Embed Size (px)
Citation preview

THE CULTURE OF COCCOLITHOPHORID ALGAE FOR CARBON DIOXIDE BIOREMEDIATION
Navid Reza Moheimani BSc, MSc
This thesis is presented for the degree of Doctor of Philosophy of Murdoch University
2005

I declare that this thesis is my own account of my research and contains work
which has not been previously submitted for a degree at any tertiary institution.
Navid R Moheimani
ii
"Biology occupies a position among the sciences at once marginal and central.
Marginal because-the living world constituting but a tiny and very "special" part
of the universe-it does not seem likely that the study of living beings will ever
uncover general laws applicable outside the biosphere. But if the ultimate aim of
the whole of science is indeed, as I believe, to clarify man's relationship to the
universe, then biology must be accorded a central position . . ."
Jacques Monod (1910-1976)
French biologist, 1965 Nobel Prize, resistance leader in WW2
from Jacques Monod Chance and Necessity Alfred A. Knopf, New York, 1971, p xi.
I dedicate this work to all scientists who suffered long nights in the name of science
for increasing humans’ knowledge of the world around them.
Navid 2005
iii
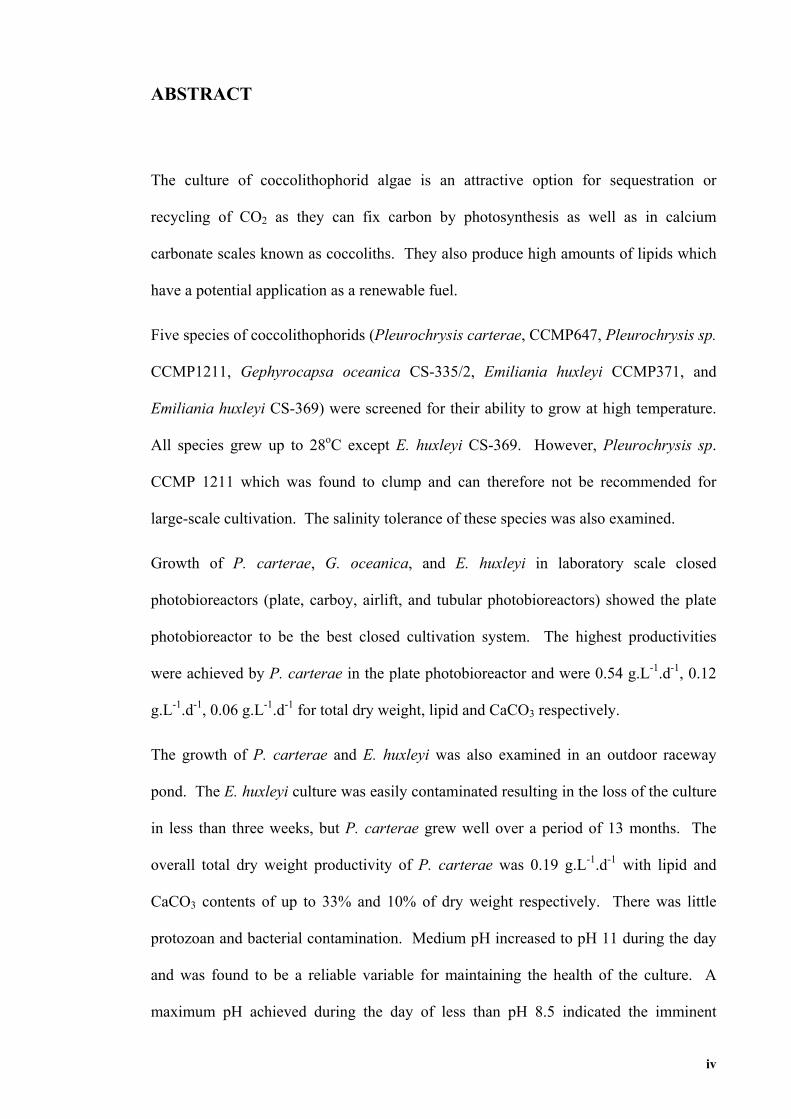
ABSTRACT
The culture of coccolithophorid algae is an attractive option for sequestration or
recycling of CO2 as they can fix carbon by photosynthesis as well as in calcium
carbonate scales known as coccoliths. They also produce high amounts of lipids which
have a potential application as a renewable fuel.
Five species of coccolithophorids (Pleurochrysis carterae, CCMP647, Pleurochrysis sp.
CCMP1211, Gephyrocapsa oceanica CS-335/2, Emiliania huxleyi CCMP371, and
Emiliania huxleyi CS-369) were screened for their ability to grow at high temperature.
All species grew up to 28oC except E. huxleyi CS-369. However, Pleurochrysis sp.
CCMP 1211 which was found to clump and can therefore not be recommended for
large-scale cultivation. The salinity tolerance of these species was also examined.
Growth of P. carterae, G. oceanica, and E. huxleyi in laboratory scale closed
photobioreactors (plate, carboy, airlift, and tubular photobioreactors) showed the plate
photobioreactor to be the best closed cultivation system. The highest productivities
were achieved by P. carterae in the plate photobioreactor and were 0.54 g.L-1.d-1, 0.12
g.L-1.d-1, 0.06 g.L-1.d-1 for total dry weight, lipid and CaCO3 respectively.
The growth of P. carterae and E. huxleyi was also examined in an outdoor raceway
pond. The E. huxleyi culture was easily contaminated resulting in the loss of the culture
in less than three weeks, but P. carterae grew well over a period of 13 months. The
overall total dry weight productivity of P. carterae was 0.19 g.L-1.d-1 with lipid and
CaCO3 contents of up to 33% and 10% of dry weight respectively. There was little
protozoan and bacterial contamination. Medium pH increased to pH 11 during the day
and was found to be a reliable variable for maintaining the health of the culture. A
maximum pH achieved during the day of less than pH 8.5 indicated the imminent
iv
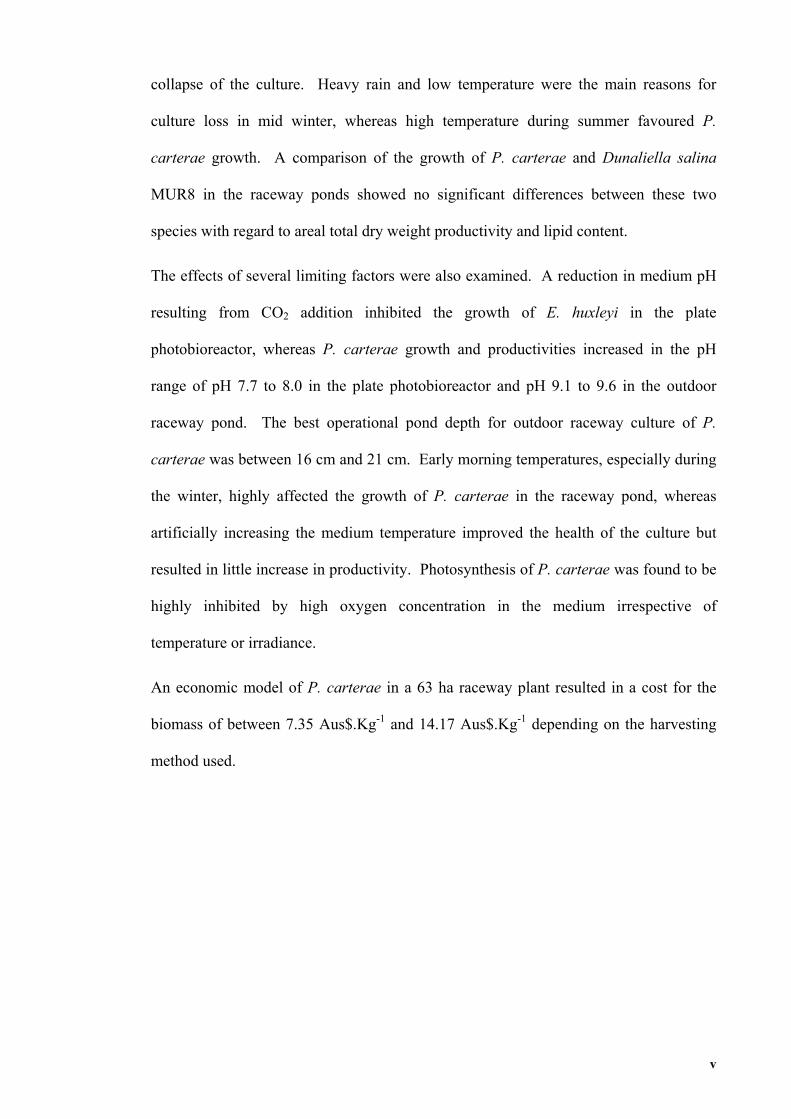
collapse of the culture. Heavy rain and low temperature were the main reasons for
culture loss in mid winter, whereas high temperature during summer favoured P.
carterae growth. A comparison of the growth of P. carterae and Dunaliella salina
MUR8 in the raceway ponds showed no significant differences between these two
species with regard to areal total dry weight productivity and lipid content.
The effects of several limiting factors were also examined. A reduction in medium pH
resulting from CO2 addition inhibited the growth of E. huxleyi in the plate
photobioreactor, whereas P. carterae growth and productivities increased in the pH
range of pH 7.7 to 8.0 in the plate photobioreactor and pH 9.1 to 9.6 in the outdoor
raceway pond. The best operational pond depth for outdoor raceway culture of P.
carterae was between 16 cm and 21 cm. Early morning temperatures, especially during
the winter, highly affected the growth of P. carterae in the raceway pond, whereas
artificially increasing the medium temperature improved the health of the culture but
resulted in little increase in productivity. Photosynthesis of P. carterae was found to be
highly inhibited by high oxygen concentration in the medium irrespective of
temperature or irradiance.
An economic model of P. carterae in a 63 ha raceway plant resulted in a cost for the
biomass of between 7.35 Aus$.Kg-1 and 14.17 Aus$.Kg-1 depending on the harvesting
method used.
v
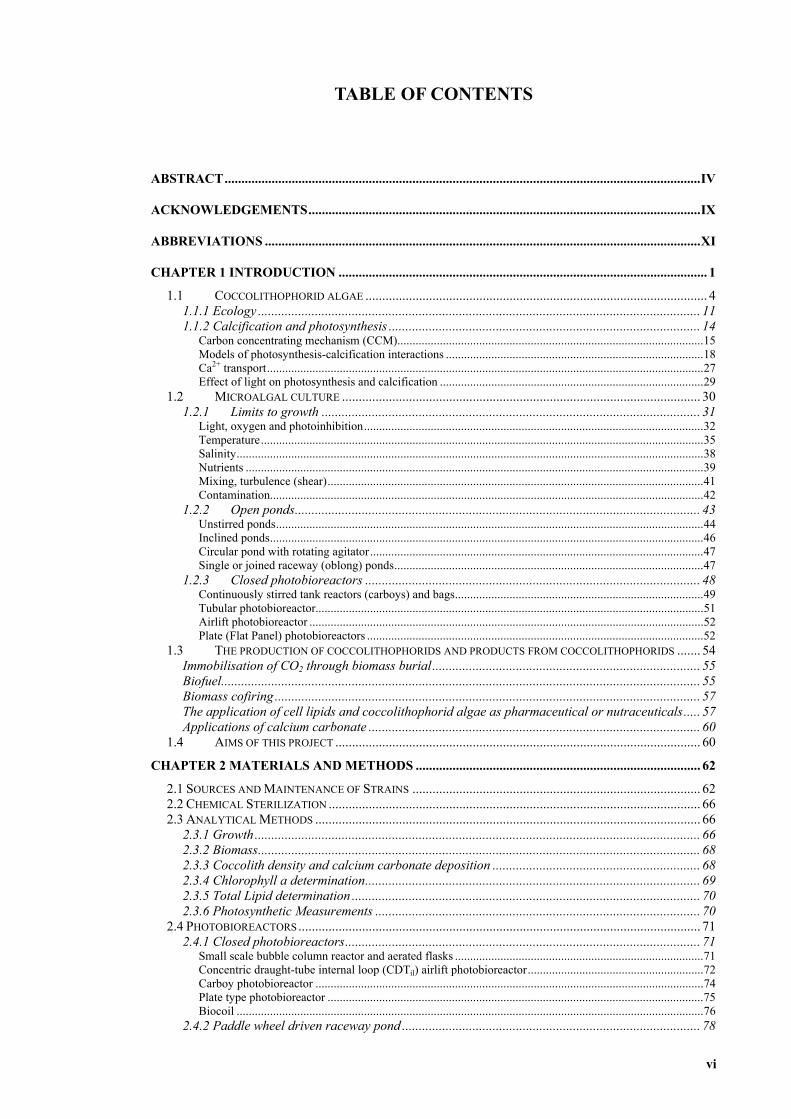
TABLE OF CONTENTS
ABSTRACT..............................................................................................................................................IV
ACKNOWLEDGEMENTS.....................................................................................................................IX
ABBREVIATIONS ..................................................................................................................................XI
CHAPTER 1 INTRODUCTION .............................................................................................................. 1 1.1 COCCOLITHOPHORID ALGAE ...................................................................................................... 4
1.1.1 Ecology .................................................................................................................................... 11 1.1.2 Calcification and photosynthesis ............................................................................................. 14
Carbon concentrating mechanism (CCM).....................................................................................................15 Models of photosynthesis-calcification interactions .....................................................................................18 Ca2+ transport................................................................................................................................................27 Effect of light on photosynthesis and calcification .......................................................................................29
1.2 MICROALGAL CULTURE ........................................................................................................... 30 1.2.1 Limits to growth ................................................................................................................. 31
Light, oxygen and photoinhibition................................................................................................................32 Temperature..................................................................................................................................................35 Salinity..........................................................................................................................................................38 Nutrients .......................................................................................................................................................39 Mixing, turbulence (shear)............................................................................................................................41 Contamination...............................................................................................................................................42
1.2.2 Open ponds......................................................................................................................... 43 Unstirred ponds.............................................................................................................................................44 Inclined ponds...............................................................................................................................................46 Circular pond with rotating agitator..............................................................................................................47 Single or joined raceway (oblong) ponds......................................................................................................47
1.2.3 Closed photobioreactors .................................................................................................... 48 Continuously stirred tank reactors (carboys) and bags..................................................................................49 Tubular photobioreactor................................................................................................................................51 Airlift photobioreactor ..................................................................................................................................52 Plate (Flat Panel) photobioreactors ...............................................................................................................52
1.3 THE PRODUCTION OF COCCOLITHOPHORIDS AND PRODUCTS FROM COCCOLITHOPHORIDS ....... 54 Immobilisation of CO2 through biomass burial................................................................................ 55 Biofuel............................................................................................................................................... 55 Biomass cofiring ............................................................................................................................... 57 The application of cell lipids and coccolithophorid algae as pharmaceutical or nutraceuticals..... 57 Applications of calcium carbonate ................................................................................................... 60
1.4 AIMS OF THIS PROJECT ............................................................................................................. 60 CHAPTER 2 MATERIALS AND METHODS ..................................................................................... 62
2.1 SOURCES AND MAINTENANCE OF STRAINS ...................................................................................... 62 2.2 CHEMICAL STERILIZATION ............................................................................................................... 66 2.3 ANALYTICAL METHODS ................................................................................................................... 66
2.3.1 Growth..................................................................................................................................... 66 2.3.2 Biomass.................................................................................................................................... 68 2.3.3 Coccolith density and calcium carbonate deposition .............................................................. 68 2.3.4 Chlorophyll a determination.................................................................................................... 69 2.3.5 Total Lipid determination ........................................................................................................ 70 2.3.6 Photosynthetic Measurements ................................................................................................. 70
2.4 PHOTOBIOREACTORS ........................................................................................................................ 71 2.4.1 Closed photobioreactors.......................................................................................................... 71
Small scale bubble column reactor and aerated flasks ..................................................................................71 Concentric draught-tube internal loop (CDTil) airlift photobioreactor..........................................................72 Carboy photobioreactor ................................................................................................................................74 Plate type photobioreactor ............................................................................................................................75 Biocoil ..........................................................................................................................................................76
2.4.2 Paddle wheel driven raceway pond ......................................................................................... 78
vi
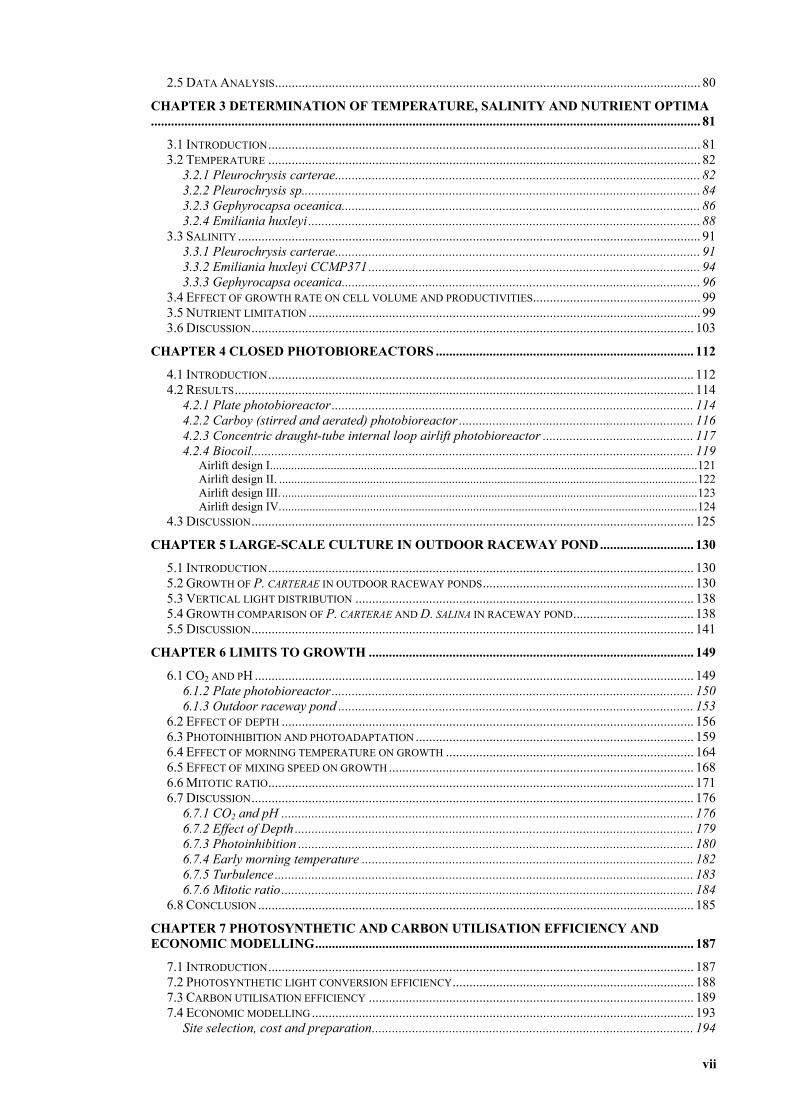
2.5 DATA ANALYSIS............................................................................................................................... 80 CHAPTER 3 DETERMINATION OF TEMPERATURE, SALINITY AND NUTRIENT OPTIMA.................................................................................................................................................................... 81
3.1 INTRODUCTION................................................................................................................................. 81 3.2 TEMPERATURE ................................................................................................................................. 82
3.2.1 Pleurochrysis carterae............................................................................................................. 82 3.2.2 Pleurochrysis sp....................................................................................................................... 84 3.2.3 Gephyrocapsa oceanica........................................................................................................... 86 3.2.4 Emiliania huxleyi ..................................................................................................................... 88
3.3 SALINITY.......................................................................................................................................... 91 3.3.1 Pleurochrysis carterae............................................................................................................. 91 3.3.2 Emiliania huxleyi CCMP371................................................................................................... 94 3.3.3 Gephyrocapsa oceanica........................................................................................................... 96
3.4 EFFECT OF GROWTH RATE ON CELL VOLUME AND PRODUCTIVITIES.................................................. 99 3.5 NUTRIENT LIMITATION ..................................................................................................................... 99 3.6 DISCUSSION.................................................................................................................................... 103
CHAPTER 4 CLOSED PHOTOBIOREACTORS ............................................................................. 112 4.1 INTRODUCTION............................................................................................................................... 112 4.2 RESULTS......................................................................................................................................... 114
4.2.1 Plate photobioreactor............................................................................................................ 114 4.2.2 Carboy (stirred and aerated) photobioreactor ...................................................................... 116 4.2.3 Concentric draught-tube internal loop airlift photobioreactor ............................................. 117 4.2.4 Biocoil.................................................................................................................................... 119
Airlift design I.............................................................................................................................................121 Airlift design II. ..........................................................................................................................................122 Airlift design III. .........................................................................................................................................123 Airlift design IV..........................................................................................................................................124
4.3 DISCUSSION.................................................................................................................................... 125 CHAPTER 5 LARGE-SCALE CULTURE IN OUTDOOR RACEWAY POND............................ 130
5.1 INTRODUCTION............................................................................................................................... 130 5.2 GROWTH OF P. CARTERAE IN OUTDOOR RACEWAY PONDS............................................................... 130 5.3 VERTICAL LIGHT DISTRIBUTION ..................................................................................................... 138 5.4 GROWTH COMPARISON OF P. CARTERAE AND D. SALINA IN RACEWAY POND.................................... 138 5.5 DISCUSSION.................................................................................................................................... 141
CHAPTER 6 LIMITS TO GROWTH ................................................................................................. 149 6.1 CO2 AND PH ................................................................................................................................... 149
6.1.2 Plate photobioreactor............................................................................................................ 150 6.1.3 Outdoor raceway pond .......................................................................................................... 153
6.2 EFFECT OF DEPTH ........................................................................................................................... 156 6.3 PHOTOINHIBITION AND PHOTOADAPTATION ................................................................................... 159 6.4 EFFECT OF MORNING TEMPERATURE ON GROWTH .......................................................................... 164 6.5 EFFECT OF MIXING SPEED ON GROWTH ........................................................................................... 168 6.6 MITOTIC RATIO............................................................................................................................... 171 6.7 DISCUSSION.................................................................................................................................... 176
6.7.1 CO2 and pH ........................................................................................................................... 176 6.7.2 Effect of Depth ....................................................................................................................... 179 6.7.3 Photoinhibition ...................................................................................................................... 180 6.7.4 Early morning temperature ................................................................................................... 182 6.7.5 Turbulence ............................................................................................................................. 183 6.7.6 Mitotic ratio........................................................................................................................... 184
6.8 CONCLUSION .................................................................................................................................. 185 CHAPTER 7 PHOTOSYNTHETIC AND CARBON UTILISATION EFFICIENCY AND ECONOMIC MODELLING................................................................................................................. 187
7.1 INTRODUCTION............................................................................................................................... 187 7.2 PHOTOSYNTHETIC LIGHT CONVERSION EFFICIENCY........................................................................ 188 7.3 CARBON UTILISATION EFFICIENCY ................................................................................................. 189 7.4 ECONOMIC MODELLING .................................................................................................................. 193
Site selection, cost and preparation................................................................................................ 194
vii

Productivity of system..................................................................................................................... 199 Nutrient requirements and cost....................................................................................................... 201 CO2 requirement and cost .............................................................................................................. 203 Water and NaCl costs ..................................................................................................................... 204 Labour cost ..................................................................................................................................... 205 Power cost ...................................................................................................................................... 205 Cost before harvesting.................................................................................................................... 206 Cost after harvesting ...................................................................................................................... 206 Cost comparison between P. carterae and D. salina...................................................................... 210 Sensitivity analysis of model........................................................................................................... 212
7.5 DISCUSSION.................................................................................................................................... 214 CHAPTER 8 GENERAL CONCLUSIONS .......................................................................................... 81
FUTURE DIRECTIONS ............................................................................................................................ 223 REFERENCES....................................................................................................................................... 225
viii

ACKNOWLEDGEMENTS
First and foremost, I would like to thank Associate Professor Michael Borowitzka for
his supervision, support, suggestions and help over the past 3 and a half years. I have
learnt a lot over the years, especially when it comes to learning new microalgae
cultivation systems and coccolithophorids physiology, and Professor Borowitzka’s help
was invaluable. Michael was particularly helpful during the writing period, where his
editing and advice helped me immeasurably.
Many thanks to Dr David Barr and Dr Stewart Rhodes from Rio Tinto for their moral
and technical support. Thanks also to Rio Tinto and Australian research council (ARC)
for providing the financial support throughout my PhD.
Thanks also to Dr Lesley Brain and Associate Professor Mike Calver for providing
statistical support.
I have been very fortunate in the support from my family. To my parents Kazem and
Nahid, my brother Reza, my sister Fatemeh, my sister-in-law Niloofar and my nephew
Dara , a very big thank-you for all you have done.
My special thanks also go to my great friends Karen Marshall and Jolanta Damas,
particularly Karen for her wonderful advice. I also need to thank Sorcha Gillen,
Lindsay Marshall and Jason Webb for their full moral support and spending lots of time
in Clancy’s Fish Pub with me. I thank these people especially because of their love and
support over the past years, for putting up with a sometimes grumpy friend, encouraging
me when I felt down and being there for me whenever I needed them.
ix

Many thanks also to Cheyrlie Doyle, Jade Carlton, Chris Plotke, Kemanthi Nandasena ,
and Ertug Sezmis for being wonderful throughout my study.
The members of the Algal Biotechnology Laboratory at Murdoch University provided a
helpful and enjoyable working environment. In particular I would like to thank Dr Luke
Twomey, Jeff Cosgrove, Alannah Sinden, Lachlan Strain, Lotte Horn, Sam Bridgwood,
Dr Mike van Keulen, Michelle Buttery, Sam Hair, Nathalie Roser and Jan Ryan.
My very special thanks also go to my dear friend Jan Lisec for all his help with our
beloved Algatron. Also to Jodi Young, thanks for your help with the Algatron too.
Thanks must also go to all my friends from School of Biological Sciences and
Biotechnology at Murdoch University for their words of support and encouragement
over the years.
Once again, I wish to thank Michael Borowitzka (I love the guy!) for being my mentor
and showing me what the real meaning of science is. When I started this PhD, I had no
idea about algae and now I feel that I am a Phycologist. I owe you so much, man!
x
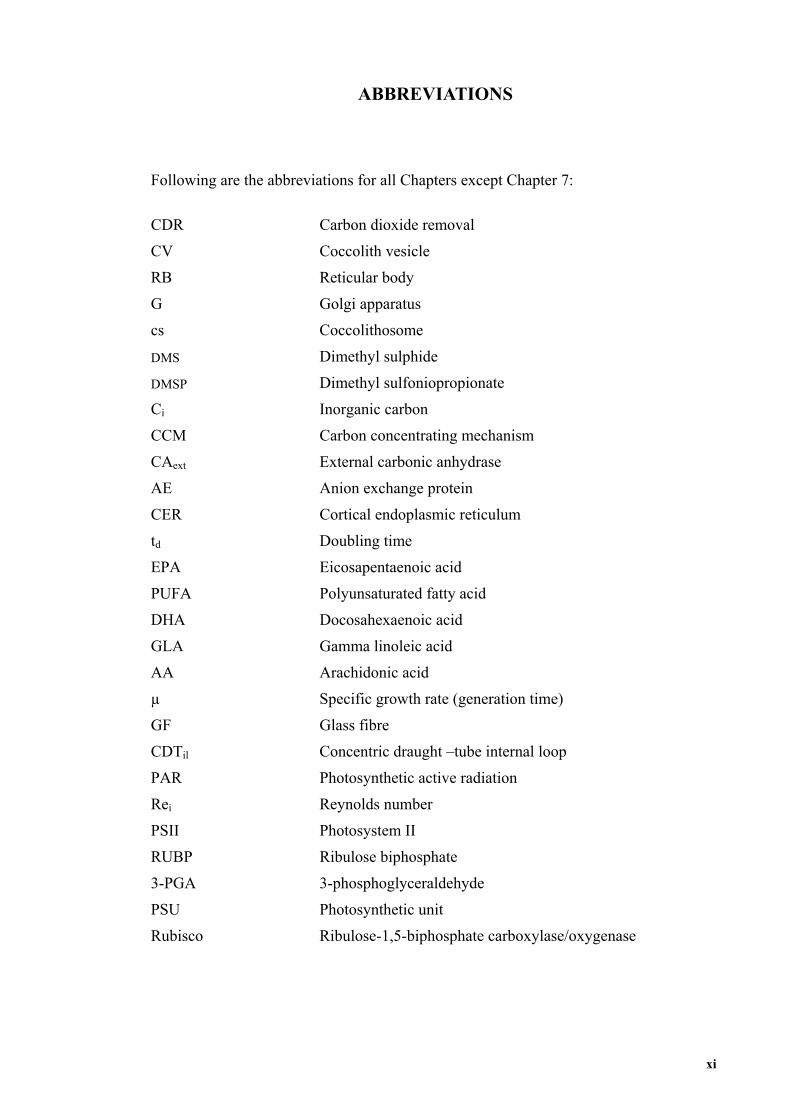
ABBREVIATIONS
Following are the abbreviations for all Chapters except Chapter 7:
CDR Carbon dioxide removal
CV Coccolith vesicle
RB Reticular body
G Golgi apparatus
cs Coccolithosome
DMS Dimethyl sulphide
DMSP Dimethyl sulfoniopropionate
Ci Inorganic carbon
CCM Carbon concentrating mechanism
CAext External carbonic anhydrase
AE Anion exchange protein
CER Cortical endoplasmic reticulum
td Doubling time
EPA Eicosapentaenoic acid
PUFA Polyunsaturated fatty acid
DHA Docosahexaenoic acid
GLA Gamma linoleic acid
AA Arachidonic acid
µ Specific growth rate (generation time)
GF Glass fibre
CDTil Concentric draught –tube internal loop
PAR Photosynthetic active radiation
Rei Reynolds number
PSII Photosystem II
RUBP Ribulose biphosphate
3-PGA 3-phosphoglyceraldehyde
PSU Photosynthetic unit
Rubisco Ribulose-1,5-biphosphate carboxylase/oxygenase
xi
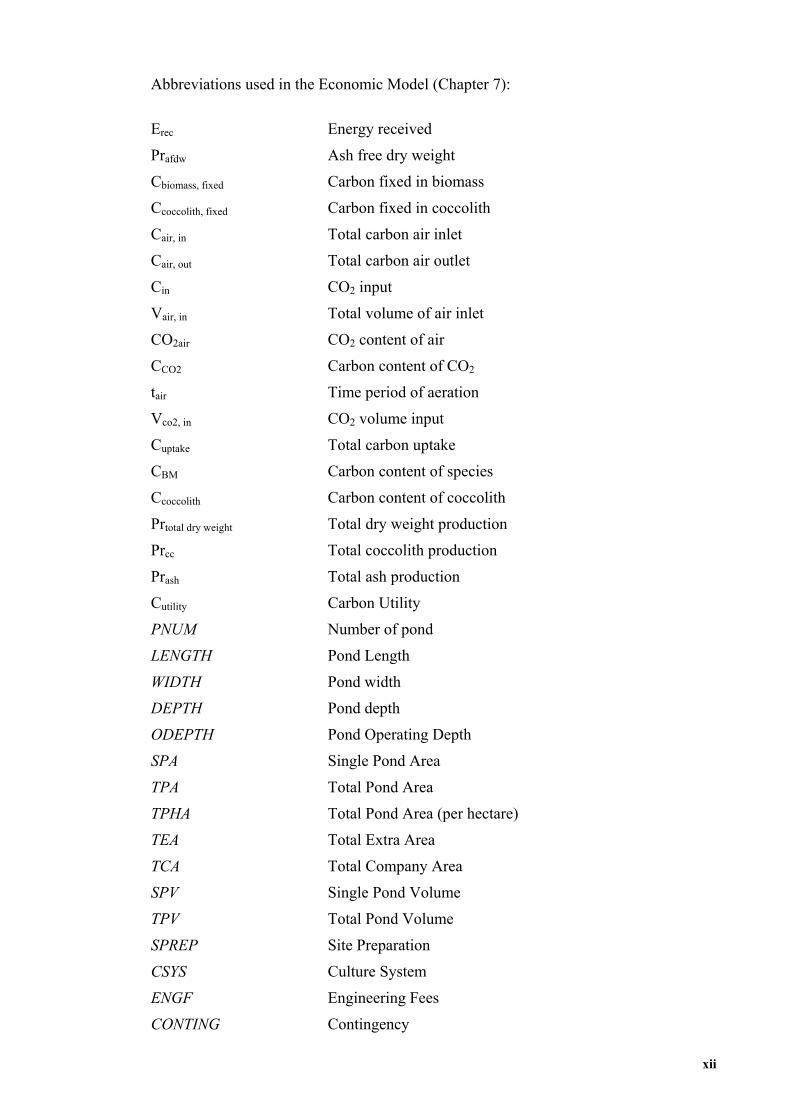
Abbreviations used in the Economic Model (Chapter 7):
Erec Energy received
Prafdw Ash free dry weight
Cbiomass, fixed Carbon fixed in biomass
Ccoccolith, fixed Carbon fixed in coccolith
Cair, in Total carbon air inlet
Cair, out Total carbon air outlet
Cin CO2 input
Vair, in Total volume of air inlet
CO2air CO2 content of air
CCO2 Carbon content of CO2
tair Time period of aeration
Vco2, in CO2 volume input
Cuptake Total carbon uptake
CBM Carbon content of species
Ccoccolith Carbon content of coccolith
Prtotal dry weight Total dry weight production
Prcc Total coccolith production
Prash Total ash production
Cutility Carbon Utility
PNUM Number of pond
LENGTH Pond Length
WIDTH Pond width
DEPTH Pond depth
ODEPTH Pond Operating Depth
SPA Single Pond Area
TPA Total Pond Area
TPHA Total Pond Area (per hectare)
TEA Total Extra Area
TCA Total Company Area
SPV Single Pond Volume
TPV Total Pond Volume
SPREP Site Preparation
CSYS Culture System
ENGF Engineering Fees
CONTING Contingency
xii
Land Land
TCAP Total Capital
HE Harvesting efficiency
PPH Proportion of pond harvested
PMR Proportion of medium recycled
NTPSY Number of times ponds set up per year
PDW Proportion of down time
EV Rate of evaporation
TGD Total Growth Days
DT Doubling time
VPUpH Volumetric productivity at unregulated pH
VP9.6 Volumetric productivity at pH 9.6
VP9 Volumetric productivity at pH 9
APUpH Areal productivity at unregulated pH
Ap9.6 Areal productivity at pH 9.6
Ap9 Areal productivity at pH 9
AVPUpH Annual productivity at unregulated pH
AVP9.6 Annual productivity at pH 9.6
AVP9 Annual productivity at pH 9
AEV Annual extra volume culture media need
ACH Average cell at harvest
NCM NaNO3 concentration in medium
NN Nitrogen content of NaNO3
NPC Nitrogen content of culture media
NC Cell Nitrogen
NUC Used N from culture media
NRR Remaining N in residual
NARC N need to add to remaining culture media in the reactor
NAHC N need to add to harvested culture media
NPE N need per extra volume
NGN N need to get to the N concentration annually
Ncost N Costs
Ancost Annual N cost
PCM NaH2PO4. H2O concentration in media
PN P content of Na2PO4.H2O
PPC P percentage in culture media
xiii
PC Cell P
PUC Used P from culture media
PRR Remaining P in residual
PARC P need to add to remaining culture media in the reactor
PAHC P need to add to harvested culture media
PPE P need per extra volume
PGP P need to get to the P concentration annually
Pcost P costs
Apcost Annual P cost
FWC Fresh water cost
ADE Average days with evaporation
ARE Average rainy days
Sa Salinity
TFWC Total Fresh water cost
Sco NaCl costs
AR Average rain
TS Total NaCl in whole system
AD Addition water to whole system
TVaR Total volume after rain
NaA NaCl concentration after TVaR
NaD NaCl addition
Asco Annual NaCl cost
LCS Labour cost supervisor
LCST Labour cost senior technician
LCTD Labour cost technician (day team)
LCTS Labour cost technician (shift teams)
TLC Total labour cost
PoC Power cost
PoU Power usage
TPoC Total power cost
PUupH Price per Kg algae unharvested at unregulated pH
PUpH9.6 Price per Kg algae unharvested at pH 9.6
PUpH9 Price per Kg algae unharvested at pH 9
xiv

CHAPTER 1
INTRODUCTION
Before the Industrial Era atmospheric carbon dioxide concentration was 280 ppm for
several thousand years and it has risen continuously since then, reaching 367 ppm in
1999 (Geider, et al. 2001). Potential global warming induced by the accumulation of
green house gases such as CO2 has become an important environmental issue (Herzog
and Drake 1996). CO2 is responsible for well over half the total warming potential of
all greenhouse gases (Hughes and Benemann 1997) and annually about 20 billion
tonnes of fossil CO2 are emitted from the burning of fossil fuels, and another 2 to 8
billion tonnes are discharged by human-mediated oxidation of the biosphere (Vitousek
1994). This increase in atmospheric CO2 is the reason for the importance of
investigations of methods for minimizing and removing anthropogenic CO2 emissions
(Turkenburg 1997). Some of the arguments for why carbon dioxide removal (CDR)
methods must be considered and developed are:
(a) The development of CDR methods has been proposed in the
United Nation Framework convention on climate change
(Turkenburg 1997),
(b) CDR could be a cost effective response in regards to high CO2
concentration and can be applied in the short and intermediate
term (Kane and Klein 1997),
(c) Application of CDR could be necessary in the longer term if
other mitigation methods fail and it is a possible low cost
mitigation option (Turkenburg 1997), and
1
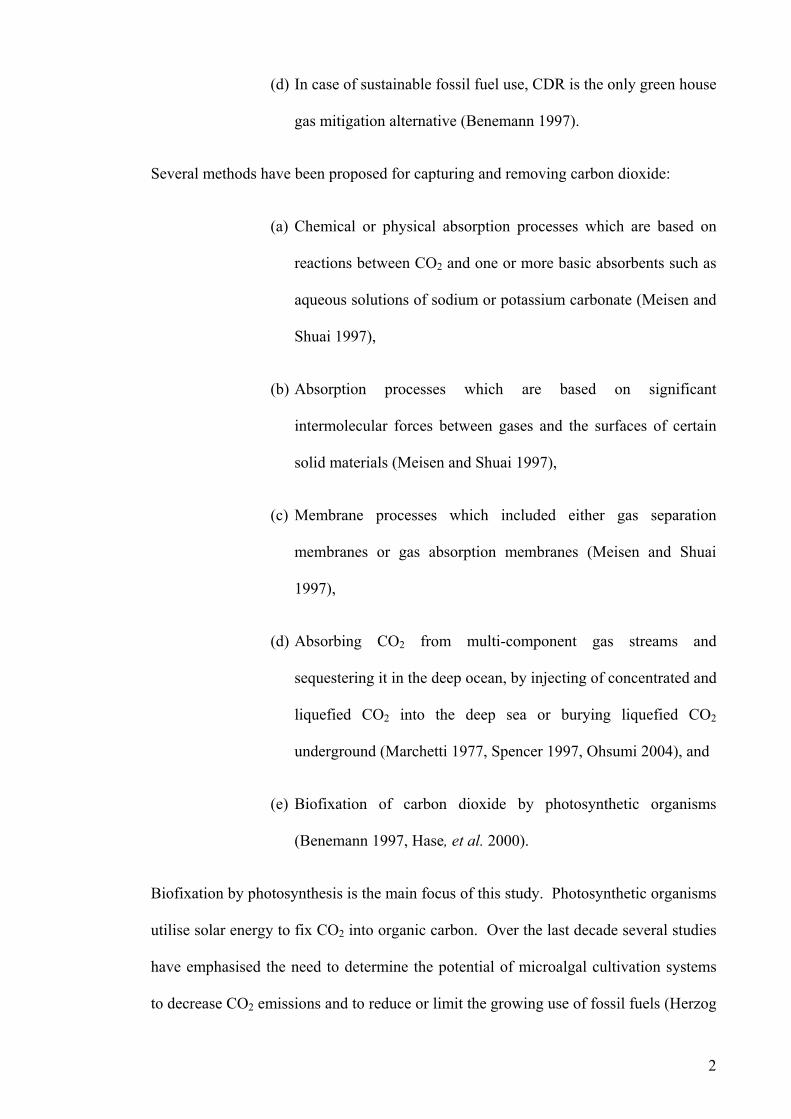
(d) In case of sustainable fossil fuel use, CDR is the only green house
gas mitigation alternative (Benemann 1997).
Several methods have been proposed for capturing and removing carbon dioxide:
(a) Chemical or physical absorption processes which are based on
reactions between CO2 and one or more basic absorbents such as
aqueous solutions of sodium or potassium carbonate (Meisen and
Shuai 1997),
(b) Absorption processes which are based on significant
intermolecular forces between gases and the surfaces of certain
solid materials (Meisen and Shuai 1997),
(c) Membrane processes which included either gas separation
membranes or gas absorption membranes (Meisen and Shuai
1997),
(d) Absorbing CO2 from multi-component gas streams and
sequestering it in the deep ocean, by injecting of concentrated and
liquefied CO2 into the deep sea or burying liquefied CO2
underground (Marchetti 1977, Spencer 1997, Ohsumi 2004), and
(e) Biofixation of carbon dioxide by photosynthetic organisms
(Benemann 1997, Hase, et al. 2000).
Biofixation by photosynthesis is the main focus of this study. Photosynthetic organisms
utilise solar energy to fix CO2 into organic carbon. Over the last decade several studies
have emphasised the need to determine the potential of microalgal cultivation systems
to decrease CO2 emissions and to reduce or limit the growing use of fossil fuels (Herzog
2

and Drake 1996, Spencer 1997, Klasson and Davison 2001). A significant amount of
carbon dioxide is fixed annually by plants (Hughes and Benemann 1997), but based on
the slow growth rate of higher plants, the fresh water requirement, and the high cost of
land for growing these plants, this appears not to be a feasible option for removing
carbon dioxide.
The cultivation of photosynthetic microorganisms such as algae and cyanobacteria has
been proposed as an alternative for CO2 bioremediation (Herzog and Drake 1996).
Algae are attractive organisms for CO2 bioremediation since they have a very high areal
productivity when compared to other photosynthetic organisms such as trees (Tredici
and Materassi 1992, Benemann 1997, Richmond 1999). Microalgae cultures also have
several characteristics that argue for potentially higher productivities than higher plants
(Benemann 1997):
(a) The possibility of culturing microalgae in continuous large-scale
systems,
(b) The ability to provide optimal nutrients levels at all times,
(c) The absence of non-photosynthetic supporting structures,
(d) The ability to adjust harvest rates to keep the culture
concentration at optimal levels at all times, and
(e) The ability to control cell composition without decreasing
productivities.
Due to favourable climatic and economic conditions, many tropical countries offer
numerous relatively large and low cost opportunities for indirect biological CO2
mitigation, through forestry, agriculture, and biofuel projects (Benemann 1997).
3
However, several technical problems remain to be resolved, including long-term
feasibility and transactional costs (Anderson 1994). The problem of disposal of the
large volume of captured CO2 also is still unsolved (Aresta, et al. 1997). For a CO2-
removal process to be both technically and economically feasible, the development of a
well-engineered system that converts CO2 to useful products, would be advantageous
(Kadam 1997).
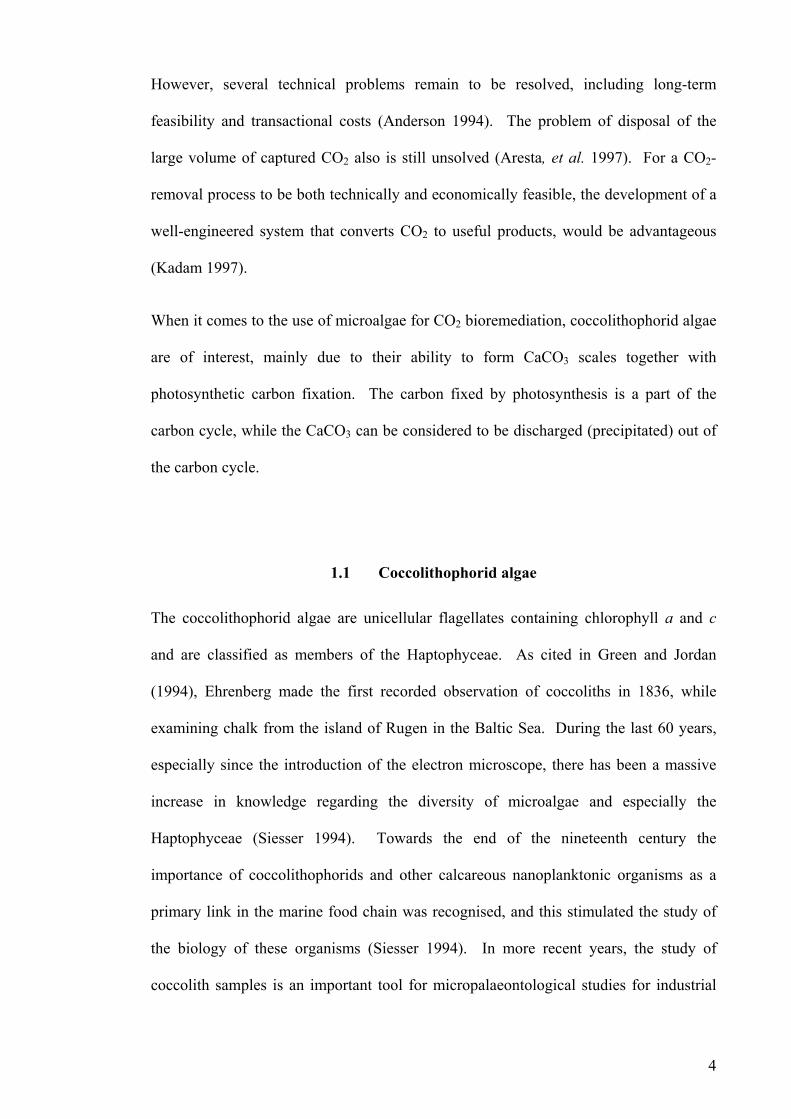
When it comes to the use of microalgae for CO2 bioremediation, coccolithophorid algae
are of interest, mainly due to their ability to form CaCO3 scales together with
photosynthetic carbon fixation. The carbon fixed by photosynthesis is a part of the
carbon cycle, while the CaCO3 can be considered to be discharged (precipitated) out of
the carbon cycle.
1.1 Coccolithophorid algae
The coccolithophorid algae are unicellular flagellates containing chlorophyll a and c
and are classified as members of the Haptophyceae. As cited in Green and Jordan
(1994), Ehrenberg made the first recorded observation of coccoliths in 1836, while
examining chalk from the island of Rugen in the Baltic Sea. During the last 60 years,
especially since the introduction of the electron microscope, there has been a massive
increase in knowledge regarding the diversity of microalgae and especially the
Haptophyceae (Siesser 1994). Towards the end of the nineteenth century the
importance of coccolithophorids and other calcareous nanoplanktonic organisms as a
primary link in the marine food chain was recognised, and this stimulated the study of
the biology of these organisms (Siesser 1994). In more recent years, the study of
coccolith samples is an important tool for micropalaeontological studies for industrial
4
laboratories due to the associations of coccolithophorids with fossil oil production
(Young, et al. 1997).
The Haptophyceae are mainly marine, but a few freshwater and terrestrial species are
also known (Green and Jordan 1994). The most abundant representatives of the
Haptophyceae are the coccolithophorid algae. They are unicellular, either motile or non
motile, with the ability to produce external calcified plates (coccoliths) which cover
their surface (Siesser 1994). In the calcified coccolithophorids, the cell surface is
covered by one (e.g. Pleurochrysis carterae) or several layers (e.g. Emiliania huxleyi)
of coccoliths. Coccoliths are mostly oval-shaped structures of about 1 to 20 µm in
diameter consisting of some organic material and crystalline calcite CaCO3.
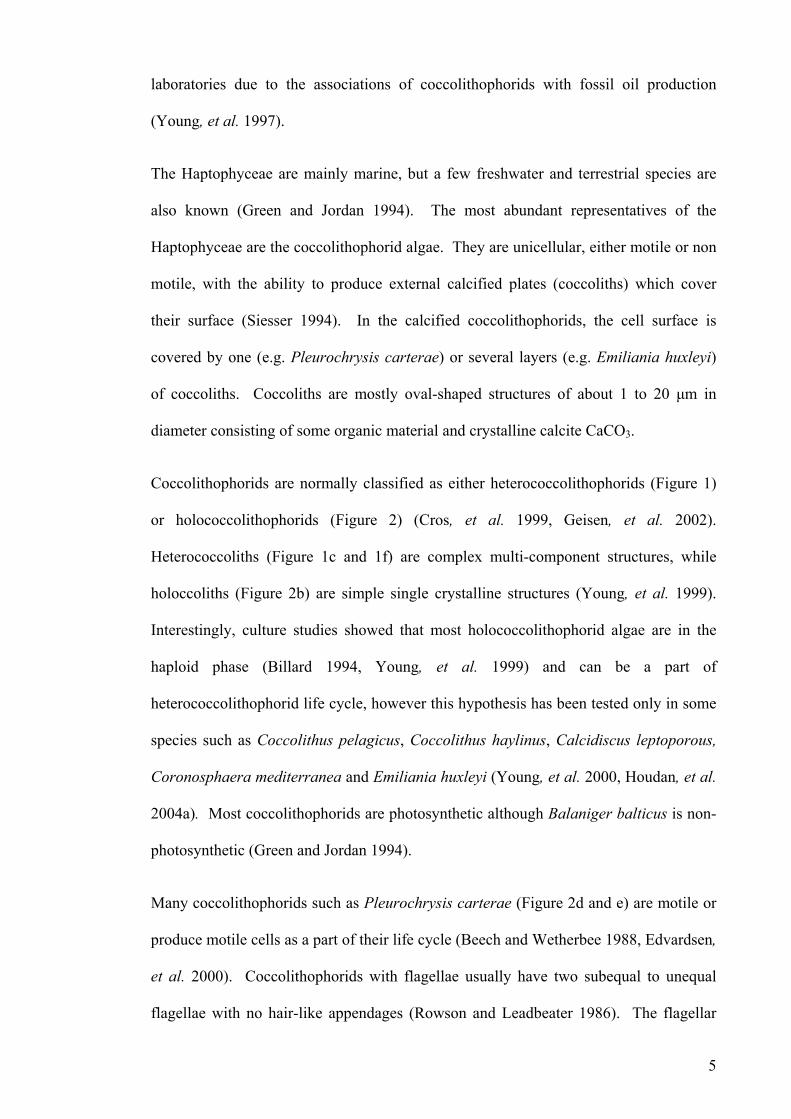
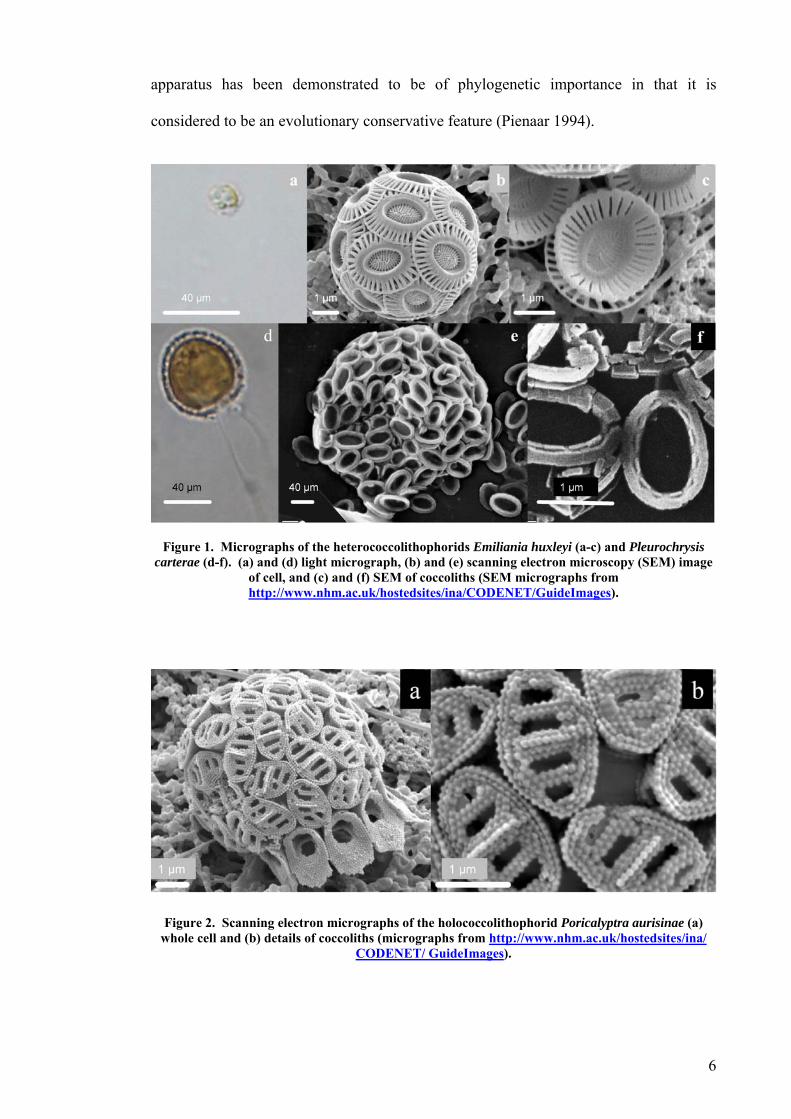
Coccolithophorids are normally classified as either heterococcolithophorids (Figure 1)
or holococcolithophorids (Figure 2) (Cros, et al. 1999, Geisen, et al. 2002).
Heterococcoliths (Figure 1c and 1f) are complex multi-component structures, while
holoccoliths (Figure 2b) are simple single crystalline structures (Young, et al. 1999).
Interestingly, culture studies showed that most holococcolithophorid algae are in the
haploid phase (Billard 1994, Young, et al. 1999) and can be a part of
heterococcolithophorid life cycle, however this hypothesis has been tested only in some
species such as Coccolithus pelagicus, Coccolithus haylinus, Calcidiscus leptoporous,
Coronosphaera mediterranea and Emiliania huxleyi (Young, et al. 2000, Houdan, et al.
2004a). Most coccolithophorids are photosynthetic although Balaniger balticus is non-
photosynthetic (Green and Jordan 1994).
Many coccolithophorids such as Pleurochrysis carterae (Figure 2d and e) are motile or
produce motile cells as a part of their life cycle (Beech and Wetherbee 1988, Edvardsen,
et al. 2000). Coccolithophorids with flagellae usually have two subequal to unequal
flagellae with no hair-like appendages (Rowson and Leadbeater 1986). The flagellar
5
apparatus has been demonstrated to be of phylogenetic importance in that it is
considered to be an evolutionary conservative feature (Pienaar 1994).
Figure 1. Micrographs of the heterococcolithophorids Emiliania huxleyi (a-c) and Pleurochrysis carterae (d-f). (a) and (d) light micrograph, (b) and (e) scanning electron microscopy (SEM) image
of cell, and (c) and (f) SEM of coccoliths (SEM micrographs from http://www.nhm.ac.uk/hostedsites/ina/CODENET/GuideImages).
Figure 2. Scanning electron micrographs of the holococcolithophorid Poricalyptra aurisinae (a) whole cell and (b) details of coccoliths (micrographs from http://www.nhm.ac.uk/hostedsites/ina/
CODENET/ GuideImages).
6
One of the interesting characteristics of the Haptophyceae is the presence of a
haptonema, originally reported by Manton (1967). The haptonema is a highly variable
organelle (Kawachi and Inouye 1995). For example, in Pleurochrysis sp. the
haptonema is bulbous, varies in length from 2-4 µm, and is covered with one or more
layers of small elliptical organic scales (Inouye and Pienaar 1985). In Syracosphaera
pulchra the haptonema, on the other hand, is long and capable of coiling (Inouye and
Pienaar 1988). The main function of the haptonema is still unknown, however, at this
stage it seems to be an organelle with various functions such as (1) attachment to other
cells, (2) as a sensory and tactile organelle and/or (3) for capturing other planktonic
organisms and playing a role in phagocytotic activity (Pienaar 1994).
Single coccoliths are invisible to the naked eye and their structures are species-specific
(Young, et al. 1999). There are many theories concerning the physical and chemical
processes of biomineralization, but there are few facts. Coccoliths (calcite biominerals)
is the inhibitory
The existence of the haptonema in coccolithophorids and its function in feeding on
marine bacteria also indicate a mixotrophic life style (Kawachi and Inouye 1995). For
example, some coccolithophorid algae such as Pleurochrysis carterae have been shown
to be heterotrophic at some stages during the life cycle and utilise the relatively high
concentrations of dissolved organic molecules present in the photic zone (Paasche
1968a).
contain up to 30 mol% Mg substituting for Ca2+ in solid solution (Chave 1952, 1984). It
is usually agreed that enzymes play a key role in biomineralization, but the kind of
enzymes required and whether the effect is inhibitory or stimulatory remains unsolved.
Two principal enzymes of biomineralization mentioned in the literature are carbonic
anhydrase and alkaline phosphatase and both enzymes commonly occur at the sites of
carbonate and phosphate mineralization (Borowitzka 1977, 1982a, b, Chave 1984). One
of the most accepted models for enzyme activity in biomineralization
7
enzyme model in which the site of mineralization is supersaturated with respect to the
Ca2+ and the function of the enzyme is to prevent mineralization or to allow
mineralization only at specified sites (Dodd 1967, Borowitzka 1982a, Chave 1984).
While the main reason for biomineralization in coccolithophorids remains unsolved,
several hypotheses have been proposed by investigators such as Borowitzka (1977)
Sikes and Wilbur (1980) and Brand (1994) for the formation of coccoliths by
coccolithophorids including: (1) focusing light onto the chloroplast, (2) light reflection
to decrease photoinhibition, (3) augmentation of the internal supply of photosynthetic
Coccolith and cell structure of two members of the coccolithophorid algae (E. huxleyi
and P. carterae) have been extensively studied, mainly because they can be grown
easily in the laboratory (Siesser 1994). The morphology of both of these species has
been well described in previous studies (de Vrind- de Jong, et al. 1986, Johansen, et al.
1988, Nielsen 1995, Paasche, et al. 1996, Paasche 2002). In both of these species
coccoliths are produced intracellularly in a coccolith vesicle (CV) and they are then
extruded from cell and placed into the coccosphere (de Vrind- de Jong, et al. 1986)
(Figure 3).
In E. huxleyi (heterococcolithophorid) electron microscope studies indicate that the CV
is located beside the nucleus enclosing the growing coccolith and is connected to the
reticular body (RB) (Figure 3). The coccoliths are composed of a radial array of unit
elements in which one unit is a single crystal of calcite (de Vrind- de Jong, et al. 1994).
In a completed coccolith these crystals have rounded faces and edges (Young, et al.
1999). Prior to calcification the coccolith vesicle / reticular body (CV - RB) system
CO2, (4) increasing the cell volume, (5) protecting the cell and (6) increasing the sinking
rate. However, the main function of coccoliths has yet to be resolved.
8
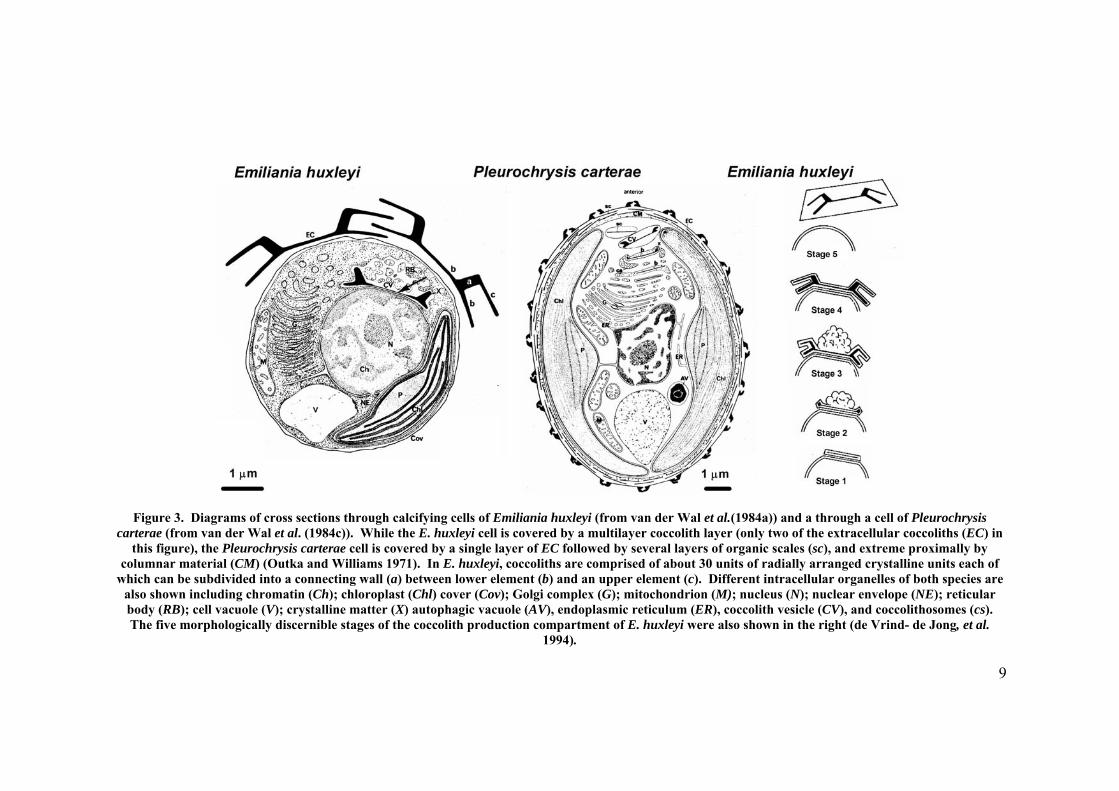
Figure 3. Diagrams of cross sections through calcifying cells of Emiliania huxleyi (from van der Wal et al.(1984a)) and a through a cell of Pleurochrysis carterae (from van der Wal et al. (1984c)). While the E. huxleyi cell is covered by a multilayer coccolith layer (only two of the extracellular coccoliths (EC) in
this figure), the Pleurochrysis carterae cell is covered by a single layer of EC followed by several layers of organic scales (sc), and extreme proximally by columnar material (CM) (Outka and Williams 1971). In E. huxleyi, coccoliths are comprised of about 30 units of radially arranged crystalline units each of
which can be subdivided into a connecting wall (a) between lower element (b) and an upper element (c). Different intracellular organelles of both species are also shown including chromatin (Ch); chloroplast (Chl) cover (Cov); Golgi complex (G); mitochondrion (M); nucleus (N); nuclear envelope (NE); reticular body (RB); cell vacuole (V); crystalline matter (X) autophagic vacuole (AV), endoplasmic reticulum (ER), coccolith vesicle (CV), and coccolithosomes (cs). The five morphologically discernible stages of the coccolith production compartment of E. huxleyi were also shown in the right (de Vrind- de Jong, et al.
1994).
9

appears to contain a high concentration of acidic polysaccharides relative to other cell
constituents (van der Wal, et al. 1984a). It has been hypothesized that this
polysaccharide plays a regulatory role in the calcification process (de Vrind- de Jong, et
al. 1986). Calcification in E. huxleyi is a highly controlled process and initiated at the
base of the future connecting wall of the coccolith and progresses first upward and then
perpendicularly to form the wall and upper element of the coccolith, respectively. It
then progresses outward and inward at the base to form the lower element (Figure 3)
(van der Wal, et al. 1984c, de Vrind- de Jong, et al. 1994). Completed coccoliths are
then extruded and incorporated into the coccosphere (Okazaki, et al. 1984). Each E.
huxleyi cell is surrounded by about 15-20 coccoliths and this species is capable of
releasing coccoliths to the medium (Figure 3). In this species it has been found that,
when external coccoliths are removed from cells by acidification, the formation of a
new coccosphere will be initiated (Linschooten, et al. 1991).
The coccolith of P. carterae consists of an oval organic scale (the base) with calcite
crystallites on the rim (Figure 3) (van der Wal, et al. 1983). The organic scales contain
concentric and radial microfibrils coated by an amorphous acidic polysaccharide (van
der Wal and de Brujin 1983). Calcium carbonate elements are deposited in alternating
orientation on the rim of the organic scale (Pienaar 1969). The organic scale is formed
prior to calcification in the Golgi apparatus and forms the base for a coccolith and
coccolithosome (Outka and Williams 1971). Van der Wal et al. (1983) also found
evidence that the coat and crystalline matter involved in coccolith formation are formed
simultaneously. As shown in Figure 3, in P. carterae, two non-calcifying bases are
located besides the coccolith layer (van der Wal, et al. 1983).
In holococcolithophorid algae such as Poricalyptra aurisinae, some studies suggest that
the trans-Golgi apparatus appears to be a coccolith storage and production compartment.
10
However, Young et al. (1999) state that intercellular holococcolith calcification has
never been observed. The lack of information on coccolith structure and formation in
other species of coccolithophorids leaves this subject open to further investigation.
1.1.1 Ecology
Coccolithophorids are widely distributed in temperate and tropical oceans, and in some
areas they may become the dominant members of the phytoplankton community
(Jeffrey and Allen 1964). Certain species such as Emiliania huxleyi can form massive
seasonal blooms which are visible from space mainly due to light scattering by the
coccoliths (Holligan, et al. 1983, Blackburn and Cresswell 1993, Balch, et al. 1996b).
Blooms of coccolithophorid algae such as Pleurochrysis pseudoroscoffensis have also
been reported in inland saline lakes such as the Salton Sea, California (Reifel, et al.
2001). The highest diversity of coccolithophorids today is in the subtropical oceanic
gyres (Hulburt 1963) and coccolithophorid diversity is much lower in polar waters than
in the tropics (McIntyre 1967).
Coccolithophorid algae, together with foraminiferans, represent the bulk of modern-day
global CaCO3 production (Paasche 2002). It is estimated that the coccolithophorid
algae represent up to half of all existing global CaCO3 production (Purdie and Finch
1994, Buitenhuis, et al. 1999).
Coccolithophorid algae, like most other phytoplankton, generally live in the photic zone
as they require sunlight for photosynthesis. Of the 195 coccolithophorid taxa,
Emiliania huxleyi is the most abundant coccolithophorid living in today’s oceans and is
a very abundant member of the phytoplankton in subpolar waters (Brand 1994). The
sedimentary records indicate the dominance of E. huxleyi over the rest of
11
coccolithophorids during the last 73000 years (Winter, et al. 1994). Emiliania huxleyi is
one of the most euryhaline and eurythermal coccolithophorid species (Paasche 2002)
and its ability of successfully growing in both eutrophic and oligotrophic conditions
indicates the wide range of nutrients tolerated by this alga.
Coccolithophorid algae are not fully photoautotrophic as they have a requirement for
one or more exogenous sources of vitamins and in at least one species phagotrophy has
been observed (Parke and Adams 1960, Miyamoto, et al. 2002).
Nitrogen and phosphorus are often the limiting growth factors for phytoplankton and
oversupply of nutrients may lead to stress and reduced growth (Grobbelaar 2004).
Coccolithophorid algae can use nitrite, nitrate, ammonium, and in some species, urea as
a nitrogen source (Wheeler and North 1974, Nimer and Merret 1993, Muggli and
Harrison 1996, Riegman, et al. 2000, Paasche 2002). They can use various forms of
organic phosphate, hydrolysed by external phosphatase, and inorganic phosphate
(Paasche 2002). Many studies have shown that low phosphate and nitrate
concentrations induce coccolith production in some coccolithophorids such as E.
huxleyi and P. carterae (Nimer and Merret 1993, Paasche 1998, Fritz 1999, Corstjens,
et al. 2001). Studies in the open ocean have shown that the highest cell densities of
coccolithophorids under non bloom conditions are observed at the lowest nitrogen and
phosphorus conditions (Cortes, et al. 2001, Haidar and Thierstein 2001). Moreover,
Shiraiawa et al. (2003) found a significant increase in coccolith production under high
bicarbonate, low phosphate and low nitrate concentrations in Emiliania huxleyi, whereas
an increase in bicarbonate concentration resulted in an increase in growth and
suppression of calcification to the point that the cells lost their coccolith layers (Figure
4). These results support previous studies on the effects of nutrients and bicarbonate on
calcification and photosynthesis of E. huxleyi (Merret, et al. 1993, Muggli and Harrison
1996, Flynn, et al. 1999, Berry, et al. 2002).
12
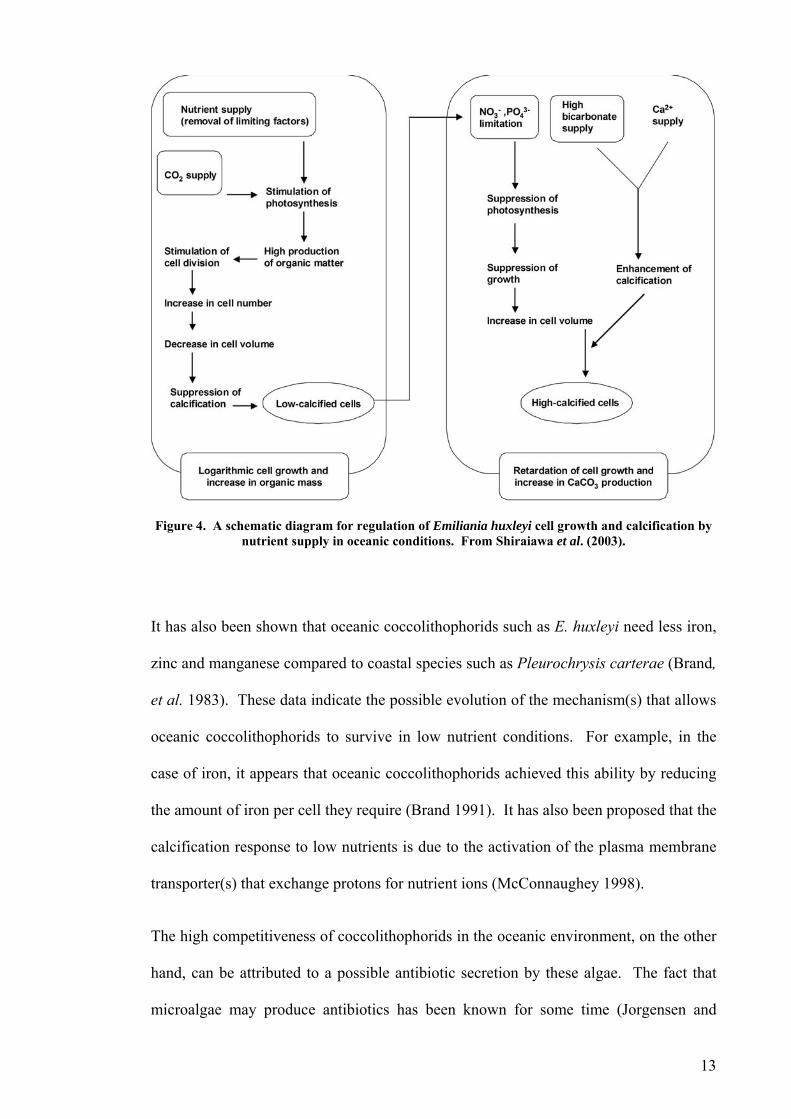
Figure 4. A schematic diagram for regulation of Emiliania huxleyi cell growth and calcification by nutrient supply in oceanic conditions. From Shiraiawa et al. (2003).
It has also been shown that oceanic coccolithophorids such as E. huxleyi need less iron,
zinc and manganese compared to coastal species such as Pleurochrysis carterae (Brand,
et al. 1983). These data indicate the possible evolution of the mechanism(s) that allows
oceanic coccolithophorids to survive in low nutrient conditions. For example, in the
case of iron, it appears that oceanic coccolithophorids achieved this ability by reducing
the amount of iron per cell they require (Brand 1991). It has also been proposed that the
calcification response to low nutrients is due to the activation of the plasma membrane
transporter(s) that exchange protons for nutrient ions (McConnaughey 1998).
The high competitiveness of coccolithophorids in the oceanic environment, on the other
hand, can be attributed to a possible antibiotic secretion by these algae. The fact that
microalgae may produce antibiotics has been known for some time (Jorgensen and
13
Steemann Nielsen 1961). Some species of coccolithophorid algae have been found to
inhibit the growth of other phytoplankton species by producing toxins (Houdan, et al.
2004b) and some clones of Pleurochrysis pseudoroscoffensis have been found to release
substances (unknown) which are toxic to other phytoplankton, whereas laboratory
experiments indicated no toxic effect of these substances on mice and brine shrimp
(Reifel, et al. 2002). Many coccolithophorids, such as P. carterae and E. huxleyi are
capable of releasing dimethyl sulphide (DMS) which has been found to play an
important role as a rain nucleus producer (van Rijssel and Gieskes 2002). DMS is
produced, together with acrylic acid, by enzymatic cleavage of dimethyl
sulfoniopropionate (DMSP), which is likely to have osmoregulatory and bactericidal
activity (Sieburth 1960, Barnard, et al. 1984). DMS is rapidly oxidized in the
atmosphere forming a number of products including sulphur dioxide,
methanesulphonate, and sulphate (Kwint and Kramer 1995) and some coccolithophorid
algae, such as Pleurochrysis carterae produce three orders of magnitude more DMS per
cell than most other groups of phytoplankton (Barnard, et al. 1984). The main reason of
releasing DMS is yet to be resolved but there is evidence for antimicrobial activity of
this chemical (Kwint and Kramer 1995, van Rijssel and Gieskes 2002, van Alstyne and
Houser 2003).
1.1.2 Calcification and photosynthesis
Calcium carbonate precipitation is a common phenomenon in seawater, fresh water and
soil environments (Erlich 1998). It is a rather straightforward chemical process
governed by four key factors including calcium concentration, the concentration of
inorganic carbon (Ci) the pH, and the availability of nucleation sites (Borowitzka 1977,
1982a, Faber and Preisig 1994, Guttusso and Buddemeier 2000).
14
Coccolithophorids fix inorganic carbon via photosynthesis and intracellular
calcification. Calcification and photosynthesis have been shown to be closely linked in
many calcified algae (Borowitzka 1982a). Photosynthesis and calcification in
coccolithophorids with particular emphasis on Emiliania huxleyi have been widely
reviewed (van der Wal, et al. 1984b, Brownlee, et al. 1994, Pienaar 1994, Paasche
2002). The various aspects of photosynthesis and calcification of coccolithophorids are
presented in detail below.
Carbon concentrating mechanism (CCM)
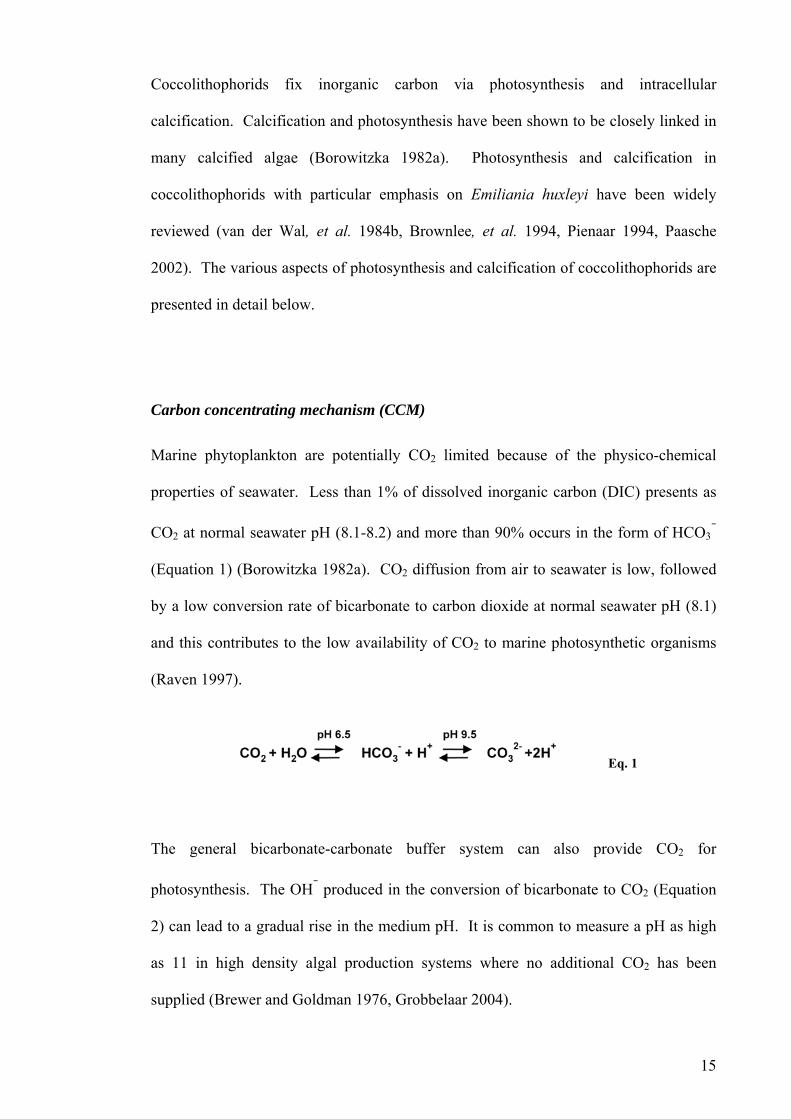
Marine phytoplankton are potentially CO2 limited because of the physico-chemical
properties of seawater. Less than 1% of dissolved inorganic carbon (DIC) presents as
CO2 at normal seawater pH (8.1-8.2) and more than 90% occurs in the form of HCO3-
(Equation 1) (Borowitzka 1982a). CO2 diffusion from air to seawater is low, followed
by a low conversion rate of bicarbonate to carbon dioxide at normal seawater pH (8.1)
and this contributes to the low availability of CO2 to marine photosynthetic organisms
(Raven 1997).
Eq. 1
no additional CO2 has been
supplied (Brewer and Goldman 1976, Grobbelaar 2004).
The general bicarbonate-carbonate buffer system can also provide CO2 for
photosynthesis. The OH- produced in the conversion of bicarbonate to CO2 (Equation
2) can lead to a gradual rise in the medium pH. It is common to measure a pH as high
as 11 in high density algal production systems where
15

Eq. 2
The limitation in the carbon dioxide supply can restrict carbon assimilation in marine
microalgae since they rely on CO2 for photosynthesis. Many phytoplankton species
have been shown to have evolved a carbon dioxide concentrating mechanism (CCM),
which permits them to use either CO2 or HCO3-, or both, as external sources of
inorganic carbon (Ci) (Laws, et al. 1988b, Beardall, et al. 1998, Moroney 2001). The
CCM mechanisms makes it possible for cells to enhance the delivery of CO2 to
ribulose-1,5-biphosphate carboxylase/oxygenase (Rubisco) and limit the oxygenase
activity of this enzyme (Raven and Falkowski 1999). Calcifying microalgae also use Ci
for producing calcium carbonate and early studies have shown that most calcifying
algae can use HCO3- as the carbon source for calcification (Borowitzka 1982a). Based
on the low affinity of Rubisco for CO2 , on the other hand, the possibility of
photosynthetic dependence of calcifying algae on calcification has been suggested and
investigated in a number of studies (Sikes, et al. 1980, Dong, et al. 1993, Nimer and
Merret 1993, Paasche and Brubak 1994). The use of bicarbonate as the substrate for
calcification results in the net production of CO2 during calcification (Equation 1)
(Frankignoulle, et al. 1994, Purdie and Finch 1994). The use of this CO2 in
photosynthesis is still unknown but, if bicarbonate is the external carbon source for both
calcification and photosynthesis, then the H+
released during calcification (Equation 1)
can be neutralized by OH- produced during photosynthetic CO2 uptake (Equation 2)
(Badger 2003). The potential advantage of calcification as an energy-efficient way of
supplying Rubisco with CO2 in E. huxleyi has also been suggested by Anning and
colleagues (1996).
16

Studies of carbon concentrating mechanisms have concentrated on cyanobacteria and
freshwater green algae and almost invariably involve the active transport of the species
CO2, H+
and HCO3- across one or more membranes in bringing about a higher steady-
state concentration of CO2 available to Rubisco than presents in the bulk medium
(Raven and Falkowski 1999, Raven 2003). In these organisms, it has been shown that
the main components of the CCM are mechanisms which cause carbon accumulation in
the cell or chloroplast (Kaplan and Reinold 1999). The CCM functions either by
actively transporting CO2, HCO3- or both, and/or by the contribution of an external
carbonic anhydrase (CAext) which catalyses the conversion of the two form of Ci
(Huertas, et al. 2003).
Buitenhuis and colleagues (1999) showed that over 90% of carbon used in E. huxleyi
photosynthesis came from bicarbonate. Sikes and Wheeler (1982) have also described
the use of bicarbonate by Emiliania huxleyi in photosynthesis under high alkaline
conditions. Although the existence of a CAext in E. huxleyi has been reported in many
studies, the activity of this enzyme at normal seawater pH (8.1) has been a mystery for a
long time and has been the subject of many investigations (Sikes and Wheeler 1982,
Nimer, et al. 1994, Nimer and Merret 1996). Herfort et al. (2002) have recently
demonstrated the existence of a membrane anion exchange (AE) protein and an CAext in
E. huxleyi, both of which are involved in active bicarbonate transport into the cell.
Herfort and colleagues (2002) have also shown that in E. huxleyi, CAext is only active at
low Ci concentrations (<0.5mM), resulting in no activity of this enzyme at the normal Ci
(=2mM) concentration and pH (8.1) of seawater. On the other hand, they have shown
that the AE was active at all levels of Ci. Furthermore, CAext appears to have no
obligate role in Ci uptake by E. huxleyi and could therefore have evolved to enable
competition with other phytoplankton at the low Ci concentration uptake in the ocean
(e.g. in conditions after an algal bloom).
17
While, the CAext is not typically active at normal Ci condition in E. huxleyi, Israel and
Gonzales (1996) have demonstrated activity of CAext at both high and low Ci
concentrations in Pleurochrysis sp. No CAext activity, however, was detected by
Huertas and colleagues (2003) in the heterococcolithophorid Ochrosphaera
neopolitana. These contradictory results suggest that there is a high possibility of
various carbon concentrating mechanisms (CCM) between different species of
coccolithophorid algae.
Models of photosynthesis-calcification interactions
Over the last 50 years there have been many attempts to develop a conceptual model for
calcification-photosynthesis in coccolithophorid algae, with the main emphasis on
Emiliania huxleyi (Paasche 1964, Sikes, et al. 1980, Brownlee, et al. 1994, Paasche
2002, Shiraiawa, et al. 2003).
One of the earliest models for the interaction between photosynthesis and calcification
of Emiliania huxleyi was developed by Paasche (1964) assuming bicarbonate usage for
both photosynthesis and calcification (Figure 5). In this model photosynthesis and
calcification were not linked closely, mainly due to the results achieved from the clone
of E. huxleyi studied including: (1) different light saturation kinetics of photosynthesis
and calcification, (2) the same rate of photosynthesis between cells grown in calcium-
free and calcium-rich medium, and (3) less effect of photosystem II inhibitors on
calcification when compared to photosynthesis. However, he did not indicate any close
association between photosynthesis and calcification. Later studies, mainly based on the
calcification-photosynthesis ratio of other clones of E. huxleyi, indicated that while not
all CO2 produced in calcification can be utilised in photosynthesis, some of the released
CO2 during calcification can be used in photosynthesis (Sikes and Wheeler 1982, de
18
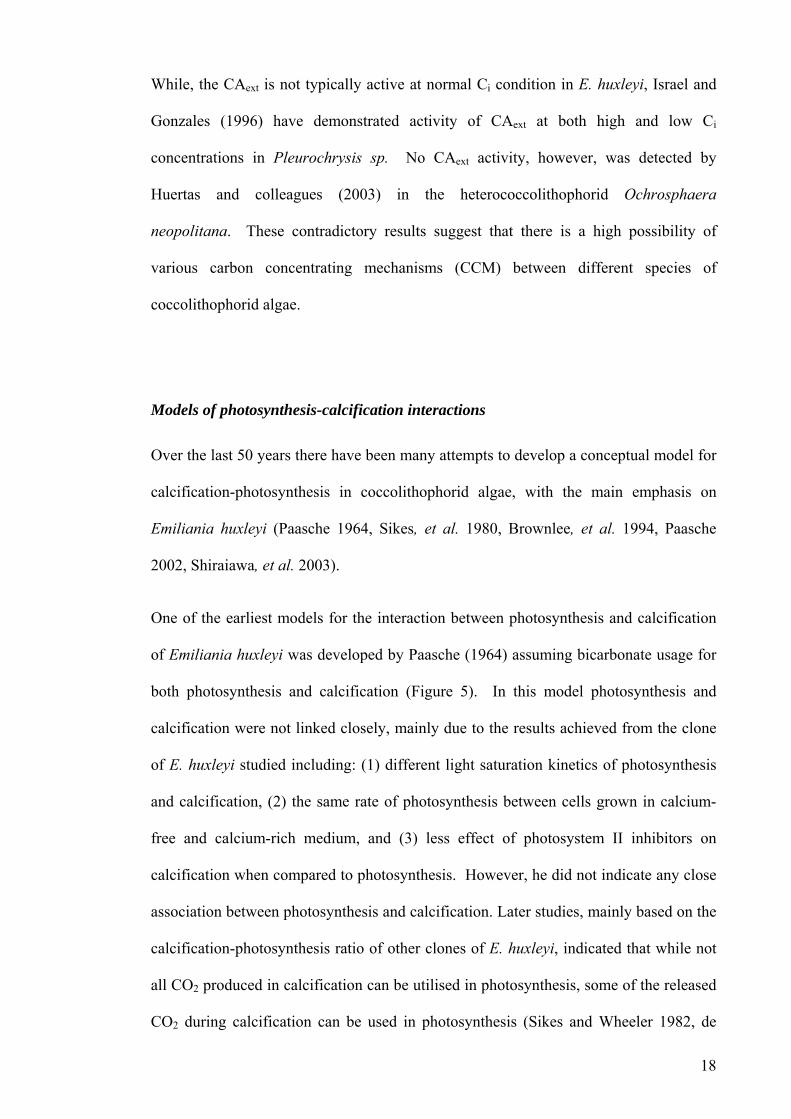
Vrind- de Jong, et al. 1986, Buitenhuis, et al. 1999). Paasche (1964) also assumed the
active transport of protons and hydroxyl ions produced during calcification and
photosynthesis from cells of E. huxleyi to the medium, however no supporting data has
been found in coccolithophorids supporting this.
Figure 5. The calcification/photosynthesis model of Paasche (1964). Potentially energy requiring
transmembrane transport sites are ringed.
Moreover, Sikes and colleagues (1980) subsequently showed that H+
produced by
HCO3- conversion to CaCO3 may be used to produce an extra CO2 from the second
HCO3- taken up. The model they proposed is shown in Figure 6 although it needs to be
noted that they did not indicate the coccolith vesicle as the actual site for HCO- CO2
conversion whereas many studies have indicated the coccolith vesicle as the site of
calcification (Young, et al. 1999, Corstjens, et al. 2001, Berry, et al. 2002).
3
19
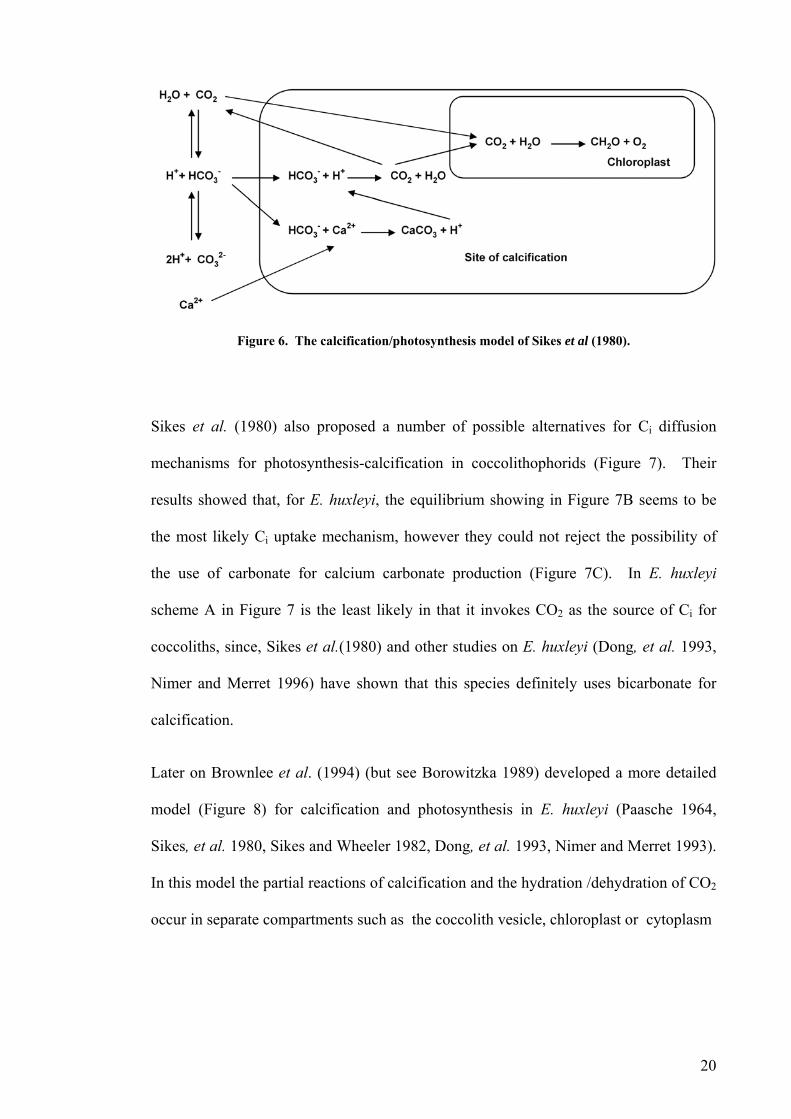
Figure 6. The calcification/photosynthesis model of Sikes et al (1980).
Sikes et al. (1980) also proposed a number of possible alternatives for Ci diffusion
mechanisms for photosynthesis-calcification in coccolithophorids (Figure 7). Their
results showed that, for E. huxleyi, the equilibrium showing in Figure 7B seems to be
the most likely Ci uptake mechanism, however they could not reject the possibility of
the use of carbonate for calcium carbonate production (Figure 7C). In E. huxleyi
scheme A in Figure 7 is the least likely in that it invokes CO2 as the source of Ci for
coccoliths, since, Sikes et al.(1980) and other studies on E. huxleyi (Dong, et al. 1993,
N
calcification.
Later on Brownlee et al. (1994) (but see Borowitzka 1989) developed a more detailed
model (Figure 8) for calcification and photosynthesis in E. huxleyi (Paasche 1964,
2
lasm
imer and Merret 1996) have shown that this species definitely uses bicarbonate for
Sikes, et al. 1980, Sikes and Wheeler 1982, Dong, et al. 1993, Nimer and Merret 1993).
In this model the partial reactions of calcification and the hydration /dehydration of CO
occur in separate compartments such as the coccolith vesicle, chloroplast or cytop
20
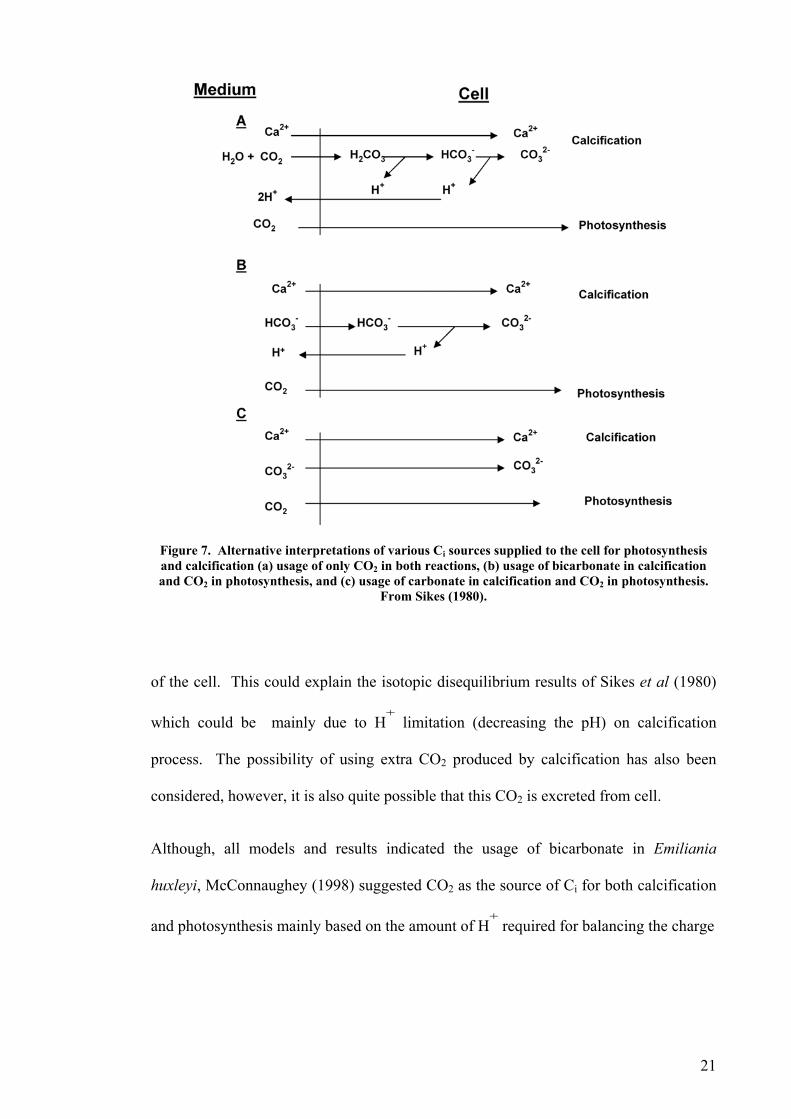
Figure 7. Alternative interpretations of various Ci sources supplied to the cell for photosynthesis and calcification (a) usage of only CO2 in both reactions, (b) usage of bicarbonate in calcification
Oand C s.
Although, all models and results indicated the usage of bicarbonate in Emiliania
huxleyi, McConnaughey (1998) suggested CO as the source of C for both calcification
and photosynthesis mainly based on the amount of H+
required for balancing the charge
2 in photosynthesis, and (c) usage of carbonate in calcification and CO2 in photosynthesiFrom Sikes (1980).
of the cell. This could explain the isotopic disequilibrium results of Sikes et al (1980)
which could be mainly due to H+
limitation (decreasing the pH) on calcification
process. The possibility of using extra CO2 produced by calcification has also been
considered, however, it is also quite possible that this CO2 is excreted from cell.
2 i
21
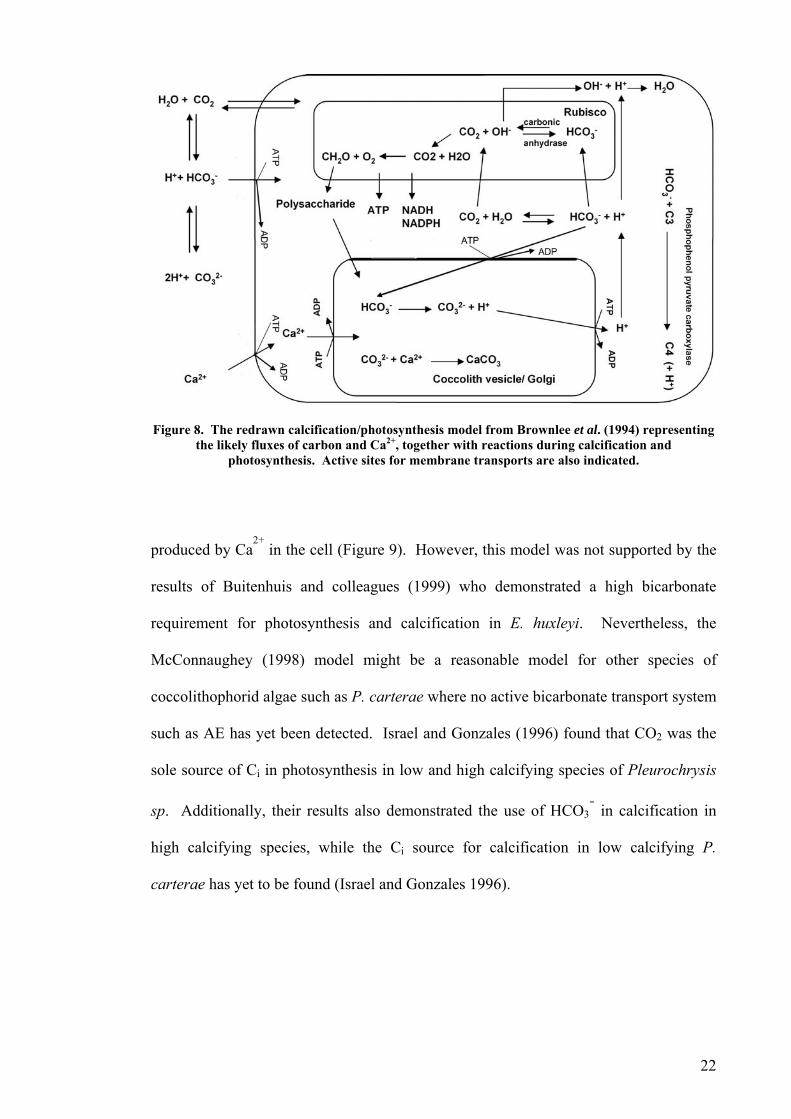
Figure 8. The redrawn calcification/photosynthesis model from Brownlee et al. (1994) representing the likely fluxes of carbon and Ca , together with reactions during calcification and
photosynthesis. Active sites for membrane transports are also indicated.
2+
coccolithophorid algae such as P. carterae where no active bicarbonate transport system
2+
produced by Ca in the cell (Figure 9). However, this model was not supported by the
results of Buitenhuis and colleagues (1999) who demonstrated a high bicarbonate
requirement for photosynthesis and calcification in E. huxleyi. Nevertheless, the
McConnaughey (1998) model might be a reasonable model for other species of
-
such as AE has yet been detected. Israel and Gonzales (1996) found that CO2 was the
sole source of Ci in photosynthesis in low and high calcifying species of Pleurochrysis
sp. Additionally, their results also demonstrated the use of HCO3 in calcification in
high calcifying species, while the Ci source for calcification in low calcifying P.
carterae has yet to be found (Israel and Gonzales 1996).
22
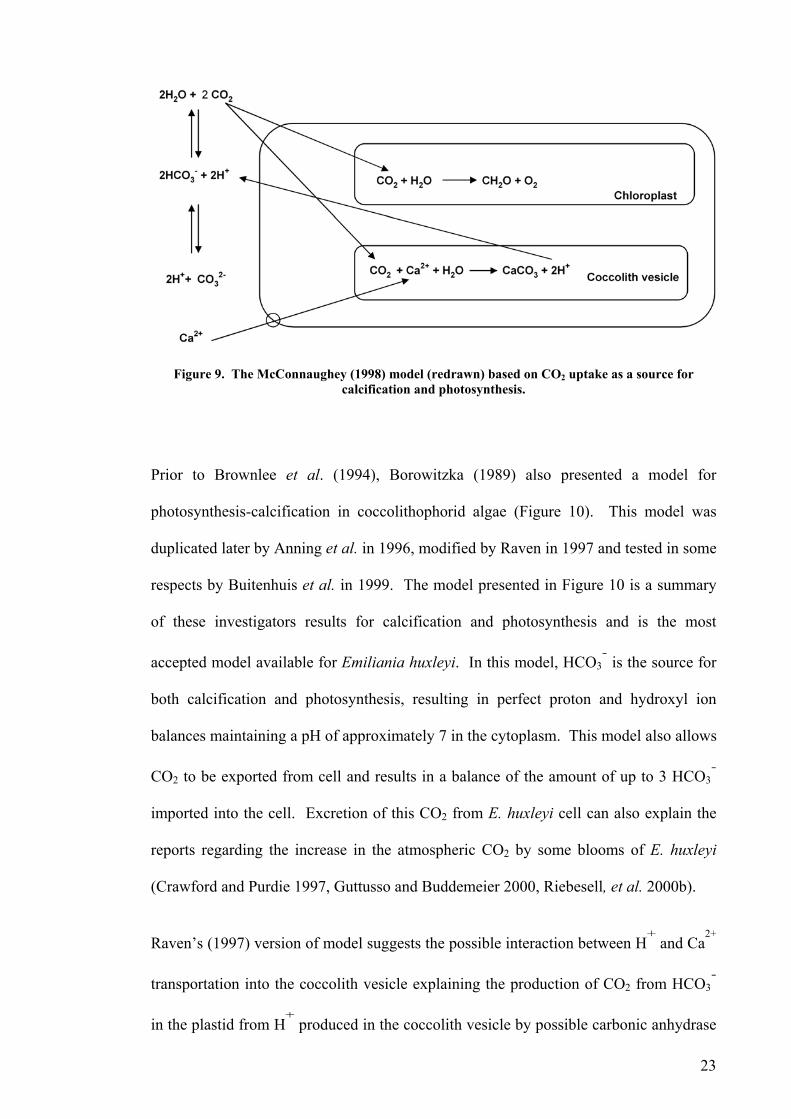
Figure 9. The McConnaughey (1998) model (redrawn) based on CO2 uptake as a source for calcification and photosynthesis.
Prior to Brownlee et al. (1994), Borowitzka (1989) also presented a model for
photosynthesis-calcification in coccolithophorid algae (Figure 10). This model was
duplicated later by Anning et al. in 1996, modified by Raven in 1997 and tested in some
respects by Buitenhuis et al. in 1999. The model presented in Figure 10 is a summary
of these investigators results for calcification and photosynthesis and is the most
accepted model available for Emiliania huxleyi. In this model, HCO3- is the source for
both calcification and photosynthesis, resulting in perfect proton and hydroxyl ion
balances maintaining a pH of approximately 7 in the cytoplasm. This model also allows
CO 3
imported into the cell. Excret leyi cell can also explain the
ports regarding the increase in the atmospheric CO2 by some blooms of E. huxleyi
transportation into the coccolith vesicle explaining the production of CO2 from HCO3
in the plastid from H produced in the coccolith vesicle by possible carbonic anhydrase
2 to be exported from cell and results in a balance of the amount of up to 3 HCO-
ion of this CO2 from E. hux
re
(Crawford and Purdie 1997, Guttusso and Buddemeier 2000, Riebesell, et al. 2000b).
Raven’s (1997) version of model suggests the possible interaction between H+
and Ca2+
-
+
23
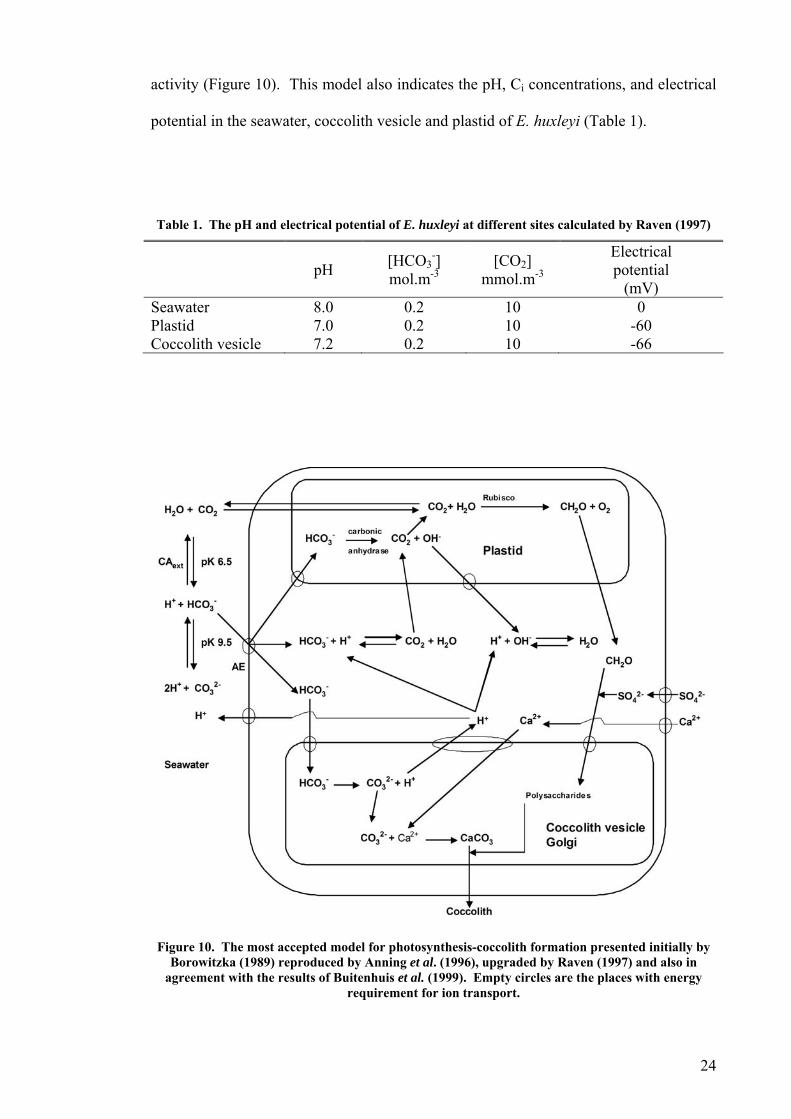
activity (Figure 10). This model also indicates the pH, Ci concentrations, and electrical
potential in the seawater, coccolith vesicle and plastid of E. huxleyi (Table 1).
Table 1. The pH and electrical potential of E. huxleyi at different sites calculated by Raven (1997)
pH [HCO
Electrical
(mV) 3
-] mol.m-3
[CO2] mmol.m-3 potential
Seawater 8.0 0.2 10 0 Plastid 7.0 0.2 10 -60 Coccolith vesicle 7.2 0.2 10 -66
Figure 10. The most accepted model for photosynthesis-coccolith formation presented initially by
agreement with the results of Buitenhuis et al. (1999). Empty circles are the places with energy requirement for ion transport.
Borowitzka (1989) reproduced by Anning et al. (1996), upgraded by Raven (1997) and also in
24
The pH has been found to be lower in the coccolith vesicle than in seawater (Anning, et
al. 1996). This lower pH, together with the negative electrical potential of the coccolith
vesicle, indicates that carbonic anhydrase is unlikely to exist at the site of calcification,
whereas there is a high possibility for CA existence at the site of photosynthesis in the
coccolithophorids (Figure 10). As previously described, despite the high possibility of
bicarbonate conversion to CO in the plastid by carbonic anhydrase, free CO2 especially
in seawater with a pH lower than pH 8.1, is the most likely resource of Ci for
Moreover, the results of Buitenhuis et al. (1999) for E. huxleyi also support the model
presented in Figure 10 with the exception of no CO2 excretion from the cell in their
model. Buitenhuis et al.(1999) also found carbonic anhydrase in the chloroplast in
c CO2 from HCO3- where CO2 is fixed by Rubisco.
The main difference between all current models can be explained by the calcification
regulation of cells under different conditions. In all of these models the ultimate sink
2
photosynthesis. The possibility of direct CO2 uptake has been largely ignored in many
of the most recent bicarbonate models for calcification and photosynthesis in
coccolithophorids (Anning, et al. 1996, Raven 1997). While bicarbonate may be the
sole resource of calcification and photosynthesis, in seawater with a pH higher than pH
8.1, external carbonic anhydrase must be the only carbon concentrating mechanism if
some species of coccolithophorids lack an active transport system for bicarbonate (for
example AE). Under such conditions, CO2 has to be the main resource for calcification
and photosynthesis and the model presented in Figure 9 by McConnaughey in 1998
seems to be the most likely model for calcification and photosynthesis in these species.
This is supported by the observation of Crenshaw (1964) who found that HCO3- used in
calcification in P. carterae were produced from the CO2 from photosynthesis.
whi h generated
25
for the OH- counterpart of the CO2 generated from HCO3
- is CO3
2- in CaCO3 (Figure
10).
However, although current models encompass and predict most aspects of calcification
In summary, calcification, photosynthesis, membrane transport and metabolism appear
to interact in a complex manner. We are only beginning to understand and quantify the
activity between E. huxleyi and P. carterae may result in different balances between Ci
ources for calcification and/or photosynthesis. As previously mentioned a lack of
information and research into other species of coccolithophorids, especially in area of
car er
f
and photosynthesis of coccolithophorids (mainly in regard to Emiliania huxleyi), some
data from the literature can not as yet be fully integrated into any existing models.
There are few reports indicating calcification of coccolithophorids in the dark and such
a phenomenon has yet to be resolved (Borowitzka 1989).
Unfortunately, the limited data available for species other than E. huxleyi does not
permit the development of a universal model for all coccolithophorid algae. For
example, as previously mentioned, the lack of active bicarbonate transporters in some
species may require a new model for photosynthesis and calcification.
components of this complex system. For example, Herfort et al. (2002) have shown
that photosynthesis does not necessarily depend actively on calcification as they did not
detect any significant differences in photosynthesis between a coccolith producing and a
non-coccolith producing E. huxleyi clone. Moreover, until now most of studies have
been carried on E. huxleyi, while it is quite possible that the calcification and
photosynthesis mechanisms are different between this species and other
coccolithophorids such as P. carterae. For example, the differences between CAext
s
bon concentrating mechanisms, leave calcification/photosynthesis open to furth
uture investigations.
26
C
n understanding of the pathways and mechanisms of Ca2+ transport is essential for
identifying the mechanism and role of calcification. Ca2+ is a micronutrient in a number
of microalgae species and relatively little is known of its transport into the cell (Raven
1980). An ATP-powered Ca pump has found in metazoa, protozoa, plants and
Calcification in coccolithophorid algae is dependent on Ca2+
uptake from the external
medium to the coccolith vesicle (CV) (Raven 1980). While the cytoplasm free calcium
t al. 1994), a high level of total Ca2+
2+
a2+ transport
A
2+
prokaryotes (Raven 1980). Ca2+ ATPase also appears to be associated with calcification
in various animals and plants (Klaveness 1976, Okazaki 1977, Okazaki, et al. 1984,
Kingsley and Watabe 1985).
concentration of E. huxleyi is very low (Brownlee, e
has been shown in the coccolith vesicle of this species (van der Wal, et al. 1984a). In E.
huxleyi the cytoplasmic concentration of Ca2+
appears to be five times lower than in the
CV (Billard 1994), therefore a concentrating mechanism for Ca2+
must exist in this
species. All of the calcium carbonate which ends up in the coccolith has passed through
cell and Golgi membranes. The energy required for active Ca2+
transport can be up to
20% of the total cost of fixing an equivalent amount of carbon in the Calvin cycle
(Anning, et al. 1996) and van der Wall and colleagues (1984b) have demonstrated a
light dependence of Ca2+
accumulation in P. carterae. In P. carterae Ca2+
transfer is
found to be via the formation of coccolithosomes, and number of coccolithosomes
required to build one coccolith has been calculated to be 4.5 (van der Wal, et al. 1984b).
The different possible scenarios for Ca transport mechanisms for diffusion to the site
of calcification are summarised in Figure 11. Ca2+ can enter the cell by diffusion
27

(Figure 11A) but requires an ATP for active transport into the CV. Ca2+
transport can
also take place by formation of membrane packets at the cell membrane (Figure 11B).
Figure 11. A schematic diagram showing the putative transport routes of Ca2+ to the site of
cytoplasm coupled with active pumping of Cacalcification in the Golgi/CV. (A) Entry across the plasma membrane and diffusion across the
These packets eventually combine with the Golgi apparatus (Billard 1994, Anning, et
2+
endoplasmic reticulum (CER) is small the ER body may have a role in Ca2+
transport
2+ into Golgi and/or CV. (B) Endocytotic uptake of Ca2+ and eventual delivery of Ca2+ to the Golgi/CV via vesicle transport. (C) Entry of Ca2+ into, and transcellular transport through, the cortical endoplasmic reticulum (CER), followed by ER-
Golgi vesicle transport. Redrawn from Berry et al. (2002).
al. 1996). If, however, the distance required for Ca penetration into the cortical
28
(Figure 11C). In E. huxleyi and P. carterae, Ca2+ is found to be concentrated in the
Golgi apparatus (van der Wal and de Brujin 1983, van der Wal, et al. 1984a), while
there are no data for other species of coccolithophorids.
Coccolithophorid algae have several light harvesting pigments including chlorophyll a
and c, β-carotene, fucoxanthin, diatoxanthin and diadinoxanthin, similar to diatoms and
chrysophytes (Jeffrey and Wright 1999). The irradiance required to keep
coccolithophorids alive and to saturate photosynthesis also does not appear to be
significantly different from that of other eukaryotic phytoplankton (Brand and Guillard
1981). There are, however, species differences, with Emiliania huxleyi and
Pleurochrysis carterae requiring a five fold higher irridiance compared with
Gephyrocapsa oceanica (Brand and Guillard 1981). It has also been shown that high
irradiances do not inhibit the growth of E. huxleyi (Brand and Guillard 1981), however,
this species has been found to be sensitive to ultraviolet radiation (Gieskes and Buma
1997, Buma, et al. 2000). Blooms of E. huxleyi are found to be induced by high
irradiance (Paasche 200
Effect of light on photosynthesis and calcification
2). Emiliania huxleyi tolerance to high irradiance, even up to
1700 to 2500 µmol photons.m-2.s-1, may be explained by high light reflection of light
coccolithophorids, especially in E. huxleyi (Sikes, et al. 1980, Dong, et al. 1993, Nimer
scattering ability of coccoliths (Young 1994, Balch, et al. 1996b, Voss, et al. 1998).
Algal calcification is highly influenced by light (see reviews by Borowitzka in 1982 and
1989). In one of the earliest studies Paasche (1966) observed the maximum calcification
rate of E. huxleyi at the blue end of the spectrum and he hypothesised this as the
possible stimulator for active bicarbonate transport. There is a wide body of
information on the dependence of calcification on irradiance and photosynthesis in
29
and Merret 1993, Paasche and Brubak 1994, Paasche 2002), however calcification in E.
huxleyi has been found to be light saturated at lower irradiances than photosynthesis
(Paasche 1964). At night, on the other hand, decalcification or low calcification rates
horids such as E. huxleyi, but there may be some exceptions.
1.2 Microalgal ure
Since a United Nations committee recom ended that conventional agriculture be
supplem ted with high-protein foods o ventional origin, microalgae have
become didates for this (Dodd 986). The primary source of all food and
organic raw materials is solar energy (Leit 1, Geider, et al. 2001).
Exponen al increases in the world’s popu nds for finding possible
resource of food will depend on how ef learn to use solar energy.
Conventional agricultural systems are very respect as (1) most plants
that falls on them, (2) most farms cover
all proportion of each crop plant is edible, and (4)
have been observed in E. huxleyi (Paasche and Brubak 1994, Sekino and Shiraiawa
1994, 1996). A number of other studies also indicate that calcification and coccolith
formation in E. huxleyi is a light dependent process (Paasche 1964, Linschooten, et al.
1991, Balch, et al. 1996a). Van der Wal and colleagues (1987), on the other hand,
found the same rate of calcification, in P. carterae, at dark and light. All of these
studies show that calcification appears to be light dependent in some species of
coccolithop
cult
m
en f uncon
natural can 1
h 1975, Larkum 198
ti lation and its dema
s ficiently we can
inefficient in this
can only utilise less than 0.5% of the sun light
only a small land area, (3) only a sm
maximal production is highly limited by the availability of CO2 (Larkum 1981).
Microalgae promise important advantages to improve the solar efficiency utilization that
(1) they can be grown in continuous culture providing maximal annual productivity, (2)
microalgal cells contain relatively low structural material with the possibility of using
30
the whole biomass for nutrition or other economic uses, and (3) addition of CO2 to a
microalgal culture systems is relatively simple compared to field crops (Barak 1980,
Oswald 1980, Soeder 1980, Benemann, et al. 1987). Despite all of these advantages of
microalgae over conventional agriculture, the feasibility of microalgae as a food source
has yet to be proven and it is mainly limited by the high cost of production (Borowitzka
1992). Production of microalgae is, on the other hand, already an economical method
of sewage treatment (Oswald 1980). Decreasing the cost of microalgae production for
different purposes such as a source of oils, polysaccharides, fine chemicals, etc has been
the subject of many studies since the 1940s (Fulks and Main 1991). During the 1950s a
world-wide interest in novel sources of protein to feed the growing human population
led researchers to investigate the possibilities of large-scale algal cultivation systems
(Soeder 1980).
mits to growth
physical, chemical and biological factors (Abeliovich 1980, Javanmardian and Paulsson
Microorganisms, especially bacteria, have been successfully cultured in large-scale
systems such as fermenters for more than half a century (Fritz 1999). The basic
principles of microalgal cultures are the same as other microbial cultures with the
exception of the light requirement in autotrophic or mixotrophic cultures (Lee and Shen
2004). For successful microalgal culture, a suitable species must be selected mainly
based on general physical chemical and biological characteristics together with the
growth optimisation of selected species on a suitable medium (Borowitzka 2005).
1.2.1 Li
The question of what limits algal growth and product yield in microalgal cultures is of
the fundamental importance in the development of a commercial large-scale algal
process. High cell density mass production cultures are unattainable due to a number of
31
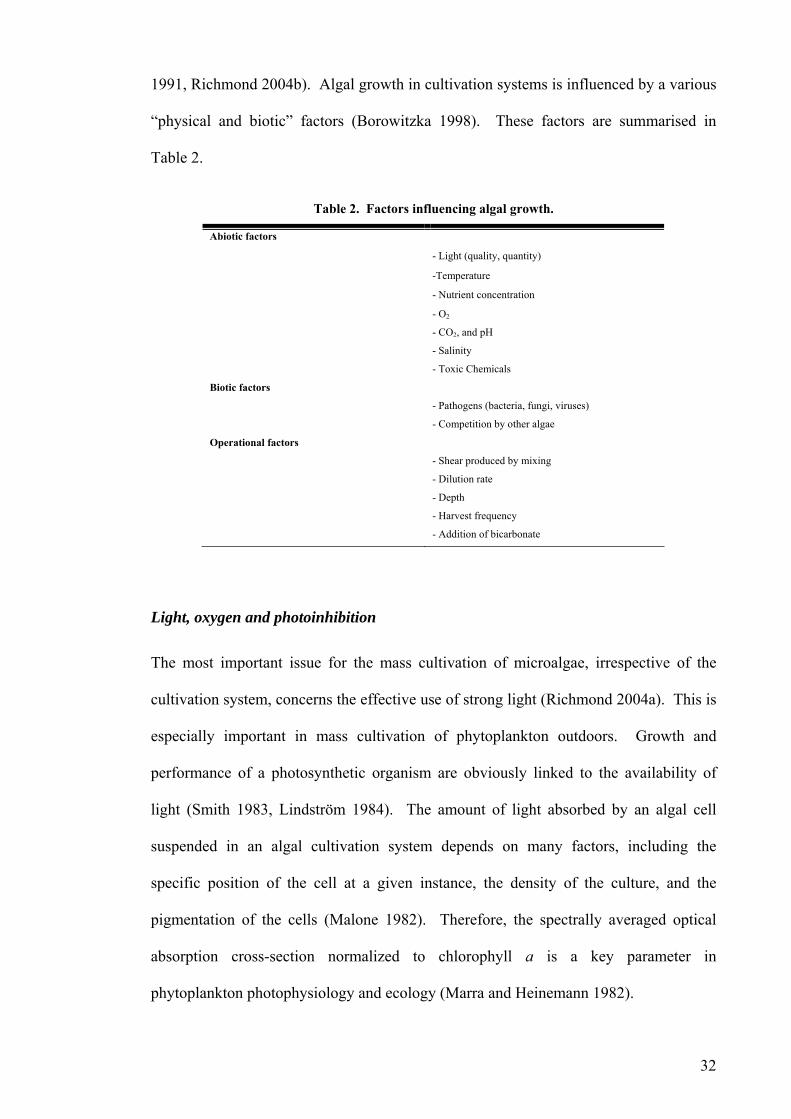
1991, Richmond 2004b). Algal growth in cultivation systems is influenced by a various
“physical and biotic” factors (Borowitzka 1998). These factors are summarised in
Table 2.
Table 2. Factors influencing algal growth.
Abiotic factors
- Light (quality, quantity)
-Temperature
- Nutrient concentration
- O2
- CO , and pH
- Salinity
- Toxic Chemicals
Biotic factors
- Pathogens (bacteria, fungi, viruses)
- Competition by other algae
Operational factors
- Shear produced by mixing
- Dilution rate
2
- Depth
- Harvest frequency
- Addition of bicarbonate
Light, oxygen and
The most important iss ation of microalgae, irrespective of the
cultivation system
especially important tion of phytoplankton outdoors. Growth and
performance of a photosynthetic organism are obviously linked to the availability of
light (Smith 1983, Lindström 1984). The amount of light absorbed by an algal cell
suspended in an algal cultivation system depends on many factors, including the
photoinhibition
ue for the mass cultiv
, concerns the effective use of strong light (Richmond 2004a). This is
in mass cultiva
specific position of the cell at a given instance, the density of the culture, and the
pigmentation of the cells (Malone 1982). Therefore, the spectrally averaged optical
absorption cross-section normalized to chlorophyll a is a key parameter in
phytoplankton photophysiology and ecology (Marra and Heinemann 1982).
32
Photoinhibition is defined as a light-induced depression of photosynthesis that is (1)
manifested as a decrease in the maximum quantum yield of photosynthesis, (2) can
decrease photosynthesis light conversion efficiency, and (3) can decrease the rate of
light-saturated photosynthesis mainly during prolonged exposure to high irradiance
(Vonshak and Guy 1992, Baker and Bowyer 1994). Photoinhibition is also described as
a loss of the photosynthetic capacity due to damage caused by high irradiance
(Vonshak, et al. 1988). Outdoor microalgal cultures are exposed to diurnal changes in
environmental conditions, especially irradiance and temperature. These environmental
factors vary during the day between limiting and possibly inhibiting of photosynthesis.
De-synchronization between these two most important environmental factors may
induce stress on photosynthesis and the growth of outdoor microalgal cultures
(Vonshak, et al. 2001). Light is found to be a major limiting factor of productivity and
growth when nutritional requirements are satisfied and the temperature is not far from
optimal (Richmond 1999). However, in open outdoor systems such as raceway ponds,
light is rarely the sole limiting factor for algal growth and production of biomass (Dodd
1986, Richmond and Grobbelaar 1986).
Predicting culture performance requires an understanding of the relationship between
the light observed and photosynthesis (Tchernov, et al. 2003). Operative management
of large-scale microalgal cultures requires an understanding of factors (i.e. position of
cultivation system) such as the light regime of the average cell and the best possible cell
density (Richmond 2004b).
H
inhibiting factor to consider wher ae (Tredici and Materassi 1992).
to photorespiratory inhibition and algal
death (Richmond, et al. 1993). Growth of many algal species is
inhibited by oxygen levels above air saturation (Weissman, et al. 1988) and this
igh oxygen concentration produced by photosynthesis is also an important growth
e culturing alg
Supersaturated oxygen concentrations can lead
photooxidative
33

inhibition can be especially significant in both closed and open cultivation systems
(Valderrama, et al. 1987, Chisti 1989, Borowitzka 1996). A number of studies have
suggested that O2 and active oxygen species (e.g. O2-and
.OH) can also cause
photoinhibition of photosynthesis (Belay and Fogg 1978, Harbinson 1994).
(a) a light limited region in which photosynthesis intensifies with
increasing irradiance,
(c) a ph
In cultivation systems, the irradiance/photosynthesis relationship can be summarised as
follows:
(b) a light-saturated area in which photosynthesis is not dependent on
irradiance, and
otinhibited region in which photosynthesis decreases with
any further photon flux density (Goldman 1979).
.
This light/photosynthesis relationship is expressed as the photosynthesis-light response
(P/I) curve (Figure 12)(Goldman 1980). The P/I curve is constructed by plotting the
biomass-specific net rate of photosynthesis against irradiance. The biomass term in this
relationship can be expressed in terms of either chlorophyll a content, total pigment
content, organic carbon, organic nitrogen, or dry weight (Dodd 1986). This P/I curve
plays a central role in measuring, predicting and modelling photosynthesis as well as in
the assessment of variations in photosynthetic physiology by indicating the maximum
photosynthetic rate (Pmax) and the initial slope of photosynthesis versus irradiance (α)
(Jassby and Platt 1976, Prezelin 1981)
When all growth conditions are optimal, in optically thin algae cultures, the irradiance is
indeed the sole determinant of light availability to the cells (Richmond 1999). In thin
cultures ( less than 3 - 5 cm), the light curve therefore represents the effect of irradiance
34
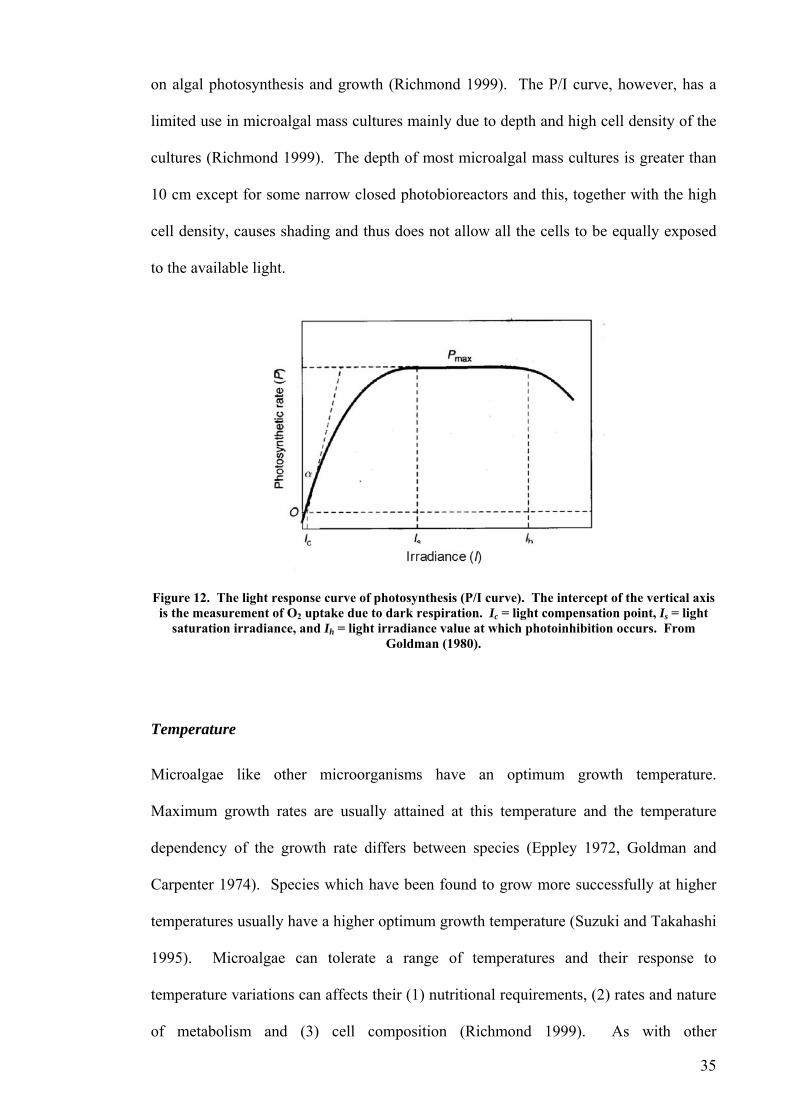
on algal photosynthesis and growth (Richmond 1999). The P/I curve, however, has a
limited use in microalgal mass cultures mainly due to depth and high cell density of the
cultures (Richmond 1999). The depth of most microalgal mass cultures is greater than
10 cm except for some narrow closed photobioreactors and this, together with the high
cell density, causes shading and thus does not allow all the cells to be equally exposed
to the available light.
Figure 12. The light response curve of photosynthesis (P/I curve). The intercept of the vertical axis 2 c s
saturation irradiance, and Iis the measurement of O uptake due to dark respiration. I = light compensation point, I = light
Goldman (1980).
been found to grow more successfully at higher
temperatures usually have a higher optimum growth temperature (Suzuki and Takahashi
1995). Microalgae can tolerate a range of temperatures and their response to
temperature variations can affects their (1) nutritional requirements, (2) rates and nature
of metabolism and (3) cell composition (Richmond 1999). As with other
h = light irradiance value at which photoinhibition occurs. From
Temperature
Microalgae like other microorganisms have an optimum growth temperature.
Maximum growth rates are usually attained at this temperature and the temperature
dependency of the growth rate differs between species (Eppley 1972, Goldman and
Carpenter 1974). Species which have
35
microorganisms, microalgal temperature requirements vary over a wide range from
psychrophilic, mesophilic, to thermophilic (Rhee and Gotham 1981). While most
microalgae can easily tolerate temperatures up to 15oC lower than their optimal,
exceeding the optimum temperature by only 2 to 4oC may result in the total loss of the
culture (Richmond 1999).
gues in (1976) found that the optimum growth range for
Pleurochrysis carterae was between 10oC and 26oC. It would also be of substantial
interest to know whether coccolith morphology is influenced by temperature to the
at the coccolith form could give an index of environmental temperature, past
most economical way of decreasing temperature (Raven 1988). The lowest possible
A recent review by Paasche (2002) reported that the maximum growth temperature for
Emiliania huxleyi was between 10oC and 26oC and Watabe and Wilbur (1966) found
that coccolith production in E. huxleyi is highly temperature dependent. Similarly,
Blankley and collea
degree th
and present (Watabe and Wilbur 1966, Green, et al. 1998, Young, et al. 1999). For
example, Stoll et al. (2002b) found a high dependence of coccolith production on
temperature and specific growth rate.
Temperature is the most important limiting factor, after light, for culturing algae in both
closed and open outdoor systems (Richmond 1987, 1988, Richmond, et al. 1990,
Torzillo, et al. 1991). While temperature effects are well documented for many species
of microalgae in the laboratory, the magnitude of temperature effects on the annual
production of biomass outdoors seems not to be sufficiently appreciated.
When dealing with temperature as the limiting factor, one of major problems inherent in
a closed cultivation system (photobioreactor) is overheating. Temperature increases,
especially in closed systems, can reach up to 55oC during the day (Goldman 1977,
Zhang, et al. 1999, Morita, et al. 2001b). Evaporative water cooling systems are the
36
range of temperature achieved by an evaporative water cooling system is between 26-
29oC and other cooling systems are too expensive for large-scale culturing (Goldman
1977, Grima, et al. 2000, Miron, et al. 2000).
ctor in a pilot plant of
Spirulina sp. during winter in Chile. Borowitzka and Borowitzka (1987) also reported
low temperature during the night period as a limiting factor in the growth of D. salina
grown outdoors. Based on this knowledge, finding a species of algae which can grow at
the temperature range at the proposed culture site is a very important step for
establishing algal cultivation systems.
grown in an outdoor raceway pond. It has also been shown that low early morning
temperatures can induce the photoinhibition of the algae (Carlozzi and Sacchi 2001,
t al. 2001).
one of the earliest priorities for a successful microalgal culture is to establish the
For outdoor open cultivation systems, based on the high cost of the cooling and heating,
it would be an economical advantage to isolate algae species with a wide temperature
tolerance (Maddux and Jones 1964, Vonshak, et al. 2001). However, in open culture
systems the temperature constantly changes throughout the night and day period which
can have negative effects on biomass production (Valderrama, et al. 1987, Richmond
1992, Garcia, et al. 2003, Jimenez, et al. 2003b). For example, Ayala and Vargas
(1987) reported low temperature to be the main limiting fa
Irradiance also interacts strongly with temperature and algae can tolerate higher
irradiances at temperature closer to the optimum growth temperature (Borowitzka
1998). Vonshak and colleagues (1982) have demonstrated the same pattern in Spirulina
Vonshak, e
Irrespective of the culture system, higher temperatures can affect growth as well as
composition of the algae culture. These effects seems to be lessened when microalgae
are cultivated in outdoor rather than indoor cultures (Payer, et al. 1980). In conclusion,
37
temperature range of the selected species and suitability of this species for the chosen
climatic conditions.
Every alga has a different optimum salinity range (Brand 1984). Salinity can increase
markedly in both open and closed systems especially during hot weather conditions due
to high evaporation. Salinity may also decrease in an open system due to rainfall
(Oswald 1988, Richm
Salinity
ond 1988). While microalgae have been found to tolerate a wide
range of salinities, changes due to evaporation or rainfall have been found to be major
affect phytoplankton normally in three ways:
(1) osmotic stress (2) ion (salt) stress; and (3) changes of the cellular ionic ratios due to
The relative level of marine phytoplankton tolerance to low salinities is estuarine >
factors inhibiting the growth of marine microalgae (Borowitzka and Borowitzka 1990,
Tredici and Materassi 1992, Becker 1994, Fabregas, et al. 2000, Garcia, et al. 2003).
The easiest way for controlling of salinity is by adding fresh water or salt as required.
Our knowledge of the physiology of the effects of salinity and the tolerance of
phytoplankton to changes in salinity has made considerable progress in the last few
decades (Kirst 1989). Changes of salinity
the selective ion permeability of the membrane (Glass 1983, Brand 1984). Salinity can
also effect the growth and cell composition of microalgae (Gomez, et al. 2003).
coastal > oceanic species (Brand 1984, Kirst 1989). The salinity tolerance range is
quite different for different species of microalgae and near the limits growth may be
sacrificed in order to maintain osmotic adjustments (White 1978, Gomez, et al. 2003).
In microalgae, extensive hypoosmotic shock has been reported to have little effect on
photosynthesis in species with strong cell walls, while most wall-less species appear to
38
be more sensitive (Hellebust 1985). Moreover, Lu et al. (1999) found a negative effect
of high salinity stress on the photosystem II of phytoplankton.
There have also been a few studies on the effect of salinity on growth and physiology of
coccolithophorids. Fisher and colleagues (1988/1989) observed two very different
nd Jones 1964,
1981, Smith 1983, Cronar and Fallowfield 1997).
organic composition of microalgae. For instance,
nutrient limitation is probably one of the most critical factors affecting the algal lipid
metabolism (Borowitzka 1988b). Most algae found respond to N-limitation by
increasing their lipid content (Borowitzka 1988b). Shifrin and Chisholm (1981) also
observed an increase in lipid content of 20 to 30 species of microalgae under N-
deprivation. In general the marine primary production is found to be N-limited (Ryther
and Dunstan 1971).
salinity ranges for two clones of Emiliania huxleyi. Paasche et al. (1996) demonstrated
a decrease in the amount of calcium deposited per coccolith in Emiliania huxleyi at low
salinity. They also found a salinity range of 10 to 34 ppt for growth of several clones of
this species. Paasche (1968a) also observed that P. carterae tolerated to a wide range
of salinities. Green and colleagues (1998) also found that reduced salinity caused
changes in the overall form of the coccoliths, particularly in the degree of calcification.
Nutrients
Phototrophic organisms use light energy to obtain most of their nutritional needs from
inorganic compounds. The most important nutrients influencing the growth of
microalgae are nitrogen, phosphorus and carbon (Richmond 1988) and each microalgal
species tends to have its own optimum nutrient concentration (Maddux a
Rhee and Gotham
Nutrient limitation can influence the
39
Phosphorus is also an important nutrient required for microalgae growth as it plays an
essential role in cell metabolism and regulation (Droop 1973, Smith 1983), being
involved in the production of enzymes, phospholipids and energy-supplying compounds
such as AMP, ADP and ATP (Taylor 1987, Beardall, et al. 2001). Phosphorus
limitation, for example, has been shown to induce coccolith production and decrease the
growth rate of the coccolithophorids E. huxleyi and P. carterae (Dorigan and Wilbur
1973, Shiraiawa, et al. 2003).
Although the supply of Nitrogen, Phosphorus and Carbon is critical, other nutrients also
affect the growth and metabolism of the microalgae. Other nutrients, such as
manganese and various cations (Mg , K , and Ca ) have shown to decrease the
microalgal growth when limited (Droop 1973). Trace elements have also been found to
be critical in the growth of microalgae. For example, copper, iron and zinc are found
essential for facilitating some enzymatic functions such as carbonic anhydrase (Brand,
et al. 1983, Lage, et al. 1994, Morel, et al. 1994, Buitenhuis, et al. 2003). Some
microalga has been found to require vitamins for their growth. Pleurochrysis carterae
growth, for example, was found to be stimulated by the addition of vitamin B12 to the
medium (Miyamoto, et al. 2002).
Coccolithophorids can use nitrate, nitrite, ammonium and urea as a nitrogen source
rth 1974, Brand 1994). E. huxleyi was found to be a poor competitor
Carbon also is an important nutrient limiting the growth of microalgae. Carbon is the
sole source of photosynthesis and most algal culture are carbon limited (Borowitzka
1998). As also noted in page 15, most marine phytoplankton are C-limited.
2+ + 2+
(Wheeler and No
for nitrogen (Riegman, et al. 1992, Riegman, et al. 2000). Low nitrate and phosphate
content of medium can induce calcification and limits the growth of coccolithophorids
(see page 13) and many oceanic species of coccolithophorids such as E. huxleyi has
40
adapted to grow under low nitrate and phosphate. While, diatoms need high silicate
concentration for blooming in the ocean, low silicate concentration seems to play an
important role in the initiation of E. huxleyi blooms (Tyrell and Merico 2004). This
species was also found to be highly competitive when grown under phosphorus limited
conditions (Riegman, et al. 1992). The oceanic coccolithophorids are also able to grow
better under low iron, manganese, and zinc concentrations than coastal species (Brand,
et al. 1983). Danbara and Shiraiawa (1999) have demonstrated a high selenium growth
requirement for coccolithophorids when compared to other microalgae.
Mixing, turbulence (shear)
Mixing is also a critical factor for achieving high productivity in all ty
pes of algal
all scale shear can be beneficial to phytoplankton by increasing the
ration and agitation
cultivation systems (Borowitzka 1996). The mixing characteristic of gas, liquid and
solid phases in a photobioreactor have a strong effect on the functioning of such systems
(Chisti 1989). Turbulence and shear produced by mixing is a ubiquitous feature of
closed photobioreactors and is generated by fluid flow (Doran 1995). Microalgae,
grown in any type of closed photobioreactor, are continuously subjected to the shear
created by small scale turbulence.
Shear may have both positive and negative effects on cell physiology. It has been
hypothesized that sm
diffusion rate of nutrients to the cell surface (Thomas, et al. 1995). The negative effects
of small-scale turbulence on microalgae are found to be through a variety of
mechanisms, including (1) physiological impairment, (2) behavioural alteration and (3)
mechanical damage, especially on motile cells by detaching the flagellae (Thomas and
Gibson 1990, Berdalet 1992, Hondzo and Lyn 1999, Sulivan and Swift 2003). The
perceived sensitivity of cells to shear stress associated with ae
41
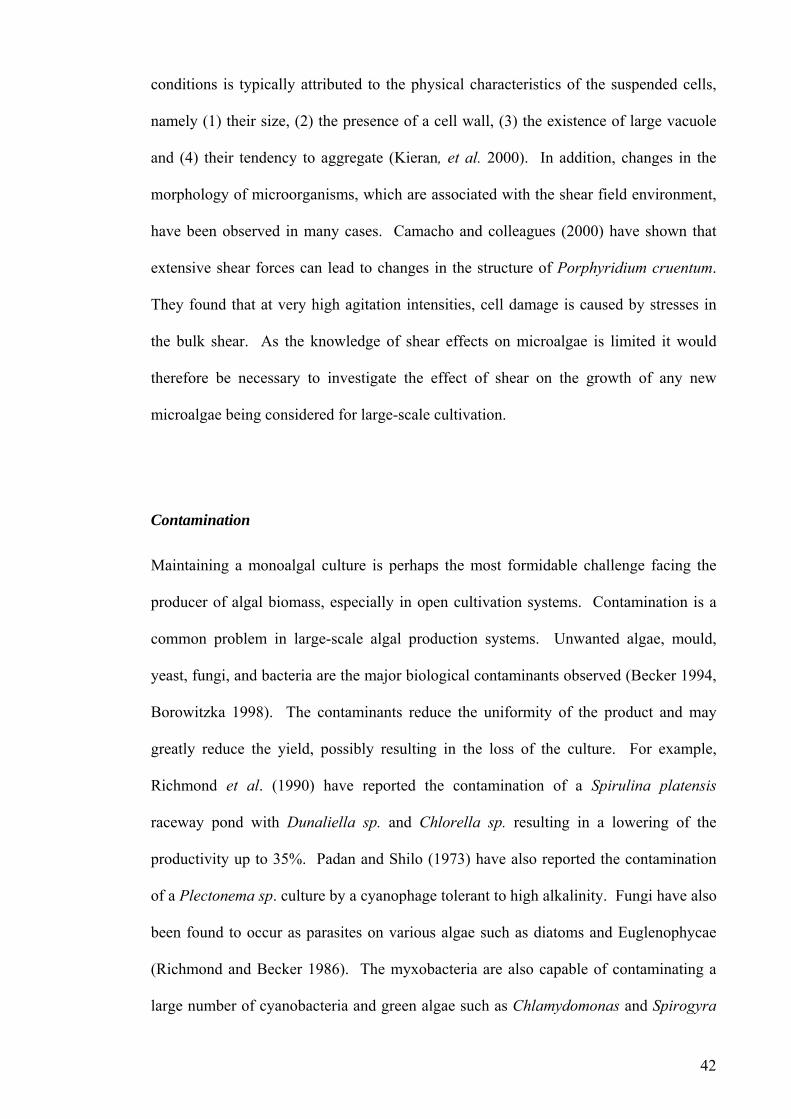
conditions is typically attributed to the physical characteristics of the suspended cells,
namely (1) their size, (2) the presence of a cell wall, (3) the existence of large vacuole
and (4) their tendency to aggregate (Kieran, et al. 2000). In addition, changes in the
is
raceway pond with Dunaliella sp. and Chlorella sp. resulting in a lowering of the
productivity up to 35%. Padan and Shilo (1973) have also reported the contamination
of a Plectonema sp. culture by a cyanophage tolerant to high alkalinity. Fungi have also
been found to occur as parasites on various algae such as diatoms and Euglenophycae
(Richmond and Becker 1986). The myxobacteria are also capable of contaminating a
rge number of cyanobacteria and green algae such as Chlamydomonas and Spirogyra
morphology of microorganisms, which are associated with the shear field environment,
have been observed in many cases. Camacho and colleagues (2000) have shown that
extensive shear forces can lead to changes in the structure of Porphyridium cruentum.
They found that at very high agitation intensities, cell damage is caused by stresses in
the bulk shear. As the knowledge of shear effects on microalgae is limited it would
therefore be necessary to investigate the effect of shear on the growth of any new
microalgae being considered for large-scale cultivation.
Contamination
Maintaining a monoalgal culture is perhaps the most formidable challenge facing the
producer of algal biomass, especially in open cultivation systems. Contamination is a
common problem in large-scale algal production systems. Unwanted algae, mould,
yeast, fungi, and bacteria are the major biological contaminants observed (Becker 1994,
Borowitzka 1998). The contaminants reduce the uniformity of the product and may
greatly reduce the yield, possibly resulting in the loss of the culture. For example,
Richmond et al. (1990) have reported the contamination of a Spirulina platens
la
42
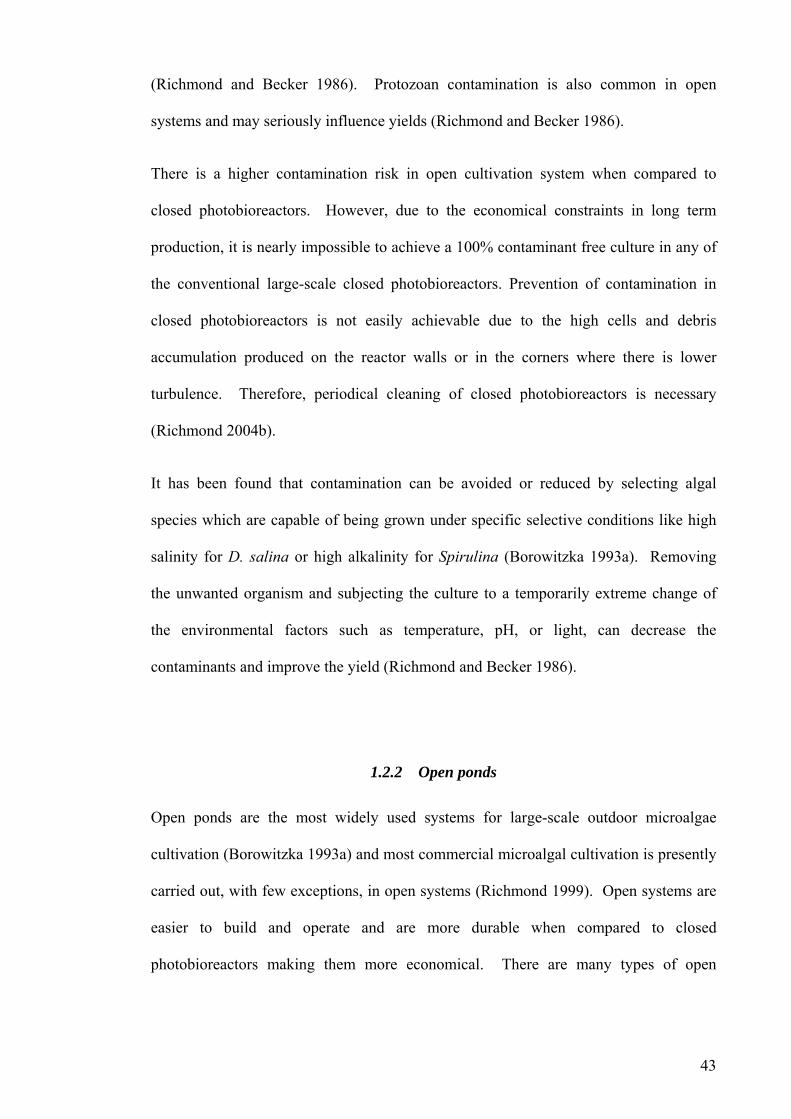
(Richmond and Becker 1986). Protozoan contamination is also common in open
closed photobioreactors is not easily achievable due to the high cells and debris
(
ination can be avoided or reduced by selecting algal
when compared to closed
photobioreactors making them more economical. There are many types of open
systems and may seriously influence yields (Richmond and Becker 1986).
There is a higher contamination risk in open cultivation system when compared to
closed photobioreactors. However, due to the economical constraints in long term
production, it is nearly impossible to achieve a 100% contaminant free culture in any of
the conventional large-scale closed photobioreactors. Prevention of contamination in
accumulation produced on the reactor walls or in the corners where there is lower
turbulence. Therefore, periodical cleaning of closed photobioreactors is necessary
Richmond 2004b).
It has been found that contam
species which are capable of being grown under specific selective conditions like high
salinity for D. salina or high alkalinity for Spirulina (Borowitzka 1993a). Removing
the unwanted organism and subjecting the culture to a temporarily extreme change of
the environmental factors such as temperature, pH, or light, can decrease the
contaminants and improve the yield (Richmond and Becker 1986).
1.2.2 Open ponds
Open ponds are the most widely used systems for large-scale outdoor microalgae
cultivation (Borowitzka 1993a) and most commercial microalgal cultivation is presently
carried out, with few exceptions, in open systems (Richmond 1999). Open systems are
easier to build and operate and are more durable
43

cultivation systems for microalgae cultivation which vary in (1) size, (2) shape, (3)
material used for construction, (4) type of agitation, and (5) inclination (Tredici 2004).
Benemann 1985, Becker 1994), 4-5 US$.Kg-1 for Spirulina (De Pauw and
Persoone 1988, Levert and Xia 2001, Jimenez, et al. 2003a), and between 7 to 10
es such as Dunaliella salina (Benemann, et al. 1987). These type of
ponds are used for culturing D. salina for ß-carotene production in Western Australia
and South Australia (Borowitzka and Borowitzka 1988, Borowitzka 1997). The very
However, to date only a few species of microalgae (e.g. D. salina, Spirulina sp.,
Chlorella sp.) have been found to be able to be grown successfully at a commercial
scale in open ponds (Tredici and Materassi 1992, Borowitzka 1993a). Profitable
production of microalgae, at present, is limited to comparatively few production plants
producing high value health foods, most of which are located in south east Asia,
Australia, and the USA (Borowitzka and Borowitzka 1990, Benemann 1992, Richmond
1992). Production costs are high, estimated to be 10-20 US$.Kg-1 for Chlorella sp. in
Japan (
US$.Kg-1 for Dunaliella salina (Benemann 1985, Borowitzka and Borowitzka 1990).
Many different designs have been suggested for pond construction but only four major
pond design have been developed and operated at a large-scale: (1) unstirred ponds
(lakes and natural ponds) (Figure 13a), (2) inclined ponds (Figure 13c), (3) central pivot
ponds (Figure 13b), and (4) raceway ponds (Figure 13d).
Unstirred ponds
Unstirred ponds (Figure 13a) represent the most economical and least technical of all
commercial culture methods and are being used commercially for a number of
microalgal speci
44
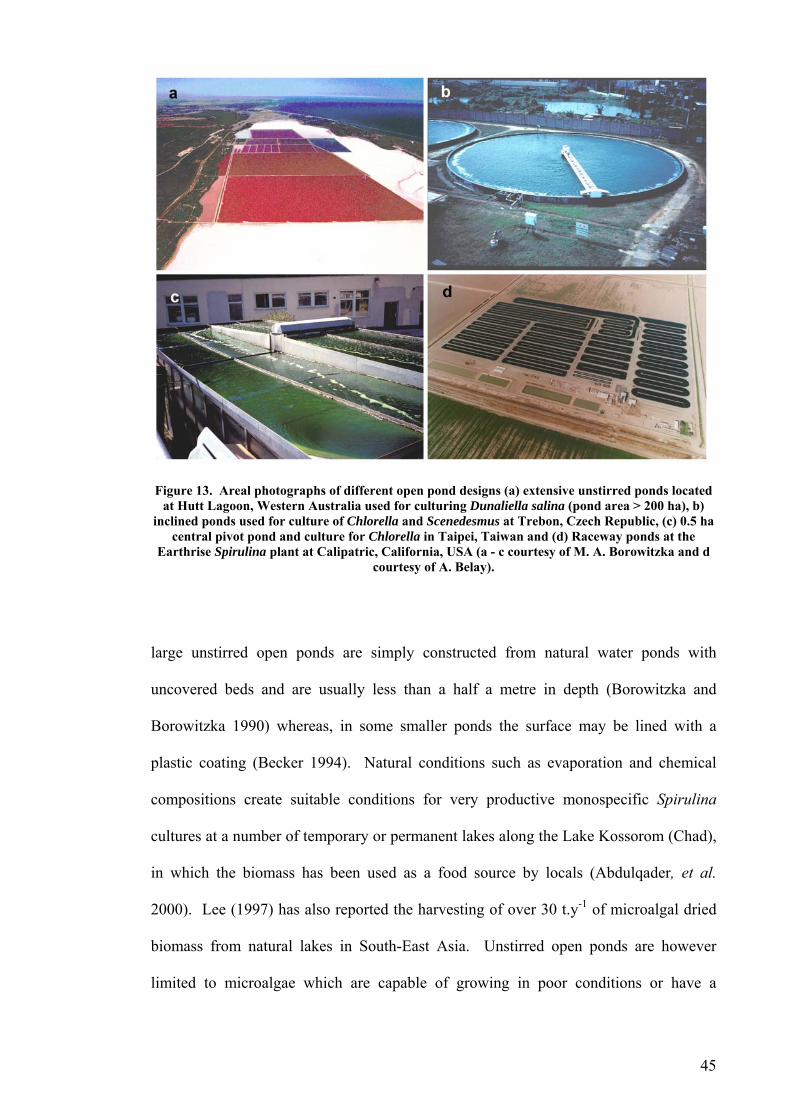
Figure 13. Areal photographs of different openat Hutt Lagoon, Western Australia used for cu
pond designs (a) extensive unstirred ponds located lturing Dunaliella salina (pond area > 200 ha), b)
inclined ponds used for culture of Chlorella and Scenedesmus at Trebon, Czech Republic, (c) 0.5 ha
courtesy of A. Belay).
conditions or have a
central pivot pond and culture for Chlorella in Taipei, Taiwan and (d) Raceway ponds at the Earthrise Spirulina plant at Calipatric, California, USA (a - c courtesy of M. A. Borowitzka and d
large unstirred open ponds are simply constructed from natural water ponds with
uncovered beds and are usually less than a half a metre in depth (Borowitzka and
Borowitzka 1990) whereas, in some smaller ponds the surface may be lined with a
plastic coating (Becker 1994). Natural conditions such as evaporation and chemical
compositions create suitable conditions for very productive monospecific Spirulina
cultures at a number of temporary or permanent lakes along the Lake Kossorom (Chad),
in which the biomass has been used as a food source by locals (Abdulqader, et al.
2000). Lee (1997) has also reported the harvesting of over 30 t.y-1 of microalgal dried
biomass from natural lakes in South-East Asia. Unstirred open ponds are however
limited to microalgae which are capable of growing in poor
45
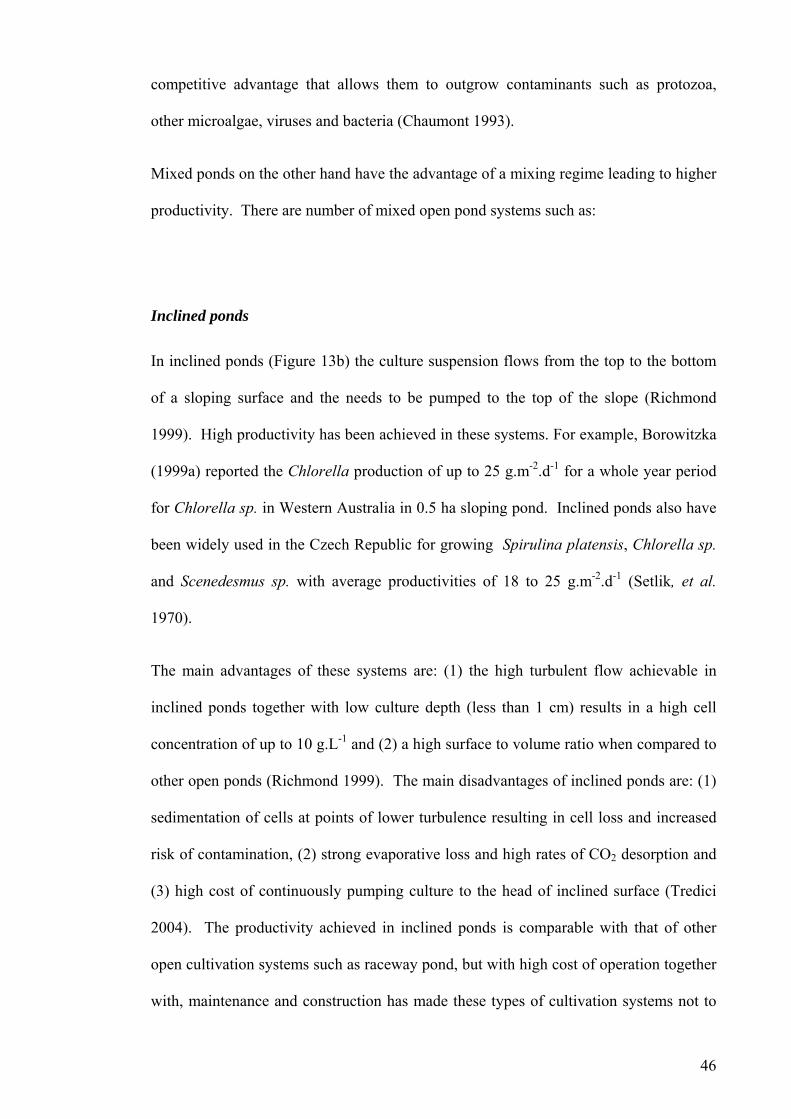
competitive advantage that allows them to outgrow contaminants such as protozoa,
other microalgae, viruses and bacteria (Chaumont 1993).
Inclined ponds
Mixed ponds on the other hand have the advantage of a mixing regime leading to higher
productivity. There are number of mixed open pond systems such as:
In inclined ponds (Figure 13b) the culture suspension flows from the top to the bottom
of a sloping surface and the needs to be pumped to the top of the slope (Richmond
1999). High productivity has been achieved in these systems. For example, Borowitzka
(1999a) reported the Chlorella production of up to 25 g.m-2.d-1 for a whole year period
The main advantages of these systems are: (1) the high turbulent flow achievable in
clined ponds together with low culture depth (less than 1 cm) results in a high cell
concentration of up to 10 g.L-1 e ratio when compared to
other open ponds (Richmond 1999). The main disadvantages of inclined ponds are: (1)
sedimentation of cells at points of lower turbulence resulting in cell loss and increased
risk of contamination, (2) strong evaporative loss and high rates of CO2 desorption and
(3) high cost of continuously pumping culture to the head of inclined surface (Tredici
2004). The productivity achieved in inclined ponds is comparable with that of other
open cultivation systems such as raceway pond, but with high cost of operation together
with, maintenance and construction has made these types of cultivation systems not to
for Chlorella sp. in Western Australia in 0.5 ha sloping pond. Inclined ponds also have
been widely used in the Czech Republic for growing Spirulina platensis, Chlorella sp.
and Scenedesmus sp. with average productivities of 18 to 25 g.m-2.d-1 (Setlik, et al.
1970).
in
and (2) a high surface to volum
46
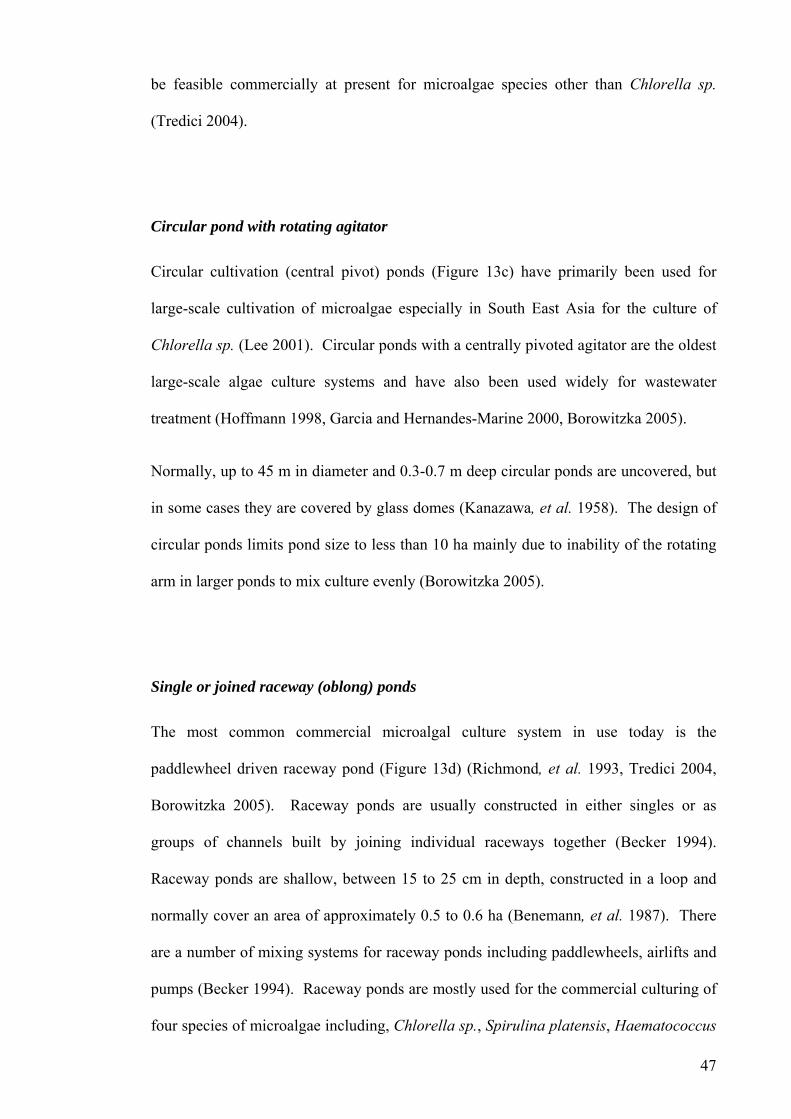
be feasible commercially at present for microalgae species other than Chlorella sp.
(Tredici 2004).
Circular pond with rotating agitator
Circular cultivation (central pivot) ponds (Figure 13c) have primarily been used for
large-scale cultivation of microalgae especially in South East Asia
for the culture of
p. (Lee 2001). Circular ponds with a centrally pivoted agitator are the oldest
large-scale algae culture systems and have also been used widely for wastewater
e 2000, Borowitzka 2005).
Normally, up to 45 m in diameter and 0.3-0.7 m deep circular ponds are uncovered, but
in some cases they are covered by glass domes (Kanazawa, et al. 1958). The design of
circular ponds limits pond size to less than 10 ha mainly due to inability of the rotating
arm in larger ponds to mix culture evenly (Borowitzka 2005).
The most common commercial microalgal culture system in use today is the
paddlewheel driven raceway pond (Figure 13d) (Richmond, et al. 1993, Tredici 2004,
orowitzka 2005). Raceway ponds are usually constructed in either singles or as
groups of channels built by joining individual raceways together (Becker 1994).
Raceway ponds are shallow, between 15 to 25 cm in depth, constructed in a loop and
normally cover an area of approximately 0.5 to 0.6 ha (Benemann, et al. 1987). There
are a number of mixing systems for raceway ponds including paddlewheels, airlifts and
pumps (Becker 1994). Raceway ponds are mostly used for the commercial culturing of
four species of microalgae including, Chlorella sp., Spirulina platensis, Haematococcus
Chlorella s
treatment (Hoffmann 1998, Garcia and Hernandes-Marin
Single or joined raceway (oblong) ponds
B
47
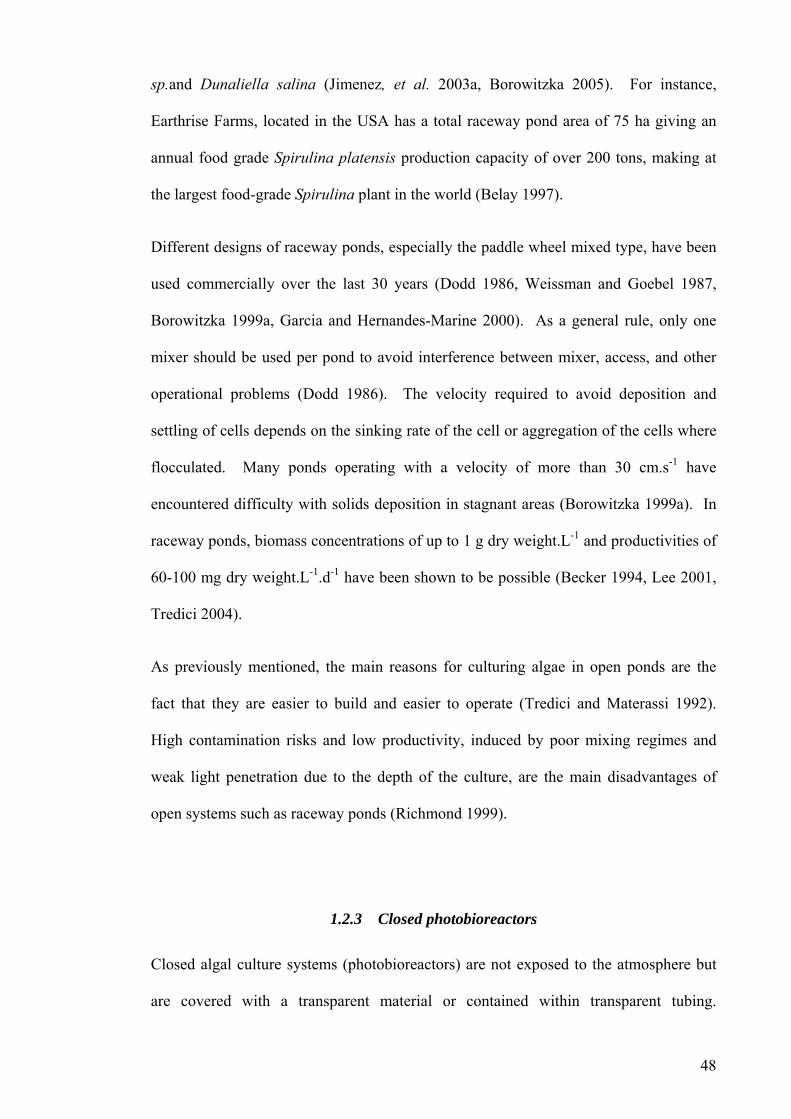
sp.and Dunaliella salina (Jimenez, et al. 2003a, Borowitzka 2005). For instance,
Earthrise Farms, located in the USA has a total raceway pond area of 75 ha giving an
annual food grade Spirulina platensis production capacity of over 200 tons, making at
the largest food-grade Spirulina plant in the world (Belay 1997).
Different designs of raceway ponds, especially the paddle wheel mixed type, have been
used commercially over the last 30 years (Dodd 1986, Weissman and Goebel 1987,
Borowitzka 1999a, Garcia and Hernandes-Marine 2000). As a general rule, only one
mixer should be used per pond to avoid interference between mixer, access, and other
operational problems (Dodd 1986). The velocity required to avoid deposition and
settling of cells depends on the sinking rate of the cell or aggregation of the cells where
flocculated. Many ponds operating with a velocity of more than 30 cm.s-1 have
encountered difficulty with solids deposition in stagnant areas (Borowitzka 1999a). In
raceway ponds, biomass concentrations of up to 1 g dry weight.L-1 and productivities of
60-100 mg dry weight.L-1.d-1 have been shown to be possible (Becker 1994, Lee 2001,
Tre
As previously mentioned, the main reasons for culturing algae in open ponds are the
fact that they are easier to build and easier to operate (Tredici and Materassi 1992).
dici 2004).
High contamination risks and low productivity, induced by poor mixing regimes and
weak light penetration due to the depth of the culture, are the main disadvantages of
open systems such as raceway ponds (Richmond 1999).
1.2.3 Closed photobioreactors
Closed algal culture systems (photobioreactors) are not exposed to the atmosphere but
are covered with a transparent material or contained within transparent tubing.
48
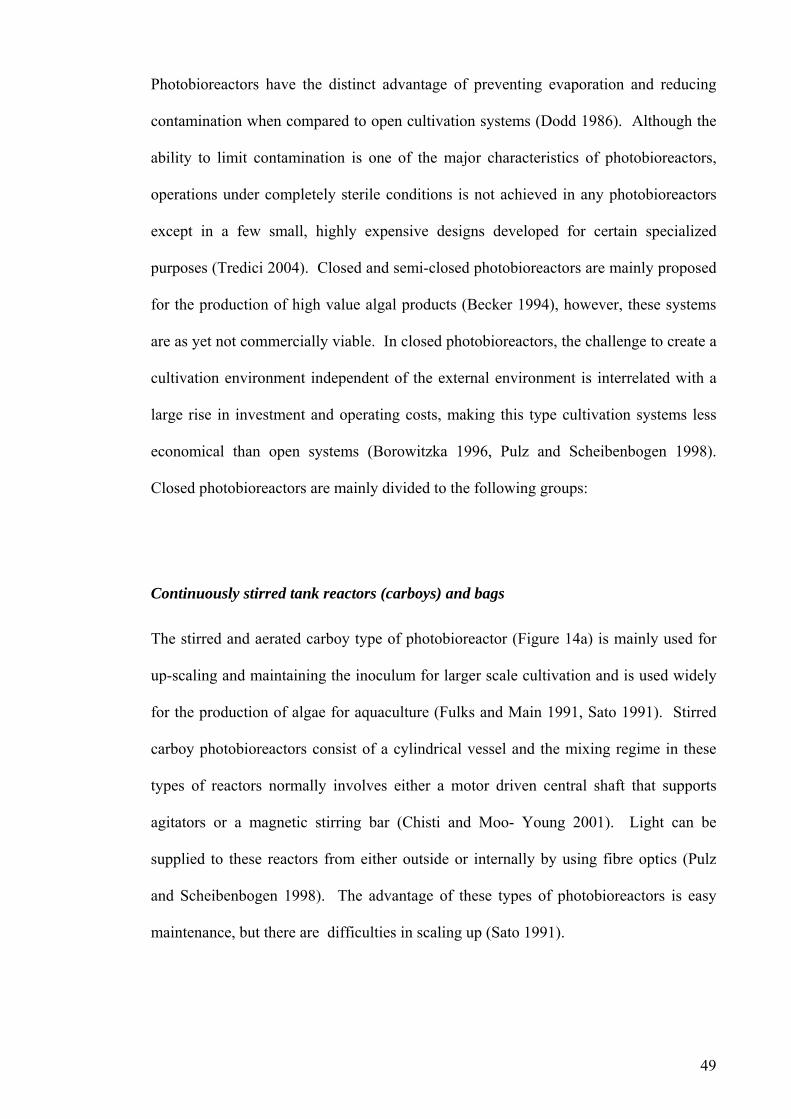
Photobioreactors have the distinct advantage of preventing evaporation and reducing
contamination when compared to open cultivation systems (Dodd 1986). Although the
ability to limit contamination is one of the major characteristics of photobioreactors,
operations under completely sterile conditions is not achieved in any photobioreactors
ighly expensive designs developed for certain specialized
except in a few small, h
purposes (Tredici 2004). Closed and semi-closed photobioreactors are mainly proposed
for the production of high value algal products (Becker 1994), however, these systems
are as yet not commercially viable. In closed photobioreactors, the challenge to create a
cultivation environment independent of the external environment is interrelated with a
large rise in investment and operating costs, making this type cultivation systems less
economical than open systems (Borowitzka 1996, Pulz and Scheibenbogen 1998).
Closed photobioreactors are mainly divided to the following groups:
Continuously stirred tank reactors (carboys) and bags
The stirred and aerated carboy type of photobioreactor (Figure 14a) is mainly used for
up-scaling and maintaining the inoculum for larger scale cultivation and is used widely
for the production of algae for aquaculture (Fulks and Main 1991, Sato 1991). Stirred
carboy photobioreactors consist of a cylindrical vessel and the mixing regime in these
types of reactors normally involves either a motor driven central shaft that supports
agitators or a magnetic stirring bar (Chisti and Moo- Young 2001). Light can be
supplied to these reactors from either outside or internally by using fibre optics (Pulz
and Scheibenbogen 1998). The advantage of these types of photobioreactors is easy
maintenance, but there are difficulties in scaling up (Sato 1991).
49
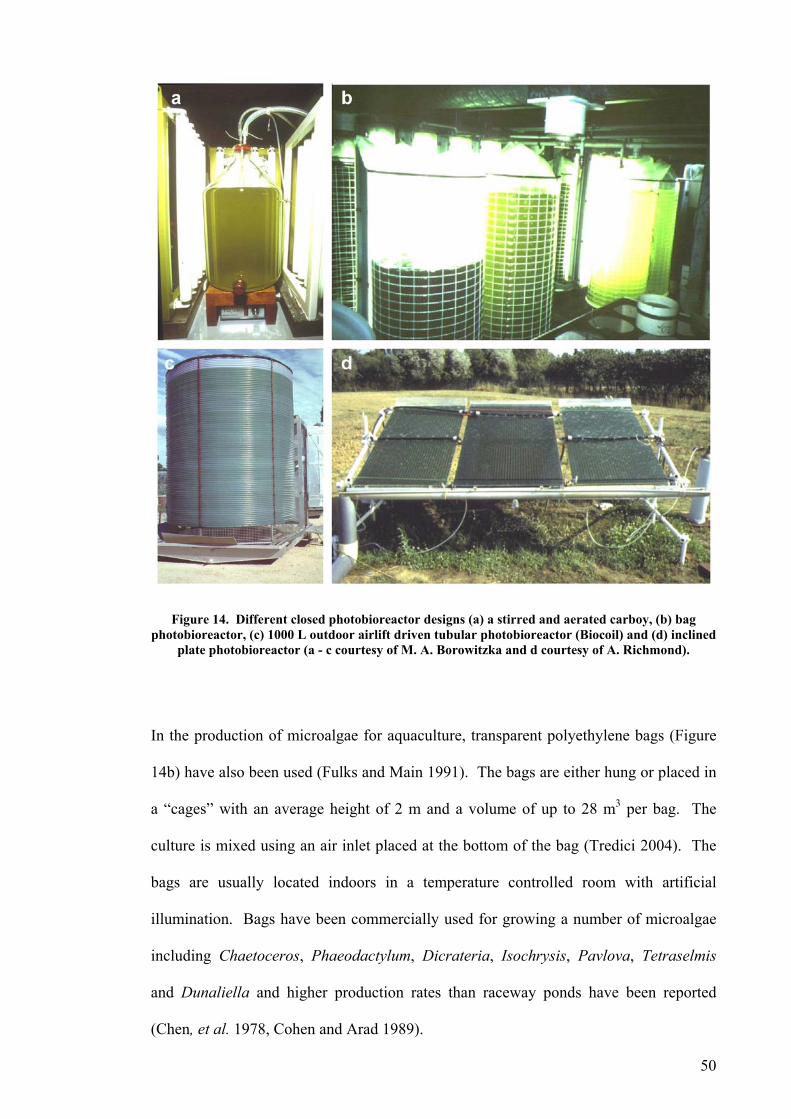
Figure 14. Different closed photobioreactor designs (a) a stirred and aerated carboy, (b) bag driven tubular photobioreactor (Biocoil) and (d) inclined
plate photobioreactor (a - c courtesy of M. A. Borowitzka and d courtesy of A. Richmond).
In the production of microalgae for aquaculture, transparent polyethylene bags (Figure
14b) have also been used (Fulks and Main 1991). The bags are either hung or placed in
a “cages” with an average height of 2 m and a volume of up to 28 m3 per bag. The
culture is mixed using an air inlet placed at the bottom of the bag (Tredici 2004). The
bags are usually located indoors in a temperature controlled room with artificial
illumination. Bags have been commercially used for growing a number of microalgae
including Chaetoceros, Phaeodactylum, Dicrateria, Isochrysis, Pavlova, Tetraselmis
and Dunaliella and higher production rates than raceway ponds have been reported
(Chen, et al. 1978, Cohen and Arad 1989).
photobioreactor, (c) 1000 L outdoor airlift
50
The main advantage of bags for microalgae production is the ease of the operation when
compared to many other cultivation systems.
Tubular photobioreactor
vertical helical (Chrismadha and Borowitzka
1994a) or as a straight tubes (Janssen, et al. 2002) to achieve better light penetration or
flow. Temperatur
in the reactor circuit. ctors that circulate the culture by using an
airlift device are e
moving parts and thi a reduced potential for
contamination (Chisti 1989); the cell damage associated with mechanical pumping is
avoided (Vandonjon 1999). The airlift device combines the function of a pump
and a gas exchanger that
and Borowitzka 1
culture circulation, the
dictated by the char cultivated and there is no
universal mixing system for all organisms (Molina, et al. 2001). Lower contamination
and constant temperature have been found to be the advantages of using tubular
photobioreactors. Many algal species such as Spirulina sp. and Phaeodactylum sp. have
been successfully cultivated in tubular photobioreactors although none of these trials
have been commercially viable to date (Borowitzka 1996, Pulz and Scheibenbogen
Tubular photobioreactors (Figure 14c) consist of long transparent tubes made of glass,
plastic or teflon with diameters ≈ 3-6 cm and lengths ranging from 10 to 100 m. The
culture medium is forced through these tubes by either mechanical (i.e. centrifugal
pumps) or air-lift pumps. The tubes can be arranged in many ways: vertical, horizontal
(Janssen, et al. 2002), conical helical,
e control may be by evaporative cooling or a heat exchanger installed
Tubular photobiorea
specially attractive for several reasons: circulation is achieved without
s provides a robust culture system with
, et al.
removes the oxygen produced by photosynthesis (Chrismadha
994b, Rubio, et al. 1999). However pumps can be also used for
choice of mixing device and of the intensity of mixing should be
acteristics of the microalgae to be
51
1998, Richmond 1999). So far tubular photobioreactors seems to be one of the most
promising closed microalgal cultivation systems.
Airlift photobioreactor
In airlift photobioreactors, the fluid volume of the vessel is divided into two
i on
oreactors (Figure 14d) consist of a transparent rectangular container with
er) trial of
producing polysaccharides from Porphyridium cruentum using a 3 m2 inclined plate
photobioreactor from has also been reported (Anderson and Eakin 1985). Hu and
nterc nected zones by means of a baffle or a draft tube (Janssen, et al. 2002). Liquid
movement is characterized by large circulatory currents in the heterogenous flow
regime (Chisti and Moo- Young 2001). There have been relatively few studies on these
kind of reactors for large-scale algal culture (Barbosa, et al. 2003), however, airlift type
reactors have been used economically for animal cell cultivation (Grima, et al. 1997).
Difficulties in scaling up and a complex flow regime are some of the disadvantage of
airlift photobioreactors (Miron, et al. 2000).
Plate (Flat Panel) photobioreactors
Plate photobi
the space between 1 to 5 cm. Flow of culture medium in these reactors is produced by
introducing air via a pierced tube at the bottom of the reactors (Janssen, et al. 2002).
Flat plate photobioreactors have shown high productivities for some species of algae
such as Nanochloropsis sp. Chaetoceros mulleri, and Porphyridium cruentum (Hu, et
al. 1998). Zhang et al. (1999) and Zhang et al. (2001) have successfully grown a
thermophilic cyanobacterium (Synechocystis aquatilis) in outdoor 24 L and 48 L
vertical plate reactors for a period of 5 months. A three months (during summ
52

colleagues (1998) have grown Chlorococcum littorale in a flat-plate photobioreactor
with a short light-path and achieved an ultra-high cell density of over 80 g dry weight.
L-1. Reducing the light path, simpler construction, absence of narrow U-turns and better
gas exchange are advantages of plate reactor compared to tubular photobioreactors.
In conclusion, closed systems are characterized by the control of many of the
environmental parameters. Culturing algae in these kind of systems has the added
benefit of reducing the contamination risks, limiting CO2 losses, creating reproducible
cultivation conditions, and flexibility in technical design (Borowitzka 1999a, Richmond
(a) reducing the light path (Borowitzka 1996, Miron, et al. 1999,
Janssen, et al. 2002),
(b) solving shear (turbulence) complexity (Borowitzka 1996,
Barbosa, et al. 2003, Miron, et al. 2003),
(c) reducing oxygen concentration (Weissman, et al. 1988, Rubio, et
al. 1999, Acién Fernández, et al. 2001, Kim and Lee 2001), and
al. 1999, Carlozzi and Sacchi 2001).
A few commercial-scale plate photobioreactors have been built and operated, but most
have been shut down after a short period of time mainly for environmental reasons
(Tredici 2004). Currently the main disa s of closed systems are the high cost of
1999, Tredici 2004). A number of researchers have endeavoured to overcome a number
of closed systems weaknesses by:
(d) better and more economical temperature control systems
(Torzillo, et al. 1991, Becker 1994, Borowitzka 1996, Zhang, et
dvantage
construction, maintenance including cleaning and sterilization (Borowitzka 1996), high
oxygen build up (Chrismadha and Borowitzka 1994b) and some scaling up difficulties
53
(Miron, et al. 1999, Grima, et al. 2000, Janssen, et al. 2002). However, if these
difficulties can be overcome these controlled closed systems may allow commercial
mass production of an increased number of microalgal species at a wider number of
locations.
1.3 The production of coccolithophorids and products from coccolithophorids
It is well known that science alone is no guarantee that an algal culture system process
or product will be commercially successful (Sukenik, et al. 1991, Borowitzka 1992,
1997, Jeffrey and Wright 1999). Commercial success requires the close interaction
between science and business (Jeffrey and Wright 1999). Once a potential microalga
has been selected through scientific literature surveys and small scale optimisation, then
a detailed market survey shou
ld be carried out to determine whether there is a market
aled by commercial producers, however,
-1
-1
for the product (Borowitzka 1997). Computer modelling of the economies of the
process is a powerful tool for decision making and because of the high costs involved in
culturing algae (Apt and Behrens 1999), it allows an estimate of whether the process is
economical.
Although large-scale microalgal culture has now been in existence for over 50 years,
our experience is still limited to only a few species and, even for these, the
understanding of their biology and ecology is still very limited. The actual cost of
current algal production is generally not reve
some appreciation of costs can be obtained from various models which have been
published. The total cost for algal biomass produced is between 6.20 Aus$.Kg and 24
Aus$.Kg and normally a lower price can be found in the larger size plants.
54
It should be noted that the very low cost of some models (e.g. in Barclay 1987, and
Valderrama et al. 1987), are from some extremely optimistic models and experience to
date shows them to be unrealistic. One of the most successful algae production plants is
located at Hutt lagoon, Western Australia, culturing D. salina for β-carotene production.
The total cost of the biomass in this company can be calculated to be between 7.5
Aus$.Kg-1 and 13.5 Aus$.Kg-1 assuming a 0.09% is the β-carotene concentration of D.
salina biomass (Borowitzka 1994) and a price for β-carotene of approximately 150
us$.Kg-1.
The cost of conventional fuel (oil) apidly during the last few decades
be a option for the use of coccolithophorids in CO2
removal. The cost effectiveness of such a process and its economical feasibility would
be highly related to value of the carbon credits obtained and government support for
CO
A
has been growing r
and CO2 emission has also become a serious environmental issue. This study focuses
on the use of coccolithophorids as potential microalgae for reducing CO2 and
production of biofuel. As already mentioned coccolithophorids are highly calcified and
have high lipid contents. Coccolithophorid algae may have commercial value as
outlined below:
Immobilisation of CO2 through biomass burial
Burial of the entire wet biomass may
2 removal.
Biofuel
Research on the production of energy from renewable sources, such as hydrocarbon
production by pyrolysis of biomass, has recently received much recent interest
55
(Weissman and Goebel 1987, Sheen, et al. 1998). Most renewable sources used in the
pyrolysis of biomass have been higher plants rather than microalgae, although the later
are the main primary producers in the oceans (Geider, et al. 2001). Whereas the
depletion of fossil fuels such as coal and oil lead to the over-emission of CO ,
renewable biomass does not increase atmospheric CO concentration and such materials
are now being considered as an important energy resources for the future (Sheen, et al.
1998). Ginzburg (1993) explored the possibility of using algae such as Dunaliella
salina for oil production by biomass pyrolysis and producing oil 20% less expensive
than fossil oil. However Ginsburg’s (1993) calculation was based on cells growing with
a growth rate of 8.36 d-1 which is not achievable in any type of outdoor cultivation
system. Wu and colleagues (1999) also achieved high methane production by high
temperature pyrolysis of E. huxleyi. Unfortunately all reports and research conducted
are based on the small scale.
One of the most important factors limiting the growth and improvement of microalgal
biotechnology is that there is little prospect for any alternative designs for microalgae
production systems that would be able to meet the requirements of microalgae
production for fuels (Borowitzka 1992, Kadam 1997, Sheen, et al. 1998). This is
particularly true of closed photobioreactors which cannot compete with open systems
due to high construction and operating costs. The costs of even the simplest closed
photobioreactors would likely be well above what is affordable for the fuel production
process (Borowitzka 1996, Richmond 2000).
2
2
Applying large-scale pond systems for the production of liquid fuel (biofuel) has been
supported by US Department of Energy (DoE) during the last three decades (Weisman
and Noue 1995). The main focus of this project was the production of biodiesel from
high-lipid content algae grown in ponds, utilising waste CO2 from coal fired power
plants. Although this project was unsuccessful (due to local climate) it indicates the
56
importance of further research in this area. Recently, research on the bio-production of
energy from renewable sources has received remarkable interest (Ginzburg 1993).
The high lipid content and the CaCO3 producing ability of coccolithophorids could be a
potential advantage for large-scale cultivation of such algae for liquid fuels. Due to the
fact that conventional fuel resources will finish sooner or later, there is a bright future
for a biofuel production especially using high lipid content microalgae.
idly, so there is
Biomass cofiring
The direct co-firing of algal biomass (i.e. coccolithophorids) with a high lipid and
hydrocarbon content with coal has been investigated in many studies (Aresta, et al.
1997, Kadam 1997). The main advantage of algal co-firing is to reduce the process
costs by increasing efficiency of the process. Therefore, in countries such as Australia,
where coal plays an important role for power production, co-firing coal together with
microalgae with high lipid content can increase the efficiency. A possible
coccolithophorid plant located close to a coal power plant can not only minimise the
cost but also can reduce the CO2 emission by direct use of flue gas. The economies of
such a system will remain unknown.
The application of cell lipids and coccolithophorid algae as pharmaceutical or
nutraceuticals
The world population is over 7 x 10⁹ and it is expected to increase rap
need for more nutrients (e.g. protein, vitamin, lipid, etc) than can be provided by
conventional means. Photosynthetic aquatic biomass is one of the few resources
awaiting general exploitation (Fox 1987). For example, Spirulina by virtue of its high
57
available protein and vitamin content (Clement, et al. 1967) is considered a favoured
potential source of non-conventional food resources (Fox 1987).
Over the last few decades, there has been a large increase in research into alternative
ources of fats and oils, particularly the potential commercial production of microbial
lipids and fatty acids (Princen and Rothfus 1984, Rattray 1984, Yongmanitchai and
Ward 1991). The bulk of fats and oils for human consumption and industrial uses are
reater
than 25% of their biomass as oil or fat, have known to exist for some time (Grima, et al.
icroorganisms, capable of commercial application in lipid production
are microalgae, yeasts and f (H 1986, Turcotte and Kosaric
ated fatty acids (PUFA),
eicosapentaenoic acid 20:5 (n-3) [EPA], docosahexaenoic acid 22:6 (n-3) [DHA],
rdiovascular
disease in humans (Knapp 1989). Gamma-linoleic acid and arachidonic acid have
s
presently derived from plant sources, and there are still requirements for improved
quality and yield, as well as novel products with specialised chemical composition
(Grima, et al. 1999). The main commercial sources of industrial oils and fatty acid
content are coconut, oil palm and tallow (saturated fatty acids), olive and canola (mono
unsaturated), soybean, castor, linseed and sunflower oil (poly-unsaturated) (Princen and
Rothfus 1984).
Oleaginous microorganisms, which may be defined as those which accumulate g
1999). The best m
ungi annson and Dostalek
1989, Radwan 1991). High value lipid products for the medical and pharmaceutical
industry are also one of the potential commercial areas of mass algal production
(Rattray 1984). Currently, the interest in microbial lipids has shifted to polyunsaturated
fatty acids, particularly the (n-3) and (n-6) polyunsatur
gamma-linoleic acid 18:3 (3) [GLA], and arachidonic acid 20:4 (n-6) [AA], because of
the important role that polyunsaturated fatty acids play in human nutrition and health
(Nevenzel 1989). PUFAs, naturally occurring in marine food chains, are implicated as
key therapeutic agents in reducing the incidence of arthrosclerosis and ca
58

strong EPA activity and are being studied for their beneficial treatment of pre-menstrual
syndrome, atopic eczema, rheumatoid arthritis, multiple sclerosis and diabetes (Knapp
1989). Human populations whose diets are rich in marine oils derived from fish have
been shown to have reduced levels of serum triacylglycerides and high HDL to LDL
ratios, correlating with a low incidence of cardiovascular disease (Nevenzel 1989).
Microbial product
traditional sources fro
Studies of some c
60% of total bioma
Riebesell, et al. 2000a et al. 2001).
), and (2) A
group, compromising the Coccolithaceae and Pleurochrysidaceae, with low 14:0/16:0
that main
hydrocarbons of E. huxleyi are straight-chain polyenes (31:2 and 37:3).
Moreover, the coccolithophorid alga Pleurochrysis carterae has been classified to be
safe as a supplement in human food in Japan (Takenaka, et al. 1996a). The lyophilized,
calcium-rich P. carterae, cells have already been used for human health food as a
ions of these PUFAs have the potential for a larger market beyond
m fish oil capsules (Kyle, et al. 1990).
occolithophorids have indicated a high lipid content of up to 40% -
ss (Fernandez, et al. 1994, Murphy and Messersmith 2000,
, Corstjens, et al. 2001, Liu and Lin 2001, Rontani,
Conte and colleagues (1994) divided coccolithophorid algae into two groups based on
their fatty acid variations: (1) A group with high 14:0/16:0 and 16:0/16:1 ratios, very
high 18:4ω3, 18:5ω3, and 22:6ω3 concentrations ( e.g. Emiliania huxleyi
and high 16:0/16:0 and high 18:4ω3 concentrations. Haptophyte algae generally have
quite simple sterol profiles, with a single sterol often compromising more than 75% of
the total (Conte, et al. 1994). Ghosh et al. (1996) found high concentrations of the
valuable sterol 24-methylcholesta-5,22-dienol which is used for bivalve food in
Pleurochrysis carterae. Among the neutral lipids of coccolithophorid algae, long chain
alkenones and alkenoates have also attracted considerable attention since they occur
widely in marine lacustrine sediments where they are used as biological markers for
inputs of Haptophyte algae (Marlowe, et al. 1984). Nevenzel (1989) reported
59
calcium supplement in Japan for several years (Takenaka, et al. 1996b). Miyamoto et
al. (2001) have also fo (0.0013% of dry cell
weight) of vitamin B12 in lyophilized P. carterae cells.
Algal calcium carbonate, including coccoliths has become of interest for possible use in
bone in humans (Stupp and Braun 1997), (2) complement activation enhancement
tion (Piatelli, et al. 1997),
) scaffolding supports in tissue engineering (Laguna, et al. 2001), and (5) biomedical
implants (Walsh and Mann 1995). They have also been targeted by material scientists
having potential significance as lightweight ceramics, catalyst support, and robust
membra igh tem epar nology (Walsh and Mann 1995).
f thi
T ny reports and reviews on sm fferent
c the la ca ments have
been conducted to show the different phys f the growth of
coccolithophorids (Paasche 2002).
ork on the use of microalgae for CO2 fixation has focused on (1) developing more
und a considerably high concentration
Applications of calcium carbonate
various applications of biomedical science including: (1) the construction of artificial
(Rames and Williams 1991), (3) artificial dental root construc
(4
nes for h perature s ation tech
1.4 Aims o s project
here have been ma all-scale culturing di
occolithophorid algae during st few de des. Most of these experi
iological aspects o
W
effective and cheaper large-scale culture systems, and (2) finding algal strains with high
productivities. The high lipid content and calcium carbonate deposition of
coccolithophorids makes them an attractive group for CO2 bioremediation.
60

The aims of current study are as follows:
large-scale cultivation system and examine long term, high
productivity of these algae,
(a) Develop and optimise the growth of coccolithophorid algae in a
(b) To maximise the sustainable rate of CO2 fixation into organic and
inorganic (CaCO3) by coccolithophorids, and
(c) To use the data to examine the feasibility of using these algae in
green sequestrati a combination of carbon
and energy balance models and an economic model.
is project was no investigate the physiology of coccolithophorids,
some aspects of photosynthesis and calcifi eeded to be ed in
rder to understand an ove the culture of th se algae.
nt study after the Materials and Methods (Chapter 2), all objec long
l culture of cocc phorids are investigated, firstly by isolation of the
number of the most suitable species of coccolithophorids (Chapter 3), followed by
ining different types of closed and open cultivation systems (Chapter 4 and 5
). The limits to growth of selected species in different cultiv tems
are also studied in Chapter 6 followed by economic modelling of the potential large-
ation system (Chapt . Finally, the resu s are discussed in Chapter 8
h the future possibl ions in regard to th current research.
hou on se/carb on using
The aim of th t to
however cation n examin
detail in o d impr e
In the curre tives for
term successfu olitho
exam
respectively ation sys
scale cultiv er 7) lt
together wit e direct e
61
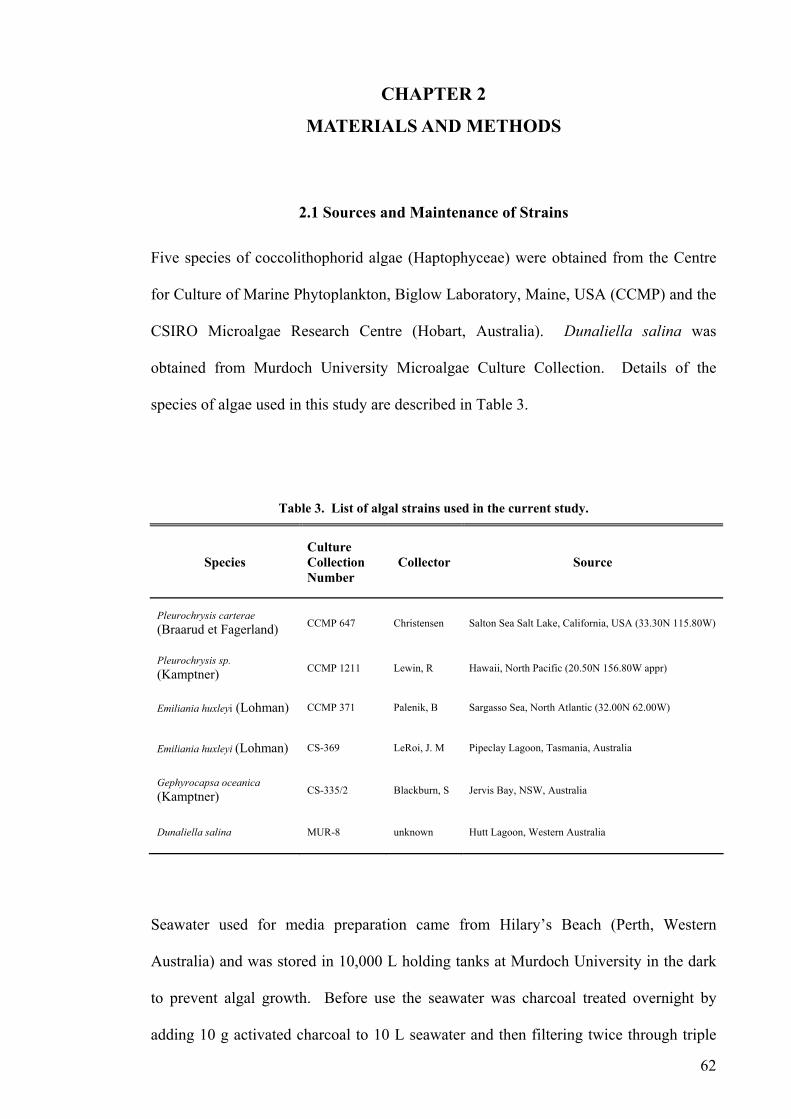
CHAPTER 2
MATERIALS AND METHODS
Five species of coccolithophorid algae (Haptophyceae) were obtained from the Centre
for Culture of Marine Phytoplankton, Biglow Laboratory, Main
2.1 Sources and Maintenance of Strains
e, USA (CCMP) and the
CSIRO Microalgae Research Centre (Hobart, Australia). Dunaliella salina was
tudy.
Species Number
ource
obtained from Murdoch University Microalgae Culture Collection. Details of the
species of algae used in this study are described in Table 3.
Table 3. List of algal strains used in the current s
Culture Collection Collector S
Pleurochrysis carter(Braarud et Fage CCMP 647 Christensen Salton Sea Salt Lake, California, USA ( 15.80W)
ae rland) 33.30N 1
Pleurochrysis sp. (Kamptner)
CCMP 1211 Lewin, R Hawaii, North Pacific (20.50N 156.80W
Emiliania huxley P 371 Palenik, B Sar North Atlantic (32.00N 62.00W)
Emiliania huxleyi (L CS-369 LeRoi, J. M Lagoon, Tasmania, Australia
Gephyrocapsa ocean(Kamptner)
CS-335/2 Blackburn, S Jervis Bay, NSW, Australia
Dunaliella salina MUR-8 unknown H Western Australia
appr)
i (Lohman) CCM gasso Sea,
ohman) Pipeclay
ica
utt Lagoon,
Seawater used for media preparation came from Hilary’s Beach (Perth, Western
Australia) and was stored in 10,000 L holding tanks at Murdoch University in the dark
to prevent algal growth. Before use the seawater was charcoal treated o ht by
adding 10 g activated charcoal to 10 L seawater and then filtering twice through triple
vernig
62
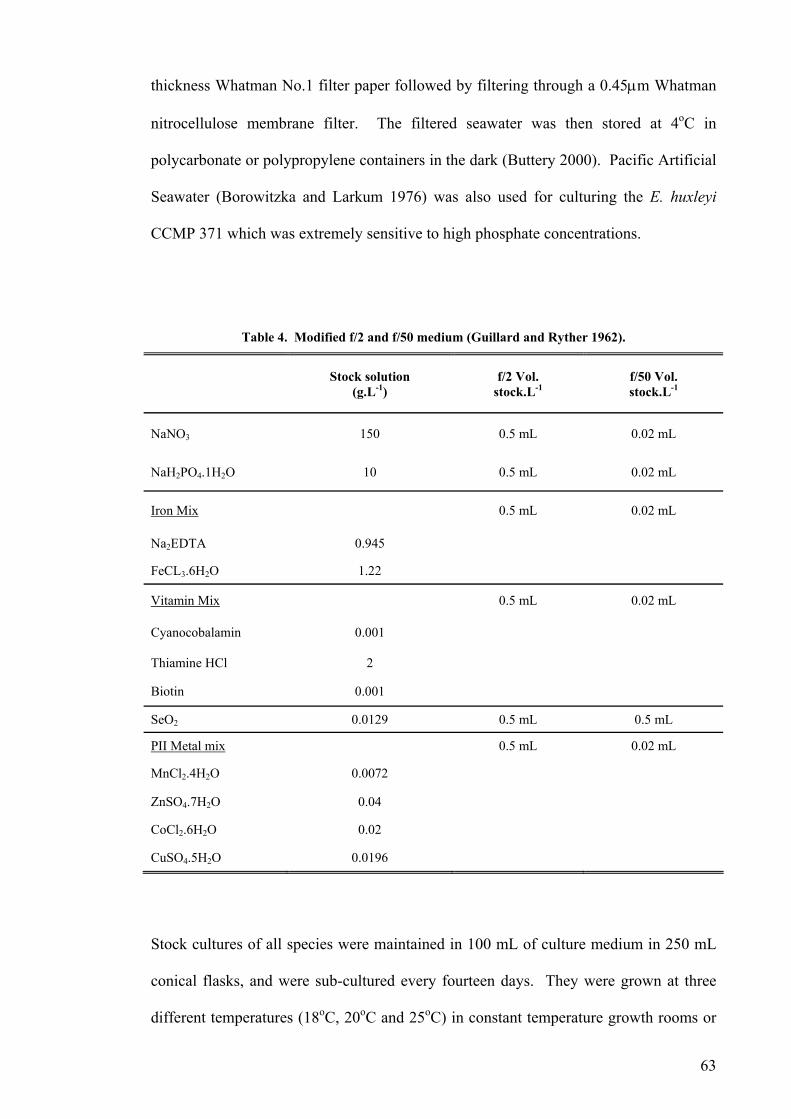
thickness Whatman No.1 filter paper followed by filtering through a 0.45µm Whatman
nitrocellulose membrane filter. The filtered seawater was then stored at 4oC in
polycarbonate or polypropylene containers in the dark (Buttery 2000). Pacific Artificial
Seawater (Borowitzka and Larkum 1976) was also used for culturing the E. huxleyi
CCMP 371 which was extremely sensitive to high phosphate concentrations.
Modified f/2 and f/ Ryther 1
Stock solution (g.L-1)
f/2 Vol. stock.L-1
ol. stock.L-1
Table 4. 50 medium (Guillard and 962).
f/50 V
NaNO3 150 0.5 mL 0.02 mL
NaH2PO4.1H 10 0.5 mL L
Iron Mix
2O 0.02 m
0.5 mL L 0.02 m
Na2EDTA 0.945
FeCL3.6H2O 1.22
Vitamin Mix
0.5 mL L 0.02 m
Cyanocobala 001
Thiamine H 2
Biotin 0.001
SeO2 0.0129 0.5 mL 0. mL
min 0.
Cl
5
PII Metal mix 0.5 mL 0. mL 02
MnCl2.4H2 0072
ZnSO4.7H2O 0.04
CoCl2.6H2O 0.02
CuSO4.5H2 0.0196
O 0.
O
Stock cultures of all species were maintained in 100 mL of culture medium in 250 mL
conical flasks, and were sub-cultured every fourteen days. They were grown at three
different temperatures (18oC, 20oC and 25oC) in constant temperature growth rooms or
63
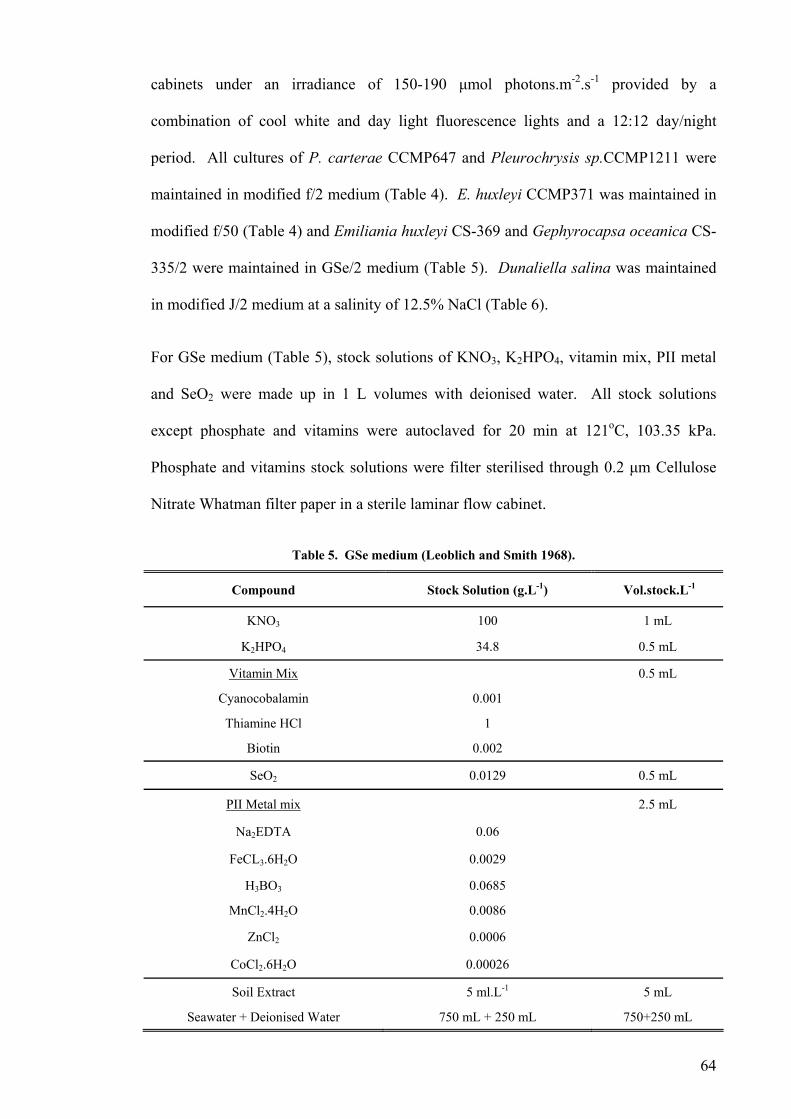
cabinets under an irradiance of 150-190 µmol photons.m-2.s-1 provided by a
combination of cool white and day light fluorescence lights and a 12:12 day/night
period. All cultures of P. carterae CCMP647 and Pleurochrysis sp.CCMP1211 were
maintained in modified f/2 medium (Table 4). E. huxleyi CCMP371 was maintained in
modified f/50 (Table 4) and Emiliania huxleyi CS-369 and Gephyrocapsa oceanica CS-
335/2 were maintained in GSe/2 medium (Table 5). Dunaliella salina was maintained
in modified J/2 medium at a salinity of 12.5% NaCl (Table 6).
For GSe medium (Table 5), stock solutions of KNO3, K2HPO4, vitamin mix, PII metal
nd SeO2 were made up in 1 L volumes with deionised water. All stock solutions
except phosphate and vitamins were autoclaved for 20 min at 121oC, 103.35 kPa.
Phosphate and vitamins stock solutions were filter sterilised through 0.2 µm Cellulose
-1 -1
a
Nitrate Whatman filter paper in a sterile laminar flow cabinet.
Table 5. GSe medium (Leoblich and Smith 1968).
Compound Stock Solution (g.L ) Vol.stock.L
KNO3 100 1 mL
K2HPO4 34.8 0.5 mL
Vitamin Mix 0.5 mL
Cyanocobalamin 0.001
Thiamine HCl 1
Biotin
SeO2 29 0.5 mL
0.002
0.01
PII Metal mix 2.5 mL
Na2EDTA 0.06
FeCL3.6H2O 0.0029
MnCl
H3BO3 0.0685
0.0006
CoCl2.6H2O 0.00026
Soil Extract l.L-1 5 mL
2.4H2O 0.0086
ZnCl2
5 m
Seawater + Deionised Water 750 mL + 250 mL 750+250 mL
64
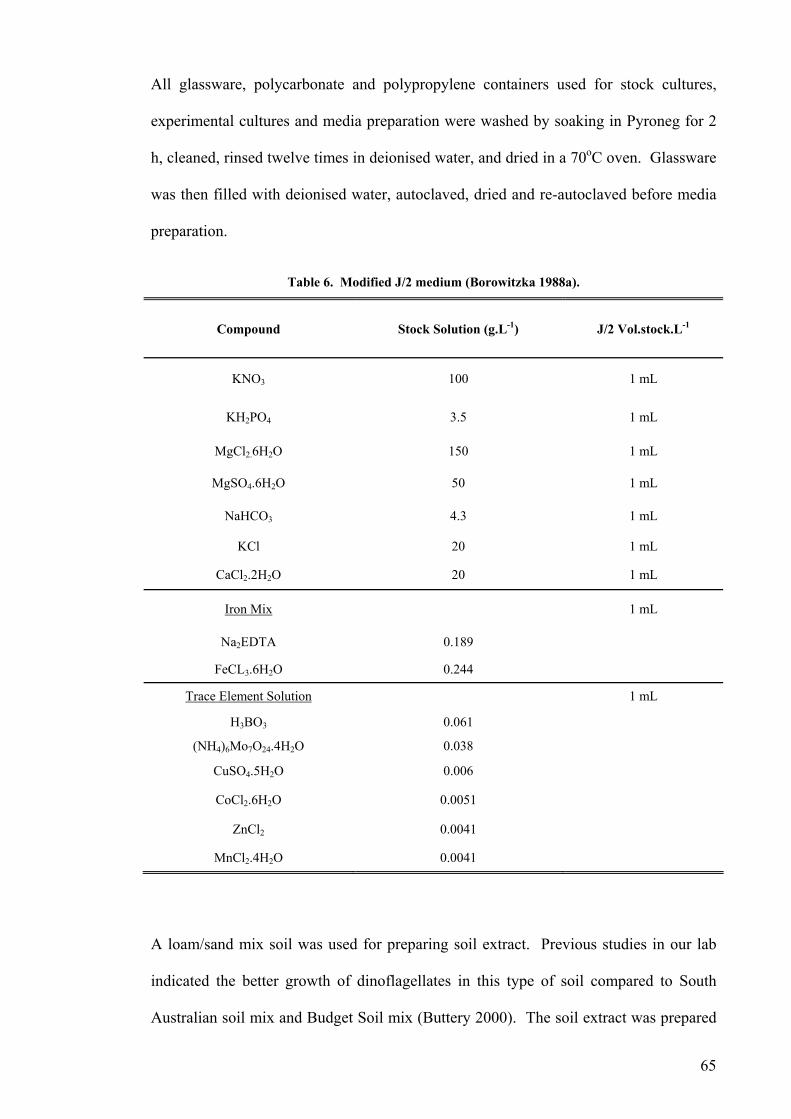
All glassware, polycarbonate and polypropylene containers used for stock cultures,
experimental cultures and media preparation were washed by soaking in Pyroneg for 2
h, cleaned, rinsed twelve times in deionised water, and dried in a 70oC oven. Glassware
was then filled with deionised water, autoclaved, dried and re-autoclaved before media
preparation.
Table 6. Modified J/2 medium (Borowitzka 1988a).
Compound Stock Solution (g.L-1) J/2 Vol.stock.L-1
KNO3 100 1 mL
KH2PO4 1 mL
2 0 1 mL
Mg 2O 50 1 mL
NaHCO3 4.3 1 mL
l 20 1 mL
Ca H2O 20 1 mL
Ir ix
3.5
M O 15gCl2.6H
SO4.6H
KC
Cl2.2
on M 1 mL
Na2 189
FeCL3.6H2O 0.244
Trace Element Solution
EDTA 0.
1 mL
H BO 0.061
(NH
3 3
CoCl2.6H2O 0.0051
4)6Mo7O24.4H2O 0.038
CuSO4.5H2O 0.006
ZnCl2 0.0041
MnCl2.4H2O 0.0041
A loam/sand mix soil was used for preparing soil extract. Previous studies in our lab
indicated the better growth of dinoflagellates in this type of soil compared to South
Australian soil mix and Budget Soil 00). The soil extract was prepared mix (Buttery 20
65
using the method of Fabregas et al. (1987) by sifting dry soil (not recently treated with
fertilizer) once through a coarse sieve (1.00 mm) and twice through a 500µm sieve.
One kilogram of the soil was then mixed into 2 L of deionized water. The mixture was
filtered through triple thickness Whatman No.1 filter paper, autoclaved for 20 min at
121oC, 103.35 kPa, and cooled overnight. It was then centrifuged at 1008 g for 5 min in
the 50 mL polyethylene tubes at room temperature. The supernatant was poured into
100 mL Schott reagent bottles, and autoclaved for 20 min at 121oC, 103.35 kPa. Once
the bottles were cool, they were sealed with Parafilm and stored at 4oC.
ixture for 50 to 60 min it was then left to sit over night. The reactors
ere then completely drained and flushed 10-12 times with tap water.
Cell densities were determined by use of a Neubauer haemocytometer. The specific
growth rates of the cultures were determined by calculating the doubling time in
exponential growth from semi-log cell density plots. The specific growth rate (µ) was
determined using Equation 3:
2.2 Chemical Sterilization
Prior to each experiment, all cultivation systems except the small scale bubble column
reactors, aerated flasks and carboy photobioreactors (see page 72 and 74) were
chemically sterilized by filling with 5 to 6% (v/v) sodium hypochlorite. After
circulating this m
w
2.3 Analytical Methods
2.3.1 Growth
µ =2t
Eq. 3 0 693.
66
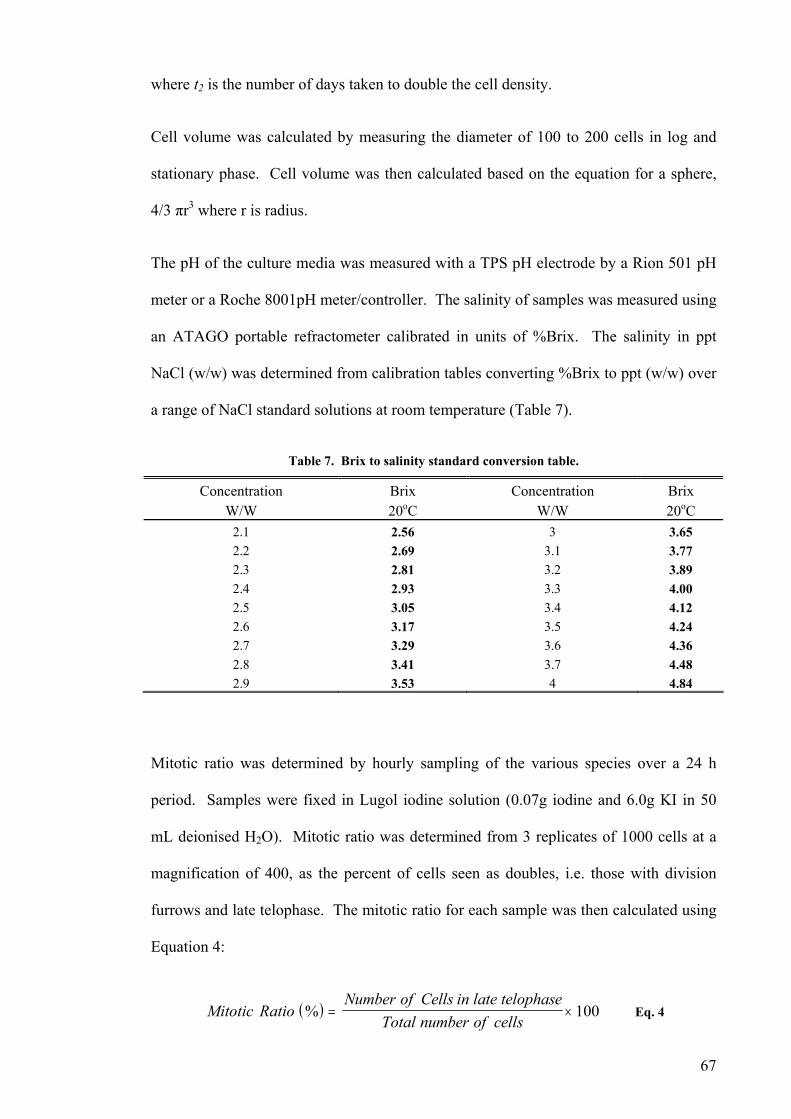
where t2 is the number of days taken to double the cell density.
3
The pH of th
Cell volume was calculated by measuring the diameter of 100 to 200 cells in log and
stationary phase. Cell volume was then calculated based on the equation for a sphere,
4/3 πr where r is radius.
e culture media was measured with a TPS pH electrode by a Rion 501 pH
meter or a Roche 8001pH meter/controller. The salinity of samples was measured using
an ATAGO portable refractometer calibrated in units of %Brix. The salinity in ppt
NaCl (w/w) was determined from calibration tables converting %Brix to ppt (w/w) over
a range of NaCl standard s 7). olutions at room temperature (Table
Table 7. Brix to salinity standard conversion table.
Concentration Brix Concentration Brix W/W 20 C W/W 20 C
2.1 2.56 3 3.65
o o
2.2 2.69 3.1 3.77 2.3 2.81 3.2 3.89 2.4 2.93 3.3 4.00 2.5 3.05 3.4 4.12 2.6 3.17 3.5 4.24 2.7 3.29 3.6 4.36 2.8 3.41 3.7 4.48 2.9 3.53 4 4.84
Mitotic ratio was determined by hourly sampling of the various species over a 24 h
eriod. Samples were fixed in Lugol iodine solution (0.07g iodine and 6.0g KI in 50
mL deionised H2O). Mitotic ratio was determined from 3 replicates of 1000 cells at a
magnification of 400, as the percent of cells seen as doubles, i.e. those with division
rrows and late telophase. The mitotic ratio for each sample was then calculated using
Equation 4:
p
fu
( )Mitotic RatioNumber of Cells in late telophase
Total number of cells% = × 100 Eq. 4
67
2.3.2 Biomass
The total biomass, as total dry weight, was determined as follows:
Whatman GF/C (2.5cm) filters were washed in deionised water and dried in a 70 C
oven for 24 h and stored in a vacuum desiccator over silica gel until needed. The filters
were then weighed to 4 decimal places on an analytical balance. 10 mL of algal culture
was filtered until the filters were dry using a Millipore filtration apparatus. The filter
was then washed with 10 mL of 0.65 M ammonium formate solution to remove excess
salts and dried at 90 C for 4 h and placed in a vacuum desiccator overnight. Filters
were then weighed to four decimal places. Dry weight was calculated as g.L after
subtracting the filter weight from filter + total weight of sample.
For ash free dry weight determ
o
o
-1
ination the above filters were ashed at 450oC for 7 h and
-1
2.3.3 Coccolith density and calcium carbonate deposition
Total coccolith numbers w od of Paasche (1999) by
ken at 25oC over
night in order to complete cell lysis. The total number of coccoliths in the extract was
then cooled overnight in a vacuum desiccator before reweighing. The ash-free dry
weight was calculated as mg.L after subtracting the weight of the filter from the total
weight. This was then further subtracted from the total algal dry weight to give the ash
free dry weight.
ere determined according to the meth
filtering 5 mL of culture suspension through a 25 mm 1 µm pore Whatman
polycarbonate filter. The filter was then transferred to a 40 mL test tubes and 15 mL
5% (v/v) Triton X100-NaOCl added. The sealed test tubes were sha
then counted using a Neubauer haemocytometer.
68
The total weight of the coccoliths (i.e. CaCO3) was also determined using these
coccolith-Triton X100 extracts. The extracts were stirred carefully, divided into two
equal portions and filtered through pre-weighed 25 mm GF/F filter papers. For
measuring the weight of remaining non-CaCO3 particles one of the GF/F filters was
then washed with 10 mL 0.1 M HCl followed by 15 mL deionised water in order to
dissolve the CaCO3. The filters were then dried for 3 h at 75oC and stored over KOH in
a dessicator over-night. The weight of calcium carbonate was then calculated using
Equation 5:
( ) ( ) ( )( )
CaCO g mLCo filter
31 2. − = × Eq. 5
Chlorophyll a concentration was determined using the 100% acetone extraction method
f Jeffery and Humphrey (1975). Depending upon the cell density, 10 to 20 mL of
e filters were then stored at
-80oC in the dark until extraction. For chlorophyll extraction the filters were
homogenized in a ceramic or glass mortar and pestle in 4 mL of 100% ice cold acetone
in low light. The chlorophyll extracts were then transferred to15 mL centrifuged tubes
and 6 mL acetone was added. After centrifugation at 1008 g for 10 min at 4 C, the
absorbance of the supernatant was measured at 663 nm and 630 nm. Chlorophyll a was
then calculated using Equation 6:
ccoliths filter Acid Washed+ −Volume sample mL5
2.3.4 Chlorophyll a determination
o
culture was filtered onto GF/C (2.5 cm diameter) filters. Th
o
( ) ( )Chla g mL E E Volume ExtractedVolume Filtered663 630
µ . . .− = − ×1 1147 0 4 Eq. 6
69
2.3.5 Total Lipid determination
Total lipid was determined using the method of Kates and Volcani (1966) as adapted by
Mercz (Mercz 1994). 10 mL of algal culture was filtered using Whatman 2.5 cm GF/C
mL glass
hing. Total lipid content was then
calculated as g.L-1 or g.L-1.d-1.
2.3.6 Photosynthetic Measurements
filters, rinsed with isotonic 0.65 M ammonium formate solution and stored at -80oC for
later lipid extraction. Before extraction the filters were thawed at room temperature,
then homogenized in a glass mortar with 5 mL of methanol:chloroform:deionised water
(2:1:0.8 v:v:v). The extracts were then transferred to 10 mL glass stoppered centrifuged
tubes and centrifuged at 1008 g for 10 min at room temperature. The supernatant was
then carefully transferred to glass stoppered graduated glass centrifuge tubes. The
extract was made up to 5.7 mL with fresh methanol:chloroform:deionised water, and 1.5
mL of chloroform was added, followed by 1.5 mL of deionised water and stirred. After
partial phase separation had occurred the samples were centrifuged for 5 min at 1008 g
to complete phase separation.
The green chloroform bottom layer was transferred to a dry, pre-weighed 4
vial and a few drops of toluene added to remove any aqueous phase unintentionally
transferred, and the extract was dried with N2. The vials were stored over KOH pellets
overnight in a vacuum desiccator before weig
In the outdoor cultures a field Yeo-Kal oxygen electrode (Active type Pb and Ag
electrode with pressure compensating diaphragm, PVC body) was used. The electrode
was calibrated twice a week using zero O2 and air saturated seawater.
70
For the laboratory studies a Rank Brothers (UK) polarographic Clark-type oxygen
electrode was used. A controlled temperature water bath maintained a constant
temperature in the glass electrode chamber jacket. Light was supplied to the chamber
by a Hanimex 150 slide projector fitted with 150 W, Syl-167 quartz halogen bulb. The
electrode was calibrated at each temperature to zero O2 and air saturated seawater. The
irradiance (P.A.R) was measured at the surface of the chamber with Li-Cor model light
meter.
2.4 Photobioreactors
2.4.1 Closed photobioreactors
rowth of all coccolithophorid species were studied in small scale bubble column
Small s
In order to determine the optimum temperature and salinity range for the various
the algae were cultured in 300 mL small-scale bubble column
G
reactors and aerated flasks while concentric draught-tube internal loop airlift reactors,
carboys, a plate and a tubular photobioreactor were investigated for growth of P.
carterae CCMP647, E. huxleyi CCMP371, and G. oceanica CSIRO352/2.
cale bubble column reactor and aerated flasks
coccolithophorid species,
reactors with initial cell concentrations of 1 x 10⁵ ± 3 x 10⁴ cells.mL-1, 170 mL culture
volume, and 5 replicates under batch culture conditions. These were maintained at
various temperature (18, 23 and 28oC) and salinities (23.7 to 33.1 ppt) in a constant
temperature growth cabinet fitted with a combination of cool white and day light
fluorescence tubes providing an irradiance of 120 µmol photons.m-2.s-1 for the first 2
days followed by 300 µmol photons.m-2.s-1 thereafter with a 12:12 light/dark cycle.
71
Humified air was used during the experiments with a flow rate of 1-2 bubble.s-1 during
the first two days and then gradually increased to 10 bubble.s-1 by the fifth day of the
experiment. Culture salinity, pH, and temperature were measured once daily. Salinity
of culture media was adjusted daily by adding sterilised deionised water to the culture
media.
For the nutrient limitation experiments, the algae were cultured in 500 mL culture
medium in 1L conical flasks as batch cultures. Cultivation continued until the cultures
reached stationary phase. The cells were harvested by centrifugation at 400 to 550 g for
10 to 15 min. The supernatant was then filtered through 2 µm Whatman nitrocellulose
filter paper in a laminar flow hood using a sterile 500 mL filter setup. The harvested
cells were then cultured in both filtered residual (i.e. the medium in which the cells had
been grown in before) and fresh culture media in a 250 mL conical flask with a culture
volume of 100 mL. The cultures were aerated and mixed by a single air inlet in the
bottom centre of the flasks. The flasks were also m
The irradiance was 300 µmol photons.m .s provided by cool white fluorescent tubes
from the side and the temperature was 25±1 C with a 12:12 light/dark cycle.
Reactors were sterilized by autoclaving at 121oC/15 p.s.i. for 15 min. Inoculation and
ied out in a laminar flow hood, sterilised by ultra-violet
Concentric draught-tube internal loop (CDT ) airlift photobioreactor
made from glass with 85 cm length and 7 cm inner diameter. The reactors were fitted
anually mixed three times a day.
-2 -1
o
medium transfer were carr
radiation, and surface cleaned with 70% ethanol.
il
Growth of coccolithophorids was investigated using 3 L concentric draught-tube
internal loop airlift photobioreactors as shown in Figure 15. The internal loop was
72
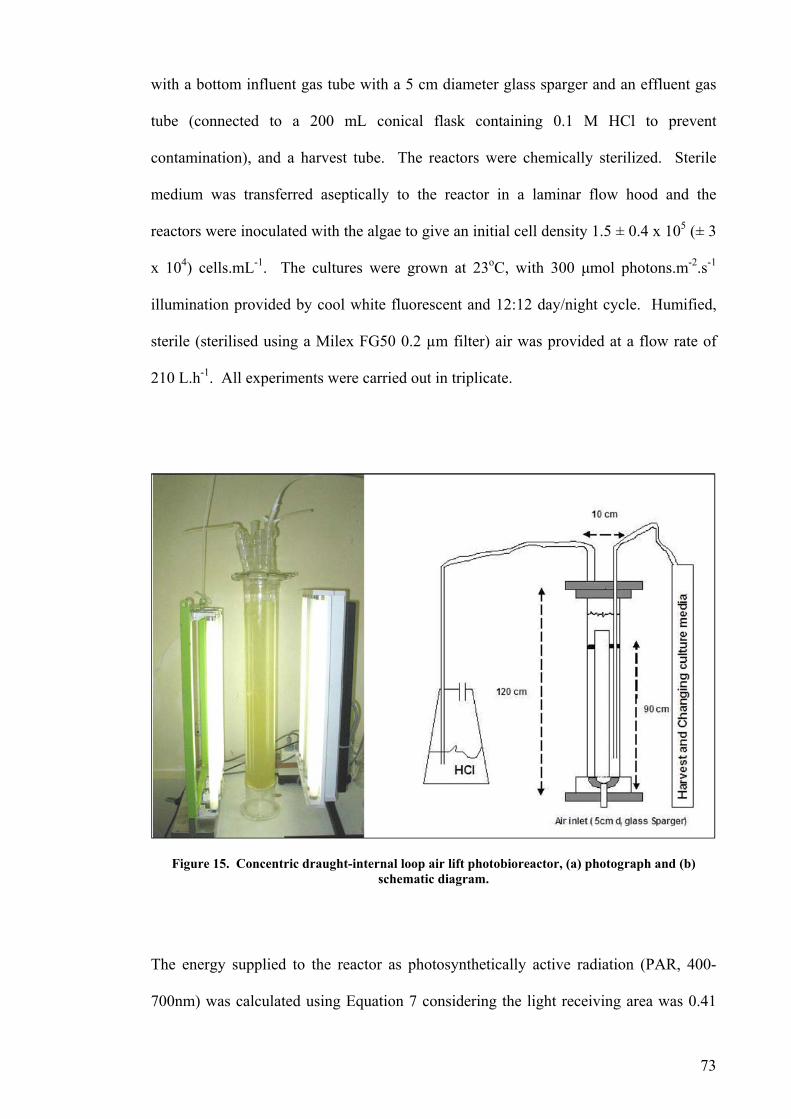
with a bottom influent gas tube with a 5 cm diameter glass sparger and an effluent gas
tub nt
ontamination), and a harvest tube. The reactors were chemically sterilized. Sterile
medium was transferred aseptically to the reactor in a laminar flow hood and the
e (connected to a 200 mL conical flask containing 0.1 M HCl to preve
c
reactors were inoculated with the algae to give an initial cell density 1.5 ± 0.4 x 10⁵ (± 3
x 104) cells.mL-1. The cultures were grown at 23oC, with 300 µmol photons.m-2.s-1
illumination provided by cool white fluorescent and 12:12 day/night cycle. Humified,
sterile (sterilised using a Milex FG50 0.2 µm filter) air was provided at a flow rate of
210 L.h-1. All experiments were carried out in triplicate.
Figure 15. Concentric draught-internal loop air lift photobioreactor, (a) photograph and (b)
The energy supplied to the reactor as photosynthetically active radiation (PAR, 400-
700nm) was calculated using Equation 7 considering the light receiving area was 0.41
schematic diagram.
73
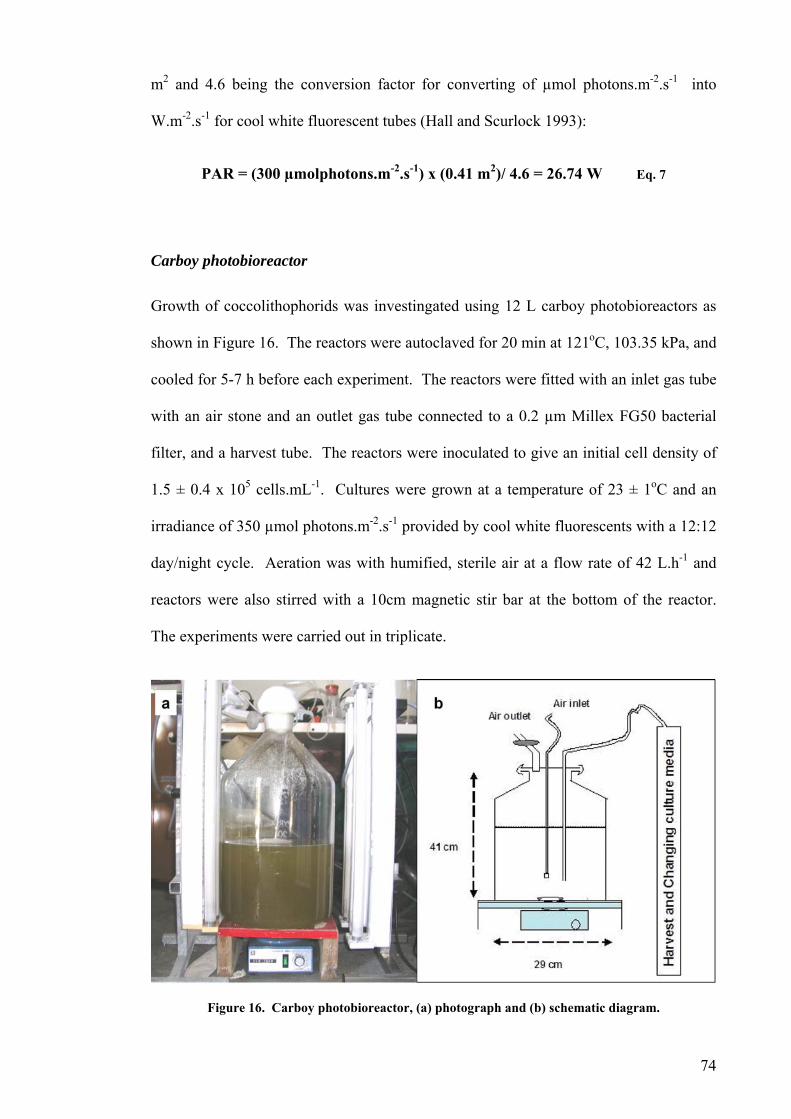
m2 and 4.6 being the conversion factor for converting of µmol photons.m-2.s-1 into
W.m-2.s-1 for cool white fluorescent tubes (Hall and Scurlock 1993):
ors were fitted with an inlet gas tube
5 -1 o
-2
of 42 L.h-1 and
reactors were also stirred with a 10cm magnetic stir bar at the bottom of the reactor.
The experiments were carried out in triplicate.
PAR = (300 µmolphotons.m-2.s-1) x (0.41 m2)/ 4.6 = 26.74 W Eq. 7
Carboy photobioreactor
Growth of coccolithophorids was investingated using 12 L carboy photobioreactors as
shown in Figure 16. The reactors were autoclaved for 20 min at 121oC, 103.35 kPa, and
cooled for 5-7 h before each experiment. The react
with an air stone and an outlet gas tube connected to a 0.2 µm Millex FG50 bacterial
filter, and a harvest tube. The reactors were inoculated to give an initial cell density of
1.5 ± 0.4 x 10 cells.mL . Cultures were grown at a temperature of 23 ± 1 C and an
irradiance of 350 µmol photons.m .s-1 provided by cool white fluorescents with a 12:12
day/night cycle. Aeration was with humified, sterile air at a flow rate
Figure 16. Carboy photobioreactor, (a) photograph and (b) schematic diagram.
74

For the calculation of the total energy received by the carboy photobioreactor a light
0.31 mreceiving area of
17. The base of the reactor was
designed as a V-shape to help maintain the relatively heavy coccolithophorid cells in
suspension. The total culture volume was 6 L. The reactors were chemically sterilized.
The cultures were gro rovided with a 12:12
2 was used (see Equation 7).
Plate type photobioreactor
The effect of pH on growth and calcification of coccolithophorids was investigated in
plate photobioreactors constructed as shown in Figure
wn in semicontinuous mode. Light was p
day/night cycle by 12 cool white fluorescent tubes arranged at both sides of the reactor
Figure 17. Plate photobioreactor, (a) side view photograph, (b) top view photograph and (c) schematic diagram.
75
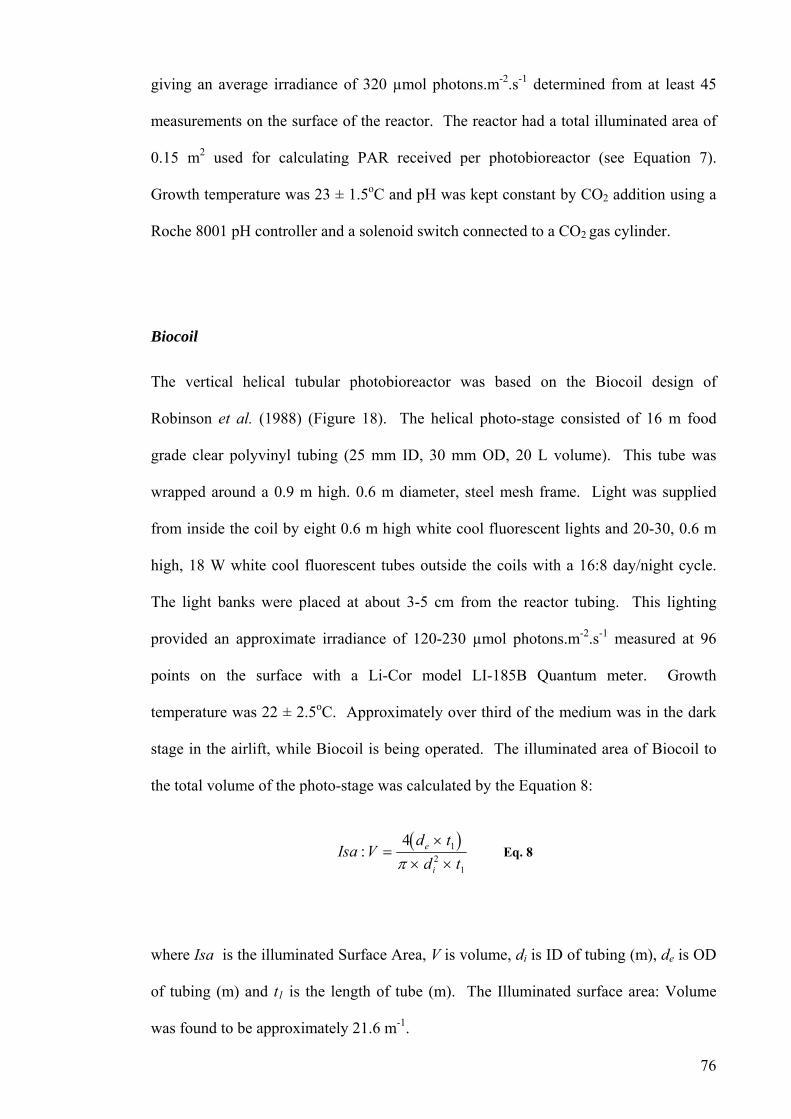
giving an average irradiance of 320 µmol photons.m-2.s-1 determined from at least 45
measurements on the surface of the reactor. The reactor had a total illuminated area of
0.15 m2 used for calculating PAR received per photobioreactor (see Equation 7).
Growth temperature was 23 ± 1.5oC and pH was kept constant by CO addition using a
Roche 8001 pH controller and a solenoid switch connected to a CO2 gas cylinder.
ed at 96
points rowth
mperature was 22 ± 2.5oC. Approximately over third of the medium was in the dark
stage in the airlift, while Biocoil is being operated. The illuminated area of Biocoil to
the total volume of the photo-stage was calculated by the Equation 8:
2
Biocoil
The vertical helical tubular photobioreactor was based on the Biocoil design of
Robinson et al. (1988) (Figure 18). The helical photo-stage consisted of 16 m food
grade clear polyvinyl tubing (25 mm ID, 30 mm OD, 20 L volume). This tube was
wrapped around a 0.9 m high. 0.6 m diameter, steel mesh frame. Light was supplied
from inside the coil by eight 0.6 m high white cool fluorescent lights and 20-30, 0.6 m
high, 18 W white cool fluorescent tubes outside the coils with a 16:8 day/night cycle.
The light banks were placed at about 3-5 cm from the reactor tubing. This lighting
provided an approximate irradiance of 120-230 µmol photons.m-2.s-1 measur
on the surface with a Li-Cor model LI-185B Quantum meter. G
te
( )Isa Vd td te
i
: =×
× ×4 1
21π
Eq. 8
where Isa is the illuminated Surface Area, V is volume, di is ID of tubing (m), de is OD
of tubing (m) and t1 is the length of tube (m). The Illuminated surface area: Volume
was found to be approximately 21.6 m . -1
76
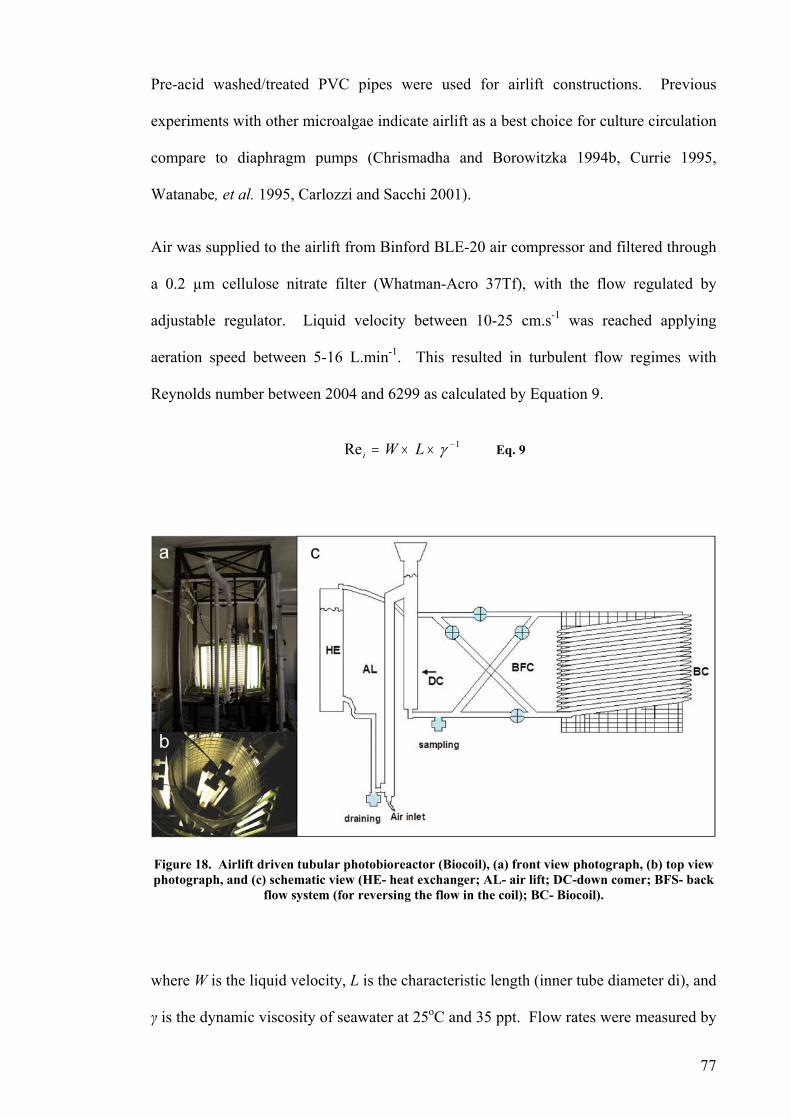
Pre-acid washed/treated PVC pipes were used for airlift constructions. Previous
experiments with other microalgae indicate airlift as a best choice for culture circulation
compare to diaphragm pumps (Chrismadha and Borowitzka 1994b, Currie 1995,
Watanabe, et al. 1995, Carlozzi and Sacchi 2001).
Air was supplied to the airlift from Binford BLE-20 air compressor and filtered through
a 0.2 µm cellulose nitrate filter (Whatman-Acro 37Tf), with the flow regulated by
adjustable regulator. Liquid velocity between 10-25 cm.s-1 was reached applying
aeration speed between 5-16 L.min-1. This resulted in turbulent flow regimes with
Reynolds number between 2004 and 6299 as calculated by Equation 9.
Eq. 9
Rei W L= × × −γ 1
Figure 18. Airlift driven tubular photobioreactor (Biocoil), (a) front view photograph, (b) top view photograph, and (c) schematic view (HE- heat exchanger; AL- air lift; DC-down comer; BFS- back
flow system (for reversing the flow in the coil); BC- Biocoil).
where W is the liquid velocity, L is the characteristic length (inner tube diameter di), and
γ is the dynamic viscosity of seawater at 25oC and 35 ppt. Flow rates were measured by
77
timing the movement of floating p fined distance per unit in the coil.
The in
2.4.2 Paddle wheel driven raceway pond
Perth is located in Western Australia (31.57S, 115.51E). The area is one of the sunniest
in the world (see Figure 59). The average sunny days per year is 331, with >10 h of sun
per day for the whole year. Irradiance is also high, averaging > 1500 W.m in summer
and > 450 W.m in winter. Average daytime temperature normally exceeds 42 C in
summer, and winter are above 4 C (see Figure 60 and Figure 61). The average days
with more rain fall than 25 cm is not higher than 12 (see Figure 63) and the average
daily evaporation is not greater than 1800 mm (see Figure 62).
Growth of P. carterae CCMP647, E. huxleyi CCMP371 and D. salina was investigated
using two 1 m surface area out door fibreglass paddle wheel driven raceway ponds at
16-21 cm depth.
. These cultures were used as to
inoculate raceway ponds resulting in an initial cell concentration of 1.2-1.5 x 10⁵
cells.mL .
he culture medium was chemically sterilized by adding 1 mL of 12.5% sodium
hypochlorite to 20 L seawater, seawater kept at dark in room temperature over night
followed by 2 h aeration prior to use.
articles over a de
itial inoculum density was 3-9 x 10⁴ cells.mL-1.
-2
-2 o
o
2
Initial inocula were scaled up from two 150 mL liquid cultures to 1.5 L aerated and
stirred Erlenmeyer 12 L stirred and aerated carboys
-1
The raceway pond layout is shown in Figure 19. The 4-paddle paddle wheel operating
at a rotating speed of about 28 rpm and generated a flow rate of 20 cm.s-1.
T
78

For investigating the effect of dif trations on growth, pH was kept
constant by a CO2-stat system troller and a solenoid switch
connected to a CO gas cylinder. pH was logged using a DataTaker DT 50 data logger.
A floating CO trap/injector based on the design of Becker (1994) with 0.06 m2 surface
area was used to maximise CO2 transfer into the liquid phase (Figure 20). The pond
temperature was recorded continuously using an underwater Tiny Tag TG-3110
temperature logger. Air temperature, irradiance and humidity data were obtained from
the Murdoch University weather station. The average photosynthetic active radiation
(PAR, 400-700nm) received by the pond was calculated by the Equation 10, where
0.429 is the fraction of PAR in the solar spectrum (Thimijan and Henis 1983).
Light penetration into the culture media was measured using an under water light sensor
at different cell concentrations.
ferent CO2 concen
using a Roche 8001 pH con
2
2
PAR = [Average daily irridiance (W.m-2)] x (1m2)x (0.429) Eq. 10
Figure 19. Raceway pond (1 m2) (a) photograph (b) schematic diagram of raceway pond.
One of the ponds was kept as a control during the experiments. Experiments on various
levels of pH (adding known volume of CO2), photosynthetic adaptation, optimum
79
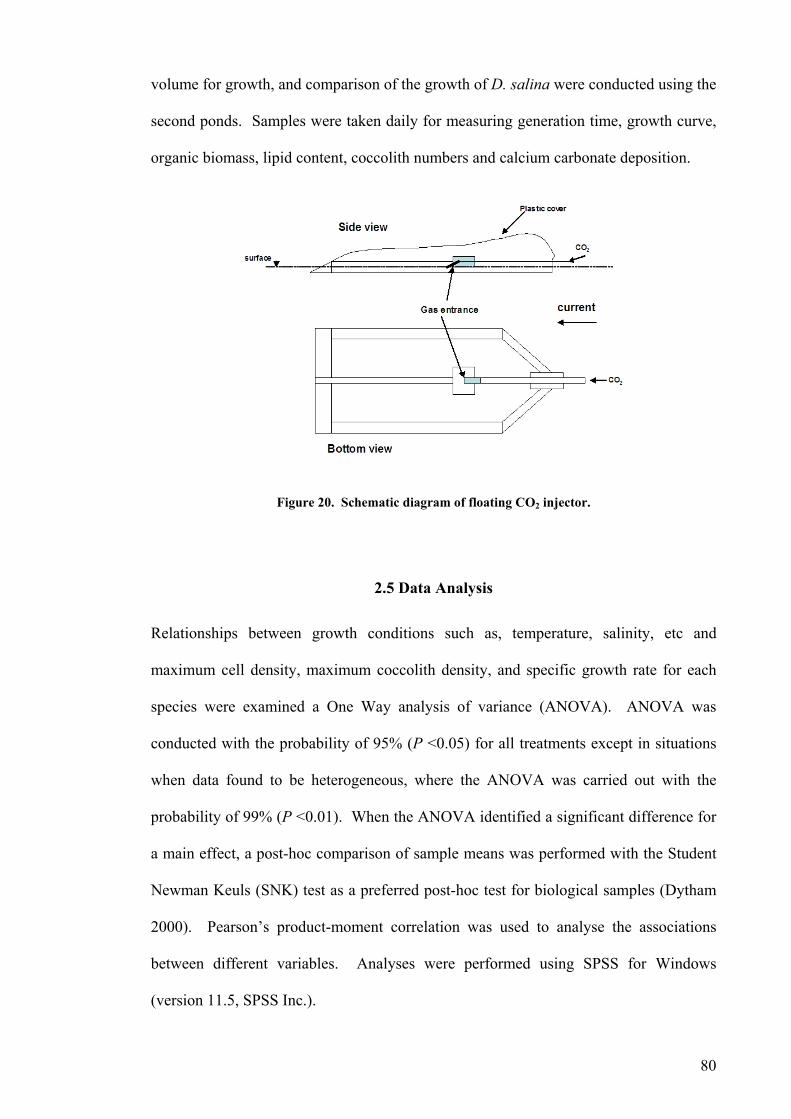
volume for growth, and comparison of the growth of D. salina were conducted using the
second ponds. Samples were taken daily for measuring generation time, growth curve,
organic biomass, lipid content, coccolith numbers and calcium carbonate deposition.
Figure 20. Sche diagram of 2 inje
2.5 Data Analysi
perature, salinity, etc and
maximum cell density, maximum coccolith density, and specific growth rate for each
amined a O is of variance (ANOVA). ANOVA was
e probability of 95% (P <0.05) for all treatments except in situations
hen data found to be heterogeneous, where the ANOVA was carried out with the
probability of 99% (P <0.01). W fied a significant difference for
a main effect, a post-hoc comparison of sample means was performed with the Student
Newman Keuls (SNK) test as a preferred post-hoc test for biological samples (Dytham
2000). Pearson’s product-m ment correlation was used to analyse the associations
between different variables. Analyses were performed using SPSS for Windows
(version 11.5, SPSS Inc.).
matic floating CO ctor.
s
Relationships between growth conditions such as, tem
species were ex ne Way analys
conducted with th
w
hen the ANOVA identi
o
80

CHAPTER 3
DETERMINATION OF TEMPERATURE, SALINITY AND
NUTRIENT OPTIMA
3.1 Introduction
The first critical step for any successful attempt in microalgal cultivation is the
determination of the physical and chemical factors limiting the growth (Richmond and
Zou 1999). Temperature and light have been found to be the most important limiting
factors in microalgal cultivation. The salinity tolerance of species and the available
nutrients are also important for successful cultivation of microalgae (Richmond 1988,
Richmond, et al. 1990, Torzillo, et al. 1991). The importance of these factors is
described in Chapter 1.
The main aim of the experiments described in this chapter was to investigate the effect
of temperature and salinity on specific growth rate, cell volume, organic dry weight and
cocco horid
lgae deemed suitable for possible mass culture. The effects of possible nutrient
limitation were also investigated for several species.
lith and calcium carbonate production of a number of species of coccolithop
a
The species chosen for this study were selected based on their apparent high
temperature tolerance since temperature control is potentially very expensive in large-
scale outdoor cultures (see page 36). The growth temperature range of all the selected
species has been reported to be between 15-26oC (Healy 2004, Hull 2004).
81
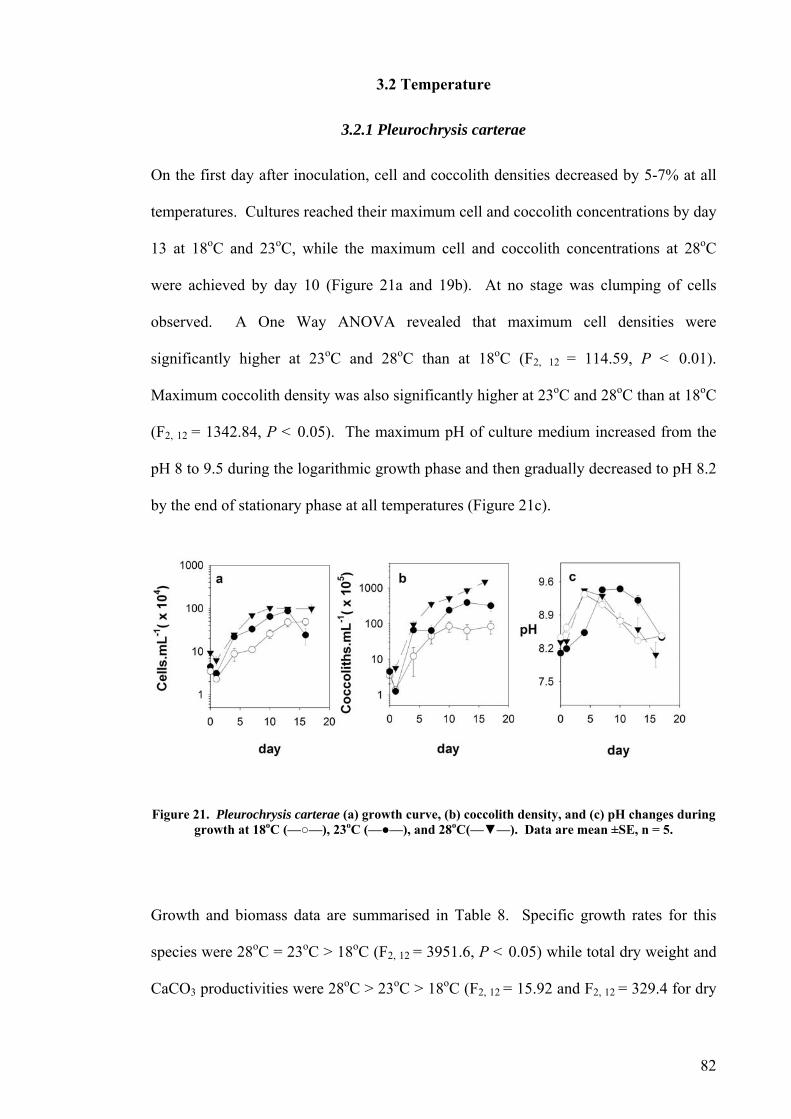
3.2 Temperature
3.2.1 Pleurochrysis carterae
o o
On the first day after inoculation, cell and coccolith densities decreased by 5-7% at all
temperatures. Cultures reached their maximum cell and coccolith concentrations by day
13 at 18 C and 23 C, while the maximum cell and coccolith concentrations at 28oC
2, 12 = 114.59, P < 0.01).
Maximum coccolith density was also significantly higher at 23oC and 28oC than at 18oC
(F2, 12 = 1342.84, P < 0.05). The maximum pH of culture medium increased from the
p
all temperatures (Figure 21c).
were achieved by day 10 (Figure 21a and 19b). At no stage was clumping of cells
observed. A One Way ANOVA revealed that maximum cell densities were
significantly higher at 23oC and 28oC than at 18oC (F
H 8 to 9.5 during the logarithmic growth phase and then gradually decreased to pH 8.2
by the end of stationary phase at
Figure 21. Pleurochrysis cartera sity, and (c) pH changes during growth at 18oC (—○—), 23 a are mean ±SE, n = 5.
Growth and biomass data are summarised in Table 8. Specific growth rates for this
species were 28 C = 23 C > 18 C (F2, 12 = 3951.6, P < 0.05) while total dry weight and
CaCO3 productivities were 28 C > 23 C > 18 C (F2, 12 = 15.92 and F2, 12 = 329.4 for dry
e (a) growth curve, (b) coccolith denoC (—●—), and 28oC(—▼—). Dat
o o o
o o o
82
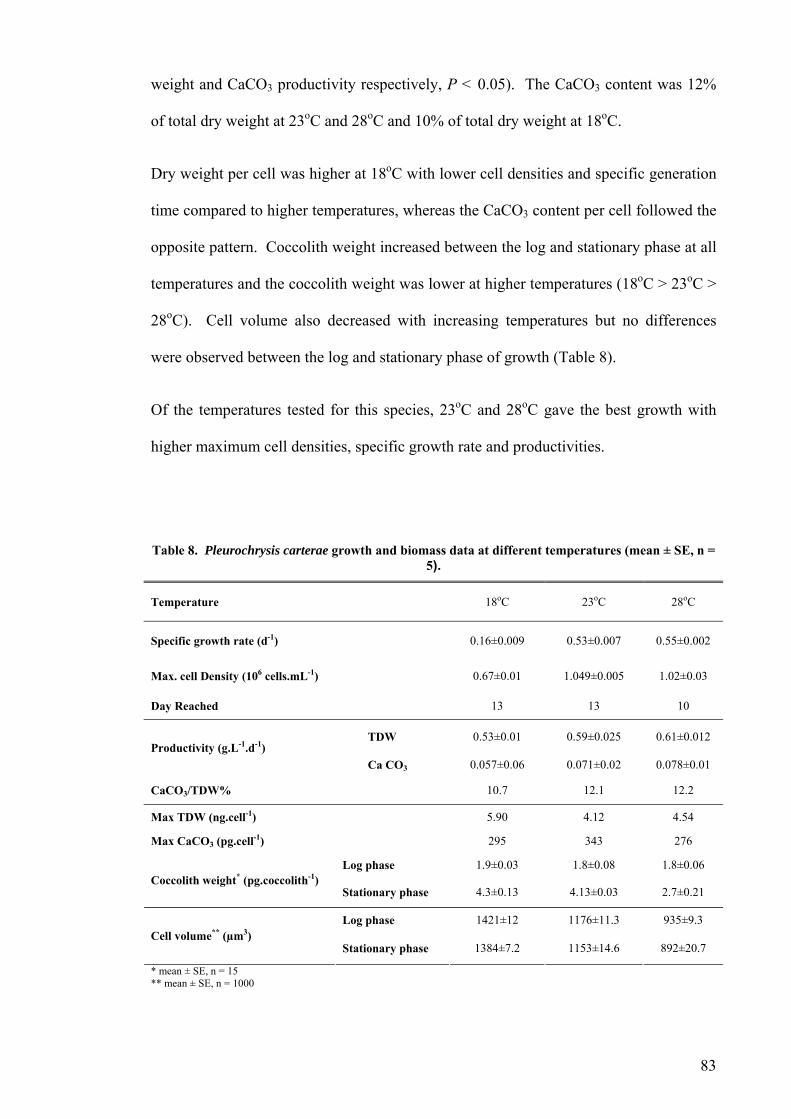
weight and CaCO3 productivity respectively, P < 0.05). The CaCO3 content was 12%
of total dry weight at 23oC and 28oC and 10% of total dry weight at 18oC.
oDry weight per cell was higher at 18 C with lower cell densities and specific generation
time compared to higher temperatures, whereas the CaCO3 content per cell followed the
opposite pattern. Coccolith weight increased between the log and stationary phase at all
temperatures and the coccolith weight was lower at higher temperatures (18oC > 23oC >
28oC) ences
ere observed between the log and stationary phase of growth (Table 8).
Of the
5).
Temperature 18oC 23oC 28oC
. Cell volume also decreased with increasing temperatures but no differ
w
temperatures tested for this species, 23oC and 28oC gave the best growth with
higher maximum cell densities, specific growth rate and productivities.
Table 8. Pleurochrysis carterae growth and biomass data at different temperatures (mean ± SE, n =
Specific growth rate (d-1) 0.16±0.009 0.53±0.007 0.55±0.002
Max. cell Density (106 cells.mL-1) 0.67±0.01 1.049±0.005 1.02±0.03
Day Reached 13 13 10
TDW 0.53±0.01 0.59±0.025 0.61±0.012 Productivity (g.L-1.d-1)
CaCO
Ca CO3 0.057±0.06 0.071±0.02 0.078±0.01
3/TDW% 10.7 12.1 12.2
Max TDW (ng.cell-1) 5.90 4.12 4.54
Max CaCO (pg.cell-1) 295 343 276
* -1
1421±12 1176±11.3 935±9.3
3
Log phase 1.9±0.03 1.8±0.08 1.8±0.06 Coccolith weight (pg.coccolith )
Stationary phase 4.3±0.13 4.13±0.03 2.7±0.21
Log phase Cell volume** (µm3)
Stationary phase 1384±7.2 1153±14.6 892±20.7
* mean ± SE, n = 15 ** mean ± SE, n = 1000
83
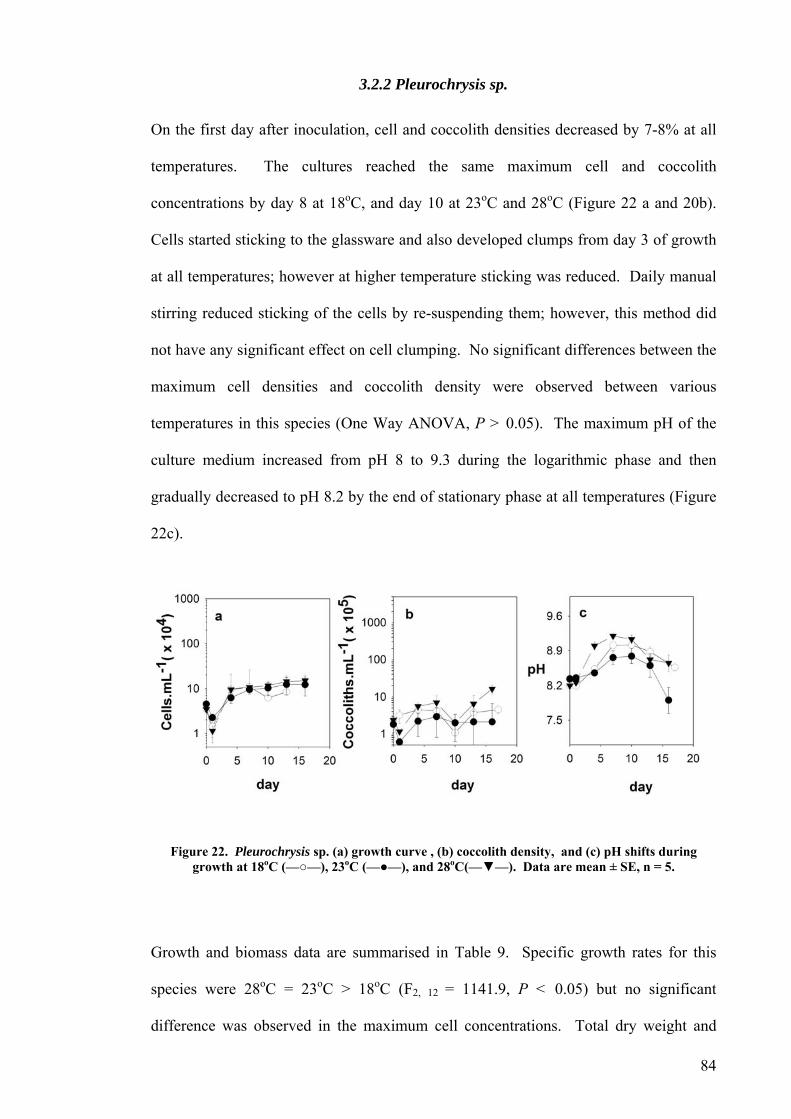
3.2.2 Pleurochrysis sp.
On the first day after inoculation, cell and coccolith densities decreased by 7-8% at all
temperatures. The cultures reached the same maximum cell and coccolith
oncentrations by day 8 at 18oC, and day 10 at 23oC and 28oC (Figure 22 a and 20b).
Cells started sticking to the glassware and also developed clumps from day 3 of growth
at all temperatures; however at higher tem ure sticking was reduced. Daily manual
the cells by re-suspending them; however, this method did
not have any significant effect on cell clumping. No significant differences between the
cell densities and ccolith density were observed between various
s species (One W P > m pH of the
m increased from pH 8 to 9.3 during the logarithm phase an en
ationary phase at all tem
22c).
c
perat
stirring reduced sticking of
maximum co
temperatures in thi ay ANOVA, 0.05). The maximu
culture mediu ic d th
gradually decreased to pH 8.2 by the end of st peratures (Figure
Figure 22. Pleurochrysis sp. (a) growth curve , (b) coccolith density, and (c) pH shifts during growth at 18oC (—○—), 23oC (—●—), and 28oC(—▼—). Data are mean ± SE, n = 5.
o o o
Growth and biomass data are summarised in Table 9. Specific growth rates for this
species were 28 C = 23 C > 18 C (F2, 12 = 1141.9, P < 0.05) but no significant
difference was observed in the maximum cell concentrations. Total dry weight and
84
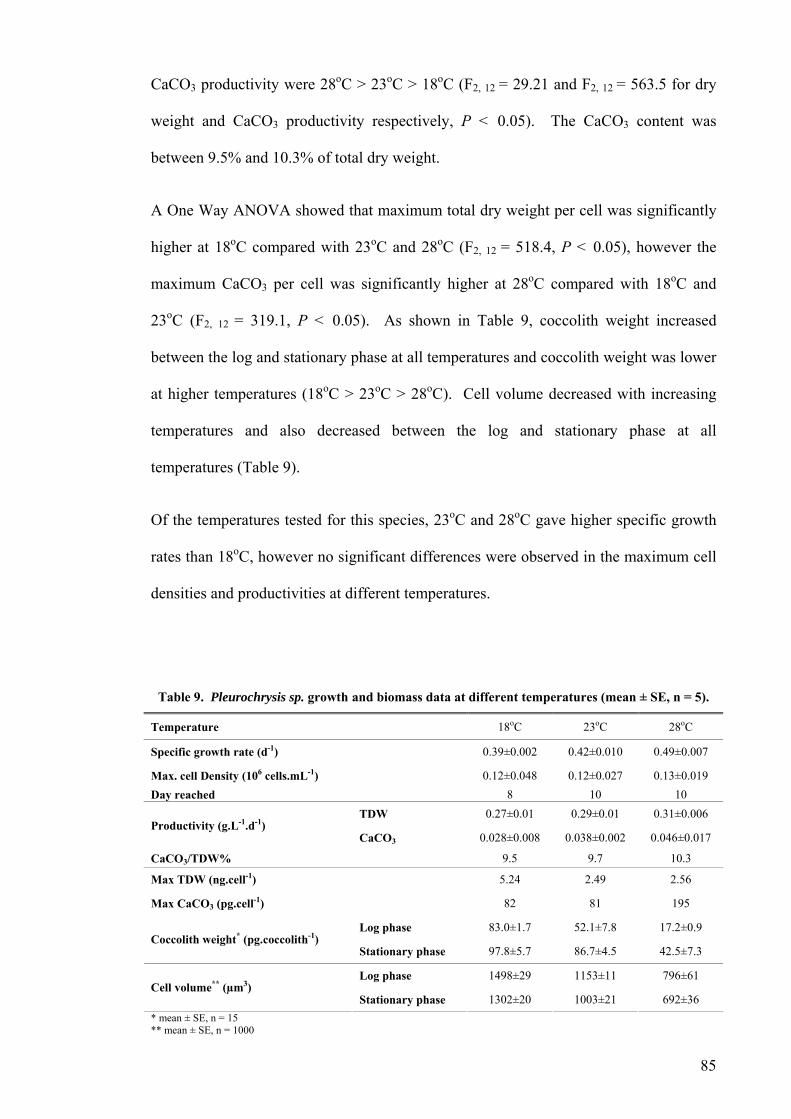
CaCO3 productivity were 28oC > 23oC > 18oC (F2, 12 = 29.21 and F2, 12 = 563.5 for dry
weight and CaCO3 productivity respectively, P < 0.05). The CaCO3 content was
between 9.5% and 10.3% of total dry weight.
o o
A One Way ANOVA showed that maximum total dry weight per cell was significantly
higher at 18 C compared with 23 C and 28oC (F2, 12 = 518.4, P < 0.05), however the
Of the temperatures tested for this species, 23oC and 28oC gave higher specific growth
rates than 18oC, however no significant differences were observed in the maximum cell
densities and productivities at different temperatures.
Table 9. Pleurochrysis sp. growth and biomass data at different temperatures (mean ± SE, n = 5).
Temperature 18oC 23oC 28oC
maximum CaCO3 per cell was significantly higher at 28oC compared with 18oC and
23oC (F2, 12 = 319.1, P < 0.05). As shown in Table 9, coccolith weight increased
between the log and stationary phase at all temperatures and coccolith weight was lower
at higher temperatures (18oC > 23oC > 28oC). Cell volume decreased with increasing
temperatures and also decreased between the log and stationary phase at all
temperatures (Table 9).
Specific growth rate (d-1) 0.39±0.002 0.42±0.010 0.49±0.007
Max. cell Density (106 cells.mL-1) 0.12±0.048 0.12±0.027 0.13±0.019 Day reached 8 10 10
TDW 0.27±0.01 0.29±0.01 0.31±0.006 Productivity (g.L-1.d-1)
CaCO3 0.028±0.008 0.038±0.002 0.046±0.017
CaCO3/TDW% 9.5 9.7 10.3
Max TDW (ng.cell-1) 5.24 2.49 2.56
Max CaCO3 (pg.cell-1) 82 81 195
Log phase 83.0±1.7 52.1±7.8 17.2±0.9 Coccolith weight* (pg.coccolith-1)
Stationary phase 97.8±5.7 86.7±4.5 42.5±7.3
Log phase 1498±29 1153±11 796±61 Cell volume** (µm3)
Stationary phase 1302±20 1003±21 692±36 * mean ± SE, n = 15 ** mean ± SE, n = 1000
85

3.2.3 Gephyrocapsa oceanica
On the first day after inoculation, cell and coccolith densities decreased by 4-
11% at all temperatures. Cultures reached their maximum cell and coccolith
concentrations by day 13, 10, and 7 at 18oC, 23oC, and 28oC respectively (Figure 23a
and 21b). At no stage was clumping of cells observed. A One Way ANOVA revealed
that maximum cell densities were significantly higher at 23oC and 28oC than at 18oC
(F2, 12 = 3212.22, P < 0.01). Maximum coccolith density was also significantly higher
at 23 and 28oC than at 18oC (F2, 12 = 105.58, P < 0.05). The maximum pH of the culture
medium increased from the pH 8.4 to 9 by day 6 at all temperatures and remained
constant from then on (Figure 23c).
Figure 23. Gephyrocapsa oceanica (a) growth curve, (b) coccolith density, and (c) pH shifts during growth at 18oC (—○—), 23oC (—●—), and 28oC(—▼—). Data are mean ± SE, n = 5.
Growth and biomass data are summarised in Table 10. Specific growth rates for
this species were 28oC > 23oC > 18oC (F2, 12 = 16227.1, P < 0.01) whereas lower
maximum cell concentrations were observed at 18oC than at 28 and 23oC. Total dry
weight and CaCO3 productivities were also significantly lower at 18oC than 28 and
23oC (F2, 12 = 23.29 and F2, 12 = 2179.1 for dry weight and CaCO3 productivity
86

87
respectively, P < 0.05). No significant differences were observed in CaCO3 per total
dry weight between different temperatures (One Way ANOVA, P > 0.05).
A One Way 3 per cell
were significantly higher at 18oC compared to 23 and 28oC (F2, 12 = 203.19 and F2, 12 =
372.1 for maximum dry weight and CaCO3 per cell respectively, P < 0.05). As
summarized in Table 10, coccolith weight s y higher at 18oC
compared to 23 and 28oC (F2, 12 = 2027.1, P < 0.05). Lower coccolith weight was
observed the stationa e e logarithm p t all temperatures Cell
volume decreased with es and d e p to 73% between the
log and stationary phase at all temperatures.
Of the te eratures tested, 23 and 28o aximum
dry weight, and productivities than 18oC, however results for total dry weight per cell
indicated th times heavier at 18 oC.
Table 10. capsa oceanica growth and biomass data at different temperature (mean ± SE, n = 5).
Temperatu 18o 3oC 28oC
ANOVA revealed that maximum dry weight and CaCO
wa also significantl
in
mp
at the cells were up to 3
Gephyro
re
ry p
incr
has
easing temperatur
than in th ic
ecr
has
ase
e a
d u
C gave higher specific growth rates, m
oC than at 23 and 28
C 2
Specific gro -1) 0.13±0.029 0.75±0.001 wth rate (d 0.54±0.007
Max. cell D cells.mL-1) 0.69±0.009 3.23±0.002 3.29±0.004
Day reached 13 10 7
TDW 0.21±0.001 0.43±0.001 0.42±0.003
ensity (10
6
Productivit -1.d-1) CaCO3 0.014±0.09 0.024±0.01 0.025±0.03
CaCO3/TDW%
Max TDW (ng.cell-1) 0.41 0.13 0.14
y (g.L
6.2 5.5 5.9
Max CaCO3 (pg.cell-1) 81 7
4.2±013 0.4±0.09 0.35±0.3 Coccolith weight* (pg.cocy phas 3.6±0.14 0.1±0.13 0.2±0.35
268±20 164±16 121±20
9
Log phase StationarLog phase
colith-1) e
Cell volume** (µm3)
y p 75±9.5 61±11 45±10.5 Stationar hase * mean ± SE, n = 15 ** mean ± SE, n = 1000
3.2.4 Emiliania huxleyi
Emiliania huxleyi CCMP371 grew at all temperatures, whereas E. huxleyi CS-
369 grew only at 18oC and 23oC (Figure 24a and 22b for both species). In the first day
s, while strain CS-369 achieved
maximum cell and coccolith concentrations on day 5 and 15 at 18oC and 23oC
respectively. No clumping of cells was observed in either strain at any stage. Cell
densities and coccolith density were 2 18oC for CCMP371 (F2, 12 = 910.49
and F2, 12 = 41.47 for cell de spectively, P < 0.05), while
o
o
aCO3 per dry weight also increased in conditions with higher specific
of the growth, a decline in cell and coccolith densities was observed in both E. huxleyi
strains. Emiliania huxleyi CCMP371 reached maximum cell and coccolith
concentrations between day 12 and 13 at all temperature
3oC > 28oC >
nsity and coccolith density re
cell densities and coccolith density for CS-369 were significantly higher at 18 C than
23 C (F2, 12 = 102.61 and F2, 12 = 511.01 for cell density and coccolith density
respectively, P < 0.01). The maximum pH of the culture media of both of E. huxleyi
strains did not change (Figure 24 c).
Growth and biomass data for both E. huxleyi clones are presented in (Table 11).
Specific growth rates for strain CCMP371 were 28oC > 23oC > 18oC (F2, 12 = 2108.6, P
< 0.01), while for strain CS-369 specific growth rates were significantly higher at 18oC
than 23oC (F2, 12 = 6856.1, P < 0.05). For both these strains, total dry weight, CaCO3
productivity and C
growth rates. Calcium carbonate per total dry weight was also higher with higher
growth rate in both of these species.
88

Figure 24. Growth curve (a), coccolith density (b), and pH shifts (c) during the growth of E. huxleyi CCMP371 and CS-369 at 18oC (—○—), 23oC (—●—), and 28oC (—▼—). Data are mean ± SE, n =
A One Way ANOVA showed that maximum dry weight and CaCO3 per cell were
significantly higher at conditions with higher specific growth rates for both CCMP371
(F2, 12 = 194.7 and F2, 12 = 222.3 for maximum dry weight and CaCO3 per cell
respectively, P < 0.05) and CS-369 (F2, 12 = 353.19 and F2, 12 = 512.2 for maximum dry
weight and CaCO3 per cell respectively, P < 0.05). As shown in Table 11 in both of
these strains, coccolith weight also increased between the logarithmic and stationary
phase. No significant differences were observed in the weight of coccoliths at different
temperatures in strain CCMP371 (One Way ANOVA, P > 0.05), whereas for strain CS-
5.
89
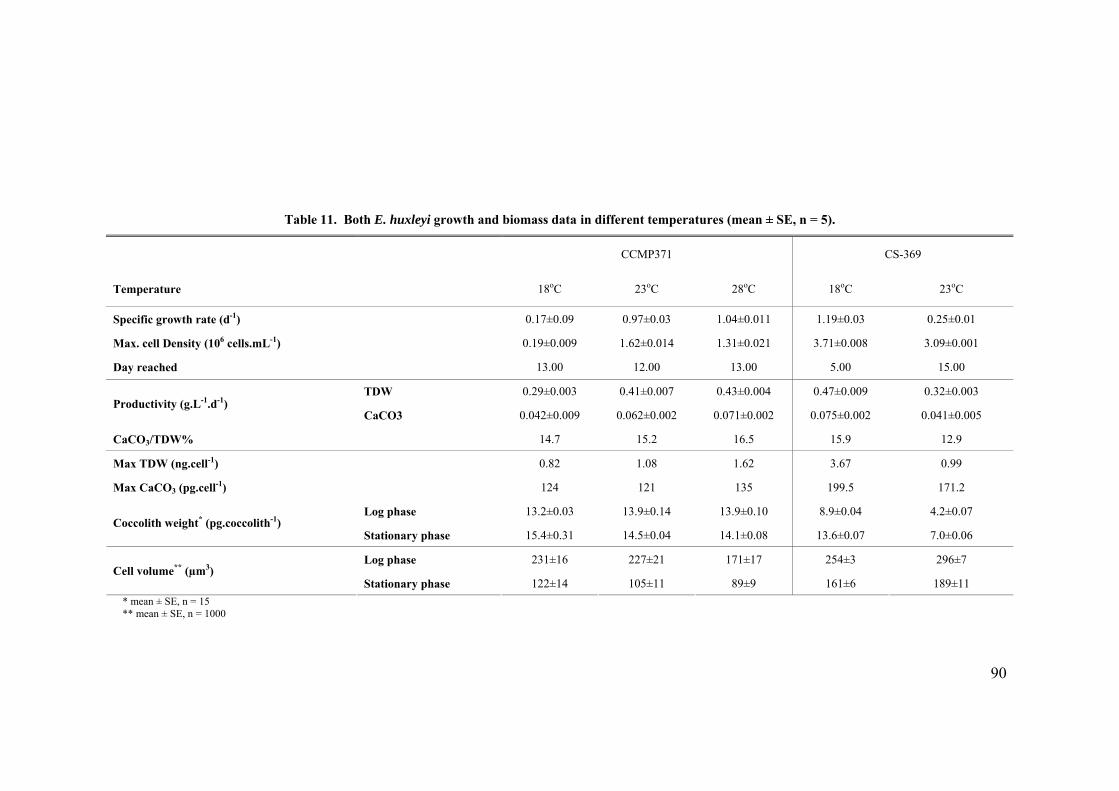
90
Table 11. Both E. huxleyi growth and biomass data in different temperatures (mean ± SE, n = 5).
CCMP371 CS-369
Temperature 18oC 2 2 3oC 28oC 18oC 3oC
Specific growth rate (d-1) 0.17±0.09 0.97±0.03 1.04±0.011 1.19±0.03 0.25±0.01
Max. cell Density (106 cells.mL-1) 0.19±0.009 1.62±0.014 1.31±0.021 3.71±0.008 3.09±0.001
Day reached 3.00 1 15.00 1 2.00 13.00 5.00
TDW 0.29±0.003 0.41±0.007 0.43±0.004 0.47±0.009 0.32±0.003 Productivity (g.L-1.d-1)
CaCO3 0.042±0.009 0.062±0.002 0.071±0.002 0.075±0.002 0.041±0.005
CaCO /TDW% 3 14.7 15.2 15.9 12.9 16.5
Max TDW (ng.cell-1) 0.82 1.08 3.67 0.99 1.62
Max CaCO3 (pg.cell-1) 124 1 .5 171.2 21 135 199
Log phase 13.2±0.03 13.9±0.14 13.9±0.10 8.9±0.04 4.2±0.07 Coccolith weight* (pg.coccolith-1)
Stationary phase 15.4±0.31 14.5±0.04 14.1±0.08 13.6±0.07 7.0±0.06
Log phas 1±1 22 ±3e 23 6 7±21 171±17 254 296±7 Cell volume** (µm3)
tationary phase 122±14 105 ±6S ±11 89±9 161 189±11 * mean ± SE, n = 15
00
** mean ± SE, n = 10
coccolith weight decrease oC (F2, 12 = 1217.2, P <
3.3 Salinity
3.3.1 Pleurochrysis carterae
On the first day after inoculation, cell density decreased by 2% at all salinities. The
maximum cell concentration and stationary phase was reached by day 4 at 31.5 and 33.1
ppt salinities, by day 7 at 27.9 and 29.1 ppt salinities, and by day 11 at salinities
between 23.7 and 26.5 ppt (Figure 25a). No significant difference was observed in the
final cell densities between different salinities (One Way ANOVA, P > 0.05). The
maximum coccolith concentration was reached by day 9 of growth (Figure 25b) at all
salinities and there was no significant difference in the maximum coccolith density
between different salinities (One Way ANOVA, P > 0.05). At no stage was clumping
Growth and biomass data are summarised in Table 12. Specific growth rates were 33.1
= 31.5 > 30.2 = 29.1 > 27.9 > 26.5 > 25.1 > 23.7 ppt (F 7, 32 = 207.9, P < 0.05), while
d significantly between 18oC and 23
0.05). Cell volume was greater in cultures with lower specific growth rates and cell
volume decreased up to 50% between the logarithmic and stationary phase at all
temperatures.
Of the temperatures tested for both strains (CCMP371 and CS-369), specific growth
rates and productivities were higher at 28oC than at 23 and 18oC for strain CCMP371,
whereas strain CS-369 showed the best growth at 18oC.
of cells observed.
the same maximum cell concentration was achieved in all salinities. Pearson product-
moment correlation indicated a significant positive association between specific growth
rate and the salinity of the medium (r = -0.59, df = 39, P < 0.05). Total dry weight and
91
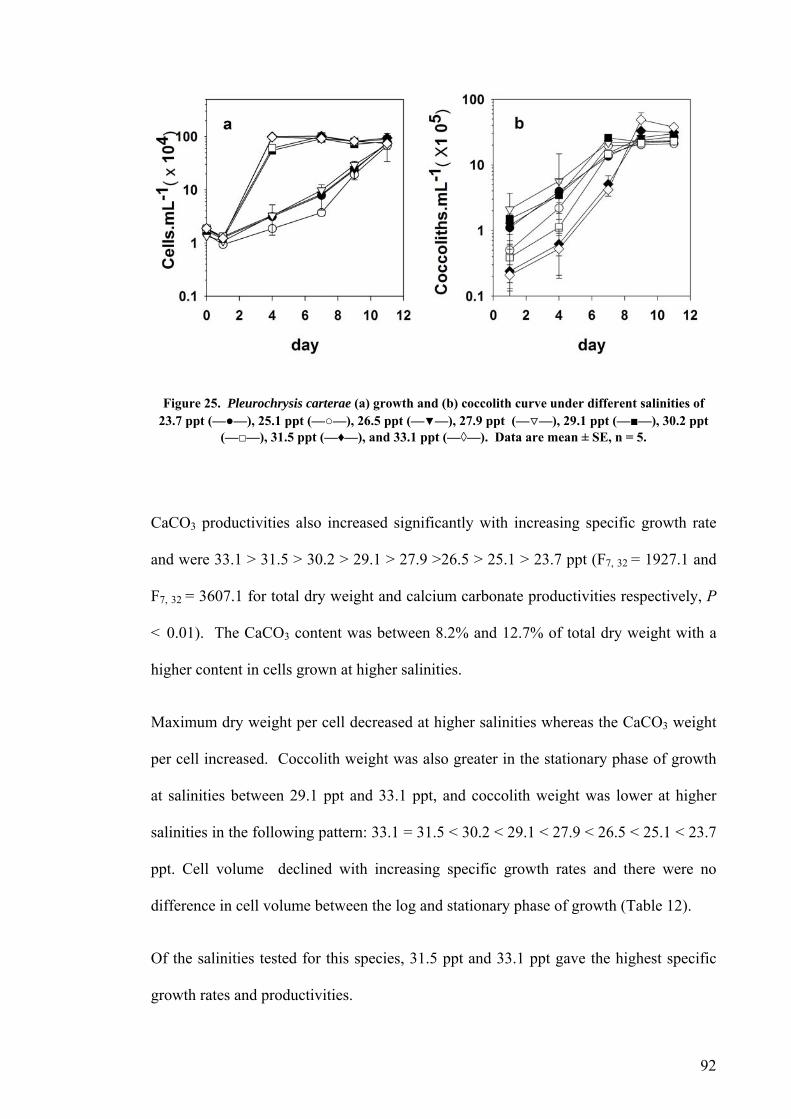
92
Figure 25. eurochrysis carterae (a) growth and (b) coccolith curve under different salinities of —), 25 pp ○— ppt (—▼—), 2 (—Ï—), 29.1 ppt (—■—), 30.2 ppt □ ), t (—♦ ) a ean ± SE, n = 5.
CaCO3 productivities also increased sing specific growth rate
and were 33.1 > 31.5 > 30.2 > 29.1 > 27.9 >26.5 > 25.1 > 23.7 ppt (F7, 32 = 1927.1 and
F7, 32 = 3607.1 for total dry weight and calcium carbonate productivities respectively, P
< 0.01). The CaCO3 content was between 8.2% and 12.7% of total dry weight with a
higher content in cells grown er salinities.
Maximum at higher salinities whereas the CaCO3 weight
per cell increased. Coccolith weight was also great n th ationary phase of growth
at salinities between 29.1 ppt and 33.1 ppt, and coccolith weight was lower at higher
salinities in the following pattern: 33.1 = 31.5 < 2 2 27.9 < 26.5 < 25.1 < 23.7
ppt. Cell volume declined with increasing spec rowth rates and there were no
difference in cell volum
Of the salinities tested for and 33.1 ppt gave the highest specific
growth rates a p es.
Pl●
(—
dry weight per cell decreased
23.7 ppt (— .1 31.5
t (— pp
), 2—),
6.5 and
7.9◊—
ppt. D— 33.1 ppt (— ta are m
significantly with increa
at high
er i
<
e st
< 30. 9.1
ific g
e between the log and
ucti
stationary phase of growth (Table 12).
this species, 31.5 ppt
vitind rod
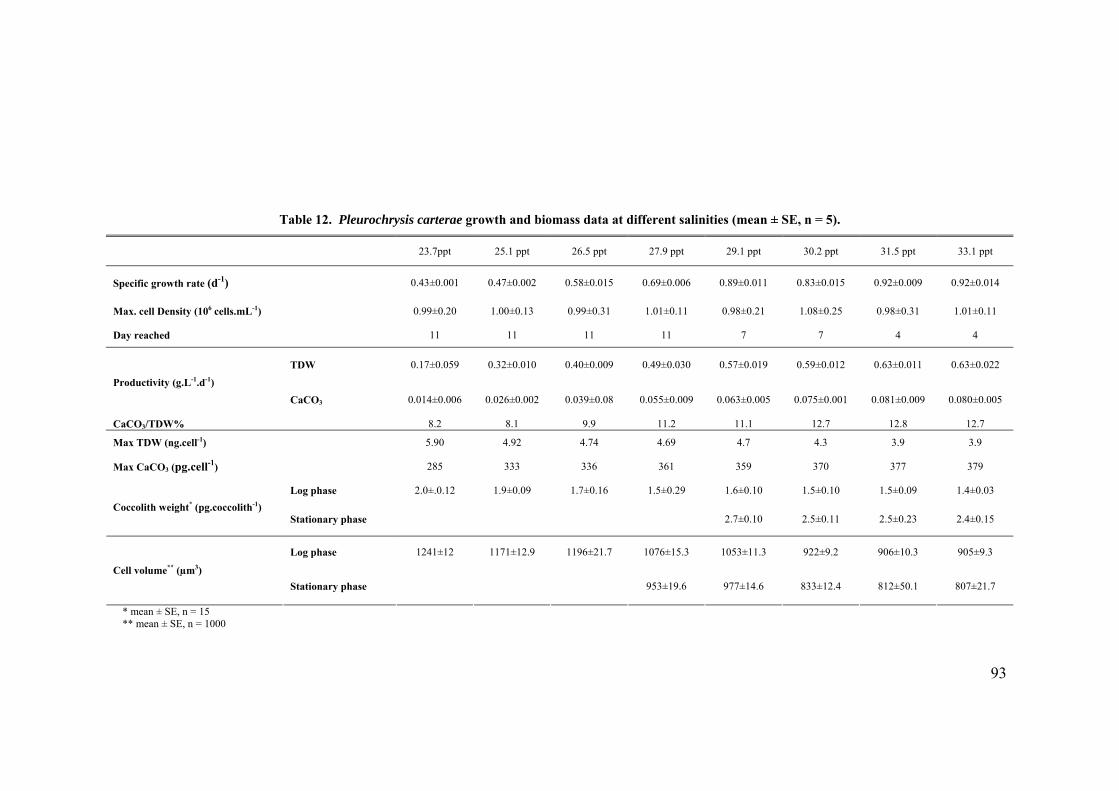
93
).
pt 31. ppt 33 ppt
leurochrysis carterae growth biom d d erent n = 5
23.7ppt 25. 26.5 .9 29. 30.2 p 5 .1
Table 12. P
and
1 ppt
ass ata at iff salinities (mean ± SE,
ppt 27 ppt 1 ppt
Specific ow te 0.43±0.001 0.47 2 0.58±0. 5 69±0. 6 9 83±0. 5 0. ±0 9 92± 4 gr th ra (d-1) ±0.00 01 0. 00 0.8 ±0.011 0. 01 92 .00 0. 0.01
M . y (ax cell Densit 10 .m 0.99±0.20 1.0 0.99± 31 01±0.11 98 .08±0.25 0.98±0.31 01±0.11
y ed 11 11 7 4 4
W 0.17±0.059 0.32 0 0.40±0. 9 49±0. 0 7 59±0. 2 0. ±0 1 63±0. 2
6 cells L-1)
Da reach
TD
0±0.13
11 11
±0.01
0. 1. 0. ±0.21 1
7
00 0. 03 0.5 ±0.019 0.
1.
01 63 .01 0. 02
Pr uctivi (g.Lod ty .dO 0.014±0.006 0.02 02 0.039± 055±0. 09 063±0. 075±0. 01 0.081±0. 09 0± 05
CaCO W 8.2 9. 11. 1 12.7 12.8 12.
ax ( -1) 5.90 4.74 4.69 4.3 3.9 3.9
-1 -1) CaC
/TD %
M TDW ng.cell
3 6±0.0
8.1
4.92
0.08 0. 0 0. 005 0.
9 2 1.1
4.7
0 0 0.08 0.0
7
3
M CaC (pg.cax O3 ell 285 336 361 3 370 7 379
Log phase 2.0±.0.12 1.9 1.7±0.16 ± 29 6 1.5±0.10 ±0 09 ± 03 c we
io has 7 2.5±0.11 ±0 ±
Log phase 1241±12 117 9 1196± 7 6 1053± 922±9.2 ±1 905±9.3
-1)
Co colith ight
333
±0.09
1±12.
59
1.5 0. 1. ±0.10
2. ±0.10
21. 107 ±15.3 11.3
3 7
1.5 . 1.4 0.
2.5 .23 2.4 0.15
906 0.3
* (pg.coccolith-1) Stat nary p e
Cell volum **e ) io hase 953±1 977±1 2.4 807±2
(µm3
Stat nary p 9.6 4.6 833±1 812±50.1 1.7
* 15 ** ean ± SE = 1
mean ± SE, n = m , n 000
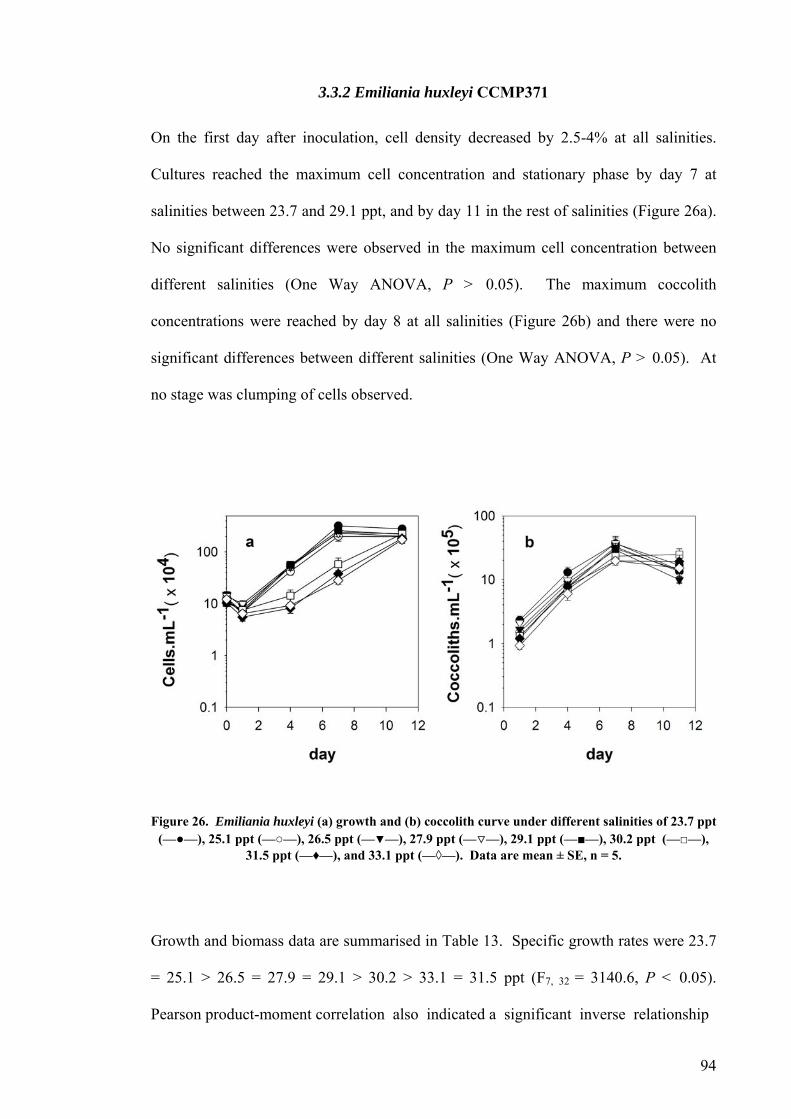
3.3.2 Emiliania huxleyi CCMP371
On the first day after inoculation, cell density decreased by 2.5-4% at all salinities.
Cultures reached the maximum cell concentration and stationary phase by day 7 at
salinities between 23.7 and 29.1 ppt, and by day 11 in the rest of salinities (Figure 26a).
No significant differences were observed in the maximum cell concentration between
d
oncentrations were reached by day 8 at all salinities (Figure 26b) and there were no
significant differences between different salinities (One Way ANOVA, P > 0.05). At
ifferent salinities (One Way ANOVA, P > 0.05). The maximum coccolith
c
no stage was clumping of cells observed.
Figure 26. Emiliania huxleyi (a) growth and (b) coccolith curve under different salinities of 23.7 ppt (—●—), 25.1 ppt (—○—), 26.5 ppt (—▼—), 27.9 ppt (—Ï—), 29.1 ppt (—■—), 30.2 ppt (—□—),
31.5 ppt (—♦—), and 33.1 ppt (—◊—). Data are mean ± SE, n = 5.
Growth and biomass data are summarised in Table 13. Specific growth rates were 23.7
= 25.1 > 26.5 = 27.9 = 29.1 > 30.2 > 33.1 = 31.5 ppt (F7, 32 = 3140.6, P < 0.05).
Pearson product-moment correlation also indicated a significant inverse relationship
94
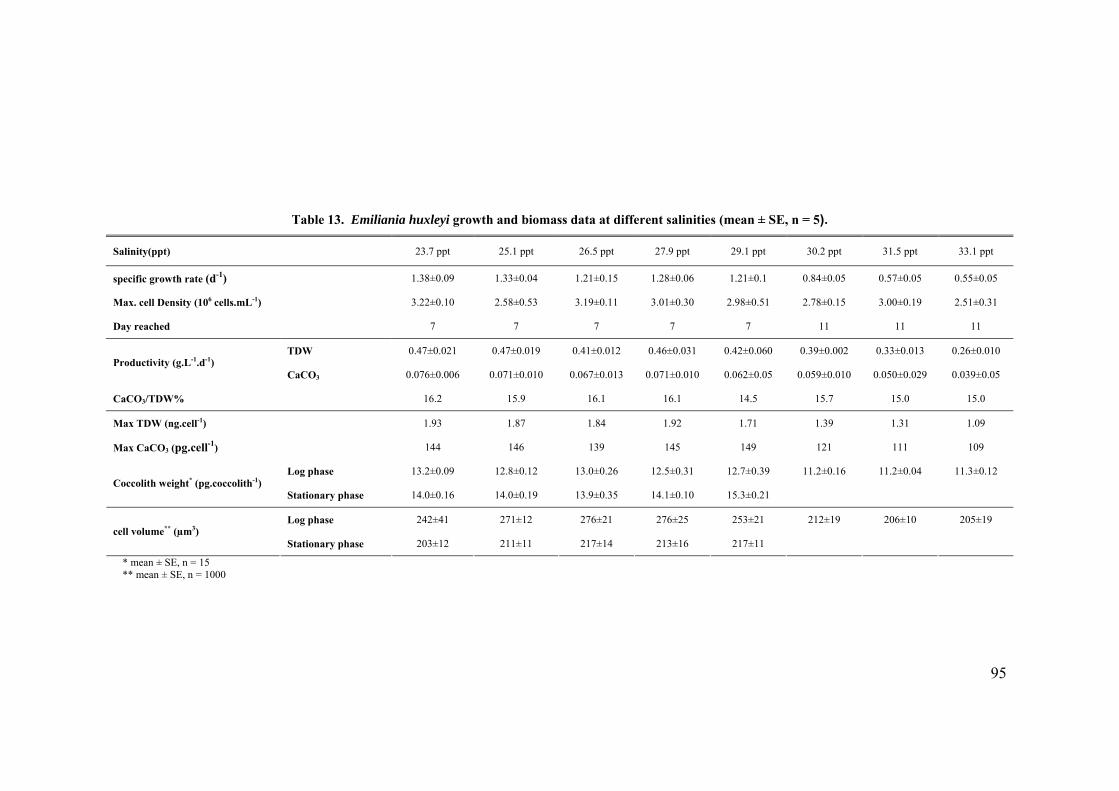
95
Table 13. Emiliania huxleyi growth and biomass data at different salinities (mean ± SE, n = 5).
Salinity(ppt) 23.7 ppt 25.1 ppt 26.5 ppt 27.9 ppt 29.1 ppt 30.2 ppt 31.5 ppt 33.1 ppt
specific growth rate (d-1) 1.38±0.09 1.33±0.04 1.21±0.15 1.28±0.06 1.21±0.1 0.84±0.05 0.57±0.05 0.55±0.05
Max. cell Density (106 cells.mL-1) 3.22±0.10 2.58±0.53 3.19±0.11 3.01±0.30 2.98±0.51 2.78±0.15 3.00±0.19 2.51±0.31
7 7 7 7 7 11 11 11
TDW 0. 021 0. 019 0. 012 0.46±0.031 0.42±0.060 0. 002 0. 013 0. 010
Day reached
47±0. 47±0. 41±0. 39±0. 33±0. 26±0.Productivity (g.L-1.d-1)
3 06 0. 10 13 10 0. 10 29 0.
CaCO3/TDW% 2 9 1 16.1 14.5 15.7 0 0
cell-1) 93 87 84 1.92 1.71 1.39 31 09
CaCO 0.076±0.0 071±0.0 0.067±0.0 0.071±0.0 0.062±0.05 059±0.0 0.050±0.0 039±0.05
16. 15. 16. 15. 15.
Max TDW (ng. 1. 1. 1. 1. 1.
Max CaCO (pg.cell-13 ) 144 146 111 109
Log phase 13. 09 12. 12 13. 26 12. 31 12. 39 11. 16 11. 04 11. 12 Coccolith weight* (pg.coccolith-1)
16 19 35 14. 10 15. 21
242±41 271±12 276±21 212±19 206±10 205±19
139 145 149 121
2±0. 8±0. 0±0. 5±0. 7±0. 2±0. 2±0. 3±0.
Stationary phase 14.0±0. 14.0±0. 13.9±0. 1±0. 3±0.
Log phase 276±25 253±21cell volume** (µm3)
213±1 217±1 Stationary phase 203±12 211±11 217±14 6 1
* mean ± SE, n = 15 10 0 ** mean ± SE, n = 0
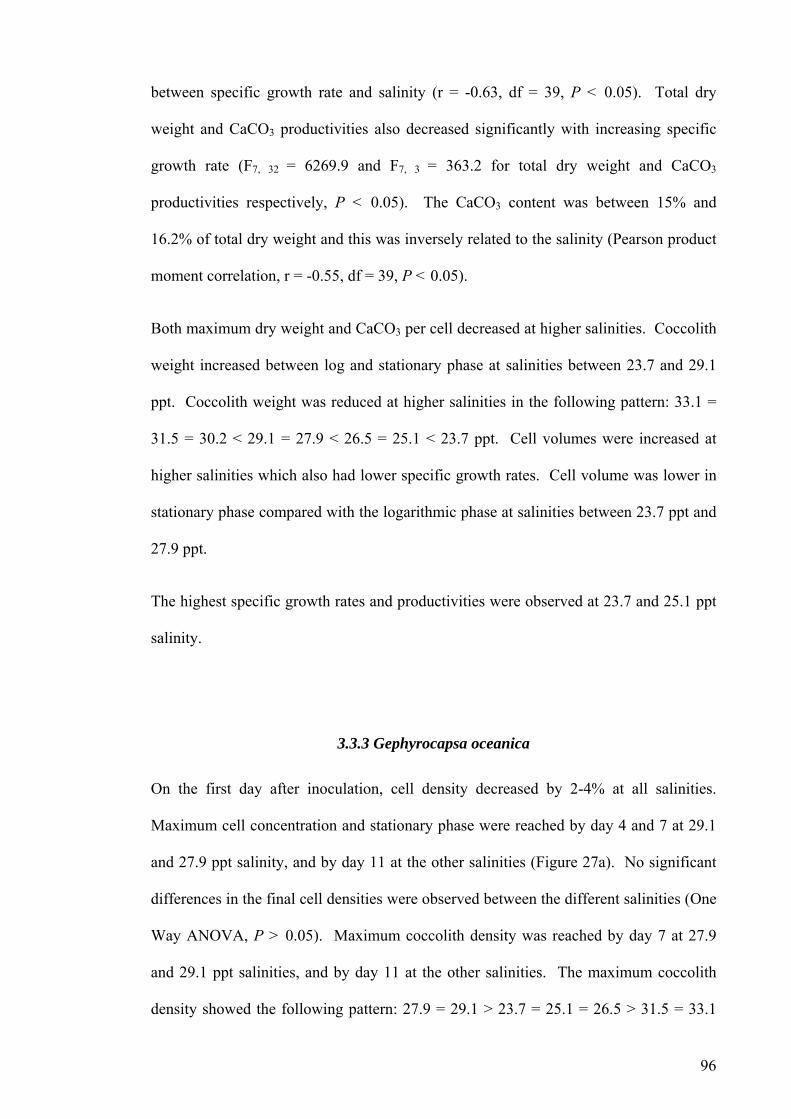
between specific growth rate and salinity (r = -0.63, df = 39, P < 0.05). Total dry
weight and CaCO3 productivities also decreased significantly with increasing specific
growth rate (F7, 32 = 6269.9 and F7, 3 = 363.2 for total dry weight and CaCO3
productivities respectively, P < 0.05). The CaCO3 content was between 15% and
16.2% of total dry weight and this was inversely related to the salinity (Pearson product
moment correlation, r = -0.55, df = 39, P < 0.05).
aCO3 per cell decreased at higher salinities. Coccolith
weight increased between log and stationary phase at salinities between 23.7 and 29.1
ppt. Coccolith weight was reduced at higher salinities in the following pattern: 33.1 =
31.5 = 30.2 increased at
at 23.7 and 25.1 ppt
alinity.
phase were reached by
Both maximum dry weight and C
< 29.1 = 27.9 < 26.5 = 25.1 < 23.7 ppt. Cell volumes were
higher salinities which also had lower specific growth rates. Cell volume was lower in
stationary phase compared with the logarithmic phase at salinities between 23.7 ppt and
27.9 ppt.
The highest specific growth rates and productivities were observed
s
3.3.3 Gephyrocapsa oceanica
On the first day after inoculation, cell density decreased by 2-4% at all salinities.
Maximum cell concentration and stationary day 4 and 7 at 29.1
and 27.9 ppt salinity, and by day 11 at the other salinities (Figure 27a). No significant
differences in the final cell densities were observed between the different salinities (One
Way ANOVA, P > 0.05). Maximum coccolith density was reached by day 7 at 27.9
and 29.1 ppt salinities, and by day 11 at the other salinities. The maximum coccolith
density showed the following pattern: 27.9 = 29.1 > 23.7 = 25.1 = 26.5 > 31.5 = 33.1
96
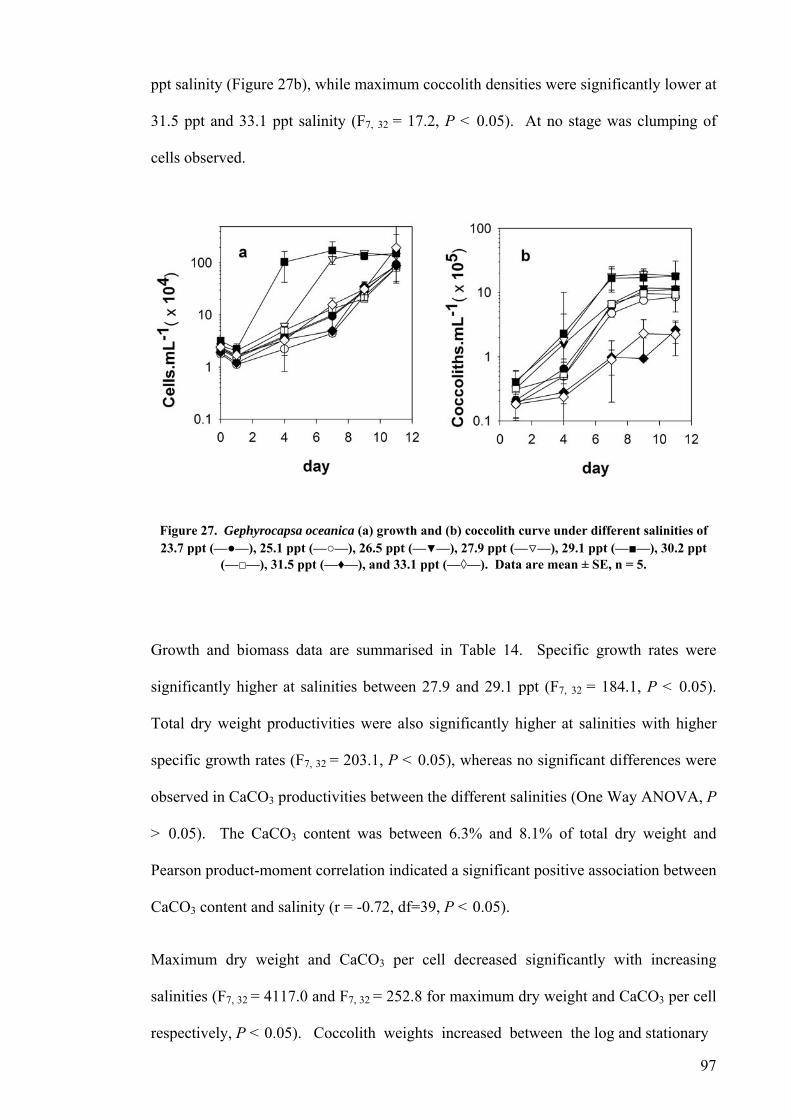
ppt salinity (Figure 27b), while maximum coccolith densities were significantly lower at
31.5 ppt and 33.1 ppt salinity (F7, 32 = 17.2, P < 0.05). At no stage was clumping of
cells observed.
Figure 27. Gephyrocapsa oceanica (a) growth and (b) coccolith curve under different salinities of 23.7 ppt (—●—), 25.1 ppt (—○—), 26.5 ppt (—▼—), 27.9 ppt (—Ï—), 29.1 ppt (—■—), 30.2 ppt
(—□—), 31.5 ppt (—♦—), and 33.1 ppt (—◊—). Data are mean ± SE, n = 5.
Growth and biomass data are summarised in Table 14. Specific growth rates were
significantly higher at salinities between 27.9 and 29.1 ppt (F7, 32 = 184.1, P < 0.05).
Total dry weight productivities were also significantly higher at salinities with higher
specific growth rates (F7, 32 = 203.1, P < 0.05), whereas no significant differences were
observed in CaCO3 productivities between the different salinities (One Way ANOVA, P
> 0.05). The CaCO3 content was between 6.3% and 8.1% of total dry weight and
Pearson product-moment correlation indicated a significant positive association between
Maximum dry ith increasing
alinities (F7, 32 = 4117.0 and F7, 32 = 252.8 for maximum dry weight and CaCO3 per cell
respectively, P < 0.05). Coccolith weights increased between the log and stationary
CaCO3 content and salinity (r = -0.72, df=39, P < 0.05).
weight and CaCO3 per cell decreased significantly w
s
97
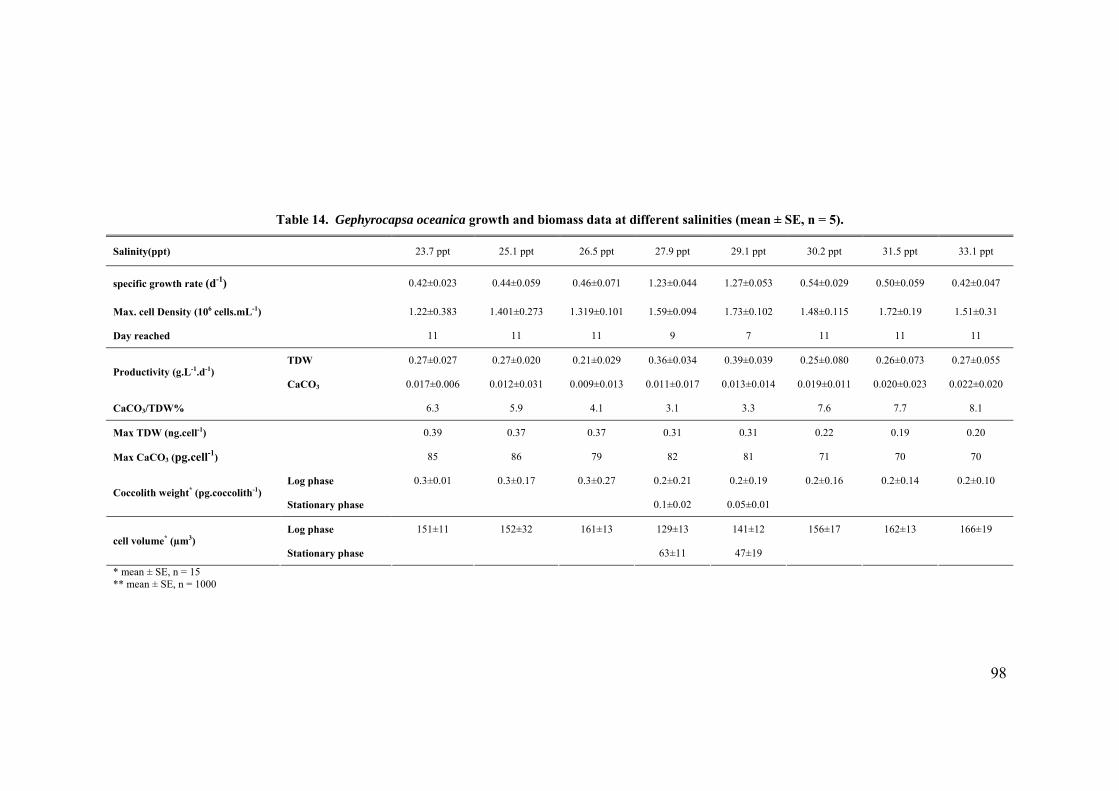
98
33.1 ppt
Table 14. Gephyrocapsa n ro an o d at different s in ( ±
Salinity(ppt) pt 1 p .5 7. 29. 30. 31.5 ppt
ocea ica g wth d bi mass ata al ities mean SE, n = 5).
23.7 p 25. pt 26 ppt 2 9 ppt 1 ppt 2 ppt
specific growth rate (d-1) 0. 02 0. 9 46±0. 3± 7 54 50±0.059 42±0. 3 0.44± 05 0. 071 1.2 0.044 1.2 ±0.053 0. ±0.029 0. 0.42±0.047
Max. cell Density (106 cells.mL-1) 1. 38 ±0 73 319±0. 59±0. 3 48 5 1.72±0.19
Day reached 1 11 9 11
TDW 0. 02 0. 0 21±0. 36±0. 9 25 26±0.073
22±0. 3 1.401 .2 1. 101 1. 094 1.7 ±0.102 1. ±0.11
11 1 7 11
27±0. 7 0.27± 02 0. 029 0. 034 0.3 ±0.039 0. ±0.080 0.
1.51±0.31
11
0.27±0.055 Productivity (g.L-1.d-1)
CaCO3 0. .0 ±0 31 009±0. 13 011±0. 1 1 020±0.023
CaCO3/TDW% 9 4. 3. 7.7
Max TDW (ng.cell-1) 37 0.37 0. 0. 0.19
017±0 06 0.012 .0 0. 0 0. 017 0.013±0.014 0.0 9±0.01 0.
6.3 5. 1 1 3.3 7.6
0.39 0. 31 31 0.22
0.022±0.020
8.1
0.20
Max CaCO3 (pg.cell-1) 6 79 82 81 71 70 70
Log phase 01 0.17 3± 2± .2 .2 0.2±0.14 Coccolith weight* (pg.coccolith-1)
Stationary phase 1± 05
Log phase 1 161±1 29 4 3
85 8
0.3±0. 0.3± 0. 0.27 0. 0.21 0 ±0.19 0 ±0.16
0. 0.02 0. ±0.01
151±1 152±32 3 1 ±13 1 1±12 156±17 162±1
0.2±0.10
166±19 cell volume* (µm3)
Stationary phase 63 47 ±11 ±19
* mean ± SE, n = 15 ** mean ± SE, n = 1000
phase at salinities between 27.9 and 29.1 ppt, however there were no significant
differences in coccolith weight between the different salinities (One Way ANOVA, P >
0.05). Cell volume was significantly lower at salinities with higher specific growth
rates (F7, 32 = 601.9, P < 0.05). Lower cell volumes were also observed in the stationary
phase compared with the logarithmic phase at salinities between 27.9 and 29.1 ppt.
Of the salinities tested for this species, 27.9 ppt and 29.1 ppt gave the best specific
growth rates and productivities.
3.4 Effect of growth rate on cell volume and productivities
The experiments above showed that increased growth rate resulted in a decrease in cell
3.5 Nutrient limitation
of nutrients can limit microalgal growth (see page 39). To investigate whether
nutrient deficiency is the possible reason for the initiation of stationary phase in the
algae cultured here, growth of P. carterae, E. huxleyi (CCMP), and G. oceanica was
tested by removing the cells from th m once the culture had reached the
4
cells growing in the residual medium.
volume and increases in both dry weight and CaCO3 productivity during the logarithmic
phase of growth, irrespective of the growth conditions (i.e. temperature or salinity) and
these relationships are illustrated in Figure 28 and Figure 29.
A lack
e growth mediu
stationary phase and re-inoculating this residual medium with a lower density of cells
(see page 72). Cells were also inoculated into fresh medium at the same low density of
1 ± 0.5 x 10 and at the maximum cell density. In case of nutrient limitation lower
specific growth rate and lower maximum cell concentration would be expected for the
99
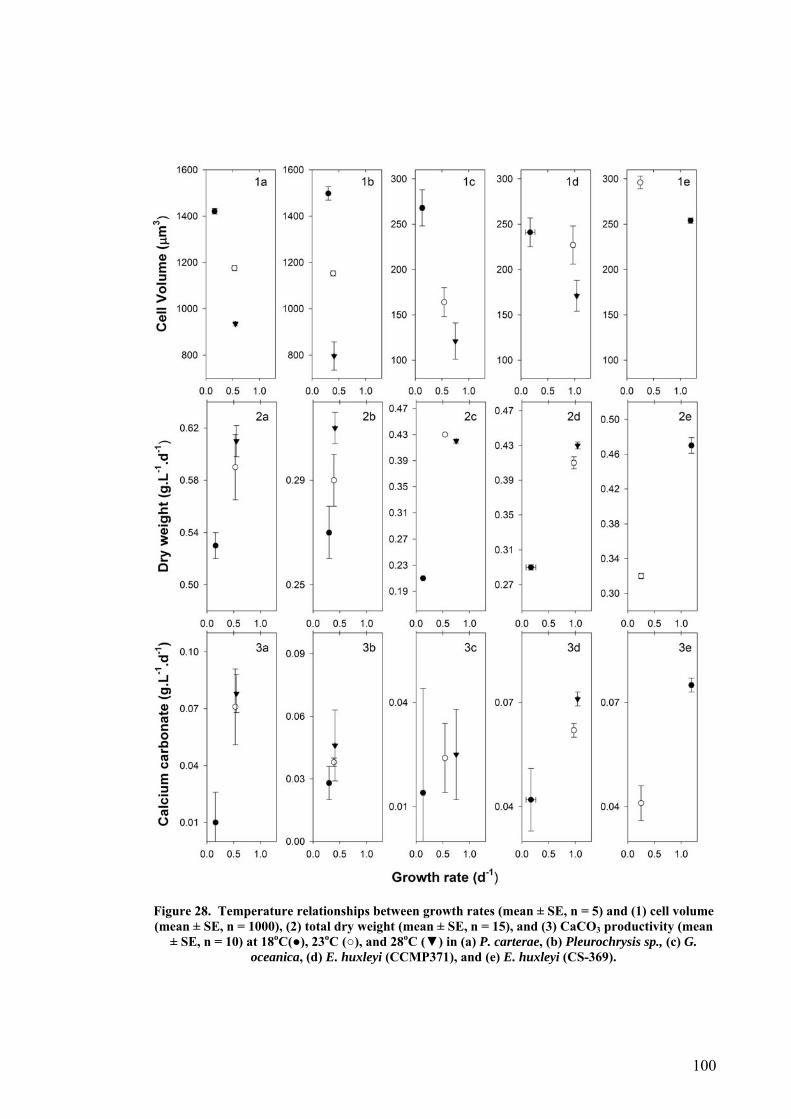
Figure 28. Temperature relationships between growth rates (mean ± SE, n = 5) and (1) cell volume
oceanica, (d) E. huxleyi (CCMP371), and (e) E. huxleyi (CS-369).
(mean ± SE, n = 1000), (2) total dry weight (mean ± SE, n = 15), and (3) CaCO3 productivity (mean ± SE, n = 10) at 18oC(●), 23oC (○), and 28oC (▼) in (a) P. carterae, (b) Pleurochrysis sp., (c) G.
100
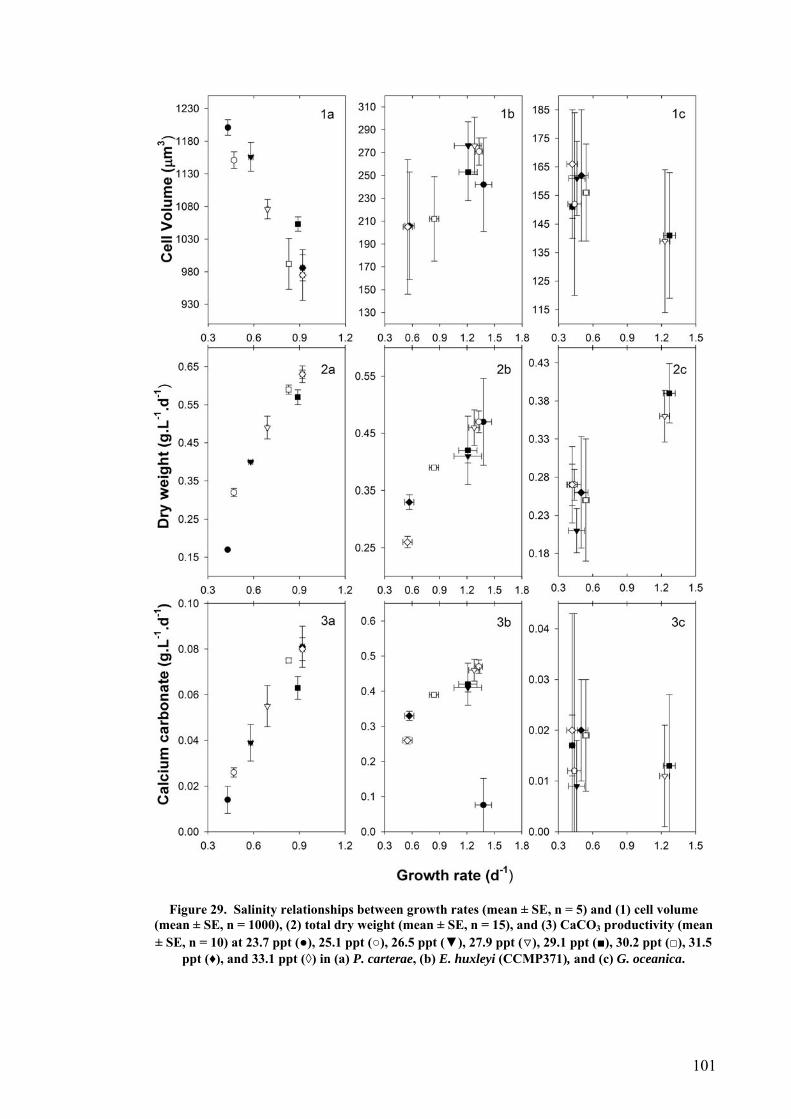
Figure 29. Salinity relationships between growth rates (mean ± SE, n = 5) and (1) cell volume (mean ± SE, n = 1000), (2) total dry weight (mean ± SE, n = 15), and (3) CaCO3 productivity (mean ± SE, n = 10) at 23.7 ppt (●), 25.1 ppt (○), 26.5 ppt (▼), 27.9 ppt (Ï), 29.1 ppt (■), 30.2 ppt (□), 31.5
ppt (♦), and 33.1 ppt (◊) in (a) P. carterae, (b) E. huxleyi (CCMP371), and (c) G. oceanica.
101
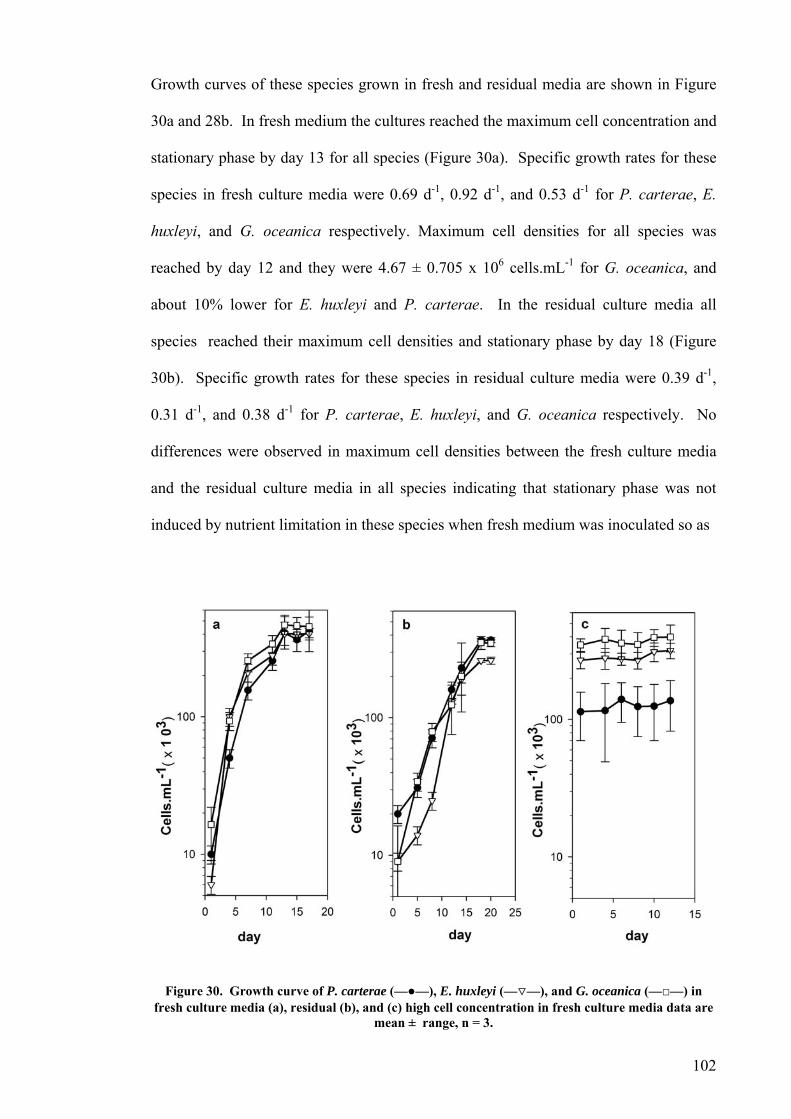
102
Growth curves of these species grown in fresh and residual media are shown in Figure
30a and 28b. In fresh medium the cultures reached the maximum cell concentration and
stationary p ase by day 13 for all species (F re 30a). Specific growth rates for these
species in fresh culture m dia were 0.69 d-1 -1, and 0.53 d-1 for P. carterae, E.
huxleyi, and eanica respectively. Maximum cell densities for all species was
reached by day 12 and they were 4.67 ± 0.705 x 10⁶ cells.mL-1 for G. oceanica, and
about 10% lower for E. huxleyi and P. carterae. In the residual culture media all
species reached their m m l d sit
30b). Specific growth rates for these species in residual culture media were 0.39 d-1,
0.31 d-1, and 0.38 d for P. rt ae, . huxleyi
differences were observed in maximum nsities b edia
and the re lture media in all species indicating that stationary phase was not
induced by nutrient limitation t e cie was inoculated so as
Figure 30. ow urve of P. c (— (— , and G. oceanica (—□—) in fresh culture media (a), res al (c) con tra media data are
mean ± range, n = 3.
h
sidual cu
Gr
igu
e , 0.92 d
G. oc
axi um cel en ies and stationary phase by day 18 (Figure
-1 ca er E
cell
, and G. oceanica
etween the fresh culture m
th c arterae(b), an
●—), high
E. huxleyicell
Ï—)tion in fresh culture idu d cen
de
in hes spe s when fresh medium
respectively. No
to give a cell density close to the maximum cell concentration reached by each species
at stationary phase. This experiment designed to investigate the possibility of growth
shift from lag phase to the log phase while there are high nutrients available. The same
growth was observed for the 12 days of the experiment for all species indicating that the
maximum cell densities reached by the cultures were possibly limited by light (Figure
30c).
In many regions of the world, temperature may represent the main limitation for high
biomass production rates for the outdoor cultivation of microalgae (Vonshak 1997).
The response of targeted species of microalgae such as coccolithophorids to varying
temperature is also an important consideration when considering the culture of these
algae in closed cultivation systems (Frohlich, et al. 1991, Borowitzka 1996, Carlozzi
and Torzillo 1996). A wide range of optimum temperatures for growth have been
reported for different strains of Emiliania huxleyi (Watabe and Wilbur 1966, Paasche
1968b, Eppley 1972, Goldman 1977, Fisher and Honjo 1988/1989, Conte, et al. 1998,
Paasche 2002). Blankley and Lewin (1976) have also studied the effects of various
temperatures on the specific growth rate of P. carterae, there are no data on the effect of
temperature on other aspects of the physiology and growth of this species.
en the different coccolithophorid species, and even between the two
different strains of E. huxleyi, however biomass productivities of all species were highly
associated with the specific growth rates and increased at higher specific growth rates.
Although it seems obvious that an increase in specific growth rate has to result in higher
productivities, it has been shown for the number of microalgae that higher growth rate
3.6 Discussion
The result reported here indicate different responses of specific growth rates to
temperature betwe
103
can result in smaller cells and thus in no significant increase in the final biomass yield
(Foy 1983, Hall and Scurlock 1993).
Of all species examined in the current study, E. huxleyi CS-369 was the only species
which did not grow at 28oC and this species can therefore not be recommended for
outdoor cultivation where te res can easily rise to over 28oC. chry
grew up to 28oC but this species stuck to the glassware and also showed excessive
clumping of cells and theref o can not be recommended for cult on in eit
closed or open cultivation systems. T ther species tested her ever ha
potential for outdoor culture e of the mperatu tolerance.
The optimum growth temp as de ined in s st , and origin, a
temperature range orig llectio e from which th pecies isolated
p esented in Tabl . The p relatio etween pec origin ts optim
growth temperature has been a subject of ny studies (Paasche 1968b, Eppley 1972,
Goldman and Carpenter 1974, Cloern 1977, Rhee and Gotham 81, Co 19
Grossi, et al. 2000, Larsen, 2001, o, et al 02, sche 2 ). Many
these studies fo a pos orrelat betwee e te eratur nge of
collection site and the optim th tem ture y resu lso indic
a strong association between the origin o e spec nd its temperature toleran
However, the m tenance of the algal stock at a certain temperature in culture
collections for long period of time might eventually lead to selection of clones with
different temperature toleran
Temperature is n e only that affects specific grow rates survival
p ytoplankton (W and 1966, ley 197 oldm 1977 everthele
my data suggest empe s one he majo gnifi t fact hat regul
cellular, morphological, and physiological responses in coccolithophorid
mperatu Pleuro sis sp.
ore als ivati her
he o e how ve
becaus ir te re
erature term thi udy the nd
of the inal co n sit e s was are
r e 15 ossible n b the s ies and i um
ma
nte, et al. 19 98,
et al. . 20Kud Paa 002 of
und itive c ion n th mp e ra the
um laboratory grow pera . M lts a ate
f th ies a ce.
ain
ces.
ot th factor th and of
h atabe Wilbur Epp 2, G an ). N ss,
that t rature i of t r si can ors t ate
s.
104
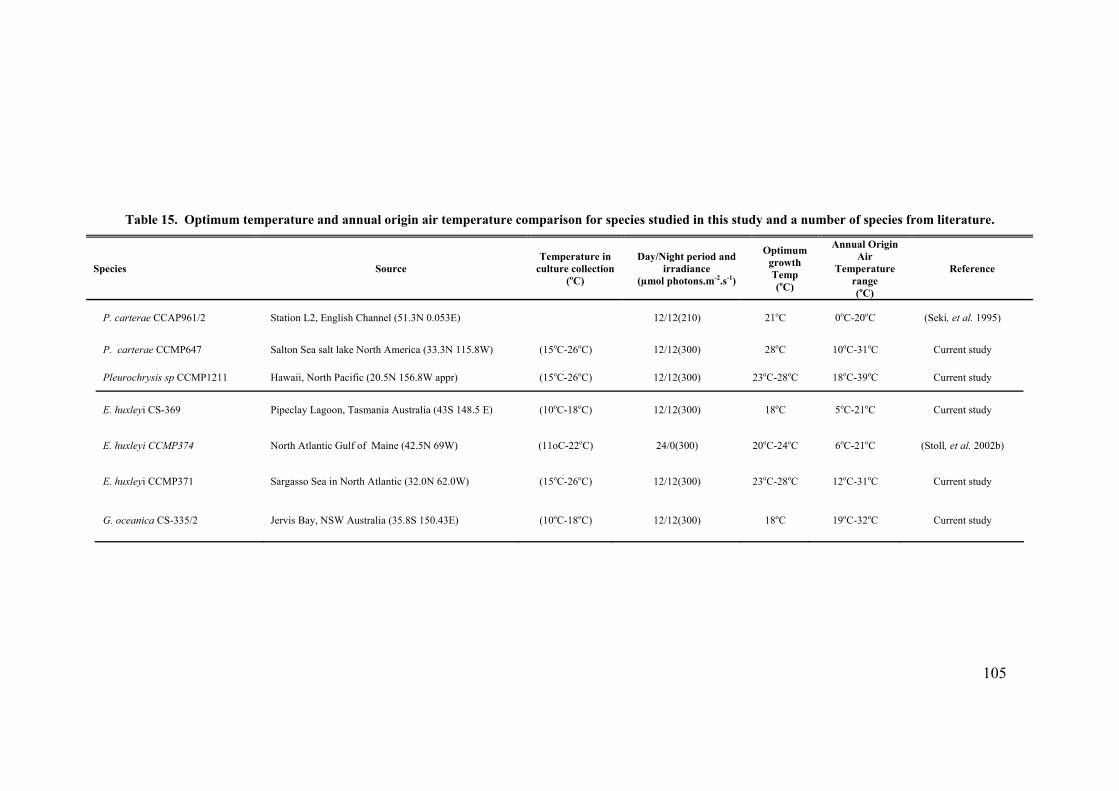
105
er
Refer ce
m m t n annual origin m omparison for spe st tu d m of m lit ature.
pe e in re
(
pe and irradiance
mo o -1)
tio
Te(o
mp re r(
en
Table 15. Opti um te pera ure a d
Species Source
air te perature c
Tem raturcultu collection
cies udied in this s
Day/Night riod
(µ l phot ns.m
dy an a nu ber species fro
Op mum gr wth
mp C)
Annual Origin Air
Te eratuange oC) -2.soC)
P. carterae Station L n 51.3N E) 1 10) oC C-20 (Seki, 19 CCAP961/2 2, E glish Channel ( 0.053 2/12(2 21 0o oC et al. 95)
P. carterae on alt or erica 3N 115. ) - 1 00) oC C- Cur study
Pleurochry CC 21 t 156.8 r) - 1 00) 2 C 18 C- Cur study
E. huxleyi Pipeclay o m ustral 43S 148. ) - 1 00) oC C-21 Cur study
CCMP647 Salt Sea s lake N th Am
sis sp MP1 1 Hawaii, Nor h Pacific (20.5N
CS-369 Lag on, Tas ania A
(33. 8W (15oC 26oC)
W app (15
2/12(3
2/12(3
2/12(3
28 10o 31oC
23
rent
rent
rent
oC 26oC)
ia ( 5 E (10
oC- 8o o 39oC
18 5oC 18oC) o oC
E. huxleyi CCMP37 h ic f (42. ) C- 2 00) 20oC-24 C 6 C-21 Stoll, 20
E. huxleyi CCMP37 a i 32. 0 - 1 00) 23oC-28 C 12 C- Cur study
G. oceanica CS-335 is NSW str 5.8S 1 ) - 1 00) 18oC C- Cur study
4 Nort Atlant Gulf o Maine
1 Sarg sso Sea n North Atlantic (
/2 Jerv Bay, Au alia (3
5N 69W (11o 22oC)
0N 62. W) (15
4/0(3
2/12(3
2/12(3
o o oC ( et al. 02b)
rent
rent
oC 26oC)
50.43E (10
o o 31oC
19oC 18oC) o 32oC
This study also found that temperatures affect both the total amount and CaCO3
deposited and the weight of individual coccoliths. The three key steps involved in
coccolith formation are: cellular uptake of calcium and carbon by cell, synthesis of the
organic matrix on which coccolith is shaped, and nucleation and crystal growth
(Borowitzka 1977, 1982a, Young, et al. 1999). There are no data indicating which of
these may be limiting coccolith formation at different temperatures. Calcification in the
inoflagellate Thoracosphaera heimii has been shown to be inversely related to
t
limiting coccolithophorids calcification al. 2002a, Zondervan, et al. 2002), and
nown th olubility in seawater decreas th sing temper
(Milero 1979). The current study has shown a higher CaCO3 content and CaCO3
productivity as well as greater coccolith production with higher specific growth rates
and that there was no significant relation between the culture temperature and
calcification. Since rates of carbon fixation are comparable to photosynthetic carbon
fixation rates (Purdie and Finch 1994), it follows that coccolithophorid algae should
show higher rates of calcification at the optimum temperature. For example, Watabe
and Wilbur (1966) observed suppression of calcification of E. huxleyi grown at
tures opti m te
d th ssion an sence of calcification in cells which at
tem ould preferen incr n c tution ak
ing ity to urr data not p it to ngui betw
ani
mparison cocc ts
garithmic phase are shown in Table 16. The results show an inverse correlation
between coccolith weight and specific growth rate in P. carterae and Pleurochrysis. sp.
d
emperature (Karwath, et al. 2002). The availability of inorganic carbon also can be
(Stoll, et
at the s of CO2 es wi increa ature it is k
tempera above and below the mu mperature. Paasche (1968b, 2002)
explaine is suppre as either ab
optimum perature w calcify, or a tial ease i onsti ally n ed
cells lack the capac calcify. C ent do erm disti sh een
two mech sms.
Co between olith weigh for species grown in current study during
lo
106
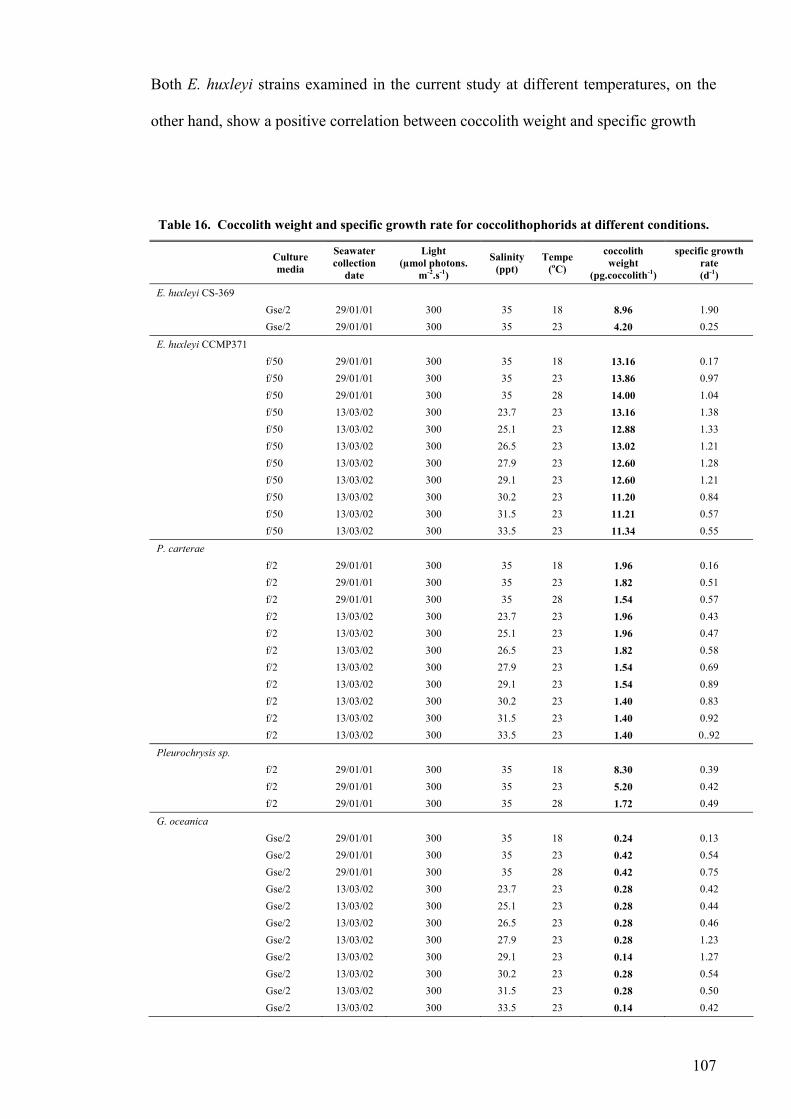
Both E. huxleyi strains examined in the current study at different temperatures, on the
other hand, show a positive correlation between coccolith weight and specific growth
Table 16. Coccolith weight and specific growth rate for coccolithophorids at different conditions.
Culture media collection
date (µmol photons.
m
Seawater Light coccolith specific growth
-2.s-1)
Salinity (ppt)
Tempe (oC) weight
(pg.coccolith-1) rate (d-1)
E. huxleyi CS-369 Gse/2 29/01/01 300 35 18 8.96 1.90 Gse/2 29/01/01 300 35 23 4.20 0.25
E. huxleyi CCMP371 f/50 29/01/01 300 35 18 13.16 0.17
f/50 29/01/01 300 35 28 14.00 1.04
f/50 13/03/02 300 25.1 23 12.88 1.33
300 29.1 23 12.60 1.21 300 30.2 23 11.20 0.84
f/50 13/03/02 300 31.5 23 11.21 0.57
f/50 29/01/01 300 35 23 13.86 0.97
f/50 13/03/02 300 23.7 23 13.16 1.38
f/50 13/03/02 300 26.5 23 13.02 1.21 f/50 13/03/02 300 27.9 23 12.60 1.28 f/50 13/03/02 f/50 13/03/02
f/50 13/03/02 300 33.5 23 11.34 0.55
P. carterae f/2 29/01/01 300 35 18 1.96 0.16 f/2 29/01/01 300 35 23 1.82 0.51 f/2 29/01/01 300 35 28 1.54 0.57 f/2 13/03/02 300 23.7 23 1.96 0.43
f/2 13/03/02 300 26.5 23 1.82 0.58
f/2 13/03/02 300 29.1 23 1.54 0.89
f/2 13/03/02 300 31.5 23 1.40 0.92 f/2 13/03/02 300 33.5 23 1.40 0..92
Pleurochrysis sp.
f/2 13/03/02 300 25.1 23 1.96 0.47
f/2 13/03/02 300 27.9 23 1.54 0.69
f/2 13/03/02 300 30.2 23 1.40 0.83
f/2 29/01/01 300 35 18 8.30 0.39 f/2 29/01/01 300 35 23 5.20 0.42 f/2 29/01/01 300 35 28 1.72 0.49
G. oceanica
Gse/2 29/01/01 300 35 18 0.24 0.13
Gse/2 29/01/01 300 35 23 0.42 0.54
Gse/2 13/03/02 300 23.7 23 0.28 0.42
Gse/2 13/03/02 300 26.5 23 0.28 0.46
Gse/2 13/03/02 300 29.1 23 0.14 1.27 Gse/2 13/03/02 300 30.2 23 0.28 0.54
Gse/2 13/03/02 300 31.5 23 0.28 0.50
Gse/2 13/03/02 300 33.5 23 0.14 0.42
Gse/2 29/01/01 300 35 28 0.42 0.75
Gse/2 13/03/02 300 25.1 23 0.28 0.44
Gse/2 13/03/02 300 27.9 23 0.28 1.23
107
rate. No correlation was found between coccolith weight and specific growth rate in G.
oceanica. Watabe and Wilbur (1966) also found a decrease in coccolith dimensions at
temperatures higher or lower than the optimum for growth.
The salinity range tolerated by coccolithophorid algae is highly correlated with the
origin of collection of the culture with a higher tolerance to the lower salinities obvious
in coastal species, while oceanic species grow better in the higher salinities Table 17.
The species investigated in this study did not appear to have a single optimal salinity for
growth. Instead, growth was about the same over a broad range from 29.1 ppt to 33.1
ppt for P. carterae, 23.7 ppt to 29.1 ppt for E. huxleyi, and 27.9 ppt to 29.1 ppt for
Cell volume was also found to decrease with increasing temperature in all species;
however cell volume was inversely correlated to specific growth rates. It seems that in
these species cell size and volume are more related to optimum specific growth rates
than temperature. Cell volume decreased between log and stationary phase in current
study in all species except P. carterae.
G.
oceanica. These results will provide a basis for monitoring and management of any
future large-scale cultivation of these coccolithophorids.
Cell volume was found to be positively correlated with the specific growth rate at the
different salinities tested for each species. Coccolith weights in all species in our study
also decreased with increasing salinity. Green (1998) also reported a decrease in the
dimensions of coccolith with increasing salinity. This could possibly be the result of
more Ci and energy required for synthesis of organic osmolytes at the higher salinities
thus decreasing the rate of calcification. However, the possibility of a direct salinity
effect on calcification cannot be excluded.
108
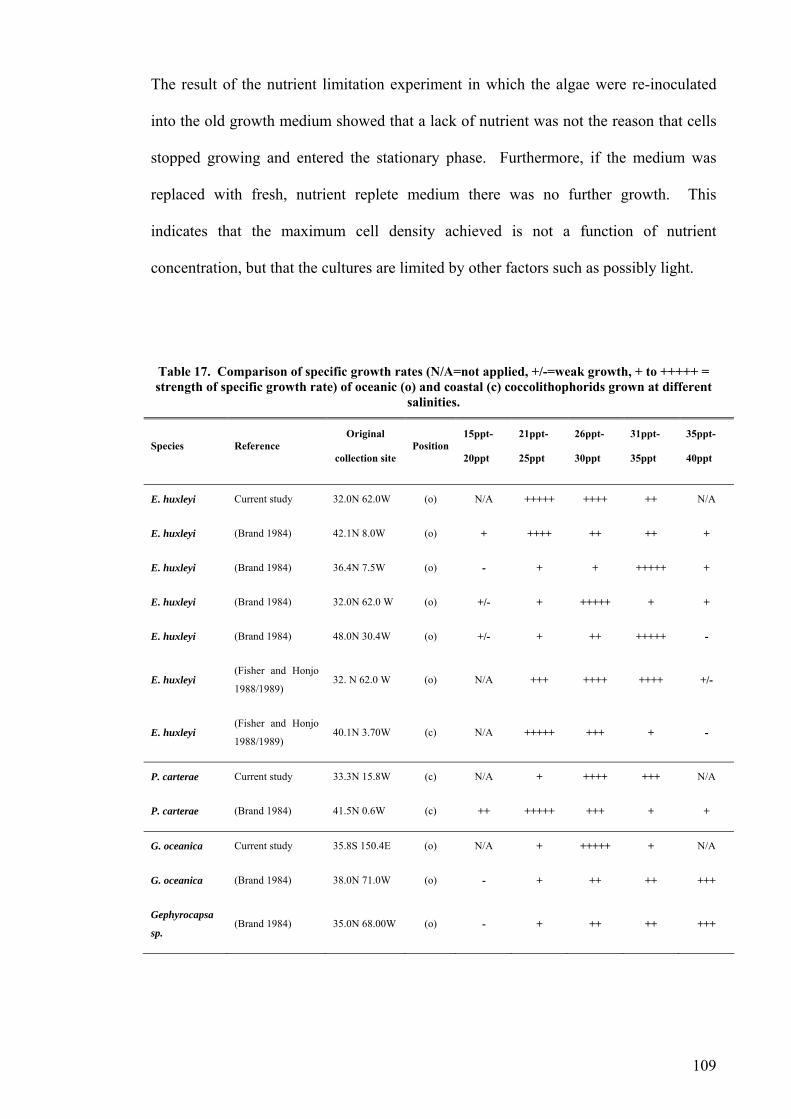
The result of the nutrient limitatio hich the algae were re-inoculated
into the old growth m the reason that cells
stopped growing and entered the stationary phase. Furthermore, if the medium was
replaced with fresh, nutrient replete medium there was no further growth. This
indicates that the maximum cell density achieved is not a function of nutrient
strength of specific growth rate) of oceanic (o) and coastal (c) coccolithophorids grown at different
collection site 20ppt 25ppt 30ppt 35ppt 40ppt
n experiment in w
edium showed that a lack of nutrient was not
concentration, but that the cultures are limited by other factors such as possibly light.
Table 17. Comparison of specific growth rates (N/A=not applied, +/-=weak growth, + to +++++ =
salinities.
Species Reference Original
Position 15ppt- 21ppt- 26ppt- 31ppt- 35ppt-
E. huxleyi Current study 32.0N 62.0W (o) N/A +++++ ++++ ++ N/A
E. huxleyi (Brand 1984) 42.1N 8.0W (o) + ++++ ++ ++ +
E. huxleyi (Brand 1984) 36.4N 7.5W (o) - + + +++++ +
E. huxleyi 32.0N 62.0 W (o) +/- + +++++ + +
E. huxleyi 40.1N 3.70W (c) N/A +++++ +++ + -
(Brand 1984)
E. huxleyi (Brand 1984) 48.0N 30.4W (o) +/- + ++ +++++ -
E. huxleyi (Fisher and Honjo
1988/1989) 32. N 62.0 W (o) N/A +++ ++++ ++++ +/-
(Fisher and Honjo
1988/1989)
P. carterae Current study 33.3N 15.8W (c) N/A + ++++ +++ N/A
P. carterae (Brand 1984) 41.5N 0.6W (c) ++ +++++ +++ + +
G. oceanica Current study 35.8S 150.4E (o) N/A + +++++ + N/A
G. oceanica (Brand 1984) 38.0N 71.0W (o) - + ++ ++ +++
Gephyrocapsa
sp. (Brand 1984) 35.0N 68.00W (o) - + ++ ++ +++
109
In the temperature experiment the pH of the culture media increased significantly during
the logarithmic phase in P. carterae and Pleurochrysis sp. while in E. huxleyi no
significant increase in pH was observed. Crenshaw (1964) found the same pattern in
pH shift in his cultures of P. carterae and E. huxleyi. In both studies, all the examined
species were actively producing coccoliths through their growth. As previously noted
(page15), bicarbonate is the prime inorganic carbon (Ci) source for calcification in
Emiliania huxleyi, while the question of “what is the actual Ci source in calcification of
Pleurochrysis sp” haw (1964) concluded CO2 as the
cytoplasmic bica es et al (1982)
demonstrated the possible use of external bicarbonate in calcification of P. carterae in
high calcified spe r, could not detect the Ci source of
calcification in low
is released during the production of calcium carbonate from
bicarbonate. The currently accepted model for E. huxleyi (Figure 10) and uptake of
bicarbonate by this species can explain why there is no significant pH change during the
growth of E. huxleyi. This model, on the other hand, can not account for the pH shifts
observed in P. carterae cultures during actinic growth.
My results do not permit me to make a conclusive proposition for the differences
between E. huxleyi and P. carterae; however my results suggest the high possibility of
CO2 as the main source of Ci in P. carterae because of the observed increase in pH
(Equation 2). Israel and Gonzales (1996) also found the same pattern in pH during the
growth of P. carterae and also suggested that this alga uses CO2. There are two
possible scenarios explaining why the pH of the culture medium increases in cultures of
P. carterae. The first possible explanation is in the situation in which P. carterae cells
still remains unsolved. Crens
rbonate source for calcification, whereas Sik
cies. Sikes et al (1982), howeve
calcified P. carterae.
Carbon dioxide, on the other hand, is the prime carbon source for photosynthesis.
Based on the carbon models for calcification and photosynthesis reviewed in Chapter 1,
one carbon dioxide
110
can actively transport bicarbonate. , if cells use bicarbonate for both
calcification and photosynthesis, then the only way to increase the external medium pH
is an ionic imbalance in the calcification/photosynthesis ratio where the cells
photosynthesising significantly more than then calcifying resulting in the production of
OH- from bicarbonate conversion to CO during photosynthesis than H+ production
during calcification from the second bicarbonate. This excess OH- would then be
xcreted. In the second scenario, P. carterae has no active transport system for external
bicarbonate. In this case both ca 2 dependent.
Since the pH of the medium increases to pH 9.5 and higher resulting in low soluble
[CO2], a CAext must play an important role in bicarbonate conversion providing CO2 for
both calcification and photosynthesis. Further studies of the Ci source for
photosynthesis and calcification in P. carterae and also other coccolithophorids would
be necessary to resolve this question. However, these findings indicate physiological
differences between various strains of coccolithophorids in calcification, inorganic C
usage and the relation between these and photosynthesis.
In this case
2
e
lcification and photosynthesis are CO
111
CHAPTER 4
4.1 Introduction
Almost all commercial microalgal culture systems in use today are open systems.
Essentially, these open systems are shallow ponds, mixed or not mixed, each covering a
large area of up to hundreds of hectares (Borowitzka 2005). A major weakness of open
ond systems is the relatively long light-path which requires maintenance of relatively
dilu res
also create problems with harvesting the algal biom , et al. 2003). Other
d advantages of pen sys are th re adily and
h on o apo ing y se mond 1992). These
f mit th e of ds f lture rts of edici
and Materassi 1992).
Further commercial exploitation of microalgae requires more effective, inexpensive and
controllable algal biomass production systems (Benemann, et al. 1987). Closed
photobioreactors f almost all the
uch as Borowitzka
(1996), Hai et al. (2000) Janssen et al. (2002), and Masojidek et al. (2003). The main
CLOSED PHOTOBIOREACTORS
p
te cultures, and a high risk of contamination (Borowitzka 1999a). Dilute cultu
ass (Moreno
is o tems a tut tempera ca rennot be controlled,
igh diluti r ev ration dur rain or dr asons (Rich
eatures li e us open pon or algae cu in many pa world (Tr
are characterized by the regulation and control o
physical and chemically important parameters (Ratchford and Fallowfield 1992,
Borowitzka 1996). Reduced contamination risk, reproducible cultivation conditions,
less CO2 losses, controllable hydrodynamics and temperature, and flexible design are all
fundamental benefits of closed photobioreactors compared to open systems (Pulz 2001).
In recent years research on efficient closed photobioreactors has increased and various
devices and structures have been developed by many researchers s
112
aim of research on various types of closed photobioreactors is to maximise algal growth
rates for an extended and sustained time period (Richmond, et al. 1993).
Based on the optimization results reported in the previous chapter, Pleurochrysis
carterae CCMP647, Emiliania huxleyi CCMP371, and Gephyrocapsa oceanica
CSIRO335/2 were grown in four different closed photobioreactors. The
photobioreactors tested were:
(a) a flat plate photobioreactor,
(b) a concentric draught-tube internal loop airlift,
(c) Stirred aerated carboys, and
ain aim of this chapter is to evaluate the closed photobioreactors for the culture
(d) a tubular photobioreactor of the Biocoil design.
The m
coccolithophorid algae. This could potentially lead to future large-scale outdoor closed
cultivation systems.
113
4.2 Results
Pleurochrysis carterae CCMP647, Emiliania huxleyi CCMP371, and Gephyrocapsa
ceanica CSIRO335/2 were grown in different closed photobioreactors under controlled
light and temperature. Growth conditions (i.e. light irradiance, temperature and mixing)
in each photobioreactor were a
Plate eac
A ecies ew i pla orea e 31). the
photobioreactors were operated in batch mode, however at the end of the log phase of
growth a ica, the
3
ces were statistically significant (F2, 44 = 79.29, F2, 44 =
105.02, and F2, 44 = 2068.33 for total dry weight, lipid, and CaCO3 productivities
respectively, P < 0.05). The mean lipid content was 22.5 ± 0.9% of total dry weight
for P. carterae and 18 ± and G. oceanica. Mean
tal CaCO3 content was 11.5 ± 1.0% and 12.1.± 0.6% of total dry weight in P. carterae
and E. huxleyi respectively and only 1.2 ± 0.04% in G. oceanica. Gephyrocapsa
o
s listed in Chapter 2.
4.2.1 photobior tor
ll three sp gr n the 6 L te photobi ctor (Figur Initially
t day 4 for P. carterae and E. huxleyi and day 7 for G. ocean
photobioreactors were operated as semicontinuous cultures based on 95% of the
maximum cell concentration for each species. The maximum cell concentrations
reached were 4.1 x 10⁵ cells.mL-1 for P. carterae, 5.9 x 10⁵ cells.mL-1 for E. huxleyi,
and 2.4 x 10⁵ cells.mL-1 for G. oceanica.
Emiliania huxleyi was found to have the highest specific growth rate followed by P.
carterae and with G. oceanica having a much lower specific growth rate (Figure 31b
and Table 18). Pleurochrysis carterae, on the other hand, showed the highest total dry
weight, lipid, and CaCO productivities and followed by E. huxleyi and G. oceanica
(Table 18) and these differen
0.1% of total dry weight in E. huxleyi
to
114
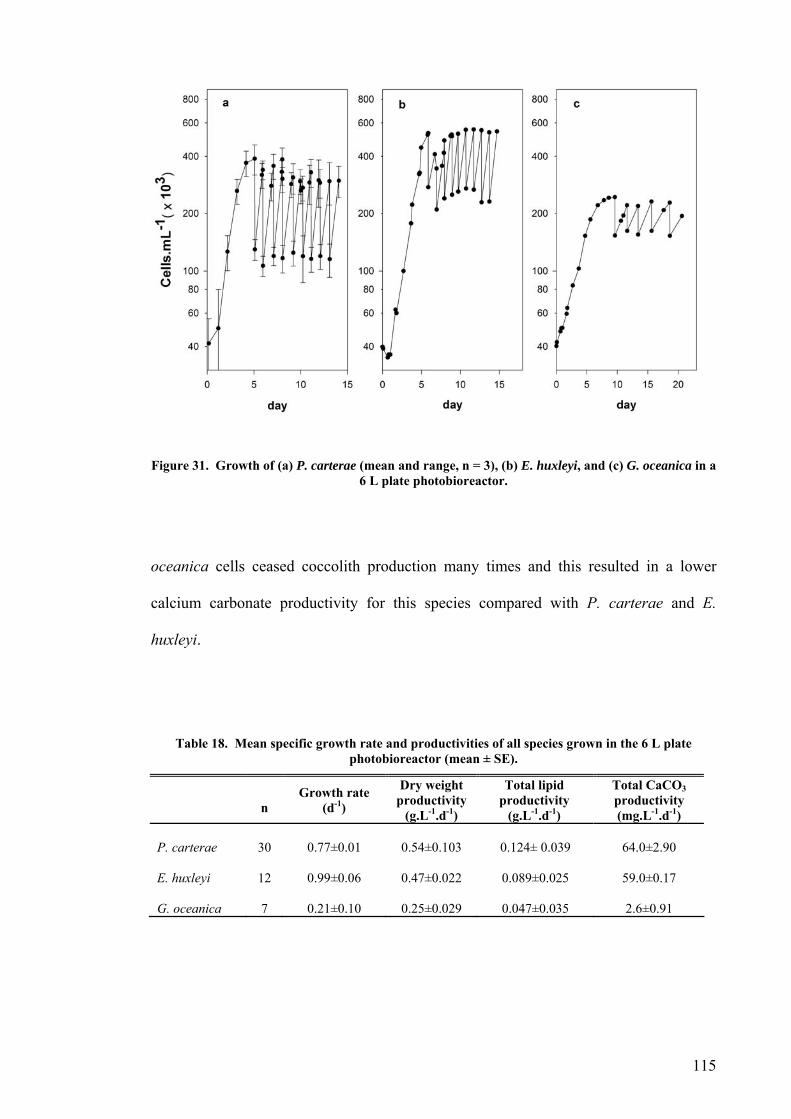
Figure 31. Growth of (a) P. carterae (mean and r 3), (b) E. huxleyi, and (c) G. oceanica in a 6 L pl ctor.
-1 productivity productivity productivity
ange, n = ate photobiorea
oceanica cells ceased coccolith production many times and this resulted in a lower
calcium carbonate productivity for this species compared with P. carterae and E.
huxleyi.
Table 18. Mean specific growth rate and productivities of all species grown in the 6 L plate photobioreactor (mean ± SE).
n
Growth rate (d )
Dry weight
(g.L-1.d-1)
Total lipid
(g.L-1.d-1)
Total CaCO3
(mg.L-1.d-1)
P. carterae 30 0.77±0.01 0.54±0.103 0.124± 0.039 64.0±2.90
E. huxleyi
12 0.99±0.06 0.47±0.022 0.089±0.025 59.0±0.17
G. oceanica
7 0.21±0.10 0.25±0.029 0.047±0.035 2.6±0.91
115
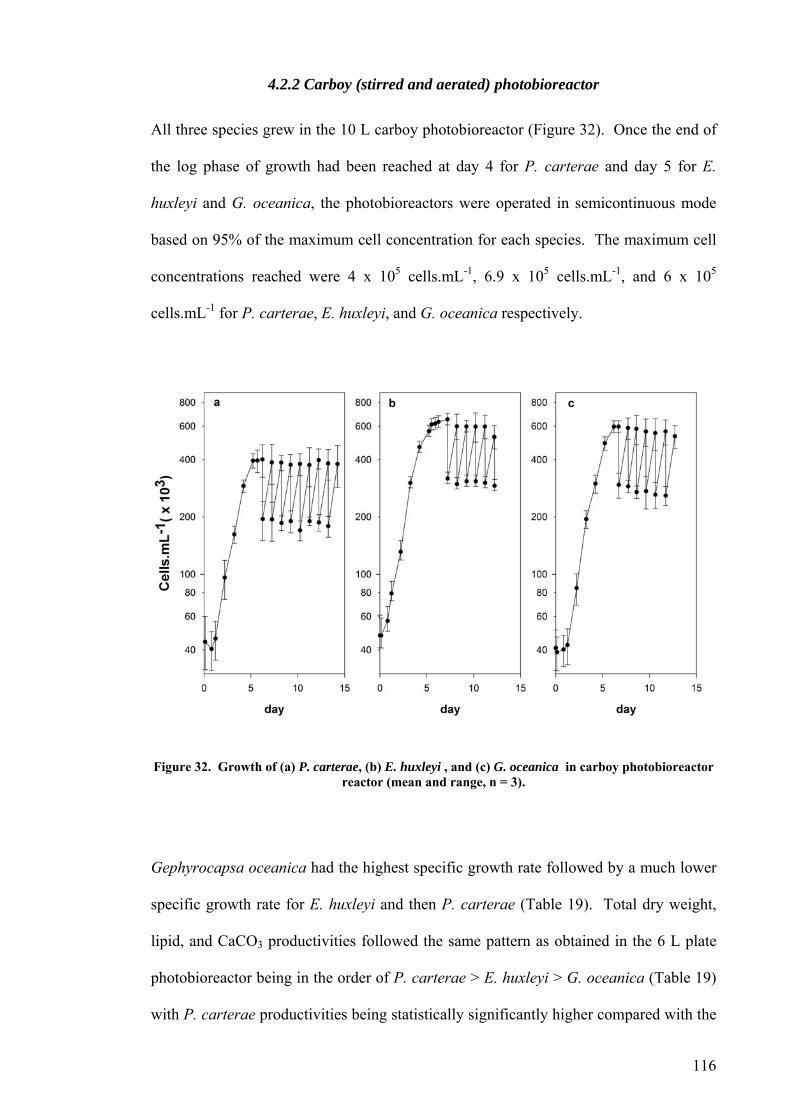
4.2.2 Carboy (stirred and aerated) photobioreactor
All three species grew in the 10 L carboy photobioreactor (Figure 32). Once the end of
the log phase of growth had been reached at day 4 for P. carterae and day 5 for E.
huxleyi and G. oceanica, the photobioreactors were operated in semicontinuous mode
based on 95% of the maximum cell concentration for each species. The maximum cell
concentrations reached were 4 x 10⁵ cells.mL-1, 6.9 x 10⁵ cells.mL-1, and 6 x 10⁵
cells.mL-1 for P. carterae, E. huxleyi, and G. oceanica respectively.
Figure 32. Growth of (a) P. carterae, (b) E. huxleyi , and (c) G. oceanica in carboy photobioreactor reactor (mean and range, n = 3).
Gephyrocapsa oceanica had the highest specific growth rate followed by a much lower
specific growth rate for E. huxleyi and then P. carterae (Table 19). Total dry weight,
lipid, and CaCO3 productivities followed the same pattern as obtained in the 6 L plate
hotobioreactor being in the order of P. carterae > E. huxleyi > G. oceanica (Table 19)
with P. carterae productivities being statistically significantly higher compared with the
p
116
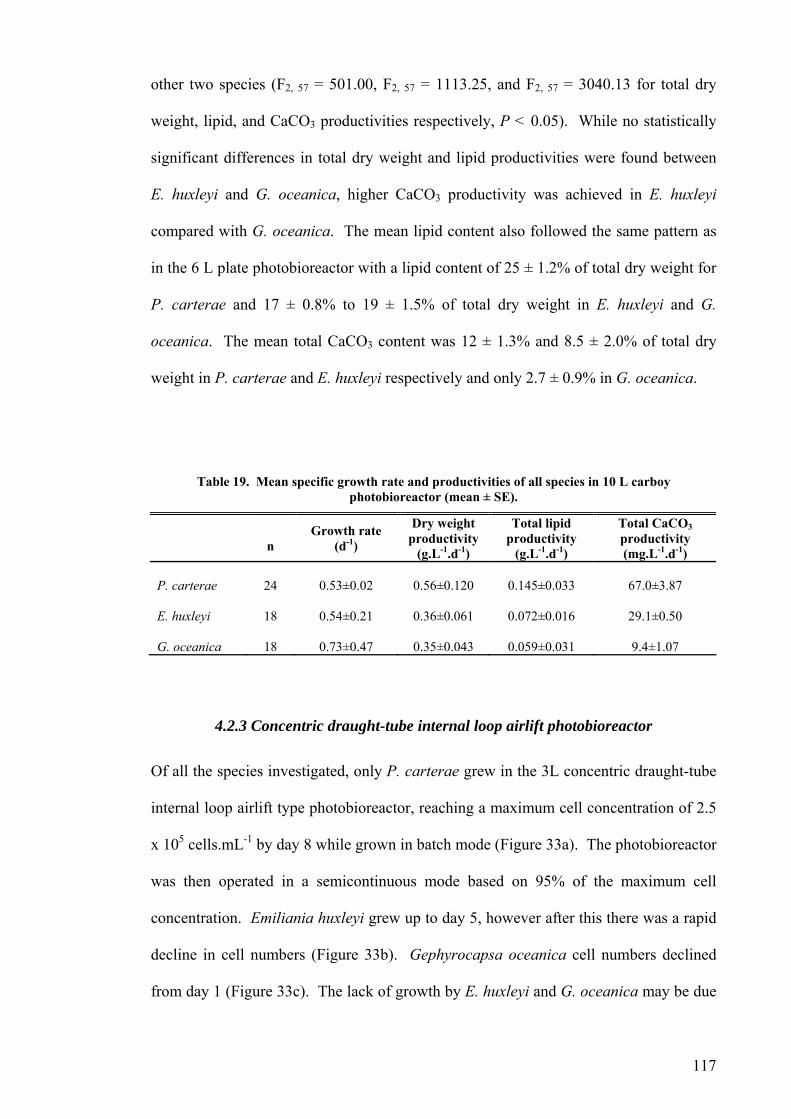
o
eight, lipid, and CaCO3 productivities respectively, P < 0.05). While no statistically
significant differences in total dry weight and lipid productivities were found between
3
P. carterae and 17 ± 0.8% to 19 ± 1.5% of total dry weight in E. huxleyi and G.
oceanica. The mean total CaCO3 content was 12 ± 1.3% and 8.5 ± 2.0% of total dry
weight in P. carterae and E. huxleyi respectively and only 2.7 ± 0.9% in G. oceanica.
Table 19. Mean specific growth rate and productivities of all species in 10 L carboy
n (g.L-1.d-1) (g.L-1.d-1) productivity (mg.L-1.d-1)
ther two species (F2, 57 = 501.00, F2, 57 = 1113.25, and F2, 57 = 3040.13 for total dry
w
E. huxleyi and G. oceanica, higher CaCO productivity was achieved in E. huxleyi
compared with G. oceanica. The mean lipid content also followed the same pattern as
in the 6 L plate photobioreactor with a lipid content of 25 ± 1.2% of total dry weight for
photobioreactor (mean ± SE).
Growth rate (d-1)
Dry weight productivity
Total lipid productivity
Total CaCO 3
P. carterae
24 0.53±0.02 0.56±0.120 0.145±0.033 67.0±3.87
E. huxleyi
18 0.54±0.21 0.36±0.061 0.072±0.016 29.1±0.50
G. oceanica
18 0.73±0.47 0.35±0.043 0.059±0.031 9.4±1.07
Of all the species investigated, only P. carterae grew in the 3L concentric draught-tube
internal loop airlift type photobioreactor, reaching a maximum cell concentration of 2.5
x 10
4.2.3 Concentric draught-tube internal loop airlift photobioreactor
xleyi and G. oceanica may be due
5 cells.mL-1 by day 8 while grown in batch mode (Figure 33a). The photobioreactor
was then operated in a semicontinuous mode based on 95% of the maximum cell
concentration. Emiliania huxleyi grew up to day 5, however after this there was a rapid
decline in cell numbers (Figure 33b). Gephyrocapsa oceanica cell numbers declined
from day 1 (Figure 33c). The lack of growth by E. hu
117

to the higher shear produced in this type of airlift photobioreactor compared to the plate
and carboy photobioreactors.
Figure 33. Growth of (a) P. carterae, (b) E. huxleyi , and (c) G. oceanica in a CDT airlift photobioreactor (mean and range, n = 3).
il
ean specific growth rate during the semicontinuous phase for P. carterae is
shown in Table 20 together with the mean total dry weight, lipid and CaCO3
e mean lipid and CaCO3 contents were 23 ± 2.4% and 12 ± 1.8% of
n (d-1)
The m
productivities. Th
the total dry weight productivity respectively.
Table 20. Mean specific growth rate and productivities of P. carterae grown in concentric draught-tube internal loop airlift photobioreactor (mean ± SE).
Growth rate Dry weight productivity
(g.L-1.d-1)
Total lipid productivity
(g.L-1.d-1)
Total CaCO3 productivity (mg.L-1.d-1)
P. carterae
27 0.46±0.169 0.39±0.104 0.091±0.011 48±1.99
118
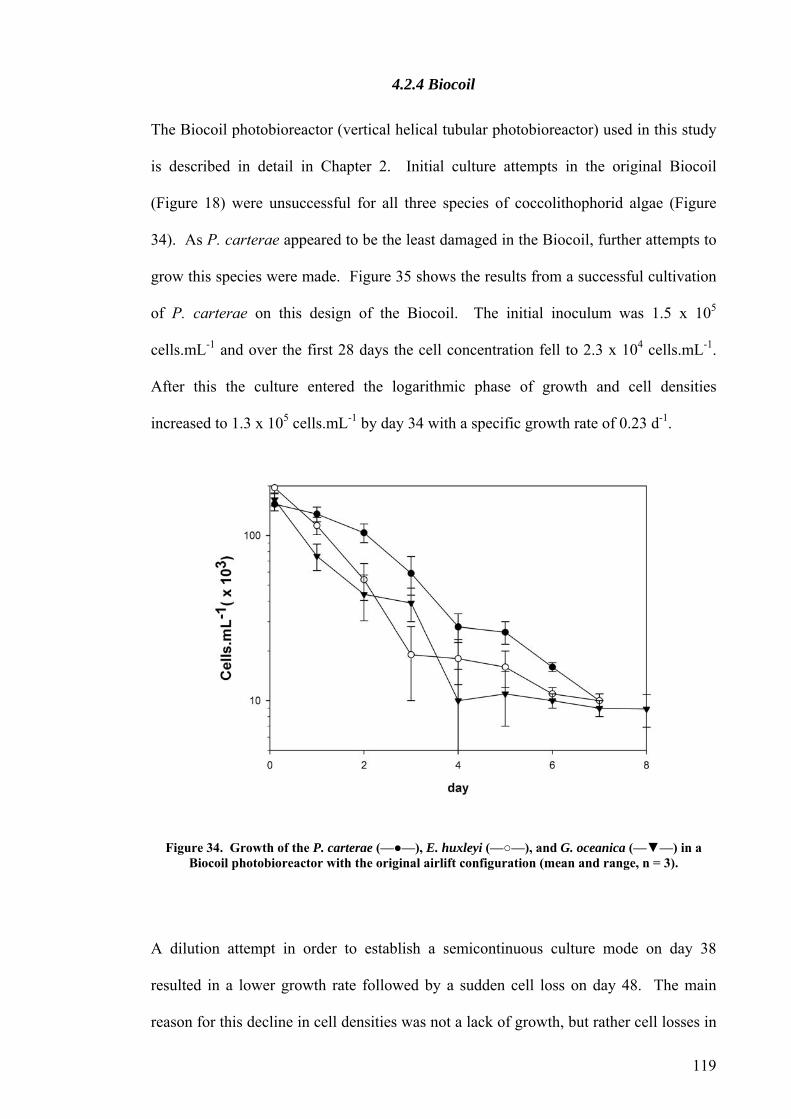
4.2.4 Biocoil
The Biocoil photobioreactor (vertical helical tubular photobioreactor) used in this study
is described in detail in Chapter 2. Initial culture attempts in the original Biocoil
(Figure 18) were unsuccessful for all three species of coccolithophorid algae (Figure
34). As P. carterae appeared to be the least damaged in the Biocoil, further attempts to
grow this species were made. Figure 35 shows the results from a successful cultivation
of P. carterae on this design of the Biocoil. The initial inoculum was 1.5 x 10⁵
cells.mL-1 and over the first 28 days the cell concentration fell to 2.3 x 10⁴ cells.mL-1.
After this the culture entered the logarithmic phase of growth and cell densities
increased to 1.3 x 10⁵ cells.mL-1 by day 34 with a specific growth rate of 0.23 d-1.
Figure 34. Growth of the P. carterae (—●—), E. huxleyi (—○—), and G. oceanica (—▼—) in a Biocoil photobioreactor with the original airlift configuration (mean and range, n = 3).
A dilution a
ttempt in order to establish a semicontinuous culture mode on day 38
resulted in a lower growth rate followed by a sudden cell loss on day 48. The main
reason for this decline in cell densities was not a lack of growth, but rather cell losses in
119
the head of the airlift part of the Biocoil, as well as settling of the cells in the
red normal
for the first 12 hours of growth (Figure 36a) followed by a heavy loss of coccosphere
illuminated part (coil) of the reactor. In addition, high shear produced by the flow
regime seems to have damaged the cells thus inhibiting their growth. Microscopic
observation of the P. carterae cells showed that many cells had lost their coccosphere
and many others also appeared damaged. Pleurochrysis carterae cells appea
during the next 3 days (Figure 36b) and a high level of clumping of cells thereafter
(Figure 36c).
Figure 35. Growth curve of the best culture of P. carterae achieved in the Biocoil photobioreactor with the original airlift configuration (airlift design I).
In order to overcome the problems identified with the airlift, a number of modifications
in design of the airlift and the sparger part of the airlift were tested in an attempt to
reduce the level of shear and cell damage. Four airlift design modifications were tested:
120

Figure 36. Light micrograph of Pleurochrysis carterae grown in the Biocoil photobioreactor. (a) Healthy cell with intact coccosphere inoculated into the Biocoil, (b) cell without a coccolith cover
and (c) cell clump with cells having lost their coccosphere.
Airlift design I.
The total operating volume of this design was 37 L with a light to dark volume ratio of
approximately 1.2 operated with a volumetric flow rate of 0.06 m.s
In all cases cell numbers declined within the first 2 to 3 days leading to a loss of the
d
l
-1. Three sparger
designs were tested in order to reduce cell damage and improve flow rate: (1) a
punctured plate with 21 x 1 mm diameter holes (sparger design I), (2) a punctured plate
with 9 x 2 mm diameter holes (sparger design II), and (3) a perforated pipe with 17 x 1
mm diameter holes (sparger design III). No other major changes were made to the
existing airlift design (airlift design I) as shown in Figure 37. Repeated hammering on
the PVC coil proved to be the most successful way to reduce cell settling in the
photostage coil and cell clumping and periodic reversal of the flow obtained also
decreased sticking of the cells to the wall of the coil.
culture, with less than 1 x 10³ cells.mL-1 remaining after 7-9 days (Figure 38). The
maximum pH recorded daily at 12:00 noon, ropped from pH 10 ± 0.5 on the first day
to pH 7.6 ± 0.1 by day 9. Sparger design II appeared to produce the least stress on the
P. carterae cells and they survived for longer compared to the other two sparger
designs. This sparger design was therefore used in the other air ift designs tested.
121
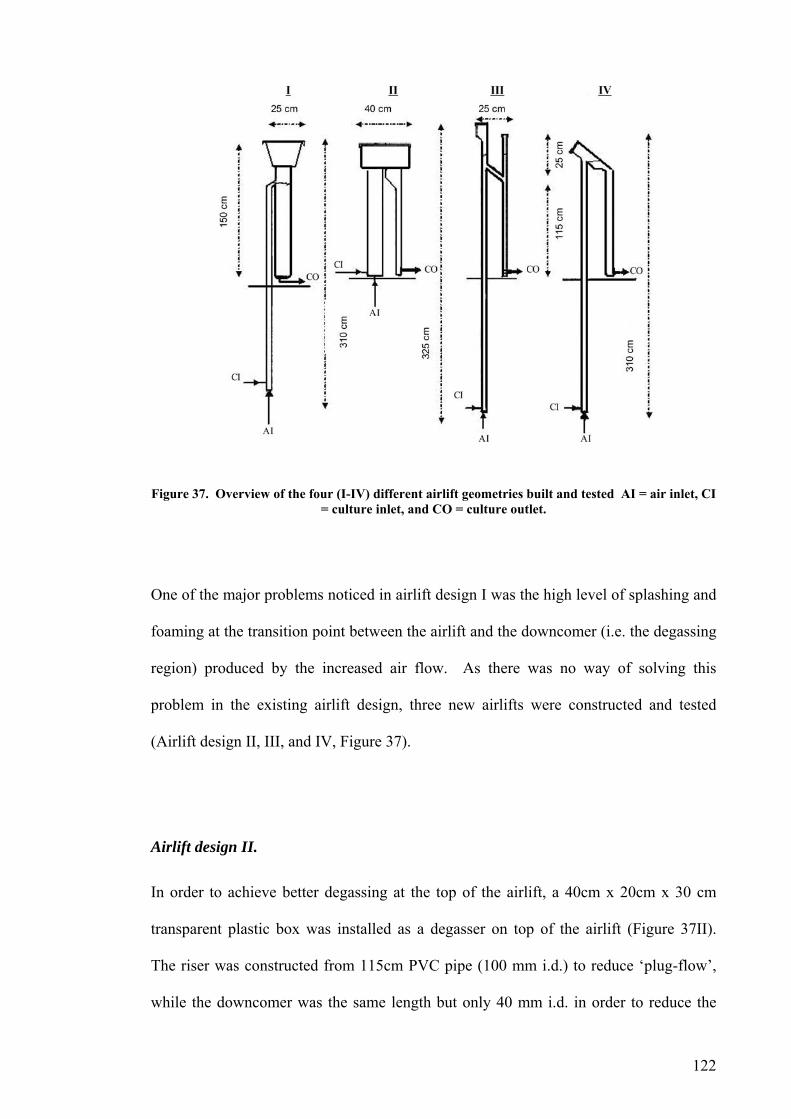
Figure 37. Overview of the four (I-IV) different airlift geometries built and tested AI = air inlet, CI = culture inlet, and CO = culture outlet.
One of the major problems noticed in airlift design I was the high level of splashing and
foaming at the transition point between the airlift and the downcomer (i.e. the degassing
region) produced by the increased air flow. As there was no way of solving this
problem in the existing air
lift design, three new airlifts were constructed and tested
(Airlift design II, III, and IV, Figure 37).
Airlift design II.
In order to achieve better degassing at the top of the airlift, a 40cm x 20cm x 30 cm
transparent plastic box was installed as a degasser on top of the airlift (Figure 37II).
The riser was constructed from 115cm PVC pipe (100 mm i.d.) to reduce ‘plug-flow’,
while the downcomer was the same length but only 40 mm i.d. in order to reduce the
122
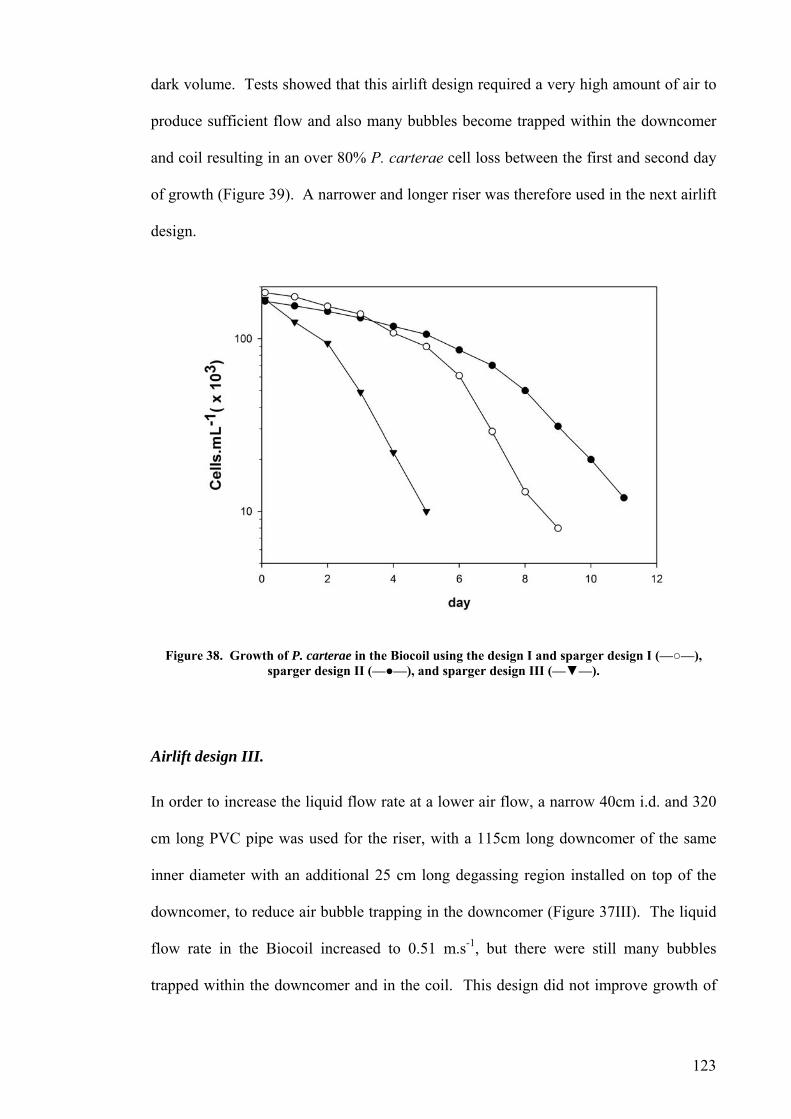
dark volume. Tests showed that this airlift design required a very high amount of air to
produce sufficient flow and also many bubbles become trapped within the downcomer
and coil resulting in an over 80% P. carterae cell loss between the first and second day
of growth (Figure 39). A narrower and longer riser was therefore used in the next airlift
design.
Figure 38. Growth of P. carterae in the Biocoil using the design I and sparger design I (—○—), sparger design II (—●—), and sparger design III (—▼—).
Airlift design III.
In order to increase the liquid flow rate at a lower air flow, a narrow 40cm i.d. and 320
cm long PVC pipe was used for the riser, with a 115cm long downcomer of the same
inner diameter with an additional 25 cm long degassing region installed on top of the
downcomer, to reduce air bubble trapping in the downcomer (Figure 37III). The liquid
flow rate in the Biocoil increased to 0.51 m.s-1, but there were still many bubbles
trapped within the downcomer and in the coil. This design did not improve growth of
123
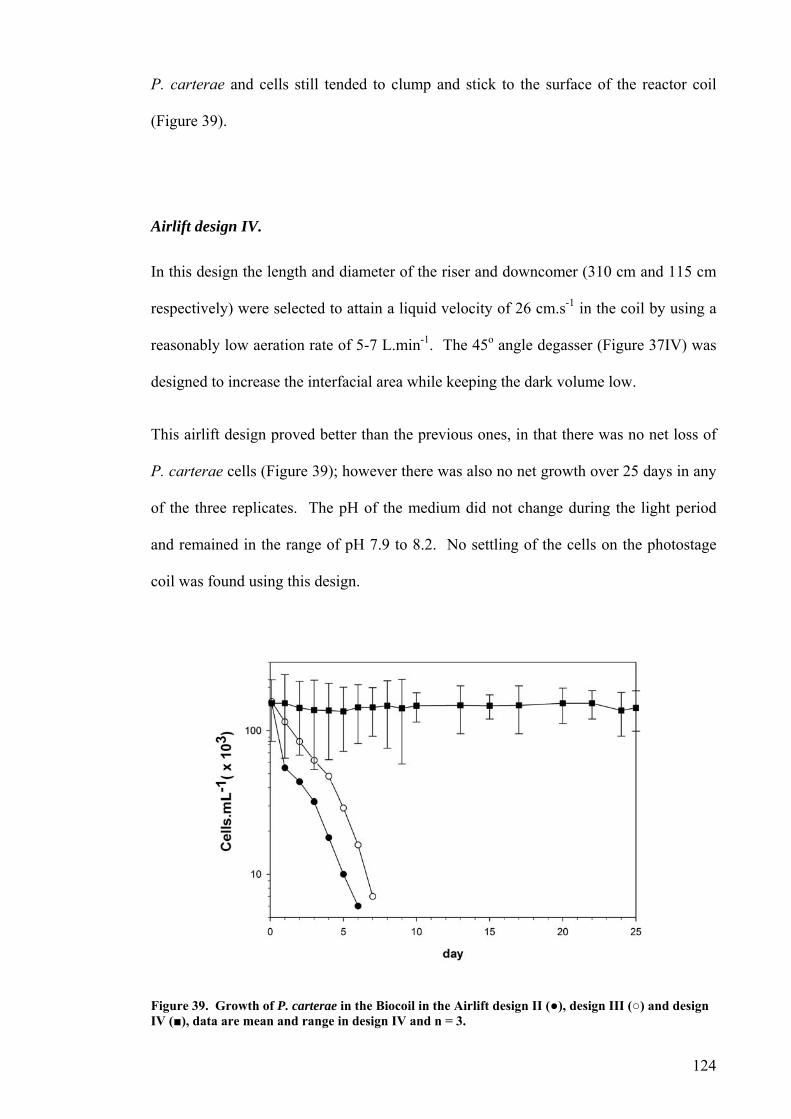
P. carterae and cells still tended to clump and stick to the surface of the reactor coil
(Figure 39).
Airlift design IV.
In this design the length and diameter of the riser and downcomer (310 cm and 115 cm
respectively) were selected to attain a liquid velocity of 26 cm.s
This airlift design proved better than the previous ones, in that there was no net loss of
P. carterae cells (Figure 39); however there was also no net growth over 25 days in any
-1 in the coil by using a
reasonably low aeration rate of 5-7 L.min-1. The 45o angle degasser (Figure 37IV) was
designed to increase the interfacial area while keeping the dark volume low.
of the three replicates. The pH of the medium did not change during the light period
and remained in the range of pH 7.9 to 8.2. No settling of the cells on the photostage
coil was found using this design.
Figure 39. Growth of P. carterae in the Biocoil in the Airlift design II (●), design III (○) and design IV (■), data are mean and range in design IV and n = 3.
124
Adding 1-2 mL.d-1 of olive oil as an anti-foam agent was found to significantly decrease
the foaming in the degasser, resulting in less cell loss. The olive oil also flushed the
small air bubbles coalesced in the coil. Preliminary results indicated no significant
effect of this concentration of olive oil on the growth of P. carterae grown in batch
culture mode in 100 mL f/2 culture medium at 20oC and 100 µmol photons.m-2.s-1 (data
not shown).
4.3 Discussion
aling up and have been used for a range of
either indoor or outdoor micro-algal cultivation (see page 52). Chlorella sp. and
Scenedemesmus sp. have been successfully cultured in plate photobioreactors and in
both cases the biomass yields and growth rates were higher for this type of
photobioreactor when compared to conventional culture systems (Ratchford and
Fallowfield 1992). Other species of microalgae such as Spirulina platensis,
Chlorococcum littorale, Isochrysis sp., and Porphyridium sp. have also been
successfully grown in plate photobioreactors (Hu, et al. 1998, Singh, et al. 2000, Liu
and Lin 2001, Richmond and Wu 2001, Zhang, et al. 2001, Zhang, et al. 2002). Qiang
and colleagues (1998) reported approximately 50 fold higher yields of Spirulina
platensis grown in a 14 L controlled temperature plate photobioreactor when compared
with a 200 L outdoor raceway pond under the same photon flux density. Hu et al.
To date, this appears to be the first study to investigating growth of coccolithophorid
algae in different types of closed photobioreactors. All of the species grew in the plate
and carboy photobioreactors, however the concentric draught-tube internal loop airlift
photobioreactor was only suitable for P. carterae cultivation and the Biocoil was found
to be unsuitable for growing any of the species tested.
Plate photobioreactors have a potential for sc
125
(1996) achieved productivity of ov S. platensis grown in a 1.3 cm in
thic wn
in plate photobioreactors is correlated with the thickness of the culture and the optimal
light paths differs with the algal species cultivated (Tredici 2004). For example,
productivity of S. platensis found decreased by 50% where the light path was increased
-1 -1
-1 -1
-1 -1
ioreactor on the
mixing regime.
e lower
nutrient content of the f/50 culture medium used. A higher nutrient medium could not
e used as this resulted in the loss of coccolith production in E. huxleyi. This loss of
coccoliths has a 1994, Paasche
2002, Shiraiawa 2003).
er 50 g. m-2.d-1 for
k inclined flat plate photobioreactor. The productivity of microalgae species gro
from 1.3 cm to 5.2 cm (Hu, et al. 1996).
Of the coccolithophorid algae tested in the plate photobioreactor the highest
productivity of over 0.55 g dry weight .L .d was achieved in the P. carterae cultures.
Lipid and calcium carbonate productivity were also higher in P. carterae than the other
two species. Lisec (2004) however, found 6 fold lower productivity for P. carterae
grown in the same plate photobioreactor (0.09 g dry weight .L .d ). These contrasting
results may be explained by the lower aeration of 40 L.h compared to 160 L.h
aeration used in the current study. Hu and Richmond (1996) have also shown a high
dependency of the productivity of S. platensis grown in a plate photob
Emiliania huxleyi grown in the plate photobioreactor had a higher growth rate and a
higher cell density compared with P. carterae, but lower productivity. The lower
productivity of E. huxleyi may be result of it having smaller cells due to th
b
lso been reported in other studies (Paasche and Brubak
Gephyrocapsa oceanica, on the other hand, was found to be an unstable species in terms
of coccolith formation in all reactors tested and this species often lost up to 80% of
coccolith production. This was not observed in the small scale cultivation of G.
126
oceanica (see pages 86 and 96). The loss of coccolith production seems to be
irreversible in E. huxleyi (Paasche 2002) however in G. oceanica coccolith production
could be re-initiated under nutrient limitation especially phosphorus limitation (data not
shown).
These results presented here indicate the high possibility of successful growth of
coccolithophorids, especially P. carterae, in a larger scale plate photobioreactor for
outdoor or indoor production.
The coccolithophorids examined in this study grew better in the plate and carboy
photobioreactors compared with the concentric draught-internal loop airlift and Biocoil
photobioreactors. The lower shear environment in both of these photobioreactors
together with different mixing regimes in carboy photobioreactors produced by a
combination of stirring bar speed and gentle aeration may explain the better growth of
coccolithophorids in these photobioreactors.
Carboy photobioreactors have been stated to be a gentle system for culturing microalgae
and have been successfully used for culturing a wide range of algae such as
Chaetoceros, Isochrysis and Pavlova (Fulks and Main 1991, Sato 1991, Richmond
1999, Granum and Myklestad 2002). The problem with using carboy photobioreactors
is scaling up (Fulks and Main 1991, Richmond 1999), however they can be ideal for
ing stock cultures for initiating a large-scale culture.
draught-internal loop airlift photobioreactors indicates that this type photobioreactor is
prepar
The lack of growth of E. huxleyi and G. oceanica in concentric draught-internal loop
airlifts compared to P. carterae indicates their higher sensitivity to shear produced in
the concentric draught-internal loop airlift. The turbulent environment in this type of
photobioreactor caused a high level of cell death in E. huxleyi and G. oceanica. The
lower specific growth rate and productivity of P. carterae grown in the concentric
127

unsuitable for growing this species. There are also many difficulties in scaling up airlift
type photobioreactors when compared with plate or tubular reactors (Borowitzka
1999a).
In the Biocoil-type helical tubular photobioreactors cell death/loss rates were greater
than growth rates in all the different airlift designs tested except for design IV. The
results show that this type of photobioreactor is unsuitable for the cultivation of
coccolithophorid algae. The shear produced by turbulence together with possible cell
damage at the air bubble-water interface are the main likely reasons for damage to the
coccolithophorid cells in the Biocoil and/or the concentric draught-internal loop airlift
photobioreactors.
A basic requirement for mixing is to prevent microalgal cells from settling. Increasing
liquid velocities during mixing cause shear and this increases with the level of
turbulence and is affected by the type of agitator (Doran 1995). While using air flow
for mixing the photobioreactor, two forms of shear can damage the cell, (1) localized
shear which is produced by bubbles rising and (2) shear in the bulk liquid arising from
turbulence within the reactor (Doran 1995). It has also been shown that, under normal
mixing conditions, the average size of turbulent eddies is noticeably larger than the
average cell diameter resulting in no cell damage by shear forces. Shear damage is
Bubble damage is also the major cause of cell damage in sparged photobioreactors
mainly due to (1) bursting of bubbles at the surface of the fluid, (2) shearing the cells
trapped in the foam, and (3) surface tension between bubble and cells (Tramper and
W
maximal when the eddy size is smaller than the cell size producing violent pressure
oscillation forces and resulting in high cell damage to cells trapped in these eddies
(Doran 1995).
illiams 1986, Hondzo and Lyn 1999, Sulivan and Swift 2003). Bubble burst at the
128

surface of the culture fluid can also damage or even tear apart the cells trapped on the
bubble interface in the bubble and large bubbles cause more damage than small bubbles.
hout the reactor, resulting in no cells settling in the coil,
however, the higher shear produced by the higher flow rate in this design compared to
ice, leading to less cell damage. For example Chrismada and
ublished results). As a matter of fact, for some
algae with fragile structure such as Dunaliella sp. and long filamentous algae such as
pirulina sp. airlifts have been found to provide a much gentler flow environment
compared to conventional pumps (Richmond 2004a, Tredici 2004).
In the current study on the airlift designs I to III of the Biocoil, the cell losses were
attributed largely to the algae sticking and settling to the photostage walls due to the low
flow rate produced by these designs. Airlift design IV resolved this problem by
increasing the flow rate throug
designs I to III could be the possible reason for no net growth in this design.
Shear produced by turbulence and/or bubble rise from a sparger also affected the
coccolith layer surrounding the cells and also led to the loss of the flagellae, as well as
often resulting in the disruption of the cells. Addition of olive oil as an antifoam agent
decreased the bubble bursting effect on the cells by decreasing the cell trapping on the
top of the degasser part of airlift in design IV.
In the Biocoil, for some species of algae, pumps other than airlift have been shown to be
a better mixing dev
Borowitzka (1994b) observed better growth rate and biomass output rate for the diatom
Phaeodactylum tricornutum using a centrifugal pump compared to a peristalic pump or
an airlift. However, using an airlift in biocoil photobioreactors has been successful for
cultivation of many other species such as Chlorella sp., S. platensis, and S. siamensis
(Watanabe, et al. 1995, Hai, et al. 2000) as well as Isochrysis sp., Skeletonema costatum
and Tetraselmis chuii ( Borowitzka, unp
S
129
CHAPTER 5
LARGE-SCALE CULTURE IN OUTDOOR RACEWAY POND
5.1 Introduction
Coccolithophorid algae have never previously been grown in any type of open
cultivation system. The results in Chapters 3 and 4, indicated P. carterae CCMP647
and E. huxleyi CCMP371 as the best potential species for long term cultivation in
regards to temperature tolerance and maintaining growth in semi-continuous culture
together with constant coccolith production. This chapter describes the long-term
culture of P. carterae in unheated uncovered outdoor paddle wheel driven raceway
ponds over a period of 13 months. Several attempts were also made to culture E.
huxleyi in an outdoor raceway pond but these were unsuccessful. There was little
growth and soon after initial inoculation the culture become highly contaminated with
c
This chapter describes the relationships between several physiochemical variables (e.g.,
pH, temperature, irradiance, and dissolved oxygen concentration) and those associated
and 40% lower irradiance was observed in autumn and winter respectively, with the
iliates, amoebae and other microalgae, resulting in loss of the culture.
with P. carterae productivity (e.g., biomass concentration, productivity, lipid and
CaCO3 content) in unheated outdoor open paddle wheel driven raceway ponds.
5.2 Growth of P. carterae in outdoor raceway ponds
The experiments described in this chapter were carried in two 1 m2 outdoor raceway
ponds (Figure 40) between 14/Mar/2003 and 14/Apr/2004. The highest daily irradiance
of up to 1400 J.m-2.s-1 was observed in spring and summer, and an approximately 20%
130

lowest irradiance of 250 ± 100 J.m-2.s-1 on cloudy days (Figure 41a). The maximum
daily air and medium temperature was observed in December and January 2004, and the
minimum daily air and medium temperature was reached in June and July 2003 (Figure
41b). The daily air temperature maximum/minimum variation was between 25oC to
29oC, whereas a lower variation of 15oC to 19oC was observed in medium temperature
(Figure 41b). As expected, the maximum daily evaporation of up to 25 mm.d-1 was
observed during summer season, while the highest monthly average rainfall of 7 mm.d-1
was observed in July 2003 (Figure 41c).
Figure 40. Side view of unheated and uncovered raceway ponds used in this study.
oreactors and 100 L f/2 culture medium occurred on 14
Mar/2003. Growth was monitored for the first 11 days to determine the maximum
aintained in a semicontinuous culture in the log
phase (Figure 41d). At cell densities of approximately 8 x 10⁵ cells.mL-1 the culture
The initial inoculation of the 30 cm deep raceway pond with 60 L prepared P. carterae
inoculum from carboy photobi
achievable cell density that could be m
131
132
started to show symptoms observed in batch cultures when reaching steady state; i.e.
algae started to stick to the sides of the ponds and paddle wheel and the cells also began
to clump (Figure 42a and b).
To avoid possible limitations due to sticking and self-shading, the culture was operated
in a sem contin e a um concentration of
5.5 to 7 x 10⁵ cells.mL-1. The data reported here are the mean daily values of the cell
densities. T
and 29/Jun/2003 (Figure 41d). During this period of time the maximum pH was
between pH 9.5 and 11 (Figure 41e). The pH of the culture medium increased from pH
8.1 to pH 10.2 ± 0.7 by noon. The pH then stayed constant during the day, and
decreased to the initial pH during the night. While low level bacterial contamination of
less than 2 104 cells.mL was observed, this contamination appeared to stay constant
and to have no negative effect on the growth of P. carterae (Figure 41g and Figure 42c).
No other contamination was detected during this period of time in the culture (Figure
4 . O e experimental period, irradiance was declining due to the shorter days
and the low sun angle (Figure 41a), however no sign of photolimitation were detected
d g th d. Low evaporation and rain fall also favoured growth (Figure 41b and
c).
By 29/Jun/2003 cells densities started to decrea
1 x 10⁵ ce L-1 by 15/Jul/2003 (Figure 41d). Protozoan contamination consisting
m tes and amoebae (Figure 42d and e) began to increase (Figure 41g), but
there was no significant increas n o u 41g). The amoebae
w observ to feed on P. carterae by attaching to the cells (Figure 42f). The lowest
i uous mode and the cell density was k pt t a maxim
he culture was maintained in semicontinuous mode between 25/Mar/2003
x -1
1g)
urin
ainly of
ere
ver th
er
is perio
se resulting in a cell density of less than
lls.m
cilia
ed
e in bacterial contami ati n (Fig re
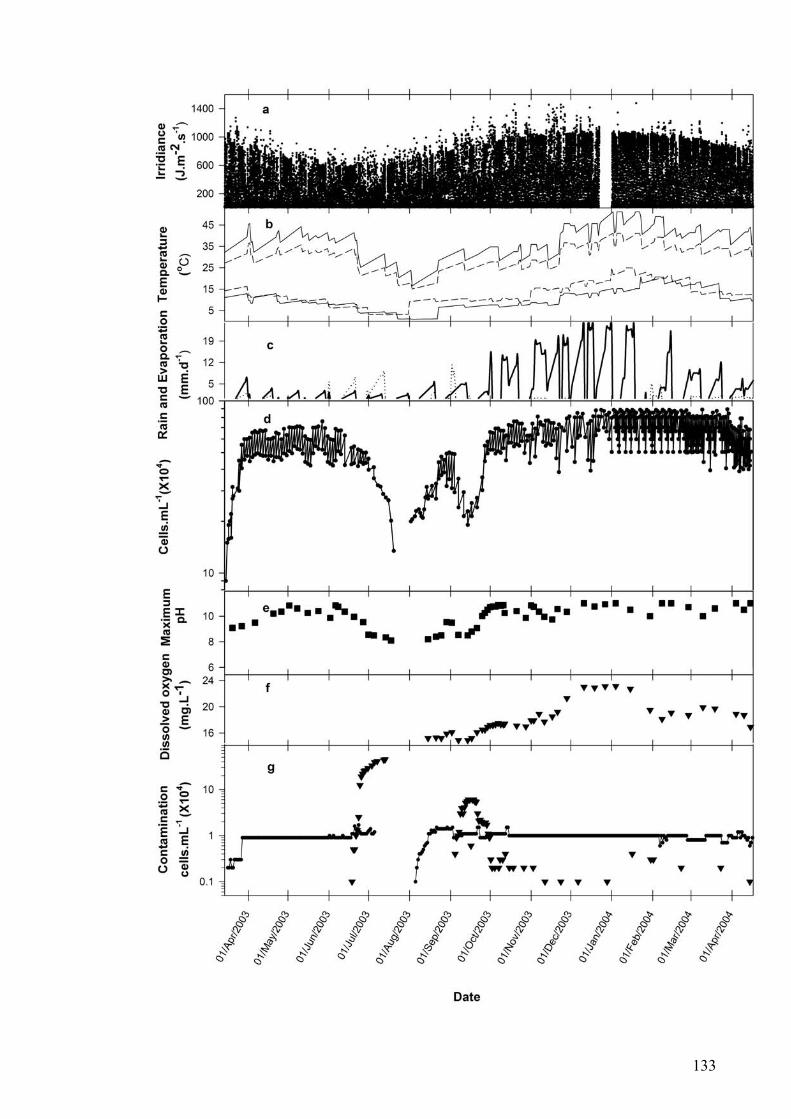
133

Figure 41. Pleurochrysis carterae grown in a 1 m2 unheated outdoor raceway pond (a) irradiance, (b) maximum and minimum air (—) and medium (− −) temperature, (c) total daily rain fall (—)
and evaporation (− −), (dculture medium,
) growth curve, (e) maximum daily pH, (f) dissolved oxygen content of the and (g) bacterial (—) and protozoan (▼) contamination.
irrad
during this period (Figure 41a to c). It
ells created by these conditions, together with high contamination, resulted in cell
death and loss he cultu
inoculum
and 100 L f/2 culture medium on 27/Jul/2003 (Figure 41d). Over the first 25 days the
In order to avoid possible limitations due to sticking and self-shading the
semicontinuous culture was maintained at a maximum concentration of 5.5 to 6 x 10
cells.mL between 28/Sep/2003 and 14/Apr/2004. The culture was maintained as a
semicontinuous culture until the middle of April 2004 when this experiment was
terminated (Figure 41d). No significant contamination by other organisms was
observed over this period (Figure 41g).
iances, air and medium temperatures and the highest average daily rainfall occurred
is likely that the high stress on the P. carterae
c
of t re.
The raceway pond was re-inoculated with 60 L freshly prepared P. carterae
culture reached the maximum cell density of 4.2 x 10⁵ cells.mL-1 (Figure 41d). Heavy
rain of approximately 12 mm on 16/Sep/2003 resulted in a large decline in the cell
numbers to 2 x 10⁵ cells.mL-1 and a significant increase in the protozoan contamination
(Figure 41d and g), however with improved climatic conditions thereafter the system
recovered and the cells shifted into logarithmic phase by 19/Aug/2003 increasing to 7 x
105 cells.mL-1. Protozoan contamination decreased significantly by 27/Sep/2003
(Figure 41d and g).
5
-1
134
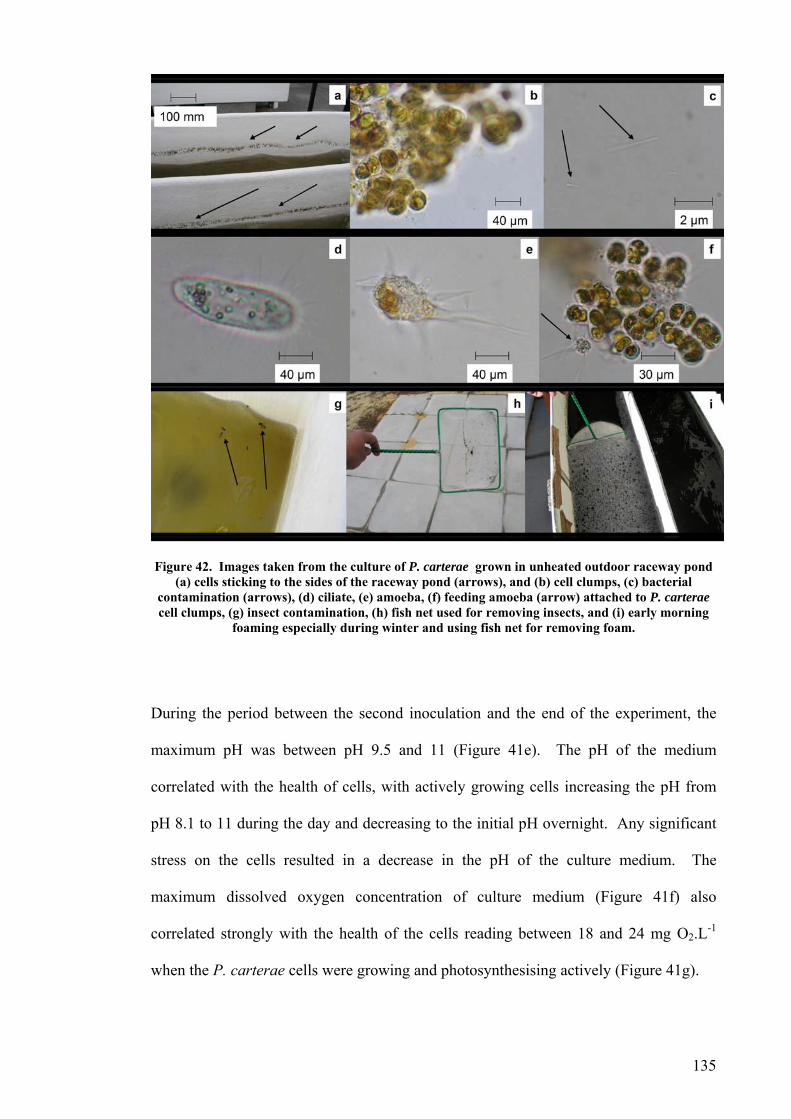
Figure 42. Images taken from the culture of P. carterae grown in unheated outdoor raceway pond (a) cells sticking to the sides of the raceway pond (arrows), and (b) cell clumps, (c) bacterial
contamination (arrows), (d) ciliate, (e) amoeba, (f) feeding amoeba (arrow) attached to P. carterae cell clumps, (g) insect contamination, (h) fish net used for removing insects, and (i) early morning
foaming especially during winter and using fish net for removing foam.
uring the period between the second inoculation and the end of the experiment, the
maximum pH was between pH 9.5 and 11 (Figure 41e). The pH of the medium
correlated with the health of cells, with actively growing cells increasing the pH from
pH 8.1 to 11 during the day and decreasing to the initial pH overnight. Any significant
stress on the cells resulted in a decrease in the pH of the culture medium. The
maximum dissolved oxygen concentration of culture medium (Figure 41f) also
correlated strongly with the health of the cells reading between 18 and 24 mg O2.L
when the P. carterae cells were growing and photosynthesising actively (Figure 41g).
D
-1
135
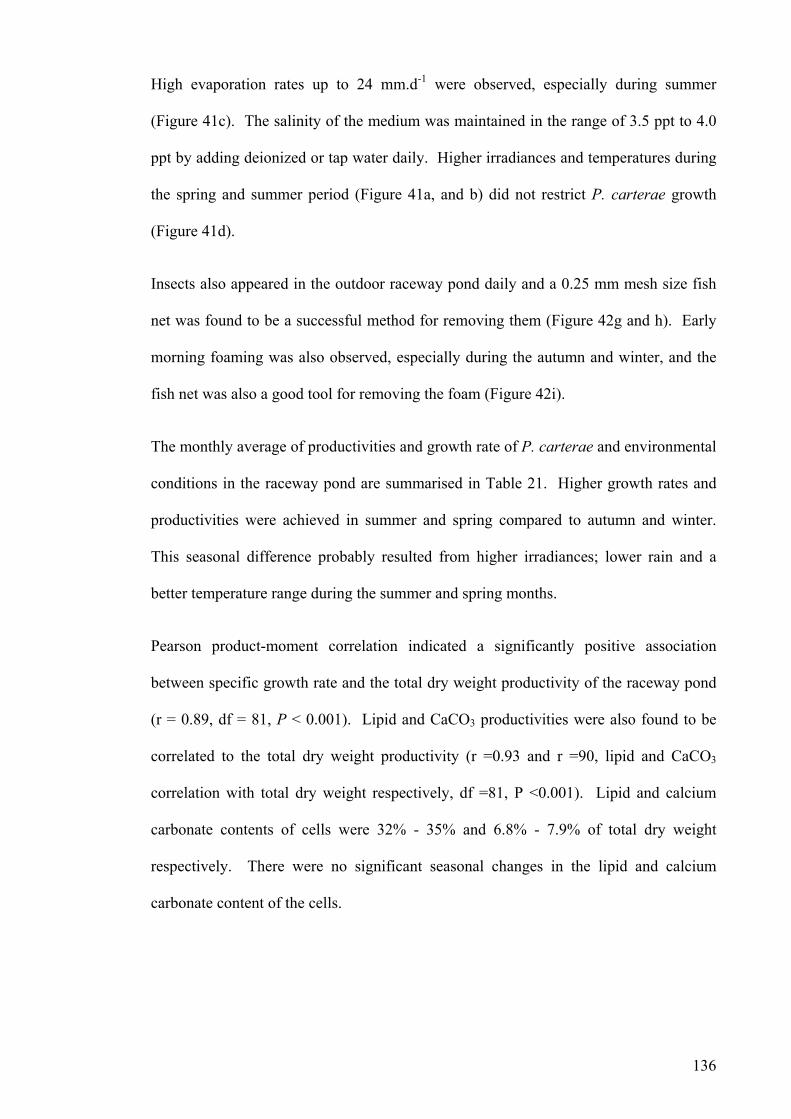
High evaporation rates up to 24 mm.d-1 were observed, especially during summer
(Figure 41c). The salinity of the medium was maintained in the range of 3.5 ppt to 4.0
ppt by adding deionized or tap water daily. Higher irradiances and temperatures during
the spring and summer period (Figure 41a, and b) did not restrict P. carterae growth
(Figure 41d).
The monthly average of productivities and growth rate of P. carterae and environmental
conditions in the raceway pond are summarised in Table 21. Higher growth rates and
Pearson product-moment correlation indicated a significantly positive association
between specific growth rate and the total dry weight productivity of the raceway pond
(r = 0.89, df = 81, P < 0.001). Lipid and CaCO3 productivities were also found to be
correlated to the total dry weight productivity (r =0.93 and r =90, lipid and CaCO3
correlation with total dry weight respectively, df =81, P <0.001). Lipid and calcium
carbonate contents of cells were 32% - 35% and 6.8% - 7.9% of total dry weight
respectively. There were no significant seasonal changes in the lipid and calcium
carbonate content of the cells.
Insects also appeared in the outdoor raceway pond daily and a 0.25 mm mesh size fish
net was found to be a successful method for removing them (Figure 42g and h). Early
morning foaming was also observed, especially during the autumn and winter, and the
fish net was also a good tool for removing the foam (Figure 42i).
productivities were achieved in summer and spring compared to autumn and winter.
This seasonal difference probably resulted from higher irradiances; lower rain and a
better temperature range during the summer and spring months.
136

137
ment cond ion rysis car rae g own race ay
Pro ctivity
Table e io ass pr c ( umetric and real ro rate nd iron al it s of Pleuroch te r in w pond.
du
21. M an b m odu tivity vol a ), g wth , a env
Volum tric Area e lMonth pe e
um(o ( -2.
Average rainfall
m.
Average thd-1
Dilution period
(d)
T W ( -1 L-1
C.L )
T W ( .d-1
Tem raturrange of medi
C)
Average irradiance MJ.m d-1) (m d-1)
grow rate ( )
Dilution rate (%)
otal D g.L-1.d )
Lipid (g. .d-1)
aCO (g
3-1.d-1
otal D g.m-2 )
Mar-2003 13-29 65 2. 0.04 379 4 0.05 50 0.15 0.01 23.52
Apr-2003 10-34 67 1. 0.63 199 2 0.04 30 0.11 0.01 16.80
May-2003 9-32 28 3. 0.09 087 2 0.02 15 0.05 0.00 8.00
Jun-2003 4- 7 09 5 0.0 22 21 5. 8 0. 1 35 0.02 1 0.00 3.20
Jul-2003 1- .00 16 11 7
Aug-2003 7-25 42 1. 0. 3 77 29 2 0.02 30 0.06 0.01 8.80
Sept-2003 7-25 63 1. 0.10 394 2 0.03 060 0.08 .01 12.16
Oct-2003 9-26 66 0.46 0. 4 55 2 0.0 0 6 55 0.17 6 .02 27.7
Nov-2003 13-33 72 0. 0.36 592 2 0.07 65 0.19 0.02 30.72
Dec-2003 15-38 75 0. 0.00 521 2 0.07 40 0.20 0.02 32.08
Jan-2004 21 00 569 1 0. -36 73 0. 0. 30 0.21 07 0.02 33.44
Feb-2004 19-34 65 0. 0.00 541 1 0.07 25 0.21 0.02 33.68
Mar-2004 11-31 61 0. 0. 3 80 407 0.06 25 0.18 0.02 29.52
5.3 Vertical light distribution
5 -1
The vertical light distribution throughout the culture of P. carterae grown in a raceway
pond was measured using an underwater light meter with 10 measurements at each
depth during October 2003 (Figure 43). The cell density was 4.9 ± 0.4 x 10 cells.mL
and the raceway pond was 16 cm deep. Results indicated irradiances of less than 0.5
MJ.m-2.d-1 at depths greater than 8 cm, while the surface irradiance was 64.5 ± 2
MJ.m-2.d-1.
pond (cell density = 4.9 ± 0.4 x 10Figure 43. Vertical light distribution throughout the culture of P. carterae grown in a raceway
The green alga Dunaliella salina is grown commercially for the production of β-
carotene (Moulton, et al. 1987, Borowitzka and Borowitzka 1988, Borowitzka 1994,
5 cells.mL-1 and depth = 16 cm). Data are mean ± SE, n = 10.
5.4 Growth comparison of P. carterae and D. salina in raceway pond
138
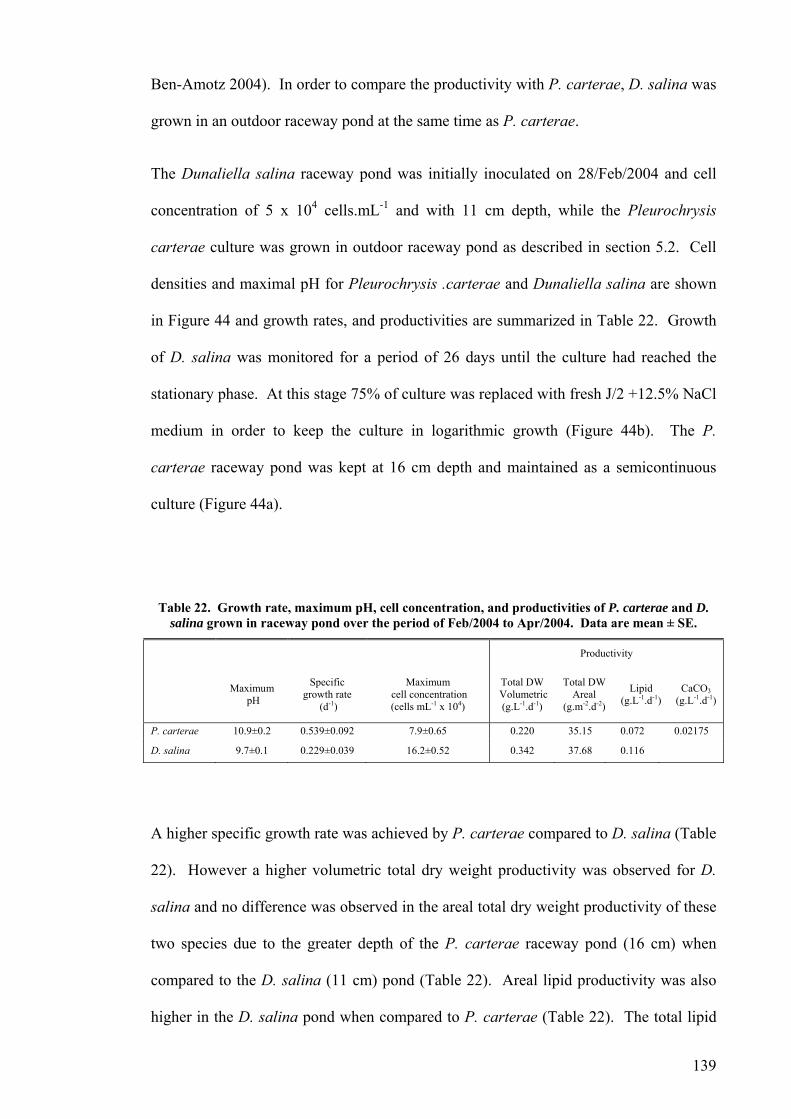
Ben-Amotz 2004). In order to compare the productivity with P. carterae, D. salina was
grown in an outdoor raceway pond at the same time as P. carterae.
4 -1
Table 22. Growth rate, maximum pH, cell concentration, and productivities of P. carterae and D. salina grown in raceway pond over the period of Feb/2004 to Apr/20
The Dunaliella salina raceway pond was initially inoculated on 28/Feb/2004 and cell
concentration of 5 x 10 cells.mL and with 11 cm depth, while the Pleurochrysis
carterae culture was grown in outdoor raceway pond as described in section 5.2. Cell
densities and maximal pH for Pleurochrysis .carterae and Dunaliella salina are shown
in Figure 44 and growth rates, and productivities are summarized in Table 22. Growth
of D. salina was monitored for a period of 26 days until the culture had reached the
stationary phase. At this stage 75% of culture was replaced with fresh J/2 +12.5% NaCl
medium in order to keep the culture in logarithmic growth (Figure 44b). The P.
carterae raceway pond was kept at 16 cm depth and maintained as a semicontinuous
culture (Figure 44a).
04. Data are mean ± SE.
Productivity
Maximum
pH
Specific growth rate
(d-1)
Maximum cell concentration (cells mL-1 x 10⁴)
Total DW Volumetric (g.L-1.d-1)
Total DW Areal
(g.m-2.d-2)
Lipid (g.L-1.d-1)
CaCO3(g.L-1.d-1)
P. carterae 10.9±0.2 0.539±0.092 7.9±0.65 0.220 35.15 0.072 0.02175
D. salina 9.7±0.1 0.229±0.039 16.2±0.52 0.342 37.68 0.116
A higher specific growth rate was achieved by P. carterae compared to D. salina (Table
22). However a higher volumetric total dry weight productivity was observed for D.
salina and no difference was observed in the areal total dry weight productivity of these
two species due to the greater depth of the P. carterae raceway pond (16 cm) when
compared to the D. salina (11 cm) pond (Table 22). Areal lipid productivity was also
higher in the D. salina pond when compared to P. carterae (Table 22). The total lipid
139
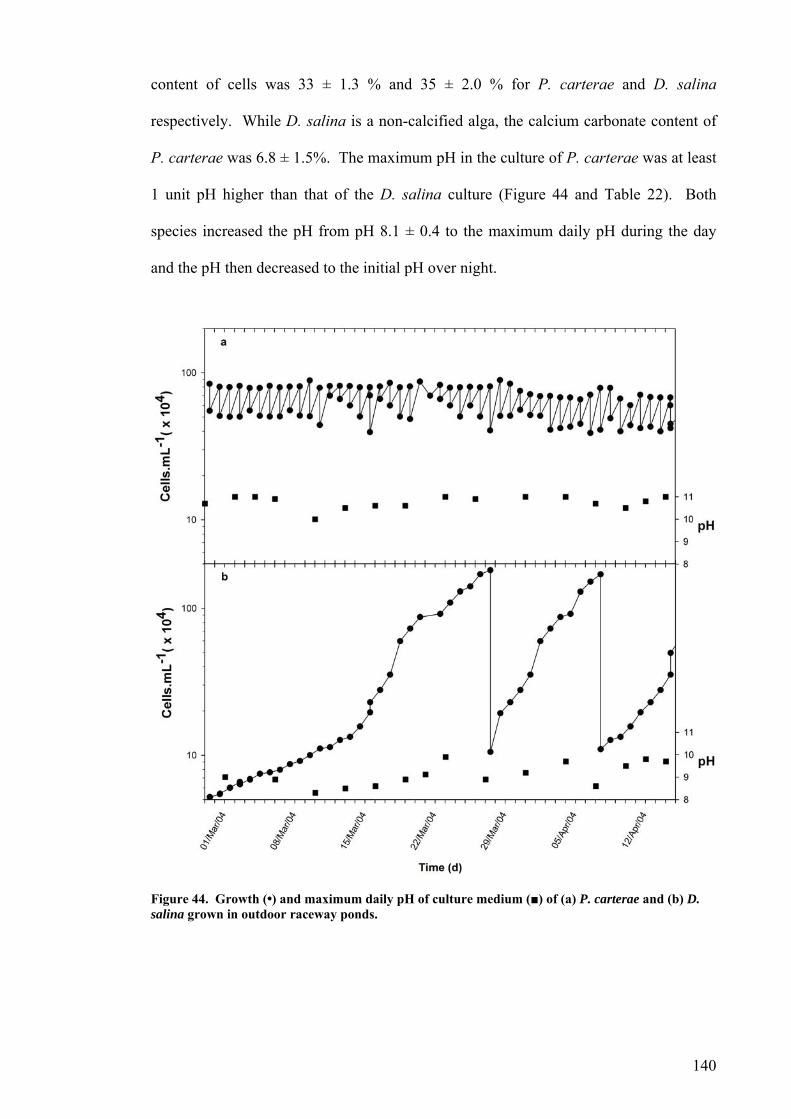
140
content of cells was 33 ± 1.3 % and 35 ± 2.0 % for erae and D. salina
respec ly. Wh
P. carterae was 6.8 ± 1.5%. The maxim h c ae was at least
1 unit pH hig r than t of the D. salina ultur r 4 an ble 22). Both
species increased the pH fro
and the pH th d to the initial pH r nigh
Figure 4 . Growth (•) and maximum daily pH of (■) of (a) P. cart and (b) D. salina n i utdoor raceway ponds.
4 grow
culture medium
P
re
.
o
c
f
art
carbonate content of
P.
tive ile D. salina is a non-calcified alga, the calcium
ltuum pH in t e cu arter
he
en
tha
ed
c
ove
e (F
t.
igu
m
e 4
m
d Ta
m pH 8.1 ± 0.4 to the maxi u daily pH during the day
ecreas
n oerae
5.5 Discussion
Although coccolithophorid algae, especially species such as Emiliania huxleyi,
Pleurochrysis carterae and Gephyrocapsa oceanica, are widely distributed in the ocean
(Siesser 1994), they are not currently used for biotechnological applications. At this
stage, applied microalgology is limited to a few genera including Chlorella, Spirulina,
Dunaliella, Haematococcus, Nannochloropsis, Chaetoceros, Isochrysis and
Phaeodactylum. Most studies have focused to use these species for either total biomass
as a food source or intracellularly synthesized products such as eicosapentaenoic acid
(EPA), polyunsaturated fatty acids (PUFA), and β-carotene. Other potential products,
such as total biomass or lipids for biodiesel, amino acids and phycobilins for cosmetics,
antibiotics, and antiproliferative agents from microalgae are at an early stage of
development.
Pleurochrysis carterae grown in raceway pond had an are
An important aspect of commercially successful algal culture is to be able to grow the
algae in continuous or semicontinuous culture for long periods. This can maximise the
use of capital intensive culture systems and also reduces labour costs (Borowitzka
1993b, Sheen, et al. 1998). The results presented in this Chapter show that it is feasible
to grow Pleurochrysis carterae CCMP647 in an outdoor raceway pond for a period of at
least 13 months. Emiliania huxleyi, on the other hand, was found to be an unstable
species when cultured under similar conditions.
al total productivity of 16-
33.5 g.m-2.d-1 for with a mean production of < 20 g.m-2.d-1 over 10 months a year. The
total areal productivities of P. carterae when re-calculated from the volumetric
productivity, were 3.19 g. m illuminated area.d for the plate photobioreactor, 3.48 g.
m illuminated area.d for the carboy photobioreactor, and 2.26 g. m illuminated
area.d for the concentric draught-tube internal loop airlift photobioreactor. While, the
-2 -1
-2 -1 -2
-1
141

areal productivity of P. carterae is higher in the raceway pond compare to closed
photobioreactors, up to 3 fold higher volumetric productivities were found in closed
photobioreactors (see Chapter 4 and Table 23). Areal and volumetric productivity of
several other species of microalgae grown in different closed and open cultivation
systems are summarised in Table 23. Generally investigators studying closed
photobioreactors use volumetric productivity, whereas open ponds are mostly compared
as the basis of areal productivity. This inconsistency between the reports can give
incorrect information in regards to the productivity of different cultivation systems. For
example, Pushparaj et al. (1997) and Richmond et al. (1990) reported the same areal
productivity for Spirulina platensis grown in raceway ponds, whereas volumetric
productivity is 3 times higher in the system operated by Pushparaj et al. (1997). This is
even more interesting when the areal productivity is to be used for closed
photobioreactors. As it is shown in Table 23, the areal productivities of closed
photobioreactors and open ponds are not mostly different, whereas the volumetric
productivities of closed photobioreactors are higher than open systems. The question
that arise here is “What productivity (areal or volumetric) should be used for comparing
various cultivation systems?”. Volumetric productivity is better for comparing
productivity of cultivation systems as it is not affected by configuration and design.
The main difficulties in calculating the areal productivities for closed photobioreactors
are whether to use illuminated surface area or the projected area of the reactor. The
pond depth will also affect the areal productivity of open ponds.
d, was influenced by the diurnal and day–to–day variation of several
As mentioned above, the volumetric productivity of P. carterae was higher in closed
photobioreactors than in the raceway pond. It is also important to note that all closed
systems studied under controlled light and temperature resulting on less inhibition of the
cultures (see Chapter 4). Pleurochrysis carterae grown in the raceway pond, on the
other han
142
environmental factors including irradiance, temperature, salinity, rain and so on. While,
the rate of Pleurochrysis carterae areal productivity in raceway pond is the same as
other microalgae grown in open ponds, the volumetric productivity of this
coccolithophorid alga is considerably higher than most of the open ponds and it is not
much less than closed photobioreactors (Table 23) confirming this species as a suitable
candidate for further investigation. However, it should be pointed out that between 9 to
10% of the total dry biomass productivity of P. carterae is CaCO3.
-1 -1A total productivity of about 36-80 mt.ha .y can be calculated for P. carterae grown
in raceway pond together with 14.4-32.2 mt.ha-1.y-1 total lipid and 3.8-9.2 mt.ha-1.y-1
The Pleurochrysis carterae productivities should not be interpreted to signify that
Irrespective of species, the maximum sustainable productivity of open pond systems
falls in the range of 20 – 25 g.m .d (Oh-Hama and Miyachi 1988, Richmond 1988,
Vonshak and Richmond 1988, Borowitzka and Borowitzka 1990, Jimenez, et al.
2003a). The reports of lower productivities of 10-15 g dry weight.m .d range can be
interpreted as growth being limited by operational factors such as CO2 limitations, O2
build up and poor mixing.
total calcium carbonate production. The lipid and calcium carbonate content of the P.
carterae cells were shown to be consistent throughout the year. While the lipid content
of P. carterae cells was 1.6 to 1.8 fold higher in the raceway pond compared to closed
photobioreactors, the calcium carbonate content of cells grown in the raceway pond was
0.6 to 0.7 fold lower than in closed photobioreactors.
improvements in yields above 80 mt.h-1.y-1 are not achievable as the system has not
been fully optimised. Further improvements may be achieved through strain
optimisation.
-2 -1
-2 -1
143

The most common difficulties fac uction in open ponds are (1) low
productivity and (2) high con
and/or other algae is also one of the major reasons for micro-algal culture failure in
open cultures (Richmond and Becker 1986, Vonshak and Richmond 1988, Richmond
1992, Borowitzka 1993c, Borowitzka 1999a). The maintenance of monoalgal cultures
throughout the growing season is a challenge to any commercial production facility
(Vonshak, et al. 1983, Vonshak and Richmond 1988). Contamination of outdoor algae
cultures with other algae, protozoan, and fungi cannot be avoided completely since the
culture conditions often also favour several species of contaminants (Borowitzka 1998).
For example, in Scenedesmus cultures the common contaminants are (1) other algae
such as Chlorella, Oocystis, Ankistrodesmus and diatoms, (2) protozoa like Brachionus,
Lacrymania, Colpidium and Vorticella, (3) fungi such as Penicilium and Aspergillus,
nd (4) even some insect larvae such as Chrionomus and Anopheles (Venkataraman and
Becker 1982). The major contaminant algae in raceway ponds, as
reported by Vonshak and Richmond (1988), are Chlorella and a small species of
Spirulina, Spirulina minor. These investigators have estimated the overall annual loss
of productivity due to contamination and subsequent discarding of culture to be in the
order of 15 to 20 percent of total productivity. However, Dunaliella salina, Spirulina
sp. and Chlorella sp. are successfully grown in open ponds for long periods and the low
levels of contamination in the cultures are mainly due to the high salinity, alkalinity or
nutrients of medium (Richmond 1988, Borowitzka and Borowitzka 1990, Garcia, et al.
2003). The economic production of microalgae also necessitates the continuous
recycling of the nutrients after the biomass removal. The constant recycling of the
medium often results in excessive accumulation of organic matter. This can affect the
ing biomass prod
tamination. Microbial contamination by bacteria, protozoa
a
Spirulina platensis
productivity by either increasing the contamination risks, or in some species such as
Spirulina, can lead to autoinhibition of growth (Belay 1997).
144

145
r c as duct i al r
Cu on Productivity ra tion Aim f
Table 23. A eal and volumetri biom s pro
nge
ivity n alg cultu e systems.
Strain Localtivati type Re
C ure volum)
ure od )
Indoor /outdoor al
(g dry w ht -)1metric ight.L
ult e
(LCultperi
(m Are
eig .m-2.dVolu
(g dry we -1.d-)1
Closed photobioreactors : Annular (airlift design) 0 3 (I) 5.3 -0.35 oc si ly PUFA producti ell . 2 14 + 3.7- b 0.25 Nann hlorop s sp. Ita on (Zitt i, et al 003) O) 1.9- 8 ( 3. -0.35 b 0.12 Inc la 6 3 ( c 1c oc si ael EPA productio a hm
) lined F t plate + O) 23 1 Nann hlorop s sp. Isr n (Zou nd Ric ond
1999Inclined Flat plate 6 3 ( 51 -0.3 lin ael Food Productio , et 96< O) 39- 0.09 Spiru a platensis Isr n (Hu al. 19 ) Vertical flat plate 2 3 ( 39 1-5 ho an Wastewater treat nt ng 119 < O) 30- 4. Synec cystis
aquatilis Jap me (Zha , et al. 999)
Tu bular Airlift driv .7 3 b 28 lin ada Food t a 5) en 14 < (I) 9.2 0. Spiru a platensis Can (Watanabe, e l. 199Pump driv b 33 en (I) 9.4 0.
Co pe lar 74 3 7 55 lin an Food )
ne-sha d tubu 7. < (I) 7.0 0. Spiru a platensis Jap (Watanabe and Hall 1996
Inc ub ubble colu
2 ( ±2 ±0.19 lin ly Food ell . 2lined t ular bmn
1 < 3 O) 31.1 .1 0.91 Spiru a platensis Ita (Zitt i, et al 003)
Vertical Biocoil 00 3 ( 1.20 ralia Aquaculture owitzka 19 10 + O) ? 0.5- Tetraselmis chuii Aust (Bor 97)
Pla bo airlift an 3 19 an 6 .5 and 0 oc ca ralia CO2 bioremediat e te, car y, and 6, 12, d 3 < (I) 3. , 3.48, d 2.2 0 6, 0.55 .39 Pleur hrysis rterae Aust ion Curr nt study
Open ponds: Cir 60 3 ( 16. -0.16 Chlorella sp an Food (Kanazaw t a 8) cular 19 + O) 1.61- 47 0.02 Jap a, e l. 195 2.43- 52 0.0313. -0.13 de p. Scene smus s Ra 3 ( 3 ? lin ico Wastewater treatment ui . 2cewaya ? + O) 9-1 Spiru a. sp. Mex (Olg n, et al 003) Ra 2 3 ( ±0 ±0.02 lin aly Food ushpar t a ) cewaya 28 + O) 14.47 .16 0.183 Spiru a platensis It (P aj, e l. 1997Ra 0 3 ( 23. 1-0.07 nabaena s ain Food supplement e l. cewaya 30 + O) 9.4- 5 ≈ 0.03 8 A p. Sp (Mor no, et a 2003) Ra 0 ( 7 -0.07 lin ain Food en l. cewaya 135 00 +3 O) 2-1 0.006 Spiru a sp. Sp (Jim ez, et a 2003a)Ra 3 ( 3.5 ? ain β-carotene production cia . 2cewaya ? + O) 1.6- Dunaliella salina Sp (Gar , et al 003) Ra 0 3 ( 27 -0.18 lin ael Food production hm t 0) cewaya 75 + O) 15- 0.06 Spiru a platensis Isr (Ric ond, e al. 199Co ous fl (ra
50 ( 11.3 8-0.13 d m tricornutum
waii New technique s, 19ntinu umeceway)
41 + 3 O) 2.4- 0.002 Phaeo actylu Ha (Law et al. 83)
Ra 0 3 ( 33.5 -0.21 oc ca ralia CO2 bioremediation e cewaya 16 + O) 16- 0.11 Pleur hrysis rterae Aust Curr nt studyRa 0 3 ( 37 -0.34 ralia CO2 bioremediation e cewaya 11 + O) 20- 0.22 Dunaliella salina Aust Curr nt study(a) s were(b) na a. (c) ee eight.
Raceway pondIllumi ted areAsh fr dry w
paddle wheel driven.
The main reasons for the low contamination of P. carterae culture in the raceway ponds
are most likely the increase in the pH of the culture close to about pH 11 and the
production of dimethylsulfide (DMS). An increase in the pH to pH 11 can inhibit the
growth of some unwanted species of algae and cyanobacteria by restricting the available
failure of Emiliania huxleyi growth in the outdoor raceway pond may be due to the
onstant medium pH of 8.1-8.2, resulting overgrowth by other species of microalgae.
and Houser 2003).
Moreover, Houdan and colleagues (2004b) have also recently reported a high toxicity of
o
carterae
ay explain the better success of this species in limiting the growth of contaminants
such as bacteria, protozoa and fungi. In conclusion, it is appears that the increase of the
me r
contamination in the raceway pond, whereas E ux or
rac ainly due to the high contamination.
The bacterial population in the raceway pond dids not affect the growth of P. carterae
and this may be due to the fact that it ha
feed on bacteria using their haptonem (Kawachi and Inouye 1995). If P. carterae
grown in the outdoor raceway pond is capable of feeding on bacteria, it could actually
increase the total bio s pro tiv
Ci source (see Chapter 1). As a matter of fact, one of the most likely reasons for the
c
Dimethylsulfide has also been shown to act as an antibiotic inhibiting the bacterial,
protozoan and fungal contaminations in the medium (van Alstyne
some coccolithophorids, including P. carterae, on a number of other species of
microalgae. Reifel and colleagues (2001) also have suggested that the toxicity of
Pleurochrysis pseudoroscoffensis could explain its ability t bloom in the Salton Sea.
Moreover, Malin and Steinke (2004) reported a 12 to 19 times higher cell content of
DMS precursor (dimethyl sulfoniopropionate) in P. carterae when compared to two
clones of E. huxleyi. The higher content of dimethyl sulfoniopropionate in P.
m
dium pH and the high DMS produced by P. carterae inhibited the majo
miliania h leyi growth in an outdo
eway pond failed m
s been shown that some coccolithophorids can
a
mas duc ity.
146

Although the effect of temperature on the growth rate of laboratory microalgal cultures
is well documented, its effect in outdoor cultures is still not fully understood. An
outdoor algal culture undergoes a diurnal cycle which, in areas out of the tropics, may
show a difference of 20 oC. While low temperature can decrease night loss of biomass
due to respiration (Torzillo, et al. 1998), in cold seasons the low temperature can be an
important limiting factor, even leading to the complete loss of culture (Vonshak, et al.
1982). In case of Spirulina culture, the only way to overcome low temperature
limitation is to put the culture in greenhouses (Vonshak 1997). Pleurochrysis carterae
is a mesophilic microalga w rature of 23oC – 28oC (see
t availability to the cell in the culture. In many instances, the
t
seasons.
ith an optimal growth tempe
Chapter 3). The minimum temperature that permits P. carterae growth was found to be
as low as 4 - 5oC during autumn 2003, while the culture deteriorates when the minimum
24 h temperatures are lower than 1 -3 oC for a period longer than 5 days. Maximum day
temperatures of over 41oC, on the other hand, had no significant negative effect on the
growth of P. carterae similar to Spirulina sp where Vonshak (1997) also found no
limitation of high temperature on growth.
When growing P. carterae at a depth of 15 – 21 cm in open raceway ponds, self-
shading governs the ligh
availability of light limits the productivity that can be attained in an outdoor pond.
When nutrients and temperature are not limiting the growth of microalgae, light
availability to the average cell becomes the dominant limiting factor (De Pauw and
Persoone 1988, Richmond 1999). For instance, Vonshak (1997) has demonstrated a
decrease in the growth rate of Spirulina, with an increase in self-shading due to
increased cell density. Pond depth and cell densities therefore need to be optimised to
maximise productivity. Due to irradiance variation throughout the year, it is possible
that the pond needs to be operated at different depths and cell densities in differen
147

Rainfall and high dilution resulting from the rain together with the low temperature,
were the major reasons for the failure of the culture during winter, however in Perth the
rain is confined to a small part of the year, so this would not be a major problem for
long term cultivation. It is not possible to determine whether each of these
environmental factors was the main reason for failure of the culture. Pleurochrysis
carterae grew well during the winter when there was no high rainfall and the culture
recovered despite heavy rainfall in early September 2003 when the temperature was at
the optimum. It seems that the combination of these two elements resulted in the loss of
the culture by mid July 2003.
Dunaliella salina is among the microalgae most studied for mass culture and it is grown
commercially as a source of β-carotene (Borowitzka and Borowitzka 1988). Results
comparing the growth of P. carterae with D. salina in a raceway pond indicated no
significant differences in the total biomass and lipid productivities of these two species
of algae. As a carbon sink P. carterae has the added advantage of producing calcium
carbonate as well as organic biomass with high lipid content.
This is the first systematic attempt to establish conditions for the outdoor cultivation of
a coccolithophorid alga for lipid and calcium carbonate production. Calcium carbonate
and lipid productivities of around 2-3 g.m-2.d-1 and 12-15 g.m-2.d-1 on a yearly average
for coccolithophorid P. carterae in Perth Western Australia have been achieved. These
values are similar to other microalgae grown on a large-scale (Table 23). Although the
scale attempted here is far from that of a commercial facility, it seems clear that the
mass cultivation of P. carterae for lipid and/or calcium carbonate production in
Australia possible. However, further research is required for the scaling up and
optimization of operation conditions.
148
CHAPTER 6
LIMITS TO GROWTH
The temperature, salinity, and nutrient optimisation experiments described in Chapter 3
provided the background for the analyses of different types of open and closed
from the growth of several species of coccolithophorids in different types of
cultivation systems in regard to these variables. In conjunction with the results obtained
cultivation
ystems (Chapters 4 and 5), the effects of other limiting factors on the coccolithophorid
algae are examined in this Chapter. In this Chapter, the effects of a number of potential
limiting factors including CO2, pH, light, temperature and shear produced by agitation
are investigated in laboratory and outdoor cultures.
6.1 CO2 and pH
Adding CO2 to open algal cultivation systems such as raceway ponds has been
investigated in many studies (Anderson 1994, Olaizola and Yamamoto 1994, Benemann
1997, Hughes and Benemann 1997, Meisen and Shuai 1997, Gordillo, et al. 1998). The
most common way of introducing CO2 into culture media is via sintered porous stones
or pipes under submerged plastic sheets. Unfortunately, in all of these methods there is
still a high loss of CO2 to the atmosphere because of the short retention time of the gas
bubbles in the algal suspension. In this study the effect of different levels of CO2 was
investigated using a pH-stat system in outdoor raceway ponds and plate
photobioreactors under controlled growth conditions.
Two types of experiments were carried out: (1) the effects of different levels of pH were
examined in cultures of P. carterae and E. huxleyi grown in a plate photobioreactor
s
149
150
using CO2 addition via a pH-stat system indoors under controlled light and temperature
conditions, and (2) in cultures of rterae grown in outdoor raceway ponds, one pond
was used as a tro fects of different levels of pH achieved by CO2
addition were studied in the ntal pond.
Given that the plate-type photobioreactor had been shown to be a good closed system
for the sem of several species of coccolithophorids (see page 114)
this system ex 2 and pH addition on growth and
productivity of Pleurochrysis carterae and Emiliania huxleyi. The aim was to find the
optimum pH values (pH-stat system).
Cell num eig etermined daily. Three additional samples were
collected each tim and weigh the coccoliths and for lipid determination. The
pH was m ntained by applying CO2 through a separate aeration pipe installed at the
bottom o e plate photobioreactor. The pH varied no more than 0.4 pH units at each
set point. No conta ation was detected during experiments. The plate
photobioreactor was operated at 5 cells.mL-1 for
Pleurochrysis carterae and 4.8 x 10 L-1 for Emiliania huxleyi.
The pH of the cultures was ated and for P. carterae this resulted in a pH
increase from pH 8.1 to 9.9 during the light period and then a decrease to pH 8.1 by the
end of dark period (Figure 45a). In the E. huxleyi culture the pH remained between pH
8.1 and 8.3 in both the light and dark period (Figure 45b).
When the pH of the culture medium was regulated by addition of CO2 using the pH-stat
system between pH 7.9 – 8.1 and pH 7.6 – 7.9 for P. carterae and between pH 7.7 – 7.9
P
the
. ca
ef con l, while
experime
6.1.2 Plate photobioreactor
i-continuous culture
was used to
growth rate at different
ber and dry w
ai
f th
amine the effects of CO
ht were d
e to count
min
cell concentrations of 3.8 x 10
5 cells.m
unregulinitially

for E. huxleyi, the cultures continued to grow well. When the pH was reduced to pH 7.4
for P. carterae and to pH 7.2 for E. huxleyi the algal cells started sticking to the
photobioreactor walls and also began to clump and semicontinuous culture could not be
Figure 45. Growth curve (—●—) and pH range (—■—) of (a) P. carterae and (b) E. huxleyi grown in a plate type photobioreactor under different pH conditions in a pH-stat system controlled by
addition of CO2.
151
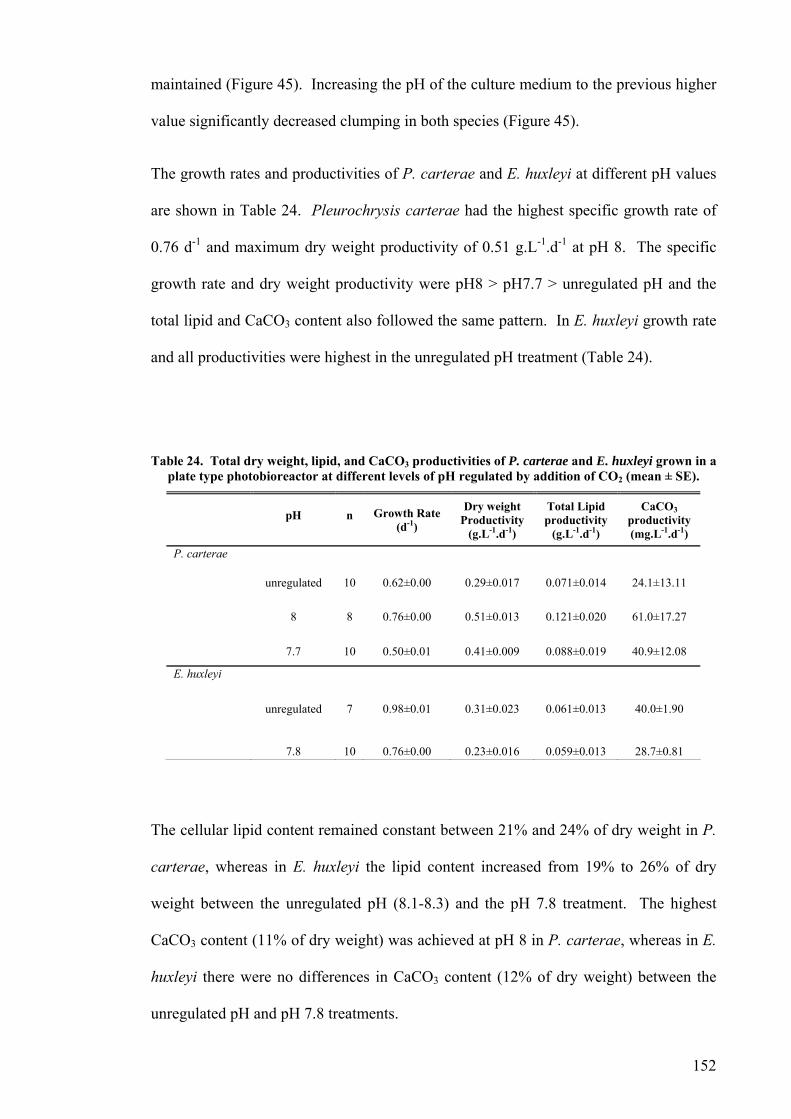
maintained (Figure 45). Increasing the pH of the culture medium to the previous higher
value significantly decreased clumping in both species (Figure 45).
The growth rates and productivities of P. carterae and E. huxleyi at different pH values
are shown in Table 24. Pleurochrysis carterae had the highest specific growth rate of
0.76 d-1 and maximum dry weight productivity of 0.51 g.L-1.d-1 at pH 8. The specific
growth rate and dry weight productivity were pH8 > pH7.7 > unregulated pH and the
total lipid and CaCO3 content also followed the same pattern. In E. huxleyi growth rate
and all productivities were highest in the unregulated pH treatment (Table 24).
Table 24. Total dry weight, lipid, and CaCO3 productivities of P. carterae and E. huxleyi grown in a plate type photobioreactor at different levels of pH regulated by addition of CO2 (mean ± SE).
pH
n Growth Rate
(d-1)
Dry weight Productivity
(g.L-1.d-1)
Total Lipid productivity
(g.L-1.d-1)
CaCO3 productivity (mg.L-1.d-1)
P. carterae
unregulated 10 0.62±0.00 0.29±0.017 0.071±0.014 24.1±13.11
8
8
0.76±0.00 0.51±0.013 0.121±0.020 61.0±17.27
7.7 10 0.50±0.01 0.41±0.009 0.088±0.019 40.9±12.08
E. huxleyi
unregulated
7
0.98±0.01
0.31±0.023
0.061±0.013
40.0±1.90
7.8
10
0.76±0.00
0.23±0.016
0.059±0.013
28.7±0.81
The cellular lipid content remained constant between 21% and 24% of dry weight in P.
carterae, whereas in E. huxleyi the lipid content increased from 19% to 26% of dry
weight between the unregulated pH (8.1-8.3) and the pH 7.8 treatment. The highest
CaCO3 content (11% of dry weight) was achieved at pH 8 in P. carterae, whereas in E.
huxleyi there were no differences in CaCO3 content (12% of dry weight) between the
unregulated pH and pH 7.8 treatments.
152

153
6.1.3 Outdoor raceway pond
The experimental raceway pond was initially inoculated on 28/Sep/2003 with 80 L
inoculum from the Pleurochrysis carterae control raceway pond with the addition of 80
L f/2 culture medium so as to m intain the same cell concentration in both ponds
(Figure 46). The ponds were operated in semicontinuous mode and CO2 was added to
the experimental pond by a floating CO2 injector 10 cm downstream from the paddle
wheel (see page 79). The aim was to determine the effects of increasing CO2 and pH on
growth and lipid and calcium carbonate production. pH was kept constant (± 0.4 pH
units) at each set point.
The changes in cell density and pH for P. carterae are shown in Figure 46 and the
effects of different pH values on growth rates and productivities are summarised in
Table 25. The pH in both ponds was unregulated pH between 1/Oct/2003 and
15/Oct/2003 (Figure 46). During this period, the pH increased during the day from pH
8.3 to pH 11 and decreased to the initial pH of 8.3 during the night. pH decreased 2
units after each dilution and then reached the maximum daily pH within 2 h. There was
no difference in maximum cell concentration, growth rate, and productivity between the
control and experimental raceway ponds during the unregulated pH period (Table 25).
Between 16/Oct/2003 and 09/Nov/2003 the pH was set to pH 9.6 in the experimental
pond, while the pH in the control pond remained unregulated. This resulted in a higher
growth rate, total dry weight productivity, lipid productivity, and CaCO3 productivity in
the experimental pond compared to the control pond (Figure 46 and Table 25).
Between 10/Nov/2003 and 07/Dec/2003 pH was decreased to pH 9.0 in the
experimental pond (Figure 46b). While no difference was observed in growth rate and
maximum cell concentration between the two ponds, the pH regulated pond achieved
higher dry weight, lipid and CaCO3 productivities (Table 25).
a
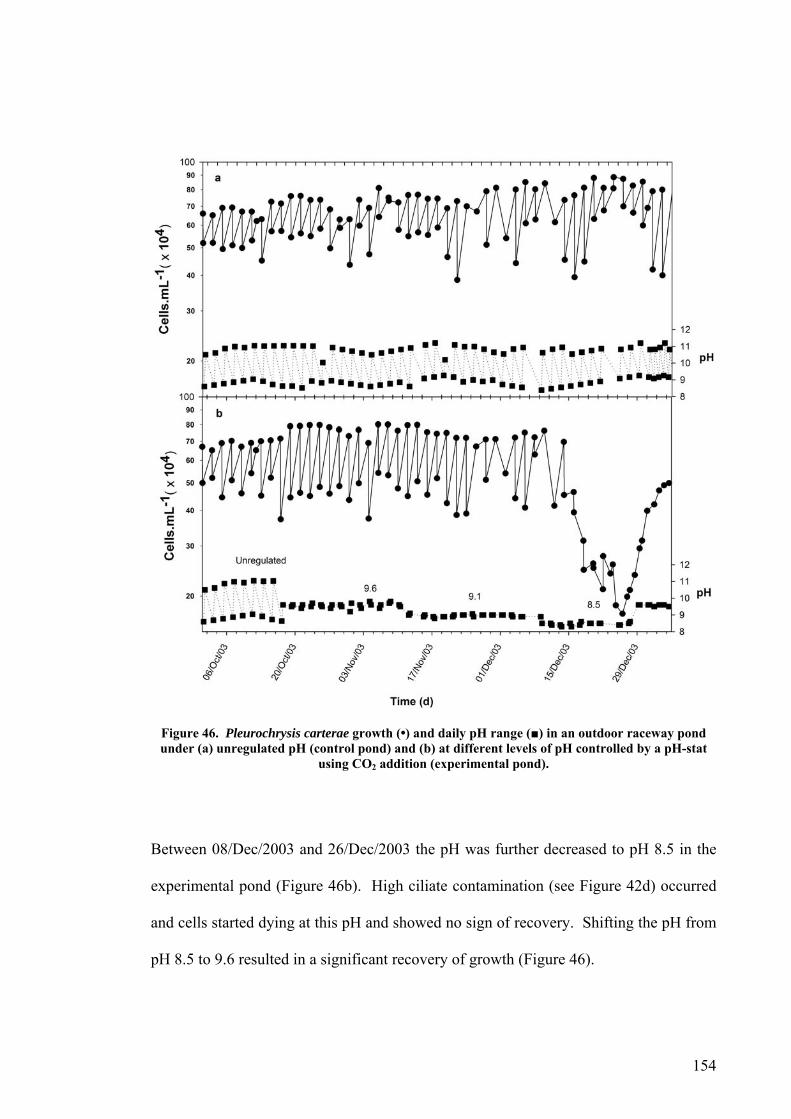
Figure 46. Pleurochrysis carterae growth (•) and daily pH range (■) in an outdoor raceway pond under (a) unregulated pH (control pond) and (b) at different levels of pH controlled by a pH-stat
using CO2 addition (experimental pond).
Between 08/Dec/2003 and 26/Dec/2003 the pH was further decreased to pH 8.5 in the
experimental pond (Figure 46b). High ciliate contamination (see Figure 42d) occurred
and cells started dying at this pH and showed no sign of recovery. Shifting the pH from
pH 8.5 to 9.6 resulted in a significant recovery of growth (Figure 46).
154
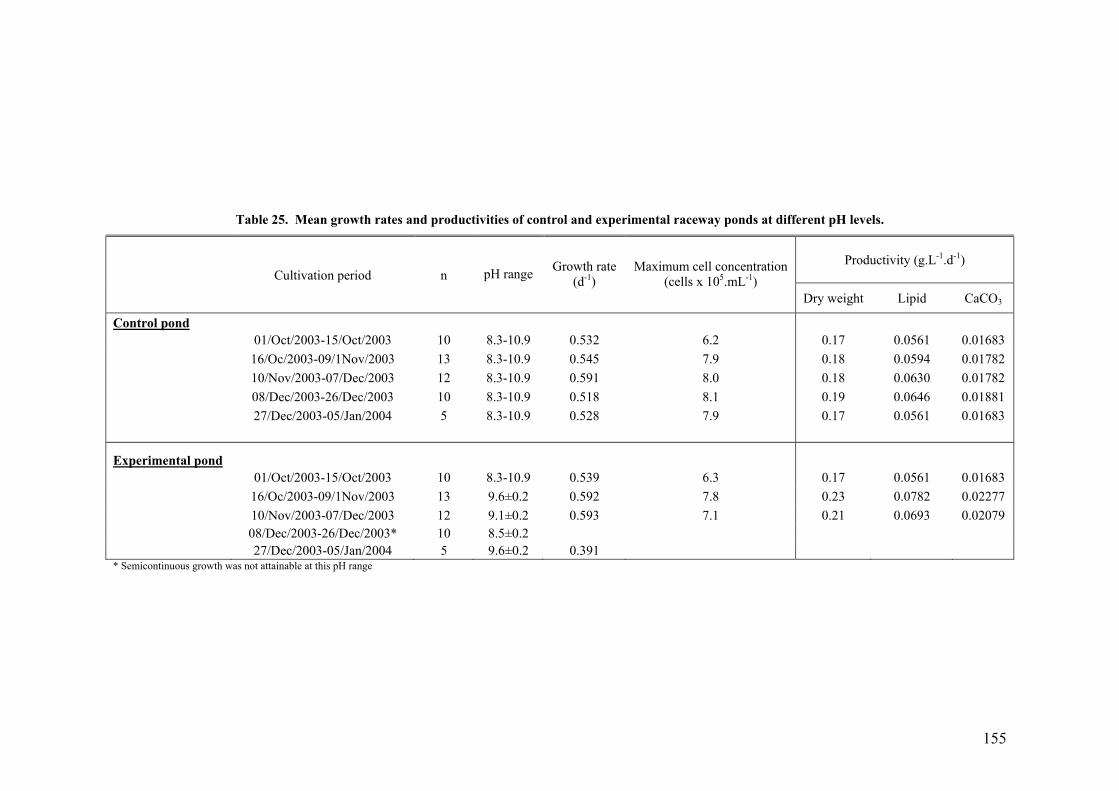
155
Table 25. Mean growth rates and productivities of control and experimental raceway ponds at different pH levels.
Cultivation period
n Productivity (g.L-1.d-1)
pH range Growth rate (d-1)
Maximum cell concentration (cells x 105.mL-1)
Dry weight Lipid CaCO3
Control pond 01/Oct/2003-15/Oct/2003 10 8.3-10.9 0.532 6.2 0.17 0.0561 0.01683 16/Oc/2003-09/1Nov/2003 13 8.3-10.9 0.545 7.9 0.18 0.0594 0.01782 10/Nov/2003-07/Dec/2003 12 8.3-10.9 0.591 8.0 0.18 0.0630 0.01782 08/Dec/2003-26/Dec/2003 10 8.3-10.9 0.518 8.1 0.19 0.0646 0.01881 27/Dec/2003-05/Jan/2004 5 8.3-10.9 0.528 7.9 0.17 0.0561 0.01683
Experimental pond
01/Oct/2003-15/Oct/2003 10 8.3-10.9 0.539 6.3 0.17 0.0561 0.01683 16/Oc/2003-09/1Nov/2003 13 9.6±0.2 0.592 7.8 0.23 0.0782 0.02277 10/Nov/2003-07/Dec/2003 12 9.1±0.2 0.593 7.1 0.21 0.0693 0.02079 08/Dec/2003-26/Dec/2003* 10 8.5±0.2 27/Dec/2003-05/Jan/2004 5 9.6±0.2 0.391 * Semicontinuous growth was not attainable at this pH range
The pH changes by CO2 addition did not affect the cellular lipid and CaCO3 content.
Total lipid content was between 32% - 34% of total dry weight and CaCO3 content was
between 9.9% and 10.2% of total dry weight in both ponds.
6.2 Effect of depth
In Chapter 5 growth of P. carterae was shown to be possible for a period of at least 13
months in an outdoor raceway pond. Pond depth has been shown to affect the
productivity of raceway ponds (Abeliovich 1980, Azov, et al. 1980, Carberry and
Brunner 1991) and therefore the effect of different pond depths on the growth and
productivity of P. carterae during autumn (06/Apr/2003 to 31/May/2003) and spring
(08/Jan/2004 to 29/Feb/2004) was studied. One pond, used as a control, was operated at
16 cm depth, while the other pond was initially operated at a depth of 13 cm, and the
depth was then increased to 16 cm, 18 cm, and 21 cm depth by adding f/2 medium. The
initial cell densities in both ponds were 5.7 ± 0.2 and 8.0 ± 0.3 cells x 105.mL-1 for
autumn and spring respectively. The cell density variation was mainly due to higher
cell density achieved during the summer. Both ponds were operated in semicontinuous
mode. Cell density and dry weight were determined daily. Samples were also collected
to count and weigh coccoliths and for lipid determination.
The culture grew at all depths during both autumn and summer (Figure 47). During
autumn, the best growth and productivities were observed at depths of 13 cm and 16
cm, and growth and productivity decreased with increasing depth to 18 cm and 21 cm
(Figure 47 and Table 26). During summer, on the other hand, growth and productivities
increased when the depth was increased from 13 cm to 21 cm (Figure 47 and Table 26).
156
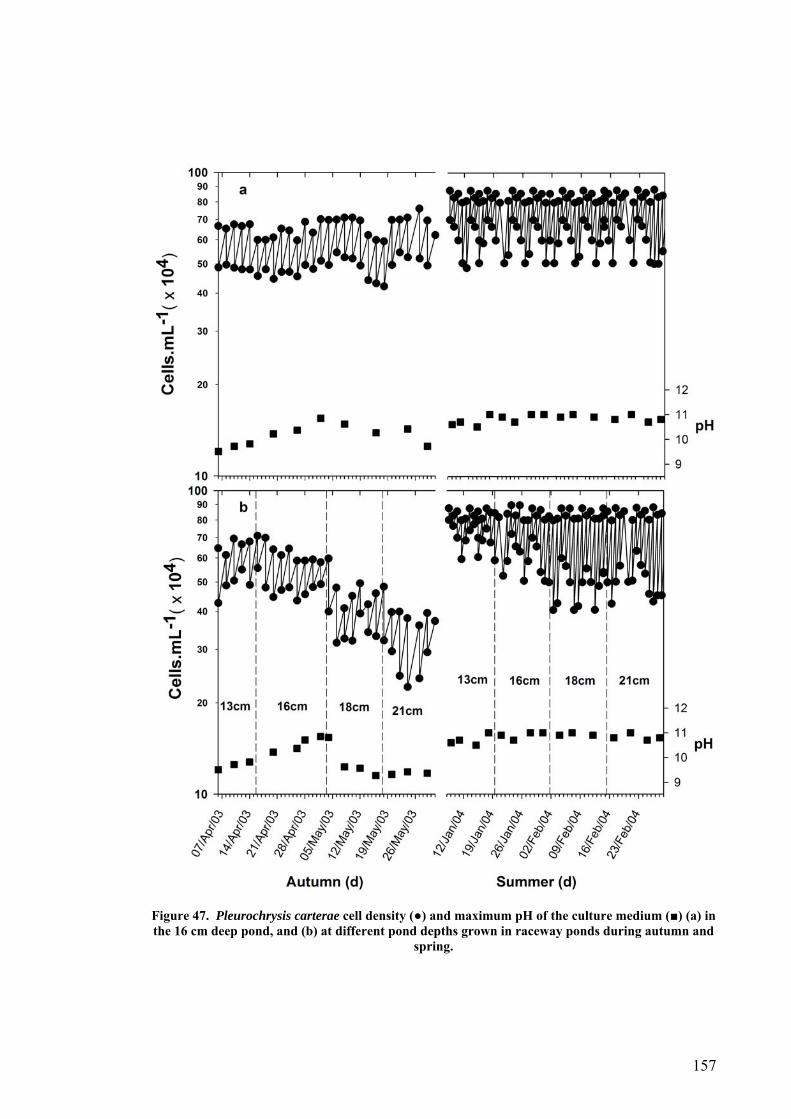
Figure 47. Pleurochrysis carterae cell density (●) and maximum pH of the culture medium (■) (a) in the 16 cm deep pond, and (b) at different pond depths grown in raceway ponds during autumn and
spring.
157
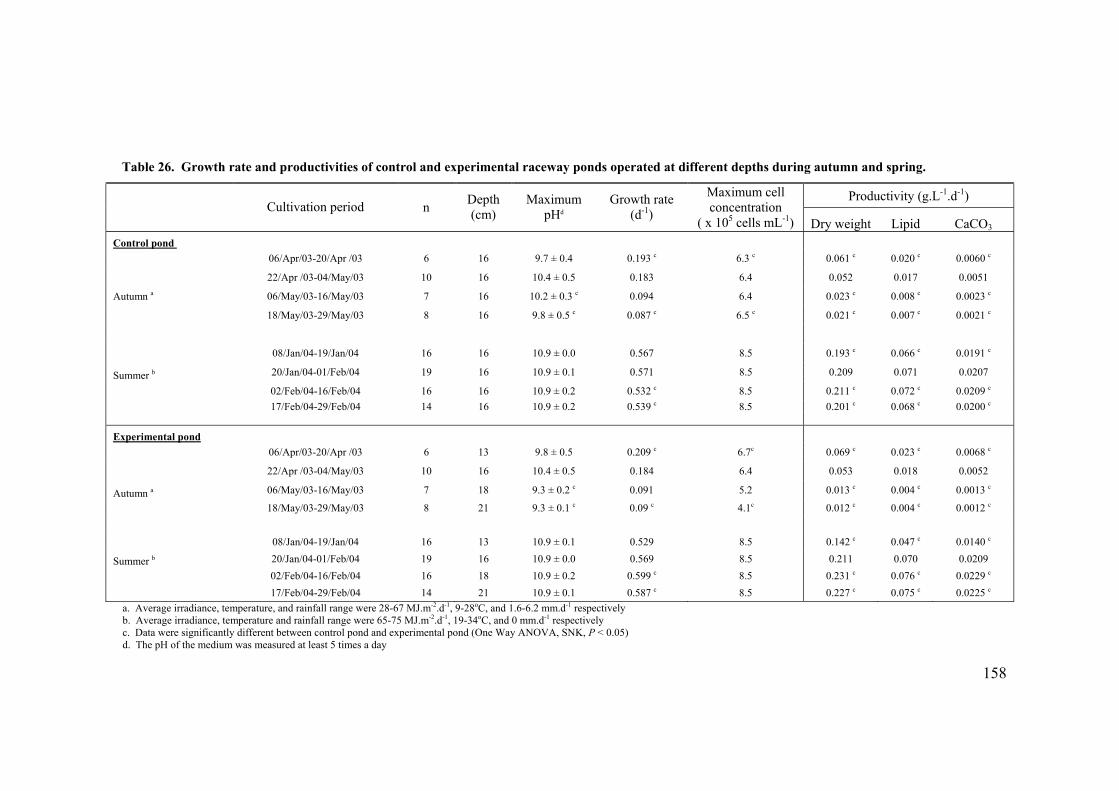
158
Table 26. Growth rate and productivities of control and experimental raceway ponds operated at different depths during autumn and spring.
Productivity (g.L-1.d-1)
Cultivation period
n Depth
(cm) Maximum
pHdGrowth rate
(d-1)
Maximum cell concentration
( x 105 cells mL-1) Dry weight Lipid CaCO3
Control pond
06/Apr/03-20/Apr /03 6 16 9.7 ± 0.4 0.193 c 6.3 c 0.061 c 0.020 c 0.0060 c
22/Apr /03-04/May/03 10 16 10.4 ± 0.5 0.183 6.4 0.052 0.017 0.0051
06/May/03-16/May/03 7 16 10.2 ± 0.3 c 0.094 6.4 0.023 c 0.008 c 0.0023 cAutumn a
18/May/03-29/May/03 8 16 9.8 ± 0.5 c 0.087 c 6.5 c 0.021 c 0.007 c 0.0021 c
08/Jan/04-19/Jan/04 16 16 10.9 ± 0.0 0.567 8.5 0.193 c 0.066 c 0.0191 c
Summer b 20/Jan/04-01/Feb/04 19 16 10.9 ± 0.1 0.571 8.5 0.209 0.071 0.0207
02/Feb/04-16/Feb/04 16 16 10.9 ± 0.2 0.532 c 8.5 0.211 c 0.072 c 0.0209 c
17/Feb/04-29/Feb/04 14 16 10.9 ± 0.2 0.539 c 8.5 0.201 c 0.068 c 0.0200 c
Experimental pond
06/Apr/03-20/Apr /03 6 13 9.8 ± 0.5 0.209 c 6.7c 0.069 c 0.023 c 0.0068 c
22/Apr /03-04/May/03 10 16 10.4 ± 0.5 0.184 6.4 0.053 0.018 0.0052
Autumn a 06/May/03-16/May/03 7 18 9.3 ± 0.2 c 0.091 5.2 0.013 c 0.004 c 0.0013 c
18/May/03-29/May/03 8 21 9.3 ± 0.1 c 0.09 c 4.1c 0.012 c 0.004 c 0.0012 c
08/Jan/04-19/Jan/04 16 13 10.9 ± 0.1 0.529 8.5 0.142 c 0.047 c 0.0140 c
Summer b 20/Jan/04-01/Feb/04 19 16 10.9 ± 0.0 0.569 8.5 0.211 0.070 0.0209
02/Feb/04-16/Feb/04 16 18 10.9 ± 0.2 0.599 c 8.5 0.231 c 0.076 c 0.0229 c
17/Feb/04-29/Feb/04 14 21 10.9 ± 0.1 0.587 c 8.5 0.227 c 0.075 c 0.0225 c
a. Average irradiance, temperature, and rainfall range were 28-67 MJ.m-2.d-1, 9-28oC, and 1.6-6.2 mm.d-1 respectively b. Average irradiance, temperature and rainfall range were 65-75 MJ.m-2.d-1, 19-34oC, and 0 mm.d-1 respectively c. Data were significantly different between control pond and experimental pond (One Way ANOVA, SNK, P < 0.05) d. The pH of the medium was measured at least 5 times a day
The pH of the medium increased from pH 8.1 ± 0.2 to pH 9.9 ± 0.4 in autumn and from
pH 8.1 ± 0.2 to pH 10.9 ± 0.1 in summer. While no differences were found in the
maximum pH of the medium between the ponds in summer, a lower maximum pH was
observed at 18 and 21 cm depth compared to 16 cm depth in autumn (Table 26). Total
cellular lipid and calcium content did not change between autumn and summer in both
ponds and were 33% - 34% and 9.9% - 10.2% of total dry weight respectively in both
ponds (Table 26).
6.3 Photoinhibition and photoadaptation
High light and high oxygen concentration can negatively affect the photophysiology of
microalgae grown in outdoor ponds resulting in decrease in the optimum productivity
(Vonshak, et al. 1982, Richmond, et al. 1990, Lee 1993, Jimenez, et al. 2003b). The
sensitivity of photosynthesis of P. carterae to high light and high oxygen was therefore
examined in the laboratory and the outdoor grown algae as well as the ability of this
alga to adapt to high light.
The diurnal changes in the concentration of dissolved oxygen and its relation to
temperature and irradiance for Pleurochrysis carterae grown outdoor in a raceway pond
in September and November 2003 and February 2004 are presented in Figure 48. The
dissolved oxygen concentration pattern was the same throughout the day in each of the
months. In the early morning there was a surge in pond [O2] reaching a maximum value
about noon and decreasing rapidly within 4 h thereafter (Figure 48). Although the
maximum pond temperature increased from 12oC to 23oC at about 13:00 hours in
September, and from 15oC to 33oC in November, and from 17oC to 31oC in February,
there was no marked difference in the daily pattern of dissolved oxygen concentration
between these three months (Figure 48).
159
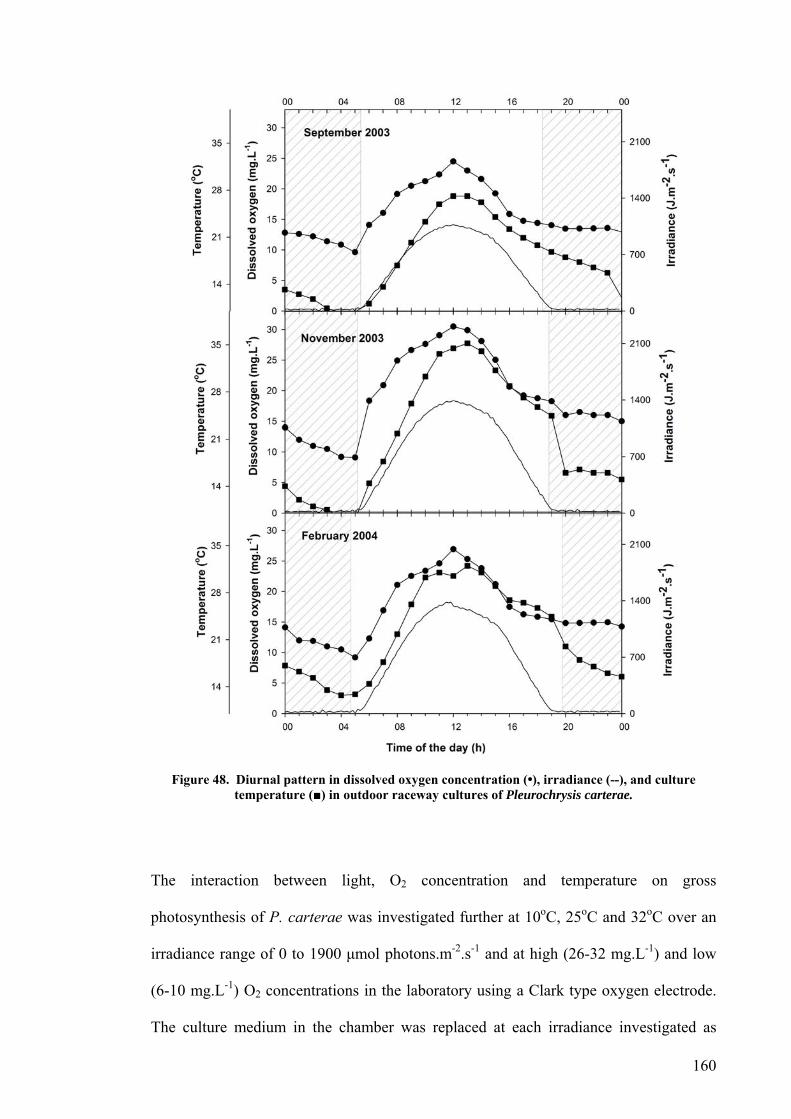
Figure 48. Diurnal pattern in dissolved oxygen concentration (•), irradiance (--), and culture temperature (■) in outdoor raceway cultures of Pleurochrysis carterae.
The interaction between light, O2 concentration and temperature on gross
photosynthesis of P. carterae was investigated further at 10oC, 25oC and 32oC over an
irradiance range of 0 to 1900 µmol photons.m-2.s-1 and at high (26-32 mg.L-1) and low
(6-10 mg.L-1) O2 concentrations in the laboratory using a Clark type oxygen electrode.
The culture medium in the chamber was replaced at each irradiance investigated as
160
161
preliminary studies had indicated that keeping the samples for more than 15 min in the
oxygen chamber affected the algae (data not shown). Two sources of P. carterae were
used for these experiments: (1) samples taken from a raceway pond before sunrise; and
(2) samples taken from a culture grown at 25oC in a constant temperature room under
300 µmol photons.m-2.s-1 and a 12/12 light/dark cycle.
Cell concentrations were kept at 1 x 10⁵ cells.mL-1 for each experiment by diluting the
sample with residual culture medium prepared by filtering 50 mL of culture prior to
experiment. Samples were kept in the dark for 10-15 min prior to each experiment in a
water bath at the same temperature as the experimental temperature and stirred gently
every 5 min. The oxygen concentration was adjusted to the required concentration by
either bubbling N2 or by letting the algae photosynthesise in the oxygen chamber at an
irradiance of 200 µmol photons.m-2.s-1, unstirred, for up to 12 min. The nature of this
experiment did not allow measurement of all the treatments in one day, especially for
the outdoor culture, therefore the following results are the outcome of several days of
measurements.
In both samples the highest photosynthetic rate achieved in high light and at low oxygen
concentrations (Figure 49). The main differences between the two treatments were
observed between 25oC and 32oC. The laboratory grown P. carterae had the highest
photosynthetic rate at 25oC (Figure 49b), whereas the outdoor grown algae had the
highest photosynthetic rate at 32oC (Figure 49a) indicating that the cultures had adapted
to the temperature at which they were cultured.
The results also show a high inhibition of photosynthesis by high oxygen concentration
at both low and high irradiances irrespective of temperature in both indoor and outdoor
grown P. carterae (Figure 49). At low oxygen concentration, the photosynthetic rate in
the outdoor raceway grown P. carterae decreased with increasing the temperature. In
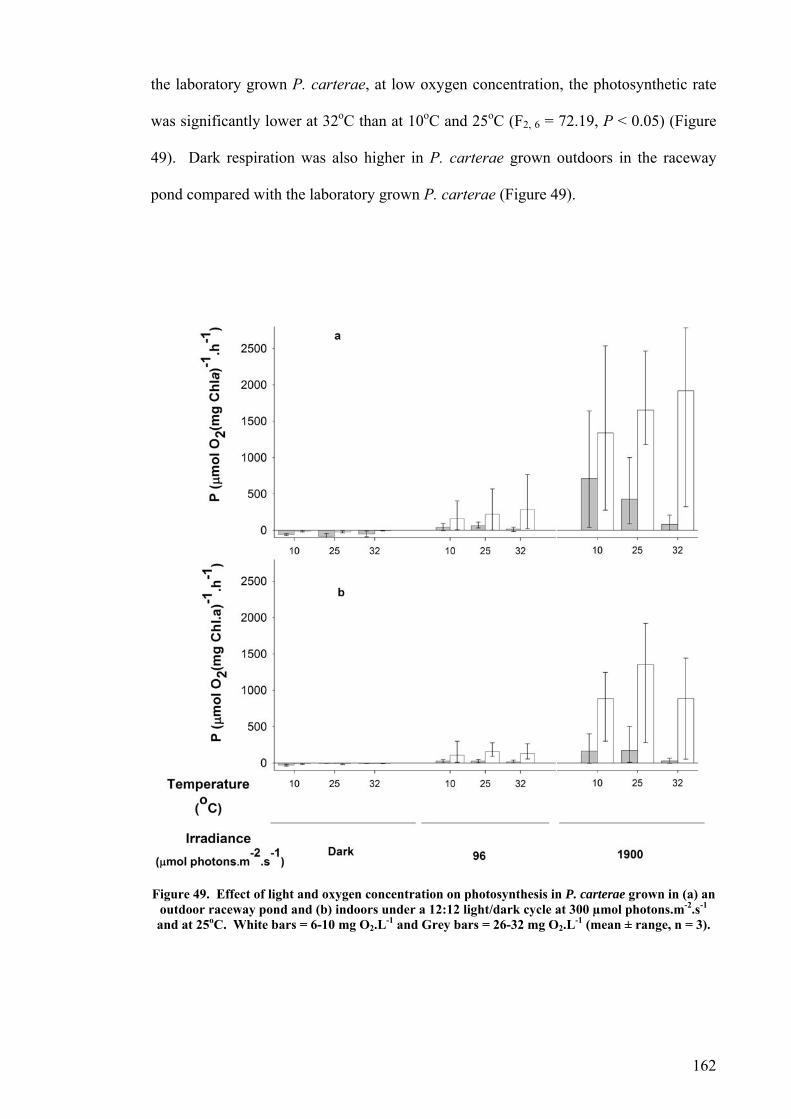
the laboratory grown P. carterae, at low oxygen concentration, the photosynthetic rate
was significantly lower at 32oC than at 10oC and 25oC (F2, 6 = 72.19, P < 0.05) (Figure
49). Dark respiration was also higher in P. carterae grown outdoors in the raceway
pond compared with the laboratory grown P. carterae (Figure 49).
Figure 49. Effect of light and oxygen concentration on photosynthesis in P. carterae grown in (a) an outdoor raceway pond and (b) indoors under a 12:12 light/dark cycle at 300 µmol photons.m-2.s-1 and at 25oC. White bars = 6-10 mg O2.L-1 and Grey bars = 26-32 mg O2.L-1 (mean ± range, n = 3).
162
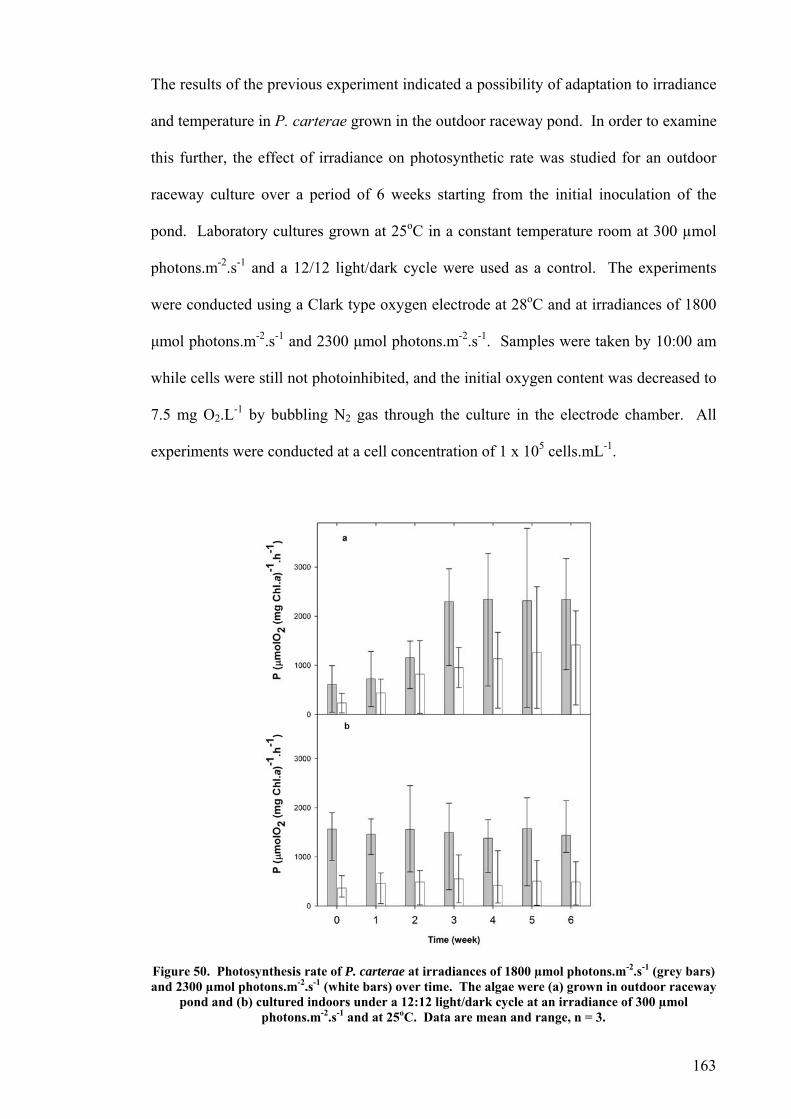
The results of the previous experiment indicated a possibility of adaptation to irradiance
and temperature in P. carterae grown in the outdoor raceway pond. In order to examine
this further, the effect of irradiance on photosynthetic rate was studied for an outdoor
raceway culture over a period of 6 weeks starting from the initial inoculation of the
pond. Laboratory cultures grown at 25oC in a constant temperature room at 300 µmol
photons.m-2.s-1 and a 12/12 light/dark cycle were used as a control. The experiments
were conducted using a Clark type oxygen electrode at 28oC and at irradiances of 1800
µmol photons.m-2.s-1 and 2300 µmol photons.m-2.s-1. Samples were taken by 10:00 am
while cells were still not photoinhibited, and the initial oxygen content was decreased to
7.5 mg O2.L-1 by bubbling N2 gas through the culture in the electrode chamber. All
experiments were conducted at a cell concentration of 1 x 10⁵ cells.mL-1.
Figure 50. Photosynthesis rate of P. carterae at irradiances of 1800 µmol photons.m-2.s-1 (grey bars) and 2300 µmol photons.m-2.s-1 (white bars) over time. The algae were (a) grown in outdoor raceway
pond and (b) cultured indoors under a 12:12 light/dark cycle at an irradiance of 300 µmol photons.m-2.s-1 and at 25oC. Data are mean and range, n = 3.
163
No significant differences were detected in the photosynthetic rate at either irradiance
between week 0 and 6 in the laboratory cultured P. carterae (One Way ANOVA, P >
0.05) (Figure 50). However, in the outdoor culture at both irradiances, the
photosynthetic rate increased between week 0 and 4 and remained constant thereafter at
both irradiances (Figure 50) indicating that the outdoor culture had adapted to the higher
irradiance. The mean photosynthetic rate observed between week 0 and 3 in the indoor
grown algae was higher than that of the outdoor culture, however from week 4 the
outdoor culture had a higher mean photosynthetic rate (Figure 50).
6.4 Effect of morning temperature on growth
Early morning low temperature stress has been reported to be one of the major limiting
factors on the growth of algae in outdoor cultures, especially during cold seasons
(Goldman 1977, Lee 1993, Zhang, et al. 1999, Vonshak, et al. 2001). As pointed out by
Vonshak and Richmond (1988) high net biomass output may not be achieved in open
ponds principally due to the difficulties in maintaining the optimal temperature
throughout the day and over the whole year. Indeed, even during summer when the day
temperature reaches maximum values, the morning temperature of the culture is often
10oC to 15oC below the optimum in warm temperate climates, preventing full
exploitation of the photosynthetic capability of the culture for a few hours in the
morning until the culture warms up.
The effect of artificially increased culture temperature in the morning on the growth of
P. carterae in the outdoor raceway pond therefore was studied and compared with an
164
un-heated culture during the winter of 2003. The cultures in both raceway ponds were
maintained in semicontinuous culture at a depth of 16 cm. Each morning before sunrise
one raceway pond was diluted with fresh f/2 culture medium with a temperature of less
than 15oC; while the other pond was diluted with medium preheated to 37oC resulting in
an overall 3oC to 5oC temperature increase after each dilution in the heated pond
compared to the un-heated pond. The dilution rate was based on the cell concentration
and growth rate.
Heavy rainfall of up to 10 mm.d-1 and low air temperatures as low as 3oC by mid June
resulted in loss of the culture in both ponds (Figure 51a and b), but semicontinuous
growth was attainable for 6 days longer in the heated pond compared to the unheated
pond. Following this collapse of the culture, the raceway ponds were re-inoculated,
however in late August and early September heavy rain again affected both ponds
negatively (Figure 51a and b), but the impact of the rain was much lower in the
experimental pond compared to control pond (Figure 51c and d).
While no differences were found in the maximum cell densities between the two ponds,
the heated pond achieved higher productivities compared to the un-heated pond (Table
27). Overall, the total biomass as dry weight in the heated pond was 11% - 21% higher
than in the un-heated pond. The heated pond also had a 14% - 25% higher lipid
productivity and 9% - 24% higher CaCO3 productivity. The cellular lipid and CaCO3
content of P. carterae in both ponds were 30-32% and 9.5-10.1% respectively. The
maximum daily pH of the culture medium which is an indicator of culture “health” (see
page 146) was also a little higher in the experimental pond than the control pond (Figure
51 and Table 27).
165
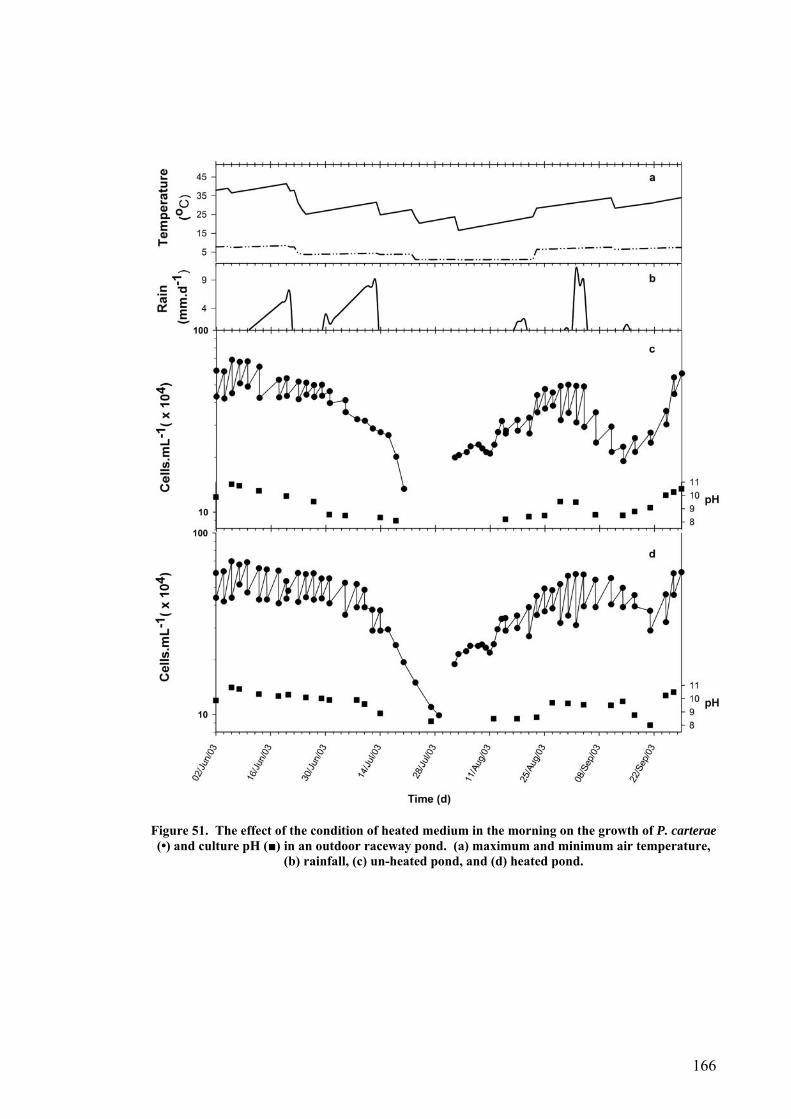
Figure 51. The effect of the condition of heated medium in the morning on the growth of P. carterae (•) and culture pH (■) in an outdoor raceway pond. (a) maximum and minimum air temperature,
(b) rainfall, (c) un-heated pond, and (d) heated pond.
166
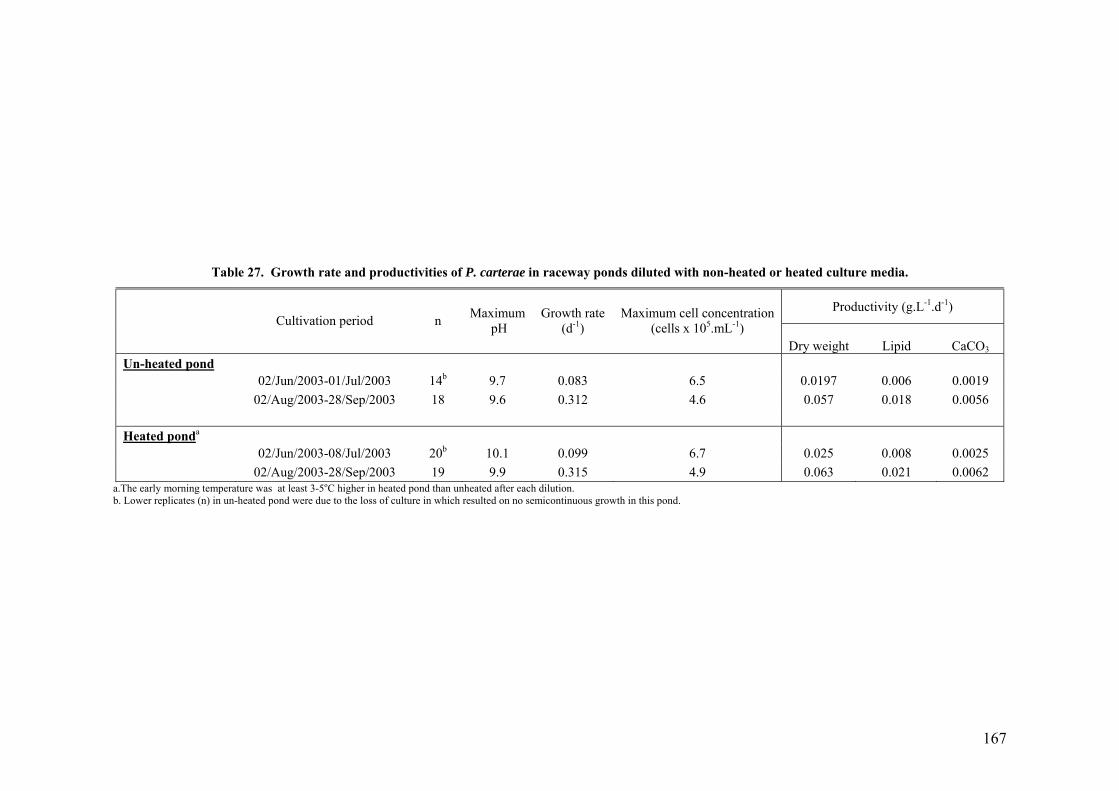
167
Table 27. Growth rate and productivities of P. carterae in raceway ponds diluted with non-heated or heated culture media.
Productivity (g.L-1.d-1)
Cultivation period n Maximum pH
Growth rate (d-1)
Maximum cell concentration (cells x 105.mL-1)
Dry weight Lipid CaCO3
Un-heated pond 02/Jun/2003-01/Jul/2003 14b 9.7 0.083 6.5 0.0197 0.006 0.0019 02/Aug/2003-28/Sep/2003 18 9.6 0.312 4.6 0.057 0.018 0.0056 Heated ponda 02/Jun/2003-08/Jul/2003 20b 10.1 0.099 6.7 0.025 0.008 0.0025 02/Aug/2003-28/Sep/2003 19 9.9 0.315 4.9 0.063 0.021 0.0062
a.The early morning temperature was at least 3-5oC higher in heated pond than unheated after each dilution. b. Lower replicates (n) in un-heated pond were due to the loss of culture in which resulted on no semicontinuous growth in this pond.
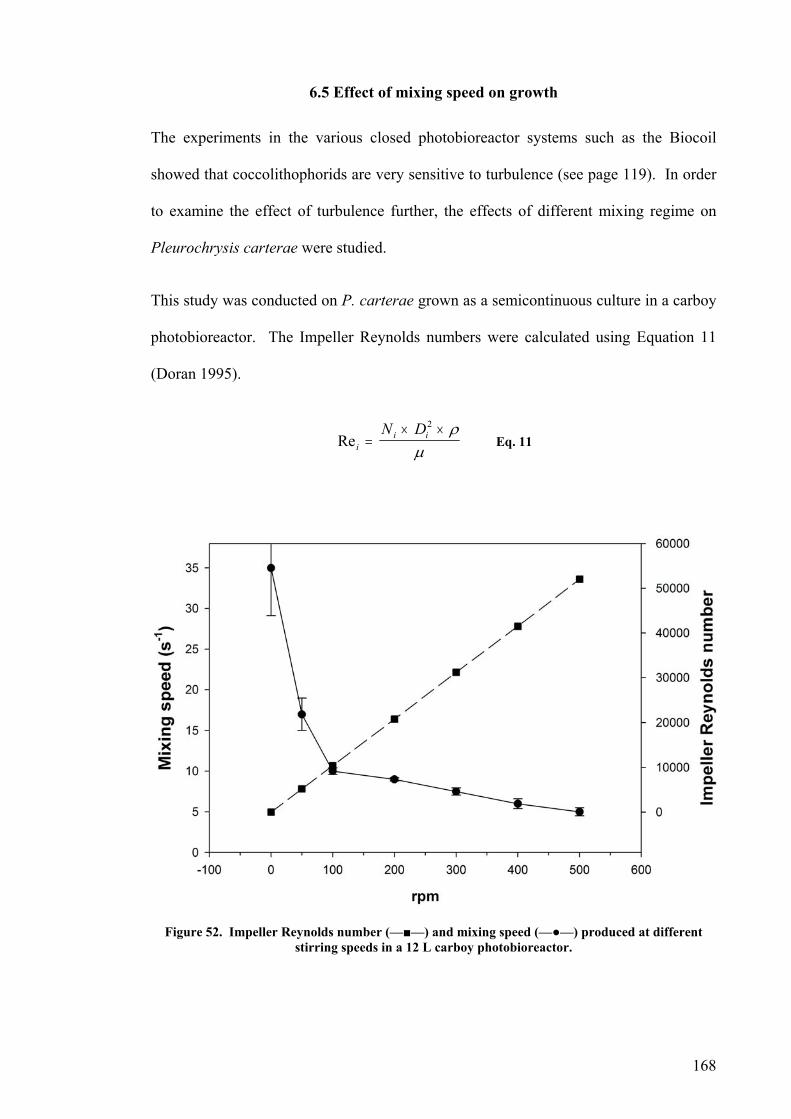
6.5 Effect of mixing speed on growth
The experiments in the various closed photobioreactor systems such as the Biocoil
showed that coccolithophorids are very sensitive to turbulence (see page 119). In order
to examine the effect of turbulence further, the effects of different mixing regime on
Pleurochrysis carterae were studied.
This study was conducted on P. carterae grown as a semicontinuous culture in a carboy
photobioreactor. The Impeller Reynolds numbers were calculated using Equation 11
(Doran 1995).
Reii iN D
=× ×2 ρµ
Eq. 11
Figure 52. Impeller Reynolds number (—■—) and mixing speed (—●—) produced at different stirring speeds in a 12 L carboy photobioreactor.
168

where Rei is the impeller Reynolds number, Ni is stirrer speed, Di is impeller diameter, ρ
is fluid density and µ is fluid viscosity. Reactors were aerated using constant sterile
humified air (45 L.h-1).
Turbulence was varied by changing the stirring speed of the stir bar from 0 to 600 rpm
providing mixing regimes in the range of 9 s-1 to 35 s-1 measured by mixing the time
required for India ink to mix completely in the reactor and an impeller Reynolds number
in the range of 0 to 52000 (Figure 52).
Once the culture reached early stationary phase at around 5.6 x 10⁵ cells.mL-1
semicontinuous culture at a maximum cell concentration of 5.2 x 10⁵ cells.mL-1 was
established (Figure 53). Increasing the stirring bar speed from 0 to 200 rpm resulted in
significantly higher growth rates (F6, 98 = 309.55, P < 0.05), however speeds higher than
Figure 53. Growth curve (—●—) and growth rate (▼) of P. carterae grown under different stirring speed conditions in a carboy photobireactor (mean ± SE, ncell density = 4 and nspecific growth rate = 15).
169
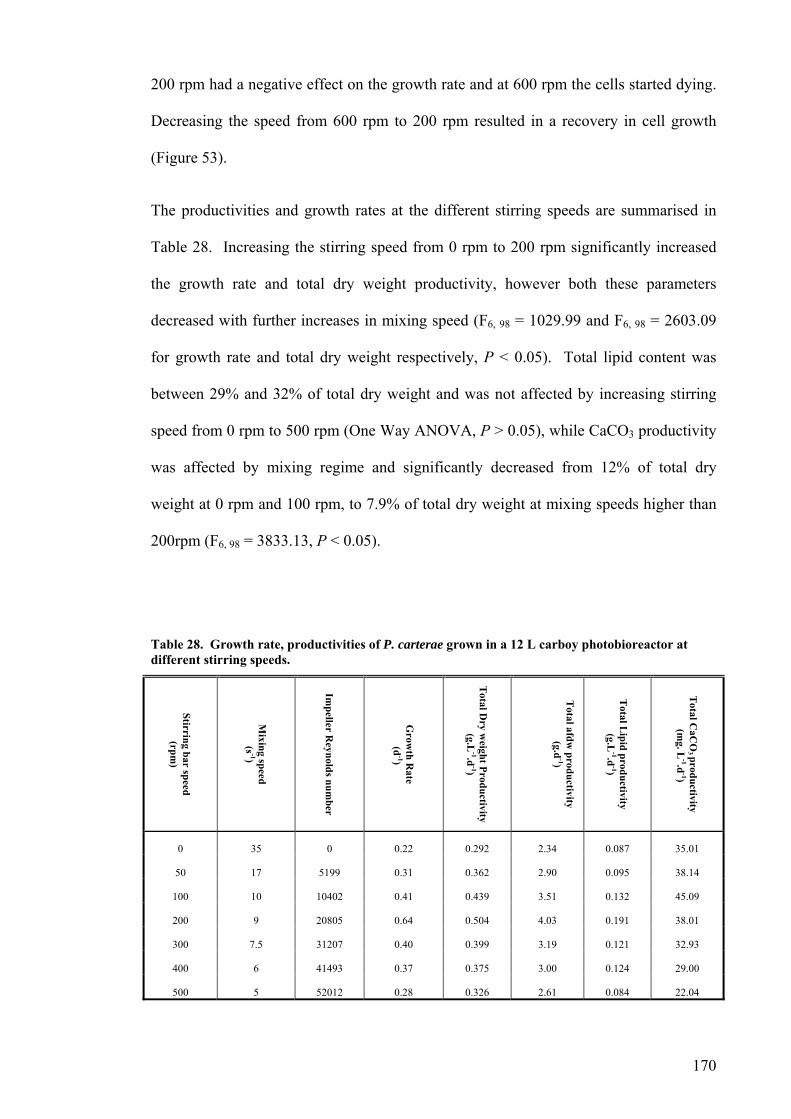
200 rpm had a negative effect on the growth rate and at 600 rpm the cells started dying.
Decreasing the speed from 600 rpm to 200 rpm resulted in a recovery in cell growth
(Figure 53).
The productivities and growth rates at the different stirring speeds are summarised in
Table 28. Increasing the stirring speed from 0 rpm to 200 rpm significantly increased
the growth rate and total dry weight productivity, however both these parameters
decreased with further increases in mixing speed (F6, 98 = 1029.99 and F6, 98 = 2603.09
for growth rate and total dry weight respectively, P < 0.05). Total lipid content was
between 29% and 32% of total dry weight and was not affected by increasing stirring
speed from 0 rpm to 500 rpm (One Way ANOVA, P > 0.05), while CaCO3 productivity
was affected by mixing regime and significantly decreased from 12% of total dry
weight at 0 rpm and 100 rpm, to 7.9% of total dry weight at mixing speeds higher than
200rpm (F6, 98 = 3833.13, P < 0.05).
Table 28. Growth rate, productivities of P. carterae grown in a 12 L carboy photobioreactor at different stirring speeds.
Stirring bar speed (rpm
)
Mixing speed
(s -1)
Impeller R
eynolds number
Grow
th Rate
(d-1)
Total D
ry weight Productivity
(g.L-1.d
-1)
Total afdw
productivity (g.d
-1)
Total L
ipid productivity (g.L
-1.d-1)
Total C
aCO
3 productivity (m
g. L-1.d
-1)
0 35 0 0.22 0.292 2.34 0.087 35.01
50 17 5199 0.31 0.362 2.90 0.095 38.14
100 10 10402 0.41 0.439 3.51 0.132 45.09
200 9 20805 0.64 0.504 4.03 0.191 38.01
300 7.5 31207 0.40 0.399 3.19 0.121 32.93
400 6 41493 0.37 0.375 3.00 0.124 29.00
500 5 52012 0.28 0.326 2.61 0.084 22.04
170
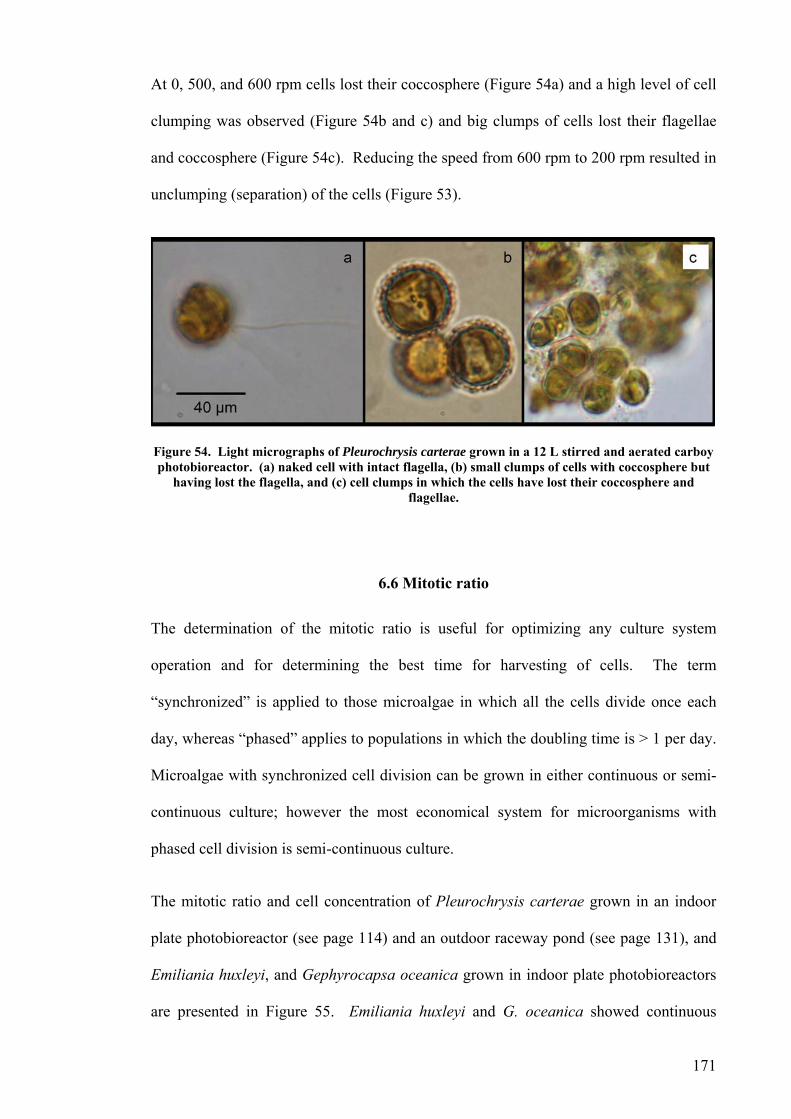
At 0, 500, and 600 rpm cells lost their coccosphere (Figure 54a) and a high level of cell
clumping was observed (Figure 54b and c) and big clumps of cells lost their flagellae
and coccosphere (Figure 54c). Reducing the speed from 600 rpm to 200 rpm resulted in
unclumping (separation) of the cells (Figure 53).
Figure 54. Light micrographs of Pleurochrysis carterae grown in a 12 L stirred and aerated carboy photobioreactor. (a) naked cell with intact flagella, (b) small clumps of cells with coccosphere but
having lost the flagella, and (c) cell clumps in which the cells have lost their coccosphere and flagellae.
6.6 Mitotic ratio
The determination of the mitotic ratio is useful for optimizing any culture system
operation and for determining the best time for harvesting of cells. The term
“synchronized” is applied to those microalgae in which all the cells divide once each
day, whereas “phased” applies to populations in which the doubling time is > 1 per day.
Microalgae with synchronized cell division can be grown in either continuous or semi-
continuous culture; however the most economical system for microorganisms with
phased cell division is semi-continuous culture.
The mitotic ratio and cell concentration of Pleurochrysis carterae grown in an indoor
plate photobioreactor (see page 114) and an outdoor raceway pond (see page 131), and
Emiliania huxleyi, and Gephyrocapsa oceanica grown in indoor plate photobioreactors
are presented in Figure 55. Emiliania huxleyi and G. oceanica showed continuous
171
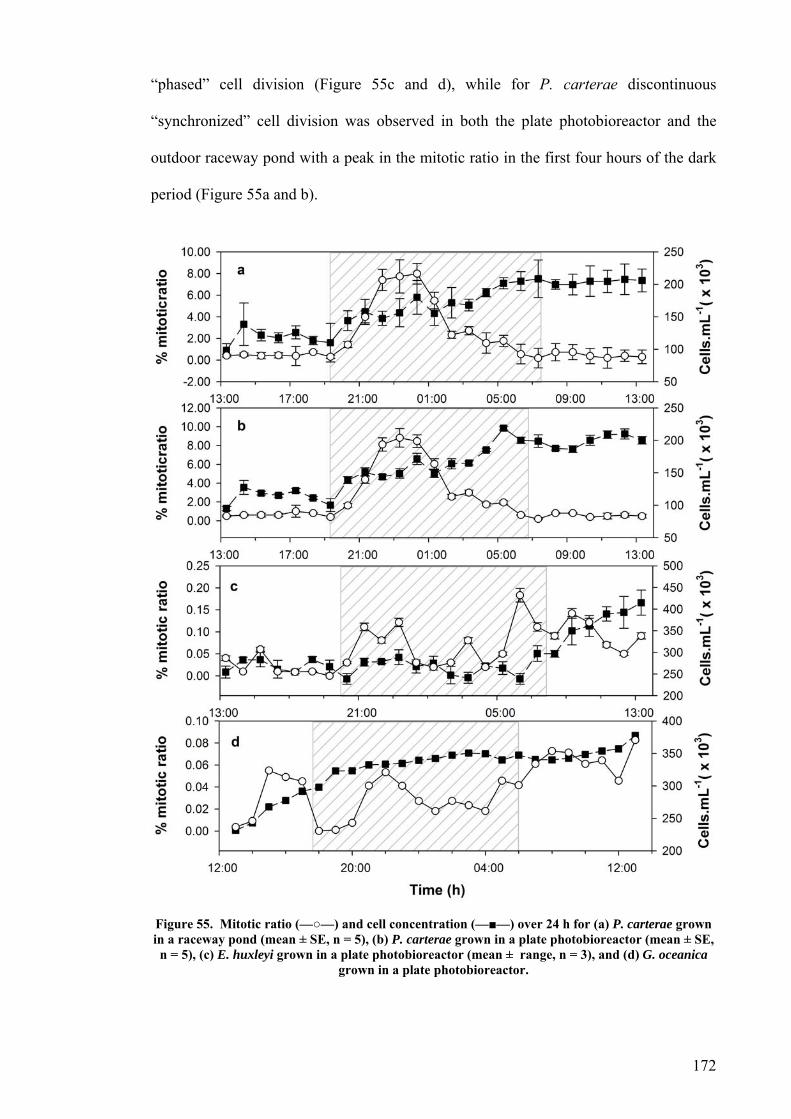
“phased” cell division (Figure 55c and d), while for P. carterae discontinuous
“synchronized” cell division was observed in both the plate photobioreactor and the
outdoor raceway pond with a peak in the mitotic ratio in the first four hours of the dark
period (Figure 55a and b).
Figure 55. Mitotic ratio (—○—) and cell concentration (—■—) over 24 h for (a) P. carterae grown in a raceway pond (mean ± SE, n = 5), (b) P. carterae grown in a plate photobioreactor (mean ± SE, n = 5), (c) E. huxleyi grown in a plate photobioreactor (mean ± range, n = 3), and (d) G. oceanica
grown in a plate photobioreactor.
172

The coccolith concentrations and pH of the culture medium for all species over a 24 h
period are presented in Figure 56. The pH of the culture media remained constant in the
range of pH 8.3 to 8.5 in the E. huxleyi culture and between pH 7.9 to 8.1 in G.
oceanica (Figure 56c and d). Between sunrise and sunset the pH of the culture medium
in the P. carterae culture increased from pH 7.8 to 10.1 in the plate photobioreactor and
from pH 8.2 to 11 in raceway pond and decreased to the initial pH of pH 8 ± 0.2 by the
end of the night period (Figure 56a and b). In E. huxleyi and G. oceanica the coccolith
concentration increased from the start of light period and there appeared to be little
decalcification during the night period (Figure 56c and d). In P. carterae cultures
coccolith concentration increased from 2 x 10⁶ to 9 x 10⁶ coccoliths.mL-1 during light
period (Figure 56a and b) and a high level of decalcification was observed in the first
five hours of the dark period together with a decrease in the pH of the culture medium
(Figure 56a and b).
Pearson product-moment correlation indicates a significant positive association between
the pH of the culture medium and the coccolith concentration in the culture of P.
carterae (r = -0.69, df = 24, P < 0.05), whereas there was no correlations between pH
and coccolith concentration in the cultures of E. huxleyi and G. oceanica (r = -0.31 and r
= -0.12 for E. huxleyi and G. oceanica respectively, df = 24, P > 0.05).
Cell dry weight decreased by 55% and 75% during the dark period followed by an
increase during the light period in all species (Figure 57).
173
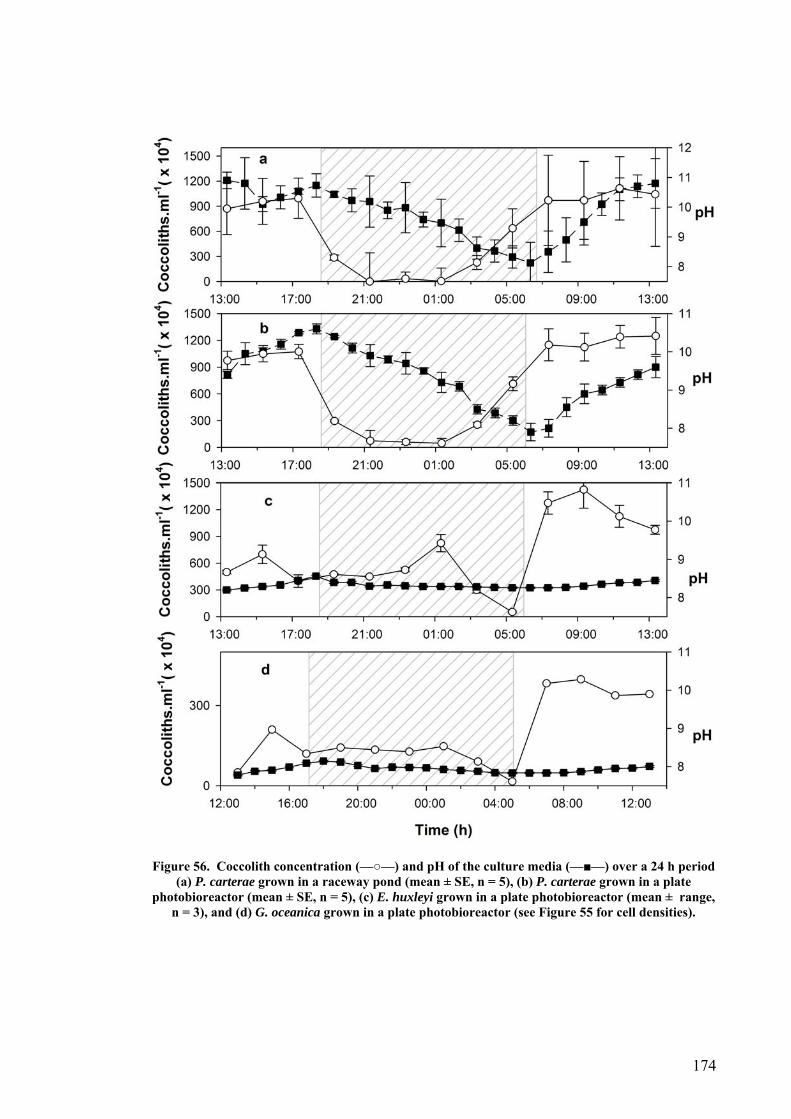
Figure 56. Coccolith concentration (—○—) and pH of the culture media (—■—) over a 24 h period (a) P. carterae grown in a raceway pond (mean ± SE, n = 5), (b) P. carterae grown in a plate
photobioreactor (mean ± SE, n = 5), (c) E. huxleyi grown in a plate photobioreactor (mean ± range, n = 3), and (d) G. oceanica grown in a plate photobioreactor (see Figure 55 for cell densities).
174
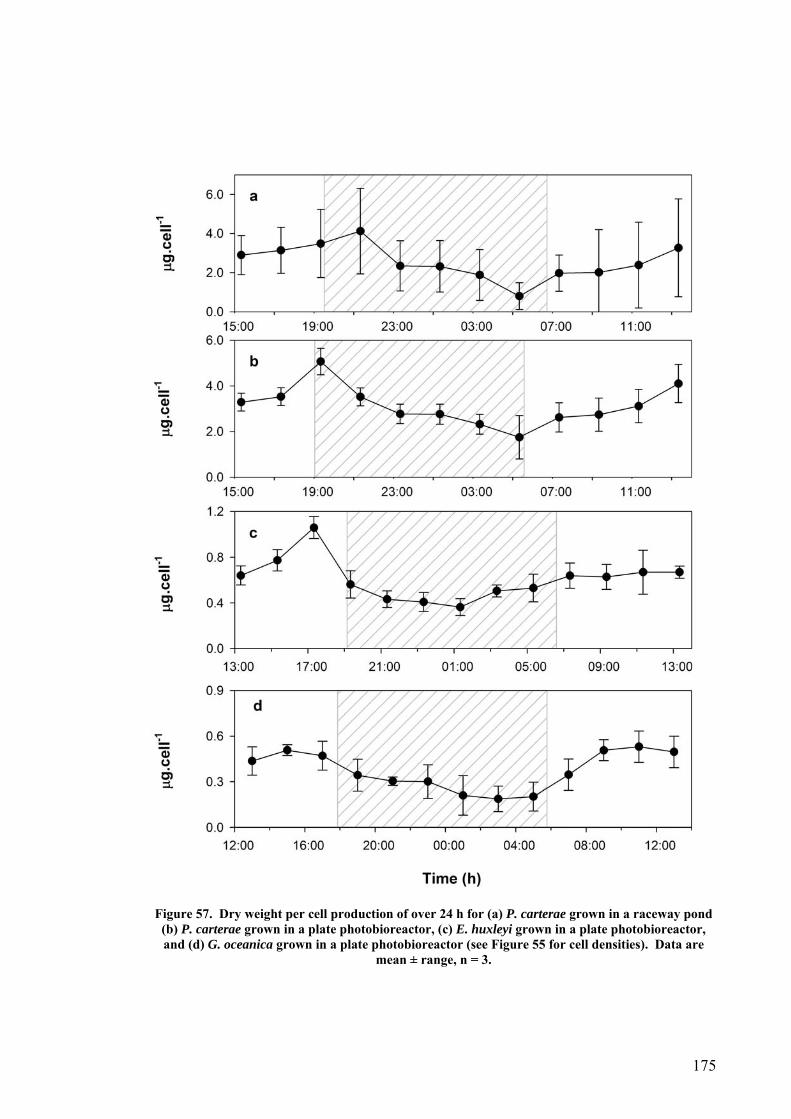
Figure 57. Dry weight per cell production of over 24 h for (a) P. carterae grown in a raceway pond (b) P. carterae grown in a plate photobioreactor, (c) E. huxleyi grown in a plate photobioreactor, and (d) G. oceanica grown in a plate photobioreactor (see Figure 55 for cell densities). Data are
mean ± range, n = 3.
175
6.7 Discussion
6.7.1 CO2 and pH
The pH of the culture medium is an important factor in algal cultivation. It can
determine the solubility and availability of CO2 and minerals in the culture and can
directly or indirectly influence the metabolism of the algae (Bunt 1971, Raven 1980).
Microalgae have different requirements when it comes to growth pH (Yang and Gao
2003). For example Cyanidium has been found to grow best at pH 2 whereas Spirulina
grows well between pH 9 and 11 (Venkataraman and Becker 1982, Richmond 1988).
In the current study, P. carterae and E. huxleyi were grown for two months in a 6L plate
photobioreactor at several levels of pH controlled injecting direct CO2 using a pH-stat
system. The highest average productivity of 0.509 g dry weight.L-1.d-1 was achieved at
pH 8 for P. carterae. This result was three times greater than productivity of 0.16 g dry
weight.L-1.d-1 for the same species in a plate photobioreactor at the same pH by Lisec
(2004). A possible explanation for this difference between two studies may be the
lower air volume and hence poorer mixing regime in Lisec’s experiment. Pleurochrysis
carterae productivity was 10% and 40% higher at pH 8 than pH 7.7 and unregulated pH
respectively, however E. huxleyi showed 26% higher productivity at unregulated pH
compared to pH 7.8. The results show the possibility of using CO2 addition to culture
of P. carterae to increase productivity, whereas any pH reduction produced by CO2
addition to cultures of E. huxleyi results in a lowering of productivity. In future, the
decision to use extra CO2 in P. carterae cultures will need to be economically based.
Access to inexpensive CO2 would be advantageous, as adding CO2 to the culture of P.
carterae increases the productivity.
Pleurochrysis carterae grown outdoors in a raceway pond increased the medium pH up
to pH 11 (see Figure 41e) and at this pH there is no free CO2 and most of the inorganic
176

carbon is in the form of CO32-. The results presented in this Chapter show that
controlling the pH at pH 9.6 using a pH-stat system results in significantly higher
biomass productivity with any further decreases in pH producing no further significant
increases in productivity. More available CO2 at pH 9.6 is the likely main reason for
increased productivity of P. carterae when compared to unregulated pH. Although,
higher CO2 concentration can lead to higher biomass productivity, the effect of low pH
on the microalgae physiology and also the increased possibility of contamination should
not be ignored. A combination of these two factors may be the best explanation for the
reduced productivity and lower growth rate of P. carterae grown in the outdoor raceway
pond at any pH lower than pH 9.6. Based on the pH results for the plate
photobioreactor with regards to optimum pH for P. carterae growth (pH 8), it seems
that contamination is the most likely reason for P. carterae growth failure at pH 8.5 in
the raceway pond.
The low pH depression of marine calcification and photosynthesis has been identified in
coral reefs by Gattuso and colleagues (1999) and Langdon and colleagues (2000). It has
also been shown that E. huxleyi calcification is inhibited at an elevated pCO2,
(Zondervan, et al. 2001). Sciandra (2003) also reported an increase in the mean
doubling time (decrease in specific growth rate) and a decrease in calcification by
increasing pCO2 from 400 to 700 ppm (resulting in 0.2 unit lowering in pH), under
nitrate limitation in E. huxleyi. In the current study, any additional CO2 also resulted in
lowering both growth rate and calcification rate in E. huxleyi. It is still unknown if the
productivity reduction and lower growth rate in E. huxleyi is due to the elevated pCO2
or whether it is caused by pH shifts. Emiliania huxleyi showed no increase in the
medium pH (see Figure 24c, and Figure 45b) and it is therefore quite possible that this
species is adapted to grow in the pH range of pH 8.1 - 8.3. This could explain the lower
growth rate and calcification rate of E. huxleyi when grown at a pH lower than pH 7.9.
177
It is possible to control the pH level while adding external CO2, mainly by increasing
the pH by adding NaOH or KOH and using this method can possibly increase the
growth rate and/or calcification of E. huxleyi, however, the economies of such a system
must determined.
Seki (1995) found a positive correlation with inorganic biomass and a negative
correlation with organic biomass with increasing CO2 concentration in P. carterae .
However, in the experiments carried out in this study both organic and inorganic
biomass (CaCO3) increased at higher CO2 concentrations in P. carterae. The difference
between the current study and that of Seki (1995) may be explained by the way the CO2
level was regulated. Seki (1995) kept the pH constant using KOH and HCl whereas, in
the current experiment, the pH was variable and controlled by controlling the amount of
CO2 supplied (pH stat).
The lipid content and composition of microalgae can be significantly affected by
environmental changes (Riebesell, et al. 2000a). The most crucial factors include
nutrient status, irradiance and temperature (Shifrin and Chisholm 1981, Sukenik, et al.
1989, Dunstan, et al. 1993). For instance, Riebeesell and colleagues (2000a) found an
effect of different CO2 concentration on the abundances of some lipids in E. huxleyi. In
this study, the lipid content of P. carterae remained constant irrespective of the pH,
whereas the lipid content of E. huxleyi was higher at pH 7.7 than unregulated pH.
Temperature and salinity, on the other hand, did not affect the lipid content of E. huxleyi
(see Chapter 3). It seems that, in E. huxleyi, stress produced under elevated CO2 can
increase the lipid content of cell.
178
6.7.2 Effect of Depth
The productivity of outdoor algal cultures is influenced by manageable parameters such
as mixing speed, depth, cell density and the dilution cycle, an adequate combination of
which allows better use of sunlight, resulting in higher productivities (Richmond and
Becker 1986, Vonshak and Richmond 1988). For instance, Richmond et al. (1980)
found a positive correlation between the mixing rate and the growth and output rates of
Spirulina platensis, Chlorella vulgaris, and Chlorella sorokiniana grown in raceway
ponds.
In outdoor microalgal cultures all incident light energy is absorbed in the photic zone,
usually the upper 1-5 cm of the cell suspension in dense cultures, with the rest
remaining in the dark (Oswald 1988). Richmond et al. (1980) also found that light
penetrated no more than 7 cm in a raceway pond culture even at very low cell densities.
Total productivity also depends on both total irradiance and on the amount of energy
available at the cell surface (Richmond, et al. 1993). Therefore, for most commercial
algae tested, deeper cultures do not result in higher productivity (Garcia and Hernandes-
Marine 2000). For instance, Richmond (1986) found that the productivity of microalgae
grown in ponds increases with an increase in depth from 15 cm to 29 cm and decreases
rapidly with any further increase in depth.
Pleurochrysis carterae growth in an outdoor raceway pond at different depths showed
two different patterns between autumn and spring. The maximum productivity in
autumn was obtained at 16 cm depth, whereas in summer, when irradiance was higher,
the maximum productivity was achieved at 21 cm. It is possible that P. carterae was
photoinhibited at depths lower than 16 cm depth during the summer season and light
limited at depths higher than 16 cm during autumn. Nevertheless, in the operation of
179
large-scale ponds, engineering restrictions make it essentially impossible to maintain a
evenly smooth pond bottom to operate at very shallow depths and, in practice, most
commercial raceway ponds have to be operated at a depth of between 10-25 cm (De
Pauw and Persoone 1988, Borowitzka and Borowitzka 1990, Jimenez, et al. 2003b).
While, the higher productivities of a raceway pond are highly dependent on pond depth,
productivities are most dependent on the mixing regime which ensures that cells are
kept in suspension in the water column and are exposed regularly to light. Mixing plays
an important role in the cultivation of coccolithophorids. The coccolith layer makes
coccolithophorids heavy resulting in a rapid settling of the cells when the culture is not
mixed (Young, et al. 1994, Paasche 2002). However, the results reported in Chapter 4
and page 170 indicate that coccolithophorids have a high sensitivity to shear. Thus,
although there are several studies indicating that an increase in the flow rates in raceway
ponds can increase productivities (Vonshak, et al. 1982, Richmond and Grobbelaar
1986), the mixing speed used for mixing cultures of coccolithophorids is restricted and
must be controlled carefully.
6.7.3 Photoinhibition
Vonshak and Guy (1992) have shown that a decrease in photosynthetic activity induced
by photoinhibition can contribute to a reduction in the productivity of outdoor
production of Spirulina. This reduction seems to be due to decreased photosystem II
(PSII) activity and is indicated by a decrease in the maximal efficiency of PSII
photochemistry (Torzillo, et al. 1991, Vonshak, et al. 1994). Photorespiration is the
light stimulated oxidation of the products of photosynthesis to CO2 and is arbitrated by
the oxygenase activity of Rubisco which is the essential carboxylating enzyme in
autotrophic organisms possessing C3 photobiochemistry (Anton Hough and Wetzel
180
1978). Under conditions of high O2 concentrations and low CO2 concentrations
Rubisco catalyses the conversion of RuBP to 3-PGA and 2-phosphoglycolate.
Numerous studies have also suggested that the reactions of dioxygen (O2) and active
oxygen species, such as the superoxide radical (O2. ), the hydroxyl radical ( .OH),
hydrogen peroxide (H2O2), and singlet oxygen (1∆g O2), can cause photoinhibition of
photosynthesis (Belay and Fogg 1978, Foy and Gibson 1982, Foy 1983, Cadenus 1989,
Krause 1994). Both photosynthesis and photorespiration are also influenced by
temperature, with higher temperatures increasing oxygenase and PSII activities (Belay
and Fogg 1978, Verity 1981, Janssen, et al. 2002, Morris and Kromkamp 2003).
However, the characteristics of PSII photochemistry induced by photoinhibition in
outdoor algal cultivation remain little understood although, the mechanisms of
photoinhibition have been studied intensively in algae and higher plants (Baker and
Bowyer 1994).
My results on diurnal pattern of dissolved oxygen concentration in the raceway ponds
growing P. carterae show the exact same pattern as previously described in many
studies of other algae (e.g. Spirulina, Chlorella, Dunaliella) with a rapid reduction in
dissolved oxygen concentration by about noon, as a result of photoinhibition (Vonshak,
et al. 1988, Baker and Bowyer 1994, Torzillo, et al. 1998).
Photosynthesis in C3-plants has reported to be inhibited up to 50% at 40-50% O2
concentration (Tolbert 1994), but photosynthesis in some cyanobacteria and green algae
has been found not to be inhibited (Coleman and Colman 1980). For instance Vonshak
(1997) found that oxygen concentration of up to 20 to 22 mg.L-1 had no significant
inhibiting effect on the photosynthesis of Spirulina grown in outdoor raceway ponds.
Israel et al. (1996), on the other hand, reported high photosynthesis inhibition of P.
carterae by increasing O2 concentration from 1 to 21%. Shiraiawa and colleagues
(2004) also found a 4-6 times higher O2-inhibition of photosynthesis in
181
coccolithophorids compared to green microalgae. Photosynthesis in the P. carterae
investigated in this study is also very sensitive to high oxygen concentrations.
The results presented here show that P. carterae can adapt to the higher irradiances
outdoor over a period of several weeks. Photoadaptation in free-living phytoplankton
also has been demonstrated in several studies (Brown and Richardson 1968, Prezelin
1976, Meeson and Sweeny 1982, Olaizola and Yamamoto 1994).
Several mechanisms are involved in photoadaptation: (1) altering the size of
photosynthetic unit (PSU) as occurs in some dinoflagellate species such as the
significant of Tridacna maxima (Prezelin 1981), (2) changes in pigment ratios (Vonshak
and Guy 1992, Iglesias-Prieto and Trench 1997), and (3) changes in the activity of CO2-
fixing enzymes e.g. Rubisco and/or electron transport systems as a function of changing
irradiance (Rivkin, et al. 1982, Rivkin and Voytek 1987). The exact mechanism of
photoadaptation in P. carterae remains to be determined.
6.7.4 Early morning temperature
The growth of Pleurochrysis carterae in raceway ponds is sensitive to the early
morning temperature. This is a common problem in outdoor microalgal cultures
(Vonshak, et al. 2001). Richmond et al. (1980) found that low morning temperature
resulted in an up to 30% decrease of productivity in Chlorella sp. and Spirulina sp. and
Laws et al. (1988a) found that a 10oC – 15oC increase in the culture temperature during
winter can result in a significant increase in the yield of Chlorella grown in outdoor
raceway ponds. In the current study increasing the culture temperature by about 4oC in
the morning resulted in an increase of biomass production. While several investigators
reported that increasing the culture medium is too expensive to be economical
182
(Borowitzka 1992, Richmond 1999), the method used in this study (adding warm
medium for increasing the early morning culture media’s temperature) was easy and
may be economical.
6.7.5 Turbulence
Efficient and high productivity culture of microalgae requires that the algae are mixed
to maintain them in suspension for optimum light availability and to minimise unstirred
(boundary) layers around the cell in order to optimise gas exchange and nutrient
availability. Mixing also creates turbulence and shear (Camacho, et al. 2000). The
hydrodynamic state of a photobioreactor has a direct influence on the productivity of
shear-sensitive cultures of microorganisms (Berdalet 1992, Carlozzi and Torzillo 1996).
The yield of some microalgae improves with increasing turbulence, due to the enhanced
supply of nutrients to the cells, whilst the yield declines rapidly with further increases in
turbulence which results in cell damage (Thomas and Gibson 1990, Thomas, et al.
1995, Hondzo and Lyn 1999, Sulivan, et al. 2003). Thomas and Gibson (1990)
hypothesized an ascending scale of inhibition of relative sensitivities to turbulence in
microalgae: green algae < cyanobacteria < diatoms < dinoflagellates. Thus green algae
can be grown under more intensive mixing conditions, whilst dinoflagellates are the
most shear sensitive of the microalgae. The shear sensitivity of microalgae appears to
be related, at least in part, on whether the algae are flagellated or not. The loss of
fragile flagella due to shear results in a reduction in growth rate (Sulivan and Swift
2003).
There are no previous studies on the effect of shear and mixing regime on haptophyte
algae such as the coccolithophorids. The results of growth in closed photobioreactors
described in Chapter 4 clearly show that the coccolithophorids used in this study are
very sensitive to turbulence and shear. The rather simple experiment described in this
183

184
Chapter used the turbulence generated by magnetic stir bar in a carboy type
photobioreactors to partially characterise the shear sensitivity of P. carterae. The
optimum growth rate was achieved at 200 rpm agitation with Rei = 20805 and a mixing
speed of 9s-1. Higher mixing resulted in a lower specific growth rate and productivity.
Camacho (2000) also found the same pattern in mixed cultures of Porphydium
cruentum. This decrease in the specific growth rate may be explained by shear
produced at higher speeds. Mean specific growth rate also decreased at stirring bar
speeds lower than 200 rpm which can be explained by lack of nutrient supply to the
cells due to the poor mixing. The main negative effects produced in the carboy
photobioreactor are the shear produced at high impeller Reynolds numbers and also cell
damage created between the stirring bar and the vessel.
6.7.6 Mitotic ratio
In phytoplankton species, such as the dinoflagellate Gonyaulax polyena, the euglenoid
Euglena gracilis, and the green alga Chlamydomonas reinhardtii the phased or
synchronized cell division observed in light:dark cycles is known to be coupled to an
endogenous circadian clock (Sweeny and Hastings 1958, Edmunds 1966, Bruce 1970).
Van der Wal and colleagues (1987) also observed synchronized cell division in P.
carterae and Chisholm and Brand (1981) observed phased division in E. huxleyi during
growth in a light:dark cycle and synchronized division when this alga was grown in
continuous light. Fisher and Honjo (1988/1989) also showed phased division in E.
huxleyi and this did not change with changes in salinity. In the current study,
Pleurochrysis carterae showed synchronized cell division when grown in a plate
photobioreactor and a raceway pond, whereas in E. huxleyi and G. oceanica cell
division was phased.
Moreover, significant biomass loss during the night period was observed followed by an
increase in biomass during the light period. Biomass loss during the night period is a
common feature of algal culture and from 10 to 45% biomass loss has been observed in
a number of microalgae species such as the green alga Chlorococcum littorale (Hu, et
al. 1998), the cyanobacterium Spirulina platensis (Carlozzi 2000) and the
cyanobacterium Synechocystis aquatilis (Zhang, et al. 2001). The main reason for the
loss of biomass is respiration.
Van der Wal and colleagues (1987) reported the same calcification rate at night as
during the day in P. carterae, whereas the current study shows decalcification during
the night by this species. Several other investigators (Paasche 1964, Linschooten, et al.
1991, Sekino and Shiraiawa 1994, Balch, et al. 1996a) have also reported
decalcification at night in E. huxleyi. This decalcification may be due to localised
acidification due to respiratory CO2 production resulting in a partial dissolution of the
coccoliths.
6.8 Conclusion
The results presented in this Chapter show that:
1. CO2 addition to the medium with the pH hold between 8.1 and 9.3 increase the
specific growth rate and productivity of P. carterae, however, CO2 addition to culture of
E. huxleyi resulted in a lower specific growth rate and productivity,
2. The optimum growth rate and productivity in raceway ponds were at 16 cm and 21
cm pond depth in autumn and summer respectively,
185
3. The photosynthetic rate of P. carterae is more sensitive to high oxygen
concentrations than high light and high temperature. Further more P. carterae grown in
a raceway pond can photoadapt to the higher irradiances,
4. Productivity of raceway pond culture can be increased by heating the culture early in
the morning,
5. Pleurochrysis carterae is highly sensitive to the shear and this must be considered in
the design of any culture system, and
6 Cell division of P. carterae is synchronised making this species very suitable for
semicontinuous culture. On the other hand, E. huxleyi and G. oceanica is phased
making these species suitable for both continuous and semicontinuous operating
systems. The timing of harvesting of the cells also require considering the timing of cell
division if yields are to be maximised in culture.
186

CHAPTER 7
PHOTOSYNTHETIC AND CARBON UTILISATION EFFICIENCY
AND ECONOMIC MODELLING
7.1 Introduction
While around 2 x 1024 J of solar energy reach the earth annually, only about 2.1 x 10²¹ J
of this (0.11%) is captured through photosynthesis (Leith 1975, Larkum 1981).
Calculating the photosynthetic solar energy conversion efficiency for different
cultivation systems is useful for comparing the efficiency of different culture systems.
Calculating the amount of carbon fixed by coccolithophorids grown in different closed
and open cultivation systems also allows the examination of the carbon utilisation
efficiency of these culture systems and is necessary for determining the economics of
supplying external carbon.
Development of a deterministic economic model to predict the final cost of P. carterae
production is an important step before any further research on scaling up for this
species. The biomass productivity of P. carterae, used in this modelling is based on the
outdoor raceway cultivation results presented in Chapter 5. The conceptual design,
costs, engineering and cost analysis are based on previous work established by
Borowitzka ( 1992, 1999b, 2005), while operating options are based on work
established by Tapie and Bernard (1987), and harvesting systems costs are calculated
based on a number of studies (Tapie and Bernard 1987, Mohn 1988, Mohn and Cordero
1990, Weisman and Noue 1995).
187
7.2 Photosynthetic light conversion efficiency
The photosynthetically active radiation (PAR) received by the different cultivation
systems was calculated in Chapter 2. The total energy received per cultivation system
during a day (Erec) can be calculated by Equation 12. The average daily irradiation
period was 43200 s.d-1 (12 h irradiance.d-1) for the closed photobioreactors, and it varied
in the outdoor raceway pond.
( )[ ]E PAR Average irradiation s drec = × −. 1 Eq. 12
The recovered light energy for each species and in different cultivation systems can be
calculated based on the Equation 13 if the energy needed for coccolith production is
neglected:
R Energy content of cellLE afdw= ×Pr Eq. 13
where RLE is the recovered light energy, Prafdw is the total ash free dry weight produced
daily in the reactor. The energy content of the alga is calculated to be 17.17KJ.gafdw-1
assuming a carbon content of 36.1±0.41% (Shifrin and Chisholm 1981) and an
estimated chemical energy of carbon for phytoplankton of 47.7 KJ.g-1 carbon (Platt and
Irwin 1973).
Photosynthetic light conversion efficiency (PE) is the light energy recovered as
microalgal biomass divided by Erec. The total productivity and growth rates for
different coccolithophorids and in different cultivation systems were previously
described in Chapters 4 and 5. The calculated photosynthetic efficiencies for the
different cultivation systems are presented in Table 29. Pleurochrysis carterae had the
highest PE of all species and this was in the plate photobioreactor. The relative
188

189
efficiencies for P. carterae were: plate photobioreactor > stirred and aerated carboy >
airlift photobioreactor > raceway, and in the raceway pond it was highest in summer.
Emiliania huxleyi CCMP371 also had a higher PE in the plate photobioreactor
compared to the carboy photobioreactor, while G. oceanica followed the opposite
pattern.
7.3 Carbon utilisation efficiency
The carbon balances for P. carterae CCMP647 and E. huxleyi CCMP371 at different
levels of pH were calculated by the method of Lisec (2004) using the following
assumptions:
(a) CO2 was the only carbon source in the photobioreactor,
(b) The carbon content for both of these species was 36.1±0.41%
(Shifrin and Chisholm 1981),
(c) The amount of carbon in the suspension was constant, and
(d) All the CO2 which was not fixed leaves the photobioreactor.
The differential carbon balance in the photobioreactor at culture time t (dt) can be
calculated using Equation 14:
dCdt
dCdt
dCdt
cultivation system absorbed uptake= − Eq. 14
where dCcultivation system is the differential carbon balance, dCabsorbed is the differential
carbon content of the suspension (reactor) resulting from carbon absorption from air
bubbles, and dCuptake the differential carbon uptake by the cells. It is assumed that
suspension carbon is constant (stationary d/dt = 0).
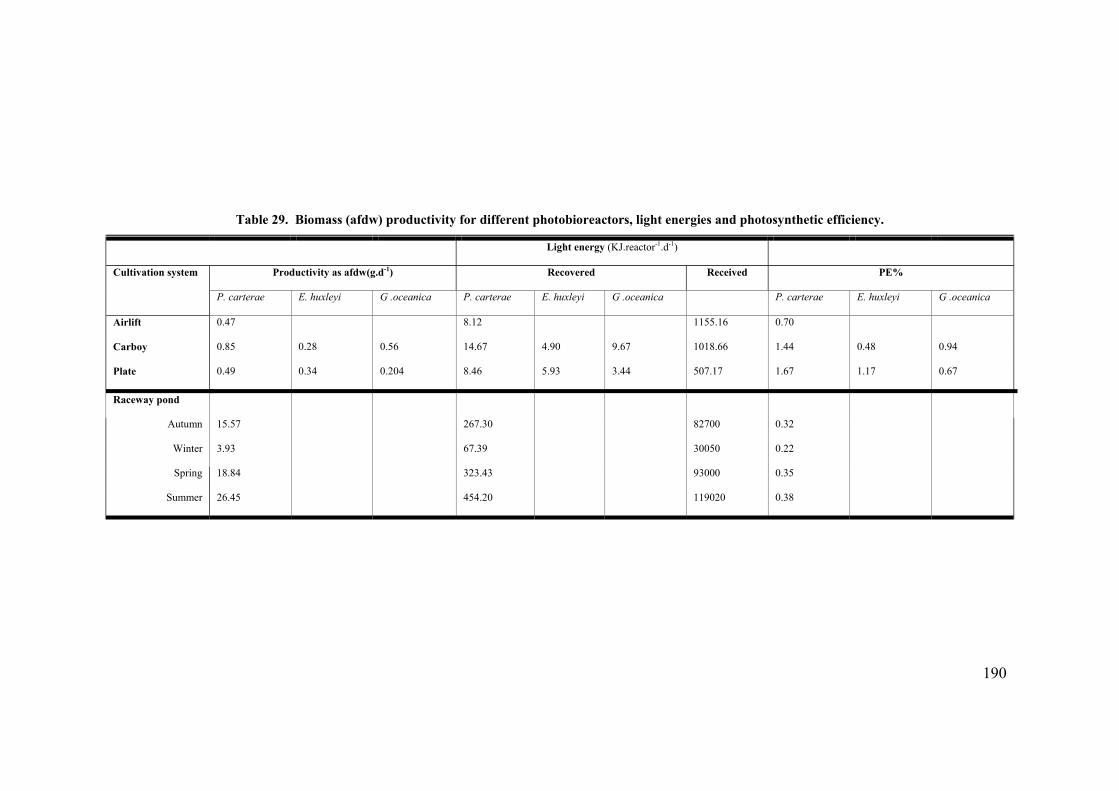
190
Table 29. Biomass (afdw) productivity for different photobioreactors, light energies and photosynthetic efficiency.
Light energy (KJ.reactor-1.d-1)
Cultivation system Productivity as afdw(g.d-1) Recovered Received PE%
P. carterae E. huxleyi G .oceanica P. carterae E. huxleyi G .oceanica P. carterae E. huxleyi G .oceanica
Airlift 0.47 8.12 1155.16 0.70
Carboy 0.85 0.28 0.56 14.67 4.90 9.67 1018.66 1.44 0.48 0.94
Plate 0.49 0.34 0.204 8.46 5.93 3.44 507.17 1.67 1.17 0.67
Raceway pond
Autumn 15.57 267.30 82700 0.32
Winter 3.93 67.39 30050 0.22
Spring 18.84 323.43 93000 0.35
Summer 26.45 454.20 119020 0.38
The carbon balance over a 24 h period can be expressed as Equation 15:
,C C C Cbiomass fixed coccolith fixed air in air out, , ,+ = − Eq. 15
where Cbiomass, fixed is the total organic carbon fixed, Ccoccolith, fixed is the total inorganic
carbon fixed in the coccolith, Cair, in is the total C supplied via aeration and Cair, out is the
total carbon loss via the air outlet.
The amount of CO2 input in the gas phase (Cin) can be calculated using Equations 16, 17
and 18:
( )C g L C Cin air in CO in. , ,− = +1
2 Eq. 16
tC V CO Cair in air in air CO air, ,= × × ×2 2 Eq. 17
2C V C tCO in CO in CO CO2 2 2, ,= × × Eq. 18
where Cco2 = 0.54 g.L-1 and is the constant for converting volume gas volume to weight
based on the molar gas volume at STP. Cco2, in is the amount of carbon supplied by CO2
injection to the culture, Vair, in is the air volume, CO2air is the CO2 content of the air, tair
is the aeration period, Vco2,in is the CO2 volume and tco2 is the CO2 aeration period.
The amount of carbon taken up (Cuptake) can also be calculated by using the biomass and
coccolith productivity as follows (Equations 19, 20, and 21).
C C Cuptake biomass fixed coccolith fixed= +, , Eq. 19
C Cbiomass fixed ash and coccolith free BM, Pr= × Eq. 20
C Ccoccolith fixed coccolith coccolith, Pr= × Eq. 21
191
where Prashandcoccolith free is the ash and coccolith free productivity (g.L-1), CBM is the
carbon content of biomass, Prcoccolith is the coccolith productivity (g.L-1) and Ccoccolith is
the carbon content of coccoliths. The ash and coccolith free productivity
(Prashandcoccolithfree) were calculated using Equation 22:
Pr Pr Pr Pr [ ][ ]
%ash and coccolith free total dry weight coccolith ashCaO
CaCO= − + −
⎛⎝⎜
⎞⎠⎟
⎛
⎝⎜
⎞
⎠⎟
⎡
⎣⎢⎢
⎤
⎦⎥⎥3
Eq. 22
where Prtotaldryweight is the total biomass productivity (g.L-1) and Prash is the ash content of
the biomass.
Although the amount of carbon content of the air leaving the system has not been
measured, it can now be calculated using the remaining values. Knowing Cuptake permits
the calculation of the amount of carbon lost from photobioreactor using Equation 23:
C C Cair out in uptake, = − Eq. 23
The efficiency of the system (Cutil) can then be calculated using Equation 24:
CC
Cutiluptake
in
= Eq. 24
The primary data and the efficiency of carbon usage for P. carterae and E. huxleyi at
different levels of pH are summarized in Table 30. For P. carterae the highest Cutil of
27.9% was observed at pH 8.1 in the plate photobioreactor. In the raceway pond the
highest efficiency of 12.7% was at pH 9.6. The lowest Cutil was observed for E. huxleyi
at pH 7.8.
192

Table 30. Carbon utilisation efficiency and the values used to calculate it.
P. carterae E. huxleyi Plate photobioreactor Raceway pond Unit pH 8.1 PH 7.7 pH 9.6 pH 9.1 pH 7.8
Vair, in L.h-1 160 160 0 0 160 Vco2, in L.m-1 0.041 0.041 0.125 0.138 0.041 Cair, in g.d-1 0.72 0.73 0 0 0.72 Cco2, in g.d-1 2.32 5.51 26.38 37.20 3.43 Cin g.d-1 3.05 6.23 26.38 37.20 4.15 Prash and coccolith free g.d-1 2.14 1.83 8.88 8.07 0.86 Prcoccolith g.d-1 0.49 0.31 1.36 1.24 0.17 Cbiomass, fixed g.d-1 0.77 0.66 3.20 2.91 0.31 Ccoccolith fixed g.d-1 0.059 0.037 0.16 0.15 0.021 Cuptake g.d-1 0.83 0.69 3.36 3.05 0.33 Cair, out g.d-1 2.22 5.54 23.02 34.14 3.82 Cutil 27.29% 11.15% 12.74% 8.21% 8.00%
7.4 Economic modelling
Microalgae are attractive resources for biomass production because of their higher yield
and photosynthetic efficiencies when compared to terrestrial plants (Borowitzka 1999a).
The potential of microalgae to provide abundant food, feed, and energy sources
however faces many practical problems (Oswald 1980).
The three main technological and economic concerns of any microalgal production are:
(a) The cost and availability of the main resources such as CO2 and
water (Mohn 1988, Olaizola, et al. 1991, Borowitzka 1992, Suzuki and
Matsuo 1995),
(b) The of construction and maintenance of the culture system (Mohn
1988, Moreno, et al. 2003) and
(c) The capital and operational costs of harvesting systems (Mohn
1988).
193
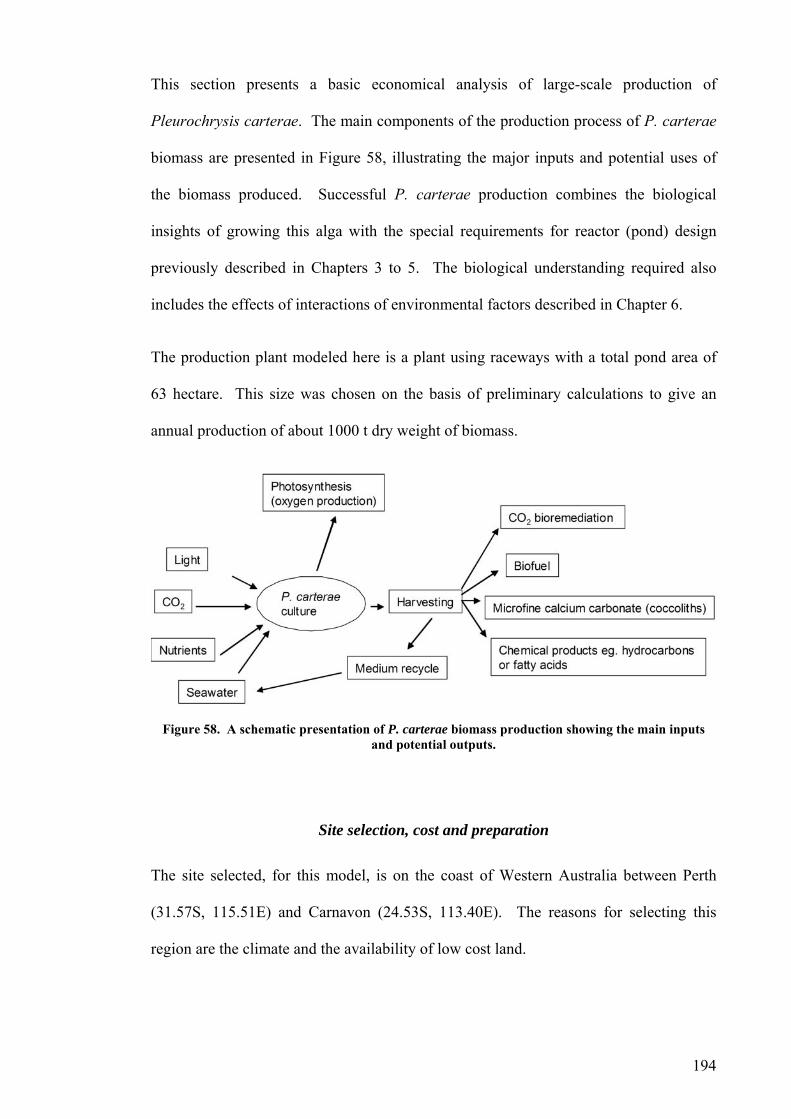
This section presents a basic economical analysis of large-scale production of
Pleurochrysis carterae. The main components of the production process of P. carterae
biomass are presented in Figure 58, illustrating the major inputs and potential uses of
the biomass produced. Successful P. carterae production combines the biological
insights of growing this alga with the special requirements for reactor (pond) design
previously described in Chapters 3 to 5. The biological understanding required also
includes the effects of interactions of environmental factors described in Chapter 6.
The production plant modeled here is a plant using raceways with a total pond area of
63 hectare. This size was chosen on the basis of preliminary calculations to give an
annual production of about 1000 t dry weight of biomass.
Figure 58. A schematic presentation of P. carterae biomass production showing the main inputs and potential outputs.
Site selection, cost and preparation
The site selected, for this model, is on the coast of Western Australia between Perth
(31.57S, 115.51E) and Carnavon (24.53S, 113.40E). The reasons for selecting this
region are the climate and the availability of low cost land.
194
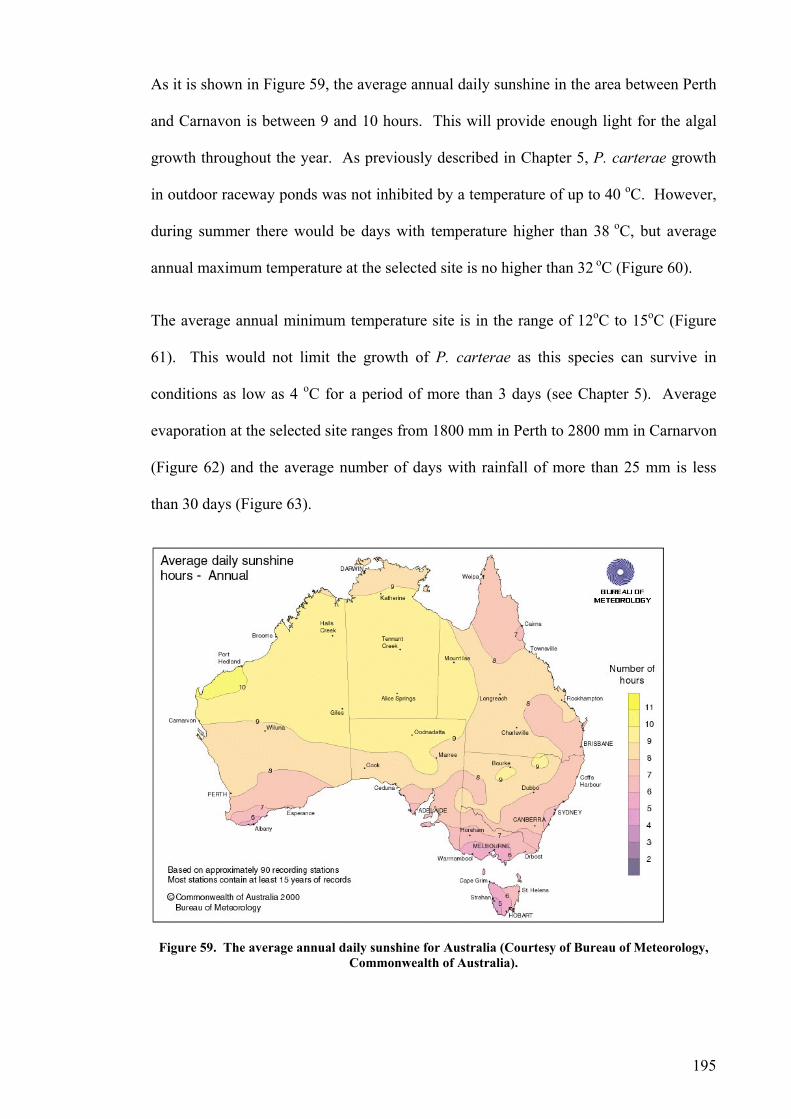
As it is shown in Figure 59, the average annual daily sunshine in the area between Perth
and Carnavon is between 9 and 10 hours. This will provide enough light for the algal
growth throughout the year. As previously described in Chapter 5, P. carterae growth
in outdoor raceway ponds was not inhibited by a temperature of up to 40 oC. However,
during summer there would be days with temperature higher than 38 oC, but average
annual maximum temperature at the selected site is no higher than 32 oC (Figure 60).
The average annual minimum temperature site is in the range of 12oC to 15oC (Figure
61). This would not limit the growth of P. carterae as this species can survive in
conditions as low as 4 oC for a period of more than 3 days (see Chapter 5). Average
evaporation at the selected site ranges from 1800 mm in Perth to 2800 mm in Carnarvon
(Figure 62) and the average number of days with rainfall of more than 25 mm is less
than 30 days (Figure 63).
Figure 59. The average annual daily sunshine for Australia (Courtesy of Bureau of Meteorology, Commonwealth of Australia).
195
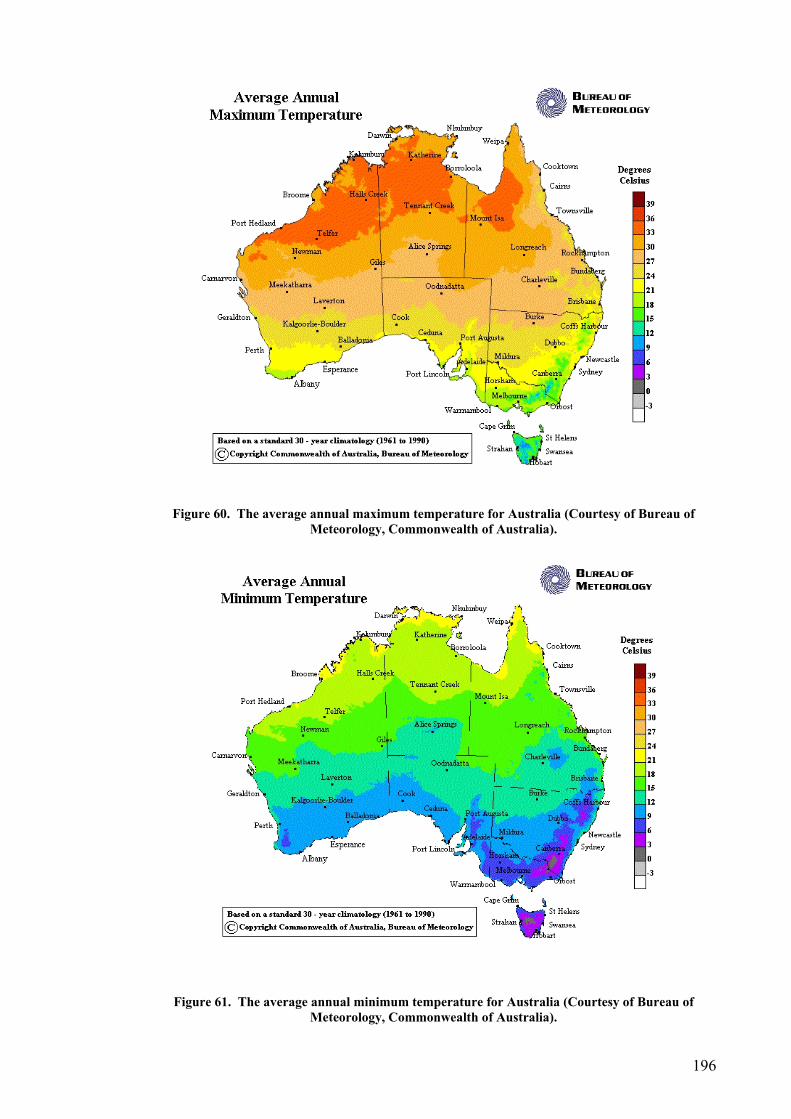
Figure 60. The average annual maximum temperature for Australia (Courtesy of Bureau of Meteorology, Commonwealth of Australia).
Figure 61. The average annual minimum temperature for Australia (Courtesy of Bureau of Meteorology, Commonwealth of Australia).
196
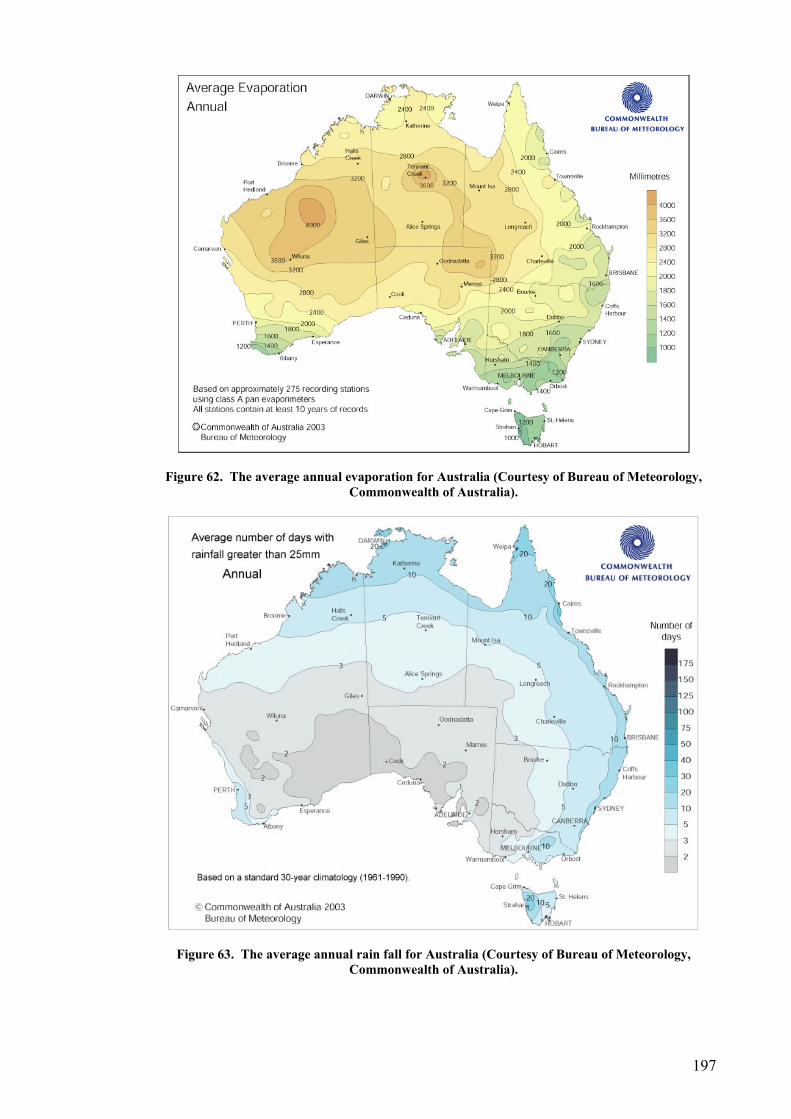
Figure 62. The average annual evaporation for Australia (Courtesy of Bureau of Meteorology, Commonwealth of Australia).
Figure 63. The average annual rain fall for Australia (Courtesy of Bureau of Meteorology, Commonwealth of Australia).
197
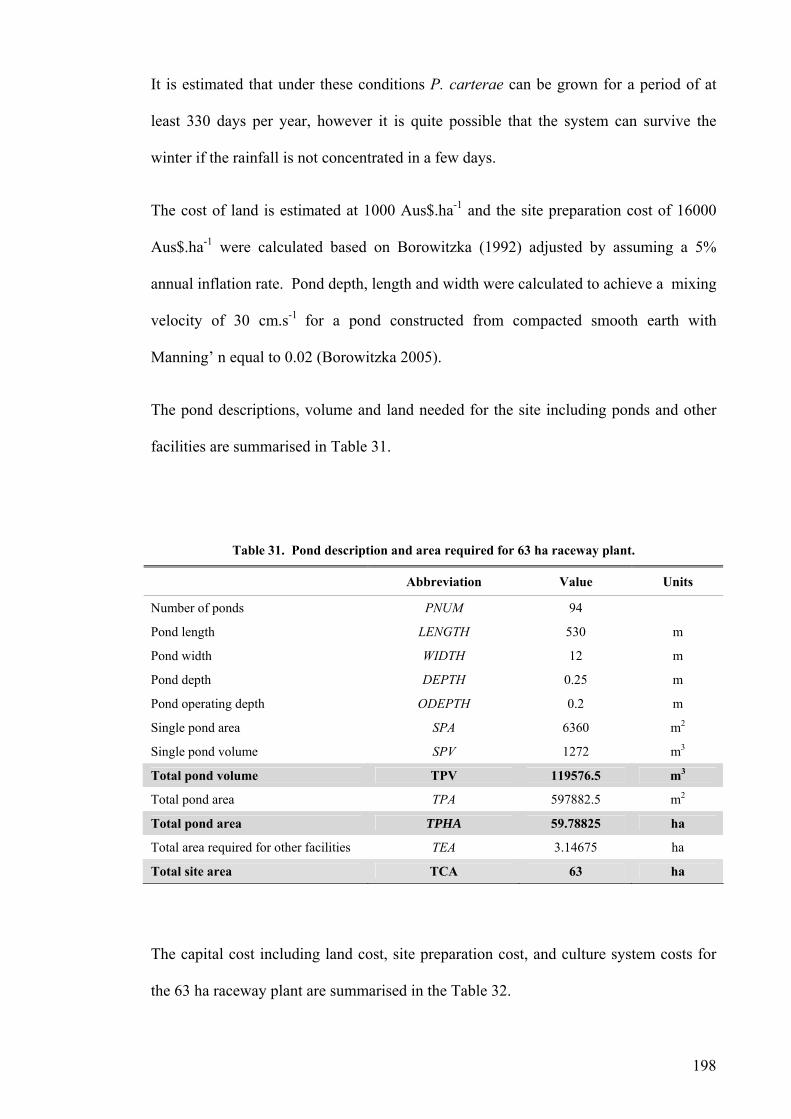
It is estimated that under these conditions P. carterae can be grown for a period of at
least 330 days per year, however it is quite possible that the system can survive the
winter if the rainfall is not concentrated in a few days.
The cost of land is estimated at 1000 Aus$.ha-1 and the site preparation cost of 16000
Aus$.ha-1 were calculated based on Borowitzka (1992) adjusted by assuming a 5%
annual inflation rate. Pond depth, length and width were calculated to achieve a mixing
velocity of 30 cm.s-1 for a pond constructed from compacted smooth earth with
Manning’ n equal to 0.02 (Borowitzka 2005).
The pond descriptions, volume and land needed for the site including ponds and other
facilities are summarised in Table 31.
Table 31. Pond description and area required for 63 ha raceway plant.
Abbreviation Value Units
Number of ponds PNUM 94
Pond length LENGTH 530 m
Pond width WIDTH 12 m
Pond depth DEPTH 0.25 m
Pond operating depth ODEPTH 0.2 m
Single pond area SPA 6360 m2
Single pond volume SPV 1272 m3
Total pond volume TPV 119576.5 m3
Total pond area TPA 597882.5 m2
Total pond area TPHA 59.78825 ha
Total area required for other facilities TEA 3.14675 ha
Total site area TCA 63 ha
The capital cost including land cost, site preparation cost, and culture system costs for
the 63 ha raceway plant are summarised in the Table 32.
198

Table 32. Total capital cost.
Abbreviation Value Units
Site Preparation* SPREP 16000 Aus$.ha-1
Culture System* CSYS 240000 Aus$.ha-1
Engineering Fees** ENGF 38400 Aus$.ha-1
Contingency*** CONTING 12800 Aus$.ha-1
Land Land 1000 Aus$.ha-1
Total Capital TCAP 18395648.8 Aus$ *calculated based Borowitzka (1992) on including 5% annual inflation rate ** calculated based on 15% of SPREP and CSYS *** calculated by 5% of SPREP and CSYS
Where total capital (TCAP) was calculated as the sum of site preparation, culture system
cost, engineering fees, contingency, and land cost times by total pond area (Equation
25).
( )TCAP TPHA SPREP CSYS ENGF CONTING Land= × + + + + Eq. 25
Productivity of system
The total annual productivity was calculated using the growth data in section 6.1 for
each different pH regime. The operation of the plant was based on the following
assumptions:
(a) Media recycling:
When more than 50% of the medium was harvested Pleurochrysis carterae grown in
the outdoor raceway pond, showed lower productivity. However, culture media must be
recycled mainly because of the cost of nutrients and the political impacts and the costs
of discarding the medium.
199
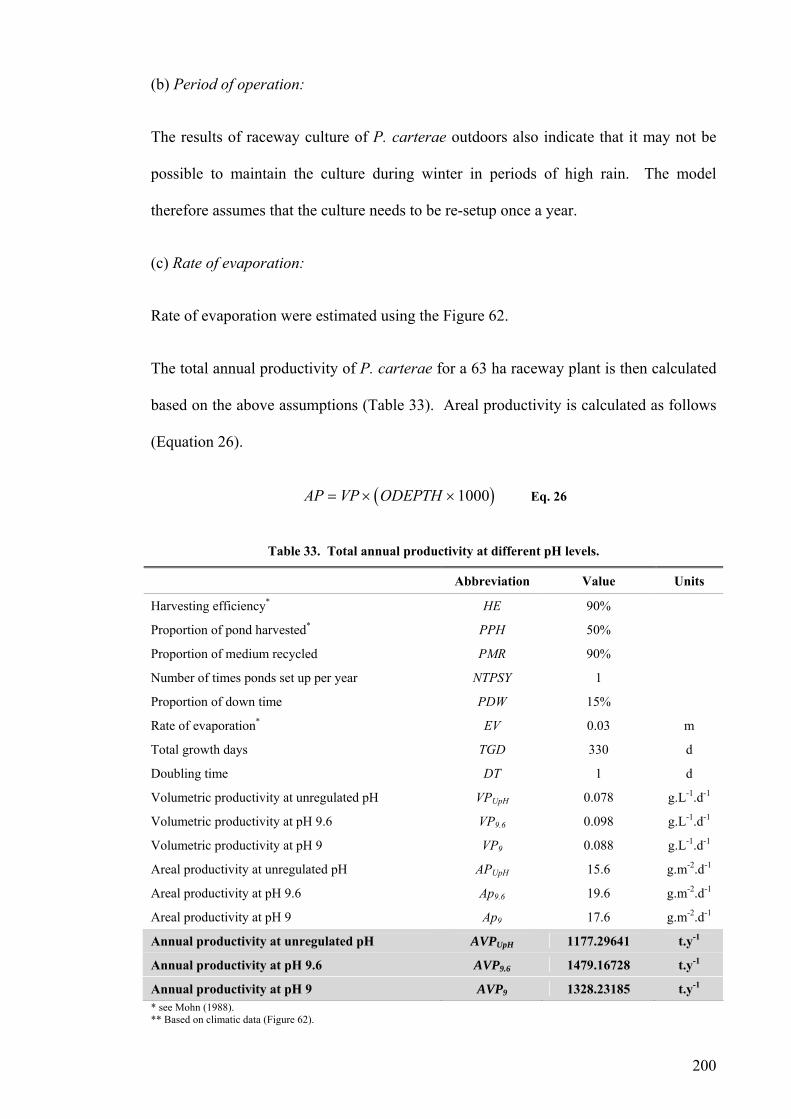
(b) Period of operation:
The results of raceway culture of P. carterae outdoors also indicate that it may not be
possible to maintain the culture during winter in periods of high rain. The model
therefore assumes that the culture needs to be re-setup once a year.
(c) Rate of evaporation:
Rate of evaporation were estimated using the Figure 62.
The total annual productivity of P. carterae for a 63 ha raceway plant is then calculated
based on the above assumptions (Table 33). Areal productivity is calculated as follows
(Equation 26).
( )AP VP ODEPTH= × ×1000 Eq. 26
Table 33. Total annual productivity at different pH levels.
Abbreviation Value Units
Harvesting efficiency* HE 90%
Proportion of pond harvested* PPH 50%
Proportion of medium recycled PMR 90%
Number of times ponds set up per year NTPSY 1
Proportion of down time PDW 15%
Rate of evaporation* EV 0.03 m
Total growth days TGD 330 d
Doubling time DT 1 d
Volumetric productivity at unregulated pH VPUpH 0.078 g.L-1.d-1
Volumetric productivity at pH 9.6 VP9.6 0.098 g.L-1.d-1
Volumetric productivity at pH 9 VP9 0.088 g.L-1.d-1
Areal productivity at unregulated pH APUpH 15.6 g.m-2.d-1
Areal productivity at pH 9.6 Ap9.6 19.6 g.m-2.d-1
Areal productivity at pH 9 Ap9 17.6 g.m-2.d-1
Annual productivity at unregulated pH AVPUpH 1177.29641 t.y-1
Annual productivity at pH 9.6 AVP9.6 1479.16728 t.y-1
Annual productivity at pH 9 AVP9 1328.23185 t.y-1
* see Mohn (1988). ** Based on climatic data (Figure 62).
200
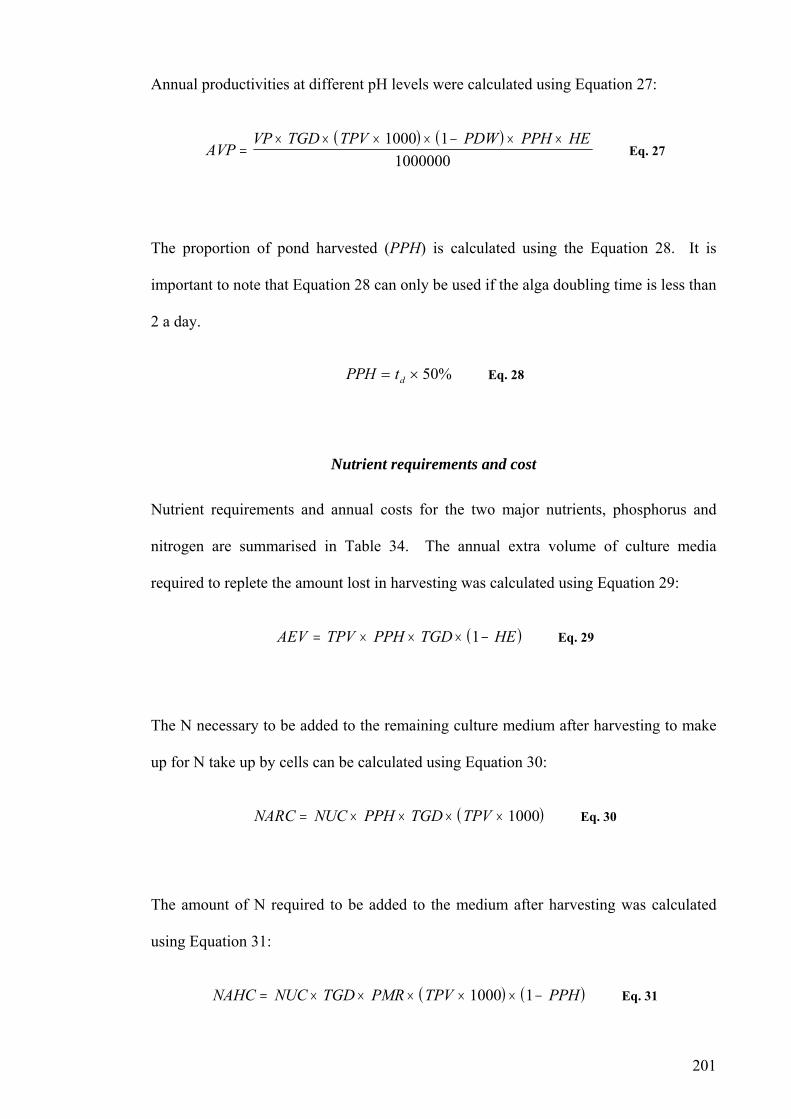
201
Annual productivities at different pH levels were calculated using Equation 27:
( ) ( )AVP
VP TGD TPV PDW PPH HE=
× × × × − × ×1000 11000000
Eq. 27
The proportion of pond harvested (PPH) is calculated using the Equation 28. It is
important to note that Equation 28 can only be used if the alga doubling time is less than
2 a day.
PPH td= × 50% Eq. 28
Nutrient requirements and cost
Nutrient requirements and annual costs for the two major nutrients, phosphorus and
nitrogen are summarised in Table 34. The annual extra volume of culture media
required to replete the amount lost in harvesting was calculated using Equation 29:
( )AEV TPV PPH TGD HE= × × × −1 Eq. 29
The N necessary to be added to the remaining culture medium ake
up for N take up by cells can be calculated using Equation 30:
( )NARC NUC PPH TGD TPV= × × × × 1000 Eq. 30
The amount of N required to be added to the medium after harvesting was calculated
using Equation 31:
( ) ( )NAHC NUC TGD PMR TPV PPH= × × × × × −1000 1 Eq. 31
after harvesting to m
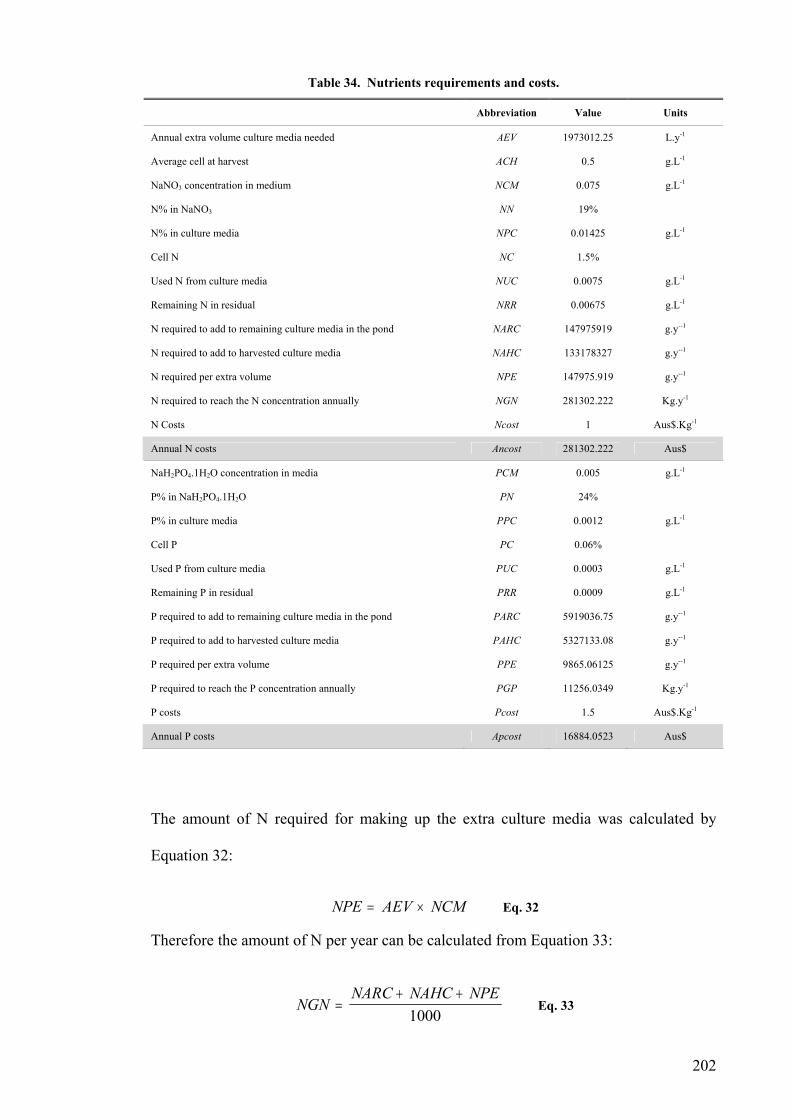
Table 34. Nutrients requirements and costs.
Abbreviation Value Units
Annual extra volume culture media needed AEV 1973012.25 L.y-1
Average cell at harvest ACH 0.5 g.L-1
NaNO3 concentration in medium NCM 0.075 g.L-1
N% in NaNO3 NN 19%
N% in culture media NPC 0.01425 g.L-1
Cell N NC 1.5%
Used N from culture media NUC 0.0075 g.L-1
Remaining N in residual NRR 0.00675 g.L-1
N required to add to remaining culture media in the pond NARC 147975919 g.y--1
N required to add to harvested culture media NAHC 133178327 g.y--1
N required per extra volume NPE 147975.919 g.y--1
N required to reach the N concentration annually NGN 281302.222 Kg.y-1
N Costs Ncost 1 Aus$.Kg-1
Annual N costs Ancost 281302.222 Aus$
NaH2PO4.1H2O concentration in media PCM 0.005 g.L-1
P% in NaH2PO4.1H2O PN 24%
P% in culture media PPC 0.0012 g.L-1
Cell P PC 0.06%
Used P from culture media PUC 0.0003 g.L-1
Remaining P in residual PRR 0.0009 g.L-1
P required to add to remaining culture media in the pond PARC 5919036.75 g.y--1
P required to add to harvested culture media PAHC 5327133.08 g.y--1
P required per extra volume PPE 9865.06125 g.y--1
P required to reach the P concentration annually PGP 11256.0349 Kg.y-1
P costs Pcost 1.5 Aus$.Kg-1
Annual P costs Apcost 16884.0523 Aus$
The amount of N required for making up the extra culture media was calculated by
Equation 32:
NPE AEV NCM= × Eq. 32
Therefore the amount of N per year can be calculated from Equation 33:
NGNNARC NAHC NPE
=+ +
1000 Eq. 33
202
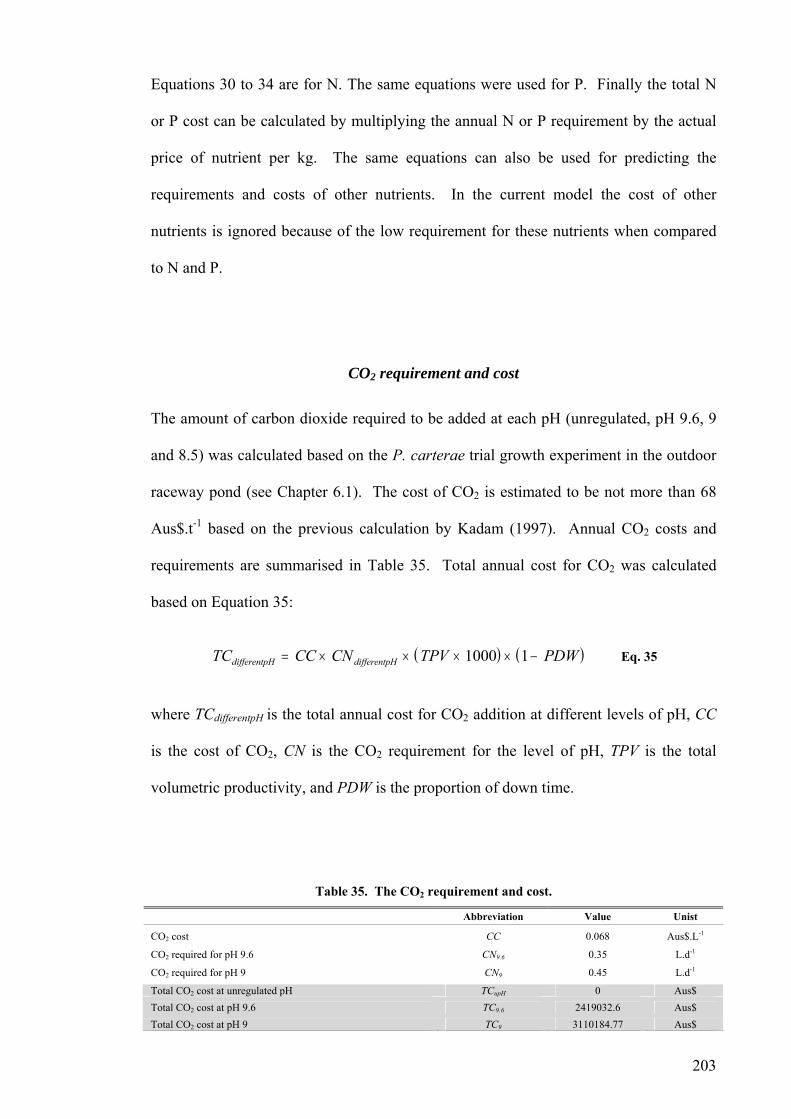
Equations 30 to 34 are for N. The same equations were used for P. Finally the total N
or P cost can be calculated by multiplying the annual N or P requirement by the actual
price of nutrient per kg. The same equations can also be used for predicting the
requirements and costs of other nutrients. In the current model the cost of other
nutrients is ignored because of the low requirement for these nutrients when compared
to N and P.
CO2 requirement and cost
The amount of carbon dioxide required to be added at each pH (unregulated, pH 9.6, 9
and 8.5) was calculated based on the P. carterae trial growth experiment in the outdoor
raceway pond (see Chapter 6.1). The cost of CO2 is estimated to be not more than 68
Aus$.t-1 based on the previous calculation by Kadam (1997). Annual CO2 costs and
requirements are summarised in Table 35. Total annual cost for CO2 was calculated
based on Equation 35:
( ) ( )TC CC CN TPV PDWdifferentpH differentpH= × × × × −1000 1 Eq. 35
where TCdifferentpH is the total annual cost for CO2 addition at different levels of pH, CC
is the cost of CO2, CN is the CO2 requirement for the level of pH, TPV is the total
volumetric productivity, and PDW is the proportion of down time.
Table 35. The CO2 requirement and cost.
Abbreviation Value Unist
CO2 cost CC 0.068 Aus$.L-1
CO2 required for pH 9.6 CN9.6 0.35 L.d-1
CO2 required for pH 9 CN9 0.45 L.d-1
Total CO2 cost at unregulated pH TCupH 0 Aus$ Total CO2 cost at pH 9.6 TC9.6 2419032.6 Aus$ Total CO2 cost at pH 9 TC9 3110184.77 Aus$
203
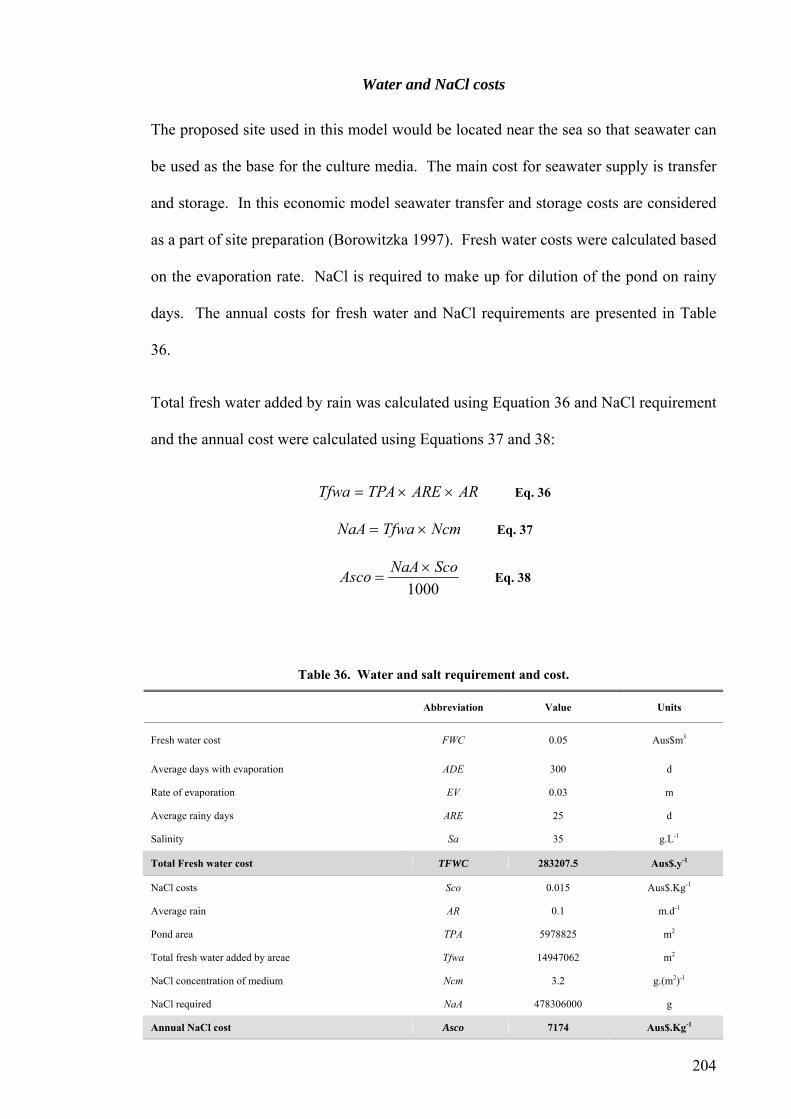
Water and NaCl costs
The proposed site used in this model would be located near the sea so that seawater can
be used as the base for the culture media. The main cost for seawater supply is transfer
and storage. In this economic model seawater transfer and storage costs are considered
as a part of site preparation (Borowitzka 1997). Fresh water costs were calculated based
on the evaporation rate. NaCl is required to make up for dilution of the pond on rainy
days. The annual costs for fresh water and NaCl requirements are presented in Table
36.
Total fresh water added by rain was calculated using Equation 36 and NaCl requirement
and the annual cost were calculated using Equations 37 and 38:
Tfwa TPA ARE AR= × × Eq. 36
NaA Tfwa Ncm= × Eq. 37
Asco NaA Sco=
×1000
Eq. 38
Table 36. Water and salt requirement and cost.
Abbreviation Value Units
Fresh water cost FWC 0.05 Aus$m3
Average days with evaporation ADE 300 d
Rate of evaporation EV 0.03 m
Average rainy days ARE 25 d
Salinity Sa 35 g.L-1
Total Fresh water cost TFWC 283207.5 Aus$.y-1
NaCl costs Sco 0.015 Aus$.Kg-1
Average rain AR 0.1 m.d-1
Pond area TPA 5978825 m2
Total fresh water added by areae Tfwa 14947062 m2
NaCl concentration of medium Ncm 3.2 g.(m2)-1
NaCl required NaA 478306000 g
Annual NaCl cost Asco 7174 Aus$.Kg-1
204
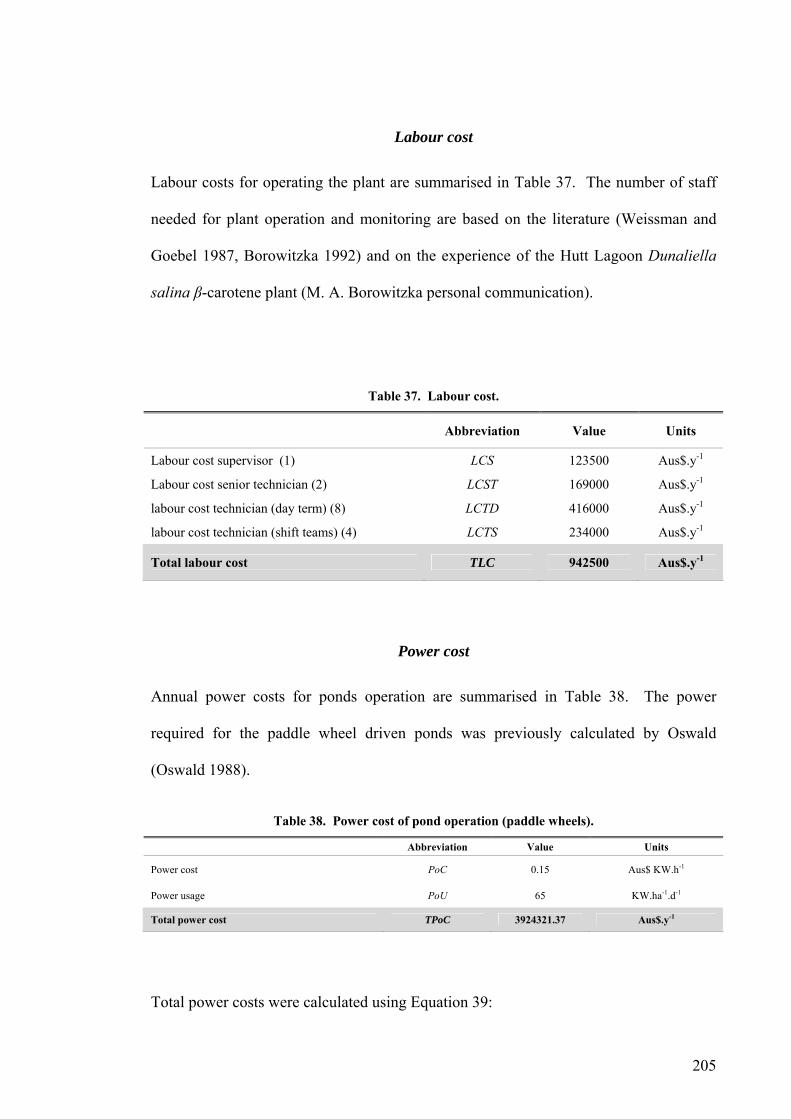
Labour cost
Labour costs for operating the plant are summarised in Table 37. The number of staff
needed for plant operation and monitoring are based on the literature (Weissman and
Goebel 1987, Borowitzka 1992) and on the experience of the Hutt Lagoon Dunaliella
salina β-carotene plant (M. A. Borowitzka personal communication).
Table 37. Labour cost.
Abbreviation Value Units
Labour cost supervisor (1) LCS 123500 Aus$.y-1
Labour cost senior technician (2) LCST 169000 Aus$.y-1
labour cost technician (day term) (8) LCTD 416000 Aus$.y-1
labour cost technician (shift teams) (4) LCTS 234000 Aus$.y-1
Total labour cost TLC 942500 Aus$.y-1
Power cost
Annual power costs for ponds operation are summarised in Table 38. The power
required for the paddle wheel driven ponds was previously calculated by Oswald
(Oswald 1988).
Table 38. Power cost of pond operation (paddle wheels).
Abbreviation Value Units
Power cost PoC 0.15 Aus$ KW.h-1
Power usage PoU 65 KW.ha-1.d-1
Total power cost TPoC 3924321.37 Aus$.y-1
Total power costs were calculated using Equation 39:
205
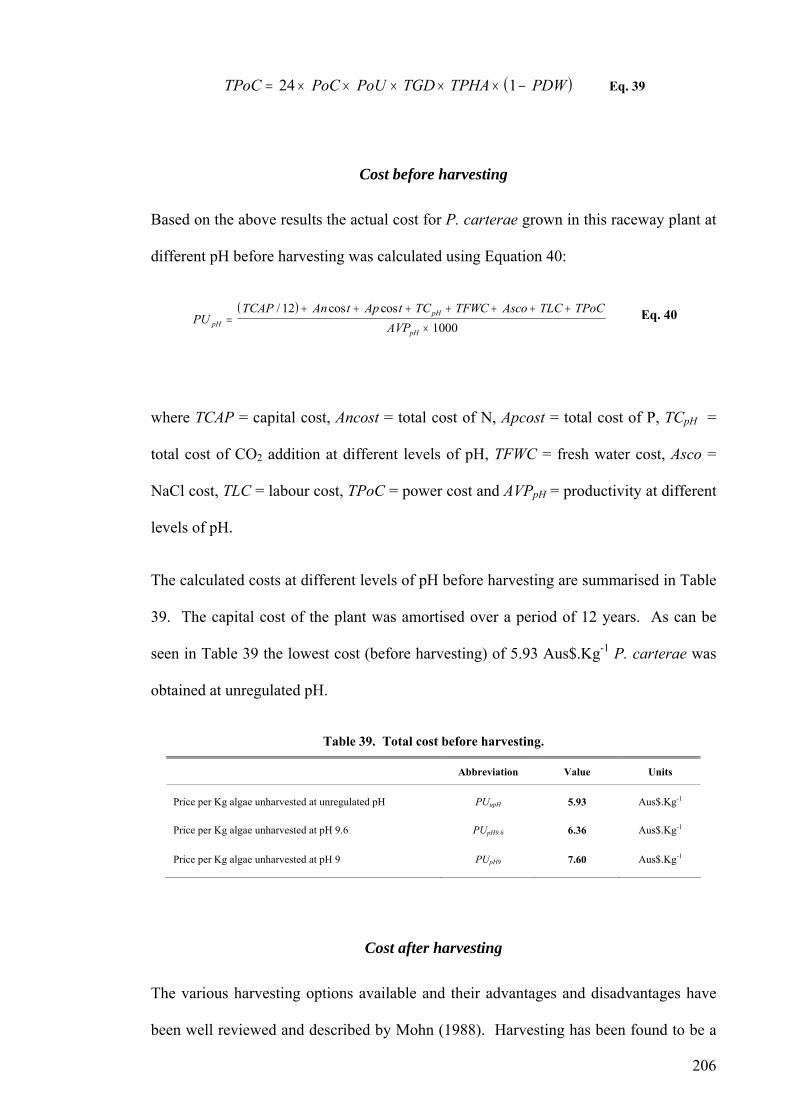
( )TPoC PoC PoU TGD TPHA PDW= × × × × × −24 1 Eq. 39
Cost before harvesting
Based on the above results the actual cost for P. carterae grown in this raceway plant at
different pH before harvesting was calculated using Equation 40:
( )PU
TCAP An t Ap t TC TFWC Asco TLC TPoCAVPpH
pH
pH=
+ + + + + + +
×
/ cos cos121000
Eq. 40
where TCAP = capital cost, Ancost = total cost of N, Apcost = total cost of P, TCpH =
total cost of CO2 addition at different levels of pH, TFWC = fresh water cost, Asco =
NaCl cost, TLC = labour cost, TPoC = power cost and AVPpH = productivity at different
levels of pH.
The calculated costs at different levels of pH before harvesting are summarised in Table
39. The capital cost of the plant was amortised over a period of 12 years. As can be
seen in Table 39 the lowest cost (before harvesting) of 5.93 Aus$.Kg-1 P. carterae was
obtained at unregulated pH.
Table 39. Total cost before harvesting.
Abbreviation Value Units
Price per Kg algae unharvested at unregulated pH PUupH 5.93 Aus$.Kg-1
Price per Kg algae unharvested at pH 9.6 PUpH9.6 6.36 Aus$.Kg-1
Price per Kg algae unharvested at pH 9 PUpH9 7.60 Aus$.Kg-1
Cost after harvesting
The various harvesting options available and their advantages and disadvantages have
been well reviewed and described by Mohn (1988). Harvesting has been found to be a
206
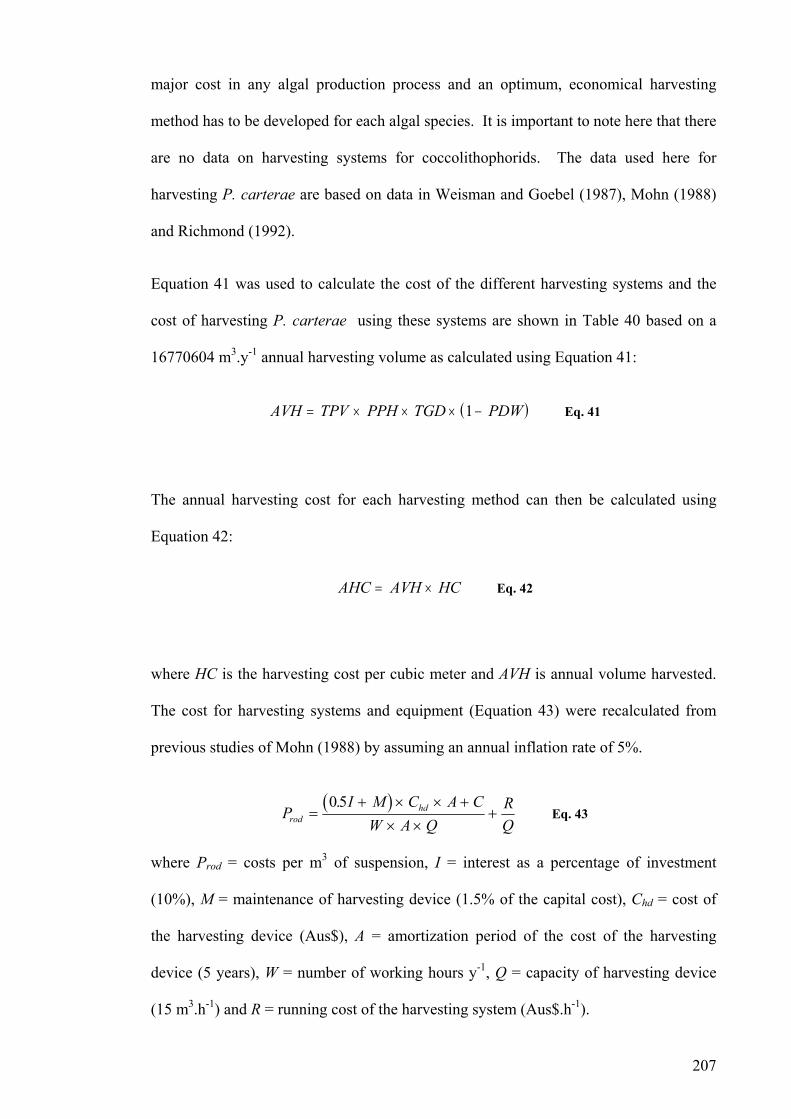
major cost in any algal production process and an optimum, economical harvesting
method has to be developed for each algal species. It is important to note here that there
are no data on harvesting systems for coccolithophorids. The data used here for
harvesting P. carterae are based on data in Weisman and Goebel (1987), Mohn (1988)
and Richmond (1992).
Equation 41 was used to calculate the cost of the different harvesting systems and the
cost of harvesting P. carterae using these systems are shown in Table 40 based on a
16770604 m3.y-1 annual harvesting volume as calculated using Equation 41:
( )AVH TPV PPH TGD PDW= × × × −1 Eq. 41
The annual harvesting cost for each harvesting method can then be calculated using
Equation 42:
AHC AVH HC= × Eq. 42
where HC is the harvesting cost per cubic meter and AVH is annual volume harvested.
The cost for harvesting systems and equipment (Equation 43) were recalculated from
previous studies of Mohn (1988) by assuming an annual inflation rate of 5%.
( )PI M C A C
W A QRQrod
hd=+ × × +
× ×+
0 5. Eq. 43
where Prod = costs per m3 of suspension, I = interest as a percentage of investment
(10%), M = maintenance of harvesting device (1.5% of the capital cost), Chd = cost of
the harvesting device (Aus$), A = amortization period of the cost of the harvesting
device (5 years), W = number of working hours y-1, Q = capacity of harvesting device
(15 m3.h-1) and R = running cost of the harvesting system (Aus$.h-1).
207
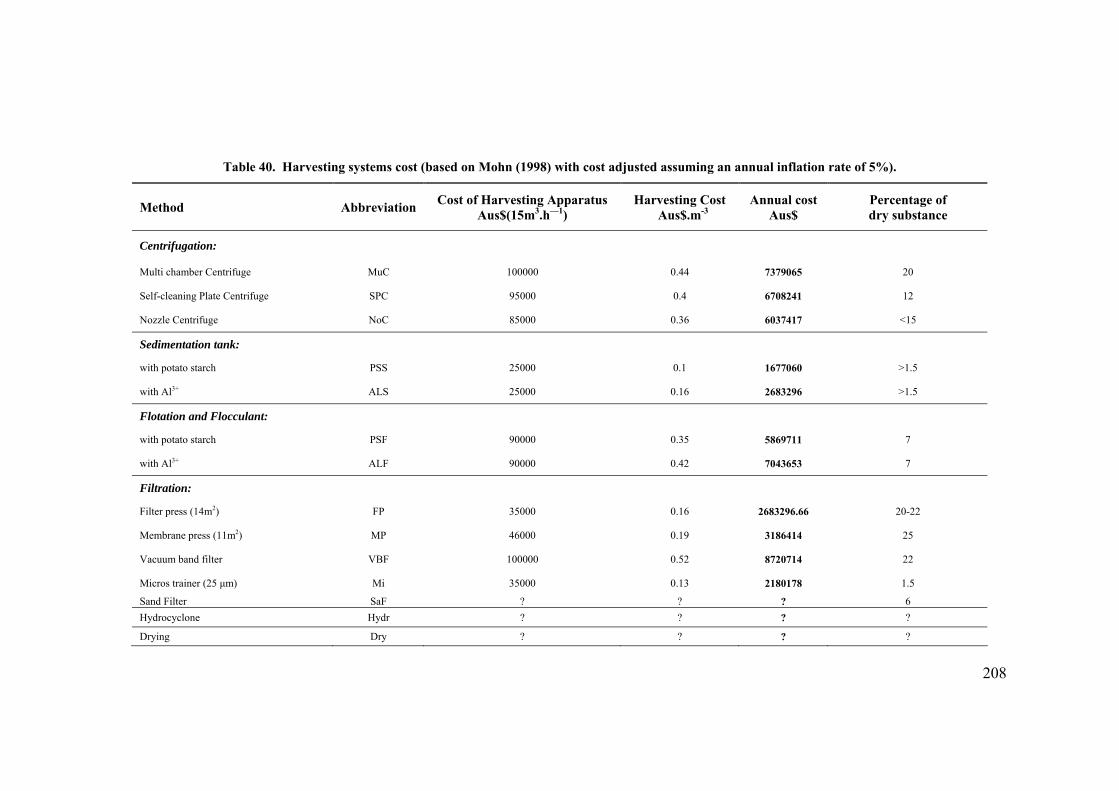
208
Table 40. Harvesting systems cost (based on Mohn (1998) with cost adjusted assuming an annual inflation rate of 5%).
Method Abbreviation Cost of Harvesting Apparatus Aus$(15m3.h—1)
Harvesting Cost Aus$.m-3
Annual cost Aus$
Percentage of dry substance
Centrifugation:
Multi chamber Centrifuge MuC 100000 0.44 7379065 20
Self-cleaning Plate Centrifuge SPC 95000 0.4 6708241 12
Nozzle Centrifuge NoC 85000 0.36 6037417 <15
Sedimentation tank:
with potato starch PSS 25000 0.1 1677060 >1.5
with Al3+ ALS 25000 0.16 2683296 >1.5
Flotation and Flocculant:
with potato starch PSF 90000 0.35 5869711 7
with Al3+ ALF 90000 0.42 7043653 7
Filtration:
Filter press (14m2) FP 35000 0.16 2683296.66 20-22
Membrane press (11m2) MP 46000 0.19 3186414 25
Vacuum band filter VBF 100000 0.52 8720714 22
Micros trainer (25 µm) Mi 35000 0.13 2180178 1.5
Sand Filter SaF ? ? ? 6 Hydrocyclone Hydr ? ? ? ? Drying Dry ? ? ? ?
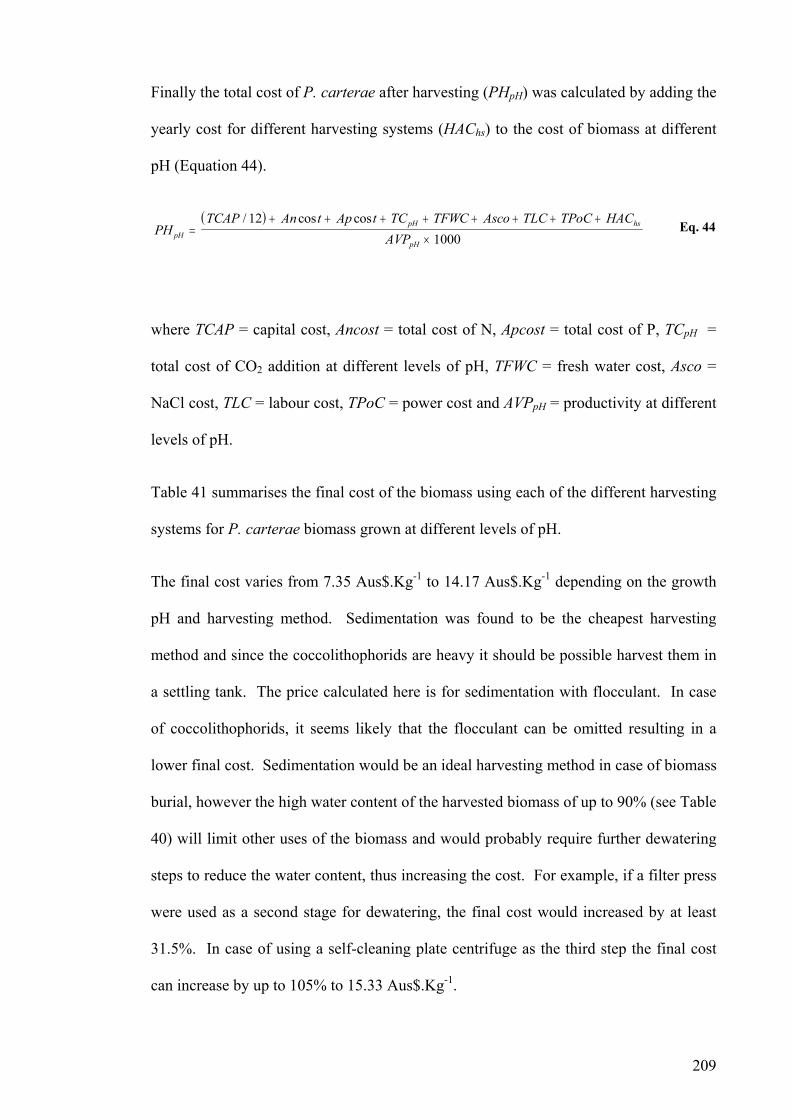
209
Finally the total cost of P. carterae after harvesting (PHpH) was calculated by adding the
yearly cost for different harvesting systems (HAChs) to the cost of biomass at different
pH (Equation 44).
( )PH
TCAP An t Ap t TC TFWC Asco TLC TPoC HACAVPpH
pH hs
pH=
+ + + + + + + +
×
/ cos cos121000
Eq. 44
where TCAP = capital cost, Ancost = total cost of N, Apcost = total cost of P, TCpH =
total cost of CO2 addition at different levels of pH, TFWC = fresh water cost, Asco =
NaCl cost, TLC = labour cost, TPoC = power cost and AVPpH = productivity at different
levels of pH.
Table 41 summarises the final cost of the biomass using each of the different harvesting
system P. carterae biomass grown at different levels of pH.
The final cost varies from 7.35 Aus$.Kg-1 to 14.17 Aus$.Kg-1 depending on the growth
ethod. Sedimentation was found to be the cheapest harvesting
method and since the coccolithophorids are heavy it should be possible harvest them in
a settling tank. The price calculated here is for sedimentation with flocculant. In case
of coccolithophorids, it seems likely that the flocculant can be omitted resulting in a
entation would be an ideal harvesting method in case of biomass
burial, however the high water content of the harvested biomass of up to 90% (see Table
40) will lim r uses of the biomass and would probably require further dewatering
steps to r ce the water content, thus increasing the cost. For example, if a filter press
were used as a second stage for dewatering, the final cost would increased by at least
31.5%. In case of using a self-cleaning plate centrifuge as the third step the final cost
can increase by up to 105% to 15.33 Aus$.Kg-1.
s for
pH and harvesting m
lower final cost. Sedim
it othe
edu

Table 41. Final cost after harvesting using different harvesting methods.
Harvesting technique Cost (Aus$.kg-1)
unregulated pH pH 9.6 pH 9
Centrifugation
MuC 12.21 11.35 13.16
SPC 11.36 10.90 12.66
NoC 11.06 10.44 12.15
Sedimentation tank
PSS 7.35 7.49 8.86
ALS 8.21 8.17 9.62
Flotation and Flocculant
PSF 11.52 10.81 12.55
ALF 12.52 11.6 13.44
Filtration
FP 8.21 8.17 9.62
MP 8.64 8.51 10.00
VBF 13.34 12.25 14.17
Mi 7.78 7.83 9.24
Cost comparison between P. carterae and D. salina
The productivity and cost prior to harvesting and after harvest for P. carterae and D.
salina are summarised in Figure 64. A self-cleaning plate centrifuge was used for
harvesting both species. The productivity data for D. salina was based on the
experiment described in Chapter 5. As it is shown in Figure 64, by using this type
harvesting system, the cheapest cost for P. carterae of 11.10 Aus$.Kg-1 is achieved at
pH 9.6 with a productivity of over 1500 t.y-1.
210
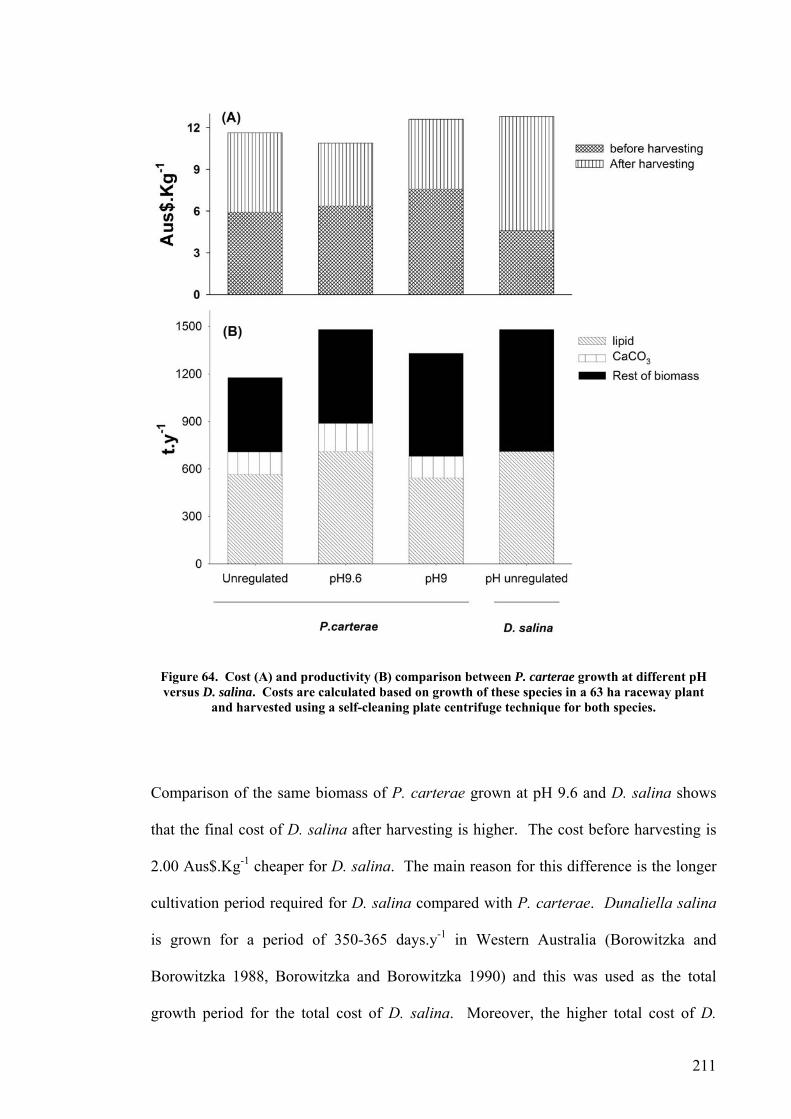
Figure 64. Cost (A) and productivity (B) comparison between P. carterae growth at different pH versus D. salina. Costs are calculated based on growth of these species in a 63 ha raceway plant
and harvested using a self-cleaning plate centrifuge technique for both species.
Comparison of the same biomass of P. carterae grown at pH 9.6 and D. salina shows
that the final cost of D. salina after harvesting is higher. The cost before harvesting is
2.00 Aus$.Kg-1 cheaper for D. salina. The main reason for this difference is the longer
cultivation period required for D. salina compared with P. carterae. Dunaliella salina
is grown for a period of 350-365 days.y-1 in Western Australia (Borowitzka and
Borowitzka 1988, Borowitzka and Borowitzka 1990) and this was used as the total
growth period for the total cost of D. salina. Moreover, the higher total cost of D.
211
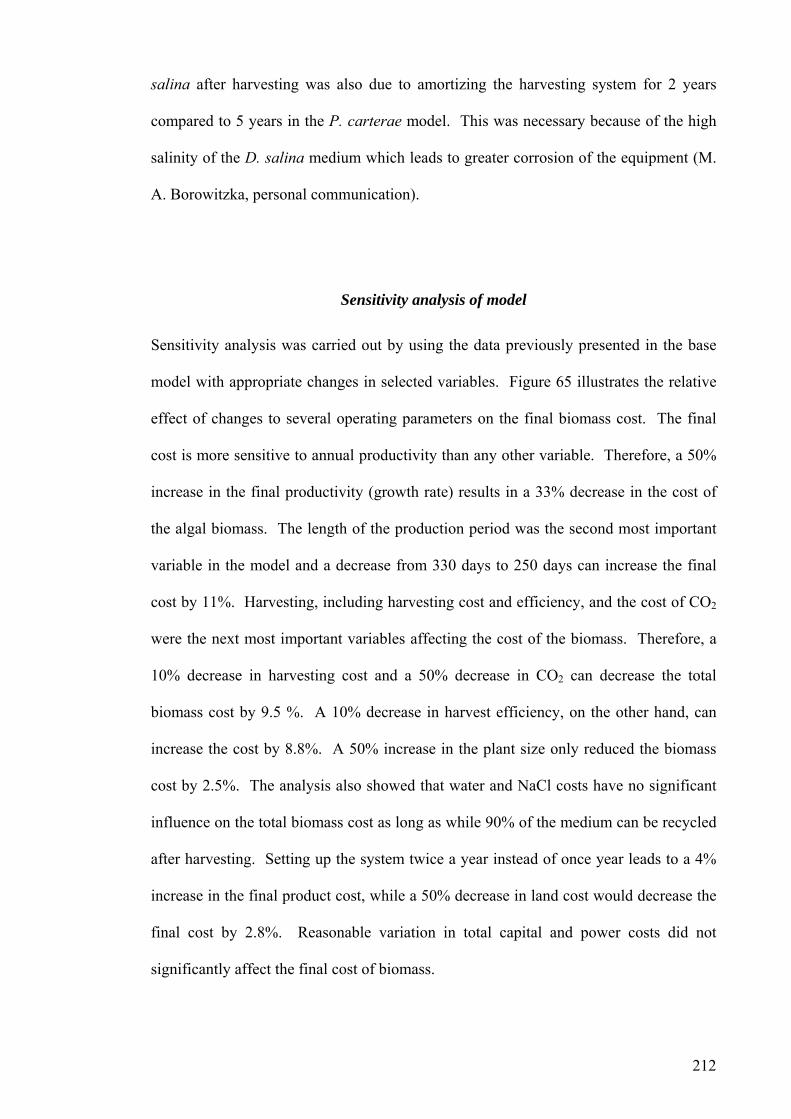
salina after harvesting was also due to amortizing the harvesting system for 2 years
compared to 5 years in the P. carterae model. This was necessary because of the high
salinity of the D. salina medium which leads to greater corrosion of the equipment (M.
A. Borowitzka, personal communication).
Sensitivity analysis of model
Sensitivity analysis was carried out by using the data previously presented in the base
model with appropriate changes in selected variables. Figure 65 illustrates the relative
effect of changes to several operating parameters on the final biomass cost. The final
cost is more sensitive to annual productivity than any other variable. Therefore, a 50%
increase in the final productivity (growth rate) results in a 33% decrease in the cost of
the algal biomass. The length of the production period was the second most important
variable in the model and a decrease from 330 days to 250 days can increase the final
cost by 11%. Harvesting, including harvesting cost and efficiency, and the cost of CO2
were the next most important variables affecting the cost of the biomass. Therefore, a
10% decrease in harvesting cost and a 50% decrease in CO2 can decrease the total
biomass cost by 9.5 %. A 10% decrease in harvest efficiency, on the other hand, can
increase the cost by 8.8%. A 50% increase in the plant size only reduced the biomass
cost by 2.5%. The analysis also showed that water and NaCl costs have no significant
influence on the total biomass cost as long as while 90% of the medium can be recycled
after harvesting. Setting up the system twice a year instead of once year leads to a 4%
increase in the final product cost, while a 50% decrease in land cost would decrease the
final cost by 2.8%. Reasonable variation in total capital and power costs did not
significantly affect the final cost of biomass.
212
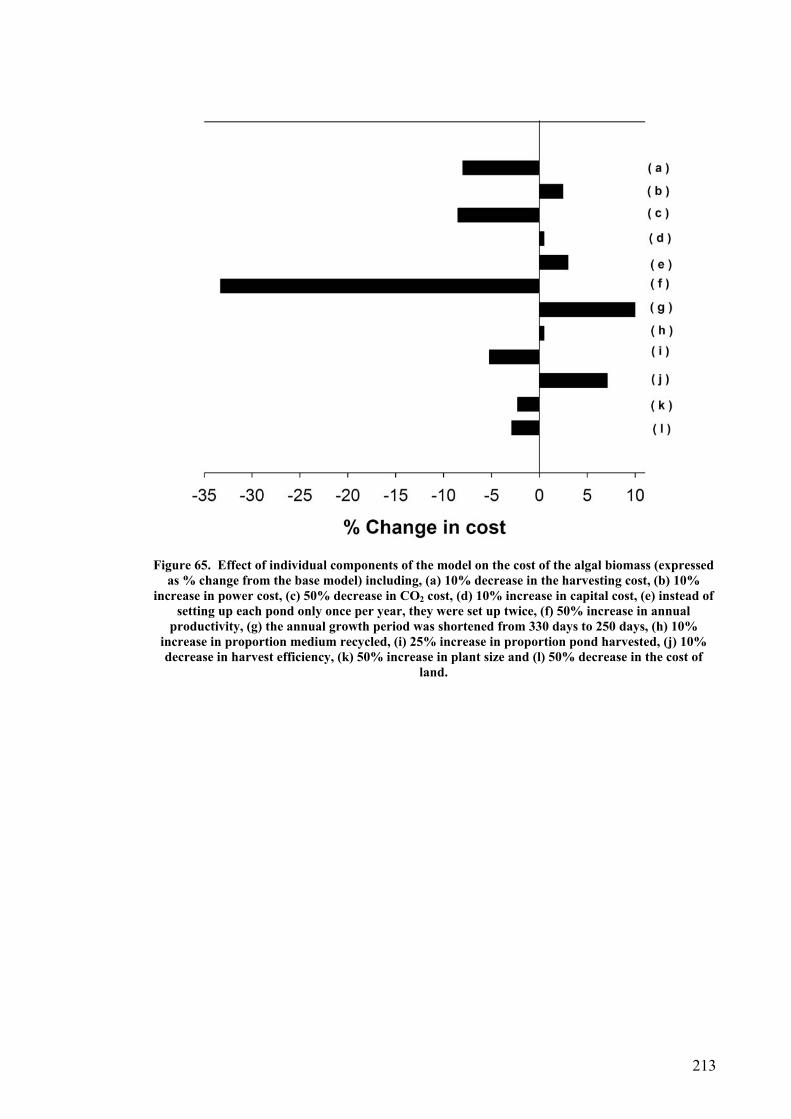
Figure 65. Effect of individual components of the model on the cost of the algal biomass (expressed as % change from the base model) including, (a) 10% decrease in the harvesting cost, (b) 10%
increase in power cost, (c) 50% decrease in CO2 cost, (d) 10% increase in capital cost, (e) instead of setting up each pond only once per year, they were set up twice, (f) 50% increase in annual
productivity, (g) the annual growth period was shortened from 330 days to 250 days, (h) 10% increase in proportion medium recycled, (i) 25% increase in proportion pond harvested, (j) 10% decrease in harvest efficiency, (k) 50% increase in plant size and (l) 50% decrease in the cost of
land.
213
7.5 Discussion
The comparison of photosynthetic light energy efficiency (PE) values showed a similar
pattern as specific growth rate and productivities for each species in the different
cultivation systems. The highest PE was achieved in the plate type photobioreactor and
was 10 times lower in the raceway pond. The reasons for this difference can be
explained by comparing the culture conditions in these two systems. The plate type
photobioreactor was located indoors under constant conditions, whereas the raceway
was located outdoors. The PE reported in other studies on different microalgae species
varies. For example, values of 3-6% for Spirulina and Chlorella are reported by
Watanabe et al. (1995) and Morita et al. (2001a). Hu et al. (1998) reported a PE of up
to 20% in Spirulina platensis grown in a narrow plate photobioreactor and they showed
that increasing the reactor width from 3.1 to 5.2 resulted in an up to 39% decrease in the
PE. A higher PE therefore can be expected if the culture width were reduced in the
plate photobioreactor, however in raceway ponds a higher PE is not expected as
raceway ponds can not be operated below a certain depth (Borowitzka 2005). The PE
of the cultivation systems can potentially be increased by introducing a better mixing
regime. This would result in shorter light/dark cycles, higher biomass production, and
higher PE. However, higher power consumption and the negative effect of shear on
microalgal cells could be possible disadvantages of higher flow rates, especially in
species such as P. carterae, which have a high shear sensitivity (see page Section 6.5).
It is also important to note that only the energy converted to biomass (afdw) was used in
the calculation of PE. Higher PE can be expected if the energy used in the coccolith
production were also taken into consideration.
Carbon utilisation at different pH levels also followed the same pattern as growth rate
and productivities at different pH values for both E. huxleyi and P. carterae. The low
214
carbon utilisation at lower pH was mainly due to the lack of good growth, resulting in
lower productivities and less carbon utilization.
The purpose of the basic economic modelling carried out here was to estimate the total
cost of producing the algal biomass for a hypothetical large-scale cultivation plant for
growing P. carterae. In the model described here, a paddle wheel driven raceway
production system is used, as this study has found that this is the best system for reliable
culture of P. carterae (Chapter 5). Previous studies have also shown that open pond
cultivation systems are most economical for long term, large-scale production of
microalgae, and that closed systems have yet to be economically viable (Benemann
1985, Benemann, et al. 1987, Weissman and Goebel 1987, Borowitzka and Borowitzka
1990, Richmond 1992, Borowitzka 1993c, Zou, et al. 2000). However, it should be
pointed out that E. huxleyi would have to be cultured in a plate photobioreactor as this
species did not grow in raceway ponds (see page 130), however the production cost of
the E. huxleyi biomass would be significantly higher.
A final cost of > 7.49 Aus$.Kg-1 was calculated for P. carterae biomass grown at pH
9.6. However, some potential and reasonable technology improvements and cost
reductions that could further decrease the cost of production can be proposed. For
example, a new inexpensive harvesting system or even improving current systems for
higher efficiency could significantly decrease the total algal biomass costs. Takano and
colleagues (1994) have demonstrated the use of ultrasound for continuous coccolith
separation from P. carterae cultures. Bosma et al. (2003) also used ultrasound as a new
technique for harvesting microalgae, however the feasibility of such systems for large-
scale production and the long term effect of coccolith separation on the physiology of P.
carterae still remains to be determined.
215
Although large-scale microalgal culture has now been carried out for over 50 years, our
experience is still limited to only a few species and, even for these, our understanding of
their biology and ecology is still very limited. The actual cost of current algal
production is generally not revealed by commercial producers; however some
appreciation of costs can be obtained from various models which have been previously
published.
The main published data on the cost of microalgal production in raceway ponds are
summarized in Table 42. The original costs have been updated to 2004 prices by
assuming 5% per annum inflation rate. The total algal biomass production cost is
between 6.20 Aus$.Kg-1 and 50 Aus$.Kg-1 and, normally, the lower cost can be found in
the larger size plants. It should be noted that the very low cost reported in the same
(e.g. Barclay 1987) are from some extremely optimistic models and experience to date
shows them to be unrealistic. Economic modelling for P. carterae shows the same
range of production cost for this species as for other species, however this cost is the
base cost for production and any further processing such as separating the CaCO3 or
converting the rest of biomass into oil by pyrolysis will increase the cost of the final
product, although it may also increase the value of the final product.
Research on the production of energy from renewable sources, such as hydrocarbon
production by pyrolysis of biomass, has received much recent interest (Weissman and
Goebel 1987, Yagishita, et al. 1996, Sheen, et al. 1998). Most renewable sources used
in the pyrolysis of biomass have been higher plants rather than microalgae, although the
latter are the main primary producers in the oceans (Geider, et al. 2001). Whereas the
use of fossil fuels such as coal and oil leads to the emission of CO2, renewable biomass
does not increase atmospheric CO2 concentration to the some degree and such
216
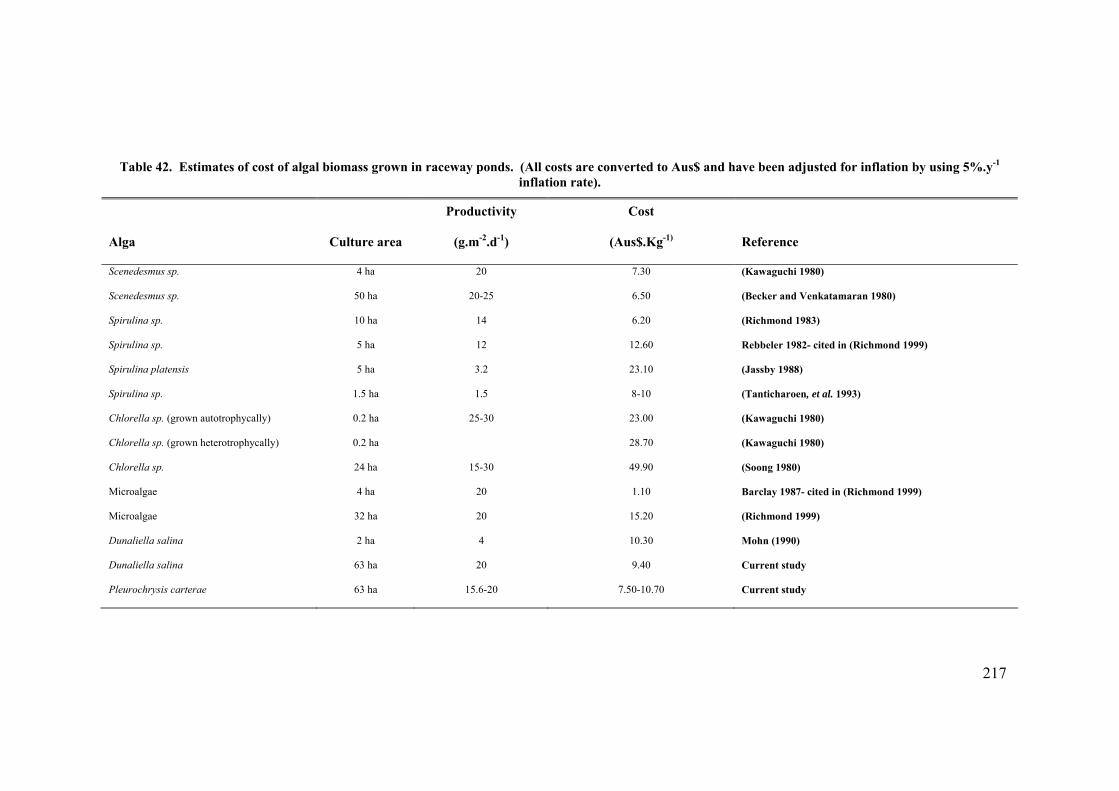
217
Table 42. Estimates of cost of algal biomass grown in raceway ponds. (All costs are converted to Aus$ and have been adjusted for inflation by using 5%.y-1 inflation rate).
Alga Culture area
Productivity
(g.m-2.d-1)
Cost
(Aus$.Kg-1) Reference
Scenedesmus sp. 4 ha 20 7.30 (Kawaguchi 1980)
Scenedesmus sp. 50 ha 20-25 6.50 (Becker and Venkatamaran 1980)
Spirulina sp. 10 ha 14 6.20 (Richmond 1983)
Spirulina sp. 5 ha 12 12.60 Rebbeler 1982- cited in (Richmond 1999)
Spirulina platensis 5 ha 3.2 23.10 (Jassby 1988)
Spirulina sp. 1.5 ha 1.5 8-10 (Tanticharoen, et al. 1993)
Chlorella sp. (grown autotrophycally) 0.2 ha 25-30 23.00 (Kawaguchi 1980)
Chlorella sp. (grown heterotrophycally) 0.2 ha 28.70 (Kawaguchi 1980)
Chlorella sp. 24 ha 15-30 49.90 (Soong 1980)
Microalgae 4 ha 20 1.10 Barclay 1987- cited in (Richmond 1999)
Microalgae 32 ha 20 15.20 (Richmond 1999)
Dunaliella salina 2 ha 4 10.30 Mohn (1990)
Dunaliella salina 63 ha 20 9.40 Current study
Pleurochrysis carterae 63 ha 15.6-20 7.50-10.70 Current study
materials now being considered as an important energy resources for the future (Sheen,
et al. 1998). Ginzburg (1993) suggested the possibility of using algae such as
Dunaliella for oil production by biomass pyrolysis, producing oil about 20% less
expensive than fossil oil. However his calculation was based on cells growing at a
growth rate of 8.36 d-1 which is not achievable in any type outdoor cultivation system.
Wu and colleagues (1999) also showed high methane production by high temperature
pyrolysis of E. huxleyi. Unfortunately all reports and research conducted are based on
small-scale studies and are also carried out over only short period of time making it
difficult to extrapolate to the very large-scale systems required. However, microalgae
clearly need to be seriously considered as the potential source of renewable fuels.
One of the most important factors limiting the growth and improvement in microalgal
biotechnology is the need for alternative designs for microalgae production systems that
would be able to meet the requirements of microalgae production for fuels (Borowitzka
1992, Kadam 1997, Sheen, et al. 1998). This particularly true of closed
photobioreactors, which to date cannot compete with open systems due to their high
construction and operating costs. The costs of even the simplest closed
photobioreactors would likely be well above what is affordable for fuel production
process (Borowitzka 1996, Richmond 2000).
The direct co-firing of algal biomass with a high lipid content with coal has been
investigated in several studies (Aresta, et al. 1997, Kadam 1997, 2001). The main
advantage of algal cofiring is to reduce the process costs. Therefore, in countries such
as Australia, where coal plays an important role for power production and with suitable
climate and large available land areas, operating a P. carterae plant, could not only
reduce transport costs but the supply with CO2 from flue gas to the culture would be
more realistic. The economies of such a system are still unsolved, and the task is still to
218

develop a microalgae cultivation process able to compete with the petrochemical
industry in terms of quantity and cost of the desired product. The underground
discarding of the wet biomass (burial) is another option if we are to use this species just
for CO2 removal. The cost effectiveness of such a process and its economical feasibility
would be highly related to governmental policies and incentives for mitigation the
production of green house gases.
The sensitivity analysis performed here confirms that the optimistic assumptions used in
setting the large-scale system for culturing P. carterae, are necessary to produce this
alga economically. However it needs to be pointed out that the culture system has not
yet fully optimised. Carbon efficiency/cost, harvesting system and productivity/growth
rate have high potential for improvement for this species of microalgae. An increase in
productivity has the most important impact on the final product cost. Previous
economic modelling has also shown a high cost dependency on the growth rate of the
microalgae (Benemann 1985, Tapie and Bernard 1987, Weissman and Goebel 1987,
Richmond 1999). However, the modelling presented here points an excellent basis for
future work on P. carterae culture and highlights areas to which attention should be
paid.
219
CHAPTER 8
GENERAL CONCLUSIONS
In this study several species of coccolithophorid algae were screened and tested with
respect to their potential for large-scale cultivation and biomass production for the
purposes of carbon dioxide bioremediation.
The initial screening successfully identified 3 high temperature (28oC) tolerant species,
Pleurochrysis carterae CCMP647, Emiliania huxleyi CCMP371, and Gephyrocapsa
oceanica CS-335/2. All three species grew in the salinity range of 23.7 to 33.1 ppt, and
the salinities for optimum growth, biomass and calcium carbonate productivity were
31.5 to 33.1 ppt, 23.7 to 25.1 ppt, and 27.9 to 29.1 ppt for P. carterae, E. huxleyi, and
G. oceanica respectively.
To examine the availability of nutrients for growth, the nutrient limitation of each
species were then screened. The results indicate that, while no limitation of the
nutrients was found, high cell density was limiting the growth of all species.
All the species grew in plate and carboy photobioreactors but the concentric draught-
tube internal loop airlift photobioreactor was only suitable for P. carterae cultivation.
Despite extensive attempts to grow P. carterae in the Biocoil photobioreactor, including
modification of the airlift and sparger design, no net growth of the alga could be
achieved. The shear produced by turbulence and bubble effects was found to be the
main reason for this failure to grow in the Biocoil.
Gephyrocapsa oceanica was found to be unstable with respect to production of
coccoliths. This species ceased to produce coccoliths several times whilst being grown
220
in closed photobioreactors and therefore this species was excluded from further
experiments.
Although higher specific growth rates were achieved in the plate rather than carboy
photobioreactors, dry weight productivities were the same for all species. Pleurochrysis
carterae showed higher biomass and lipid productivities than E. huxleyi in the plate
photobioreactor, but both species showed the same CaCO3 productivity.
These results indicate that plate photobioreactors are the most reliable closed cultivation
system for coccolithophorid algae.
The growth of P. carterae and E. huxleyi was also examined in an outdoor paddle wheel
driven raceway pond. Emiliania huxleyi grew in the raceway pond, but the culture
deteriorated in less than 2 weeks. High contamination with other microalgae and
ciliates were the main reasons for the failure of the culture. Pleurochrysis carterae, on
the other hand, grew successfully in the raceway pond for a period of 13 months.
One of the most interesting outcomes of this study was the difference in culture pH
between P. carterae and E. huxleyi. Pleurochrysis carterae increased the medium pH
up to pH 11 during the day, while no pH change was observed in the culture of E.
huxleyi. This suggests that these algae have different carbon concentrating mechanisms
(CCM) and photosynthesis:calcification ratios (see Chapter 3). The increase in the pH
of the P. carterae culture could be one of the main reasons for the low contamination
observed. As a matter of fact, in cultures of P. carterae under any conditions with low
pH high contamination with other species of microalgae occurred. The second
explanation for the successful growth of P. carterae may be the production of DMS by
this microalga. Pleurochrysis carterae has been showed to produce a much higher level
of DMS than E. huxleyi (Malin and Steinke 2004). Bacterial contamination, on the
other hand, appeared to favour its growth and it is possible that P. carterae has a
221
capacity to feed on bacteria using the haptonema as has reported for other haptophytes
(Kawachi and Inouye 1995).
In this study sustainable growth of P. carterae for over 330 days was achieved. The
overall productivity of P. carterae was 0.19 g.L-1.d-1 with the biomass having lipid and
CaCO3 contents of up to 33% and 10% respectively. Dunaliella salina was also
cultivated in parallel with P. carterae to compare their productivities. Both species
achieved the same areal biomass and lipid productivities.
The effects of number of limiting factors on growth were studied. The addition of CO2
using a pH-stat was found to increase the productivities of P. carterae in both the
raceway pond and plate photobioreactor, whereas CO2 addition decreased the
productivity of E. huxleyi. The potential of adding CO2 to culture media is highly
dependent on to its cost effectiveness (De Pauw and Persoone 1988, Oh-Hama and
Miyachi 1988, Qiu and Gao 2002). Using low cost CO2 sources such as power plant
flue gas could be possible for long term economical production, as long as there is no
negative effect of NOx and SOx impurities in the flue gas on the growth of P. carterae
(Sheen, et al. 1998, Kadam 2001).
The optimum operational depth of the raceway pond for P. carterae growth was 16 and
21 cm for autumn and spring respectively. The cultures showed signs of light limitation
at depths higher than 16 cm in autumn and were photoinhibited at a depth of less than
21 cm in summer. Pleurochrysis carterae photosynthesis adapted to the high
irradiances outdoors. Photosynthesis also was found to be more sensitive to high
oxygen concentrations compared to high light and high temperatures. The high oxygen
concentration produced by photosynthesis during the day therefore seems to be a main
limiting factor in the outdoor cultivation of P. carterae.
222
Cell division of Pleurochrysis carterae was found to be synchronised, whereas E.
huxleyi and G. oceanica were phased. The best operating system for P. carterae,
therefore, is semicontinuous culture, while E. huxleyi and G. oceanica cultures can be
operated continuous or semicontinuously.
The final cost of P. carterae production in a hypothetical 63 ha raceway plant located
on the south coast of Western Australia using various harvesting systems and grown at
various pH values was found to be between 7.35 Aus$.Kg-1 and 14.17 Aus$.Kg-1. The
model was found to be most sensitive to annual productivity and a 50% increase in
annual productivity can decrease the total production cost by more than 35%, whereas
shortening the growth period from 330 d to 250 d increased the final biomass cost by
12%. A decrease in the final cost can be achieved by increasing harvesting efficiency,
decreasing the harvesting cost or decreasing the CO2 cost. In the model the final cost of
P. carterae was at least 1.0 Aus$.Kg-1 cheaper than D. salina grown in the same
cultivation system. As mentioned in Chapter 1, the final cost for CO2 bioremediation
must be lower than 3-4 Aus$.Kg-1 if the biomass is only being used as a CO2 sink.
However, other potential uses for the biomass (i.e. renewable fuel or as a food
supplement) together with its being a CO2 sink, may make the production economically
viable. It must also be remembered that the culture of P. carterae has not been fully
optimised as yet, so, have the various harvesting and dewatering options to be tested.
The latter is of particular importance because of the significant effect of harvesting cost
on the final cost of the biomass.
Future directions
The results of this study show that research for the production of total biomass, CaCO3
and/or lipid from coccolithophorids with respect to P. carterae, as the most promising
223
species, should proceed in several directions. Firstly, further studies need to concentrate
on the physiology of this alga in the area of photosynthesis/calcification and the
mechanisms of Ci uptake. Secondly, further screening to find a strain of P. carterae
with reduced sensitivity to high oxygen concentrations has the potential to significantly
increase productivity. Mutagenesis or genetic modification should also be explored.
Strain selection could also be used to select strains with higher growth rates, biomass
productivity, and lipid content. Further optimization of growth, biomass, lipid and
CaCO3 production through a detailed study of nutrients requirements using continuous
cultures also could be rewarding. The culture of P. carterae also needs to be scaled-up
and piloted in ponds of at least 50% of the production size in order to refine the
economic modeling undertake. The economical model used in this study was a very
basic one and the production data for P. carterae are based on only a 1 m2 raceway
pond.
In conclusion, this study is the first to grow coccolithophorid algae on a larger scale and
the first to grow them outdoors in an open cultivation system for extended periods.
Although the cost of the P. carterae algal biomass, as calculated using a simple
economic model, is too high to use this alga to be used economically for CO2
bioremediation at this stage, there are several options for reducing this cost. It is
therefore clear that the large-scale culture of the coccolithophorid alga Pleurochrysis
carterae CCMP647 is a serious option for future use for carbon dioxide bioremediation
and possibly as a renewable fuel source.
224
REFERENCES
Abdulqader, G., Barsanti, L. and Tredici, M. R. (2000) Harvest of Arthrospira platensis from Lake Kossorom (Chad) and its household usage among Kanembu. Journal of Applied Phycology. 12:493-498
Abeliovich, A. (1980) Factors limiting algal growth in high rate oxidation ponds. In: Algae Biomass. (Shelef, G. and Soeder, C. J. eds). Elsevier North-Holland Biomedical Press, Amsterdam, pp: 205-216
Acién Fernández, F. G. A., Sevilla, J. M. F., Perez, J. A. S., Grima, E. M. and Chisti, Y. (2001) Airlift-driven external-loop tubular photobioreactors for outdoor production of microalgae: assessment of design and performance. Chemical Engineering Science. 56:2721-2732
Anderson, A. (1994) Cost-effectiveness in addressing the "CO2 problem," with special reference to the investments of the global environment facility. Annual Review of Energy and Environment. 19:423-455
Anderson, D. B. and Eakin, D. E. (1985) A process for production of polysaccharides from microalgae. Biotechnology and Bioengineering Symposium. 15:533-547
Anning, T., Nimer, N. A., Merret, J. M. and Brownlee, C. (1996) Costs and benefits of calcification in coccolithophorids. Journal of Marine Systems. 9:45-56
Anton Hough, R. and Wetzel, R. G. (1978) Photorespiration and CO2 compensation point in Najas flexilis. Limnology and Oceanography. 23:719-724
Apt, K. E. and Behrens, P. W. (1999) Commercial developments in microalgal biotechnology. Journal of Phycology. 35:215-226
Aresta, N., Tommasi, I. and Galatola, M. (1997) Potential of cofiring with biomass in Italy. Energy Conversion Management. 38:S557-S562
Ayala, F. and Vargas, T. (1987) Experiments on Spirulina culture on waste-effluent media and at the pilot plant. Hydrobiologia. 151/152:91-93
Azov, Y., Shelef, G., Moraine, R. and Levy, A. (1980) Controlling algal genera in high rate wastewater oxidation ponds. In: Algae Biomass. (Shelef, G. and Soeder, C. J. eds). Elsevier North-Holland Biomedical Press, Amsterdam, pp: 245-254
Badger, M. (2003) The roles of carbonic anhydrase in photosynthetic CO2 concentrating mechanisms. Photosynthesis Research. 77:83-94
Baker, N. R. and Bowyer, J. R. (1994) Photoinhibition of Photosynthesis From Molecular Mechanisms to the Field. Bios Scientific Publisher, Oxford, p: 574
Balch, W. M., Fritz, J. J. and Fernandez, E. (1996a) Decoupling of calcification and photosynthesis in the coccolithophore Emiliania huxleyi under steady-state light-limited growth. Marine Ecology Progress Series. 142:87-97
Balch, W. M., Kilpatrick, K. A. and Trees, C. C. (1996b) The 1991 coccolithophore bloom in the central North Atlantic, 1. Optical properties and factors affecting their distribution. Limnology and Oceanography. 41:1669-1183
225
Barak, A. (1980) Research and development in applied algology and the protein shortage problem. In: Algae Biomass. (Shelef, G. and Soeder, C. J. eds). Elsevier/North-Holland Biomedical Press, Amsterdam, pp: 21-24
Barbosa, M. J., Janssen, M., Ham, N., Tramper, J. and Wijffels, R. H. (2003) Microalgae cultivation in air-lift reactors: Modelling biomass yield and growth rate as a function of mixing frequency. Biotechnology and Bioengineering. 82:170-179
Barnard, W. R., Andreae, M. O. and Iverson, R. L. (1984) Dimethylsulfide and Phaeocystis pouchetii in the southeastern Bering Sea. Continental Shelf Research. 3:103-113
Beardall, J., Johnston, A. M. and Raven, J. A. (1998) Environmental regulation of the CO2 concentrating mechanism in cyanobacteria and microalgae. Canadian Journal of Botany. 76:1010-1017
Beardall, J., Young, E. and Roberts, S. (2001) Approaches for determining phytoplankton nutrient limitation. Aquatic Science. 63:44-69
Becker, E. W. (1994) Microalgae Biotechnology and Microbiology. Cambridge University Press, Cambridge, p: 293
Becker, E. W. and Venkatamaran, L. V. (1980) Production and processing of algae in pilot plant scale. Experience of the Indo-German project. In: Algae Biomass. (Shelef, G. and Soeder, C. J. eds). Elsevier/North Holland Biomedical Press, Amsterdam, pp: 35-50
Beech, P. L. and Wetherbee, R. (1988) Observations on the flagellar apparatus and peripheral endoplasmic reticulum of the coccolithophorid, Pleurochrysis carterae (Prymnesiophyceae). Phycologia. 27:142-158
Belay, A. (1997) Mass culture of Spirulina outdoors - The Earthrise Farms experience. In: Spirulina platensis (Arthrospira): Physiology, Cell-biology and Biotechnology. (Vonshak, A. ed). Taylor and Francis Ltd, London, pp: 131-158
Belay, A. and Fogg, G. E. (1978) Photoinhibition of photosynthesis in Asterionella formosa (Bacillariophyceae). Journal of Phycology. 14:341-347
Ben-Amotz, A. (2004) Industrial production of microalgal cell-mass and secondary product - major industrial species. In: Microalgal Culture. (Richmond, A. ed). Blackwell Science Ltd, Oxford, pp: 273-280
Benemann, J. (1985) Microalgae biotechnology: products, processes and opportunity (Unpublished), Overall Market Effectiveness Capability International Incorporation, Washington DC, pp: 300
Benemann, J. (1992) Microalgae aquaculture feeds. Journal of Applied Phycology. 4:233-245
Benemann, J. (1997) CO2 mitigation with microalgae systems. Energy Conversion Management. 38:475-479
Benemann, J., Tillett, D. and Weisman, J. C. (1987) Microalgae Biotechnology. Trends in Biotechnology. 5:47-53
Berdalet, E. (1992) Effects of turbulence on the marine dinoflagellate Gymnodinium nelsonii. Journal of Phycology. 28:267-272
Berry, L., Taylor, A. R., Lucken, U., Ryan, K. P. and Brownlee, C. (2002) Calcification and inorganic carbon acquisition in coccolithophores. Functional Plant Biology. 29:289-299
226
Billard, C. (1994) Life cycles. In: The Haptophyte Algae. (Green, J. C. and Leadbeater, B. S. C. eds). Clarendon Press, Oxford, pp: 167-186
Blackburn, S. I. and Cresswell, G. (1993) A coccolithophorid bloom in Jervis Bay, Australia. Australian Journal of Marine and Freshwater Research. 44:253-260
Blankley, W. F. and Lewin, R. A. (1976) Temperature responses of a coccolithophorid, Cricosphaera carterae, measured in a simple and inexpensive thermal-gradient device. Limnology and Oceanography. 21:457-462
Borowitzka, L. J. (1994) Commercial pigment from algae. In: The First Asia-Pacific Conference on Algal Biotechnology. (Moi, P. S., Kun, L. Y., Borowitzka, M. A. and Whitton, B. A. eds), Institute of Advanced Studies, University of Malaya, Kuala Lumpur, pp: 82-84
Borowitzka, L. J. and Borowitzka, M. A. (1990) Commercial production of β-carotene by Dunaliella salina in open ponds. Bulletin of Marine Science. 47:244-252
Borowitzka, M. A. (1977) Algal calcification. Oceanography Marine Biology Annual Review. 15:189-223
Borowitzka, M. A. (1982a) Mechanisms in algal calcification. Progress in Phycological Research. 1:137-177
Borowitzka, M. A. (1982b) Morphological and cytological aspects of algal calcification. International Review of Cytology. 74:127-162
Borowitzka, M. A. (1988a) Appendix: Algal media and sources of algal cultures. In: Micro-algal Biotechnology. (Borowitzka, M. A. and Borowitzka, L. J. eds). Cambridge University Press, Cambridge, pp: 456-465
Borowitzka, M. A. (1988b) Fats, oils and hydrocarbons. In: Micro-algal Biotechnology. (Borowitzka, M. A. and Borowitzka, L. J. eds). Cambridge University Press, Cambridge, pp: 257-287
Borowitzka, M. A. (1989) Carbonate calcification in algae initiation and control. In: Biomineralization: Chemical and Biochemical Perspective. (Mann, S. and Webb, J. eds). VCH Verlag, Weinheim, pp: 63-94
Borowitzka, M. A. (1992) Algal biotechnology products and processes- matching science and economics. Journal of Applied Phycology. 4:267-279
Borowitzka, M. A. (1993a) Large-scale algal culture systems: The next generation. In: 11th Australian Biotechnology Conference. (Sargeant, J., Washer, S., Jones, M. and Borowitzka, M. A. eds), Perth, Western Australia, pp: 61
Borowitzka, M. A. (1993b) Production of microalgal concentrates for aquaculture (algae culture), In: Final Report to Fisheries and Development Corporation, Murdoch University, Perth, pp: 68
Borowitzka, M. A. (1993c) Products from microalgae. Infofish. 5:21-26
Borowitzka, M. A. (1996) Closed algal photobioreactors: design considerations for large-scale systems. Journal of Marine Biotechnology. 4:185-191
Borowitzka, M. A. (1997) Microalgae for aquaculture: opportunities and constraints. Journal of Applied Phycology. 9:393-401
Borowitzka, M. A. (1998) Limits to growth. In: Wastewater Treatment with Algae. (Wong, Y. S. and Tam, N. F. Y. eds). Springer, Berlin, pp: 203-218
227

Borowitzka, M. A. (1999a) Commercial production of microalgae: ponds, tanks, tubes and fermenters. Journal of Biotechnology. 70:313-321
Borowitzka, M. A. (1999b) Economic evaluation of microalgal processes and products. In: Chemicals from Microalgae. (Cohen, Z. ed). Taylor and Francis, Inc, London, pp: 387-406
Borowitzka, M. A. (2005) Culturing microalgae in outdoor ponds. In: Algal Culturing Techniques. (Anderson, R. ed). Academic Press, London, pp: 205-217
Borowitzka, M. A. and Borowitzka, L. J. (1987) Limits to growth and carotenogenesis in laboratory and large-scale outdoor cultures of Dunaliella salina. In: Algal Biotechnology. (Stadler, T., Mollion, J., Verdus, M. C., Karamanos, Y. K., Morvan, H. and Christiaen, D. eds). Elsevier Applied Science, London, pp: 371-382
Borowitzka, M. A. and Borowitzka, L. J. (1988) Dunaliella. In: Micro-algal Biotechnology. (Borowitzka, M. A. and Borowitzka, L. J. eds). Cambridge University Press, Cambridge, pp: 27-58
Borowitzka, M. A. and Larkum, A. W. D. (1976) Calcification in the green alga Halimeda II. The exchange of Ca2+ and the occurrence of age gradients in the calcification and photosynthesis. Journal of Experimental Botany. 27:864-878
Bosma, R., van Spronsen, W. A., Tramper, J. and Wijffels, R. H. (2003) Ultrasound, a new separation technique to harvest microalgae. Journal of Applied Phycology. 15:143-152
Brand, L. E. (1984) The salinity tolerance of forty-six marine phytoplankton isolates. Estuarine, Coastal and Shelf Science. 18:543-556
Brand, L. E. (1991) Minimum iron requirements of marine phytoplankton and the implications for the biogeochemical control of new production. Limnology and Oceanography. 36:1756-1771
Brand, L. E. (1994) Physiological ecology of marine coccolithophores. In: Coccolithophores. (Winter, A. and Siesser, W. G. eds). Cambridge University Press, Cambridge, pp: 39-49
Brand, L. E. and Guillard, R. R. L. (1981) The effects of continuous light and light intensity on the reproduction rates of twenty-two species of marine phytoplankton. Journal of Experimental Marine Biology and Ecology. 50:119-132
Brand, L. E., Sunda, W. G. and Guillard, R. R. L. (1983) Limitation of marine phytoplankton reproductive rates by zinc, manganese, and iron. Limnology and Oceanography. 28:1182-1198
Brewer, P. g. and Goldman, J. C. (1976) Alkalinity changes generated by phytoplankton growth. Limnology and Oceanography. 21:108-117
Brown, T. E. and Richardson, F. L. (1968) The effects of growth environment on the physiology of algae: light intensity. Journal of Phycology. 4:38-54
Brownlee, C., Nimer, N. A., Dong, L. F. and Merret, J. M. (1994) Cellular regulation during calcification in Emiliania huxleyi. In: The Haptophyte Algae. (Green, J. C. and Leadbeater, B. S. C. eds). Clarendon Press, Oxford, pp: 133-148
Bruce, V. G. (1970) The biological clock in Chlamidomonas reinhardi. Journal of Protozoology. 17:328-334
228
Buitenhuis, E. T., de Baar, H. J. W. and Veldhuis, M. J. W. (1999) Photosynthesis and calcification by Emiliania huxleyi (Prymnesiophyceae) as a function of inorganic carbon species. Journal of Phycology. 35:949-959
Buitenhuis, E. T., Klaas, C. and de Baar, H. J. W. (2003) Zinc-bicarbonate co-limitation of Emiliania huxleyi. Limnology and Oceanography. 48:1575-1582
Buma, A. G. J., van Oijen, T., van de Poll, W., Veldhuis, M. J. W. and Gieskes, W. W. C. (2000) The sensitivity of Emiliania huxleyi (Prymnesiophyceae) to ultraviolet-b radiation. Journal of Phycology. 36:296-303
Bunt, J. S. (1971) Levels of dissolved and carbon fixation by marine microalgae. Limnology and Oceanography. 16:564-566
Buttery, M. J. (2000) Culture studies of two toxic dinoflagellate species, Alexandrium minutum and Gymnodinium catenatum. PhD Thesis, School of Biological Sciences and Biotechnology, Murdoch University, p: 206
Cadenus, E. (1989) Biochemistry of oxygen toxicity. Annual Review of Biochemistry. 58:79-110
Camacho, F. G., Gomez, A. C., Sobczuck, M. and Grima, E. M. (2000) Effects of mechanical and hydrodynamic stress in agitated, sparged cultures of Porphydium cruentum. Process Biochemistry. 35:1045-1050
Carberry, J. B. and Brunner, C. M. (1991) Predictions of diurnal fluctuations in an algal bacterial clay wastewater treatment system. Water Science and Technology. 23:1553-1561
Carlozzi, P. (2000) Hydrodynamic aspects and Arthrospira growth in two outdoor tubular undulating row photobioreactors. Applied Microbiology and Biotechnology. 54:14-22
Carlozzi, P. and Sacchi, A. (2001) Biomass production and studies on Rhodopseudomonas palustris grown in an outdoor, temperature controlled, underwater tubular photobioreactor. Journal of Biotechnology. 88:239-249
Carlozzi, P. and Torzillo, G. (1996) Productivity of Spirulina in a strongly curved outdoor tubular photobioreactor. Applied Microbiology and Biotechnology. 45:18-23
Chaumont, D. (1993) Biotechnology of algal biomass production: a review of systems for outdoor mass culture. Journal of Applied Phycology. 5:593-604
Chave, K. E. (1952) A solid solution between calcite and dolomite. Journal of Geology. 60:190-192
Chave, K. E. (1984) Physics and chemistry of biomineralization. Annual Review of Earth and Planet Science. 12:293-305
Chen, M. Y., He, S. Y., Chen, C. X. and Dai, J. (1978) Preliminary report on the culture and effect of Dicrateria zhanjiangensis Hu sp. nov. for the breeding. Shuichan yu Jiaoyu. 2:37-51 (In Chinese)
Chisholm, S. W. and Brand, L. E. (1981) Persistence of cell division phasing in marine phytoplankton in continuous light after entrainment to light:dark cycles. Journal of Experimental Marine Biology and Ecology. 51:107-118
Chisti, Y. (1989) Airlift bioreactors. Elsevier Applied Science, London and New York, p: 40-41
229
Chisti, Y. and Moo- Young, M. (2001) Bioreactor design. In: Basic Biotechnology. (Ratledge, C. and Kristiansen, B. eds). Cambridge University Press, Cambridge, pp: 151-171
Chrismadha, T. and Borowitzka, M. A. (1994a) Effect of cell density and irradiance on growth, proximate composition and eicosapentaenoic acid production of Phaeodactylum tricornutum grown in a tubular photobioreactor. Journal of Applied Phycology. 6:67-74
Chrismadha, T. and Borowitzka, M. A. (1994b) Growth and lipid production of Phaedactylum tricornutum in a tubular photobioreactor. In: The First Asia-Pacific Conference on Algal Biotechnology. (Moi, P. S., Kun, L. Y., Borowitzka, M. A. and Whitton, B. A. eds), Institue of Advanced Studies, University of Malaya, Kuala Lumpur, pp: 122-130
Clement, G. C., Giddey, C. and Menzi, R. (1967) Amino acid composition and nutritive value of alga Spirulina maxima. Journal of Science Food and Agriculture. 18:497-501
Cloern, J. E. (1977) Effects of light intensity and temperature on Cryptomonas ovata (Cryptophyceae) growth and nutrient uptake rates. Journal of Phycology. 13:389-395
Cohen, E. and Arad, S. (1989) A closed system for outdoor cultivation of Porphyridium. Biomass. 18:59-67
Coleman, J. R. and Colman, B. (1980) Effect of oxygen and temperature on the efficiency of photosynthetic carbon assimilation in two microscopic algae. Plant Physiology. 65:980-983
Conte, M., H, Thompson, A., Lesley, D. and Harris, R. (1998) Genetic and physiological influences on the alkenone/alkonate versus growth temperature relationship in Emiliania huxleyi and Gephyrocapsa oceanica. Geochemica et Cosmochimica Acta. 62:51-68
Conte, M., H, Volkman, J. K. and Eglimton, G. (1994) Lipid biomarkers of the Haptophyta. In: The Haptophyte Algae. (Green, J. C. and Leadbeater, B. S. C. eds). Clarendon Press, Oxford, pp: 351-377
Corstjens, P., Araki, Y. and Gonzalez, E. L. (2001) A Coccolithophorid calcifying vesicle with a vacuolar-type ATPase proton pump: cloning and immunolocalization of the V0 subunit c. Journal of Phycology. 37:71-78
Cortes, M. Y., Bollmann, J. and Thierstein, H. R. (2001) Coccolithophore ecology at the HOT station ALOHA, Hawaii. Deep Sea Research II. 48:1957-1981
Crawford, D. W. and Purdie, D. A. (1997) Increase of P CO2 during blooms of Emiliania huxleyi: Theorical considerations on the asymmetry between acquisition of HCO3
- and respiration of free CO2. Limnology and Oceanography. 42:365-372
Crenshaw, M. A. (1964) Coccolith formation by two marine coccolithophorids, Coccolithus huxleyi and Hymenomonas sp. PhD Thesis, Duke University, p: 74
Cronar, N. J. and Fallowfield, H. J. (1997) Effect of nutrient loading and retention time on performance of high rate algal ponds. Journal of Applied Phycology. 9:301-309
Cros, L., Kleijne, A., Zeltner, A., Billard, C. and Young, J. R. (1999) New example of holococcolith-heterococcolith combination coccospheres and their implications for coccolithophorid biology. Marine Micropaleontology. 39:1-34
Currie, A. (1995) Optimisation of growth in a helical tubular photobioreactor. Honours Thesis, School of Biological Sciences and Environmental Sciences, Murdoch University, p: 23-25
230
Danbara, A. and Shiraiawa, Y. (1999) The requirement of Selenium for the growth of marine coccolithophorids, Emiliania huxleyi, Gephyrocapsa oceanica and Helladosphaera sp.(Prymnesiophyceae). Plant Cell Physiology. 40:762-766
De Pauw, N. and Persoone, G. (1988) Microalgae for aquaculture. In: Micro-algal Biotechnology. (Borowitzka, M. A. and Borowitzka, L. J. eds). Cambridge University Press, Cambridge, pp: 85-121
de Vrind- de Jong, E. W., Borman, A., H, Thierry, R., Westbroek, P., Gruter, M. and Kamerling, J. P. (1986) Calcification in the coccolithophorids Emiliania huxleyi and Pleurochrysis carterae II. Biochemical aspects. In: Bioremediation in Lower Plants and Animals. (Leadbeater, B. S. C. ed). Clarendon Press, Oxford, pp: 205-217
de Vrind- de Jong, E. W., van Emburg, P. R. and de Vrind, J. P. M. (1994) Mechanisms of calcification: Emiliania huxleyi as a model system. In: The Haptophyte Algae. (Green, J. C. and Leadbeater, B. S. C. eds). Clarendon Press, Oxford, pp: 149-166
Dodd, J. C. (1986) Elements of pond design and construction. In: CRC Handbook of Microalgal Mass Culture. (Richmond, A. ed). CRC Press, Inc, Boca Raton, Florida, pp: 265-284
Dodd, J. R. (1967) Magnesium and strontium in calcareous skeletons. Journal of Paleontology. 41:1313-1329
Dong, L. F., Nimer, N. A., Okus, E. and Merrett, M. J. (1993) Dissolved inorganic carbon utilization in relation to calcite production in Emiliania huxleyi (Lohmann) Kamptner. New Phytologist. 123:679-684
Doran, P. M. (1995) Fluid Flow and Mixing. In: Bioprocess Engineering Principles. (Doran, P. M. ed). Academic Press, London, pp: 129-163
Dorigan, J. L. and Wilbur, K. M. (1973) Calcification and its inhibition in coccolithophorids. Journal of Phycology. 9:450-456
Droop, M. R. (1973) Some thoughts on nutrient limitation in algae. Journal of Phycology. 9:264-272
Dunstan, G. A., Volkman, J. K. and Barrett, S. M. (1993) Changes in lipid composition and maximisation of polyunsaturated fatty acid content of three microalgae grown in mass culture. Journal of Applied Phycology. 5:71-83
Dytham, C. (2000) The tests 1: tests to look at differences. In: Choosing and Using Statistics: A Biologist's Guide. (Dytham, C. ed). Blackwell Science Ltd, Oxford, pp: 61-143
Edmunds, L. N. (1966) Studies on synchronously dividing cultures of Euglena gracilis Klebs (strain Z). III Circadian components of cell divisions. Journal of Cell Physiology. 67:35-44
Edvardsen, B., Eikrem, W., Green, J. C., Andersen, R. A., Der Staay, S. and Medlin, L. K. (2000) Phylogenetic reconstructions of the Haptophyta inferred from 18S ribosomal DNA sequences and available morphological data. Phycologia. 39:19-35
Eppley, R. W. (1972) Temperature and phytoplankton growth in the sea. Fish Bulletin. 70:1063-1085
Erlich, H. L. (1998) Geomicrobiology: Its significance for geology. Earth and Science Review. 45:45-60
Faber, W. W. and Preisig, H. R. (1994) Calcified structures and calcification in protists. Protoplasma. 181:78-105
231

Fabregas, J., Dominguez, A., Regueiro, M., Maseda, A. and Otero, A. (2000) Optimization of culture for the continuous cultivation of the microalga Haematococcus pulvialis. Applied Microbial Biotechnology. 53:530-535
Fabregas, J., Toribio, L., Abalde, J., Cabezas, B. and Herrero, C. (1987) Approach to biomass production of marine microalga Tetraselmis suecica (Kylin) Butch using common garden fertilizer and soil extract as cheap nutrient supply in batch cultures. Aquacultural Engineering. 6:141-150
Fernandez, E., Balch, W. M., Maranon, E. and Holligan, P. M. (1994) High rates of lipid biosynthesis in cultured, mesocosm and coastal populations of the coccolithophorids Emiliania huxleyi. Marine Ecology Progress Series. 114:13-22
Fisher, N. S. and Honjo, S. (1988/1989) Intraspecific differences in temperature and salinity responses in the coccolithophore Emiliania huxleyi. Biological Oceanography. 6:355-361
Flynn, K. J., Page, S., Wood, G. and Hipkin, C. R. (1999) Variations in the maximum transport rates for ammonium and nitrate in the Prymnesiophyte Emiliania huxleyi and the Raphydophyte Heterosigma carterae. Journal of Plankton Research. 21:355-371
Fox, R. D. (1987) Spirulina, real aid to development. Hydrobiologia. 151/152:95-97
Foy, R. H. (1983) Interaction of temperature and light on the growth rates of two planktonic Oscillatoria sp. under a short photoperiod regime. British Phycological Journal. 18:267-273
Foy, R. H. and Gibson, G. E. (1982) Photosynthetic characteristics of planktonic blue-green algae: changes in photosynthetic capacity and pigmentation of Oscillatoria redekei van Goor under high and low light. British Phycological Journal. 17:183-193
Frankignoulle, M., Canon, C. and Gattuso, J. P. (1994) Marine calcification as a source of carbon dioxide: positive feedback of increasing CO2. Limnology and Oceanography. 39:458-462
Fritz, J. J. (1999) Carbon fixation and coccolith detachment in the coccolithophore Emiliania huxleyi in nitrate-limited cyclostats. Marine Biology. 133:509-518
Frohlich, s., Lotz, M., Korte, T., Lubbert, A., Schugerl, K. and Seekamp, M. (1991) Characterisation of a pilot plant airlift tower loop bioreactor. I: Evaluation of the phase properties with model media. Biotechnology and Bioengineering. 38:43-55
Fulks, W. and Main, K. L. (1991) Part I: Background review the design and operation of commercial-scale live feeds production systems. In: Rotifer and Microalgae Culture Systems. (Fulks, W. and Main, K. L. eds). The Oceanic Institute, Honolulu, pp: 2-46
Garcia, G., M, Moreno, J., Canavate, J. P., Anguis, V., Prieto, A., Manzano, C., Florencio, F. J. and Guerrero, M. G. (2003) Conditions for open-air outdoor culture of Dunaliella salina in southern Spain. Journal of Applied Phycology. 15:177-184
Garcia, J. and Hernandes-Marine, M. (2000) High rate algal pond operating strategies for urban wastewater nitrogen removal. Journal of Applied Phycology. 12:331-339
Gattuso, J. P., Allemand, D. and Frankignoulle, M. (1999) Photosynthesis and calcification at cellular, organismal and community levels in coral reefs: a review on interactions and control by carbonate chemistry. American Zoologist. 39:160-183
Geider, R. J., Delucia, E. H., Falkowski, P., Finzi, A., Grime, P., J, Kana, T. M., Roche, J., Long, S. P. and Osborne, B. A. (2001) Primary productivity of planet earth: biological determinants and physical constraints in terrestrial and aquatic habitats. Global Change Biology. 7:849-882
232

Geisen, M., Billard, C., Broerse, A. T. C., Cros, L., Probert, I. and Young, J. R. (2002) Life-cycle association involving pairs of holococcolithophorid species: Intraspecific variation or cryptic specification? European Journal of Phycology. 37:531-550
Ghosh, P., Paterson, G. W. and Wilfors, G. H. (1996) Sterols of some marine Prymnesiophyceae. Journal of Phycology. 34:511-514
Gieskes, W. W. C. and Buma, A. G. J. (1997) UV damage to plant life in a photobiologically dynamic environment: the case of marine phytoplankton. Plant Ecology. 128:17-25
Ginzburg, B. (1993) Liquid fuel (oil) from halophilic algae: A renewable source of non-polluting energy. Renewable Energy. 3:249-252
Glass, A. D. M. (1983) Regulation of ion transport. Annual Review of Plant Physiology. 34:311-326
Goldman, J. (1979) Outdoor algal mass culture- II Photosynthetic yield limitations. Water Research. 13:119-136
Goldman, J. C. (1977) Temperature effects on phytoplankton growth in continuous culture. Limnology and Oceanography. 22:932_936
Goldman, J. C. (1980) Physiological aspects in algal mass cultures. In: Algae Biomass. (Shelef, G. and Soeder, C. J. eds). Elsevier/North-Holland Biomedical Prress, Amsterdam, pp: 343-359
Goldman, J. C. and Carpenter, E. J. (1974) A kinetic approach to the effect of temperature on algal growth. Limnology and Oceanography. 19:756-766
Gomez, P. I., Barriga, A., Cifuentes, A. S. and Gonzalez, M. A. (2003) Effect of salinity on the quantity and quality of carotenoids accumulated by Dunaliella salina (strain CONC-007) and Dunaliella bardawil (strain ATCC 30861) Chlorophyta. Biological Research. 36:185-192
Gordillo, F. J. L., Goutx, M., Figueroe, F. L. and Niell, F. X. (1998) Effects of light intensity, CO2 and nitrogen supply on lipid class composition of Dunaliella viridis. Journal of Applied Phycology. 10:135-144
Granum, E. and Myklestad, S. M. (2002) A photobioreactor with pH control: demonstration by growth of marine diatom Skeletonema costatum. Journal of Plankton Research. 24:557-563
Green, J. C., Hemidal, B. R., Paasche, E. and Moate, R. (1998) Changes in calcification and the dimensions of coccoliths of Emiliania huxleyi (Haptophyta) grown at reduced salinities. Phycologia. 37:121-131
Green, J. C. and Jordan, R. W. (1994) Systematic history and taxonomy. In: The Haptophyte Algae. (Green, J. C. and Leadbeater, B. S. C. eds). Clarendon Press, Oxford, pp: 1-23
Grima, E., Medina, A. R. and Gimenez, G. (1999) Recovery of algal PUFAs. In: Chemicals from Microalgae. (Cohen, Z. ed). Taylor and Francis, Philadelphia, pp: 108-144
Grima, E. M., Acién Fernández, F. G. A., Camacho, F., Rubio, F. and Chisti, Y. (2000) Scale-up of tubular photobioreactors. Journal of Applied Phycology. 12:355-368
Grima, E. M., Chisti, Y. and Moo- Young, M. (1997) Characterization of shear rates in airlift bioreactors for animal cell culture. Journal of Biotechnology. 54:195-210
233
Grobbelaar, J. U. (2004) Algal nutrition, Mineral nutrition. In: Microalgal Culture. (Richmond, A. ed). Blackwell Science Ltd, Oxford, pp: 97-115
Grossi, V., Raphel, D., Aubert, C. and Rontani, J. F. (2000) The effect of growth temperature on the long-chain alkenes composition in the marine coccolithophorid Emiliania huxleyi. Phytochemistry. 54:393-399
Guillard, R. R. L. and Ryther, J. H. (1962) Studies of marine planktonic diatoms. I Cyclotella nana Hustedt, and Detonula confervacea. Canadian Journal of Microbiology. 8:229-239
Guttusso, J. and Buddemeier, R. W. (2000) Calcification and CO2. Nature. 407:311-312
Hai, T., Ahlers, H., Gorenflo, V. and Steinbuchel, A. (2000) Axenic cultivation of an oxygenic phototrophic bacteria, cyanobacteria, and microalgae in a new closed tubular glass photobioreactor. Applied Microbiology and Biotechnology. 53:383-389
Haidar, A. T. and Thierstein, H. R. (2001) Coccolithophore dynamics off Bermuda (N. Atlantic). Deep Sea Research II. 48:1925-1956
Hall, D. O. and Scurlock, J. M. O. (1993) Biomass production and data. In: Photosynthesis and Production in a Changing Environment. (Hall, D. O. and Scurlock, J. M. O. eds). Chapman and Hall, London, pp: 425-444
Hannson, L. and Dostalek, M. (1986) Lipid formation by Cryptococcus albidus in nitrogen-limited and carbon-limited chemostat cultures. Applied Microbiology and Biotechnology. 24:187-192
Harbinson, J. (1994) The responses of thylocoid electron transport and light utilization efficiency to sink limitation of photosynthesis. In: Photoinhibition of Photosynthesis. (Baker, N. R. and Bowyer, J. R. eds). Bios Scientific Publishers, Shepperton, pp: 273-290
Hase, R., Oikawa, H., Sasso, C., Morita, M. and Watanabe, Y. (2000) Photosynthetic production of microalgal biomass in a raceway system under greenhouse conditions in Sendi city. Journal of Bioscience and Bioengineering. 89:157-163
Healy, T. (2004) http://www.marine.csiro.au/algaedb/default.htm, CSIRO Microalgae Research Centre.
Hellebust, J. A. (1985) Mechanisms of response to salinity in halotolerant microalgae. Plant and Soil. 89:69-81
Herfort, L., Thake, B. and Roberts, J. (2002) Acquisition and use of bicarbonate by Emiliania huxleyi. New Phytologist. 156:427-436
Herzog, H. J. and Drake, E. M. (1996) Carbon dioxide recovery and disposal from large energy systems. Annual Review of Energy and Environment. 21:145-166
Hoffmann, J. P. (1998) Wastewater treatment with suspende and nonsuspended algae. Journal of Phycology. 34:757-763
Holligan, P. M., Viollier, M., Harbour, D. S. and Champagene-Philipe, M. (1983) Satellite and ship studies of coccolithophore production along a continental shelf edge. Nature. 304:339-342
Hondzo, M. and Lyn, D. (1999) Quantified small-scale turbulence inhibits the growth of a green alga. Freshwater Biology. 41:51-61
Houdan, A., Billard, C., Marie, D., Not, F., Saez, A. G., Young, J. R. and Probert, I. (2004a) Holococcolithophore-heterococcolitophore (Haptophyta) life cycles:flow cytometric analysis of relative ploidy levels. Systematics and Biodiversity. 1:453-465
234
Houdan, A., Bonnard, A., Fresnel, J., Fouchard, C., Billard, C. and Probert, I. (2004b) Toxicity of coastal coccolithophores (Prymnesiophyceae, Haptophyta). Journal of Plankton Research. 26:875-883
Hu, Q., Guterman, H. and Richmond, A. (1996) A flat inclined modular photobioreactor (FIMP) for outdoor mass cultivation of photoautotrophs. Biotechnology and Bioengineering. 51:51-60
Hu, Q., Kurano, N., Kawachi, M., Iwasaki, I. and Miyachi, S. (1998) Ultrahigh-cell-density culture for a marine alga Chlorococcum littorale in a flat-plate photobioreactor. Applied Microbial Biotechnology. 49:655-662
Hu, Q. and Richmond, A. (1996) Productivity and photosynthetic efficiency of Spirulina platensis as affected by light intensity, algal density and rate of mixing in a flat plate photobioreactor. Journal of Applied Phycology. 8:139-145
Huertas, I. E., Bhatti, S. and Colman, B. (2003) Inorganic carbon acquisition in two species of marine prymnesiophytes. European Journal of Phycology. 38:181-189
Hughes, E. and Benemann, J. (1997) Biological fossil CO2 mitigation. Energy Conversion Management. 38:S467-S473
Hulburt, E. M. (1963) The diversity of phytoplanktonic populations in oceanic, coastal, and estuarine regions. Journal of Marine Research. 21:81-93
Hull, D. (2004) http://ccmp.bigelow.org/future/hmenuz.php?daurl=http://ccmp.bigelow.org/future/Credits.html, The Provasoli-Guillard National Center for Culture of Marine Phytoplankton.
Iglesias-Prieto, R. and Trench, R. K. (1997) Acclimation and adaptation to irradiance in symbiotic dinoflagellates. II Response of chlorophyll-protein complexes to different photon-flux densities. Marine Biology. 130:23-33
Inouye, I. and Pienaar, R. N. (1985) Ultrastructure of the flagellar apparatus in Pleurochrysis (Class Prymnesiophyceae). Protoplasma. 125:24-35
Inouye, I. and Pienaar, R. N. (1988) Light and electron microscope observations of the type species of Syracosphaera, S. pulchara (Prymnesiophyceae). British Phycological Journal. 23:205-217
Israel, A. A. and Gonzales, E. L. (1996) Photosynthesis and inorganic carbon utilization in Pleurochrysis sp. (Haptophyta), a coccolithophorid alga. Marine Ecology Progress Series. 137:243-250
Janssen, M., Tramper, J., Mur, L. R. and Wijffels, R. H. (2002) Enclosed outdoor photobioreactors: light regime, photosynthesis efficiency, scale-up, and future prospects. Biotechnology and Bioengineering. 81:193-204
Jassby, A. D. (1988) Spirulina: a model for microalgae as human food. In: Algae and human affairs. (Lembi, C. A. and Waaland, J. R. eds). Cambridge University Press, Cambridge
Jassby, A. D. and Platt, T. (1976) Mathematical formulation of the relationship between photosynthesis and light for phytoplankton. Limnology and Oceanography. 21:540-547
Javanmardian, M. and Paulsson, B. O. (1991) High-density photoautotrophic algal cultures: design, and operation of a novel photobioreactor system. Biotechnology and Bioengineering. 38:1182-1189
235
Jeffrey, S. W. and Allen, M. B. (1964) Pigments, growth and photosynthesis in cultures of two Chrysomonads, Coccolithus huxleyi and a Hymnemonas sp. Journal of General Microbiology. 36:277-288
Jeffrey, S. W. and Humphrey, G. F. (1975) New spectrophotometric equations for determining chlorophylls a, b, c1 and c2 in higher plants, algae and natural phytoplankton. Biochemie und Physiologie der Pflanzen. 167:191-194
Jeffrey, S. W. and Wright, S. W. (1999) Photosynthetic pigments in the Haptophyta. In: Chemicals from Microalgae. (Cohen, Z. ed). Taylor and Francis, Philadelphia, pp: 111-132
Jimenez, C., Cossio, B. R., Labella, D. and Niell, F. X. (2003a) The feasibility of industrial production of Spirulina (Arthrospira) in southern Spain. Aquaculture. 217:179-190
Jimenez, C., Cossio, B. R. and Niell, F. X. (2003b) Relationship between physicochemical variables and productivity in open ponds for the production of Spirulina: a predictive model of algal yield. Aquaculture. 221:331-345
Johansen, J. R., Doucette, G. J., Barclay, W. R. and Bull, J. D. (1988) The morphology and ecology of Pleurochrysis carterae var dentata var nov. (Prymnesiophyceae), a new coccolithophorid from an inland saline pond in New Mexico, USA. Phycologia. 27:78-88
Jorgensen, E. G. and Steemann Nielsen, E. (1961) Effect of filtrates from cultures of unicellular algae on the growth of Staphylococcus aureus. Physiologia Plantarum. 14:896-908
Kadam, K. L. (1997) Power plant gas as a source of CO2 for microalgae cultivation economic impact of different process options. Energy Conversion Management. 38:S505-S510
Kadam, K. L. (2001) Microalgae production from power plant flue gas: environmental implications on a life cycle basis. Report No. NREL/ TP-510-29417, National Renewable Energy Laboratory, Golden, Colorado, pp: 55
Kanazawa, Z., Fujita, C., Yuhara, T. and Sasa, T. (1958) Mass culture of unicellular algae using the "open pond circulation method". Journal of General and Applied Microbiology. 4:135-139
Kane, R. L. and Klein, D. E. (1997) United States strategy for mitigating global climate change. Energy Conversion Management. 38:S13-S18
Kaplan, A. and Reinold, L. (1999) CO2 concentrating mechanism in photosynthetic microorganisms. Annual Review of Plant Physiology and Plant Molecular Biology. 50:539-570
Karwath, B., Janofske, D., Tientjen, F. and Williams, H. (2002) Temperature effects on growth and cell size in the marine calcareous dinoflagellate Thoracospaera heimii. Marine Micropaleontology. 39:43-51
Kates, M. and Volcani, B. E. (1966) Lipid components of diatoms. Biochimica et Biophysica Acta. 116:264-278
Kawachi, M. and Inouye, I. (1995) Functional roles of the haptonema and the spine scales in the feeding process of Chrysochromnlina spinifera (Fournier) Pienaar et Norris (Haptophyta, Prymnesiophyta). Phycologia. 34:193-200
236
Kawaguchi, K. (1980) Microalgae production systems in Asia. In: Algae Biomass. (Shelef, G. and Soeder, C. J. eds). Elsevier/North Holland Biomedical Press, Amsterdam, pp: 25-35
Kieran, P. M., Malone, D. M. and MacLoughlin, P. F. (2000) Effects of hydrodynamic and interfacial forces on plant cell suspension systems. Advances in Biochemical Engineering/Biotechnology. 67:139-174
Kim, N. and Lee, C. (2001) A theorical consideration on oxygen production rate in microalgal cultures. Biotechnology and Bioprocess Engineering. 6:352-358
Kingsley, R. J. and Watabe, N. (1985) Ca-ATPase localisation and inhibition in gorgonian Leptogorgia virgulata (Lamarck) (Coelenterata: Gorgonacea). Journal of Experimental Marine Biology and Ecology. 93:157-167
Kirst, G. O. (1989) Salinity tolerance of eukaryotic marine algae. Annual Review of Plant Physiology and Plant Molecular Biology. 40:21-53
Klasson, K. T. and Davison, B. H. (2001) Estimation of carbon credits in the carbon dioxide sequestration activities. In: First National Conference on Carbon Sequestration. (Klasson, K. T. ed), U.S Department Energy, Washington DC, pp: 1-17
Klaveness, D. (1976) Emiliania huxleyi (Lohman) Hay and Mohler. 3. Minral deposition and the origin of the matrix during coccolith formation. Protistologica. 12:217-224
Knapp, H. R. (1989) Omega-3 fatty acids, endogenous postaglandins and blood pressure regulation in humans. Nutrition Review. 47:301-313
Krause, G. H. (1994) The role of oxygen in photoinhibition of photosynthesis. In: Causes of Photooxidative Stress and Amelioration of Defences Systems in Plants. (Foyer, C. H. and Mullineaux, P. M. eds). CRC Press, Boca Raton, pp: 43-76
Kudo, I., Miyamoto, E., Noiri, Y. and Maita, Y. (2002) Combined effects of temperature and iron on the growth and physiology of the marine diatom Phaeodactylum tricornutum. Journal of Phycology. 36:1096-1102
Kwint, R. L. J. and Kramer, J. M. (1995) DMS production by plankton communities. Marine Ecology Progress Series. 121:227-237
Kyle, D., Behrens, P., Bingham, S., Arnett, K. and Leiberman, D. (1990) Microalgae as a source of EPA-containing oils. In: World Conference on Biotechnology for Fats and Oil Chemistry. (Applewhite, T. H. ed). American Oil Chemists Society, Champaign, pp: 117-122
Lage, O. M., Darente, A. M., Soares, H. M. V. M., Vasconcelos, M. T. S. D. and Salem, R. (1994) Some effects of copper on the dinoflagellates Amphidinium carterae and Prorocentrum micans in batch culture. European Journal of Phycology. 29:253-260
Laguna, R., Romo, J., Read, B. A. and Wahlund, T. M. (2001) Induction of phase variation events in the life cycle of the marine coccolithophorid Emiliania huxleyi. Applied and Environmental Microbiology. 67:3824-3831
Langdon, C., Takahash, T., Marubini, F. and Atkinson, M. (2000) Effect of calcium carbonate saturation state on the rate of calcification of an experimental coral reef. Global Biogeochemical Cycles. 14:639-654
Larkum, A. W. D. (1981) Marine primary productivity. In: Marine Botany: an Australasian Perspective. (Clayton, M. N. and King, R. J. eds). Longman Cheshire, Melbourne, pp: 370-385
237
Larsen, A., Castberg, T., Sandaa, R. A., Brussaard, C. P. D., Egge, J., Heldal, M., Paulino, A., Thyrhaug, R., van Hannen, E. J. and Bratbak, G. (2001) Population dynamics and diversity of phytoplankton, bacteria and viruses in a seawater enclosure. Marine Ecology Progress Series. 221:47-57
Laws, E. A., Taguchi, S., Hirata, J. and Pang, L. (1988a) Optimization of microalgal production in a shallow outdoor flume. Biotechnology and Bioengineering. 32:140-147
Laws, E. A., Terry, K. L., Wickman, J. and Chalup, M. (1983) A simple algal production system designed to utilise the flashing light effect. Biotechnology and Bioengineering. 25:2319-2335
Laws, E. A., Thompson, P. A., Popp, B. N. and Bidigare, R. R. (1988b) Sources of inorganic carbon for marine microalgal photosynthesis: a reassessment of S13C data from batch culture studies of Thalassiosira pseudonana and Emiliania huxleyi. Limnology and Oceanography. 43:136-142
Lee, Y. K. (1993) Productivity of outdoor algal cultures in unstable weather conditions. Biotechnology and Bioengineering. 41:1003-1006
Lee, Y. K. (1997) Commercial production of microalgae in the Asia-Pacific rim. Journal of Applied Phycology. 9:403-411
Lee, Y. K. (2001) Microalgal mass culture systems and methods: Their limitation and potential. Journal of applied phycology. 13:307-315
Lee, Y. K. and Shen, H. (2004) Basic culturing techniques. In: Microalgal Culture. (Richmond, A. ed). Blackwell Science Ltd, Oxford, pp: 40-56
Leith, H. (1975) Primary production of the major vegetation units of the world. In: Primary Productivity of the Biosphere. (Leith, H. and Whittacker, R. H. eds). Springer-Verlag, New York, pp: 205-231
Leoblich, A. R. and Smith, V. E. (1968) Chloroplast pigments of the marine dinoflagellate Gyrodinium resplendens. Lipids. 3:5-13
Levert, J. M. and Xia, J. (2001) Modelling the growth curve for Spirulina (Arthrospira) maxima, a versatile microalga for producing uniformly compounds with stable isotopes. Journal of Applied Phycology. 13:359-367
Lindström, K. (1984) Effect of temperature light and pH on growth, photosynthesis and respiration of the dinoflagellate Peridinium cinctum fa. westii in laboratory cultures. Journal of Phycology. 20:212-220
Linschooten, C., van Bleijwijk, J. D. L., van Emburg, P. R., de Vrind, J. P. M., Kempers, E. S., Westbroek, P. and de Vrind-de Jong, E. W. (1991) Role of the light-dark cycle and medium composition on the production of coccoliths by Emiliania huxleyi (Haptophyceae). Journal of Phycology. 27:82-86
Lisec, J. (2004) Cultivation of Pleurochrysis carterae CCMP647 in two different photobioreactors. Diploma Ingenieur fur Allgemeine Biotechnologie Thesis, Technische Universitat Berlin, p: 93
Liu, C. P. and Lin, L. P. (2001) Ultrastructural study and lipid formation of Isochrysis sp. CCMP1324. Botanical Bulletin of Academia Sinica. 42:207-214
Lu, C., Torzilla, G. and Vonshak, A. (1999) Kinetic response of photosystem II photochemistry in the cyanobacterium Spirulina plantenis to high salinity is characterized by two distinct phases. Australian Journal of Plant Physiology. 26:283-292
238
Maddux, W. S. and Jones, R. F. (1964) Some interactions of temperature, light intensity, and nutrient concentration during the continuous culture of Nitzschia closterium and Tetraselmis sp. Limnology and Oceanography. 9:79-86
Malin, G. and Steinke, M. (2004) Dimethyl sulfide production: what is the contribution of the coccolithophores? In: Coccolithophores from Molecular Processes to Global Impact. (Thierstein, H. R. and Young, J. R. eds). Springer, Berlin, pp: 99-126
Malone, T. C. (1982) Phytoplankton photosynthesis and carbon-specific growth: light-saturated rates in a nutrient-rich environment. Limnology and Oceanography. 27:226-235
Manton, I. (1967) Further observations on the fine structure of Chrysochromulina chiton with special reference to the haptonema, peculiar Golgi structure and scale production. Journal of Cell Science. 2:265-272
Marchetti, C. (1977) On geoengineering and the CO2 problem. Climatic Change. 1:59-68
Marlowe, I. T., Green, J. C., Neal, A. C., Brassell, S. C., Eglinton, G. and Course, P. A. (1984) Long chain (n-C37-C39) alkenones in the Prymnesiophyceae. Distribution of alkenones and other lipids and their taxonomic significance. British Phycological Journal. 19:203-216
Marra, J. and Heinemann, K. (1982) Photosynthesis response by phytoplankton to sunlight variability. Limnology and Oceanography. 27:1141-1153
Masojidek, J., Papacek, S., Sergejevova, M., Jirka, V., Cerveny, J., Kunk, J., Korecko, J., Verbovikova, O., Kopecky, J., Stys, D. and Torzillo, G. (2003) A closed solar photobioreactor for cultivation of microalgae under supra-high irradiance: basic design and performance. Journal of Applied Phycology. 15:239-248
McConnaughey, T. (1998) Acid secretion, calcification, and photosynthetic carbon concentrating mechanisms. Canadian Journal of Botany. 76:1119-1126
McIntyre, A. (1967) Coccoliths as paleoclimatic indicators of Pleistocene glaciation. Science. 158:1314-1317
Meeson, B., W and Sweeny, B. M. (1982) Adaptation of Ceratium furca and Gonyaulax polyedra (Dinophyceae) to different temperature and irradiances: growth rate and cell volumes. Journal of Phycology. 18:241-245
Meisen, A. and Shuai, X. (1997) Research and development issues in CO2 capture. Energy Conversion Management. 38:S37-S42
Mercz, T. I. (1994) A study of high lipid yielding microalgae with potential for large-scale production of lipids and polyunsaturated fatty acids. PhD Thesis, Biological Sciences and Biotechnology, Murdoch University, p: 278
Merret, J. M., Dong, L. F. and Nimer, N. A. (1993) Nitrate availability and calcite production in Emiliania huxleyi Lohmann. European Journal of Phycology. 28:243-246
Milero, F. J. (1979) The thermodynamics of the carbonate system in seawater. Geochemica et Cosmochimica Acta. 43:1651-1661
Miron, A. S., Camacho, F. G., Gomez, A. C., Grima, E. M. and Chisti, Y. (2000) Bubble-Column and Airlift photobioreactors for algal culture. Australian Institute of Chemical Engineers Journal. 46:1872-1887
Miron, A. S., Garcia, M. C. C., Gomez, A. C., Camacho, F. G., Grima, E. M. and Chisti, Y. (2003) Shear stress tolerance and biochemical characterization of Phaeodactylum
239
tricornutum in quasi steady - state continuous culture in outdoor photobioreactors. Biochemical Engineering Journal. 16:287-297
Miron, A. S., Gomez, A. C., Camacho, F. G., Grima, E. M. and Chisti, Y. (1999) Comparative evaluation of compact photobioreactors for large-scale monoculture of microalgae. Journal of Biotechnology. 70:249-270
Miyamoto, E., Watanabe, F., Ebara, S., Takenaka, S., Takenaka, H., Yamaguchi, Y., Tanaka, N., Inui, H. and Nakano, Y. (2001) Characterization of a vitamin B-12 compound from unicellular coccolithophorid alga (Pleurochrysis carterae). Journal of Agricultural and Food Chemistry. 49:3486-3489
Miyamoto, E., Watanabe, F., Takenaka, H. and Nakano, Y. (2002) Uptake and physiological function of vitamin B-12 in a photosynthetic unicellular coccolithophorid alga, Pleurochrysis carterae. Bioscience, Biotechnology and Biochemistry. 66:195-198
Mohn, F. H. (1988) Harvesting of micro-algal biomass. In: Micro-algal Biotechnology. (Borowitzka, M. A. and Borowitzka, L. J. eds). Cambridge University Press, Cambridge, pp: 357-394
Mohn, F. H. and Cordero, O. (1990) Harvesting of the algae Dunaliella some consideration concerning the cultivation and impact on the production cost of β-carotene. Berichte des Forschungszentrum Jülich. 2438:1-50
Molina, E., Fernandez, E., Acién, F. G. and Chisti, Y. (2001) Tubular photobioreactor design for algal cultures. Journal of Biotechnology. 92:113-131
Morel, F. M. M., Reinfelder, J. R., Roberts, S. B., Chamberlain, C. P., lee, J. G. and Yee, D. (1994) Zinc and carbon co-limitation of marine phytoplankton. Nature. 369:740-742
Moreno, J., Vargas, A., Rodriguez, H., Rivas, J. and Guerrero, M. G. (2003) Outdoor cultivation of a nitrogen-fixing marine cyanobacterium, Anabaena sp. ATCC 33047. Biomolecular Engineering. 20:191-197
Morita, M., Watanabe, Y., Okawa, T. and Saiki, H. (2001a) Photosynthetic productivity of conical helical tubular photobioreactors incorporating Chlorella sp under various culture medium flow conditions. Biotechnology and Bioengineering. 74:136-144
Morita, M., Watanabe, Y. and Saiki, H. (2001b) Evaluation of photobioreactor heat balance predicting changes in culture medium temperature due to light irradiation. Biotechnology and Bioengineering. 74:465-475
Moroney, J. V. (2001) Carbon concentrating mechanisms in aquatic photosynthetic organisms: A report on CCM 2001. Journal of Phycology. 37:928-931
Morris, E. and Kromkamp, J. (2003) Influence of temperature on the relationship between oxygen- and fluorescence-based estimates of photosynthetic parameters in a marine benthic diatom (Cylindrotheca closterium). European Journal of Phycology. 38:133-142
Moulton, T. P., Borowitzka, L. J. and Vincent, D. J. (1987) The mass culture of Dunaliella salina for β-carotene: from pilot plant to production plant. Hydrobiologia. 151/152:99-105
Muggli, D. L. and Harrison, P. J. (1996) Effects of nitrogen source on the physiology and metal nutrition of Emiliania huxleyi grown under different iron and light conditions. Marine Ecology Progress Series. 130:255-267
240
Murphy, W. L. and Messersmith, P. B. (2000) Compartmental control of mineral formation: adaptation of a biomineralization strategy for biomedical use. Polyhedron. 19:357-363
Nevenzel, J. C. (1989) Biogenic hydrocarbons of marine organisms. In: Marine Biogenic Lipids, Fats and Oils. (Ackmann, R. G. ed), Vol I. CRC Press, Boca Raton, pp: 3-72
Nielsen, M. V. (1995) Photosynthetic characteristic of the coccolithophorid Emiliania huxleyi (Prymnesiophyceae) exposed to elevated concentrations of dissolved inorganic carbon. Journal of Phycology. 31:715-719
Nimer, N. A., Guan, Q. and Merrett, M. J. (1994) Extra- and intra- cellular carbonic anhydrase in relation to culture age in a high-calcifying strain of Emiliania huxleyi. New Phytologist. 126:601-607
Nimer, N. A. and Merret, J. M. (1993) Calcification rate in Emiliania huxleyi Lohman in response to light, nitrate and availability of inorganic carbon. New Phytologist. 123:673-677
Nimer, N. A. and Merret, J. M. (1996) Inorganic carbon transport in relation to culture age and inorganic carbon concentration in a high-calcifying strain of Emiliania huxleyi (Prymnesiophyceae). Journal of Phycology. 32:813-818
Oh-Hama, T. and Miyachi, S. (1988) Chlorella. In: Micro-algal Biotechnology. (Borowitzka, M. A. and Borowitzka, L. J. eds). Cambridge University Press, Cambridge, pp: 85-121
Ohsumi, T. (2004) Introduction: What is the ocean sequestration of carbon dioxide. Journal of Oceanography. 60:693-694
Okazaki, M. (1977) Some enzymatic properties of Ca2+-dependent adenosine triphosphatase from calcareous marine alga, Serraticardia maxima and its distribution in marine algae. Botanica Marina. 20:347-354
Okazaki, M., Fujii, M., Usuda, Y. and Furuya, K. (1984) Soluble Ca2+-activated ATPase and its possible role in calcification of the coccolithophorid Cricosphaera roscoffensis var. haptonemofera (Haptophyta) (studies on the calcium carbonate deposition of algae V). Botanica Marina. 27:363-369
Olaizola, M., Duerr, E. O. and Freeman, D. W. (1991) Effect of CO2 enhancement in an outdoor algal production system using Tetraselmis. Journal of Applied Phycology. 3:363-366
Olaizola, M. and Yamamoto, H. Y. (1994) Short-term response of the diadinoxanthin cycle and fluorescence yield to high irradiance in Chaetoceros muelleri (Bacillariophyceae). Journal of Phycology. 30:606-612
Olguin, E. J., Galicia, S., Mercado, G. and Perez, T. (2003) Annual productivity of Spirulina (Arthrospira) and nutrient removal in a pig wastewater recycling process under tropical condition. Journal of Applied Phycology. 15:249-257
Oswald, W. J. (1980) Algal production - problems, acheivements and potential. In: Algae Biomass. (Shelef, G. and Soeder, C. J. eds). Elsevier/North-Holand Biomedical Press, Amsterdam, pp: 1-9
Oswald, W. J. (1988) Large-scale algal culture systems (engineering aspects). In: Micro-algal Biotechnology. (Borowitzka, M. A. and Borowitzka, L. J. eds). Cambridge University Press, Cambridge, pp: 357-394
241
Outka, D. E. and Williams, D. C. (1971) Sequential coccolith morphogensis in Hymnemonas carterae. Journal of Protozoology. 18:285-297
Paasche, E. (1964) A tracer study of the inorganic carbon uptake during coccolith formation and photosynthesis in the coccolithophorid Coccolithus huxleyi. Physiologia Plantarum. 3:1-82
Paasche, E. (1966) Action spectrum of coccolith formation. Physiologia Plantarum. 19:770-779
Paasche, E. (1968a) Biology and physiology of coccolithophorids. Annual Review of Microbiology. 22:71-86
Paasche, E. (1968b) The effect of temperature, light intensity, and photoperiod on coccolith formation. Limnology and Oceanography. 13:178-181
Paasche, E. (1998) Roles of nitrogen and phosphorous in coccolith formation in Emiliania huxleyi. European Journal of Phycology. 33:33-42
Paasche, E. (1999) Reduced coccolith calcite production under light-limited growth: a comparative study of three clones of Emiliania huxleyi (Prymnesiophyceae). Phycologia. 38:508-516
Paasche, E. (2002) A review of the coccolithophorid Emiliania huxleyi (Prymnesiophyceae), with particular reference to growth, coccolith formation, and calcification-photosynthesis interactions. Phycologia. 40:503-529
Paasche, E. and Brubak, S. (1994) Enhanced calcification in the coccolithophorid Emiliania huxleyi (Haptophyceae) under phosphorus limitation. Phycologia. 33:324-330
Paasche, E., Brubak, S., Skattebol, S., Young, J. R. and Green, J. C. (1996) Growth and calcification in the coccolithophorid Emiliania huxleyi (Haptophyceae) at low salinities. Phycologia. 35:394-403
Padan, E. and Shilo, M. (1973) Cyanophages-viruse attacking blue green algae. Bacteriology Review. 37:343-370
Parke, M. and Adams, I. (1960) The motile (Crystallolithus hyalinus Gaarder and Markali) and non-phases in the life history of Coccolithus pelagicus (Wallich) Schiller. Journal of Marine Biological Association of United Kingdom. 39:263-274
Payer, H. D., Chiemvichak, Y., Hosakul, K., Kongpanichkul, C., Kraidej, L., Nguitragul, M., Reungmanipytoon, S. and Buri, P. (1980) Temperature as an important climatic factor during mass production of microscopic algae. In: Algae Biomass. (Shelef, G. and Soeder, C. J. eds). Elsevier/North-Holand Biomedical Press, Amsterdam, pp: 390-399
Piatelli, A., Podda, G. and Scarano, A. (1997) Clinical and histological results in alveolar ridge enlargement using coralline calcium carbonate. Biomaterials. 18:623-627w
Pienaar, R. N. (1969) The fine structure of Cricosphaera carterae. I. External morphology. Journal of Cell Science. 4:561-567
Pienaar, R. N. (1994) Ultrastructure and calcification of coccolithophores. In: Coccolithophores. (Winter, A. and Siesser, W. G. eds). Cambridge University Press, Cambridge, pp: 13-37
Platt, T. and Irwin, B. (1973) Caloric content of phytoplankton. Limnology and Oceanography. 73:306-310
242
Prezelin, B. B. (1976) The role of peridinin-chlorophyl a-proteins in the photosynthetic light adaptation of marine dinoflagellate Glenodinium sp. Planta. 130:225-233
Prezelin, B. B. (1981) Light reactions in photosynthesis. In: Proceedings of NATO Advance Study Institute on Physiological Ecology of Phytoplankton. (Platt, T. ed), Vol 210. Canadian Bulletin of Fisheries and Aquatic Science, Lipari, Sicily, pp: 1-43
Princen, L. H. and Rothfus, J. A. (1984) Development of new crops for raw materials for industry. Journal of American Oil Chemists Society. 61:281-289
Pulz, O. (2001) Photobioreactors: production systems for phototrophic microorganisms. Applied Microbiology and Biotechnology. 57:287-293
Pulz, O. and Scheibenbogen, K. (1998) Photobioreactors: design and performance with respect to light energy input. In: Advances in Biochemical Engineering/Biotechnology. (Scheper, T. ed). Springer-Verlag, Berlin, pp: 123-152
Purdie, D. A. and Finch, M. S. (1994) Impact of a coccolithophorid bloom on dissolved carbon dioxide in seawater enclosures in a Norwegian Fjord. Sarsia. 79:379-324
Pushparaj, B., Pelosi, E., Tredici, M. R., Pinzani, E. and Materassi, R. (1997) An integrated culutre system for outdoor production of microalgae and cyanobacteria. Journal of Applied Phycology. 9:113-119
Qiang, H., Zarmi, Y. and Richmond, A. (1998) Combined effects of light intensity, light-path and culture density on output rate of Spirulina platensis (Cyanobacteria). European Journal of Phycology. 33:165-171
Qiu, B. S. and Gao, K. S. (2002) Daily production and photosynthetic characteristics of Nostoc flagelliforme grown under ambient and elevated CO2 conditions. Journal of Applied Phycology. 14:77-83
Radwan, S. S. (1991) Sources of C20-polyunsaturated fatty acids for biotechnological use. Applied Microbial Biotechnology. 35:421-430
Rames, A. and Williams, D. F. (1991) Relationship between chemotaxis and complement activation by ceramic biomaterials. Biomaterials. 12:661-667
Ratchford, I. A. J. and Fallowfield, H. J. (1992) Performance of a flat plate, air-lift reactor for the growth of high biomass algal culture. Journal of Applied Phycology. 4:1-9
Rattray, J. B. M. (1984) Biotechnology and the fats and oil industry. Journal of American Oil Chemists Society. 61:1701-1712
Raven, J. A. (1980) Nutrient transport in microalgae. Advances in Microbial Physiology. 21:47-226
Raven, J. A. (1988) Limits to growth. In: Micro-algal Biotechnology. (Borowitzka, M. A. and Borowitzka, L. J. eds). Cambridge University Press, Cambridge, pp: 331-356
Raven, J. A. (1997) Putting the C in phycology. European Journal of Phycology. 32:319-333
Raven, J. A. (2003) Inorganic carbon concentrating mechanisms in relation to the biology of algae. Photosynthesis Research. 77:155-171
Raven, J. A. and Falkowski, P. G. (1999) Oceanic sinks for atmospheric CO2. Plant, Cell and Environment. 22:741-755
243
Reifel, K. M., McCoy, M. P., Rocke, T. E., Tiffany, M. A., Hulbert, S. H. and Faulkner, D. J. (2002) Possible importance of algal toxins in the Salton Sea, California. Hydrobiologia. 473:275-292
Reifel, K. M., McCoy, M. P., Tiffany, M. A., Rocke, T. E., Trees, C. C., Barlow, S. B., Faulkner, D. J. and Hulbert, S. H. (2001) Pleurochrysis pseudoroscoffensis (Prymnesiophyceae) blooms on the surface of the Salton Sea, California. Hydrobiologia. 466:177-185
Rhee, G., Y and Gotham, I. J. (1981) The effect of environmental factors on phytoplankton growth: temperature and the interactions of temperature with nutrient limitation. Limnology and Oceanography. 26:635-648
Richmond, A. (1983) Phototrophic microalgae. In: Biotechnology. (Rehm, H. J. and Reed, G. eds), Vol 3. Verlag Chemie, Weinheim, pp: 109-143
Richmond, A. (1986) Outdoor mass culture of microalgae. In: CRC Handbook of Microalgal Mass Culture. (Richmond, A. ed). CRC Press, Boca Raton, pp: 285-329
Richmond, A. (1987) The challenge confronting industrial microagriculture: high photosynthetic efficiency in large-scale reactors. Hydrobiologia. 151/152:117-121
Richmond, A. (1988) Spirulina. In: Micro-algal Biotechnology. (Borowitzka, M. A. and Borowitzka, L. J. eds). Cambridge University Press, Cambridge, pp: 85-121
Richmond, A. (1992) Open systems for the mass production of photoautotrophic microalgae outdoors: physiological principles. Journal of Applied Phycology. 4:281-286
Richmond, A. (1999) Physiological principles and modes of cultivation in mass production of photoautotrophic microalgae. In: Chemical from Microalgae. (Cohen, Z. ed). Taylor and Francis, Philadelphia, pp: 353-386
Richmond, A. (2000) Microalgal biotechnology at the turn of the millennium: a personal view. Journal of Applied Phycology. 12:441-451
Richmond, A. (2004a) Biological priciples of mass cultivation. In: Microalgal culture. (Richmond, A. ed). Blackwell Science Ltd, Oxford, pp: 125-177
Richmond, A. (2004b) Principles for attaining maximal microalgal productivity in photobioreactors: an overview. Hydrobiologia. 512:33-37
Richmond, A. and Becker, E. W. (1986) Technological aspects of mass cultivation - a general outline. In: CRC Handbook of Microalgal Mass Culture. (Richmond, A. ed). CRC Press, Inc, Boca Raton, pp: 245-264
Richmond, A., Boussiba, S., Vonshak, A. and Kopel, R. (1993) A new tubular reactor for mass production of microalgae outdoors. Journal of Applied Phycology. 5:327-332
Richmond, A. and Grobbelaar, J. U. (1986) Factors affecting the output rate of Spirulina platensis with reference to mass cultivation. Biomass. 10:253-264
Richmond, A., Lichtenberg, E., Stahl, B. and Vonshak, A. (1990) Quantitative assessment of the major limitations on the productivity of Spirulina platensis in open raceways. Journal of Applied Phycology. 2:195-206
Richmond, A., Vonshak, A. and Arad, S. (1980) Environmental limitations in outdoor production of algal biomass. In: Algae Biomass. (Shelef, G. and Soeder, C. J. eds). Elsevier/North-Holland Biomedidal Press, Amsterdam, pp: 65-72
Richmond, A. and Wu, Z., C (2001) Optimization of a flat plate glass reactor for mass production of Nannochloropsis sp. outdoors. Journal of Biotechnology. 85:259-269
244
245
Richmond, A. and Zou, N. (1999) Efficient utilisation of high photon irradiance for mass production of photoautotrophic micro-organisms. Journal of Applied Phycology. 11:123-127
Riebesell, U., Revill, A. T., Holdsworth, G. and Volkman, J. K. (2000a) The effects of Varying COB2 B concentration on lipid composition and carbon isotope fractionation in Emiliania huxleyi. Geomica et Cosmochimica. 64:4179-4192
Riebesell, U., Zondervan, I., Rost, B., Tortell, P. D., Zeebe, R. E. and Morel, F. M. M. (2000b) Reduced calcification of marine plankton in response to increased atmospheric COB2 B. Nature. 407:364-367
Riegman, R., Noordeloos, A. A. M. and Cadee, G. C. (1992) Phaeocystis blooms and eutriphication of the continental coastal zones of the North Sea. Marine Biology. 112:479-484
Riegman, R., Stolte, W., Noordeloos, A. A. M. and Slezak, D. (2000) Nutrient uptake, and alkaline phosphate (EC 3 : 1 : 3 : 1) activity of Emiliania huxleyi (Prymnesiophyceae) during growth under N and P limitation in continuous cultures. Journal of Phycology. 36:87-96
Rivkin, R. B., Seliger, H. H., Swift, E. and Biggley, W. H. (1982) Light-shade adaptation by the oceanic dinoflagellates Pyrocystis noctiluca and P. fusiformis. Marine Biology. 68:181-191
Rivkin, R. B. and Voytek, M. A. (1987) Photoadaptations of photosynthesis and carbon metabolism by phytoplankton from McMurdo sound, Antarctica. 1. Species-specific and community responses to reduced irradiances. Limnology and Oceanography. 32:249-259
Robinson, L. F., Morrison, A. W. and Bamforth, M. R. (1988) Improvements relating to biosynthesis. In, European Patent, pp: 261-287 (EP 260.239.272)
Rontani, J. F., Marchand, D. and Volkman, J. K. (2001) NaBH4 reduction of alkenones to the corresponding alkenols: a useful tool for their characterisation in natural samples. Organic Geochemistry. 32:1329-1341
Rowson, J. D. and Leadbeater, B. S. C. (1986) Calcium carbonate deposition in the motile (Crystallolithus) phase of Coccolithus pelagicus (Prymnesiophyceae). British Phycological Journal. 21:359-370
Rubio, F. C., Acién Fernández, F. G. A., Sanchez Perez, J. A., Garcia Camacho, F. and Molina Grima, E. (1999) Prediction of dissolved oxygen and carbon dioxide concentration profiles in tubular photobioreactor for microalgal culture. Biotechnology and Bioengineering. 62:71-86
Ryther, J. H. and Dunstan, W. M. (1971) Nitrogen, phosphors and eutriphication in the coastal environment. Science. 171:1008-1013
Sato, V. (1991) Development of a phytoplankton production system as a support base for finfish larval rearing research. In: Rotifer and Microalgae Culture Systems. (Fulks, W. and Main, K. L. eds). The oceanic Institute Makapuu Point, Honolulu, pp: 257-274
Sciandra, A., Harlay, J., Lefevre, D., Lemee, R., Rimmelin, P., Denis, M. and Gattuso, J. (2003) Response of coccolithophorid Emiliania huxleyi to elevated partial pressure of COB2 B under nitrogen limitation. Marine Ecology Progress Series. 261:111-122
Seki, M., Hirokawa, Y., Hasegawa, H. and Furusaki, S. (1995) Effect of COB2 B concentration on growth and carbon fixation rate of Pleurochrysis carterae. Journal of Chemical Engineering of Japan. 28:474-476
246
Sekino, K. and Shiraiawa, Y. (1994) Accumulation and utilization of dissolved inorganic carbon by a marine unicellular coccolithophorid, E. huxleyi. Plant Cell Physiology. 35:353-361
Sekino, K. and Shiraiawa, Y. (1996) Evidence for the involvement of mitochondrial respiration in calcification in a marine coccolithophorid, Emiliania huxleyi. Plant Cell Physiology. 37:1030-1033
Setlik, I., Veladimir, S. and Malek, I. (1970) Dual purpose open circulation units for large scale cuture of algae in temperate zones. I. Basic design considerations and scheme of pilot plant. Algological Studies. 1:111-164
Sheen, J., Dunahay, T., Benemann, J. and Roessler, P. (1998) A look back at the U.S. department of energy's aquatic species program-biodiesel from algae, National Renewable Energy Laboratory, Golden, CO, 80401 NERL/TP-580-24190, pp: 294
Shifrin, N. S. and Chisholm, S. W. (1981) Phytoplankton lipids: Interspecific differences and effects of nitrate, silicate and light-dark cycles. Journal of Phycology. 17:374-384
Shiraiawa, Y. (2003) Physiological regulation of carbon fixation in the photosynthesis and calcification of coccolithophorids. Comparative Biochemistry and Physiology. 136:775-783
Shiraiawa, Y., Danbara, A. and Kanke, Y. (2004) Characterization of highly oxygen-sensitive photosynthesis in coccolithophorids. The Japanese Journal of Phycology. 52:87-94
Shiraiawa, Y., Sugimoto, H. and Satoh, M. (2003) Regulation of intracellular calcification and algal growth by nutrient supply in coccolithophorids. In: Proceedings of the 8th International Symposium on Biomineralization (Biomineralization: formation, diversity, evolution and application). (Kobayashi, I. and Ozawa, H. eds), Tokai University Press, Kangawa, pp: 241-246
Sieburth, J. M. (1960) Acrylic acid, an 'antibiotic' principal in Phaeocytis blooms in Antarctic waters. Science. 132:676-677
Siesser, W. G. (1994) Historical background of coccolithophore studies. In: Coccolithophores. (Winter, A. and Siesser, W. G. eds). Cambridge University Press, Cambridge, pp: 1-12
Sikes, C. S., Roer, R. D. and Wilber, K. M. (1980) Photosynthesis and coccolith formation: Inorganic carbon sources and net inorganic reaction of deposition. Limnology and Oceanography. 25:248-261
Sikes, C. S. and Wheeler, A. P. (1982) Carbonic anhydrase and carbon fixation in coccolithophorids. Journal of Phycology. 18:423-426
Sikes, C. S. and Wilber, K. M. (1980) Calcification by coccolithophorids: effects of pH and Sr. Journal of Phycology. 16:433-436
Singh, S., Arad, S. and Richmond, A. (2000) Extracellular polysaccharide production in outdoor mass cultures of Porphyridium sp. in flat plate glass reactors. Journal of applied phycology. 12:269-275
Smith, V., H (1983) Light and nutrient dependence of photosynthesis by algae. Journal of Phycology. 19:306-313
Soeder, C. J. (1980) The scope of microalgae for food and feed. In: Algae Biomass. (Shelef, G. and Soeder, C. J. eds). Elsevier/North-Holand Biomedical Press, Amsterdam, pp: 9-20

247
Soong, P. (1980) Production and development of Chlorella and Spirulina in Taiwan. In: Algae Biomass. (Shelef, G. and Soeder, C. J. eds). Elsevier/North-Holland Biomedical Press, Amsterdam, pp: 97-113
Spencer, D. F. (1997) Ocean systems for managing the global carbon cycle. Energy Conversion Management. 38:S265-S271
Stoll, H. M., Klaas, C. M., Probert, I., Encinar, J. R. and Alonso, J. I. G. (2002a) Calcification rate and temperature effects on Sr partitioning in coccoliths of multiple species of coccolithophorids in culture. Global and Planetary Change. 34:153-171
Stoll, H. M., Rosenthal, Y. and Falkowski, P. (2002b) Climate proxies from Sr/Ca of coccolith calcite: Calibrations from continuous culture of Emiliania huxleyi. Geochemica et Cosmochimica Acta. 66:927-936
Stupp, S. I. and Braun, P. V. (1997) Molecular manipulation of microstructures: biomaterials, ceramics, and semiconductors. Science. 277:1242-1248
Sukenik, A., Carmeli, Y. and Berner, T. (1989) Regulation of fatty acid composition by growth irradiance level in the eustigmatophyte Nanochloropsis sp. Journal of Phycology. 25:686-692
Sukenik, A., Levy, R. S., Levy, Y., Falkowski, P. G. and Dubinsky, Z. (1991) Optimizing algal biomass production in an outdoor pond: a simulation model. Journal of Applied Phycology. 3:191-201
Sulivan, J. M. and Swift, E. (2003) Effects of small scale turbulence on net growth rate and size of ten species of marine dinoflagellates. Journal of Phycology. 39:83-94
Sulivan, J. M., Swift, E., Donaghy, P. L. and Rines, J., E. B (2003) Small scale turbulence affects the division rate and morphology of two red-tide dinoflagellates. Harmful Algae. 2:183-199
Suzuki, T. and Matsuo, T. (1995) Gas-sparged bioreactors for COB2 B fixation by Dunaliella tetiolecta. Journal of Chemical Technology and Biotechnology. 8:309-334
Suzuki, Y. and Takahashi, M. (1995) Growth responses of several diatom species isolated from various environments to temperature. Journal of Phycology. 31:880-888
Sweeny, B. M. and Hastings, J. W. (1958) Rhythmic cell division in populations of Gonyaulax polyedra. Journal of Protozoology. 5:217-224
Takano, H., Jeon, J., Burgess, J. G., Manabe, E., Izumi, Y., Okazaki, M. and Matsunaga, T. (1994) Contiuous production of extracellular ultra fine calcite particles by marine coccolithophorid Pleurochrysis carterae. Applied Microbiology and Biotechnology. 40:946-950
Takenaka, H., Yamaguchi, Y., Teramato, S., Tanaka, N., Hori, M., Seki, H. and Hiwatari, T. (1996a) Evaluation of the mutagenic properties of the coccolithophore Pleurochrysis carterae (Haptophyceae) as a potential human food supplement. Journal of Applied Phycology. 8:1-3
Takenaka, H., Yamaguchi, Y., Teramato, S., Tanaka, N., Hori, M., Seki, H., Nishimori, T. and Morinaga, T. (1996b) Safety evaluation of Pleurochrysis carterae as a potential food supplement. Journal of marine Biotechnology. 3:274-277
Tanticharoen, M., Bunnag, B. and Vonshak, A. (1993) Cultivation of Spirulina using secondary treated starch wastewater. Australian Biotechnology. 3:223-226
Tapie, R. and Bernard, A. (1987) Microalgae production: technical and economical evaluations. Biotechnology and Bioengineering. 32:873-885
248
Taylor, F. J. R. (1987) Ecology of dinoflagellates; general and marine ecosystems. In: The Biology of Dinoflagellates. (Taylor, F. J. R. ed), Vol 21. Blackwell Scientific Publications, Oxford, pp: 389-502
Tchernov, D., Silverman, J., Luz, B., Reinhold, L. and Kaplan, A. (2003) Massive light-dependent cycling of inorganic carbon between oxygenic photosynthetic microorganisms and their surroundings. Photosynthesis Research. 77:95-103
Thimijan, R. W. and Henis, R. D. (1983) Photometric, radiometric, and quantum light units of measure: A review of procedures for interconversion. HortScience. 18:818-822
Thomas, W. H. and Gibson, C. H. (1990) Effects of small-scale turbulence on microalgae. Journal of Applied Phycology. 2:71-77
Thomas, W. H., Vernet, M. and Gibson, C. H. (1995) Effects of small-scale turbulence on photosynthesis, pigmentation, cell division, and cell size in the marine dinoflagellate Gonyaulax polyedra (Dinophycea). Journal of Phycology. 31:50-59
Tolbert, N. E. (1994) Role of photosynthesis and photorespiration in regulating atmospheric CO B2 B and OB2 B. In: Regulation of Atmospheric COB2 B and OB2 B by Photosynthetic Carbon Mechanism. (Tolbert, N. E. and Preiss, J. eds). Oxford University Press, New York, pp: 8-36
Torzillo, G., bernardini, P. and Masojidek, J. (1998) On-line monitoring of chlorophyll fluorescence to assess the extent of photoinhibition of photosynthesis induced by high oxygen concentration and low temperature and its effect on the productivity of outdoor cultures of Spirulina platensis. Journal of Phycology. 34:504-510
Torzillo, G., Sacchi, A., Materassi, R. and Richmond, A. (1991) Effect of temperature on yield and night biomass loss in Spirulina platensis grown outdoor in tubular photobioreactor. Journal of Applied Phycology. 3:103-109
Tramper, J. and Williams, J. B. (1986) Shear sensitivity of insect cells in suspensions. Enzyme and Microbial Technology. 8:33-36
Tredici, M. R. (2004) Mass production of microalgae: photobioreactors. In: Microalgal Culture. (Richmond, A. ed). Blackwell Science Ltd, Oxford, pp: 178-214
Tredici, M. R. and Materassi, R. (1992) From open ponds to vertical alveolar panels: the Italian experience in the development of reactors for the mass cultivation of phototrophic microorganisms. Journal of Applied Phycology. 4:221-231
Turcotte, G. and Kosaric, N. (1989) Lipid biosynthesis in oleaginous yeasts. Advances in Biochemical Engineering/Biotechnology. 40:73-92
Turkenburg, W. C. (1997) Sustainable development, climate change, and carbon dioxide removal (CDR). Energy Conversion Management. 38:S3-S12
Tyrell, T. and Merico, A. (2004) Emiliania huxleyi: blooms observations and the conditions that induce them. In: Coccolithophores from Molecular Processes to Global Impact. (Thierstein, H. R. and Young, J. R. eds). Springer, Berlin, pp: 75-98
Valderrama, G., Cardenas, a. and Markovits, A. (1987) On the economics of Spirulina production in Chile with details on drag-board mixing in shallow ponds. Hydrobiologia. 151/152:71-74
van Alstyne, K. L. and Houser, L. T. (2003) Dimethylsulfide release during macroinvertebrate grazing and its role as an activated chemical defence. Marine Ecology Progress Series. 250:175-181
249
van der Wal, P. and de Brujin, W. C. (1983) Calcification in the coccolithophorid alga Hymnemonas carterae. Environmental Biogeochemistry. 35:251-258
van der Wal, P., de Jong, E. W., Westbroek, P., de Bruijn, W. C. and Mulder-Stapel, A. A. (1983) Polysaccharide localization, coccolith formation, and golgi dynamics in the coccolithophorid Hymnemonas carterae. Journal of Ultrastructure Research. 85:139-158
van der Wal, P., de Jong, L. and Westbroek, P. (1984a) Ultrastructural polysaccharide localization in calcifying and naked cells of the coccolithophorid Emiliania huxleyi. In: Calcification in Two Species of Coccolithophorid Algae. (van der Wal, P. ed), Vol 1. Geologisch Institute, Amsterdam, pp: 25-36
van der Wal, P., de Jong, L., Westbroek, P. and de Bruijn, W. C. (1984b) Calcification in the Coccolithophorid Alga Hymnemonas carterae. In: Calcification in Two Species of Coccolithophorid Algae. (van der Wal, P. ed), Vol 1. Geologisch Institute, Amsterdam, pp: 73-80
van der Wal, P., de Jong, L., Westbroek, P., de Bruijn, W. C. and Mulder-Stapel, A. A. (1984c) Polysaccharide localization, coccolith formation, golgi dynamics in the coccolithophorid Hymnemonas carterae. In: Calcification in Two Species of Coccolithophorid Algae. (van der Wal, P. ed), Vol 1. Geologisch Institute, Amsterdam, pp: 37-56
van der Wal, P., de Vind, J. P. M., de Vrind-de Jong, E. W. and Borman, A. (1987) Incompleteness of the coccosphere as a possible stimulus for coccolith formation in Pleurochrysis carterae (Prymnesiophyceae). Journal of Phycology. 23:218-221
van Rijssel, M. and Gieskes, W. W. C. (2002) Temperature, light, and the dimethylsulfoniopropionate (DMSP) content of Emiliania huxleyi (Prymnesiophyceae). Journal of Sea Research. 48:17-27
Vandonjon, L., Rossignol, N., Janouen, P., Roberts, J. M. and Quemeneur, F. (1999) Effects of shear on two microalgae species. Contribution of pumps and valves in tangential flow filtration systems. Biotechnology and Bioengineering. 63:1-9
Venkataraman, L. V. and Becker, E. W. (1982) Biotechnology and Utilization of Algae - The Indian Experience -. Department of Science and Technology and Central Food Technological Research Institute, Mangalore, p: 257
Verity, P. G. (1981) Effects of temperature, irridiance, and day length on the marine diatom Leptocylindrus danicus Cleve. I. Photosynthesis and cellular composition. Journal of Experimental Marine Biology and Ecology. 55:79-91
Vitousek, P. M. (1994) Beyond global warming: ecology and global change. Ecology. 75:1861-1876
Vonshak, A. (1997) Outdoor mass production of Spirulina: The basic concept. In: Spirulina platensis (Arthrospira): Physiology, Cell-biology and Biotechnology. (Vonshak, A. ed). Taylor and Francis Ltd, London, pp: 79-100
Vonshak, A., Abeliovich, A. and Boussiba, S. (1982) Production of Spirulina biomass: effects of environmental factors and population density. Biomass. 2:175-185
Vonshak, A., Boussiba, S., Abeliovich, A. and Richmond, A. (1983) Production of Spirulina biomass: Maintenance of pure culture outdoors. Biotechnology and Bioengineering. 25:341-349

250
Vonshak, A. and Guy, R. (1992) Photoadaptation, Photoinhibition and productivity in the blue green alga, Spirulina platensis grown outdoor. Plant , Cell and Environment. 15:613-616
Vonshak, A., Guy, R., Poplawsky, R. and Ohad, I. (1988) Photoinhibition and its recovery in two strains of the cyanobacterium Spirulina platensis. Plant Cell Physiology. 29:721-726
Vonshak, A. and Richmond, A. (1988) Mass production of the blue-green alga Spirulina: an overview. Biomass. 15:233-247
Vonshak, A., Torzillo, G., Masojidek, J. and Boussiba, S. (2001) Sub-optimal morning temperature induces photoinhibition in dense outdoor cultures of the alga Monodus subterraneus (Eustigmatophyta). Plant, Cell and Environment. 24:1113-1118
Vonshak, A., Torzillo, G. and Tomaseli, L. (1994) Use of chlorophyll fluorescence to estimate the effect of photoinhibition in outdoor cultures of Spirulina platensis. Journal of Applied Phycology. 6:31-34
Voss, K. J., Balch, W. M. and Kilpatrick, K. A. (1998) Scattering and attenuation properties of Emiliania huxleyi cells and their detached coccoliths. limnology and Oceanography. 43:870-876
Walsh, D. and Mann, S. (1995) Fabrication of hollow porous shells of calcium carbonate from self-organizing media. Nature. 377:320-322
Watabe, N. and Wilbur, K. M. (1966) Effects of temperature on growth, calcification, and coccolith form in Coccolithus huxleyi (Coccolithineae). Limnology and Oceanography. 11:567-575
Watanabe, F., Noue, J. and Hall, D. O. (1995) Photosynthetic performance of a helical tubular photobioreactor incorporating the cyanobacterium Spirulina platensis. Biotechnology and Bioengineering. 47:261-269
Watanabe, Y. and Hall, D. O. (1996) Photosynthetic production of the filamentous cyanobacterium Spirulina platensis in a cone-shaped helical tubular photobioreactor. Applied Microbiology and Biotechnology. 44:693-698
Weisman, J. C. and Noue, J. (1995) Design and operation of an outdoor microalgae test facility: large-scale system results, National Renewable Energy Laboratory, Golden Colorado, pp: 32-56
Weissman, J. C. and Goebel, R. P. (1987) Design and analysis of microalgal pond systems for purpose of producing fuel, Solar Energy Research Institute, Golden Colorado, SERI/STR-232-3569, pp: 140
Weissman, J. C., Goebel, R. P. and Benemann, J. R. (1988) Photobioreactor design: mixing, carbon utilization, and oxygen accumulation. Biotechnology and Bioengineering. 31:336-344
Wheeler, A. P. and North, B. B. (1974) Amino acid uptake by marine phytoplanktons. Limnology and Oceanography. 19:249-259
White, A. W. (1978) Salinity effects on growth and toxin content of Gonyauax excavata, a marine dinoflagellate causing paralytic shellfish poisoning. Journal of Phycology. 14:475-479
Winter, A., Jordan, R. W. and Roth, P. H. (1994) Biogeography of living coccolithophores in ocean waters. In: Coccolithophores. (Winter, A. and Siesser, W. G. eds). Cambridge University Press, Cambridge, pp: 161-177
251
Wu, Q., Dai, J., Shiraiawa, Y., Sheng, G. and Fu, J. (1999) A renewable energy source-hydrocarbon gases resulting from pyrolysis of the marine nonoplanktonic alga Emiliania huxleyi. Journal of Applied Phycology. 11:137-142
Yagishita, T., Sawayama, S., Tsukahara, K. and Ogi, T. (1996) Photosynthetic bio-fuel cells using cyanobacteria. World Renewable Energy Congress. 2:958-961
Yang, Y. and Gao, K. (2003) Effects of COB2 B concentrations on the freshwater microalgae, Chlamydomonas reinhardtii and Scenedesmus obliquus. Journal of Applied Phycology. 15:1-11
Yongmanitchai, W. and Ward, O. P. (1991) Growth of omega-3 fatty acid production by Pheadactylum tricornutum under different culture conditions. Applied Environmental Microbiology. 57:419-125
Young, J. R. (1994) Functions of coccoliths. In: Coccolithophores. (Winter, A. and Siesser, W. eds). Cambridge University Press, Cambridge, pp: 63-82
Young, J. R., Bergen, J. A., Bowen, P. R., Burnett, J. a., Fiorentino, A., Jordan, R. W., Kleijne, A., van Niel, B. E., Romein, A. J. T. and von Salls, K. (1997) Guidelines for coccolith and calcareous nannofossil terminology. Palaentology. 40:875-912
Young, J. R., Billard, C., Bown, P. R., Cros, L., Davis, L., Geisen, M., Kawachi, M., Mann, S., Medlin, L. K. and Robert, I. A. S. (2000) Phylogeny of coccolithophores and the evolution of calcification. Journal of Nanoplankton Research. 22:153-155
Young, J. R., Bown, P. R. and Burnett, J. A. (1994) Palaeontological perspective. In: The Haptophyte Algae. (Green, J. C. and Leadbeater, B. S. C. eds). Clarendon Press, Oxford, pp: 393-412
Young, J. R., Davis, S. A., Bown, P. R. and Mann, S. (1999) Coccolith ultrastructure and biomineralization. Journal of Structural Biology. 126:195-215
Zhang, J., Miyachi, S. and Kurano, N. (2001) Evaluation of a vertical flat-plate photobioreactor for outdoor biomass production and carbon dioxide bio-fixation: effects of reactor dimensions, irradiation and cell concentration on the biomass productivity and irradiation utilization efficiency. Applied Microbiology and Biotechnology. 55:428-433
Zhang, K., Kurano, N. and Miyachi, S. (1999) Outdoor culture of a cyanobacterium with a vertical flat-plate photobioreactor: effects on productivity of the reactor orientation, distance setting between the plates, and culture temperature. Applied Microbial Biotechnology. 52:781-786
Zhang, K., Kurano, N. and Miyachi, S. (2002) Optimized aeration by carbon dioxide gas for microalgal production and mass transfer characterization in a vertical flat-plate photobioreactor. Bioprocess and Biosystems Engineering. 25:97-101
Zittelli, G., C, Rodolfi, L. and Tredici, M. R. (2003) Mass cultivation of Nannochloropsis sp. in annular reactors. journal of applied phycology. 15:107-114
Zondervan, I., Rost, B. and Riebeesell, U. (2002) Effect of COB2 B concentration on the PIC/POC ratio in the coccolithophore Emiliania huxleyi grown under light-limiting conditions and different day lengths. Journal of Experimental Marine Biology and Ecology. 272:55-70
Zondervan, I., Zeebe, R. E., Rost, B. and Riebeesell, U. (2001) Decreasing biogenic calcification: a negative feedback on rising atmospheric pCOB2B. Global Biogeochemical Cycles. 15:507-516

252
Zou, N. and Richmond, A. (1999) Effect of light-path length in outdoor flat plate reactors on output rate of cell mass and EPA in Nannochloropsis sp. Journal of Biotechnology. 70:351-356
Zou, N., Zhang, C., Cohen, Z. and Richmond, A. (2000) Production of cell mass and eicosapentaenoic acid (EPA) in ultrahigh cell density cultures of Nanochloropsis sp.. (Eustigmatophyceae). European Journal of Phycology. 35:127-133