Embed Size (px)
Citation preview
1
The crystal structure of a biological insulated transmembrane molecular wire
Authors: Marcus J. Edwards1, Gaye F. White1, Julea N. Butt1,2, David J. Richardson1,*, Thomas
A. Clarke1,3,*.
Affiliations: 1School of Biological Sciences and 2School of Chemistry, University of East Anglia, Norwich
NR4 7TJ, United Kingdom
3Lead contact
*Correspondence to: [email protected] and [email protected]
Summary:
A growing number of bacteria are recognised to conduct electrons across their cell envelope and
yet molecular details of the mechanisms supporting this process remain unknown. Here we report
the atomic structure of an outer membrane spanning protein complex, MtrAB, that is representative
of a protein family known to transport electrons between the interior and exterior environments of
phylogenetically and metabolically diverse microorganisms. The structure is revealed as a
naturally insulated biomolecular wire possessing a 10-heme cytochrome, MtrA, insulated from the
membrane lipidic environment by embedding within a 26 strand -barrel formed by MtrB. MtrAB
forms an intimate connection with an extracellular 10-heme cytochrome, MtrC, which presents its
hemes across a large surface area for electrical contact with extracellular redox partners, including
transition metals and electrodes.
Manuscript
2
Introduction:
The outer membranes of Gram-negative bacteria are naturally insulative and prevent the
indiscriminate exchange of electrons between the cell and environment. However, a number of
important bacterial processes require the conductance of electrons across the outer membrane.
These include the transfer of intracellularly derived electrons out of the cell to external electron
acceptors or the import of electrons into the cell from extracellular electron donors in order to
support the formation of reducing equivalents for carbon fixation (Shi et al., 2016). The ability to
directly transfer electrons into and out of bacterial cells is also of increasing interest for
biotechnological applications including microbial fuel cells, microbial electrosynthesis,
unbalanced fermentation and bio-electronic interfaces (Bursac et al., 2017; Lovley, 2012; Rabaey
and Rozendal, 2010). Mechanistically, this process requires electrons to be transported across the
outer membrane of the cell in a controlled pathway that prevents detrimental redox side-reactions,
such as the generation of reactive oxygen species. Thus an ‘insulated’ electron transfer complex is
required.
The Gram-negative Shewanella are one of the most studied bacterial genera capable of transferring
electrons out of the cell to solid phase Fe(III) and Mn(IV) minerals in order to support anaerobic
respiration (Beblawy et al., 2018; Edwards et al., 2018) . We have previously purified an
icosaheme protein complex comprising three subunits (MtrA, MtrB, MtrC) from the outer
membrane of Shewanella oneidensis and shown that this Mtr complex is able to conduct electrons
bidirectionally across proteoliposome bilayers sustaining electron transport rates over 8500 e s-1
(White et al., 2013). In liposome studies the direction of electron transfer is dependent on the
relative redox potentials across the membrane. Extraliposomal sodium dithionite capable of
reducing intraliposomal methyl viologen or small tetraheme cytochrome (STC), which can then
be used reduce extravesicular iron oxides and chelates (Edwards et al., 2018; White et al., 2013).
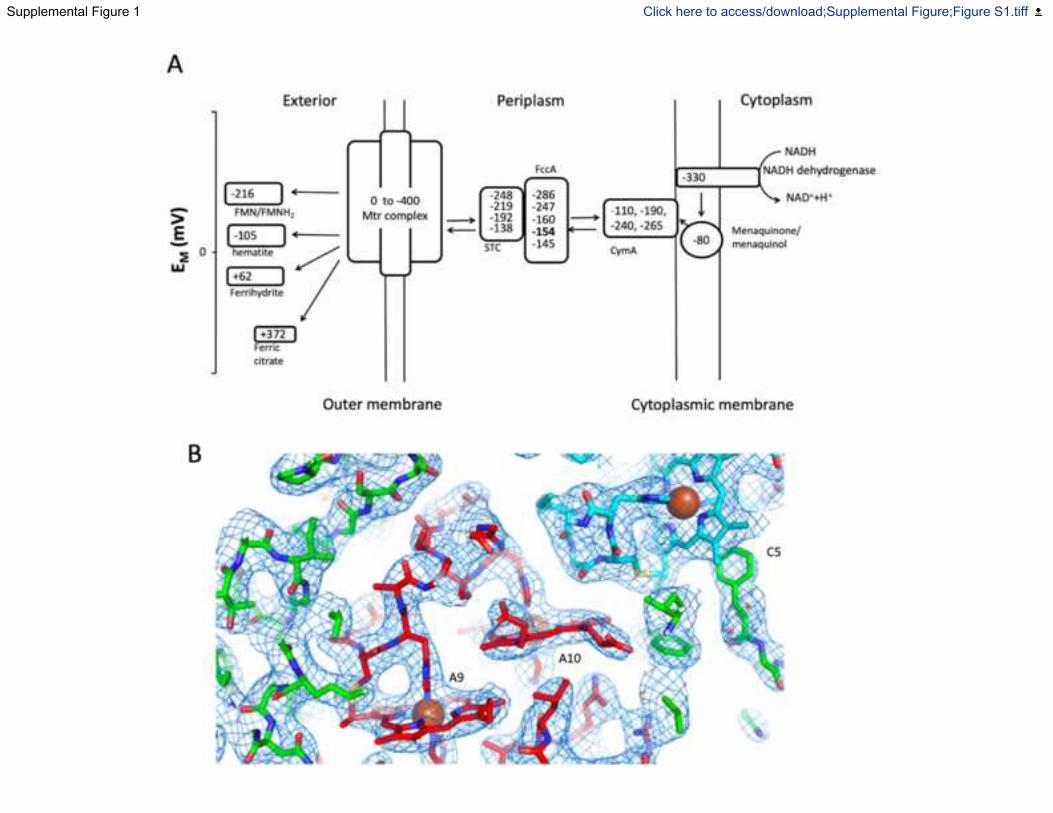
The reduction potentials of the 20 hemes in the S. oneidensis Mtr complex span from approx. 0 to
-400 mV vs SHE. This allows the complex to accept electrons from the menaquinol dehydrogenase
CymA, via the periplasmic cytochromes STC and FccA, and transfer them to extracellular soluble
and insoluble electron acceptors (Figure S1A). Within this complex the ten heme MtrC is the cell
surface module required when solid-phase minerals serve as terminal electron acceptors (Coursolle
and Gralnick, 2010; Hartshorne et al., 2007). MtrAB is proposed to span the outer membrane and
provide electrical connection between the catabolic electron transfer network within the cell, and
the electron dispersing MtrC outside the cell (Edwards et al., 2018). Despite these findings, critical
information about the complex, including the topology and interactions of all three components
has been missing until now. Here we present the structure of an Mtr complex at 2.7 Å resolution.
This structure reveals MtrAB to be a naturally insulated molecular wire that is able to conduct
electrons across the lipidic outer membrane and deliver them to MtrC, which positions its hemes
to optimize electron distribution to extracellular redox partners.
Results and Discussion
Structure of a 20 heme electron transfer complex.
Despite multiple attempts, the Mtr complex from S. oneidensis could not be crystallized. However,
homologous Mtr complexes are produced endogenously by different Shewanella species
(Fredrickson et al., 2008) and screening of several of these provided a single crystallisable hit. The
Mtr complex from Shewanella baltica OS185 produced crystals that diffracted to a final resolution
of 2.7 Å and data was phased utilizing the anomalous signal from the 20 iron atoms of the c-type
3
hemes (Table 1, Fig. S1). The crystal structure reveals a heterotrimeric complex that consists of
two cytochromes, MtrC and MtrA, and a beta-barrel protein, MtrB, that sheathes and insulates
MtrA (Fig. 1A). A network of 20 bis-His coordinated hemes spans the complex, forming an
electron transfer pathway of 185 Å (Fig. 1B). The hemes of MtrA and MtrC are annotated in order
of the CxxCH binding motifs to which they are connected, e.g. heme A1 binds to the first motif in
the MtrA amino acid sequence and heme C1 binds to the first motif in the MtrC sequence (Fig.
1B, 2A).
Structure of the embedded decaheme cytochrome MtrA.
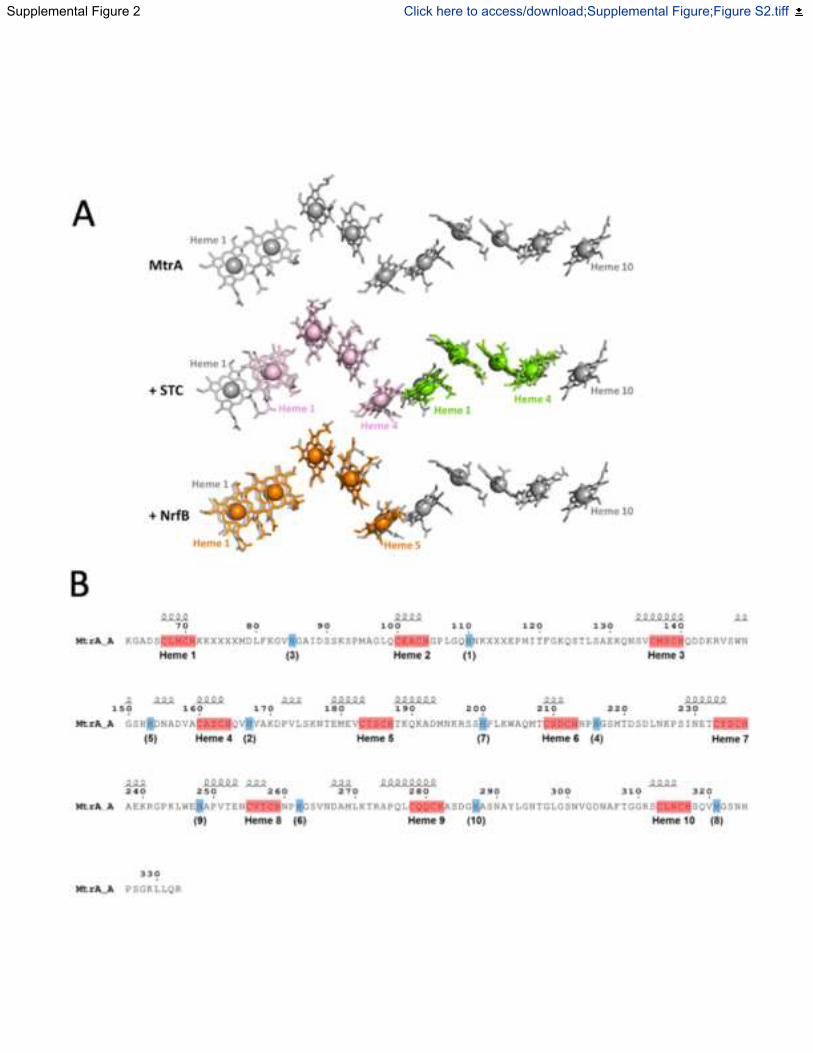
Hemes A1 to A10 of MtrA are arranged such that neighbouring pairs have alternating parallel and
perpendicular porphyrin ring planes for which the closest edge-edge distances lie between 3.9 and
6.5 Å (Fig. 2B). Similar configurations are found in the heme chains of smaller cytochromes from
Shewanella and other bacteria. The heme chain of STC (Leys et al., 2002) of Shewanella sp. can
be superposed over hemes A2-A5 and hemes A6-A9 of MtrA with R.M.S.D of 1.52 Å and 1.64 Å
respectively. The pentaheme chain of NrfB from Escherichia coli (Clarke et al., 2007) can be
superposed over hemes A1-A5 of MtrA with an R.M.S.D of 1.74 Å (Clarke et al., 2007; Leys et
al., 2002)(Supp Fig S2A). The sequence identity between STC and MtrA in the aligned regions is
only 22-23% and the corresponding sequence identity between NrfB and MtrA is only 33%.
However, the conservation of the heme arrangement observed in these structures suggests that
STC, NrfB and MtrA might share a common ancestor, with MtrA arising from a gene duplication.
The arrangement of MtrA heme A9 and A10 cannot be superposed on hemes from either STC or
NrfB, possibly because the orientation of heme A10 has altered to facilitate electron transfer to
extracellular MtrC.
The hemes of STC and NrfB are redox active within the same potential window as MtrA,
specifically 0 to -400 mV versus SHE (Clarke et al., 2004; Firer-Sherwood et al., 2008), and a
maximum electron flux of 3 106 s-1 though hemes 1-4 of STC has been calculated (Jiang et al.,
2017) in agreement with measurements of heme-heme electron transfer rates in that protein (van
Wonderen et al. 2019). Thus, MtrA may support similarly rapid electron transfer across the 80 Å
heme chain between heme A1 and heme A10. This distance is more than sufficient to facilitate the
collection of electrons originating within the periplasm, transport across the ~ 40 Å outer cell
membrane and delivery to the extracellular environment.
The MtrA polypeptide has very little secondary structure, with only 20 % of the polypeptide chain
composed of helices, and the remaining 80 % consisting of flexible loops (Fig. 2A, Fig S2). This
is consistent with previous small angle X-ray scattering SAXS analysis of isolated MtrA in
solution (Firer-Sherwood et al., 2011). Kratky analysis of this data revealed a peak at low scattering
angles, consistent with a folded protein, but increased at higher scattering angles consistent with a
flexible MtrA.
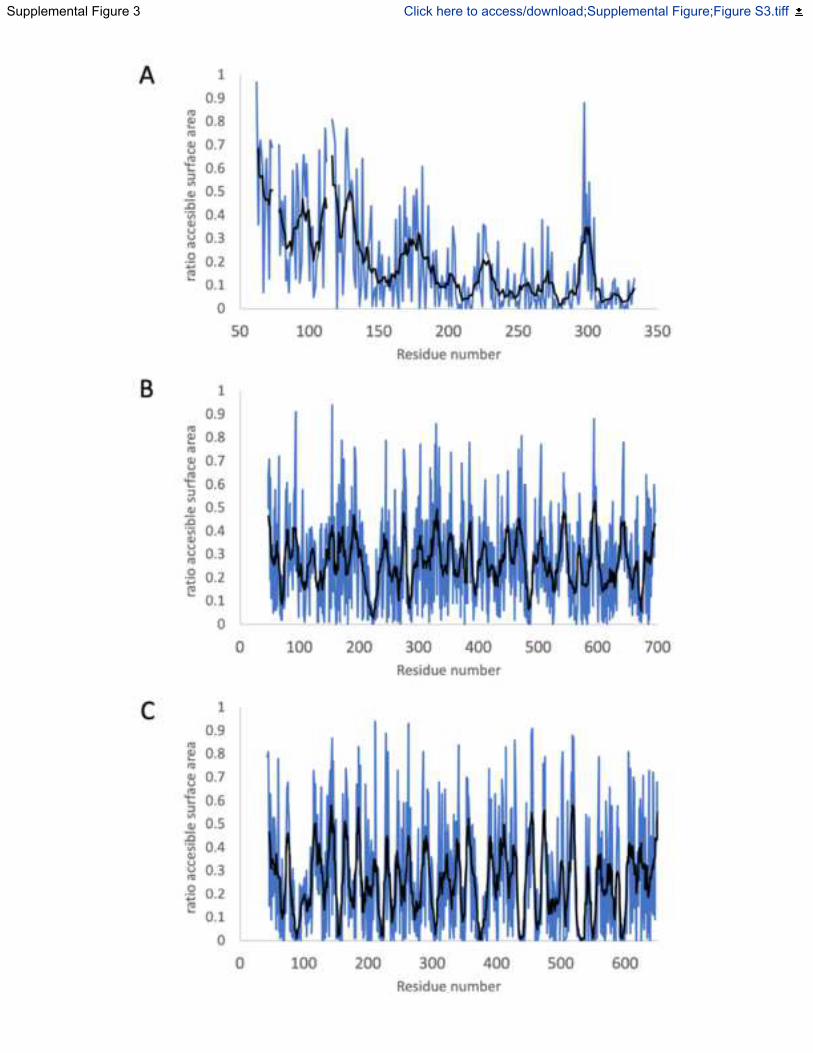
As a component of the Mtr crystal structure, the flexibility of MtrA can be observed through the
temperature (B-) factors of the peptide backbone, where higher values are associated with
increased chain mobility. The B-factors of MtrA increase from the externally facing C-terminus
to the periplasmic facing N-terminus (Fig. 2C, S3). Loops in the C-terminal half of the MtrA form
hydrogen bonds with internally facing charged MtrB side chains, restricting mobility. In contrast,
the interactions between the N-terminal half of MtrA and MtrB are much less extensive, which
increases the mobility of the periplasmic facing side of MtrA. The MtrA N-terminus is the most
mobile region and projects out of MtrB into the periplasmic compartment, with heme A1 located
approximately 20 Å inside the periplasm. This could facilitate interactions between heme A1 and
4
soluble periplasmic proteins such as STC and fumarate reductase FccA, which have been
previously shown to be electron donors to MtrA (Edwards et al., 2018; Sturm et al., 2015).
Structure of the transmembrane MtrB sheath.
Solubility of the Mtr complex in the lipidic outer membrane is conferred by MtrB, a hydrophobic
barrel comprised of 26 antiparallel -strands (Fig. 1A, Fig. 3). The interactions between MtrB and
MtrA allow MtrA to be positioned across the outer membrane while insulating the MtrA hemes
from the outer membrane environment, preventing non-specific reduction of membrane soluble
exogenous molecules such as oxygen, which could result in the generation of reactive oxygen
species that in turn lead to cellular damage (e.g. lipid peroxidation). The MtrB porin orients MtrA
so the heme chain is perpendicular to the membrane and electron transfer away from the cell is
optimised.
MtrB, with overall dimensions of approximately 70 55 45 Å, consists of tight turns on the
periplasmic face and surface loops extending ~ 45 Å on the extracellular side of the membrane.
The overall structure of MtrB is similar to that of other outer membrane secretion proteins (e.g Fig
3). For example, MtrB is approximately the same size as the 26-strand lipopolysaccharide
transporter LptD, and the 24-strand pilin subunit transporter FimD (Botos et al., 2016; Phan et al.,
2011) (Fig. 3). The amino acid composition of the extracellular loops gives the MtrB surface a
uniform negative charge. Structural modelling of the Shewanella oneidensis MR-1 porins MtrE
and DmsF reveals that while the negatively charged extracellular surfaces are conserved in the
MtrB protein family (Fig. 4), they are not observed in electrostatic surface maps of the
aforementioned FimD and LptD -barrel proteins (Fig. 3). Like MtrB, DmsF and MtrE are
components of outer membrane electron transport complexes that contain extracellular catalytic
domains, in these cases DmsAB and MtrF respectively (White et al., 2016). It is therefore likely
that for MtrB and its homologs these negatively charged residues help in the docking of the
extracellular catalytic domains, possibly by preventing the negatively charged Shewanella
lipopolysaccharide (Korenevsky et al., 2002) from binding to the external surface of the membrane
embedded porin:cytochrome complexes.
The aperture of the pore defined by MtrB is wider at the periplasmic face ( ~30 Å) than at the cell
exterior (~15 Å) where access to the outside is restricted by the folded surface loops (Fig. 3, Fig
5A). The pore is of sufficient size to allow folded MtrA (~ 80 30 35 Å) to insert into the
periplasmic opening of MtrB, but prevents MtrA from escaping to the cell exterior, effectively
trapping it inside MtrB. Thus, assembly of the full Mtr complex is dependent on ‘stalled’ excretion
of MtrA by MtrB, and association with MtrC that is translocated across the outer membrane by
the type 2 secretion system (Shi et al., 2008).
At the N-terminus of MtrB, the first four -strands are shorter than the following 22 strands.
Predicted to lie within the lipid bilayer, these shorter strands do not interact with MtrA and define
a small solvent channel that runs between MtrA and MtrB (Fig. 5B). The diameter of the
periplasmic facing side of the channel is ~ 5 Å, sufficient to allow free diffusion of water in and
out of the periplasmic facing side of MtrB. The channel is capped at the extracellular surface of
the outer membrane by a small -helix formed by the MtrB surface loop between -strands 1 and
2 (Figure 5C). This helix is stabilised by several hydrogen bonds, including two between Asn50
and the backbone of Tyr112 on -strand 5. The conserved Trp204 of MtrA is positioned underneath
the cap, and causes a bottleneck that restricts diffusion of charged and polar molecules from the
extracellular face of the channel. However, there are polar residues, Asn71 of MtrB, and Gln206
5
of MtrA, that could stabilise water molecules on either side of the channel and a charged residue
Asp107 that could participate in proton exchange. The role of this channel is unclear, but it may
allow for proton transport that has been suggested to occur through the Mtr complex during
anaerobic respiration (Okamoto et al., 2017).
The MtrC domain is oriented to maximise distribution of electrons to terminal acceptors.
At the cell surface, the surface loops of MtrB largely cover MtrA so that only MtrA residues 284
to 306 and heme A10 are presented for interaction with MtrC (Fig. 5D). Interprotein electron
transfer from heme A10 is facilitated by the positioning of MtrC heme C5 within an edge-edge
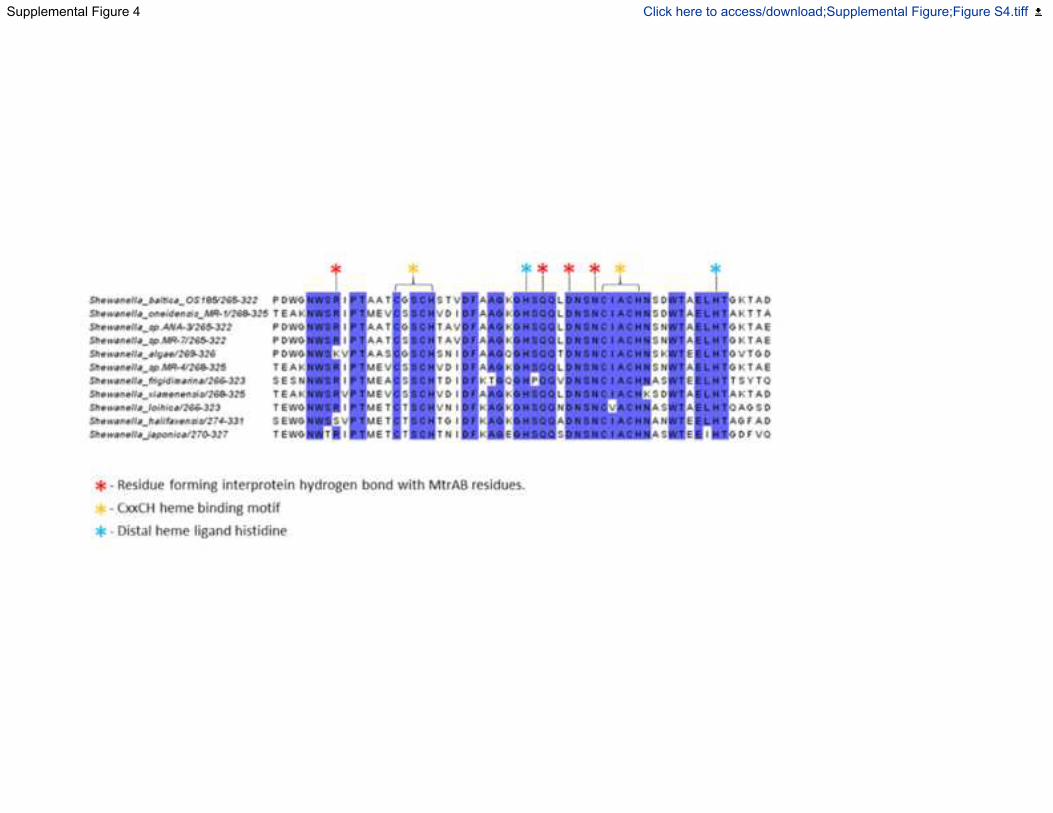
distance of 8 Å. The amino acid sequence around heme C5 is highly conserved within the MtrC
clade of outer membrane cytochromes (Fig. S4). This conserved sequence contains residues that
form hydrogen bonds with MtrAB, allowing association of MtrC to the surface of MtrAB. In the
absence of MtrC, the exposed edge of the heme A10 porphyrin indicates that reduction of
extracellular substrates by MtrAB should be possible and is consistent with previous studies that
showed MtrC knockout mutants of S. oneidensis were capable of reduction of soluble Fe(III)
chelates, but not of insoluble iron oxides (Coursolle and Gralnick, 2010).
To aid initial model building for the Mtr complex, an X-ray crystal structure was obtained for a
soluble form of S. baltica OS185 MtrC (MtrCsol). The structure of the monomeric MtrCsol was
similar to that of MtrC from S. oneidensis MR-1 described previously (Edwards et al., 2015).
MtrCsol consists of 4 domains: two split-beta barrel domains, domains I and III, and two alpha-
helical domains, domains II and IV. These domains serve as a scaffold for 10 bis-His coordinated
hemes arranged in a ‘staggered cross’ formation (Edwards et al., 2015). The three MtrCsol
monomers within the asymmetric unit of the crystal displayed domain I/II movements relative to
domains III/IV. These domain movements centred round a hinge region formed by residues 289-
300 located within the alpha-helix linking domains II and III. The location of the hinge-point
suggests this range of motion would not be restricted in the Mtr complex, giving conformational
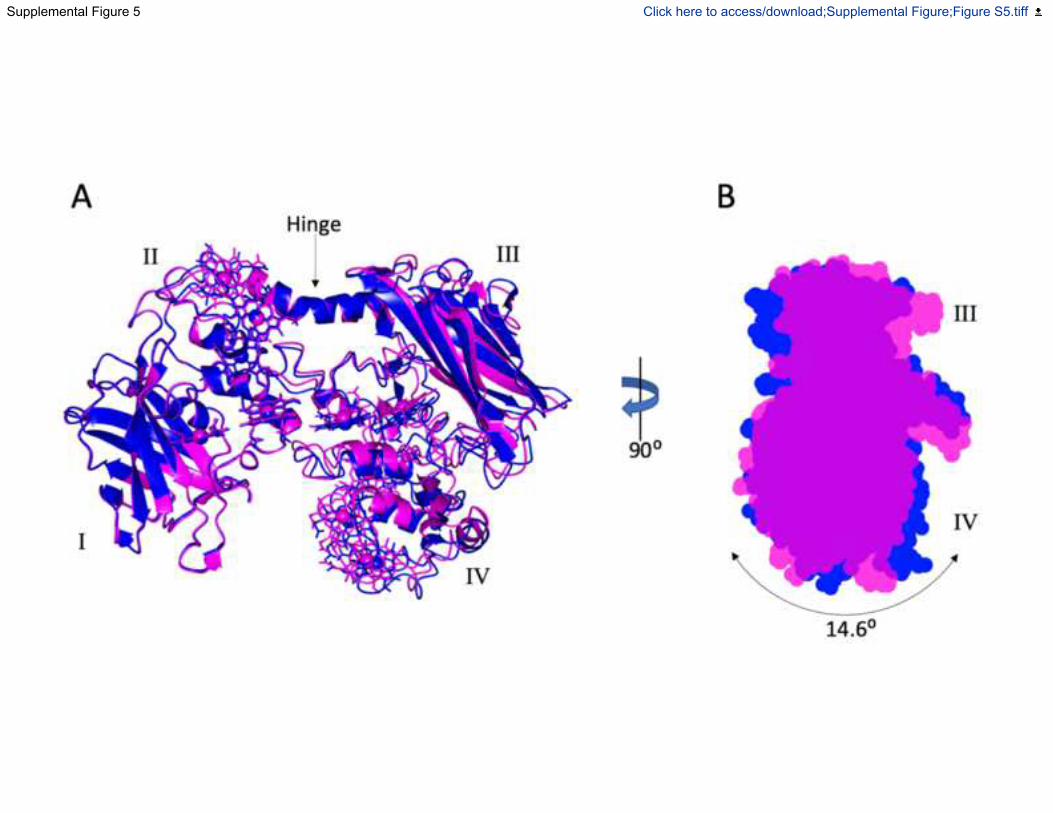
flexibility to MtrC. Analysis by DynDom (Hayward and Lee, 2002) showed a maximal rotation of
15 degrees (Fig. S5A) and that changes in relative orientation of hemes C1 and C6 were
accompanied by < 1 Å change in the edge-to-edge distance of the corresponding porphyrin rings.
(Fig. S5B).
In the Mtr complex MtrC is angled on the surface of MtrAB so that the more insulated side of
MtrC faces the membrane surface, while the negatively charged heme propionates face towards
the environment thereby providing a suitable surface for direct electron transfer to large
extracellular substrates (Fig. 1). Heme C10 is presented to the environment ~90 Å above the
hydrophobic bilayer core and is located close to the PTPTD amino acid sequence previously
identified as a possible hematite binding hydroxylated motif (Lower et al., 2008), therefore this
may be a primary route for direct electron transfer to insoluble substrates. Previously, modelling
of the electronic micro-environments of MtrC suggested that the net driving force between hemes
C5 and C10 is rather small, allowing for bi-directional electron transfer through the heme chain
formed by C5, C4, C3, C1, C6, C8, C9, C10 (Fig. 1B) (Barrozo et al., 2018). However, the redox
potentials of hemes C2 and C7 are higher than the other hemes, raising the possibility that these
hemes serve as both capacitors and junctions in an Mtr electrical circuit (Jiang et al., 2019). The
arrangement and orientation of MtrC on the surface therefore allows electrons to flow in from a
single heme, C5 and then be distributed across the surface of MtrC, with multiple hemes acting as
potential electron donor sites, thereby allowing electron transfer to both insoluble and soluble
electron acceptors. This arrangement of hemes within the Mtr complex also implies that electron
6
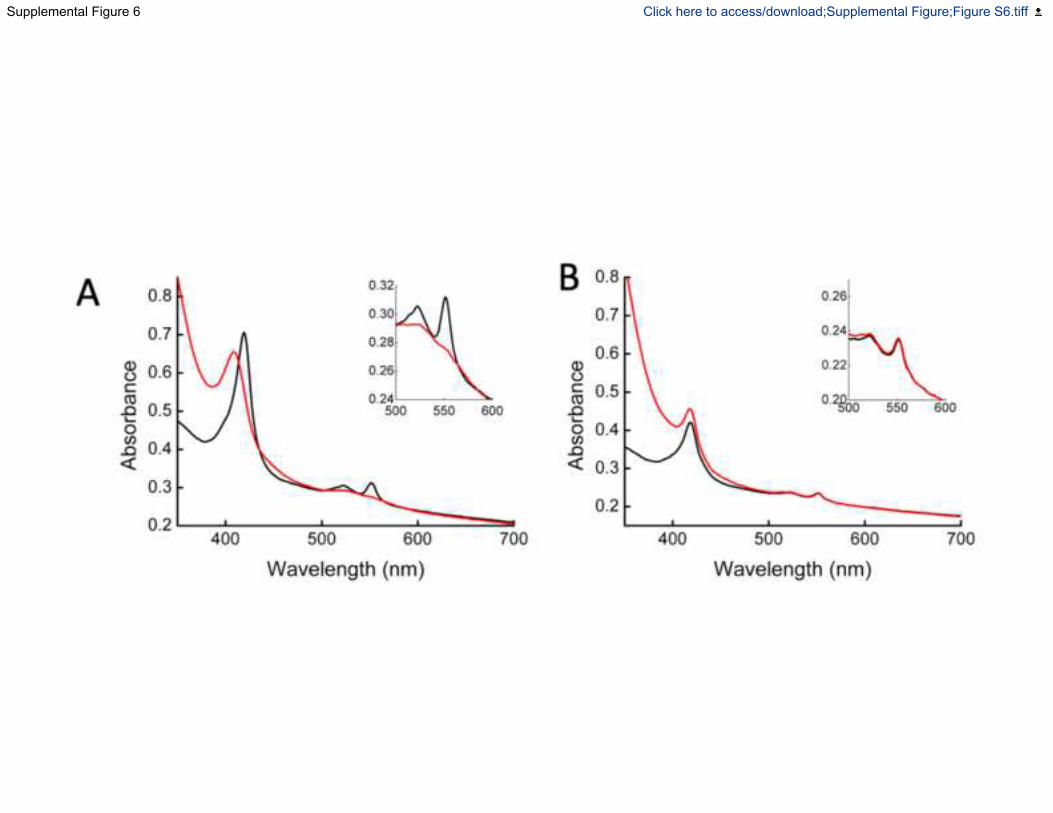
transport through the outer membrane would not be rate limiting during respiration. To support
this the redox state of the cytochrome pool in living S. oneidensis MR-1 cells was explored using
UV-visible spectroscopy to measure the spectrum of the cytochromes expressed in the periplasm
and on the cell surface. Addition of an extracellular acceptor, Fe(III)citrate, immediately oxidised
the cytochrome pool of S. oneidensis MR-1. However, the cytochrome pool of S. oneidensis
mutant lacking the mtr cluster remained reduced, demonstrating the role of the Mtr complex as a
gateway to the electrons that accumulate in the cytochromes of the S. oneidensis MR-1 periplasm
(Fig. S6).
Wider implications of the Mtr structure.
The crystal structure of the Mtr complex reveals how Gram-negative bacteria have evolved
insulated molecular wires for the movement of electrons across the outer membrane of the cell.
This evolution appears to have involved harnessing electron transferring cytochromes and outer
membrane secretory proteins. This core MtrAB electron conduit reveals how extracellular electron
transport, which is also widespread in both photoautotrophic and chemoautotrophic iron-oxidising
bacteria, can be accomplished efficiently.
Recently the structure of OmcS, an extracellular cytochrome from Geobacter sulferreducens PCA
was resolved (Wang et al., 2019). OmcS was revealed as a hexaheme cytochrome that assembled
into a polymeric cable containing a contiguous linear heme chain extending from the cell surface.
The contrast between the structures of OmcS and the surface exposed MtrC highlight the different
mechanisms used to transfer electrons to extracellular substrates, with Shewanella MtrC dispersing
electrons through a trifurcated heme arrangement, and Geobacter OmcS through a linear heme
chain with a single heme terminus. We note that a porin: cytochrome complex functionally similar
to Mtr has been identified in G. sulferreducens PCA (Liu et al., 2014). Thus, it is possible that this
complex transports electrons across the outer membrane of Geobacter and delivers them to the
OmcS polymer for subsequent long-range transport through the extracellular matrix.
Previous studies indicate the likely rate limiting step of electron transfer across a membrane by the
Mtr complex is electron transfer to/from the complex, rather than inter-heme electron exchange
(Richardson et al., 2012; White et al., 2016). The measured rate of 8,500 e s-1 for Mtr mediated
electron transfer in proteoliposomes from internalised reduced methyl viologen to extraliposomic
ferrihydrite represents a lower limit for electron flux through the complex (White et al., 2016), but
is far greater than the ~ 1 e MtrC-1 s-1 required to support anaerobic respiration (Ross et al., 2009).
The true rate of electron transfer from MtrA heme A1 to MtrC heme C10 is difficult to quantify,
due to the similar spectroscopic signatures of the 20 bis-histidine coordinated hemes within the
large Mtr complex. Computational analysis of MtrC by molecular simulation has suggested
electron transfer rates of 105 s-1 between heme C5 and heme C10 (Jiang et al., 2019). Assuming
the closely arranged hemes of MtrA support similar electron transfer rates then the likely
maximum rate of electron transfer across the Mtr complex is likely to be ~10-100 times greater
than those observed to date, and will likely require careful simulation and experimentation to
confirm.
7
Acknowledgments:
The authors are grateful to Andrea Hall (UEA) for experimental assistance, Liang Shi
(University of Wuhan) for providing strain S. oneidensis LS527, John Zachara and Jim
Fredrickson (Pacific Northwest National Laboratory) for useful discussion and providing S.
baltica OS185. The authors would also like to thank Diamond Light Source for beamtime
(proposal MX18565), and the staff of beamlines I23. I03, I04 for assistance with crystal testing
and data collection.
Author contributions: Conceptualization, TAC, DJR, MJE and JNB; Investigation, TAC, MJE,
and GFW; Formal analysis, TAC and MJE; Writing – Original Draft MJE andTAC; Writing,
Review and Editing, DJR, JNB, MJE and TAC; Funding Acquisition, DJR, TAC, MJE and JNB;
Supervision; TAC, JNB, DJR.
Declaration of Interests: The authors declare no competing interests.
Funding: This research was supported by the Biotechnology and Biological Sciences Research
Council grants BB/K009885/1, BB/L023733/1and BB/H007288/1.
Data and materials availability: X-ray crystallographic coordinates and structure factor files
are available from the PDB with the primary accession codes (6R2Q) and (6QYC) for S. baltica
Mtr complex and MtrC respectively.
Acronyms
FccA: Periplasmic fumarate reductase
SAXS: small angle X-ray scattering
STC: Small tetraheme cytochrome
8
Fig. 1. The x-ray crystal structure of the Mtr complex from S. baltica OS185. (A) Cartoon
views of the Mtr complex rotated by 90 degrees. The extracellular MtrC (blue) is associated with
the surface of the transmembrane porin MtrB (green). MtrA (magenta) is sheathed inside MtrB
with the N-terminal protruding from the periplasmic side. The predicted lipid bilayer position of
the Mtr complex is shown as red and blue discs representing extracellular and periplasmic faces
respectively (Lomize et al., 2012). (B) Heme network within the Mtr complex. Hemes are
numbered according to the position of the heme attachment motif within the amino acid chain
and colored blue (MtrC) or magenta (MtrA). See also Figure S1.
Fig. 2. Structural features of MtrA. (A) Cartoon of MtrA with hemes shown as sticks. Hemes
are numbered as in Figure 1. (B) Heme arrangement within MtrA. Minimum electron transfer
distances between the porphyrin rings of adjacent hemes. (C) Interactions between MtrA and
MtrB. The outline of MtrB is shown in green. Amino acid side chains forming hydrogen bonds
between MtrA and MtrB are shown as green (MtrB) or magenta (MtrA) sticks. Hydrogen bonds
are shown as yellow dashes. See also Figure S2 and S3
Fig. 3. Structure and comparison of the -barrel proteins FimD, LptD and MtrB (Top)
Electrostatic maps of the surfaces of each -barrel. (Middle and bottom) Side and bottom view of
each structure shown as cartoons with helices colored red, strands colored green and loops
colored yellow. Electrostatic surfaces generated using APBS in Pymol with potentials scaled
from -0.5 V (red, negatively charged) to +0.5 V (blue, positively charged).
Fig. 4. Electrostatic surface maps of molecular models of MtrB homologues from S.
oneidensis and S. Baltica. Homology models of MtrB homologues generated using Phyre2
(Kelley et al., 2015) with S. baltica OS185 MtrB as a template. Electrostatic surfaces calculated
using CCP4MG with potentials scaled from -0.5 V (red, negatively charged) to +0.5 V (blue,
positively charged).
Fig. 5: Structural properties of MtrAB porin cytochrome. (A) Change in radius of MtrB
central cavity from the periplasmic opening to the extracellular surface as measured using
CAVER (Pavelka et al., 2016) (B) Cartoon of the MtrAB helix-capped channel. The MtrB
channel (semi-transparent yellow) identified using CAVER. (C) The interface between MtrA
(magenta), MtrC (blue) and MtrB (green) with hemes A10, C10 and histidine ligands shown as
sticks. See also Figure S3 and S4.
9
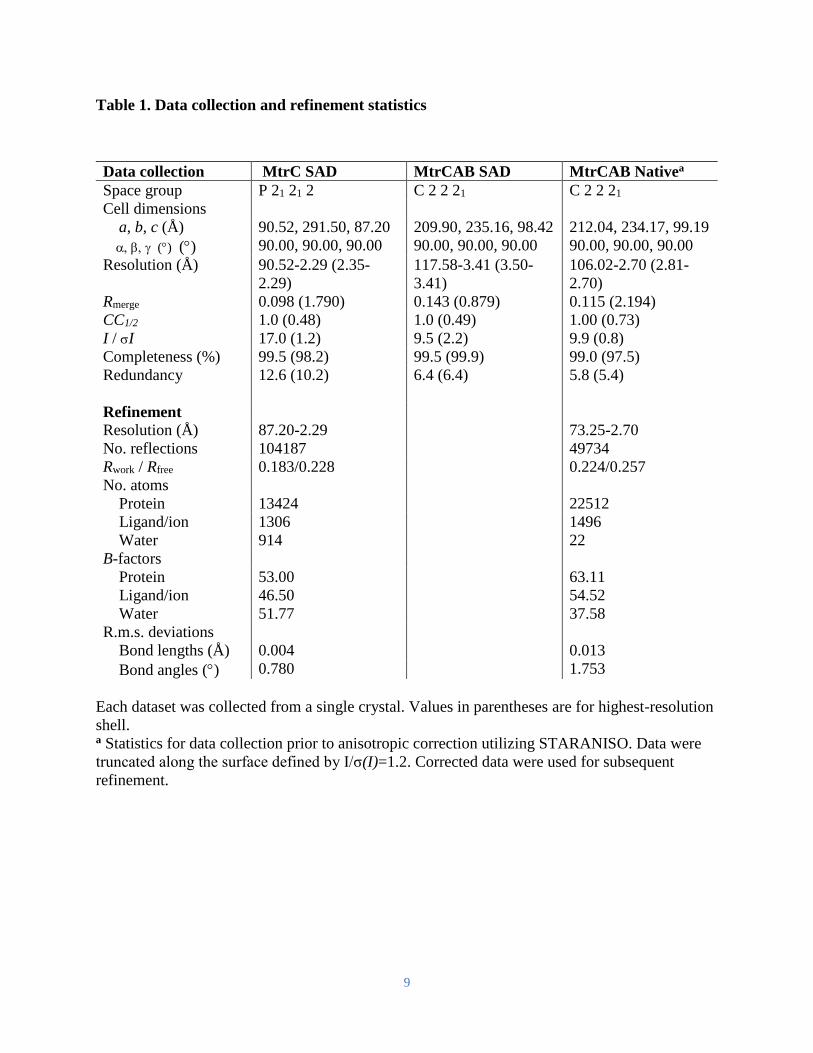
Table 1. Data collection and refinement statistics
Data collection MtrC SAD MtrCAB SAD MtrCAB Nativea
Space group P 21 21 2 C 2 2 21 C 2 2 21
Cell dimensions
a, b, c (Å) 90.52, 291.50, 87.20 209.90, 235.16, 98.42 212.04, 234.17, 99.19
() () 90.00, 90.00, 90.00 90.00, 90.00, 90.00 90.00, 90.00, 90.00
Resolution (Å) 90.52-2.29 (2.35-
2.29)
117.58-3.41 (3.50-
3.41)
106.02-2.70 (2.81-
2.70)
Rmerge 0.098 (1.790) 0.143 (0.879) 0.115 (2.194)
CC1/2 1.0 (0.48) 1.0 (0.49) 1.00 (0.73)
I / I 17.0 (1.2) 9.5 (2.2) 9.9 (0.8)
Completeness (%) 99.5 (98.2) 99.5 (99.9) 99.0 (97.5)
Redundancy 12.6 (10.2) 6.4 (6.4) 5.8 (5.4)
Refinement
Resolution (Å) 87.20-2.29 73.25-2.70
No. reflections 104187 49734
Rwork / Rfree 0.183/0.228 0.224/0.257
No. atoms
Protein 13424 22512
Ligand/ion 1306 1496
Water 914 22
B-factors
Protein 53.00 63.11
Ligand/ion 46.50 54.52
Water 51.77 37.58
R.m.s. deviations
Bond lengths (Å) 0.004 0.013
Bond angles () 0.780 1.753
Each dataset was collected from a single crystal. Values in parentheses are for highest-resolution
shell. a Statistics for data collection prior to anisotropic correction utilizing STARANISO. Data were
truncated along the surface defined by I/σ(I)=1.2. Corrected data were used for subsequent
refinement.
10
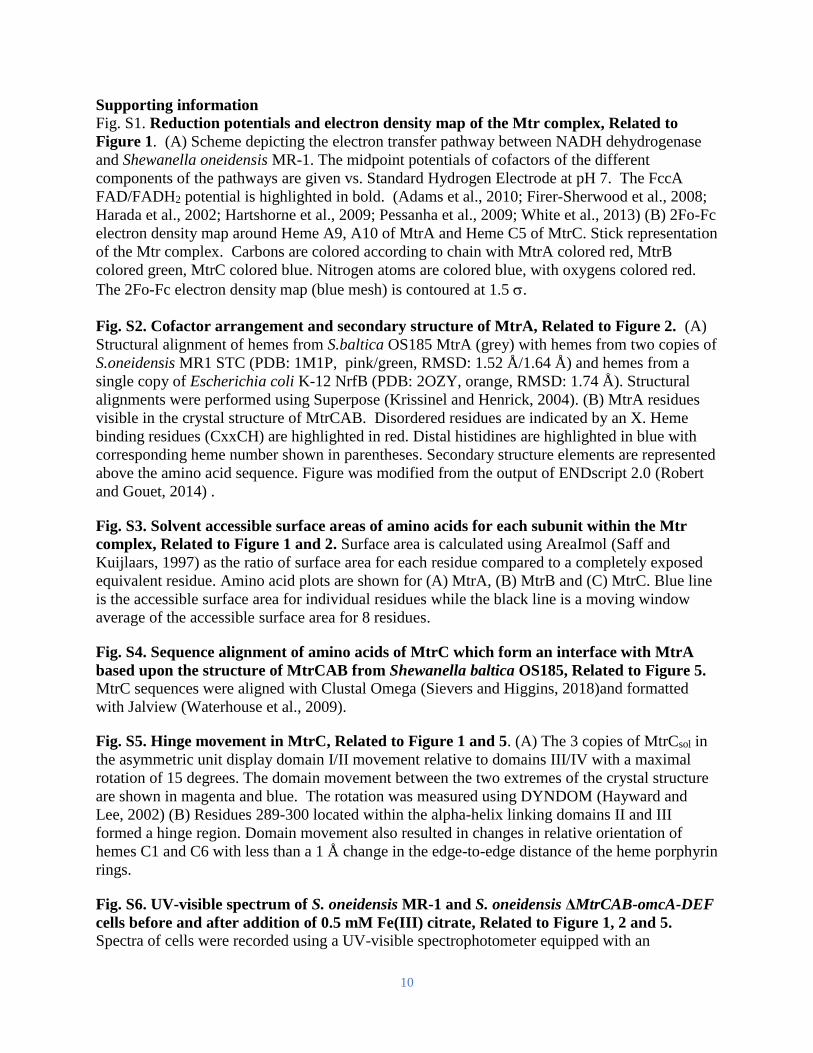
Supporting information
Fig. S1. Reduction potentials and electron density map of the Mtr complex, Related to
Figure 1. (A) Scheme depicting the electron transfer pathway between NADH dehydrogenase
and Shewanella oneidensis MR-1. The midpoint potentials of cofactors of the different
components of the pathways are given vs. Standard Hydrogen Electrode at pH 7. The FccA
FAD/FADH2 potential is highlighted in bold. (Adams et al., 2010; Firer-Sherwood et al., 2008;
Harada et al., 2002; Hartshorne et al., 2009; Pessanha et al., 2009; White et al., 2013) (B) 2Fo-Fc
electron density map around Heme A9, A10 of MtrA and Heme C5 of MtrC. Stick representation
of the Mtr complex. Carbons are colored according to chain with MtrA colored red, MtrB
colored green, MtrC colored blue. Nitrogen atoms are colored blue, with oxygens colored red.
The 2Fo-Fc electron density map (blue mesh) is contoured at 1.5 .
Fig. S2. Cofactor arrangement and secondary structure of MtrA, Related to Figure 2. (A)
Structural alignment of hemes from S.baltica OS185 MtrA (grey) with hemes from two copies of
S.oneidensis MR1 STC (PDB: 1M1P, pink/green, RMSD: 1.52 Å/1.64 Å) and hemes from a
single copy of Escherichia coli K-12 NrfB (PDB: 2OZY, orange, RMSD: 1.74 Å). Structural
alignments were performed using Superpose (Krissinel and Henrick, 2004). (B) MtrA residues
visible in the crystal structure of MtrCAB. Disordered residues are indicated by an X. Heme
binding residues (CxxCH) are highlighted in red. Distal histidines are highlighted in blue with
corresponding heme number shown in parentheses. Secondary structure elements are represented
above the amino acid sequence. Figure was modified from the output of ENDscript 2.0 (Robert
and Gouet, 2014) .
Fig. S3. Solvent accessible surface areas of amino acids for each subunit within the Mtr
complex, Related to Figure 1 and 2. Surface area is calculated using AreaImol (Saff and
Kuijlaars, 1997) as the ratio of surface area for each residue compared to a completely exposed
equivalent residue. Amino acid plots are shown for (A) MtrA, (B) MtrB and (C) MtrC. Blue line
is the accessible surface area for individual residues while the black line is a moving window
average of the accessible surface area for 8 residues.
Fig. S4. Sequence alignment of amino acids of MtrC which form an interface with MtrA
based upon the structure of MtrCAB from Shewanella baltica OS185, Related to Figure 5.
MtrC sequences were aligned with Clustal Omega (Sievers and Higgins, 2018)and formatted
with Jalview (Waterhouse et al., 2009).
Fig. S5. Hinge movement in MtrC, Related to Figure 1 and 5. (A) The 3 copies of MtrCsol in
the asymmetric unit display domain I/II movement relative to domains III/IV with a maximal
rotation of 15 degrees. The domain movement between the two extremes of the crystal structure
are shown in magenta and blue. The rotation was measured using DYNDOM (Hayward and
Lee, 2002) (B) Residues 289-300 located within the alpha-helix linking domains II and III
formed a hinge region. Domain movement also resulted in changes in relative orientation of
hemes C1 and C6 with less than a 1 Å change in the edge-to-edge distance of the heme porphyrin
rings.
Fig. S6. UV-visible spectrum of S. oneidensis MR-1 and S. oneidensis ΔMtrCAB-omcA-DEF
cells before and after addition of 0.5 mM Fe(III) citrate, Related to Figure 1, 2 and 5.
Spectra of cells were recorded using a UV-visible spectrophotometer equipped with an

11
integrating sphere to minimise light scatter from cells. The spectrum of S. oneidensis cells
incubated anaerobically in the presence of 50 mM formate showed spectral features consistent
with reduced c-type cytochromes, which are assembled within the periplasm (A, black line).
After addition of Fe(III)citrate to the cells, the spectrum changes consistent with the hemes
within the cells being fully oxidised in the presence of an electron acceptor (A, red line). The
spectrum of S. oneidensis strain lacking the mtrCAB gene cluster did not change before (B, black
line) or after addition of Fe(III)citrate (B, red line).
12
STAR Methods
LEAD CONTACT AND MATERIALS AVAILABILITY
Further information and requests for resources and reagents should be directed to and will be
fulfilled by the lead contact Tom Clarke ([email protected]). All unique/stable reagents
generated in this study are available from the Lead Contact with a completed Materials Transfer
Agreement.
EXPERIMENTAL MODEL AND SUBJECT DETAILS
Shewanella baltica OS185, Shewanella oneidensis MR-1 (ATCC 700550) and Shewanella
oneidensis MR-1LS527 (∆mtrB-mtrD, locus tags SO_1776-SO_1782) were obtained from our
laboratory culture collection.
To obtain biomass for Shewanella baltica OS185, 20 litres of LB media supplemented with
20 mM Fe(III)citrate, 50 mM sodium lactate pH 7.8 were inoculated with 2 ml of S. baltica OS185,
grown aerobically overnight in LB, per litre of media and incubated for 24 hours at 30 0C, shaking
at 180 rpm. Cells were harvested by centrifugation at 6000 g at 4 0C for 20 minutes and resuspended
in 20 mM HEPES pH 7.8 in final volume of ~ 350 ml.
A soluble S. baltica MtrC construct, MtrCsol, was synthesised (Eurofins genomics) with
codon-optimisation for expression in Shewanella oneidensis MR-1. The soluble construct was
generated by replacing the N-terminal signal peptide and lipid-anchor attachment site of MtrC
(S.baltica OS185) (residues 1-26) with the N-terminal signal peptide of MtrB from S. oneidensis
MR-1 (residues 1-24). The MtrCsol construct was then cloned into a pBAD-202D TOPO vector,
utilizing the topo cloning site whilst introducing a stop codon and a ribosome binding site before
the start codon of the MtrCsol gene, in order to prevent fusion to a his-patch thiredoxin sequence
present in the vector, to give vector pMJE001. Plasmid pMJE001 was transformed into
S.oneidensis LS527 by electroporation to give ME001.
METHOD DETAILS
Purification of the S. baltica Mtr complex
S. baltica OS185 cells were lysed by two passages through a French Pressure system at 16,000
psi. Cell debris was removed by centrifugation at 5000 g for 20 minutes at 4 0C and bacterial cell
membranes were isolated by centrifugation at 185,000 g at 4 0C for 2 hours. Membranes were
washed by resuspending in 20 mM HEPES pH 7.8 to a final volume of ~ 300 ml and stirred at 4 0C overnight. L-lauroylsarcosine was added to a final concentration of 2% w/v and stirred for 1
hour at 4 0C to preferentially solubilise the inner membrane. The soluble fraction was separated by
centrifugation at 185,000 g, 4 0C for 2 hours and discarded. The pelleted outer membranes were
then solubilised by resuspending in 20 mM HEPES pH 7.8, 5% Triton X-100 (v/v) to a volume of
~ 300 ml and stirred overnight at 4 0C.
The solublised membranes were then centrifuged at 185,000 g, 4 0C for 2 hrs. The soluble
fraction was loaded onto a 150 ml Q-sepharose column pre-equilibrated with 20 mM HEPES pH
13
7.8, 2% Triton X-100 (v/v) (buffer A). The column was washed with 2 column volumes of buffer
A. Protein was eluted with a gradient of 0 - 0.5 M NaCl in buffer A over 850 ml collecting 11 ml
fractions. Heme containing fractions were analysed by SDS-PAGE and fractions containing the
Mtr complex were pooled and diluted 3-fold with buffer A before being loaded onto a 10 ml Q-
sepharose column pre-equilibrated with buffer A. The column was washed with 10 column
volumes of 20 mM HEPES pH 7.8, 5 mM LDAO. The protein was then eluted with 20 mM HEPES
pH 7.8, 5 mM LDAO, 0.5 M NaCl.
Protein was concentrated to ~15 ml using a 100 kDa molecular weight cutoff centrifugal
concentrator (vivaspin). The concentrated protein was applied to a Superdex S200 26/60 size-
exclusion column pre-equilibrated with 20 mM HEPES pH 7.8, 150 mM NaCl, 5 mM LDAO. 2
ml fractions were collected across the elution peaks and analysed by SDS-PAGE. Pure MtrCAB
fractions from each size-exclusion column run were pooled and concentrated to ~18 mg/ml. The
protein was dialysed against 500 ml of 20 mM HEPES pH 7.8, 100 mM NaCl + 5 mM LDAO
overnight at 4 0C using 50 kDa molecular weight cutoff dispo-dialysers (Havard Apparatus).
Protein was aliquoted into ~200 µl aliquots and snap frozen in liquid nitrogen before storing at -
80 0C.
Purification of S. baltica OS185 MtrCsol
4 x 1 litre of Terrific Broth media containing 30 µg/ml kanamycin were inoculated with 2 ml
/ litre of an overnight culture of ME001 and incubated at 30 0C, shaking at 180 rpm, to an OD600
~0.5. L-arabinose was added to a final concentration of 2 mM and cultures were incubated
overnight 30 0C, shaking at 180 rpm. Growth cultures were centrifuged at 6000 x g to remove cells
and the remaining media was concentrated to ~ 400 ml utilizing a Vivaflow 200 concentrator with
a 30 kDa molecular weight cut-off membrane. The concentrate was dialysed against 5 litres of 20
mM HEPES pH 7.8 overnight at 4 0C before replacing the buffer with another 5 litres of the same
buffer for a further 24 hours. The dialysed protein was loaded onto a ~300 ml DEAE column pre-
equilibrated with 20 mM HEPES pH 7.8. The column was washed with 20 mM HEPES pH 7.8
until a stable baseline was obtained and the protein was eluted with a 0-0.5 M NaCl gradient over
850 ml, collecting 11 ml fractions.
Heme containing fractions were analysed by SDS-PAGE and MtrC containing fractions were
pooled and concentrated using a 30 kDa molecular weight cut off spin concentrator (Vivaspin,
Sartorius) to ~20 ml. The concentrate was split into 4 equal 5 ml aliquots and purified by size
exclusion chromatography utilizing a Superdex 200 26/60 column equilibrated with 20 mM
HEPES pH 7.8 + 150 mM NaCl. Fractions were analysed by SDS-PAGE and fractions containing
highly pure MtrC were pooled and concentrated to ~20 mg/ml utilizing a 10 kDa molecular weight
cut off centrifugal concentrator (Vivaspin, Sartorius).
Structure determination of S. baltica MtrCsol
Crystals of MtrC were obtained from a sitting-drop vapour diffusion setup with 0.4 M sodium
acetate pH 4.5 + 5% PEG 6000 + 5% PEG 8000 + 5% PEG 10000 as the reservoir solution.
Crystals formed in both 1:1 and 2:1 (reservoir: protein) drops with a total drop volume of 0.6 μl.
Crystals were cryo-protected by briefly transferring to a solution of 0.4 M sodium acetate pH 4.5
14
+ 5% PEG 6000 + 5% PEG 8000 + 5% PEG 10000 + 25% ethylene glycol before being vitrified
by plunging into liquid nitrogen.
Data were collected at beamline I04 at Diamond Light Source (Table S1). Crystals were of
spacegroup P21212 with typical cell dimensions of a=90.52 Å b=291.50 Å c=87.20 Å. Data were
collected at the Fe k-edge, utilizing a wavelength of 1.72 Å, to a final resolution of 2.3 Å. The
CRANK2 pipeline was utilized to locate 30 iron atoms, corresponding to the 3 copies of MtrC in
the asymmetric unit, provide initial phases and build a partial model (Skubak and Pannu, 2013). A
final model was generated through alternating rounds of manual model building with COOT and
refinement with REFMAC (Emsley et al., 2010; Winn et al., 2003). Final model was refined to
an Rcryst (Rfree) value of 0.183(0.228) and has no residues in the disallowed region of the
Ramachandran plot (Table S1). Coordinates have been deposited in the RCSB Protein Data Bank
under accession code 6QYC.
Structure determination of S. baltica MtrCAB
Crystals of the Mtr complex of S. baltica OS185 were obtained from two distinct conditions,
with the second condition only being obtained from cross-seeding using a seed-stock derived from
the first condition. Mtr complex seed-stock crystals were obtained from a sitting-drop vapour
diffusion setup in SWISSCI 96-well 2-drop MRC crystallization plates with 50 µl 0.1 M glycine
pH 8.5 + 0.3 M trimethanolamine oxide + 12% PEG 2000 MME as the reservoir solution. Crystals
formed in both 1:1 and 2:1 (reservoir: protein) drops with a total drop volume of 0.6 μl. These
crystals diffracted to ~5.5 Å resolution and were of spacegroup P321 with typical cell dimensions
of a = 210.52 Å, b = 252.21 Å, c = 209.99 Å. Crystals from each drop were crushed and
resuspended in their corresponding reservoir solution (~40 µl) in order to prepare the seed stock.
Optimised crystals of the Mtr complex were obtained from a sitting-drop vapour diffusion setup
in Swissci 96-well 2-drop MRC crystallization plates with 50 µl 0.1 M bis-tris pH 5.0 + 0.01 M
LDAO + 0.4 M CaCl2 + 40% MPD as the reservoir solution. Crystals were obtained with both a
0.3:0.2:0.1 and a 0.2:0.3:0.1 protein: reservoir: seed ratio with a final drop volume of 1.2 µl.
Crystals did not require further cryo-protection and were vitrified by plunging into liquid nitrogen.
Data were collected at beamline I03 at Diamond Light Source (Table S1). Crystals were of
spacegroup C2221 with typical cell dimensions of a = 201.150 Å, b = 236.895 Å, c = 98.922 Å.
Data were collected at a wavelength of 1.74Å (Fe k-edge) to a resolution of 3.41 Å. 20 Fe-atoms
corresponding to the 20 c-type hemes of a single Mtr complex were located using the
CRANK2 pipeline which produced phased electron density maps of sufficient quality to build an
initial model (Skubak and Pannu, 2013). Native data were collected at a wavelength of 0.98 Å to
a final resolution of 2.70 Å resolution. Anisotropy correction of the raw data set was performed
using STARANISO (Vonrhein et al., 2018)with a surface threshold of 1.2/σ(I), implemented
through the autoPROC pipeline. Anisotropy corrected data were used for model-building and
refinement. A complete model of the Mtr complex was built through alternating rounds of manual
model building into refined electron density maps with COOT and refinement with Phenix (Adams
et al., 2010) (Fig. S1).
The final model was refined to an Rcryst (Rfree) value of 0.224 (0.257) and has 12 residues
(<0.8%) in the disallowed region of the Ramachandran plot (Table S1). Coordinates have been
deposited in the RCSB Protein Data Bank under accession code 6R2Q. Structures and maps in
15
figures were rendered with either PyMOL (The PyMOL Molecular Graphics System, v.2.0,
Schrödinger) or CCP4MG (McNicholas et al., 2011).
Spectrophotometric analysis
Shewanella Basal Medium with fumarate as an electron acceptor (SBM+) . For 1 litre NH4Cl (0.46
g), K2HPO4 (0.225 g), KH2PO4 (0.225 g), MgSO4 (0.117 g) were dissolved in 500 ml water. 23.83
g HEPES, 6.40 g sodium fumarate and 1.2 ml lactic acid were added and water added to give 1
litre final volume. The pH of the media was adjusted to pH 7.2 with NaOH and sterilised by
autoclaving prior to the addition of 5 ml/l of filter sterilised casamino acids (0.1 g/ml), 5 ml/l of
filter sterilised mineral mix and 5 ml/l filter sterilised vitamin mix.
To prepare 1 litre of mineral mix, Nitrilotriacetic acid (1.5 g), MnCl2 (0.1 g), FeSO4 (0.3 g), CoCl2
(0.17 g), ZnCl2 (0.1 g), CuSO4 (0.04 g), AlK(SO4)2 (0.005 g), Na2MoO4 (0.09 g), NiCl2 (0.12 g),
NaWO4 (0.02 g), Na2SeO4 (0.1 g), H3BO3 (0.005 g) were dissolved in 1 litre of water and filter
sterilised.
To prepare 1 litre of vitamin mix, Biotin (0.002 g), Folic acid (0.002 g), Pyridoxine HCl (0.02 g),
Thiamine (0.005 g), Nicotinic acid (0.005 g), Pantothenic acid (0.005 g), Vitamin B12 (0.0001 g),
p-aminobenzoic acid (0.005 g), Thiotic acid (0.005 g) was dissolved in 1 litre of water and filter
sterilised.
10 ml aliquots of SBM+ were transferred to 25 ml sterile containers followed by addition of
100 μl of culture containing S. oneidensis MR-1 or S. oneidensis LS527 (∆mtrB-mtrD, locus tags
SO_1776-SO_1782) grown overnight in LB under aerobic conditions. The Shewanella in SBM+
cultures were incubated at 28 °C with shaking at 150 rpm overnight. 3 ml aliquots from this culture
were transferred to 50 ml sterile containers and sufficient fresh SBM+ added to completely fill the
tubes. These were closed with an airtight seal and incubated at 28°C overnight without shaking.
The anaerobic cultures were centrifuged at 5,000 rpm for 30 mins and the closed tubes transferred
to an anaerobic glove box where all the following steps were performed. The supernatant was
decanted, and the cell pellets suspended in anaerobic 20 mM HEPES pH 7.6 buffer. The cell
suspensions were centrifuged and suspended in anaerobic 20 mM HEPES pH 7.6 buffer twice
more before aliquots were transferred to 1 cm pathlength quartz cuvettes. Anaerobic Fe(III)citrate
was injected into the cells to 0.5 mM final concentration using a Hamilton syringe. In order to
minimize the effects of background scatter from the cell suspensions, absorbance scans were
performed in anaerobically sealed cuvettes using a Hitachi U-4100 spectrophotometer fitted with
an integrating sphere.
QUANTIFICATION AND STATISTICAL ANALYSIS
Quantification and statistical analyses employed in this publication pertain to the analysis and
determination of structures by x-ray crystallographic data, which are integral parts of existing
algorithms and software used.
16
DATA AND CODE AVAILABILITY
X-ray crystallographic coordinates and structure factor files are available from the RCSB PDB
with the primary accession codes (6R2Q) and (6QYC) for S. baltica Mtr complex and MtrC
respectively.
References:
Adams, P.D., Afonine, P.V., Bunkoczi, G., Chen, V.B., Davis, I.W., Echols, N., Headd, J.J.,
Hung, L.W., Kapral, G.J., Grosse-Kunstleve, R.W., et al. (2010). PHENIX: a comprehensive
Python-based system for macromolecular structure solution. Acta Crystallographica Section D-
Structural Biology 66, 213-221.
Barrozo, A., El-Naggar, M.Y., and Krylov, A.I. (2018). Distinct Electron Conductance Regimes
in Bacterial Decaheme Cytochromes. Angew Chem Int Edit 57, 6805-6809.
Beblawy, S., Bursac, T., Paquete, C., Louro, R., Clarke, T.A., and Gescher, J. (2018).
Extracellular reduction of solid electron acceptors by Shewanella oneidensis. Mol Microbiol 109,
571-583.
Botos, I., Majdalani, N., Mayclin, S.J., McCarthy, J.G., Lundquist, K., Wojtowicz, D., Barnard,
T.J., Gumbart, J.C., and Buchanan, S.K. (2016). Structural and Functional Characterization of
the LPS Transporter LptDE from Gram-Negative Pathogens. Structure 24, 965-976.
Bursac, T., Gralnick, J.A., and Gescher, J. (2017). Acetoin production via unbalanced
fermentation in Shewanella oneidensis. Biotechnol Bioeng 114, 1283-1289.
Clarke, T.A., Cole, J.A., Richardson, D.J., and Hemmings, A.M. (2007). The crystal structure of
the pentahaem c-type cytochrome NrfB and characterization of its solution-state interaction with
the pentahaem nitrite reductase NrfA. Biochem J 406, 19-30.
Clarke, T.A., Dennison, V., Seward, H.E., Burlat, B., Cole, J.A., Hemmings, A.M., and
Richardson, D.J. (2004). Purification and spectropotentiometric characterization of Escherichia
coli NrfB, a decaheme homodimer that transfers electrons to the decaheme periplasmic nitrite
reductase complex. J Biol Chem 279, 41333-41339.
Coursolle, D., and Gralnick, J.A. (2010). Modularity of the Mtr respiratory pathway of
Shewanella oneidensis strain MR-1. Mol Microbiol 77, 995-1008.
Edwards, M.J., White, G.F., Lockwood, C.W., Lawes, M.C., Martel, A., Harris, G., Scott, D.J.,
Richardson, D.J., Butt, J.N., and Clarke, T.A. (2018). Structural modeling of an outer membrane
electron conduit from a metal-reducing bacterium suggests electron transfer via periplasmic
redox partners. J Biol Chem 293, 8103-8112.
Edwards, M.J., White, G.F., Norman, M., Tome-Fernandez, A., Ainsworth, E., Shi, L.,
Fredrickson, J.K., Zachara, J.M., Butt, J.N., Richardson, D.J., et al. (2015). Redox Linked Flavin
Sites in Extracellular Decaheme Proteins Involved in Microbe-Mineral Electron Transfer. Sci
Rep-Uk 5.
Emsley, P., Lohkamp, B., Scott, W.G., and Cowtan, K. (2010). Features and development of
Coot. Acta Crystallogr D 66, 486-501.
Firer-Sherwood, M., Pulcu, G.S., and Elliott, S.J. (2008). Electrochemical interrogations of the
Mtr cytochromes from Shewanella: opening a potential window. J Biol Inorg Chem 13, 849-854.
Firer-Sherwood, M.A., Ando, N., Drennan, C.L., and Elliott, S.J. (2011). Solution-based
structural analysis of the decaheme cytochrome, MtrA, by small-angle X-ray scattering and
analytical ultracentrifugation. J Phys Chem B 115, 11208-11214.
17
Fredrickson, J.K., Romine, M.F., Beliaev, A.S., Auchtung, J.M., Driscoll, M.E., Gardner, T.S.,
Nealson, K.H., Osterman, A.L., Pinchuk, G., Reed, J.L., et al. (2008). Towards environmental
systems biology of Shewanella. Nat Rev Microbiol 6, 592-603.
Harada, E., Kumagai, J., Ozawa, K., Imabayashi, S., Tsapin, A.S., Nealson, K.H., Meyer, T.E.,
Cusanovich, M.A., and Akutsu, H. (2002). A directional electron transfer regulator based on
heme-chain architecture in the small tetraheme cytochrome c from Shewanella oneidensis. FEBS
Lett 532, 333-337.
Hartshorne, R.S., Jepson, B.N., Clarke, T.A., Field, S.J., Fredrickson, J., Zachara, J., Shi, L.,
Butt, J.N., and Richardson, D.J. (2007). Characterization of Shewanella oneidensis MtrC: a cell-
surface decaheme cytochrome involved in respiratory electron transport to extracellular electron
acceptors. J Biol Inorg Chem 12, 1083-1094.
Hartshorne, R.S., Reardon, C.L., Ross, D., Nuester, J., Clarke, T.A., Gates, A.J., Mills, P.C.,
Fredrickson, J.K., Zachara, J.M., Shi, L., et al. (2009). Characterization of an electron conduit
between bacteria and the extracellular environment. Proc Natl Acad Sci U S A 106, 22169-
22174.
Hayward, S., and Lee, R.A. (2002). Improvements in the analysis of domain motions in proteins
from conformational change: DynDom version 1.50. J Mol Graph Model 21, 181-183.
Jiang, X., Burger, B., Gajdos, F., Bortolotti, C., Futera, Z., Breuer, M., and Blumberger, J.
(2019). Kinetics of trifurcated electron flow in the decaheme bacterial proteins MtrC and MtrF.
Proc Natl Acad Sci U S A 116, 3425-3430.
Jiang, X.Y., Futera, Z., Ali, M.E., Gajdos, F., von Rudorff, G.F., Carof, A., Breuer, M., and
Blumberger, J. (2017). Cysteine Linkages Accelerate Electron Flow through Tetra-Heme Protein
STC. J Am Chem Soc 139, 17237-17240.
Kelley, L.A., Mezulis, S., Yates, C.M., Wass, M.N., and Sternberg, M.J.E. (2015). The Phyre2
web portal for protein modeling, prediction and analysis. Nat Protoc 10, 845-858.
Korenevsky, A.A., Vinogradov, E., Gorby, Y., and Beveridge, T.J. (2002). Characterization of
the lipopolysaccharides and capsules of Shewanella spp. Appl Environ Microbiol 68, 4653-4657.
Krissinel, E., and Henrick, K. (2004). Secondary-structure matching (SSM), a new tool for fast
protein structure alignment in three dimensions. Acta Crystallogr D Biol Crystallogr 60, 2256-
2268.
Leys, D., Meyer, T.E., Tsapin, A.S., Nealson, K.H., Cusanovich, M.A., and Van Beeumen, J.J.
(2002). Crystal structures at atomic resolution reveal the novel concept of "electron-harvesting"
as a role for the small tetraheme cytochrome c. J Biol Chem 277, 35703-35711.
Liu, Y., Wang, Z., Liu, J., Levar, C., Edwards, M.J., Babauta, J.T., Kennedy, D.W., Shi, Z.,
Beyenal, H., Bond, D.R., et al. (2014). A trans-outer membrane porin-cytochrome protein
complex for extracellular electron transfer by Geobacter sulfurreducens PCA. Environ Microbiol
Rep 6, 776-785.
Lomize, M.A., Pogozheva, I.D., Joo, H., Mosberg, H.I., and Lomize, A.L. (2012). OPM database
and PPM web server: resources for positioning of proteins in membranes. Nucleic Acids Res 40,
D370-376.
Lovley, D.R. (2012). Electromicrobiology. Annu Rev Microbiol 66, 391-409.
Lower, B.H., Lins, R.D., Oestreicher, Z., Straatsma, T.P., Hochella, M.F., Shi, L.A., and Lower,
S.K. (2008). In vitro evolution of a peptide with a hematite binding motif that may constitute a
natural metal-oxide binding archetype. Environ Sci Technol 42, 3821-3827.
McNicholas, S., Potterton, E., Wilson, K.S., and Noble, M.E.M. (2011). Presenting your
structures: the CCP4mg molecular-graphics software. Acta Crystallographica Section D-
Structural Biology 67, 386-394.
18
Okamoto, A., Tokunou, Y., Kalathil, S., and Hashimoto, K. (2017). Proton Transport in the
Outer-Membrane Flavocytochrome Complex Limits the Rate of Extracellular Electron
Transport. Angew Chem Int Edit 56, 9082-9086.
Pavelka, A., Sebestova, E., Kozlikova, B., Brezovsky, J., Sochor, J., and Damborsky, J. (2016).
CAVER: Algorithms for Analyzing Dynamics of Tunnels in Macromolecules. Ieee Acm T
Comput Bi 13, 505-517.
Pessanha, M., Rothery, E.L., Miles, C.S., Reid, G.A., Chapman, S.K., Louro, R.O., Turner, D.L.,
Salgueiro, C.A., and Xavier, A.V. (2009). Tuning of functional heme reduction potentials in
Shewanella fumarate reductases. Biochim Biophys Acta 1787, 113-120.
Phan, G., Remaut, H., Wang, T., Allen, W.J., Pirker, K.F., Lebedev, A., Henderson, N.S.,
Geibel, S., Volkan, E., Yan, J., et al. (2011). Crystal structure of the FimD usher bound to its
cognate FimC-FimH substrate. Nature 474, 49-53.
Rabaey, K., and Rozendal, R.A. (2010). Microbial electrosynthesis - revisiting the electrical
route for microbial production. Nat Rev Microbiol 8, 706-716.
Richardson, D.J., Butt, J.N., Fredrickson, J.K., Zachara, J.M., Shi, L., Edwards, M.J., White, G.,
Baiden, N., Gates, A.J., Marritt, S.J., et al. (2012). The porin-cytochrome' model for microbe-to-
mineral electron transfer. Mol Microbiol 85, 201-212.
Robert, X., and Gouet, P. (2014). Deciphering key features in protein structures with the new
ENDscript server. Nucleic Acids Research 42, W320-W324.
Ross, D.E., Brantley, S.L., and Tien, M. (2009). Kinetic characterization of OmcA and MtrC,
terminal reductases involved in respiratory electron transfer for dissimilatory iron reduction in
Shewanella oneidensis MR-1. Appl Environ Microbiol 75, 5218-5226.
Saff, E.B., and Kuijlaars, A.B.J. (1997). Distributing many points on a sphere. Math Intell 19, 5-
11.
Shi, L., Deng, S., Marshall, M.J., Wang, Z.M., Kennedy, D.W., Dohnalkova, A.C., Mottaz,
H.M., Hill, E.A., Gorby, Y.A., Beliaev, A.S., et al. (2008). Direct involvement of type II
secretion system in extracellular translocation of Shewanella oneidensis outer membrane
cytochromes MtrC and OmcA. J Bacteriol 190, 5512-5516.
Shi, L., Dong, H., Reguera, G., Beyenal, H., Lu, A., Liu, J., Yu, H.Q., and Fredrickson, J.K.
(2016). Extracellular electron transfer mechanisms between microorganisms and minerals. Nat
Rev Microbiol 14, 651-662.
Sievers, F., and Higgins, D.G. (2018). Clustal Omega for making accurate alignments of many
protein sequences. Protein Sci 27, 135-145.
Skubak, P., and Pannu, N.S. (2013). Automatic protein structure solution from weak X-ray data.
Nat Commun 4.
Sturm, G., Richter, K., Doetsch, A., Heide, H., Louro, R.O., and Gescher, J. (2015). A dynamic
periplasmic electron transfer network enables respiratory flexibility beyond a thermodynamic
regulatory regime. ISME J 9, 1802-1811.
Vonrhein, C., Tickle, I.J., Flensburg, C., Keller, P., Paciorek, W., Sharff, A., and Bricogne, G.
(2018). Advances in automated data analysis and processing within autoPROC, combined with
improved characterisation, mitigation and visualisation of the anisotropy of diffraction limits
using STARANISO. Acta Crystallogr A 74, A360-A360.
Wang, F., Gu, Y., O'Brien, J.P., Yi, S.M., Yalcin, S.E., Srikanth, V., Shen, C., Vu, D., Ing, N.L.,
Hochbaum, A.I., et al. (2019). Structure of Microbial Nanowires Reveals Stacked Hemes that
Transport Electrons over Micrometers. Cell 177, 361-369 e310.
19
Waterhouse, A.M., Procter, J.B., Martin, D.M.A., Clamp, M., and Barton, G.J. (2009). Jalview
Version 2-a multiple sequence alignment editor and analysis workbench. Bioinformatics 25,
1189-1191.
White, G.F., Edwards, M.J., Gomez-Perez, L., Richardson, D.J., Butt, J.N., and Clarke, T.A.
(2016). Mechanisms of Bacterial Extracellular Electron Exchange. Adv Microb Physiol 68, 87-
138.
White, G.F., Shi, Z., Shi, L., Wang, Z., Dohnalkova, A.C., Marshall, M.J., Fredrickson, J.K.,
Zachara, J.M., Butt, J.N., Richardson, D.J., et al. (2013). Rapid electron exchange between
surface-exposed bacterial cytochromes and Fe(III) minerals. Proc Natl Acad Sci U S A 110,
6346-6351.
Winn, M.D., Murshudov, G.N., and Papiz, M.Z. (2003). Macromolecular TLS refinement in
REFMAC at moderate resolutions. Method Enzymol 374, 300-321.
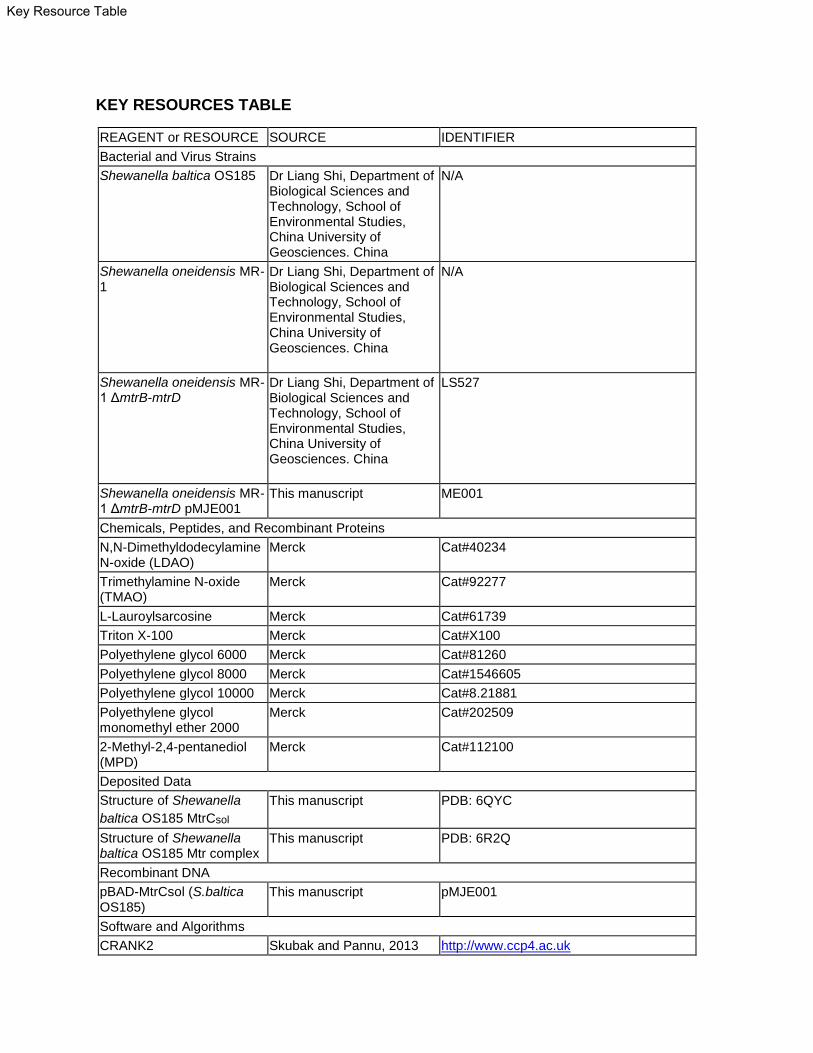
KEY RESOURCES TABLE
REAGENT or RESOURCE SOURCE IDENTIFIER
Bacterial and Virus Strains
Shewanella baltica OS185 Dr Liang Shi, Department of Biological Sciences and Technology, School of Environmental Studies, China University of Geosciences. China
N/A
Shewanella oneidensis MR-1
Dr Liang Shi, Department of Biological Sciences and Technology, School of Environmental Studies, China University of Geosciences. China
N/A
Shewanella oneidensis MR-1 ΔmtrB-mtrD
Dr Liang Shi, Department of Biological Sciences and Technology, School of Environmental Studies, China University of Geosciences. China
LS527
Shewanella oneidensis MR-1 ΔmtrB-mtrD pMJE001
This manuscript ME001
Chemicals, Peptides, and Recombinant Proteins
N,N-Dimethyldodecylamine N-oxide (LDAO)
Merck Cat#40234
Trimethylamine N-oxide (TMAO)
Merck Cat#92277
L-Lauroylsarcosine Merck Cat#61739
Triton X-100 Merck Cat#X100
Polyethylene glycol 6000 Merck Cat#81260
Polyethylene glycol 8000 Merck Cat#1546605
Polyethylene glycol 10000 Merck Cat#8.21881
Polyethylene glycol monomethyl ether 2000
Merck Cat#202509
2-Methyl-2,4-pentanediol (MPD)
Merck Cat#112100
Deposited Data
Structure of Shewanella
baltica OS185 MtrCsol
This manuscript PDB: 6QYC
Structure of Shewanella baltica OS185 Mtr complex
This manuscript PDB: 6R2Q
Recombinant DNA
pBAD-MtrCsol (S.baltica OS185)
This manuscript pMJE001
Software and Algorithms
CRANK2 Skubak and Pannu, 2013 http://www.ccp4.ac.uk
Key Resource Table
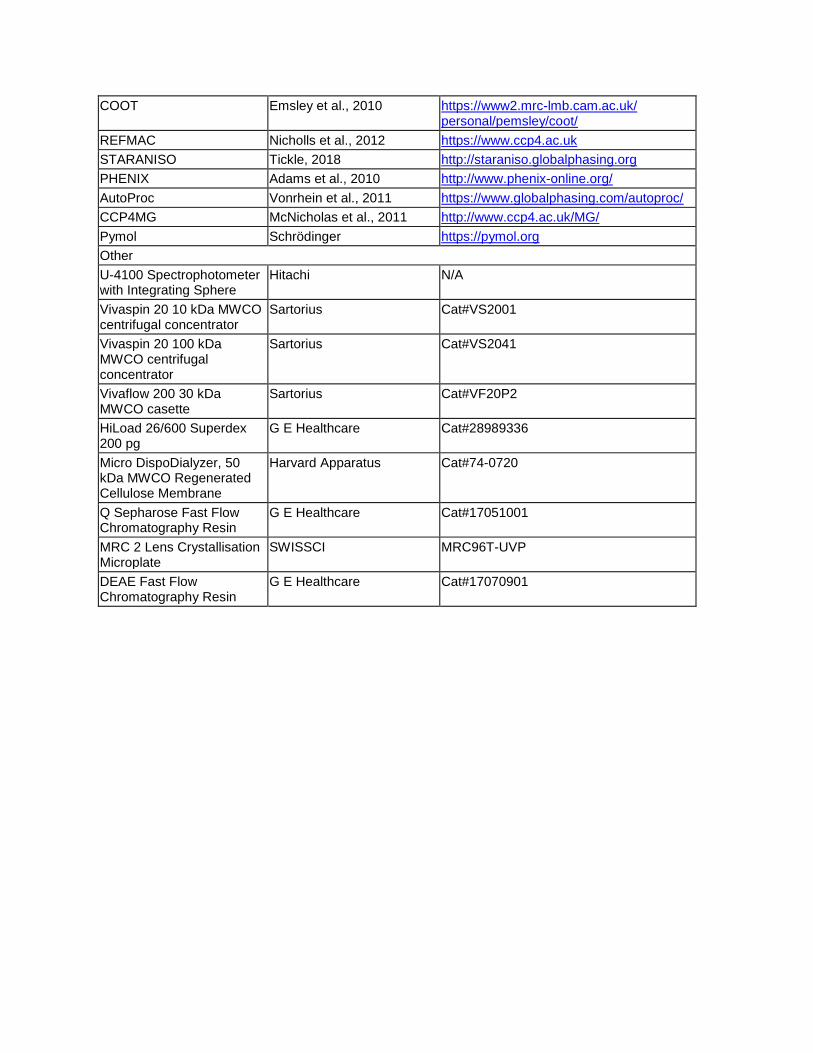
COOT Emsley et al., 2010 https://www2.mrc-lmb.cam.ac.uk/ personal/pemsley/coot/
REFMAC Nicholls et al., 2012 https://www.ccp4.ac.uk
STARANISO Tickle, 2018 http://staraniso.globalphasing.org
PHENIX Adams et al., 2010 http://www.phenix-online.org/
AutoProc Vonrhein et al., 2011 https://www.globalphasing.com/autoproc/
CCP4MG McNicholas et al., 2011 http://www.ccp4.ac.uk/MG/
Pymol Schrödinger https://pymol.org
Other
U-4100 Spectrophotometer with Integrating Sphere
Hitachi N/A
Vivaspin 20 10 kDa MWCO centrifugal concentrator
Sartorius Cat#VS2001
Vivaspin 20 100 kDa MWCO centrifugal concentrator
Sartorius Cat#VS2041
Vivaflow 200 30 kDa MWCO casette
Sartorius Cat#VF20P2
HiLoad 26/600 Superdex 200 pg
G E Healthcare Cat#28989336
Micro DispoDialyzer, 50 kDa MWCO Regenerated Cellulose Membrane
Harvard Apparatus Cat#74-0720
Q Sepharose Fast Flow Chromatography Resin
G E Healthcare Cat#17051001
MRC 2 Lens Crystallisation Microplate
SWISSCI MRC96T-UVP
DEAE Fast Flow Chromatography Resin
G E Healthcare Cat#17070901
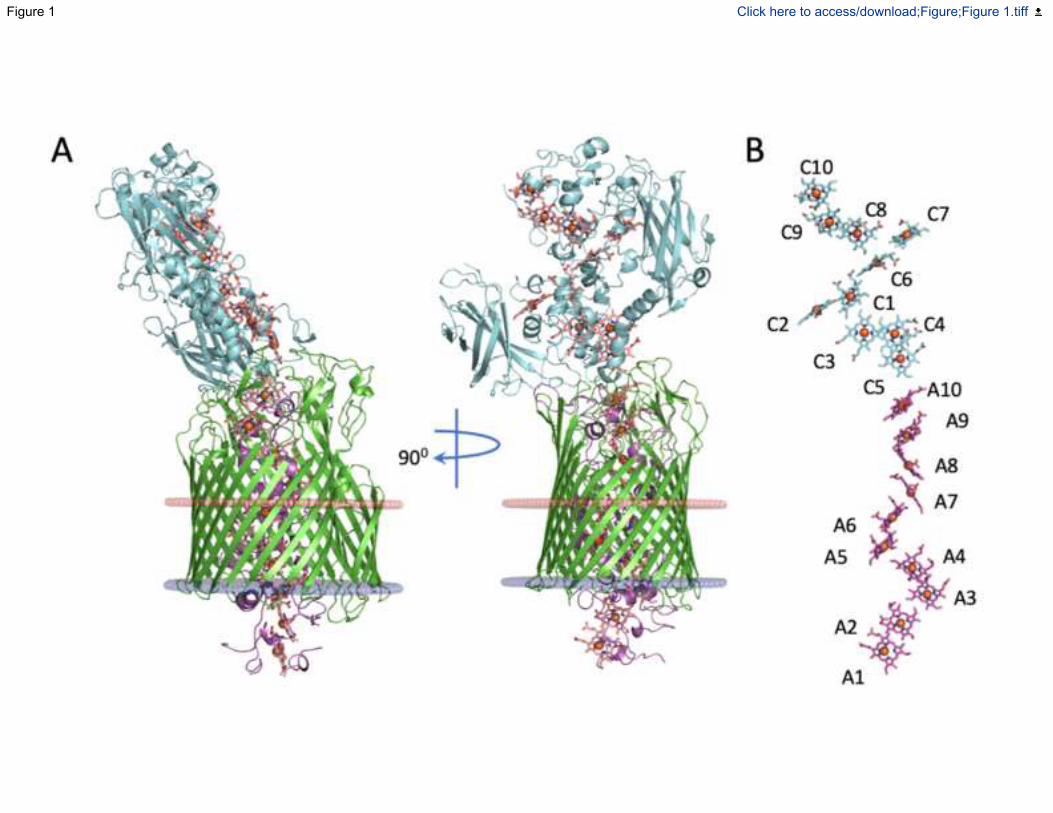
Figure 1 Click here to access/download;Figure;Figure 1.tiff
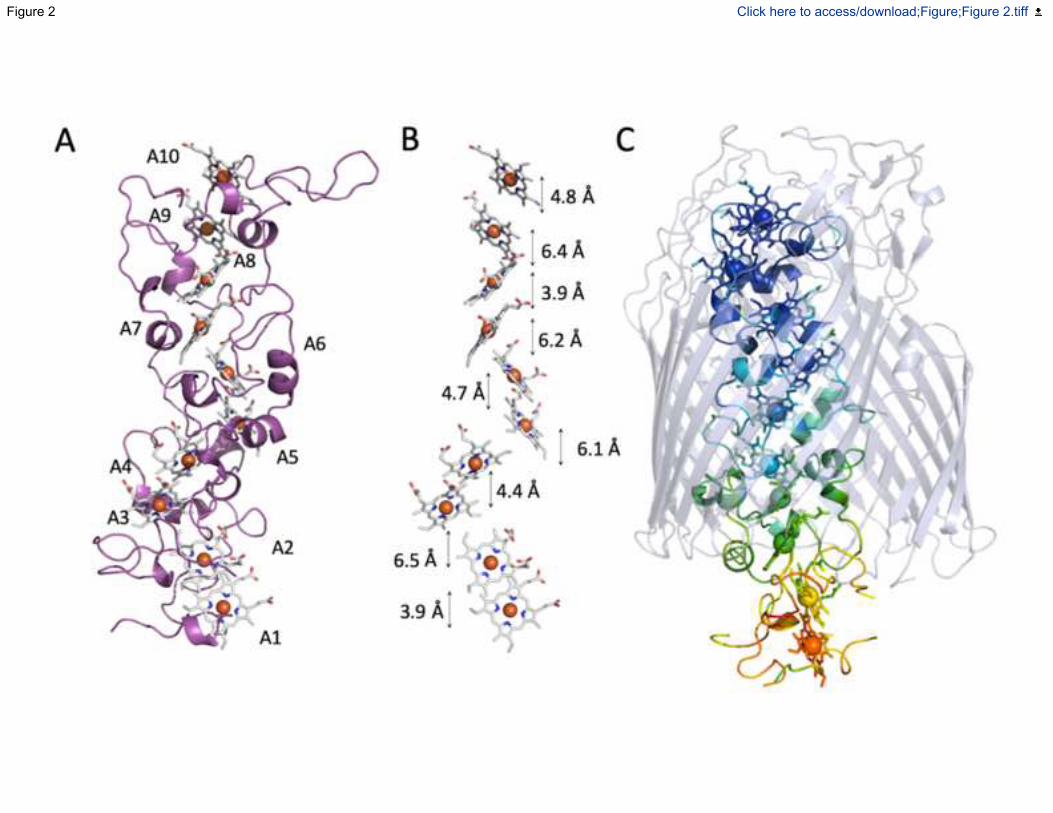
Figure 2 Click here to access/download;Figure;Figure 2.tiff
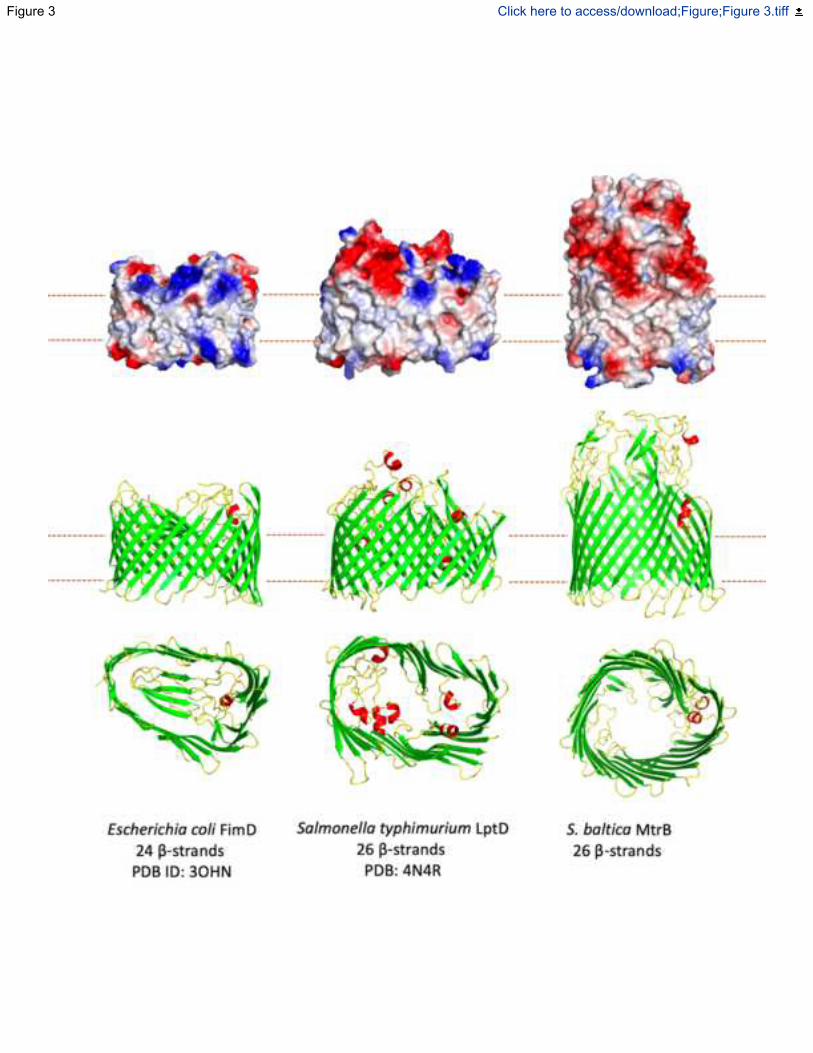
Figure 3 Click here to access/download;Figure;Figure 3.tiff
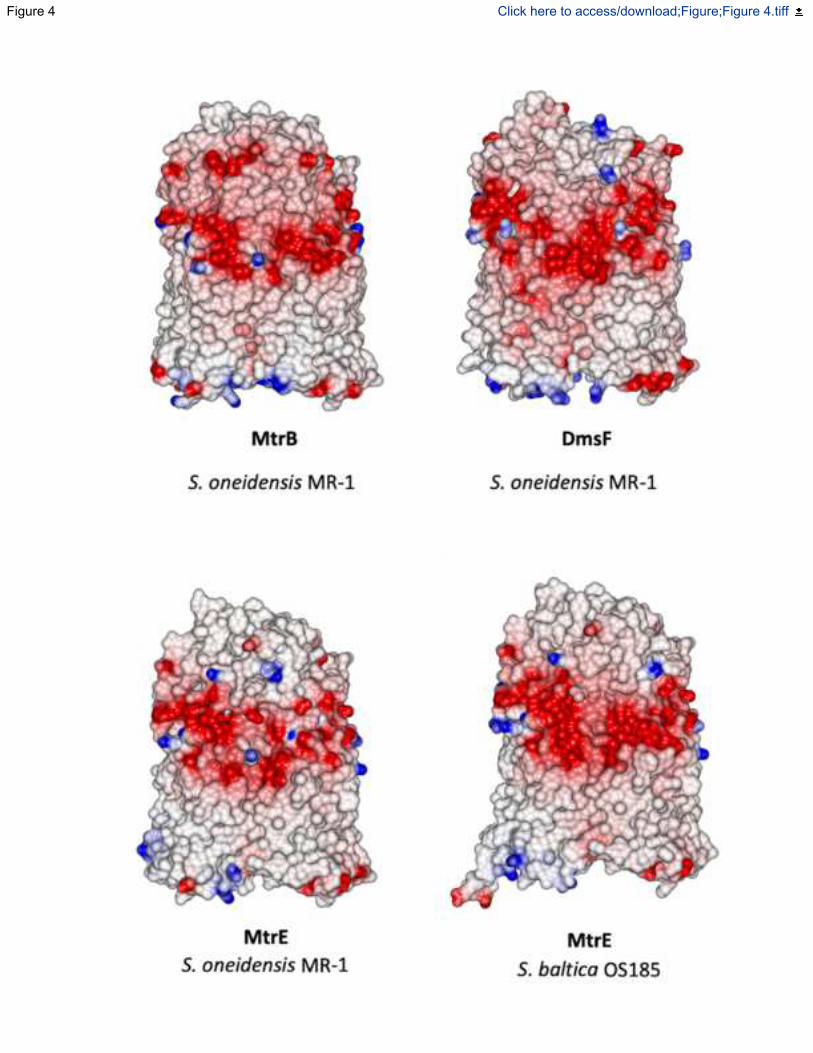
Figure 4 Click here to access/download;Figure;Figure 4.tiff
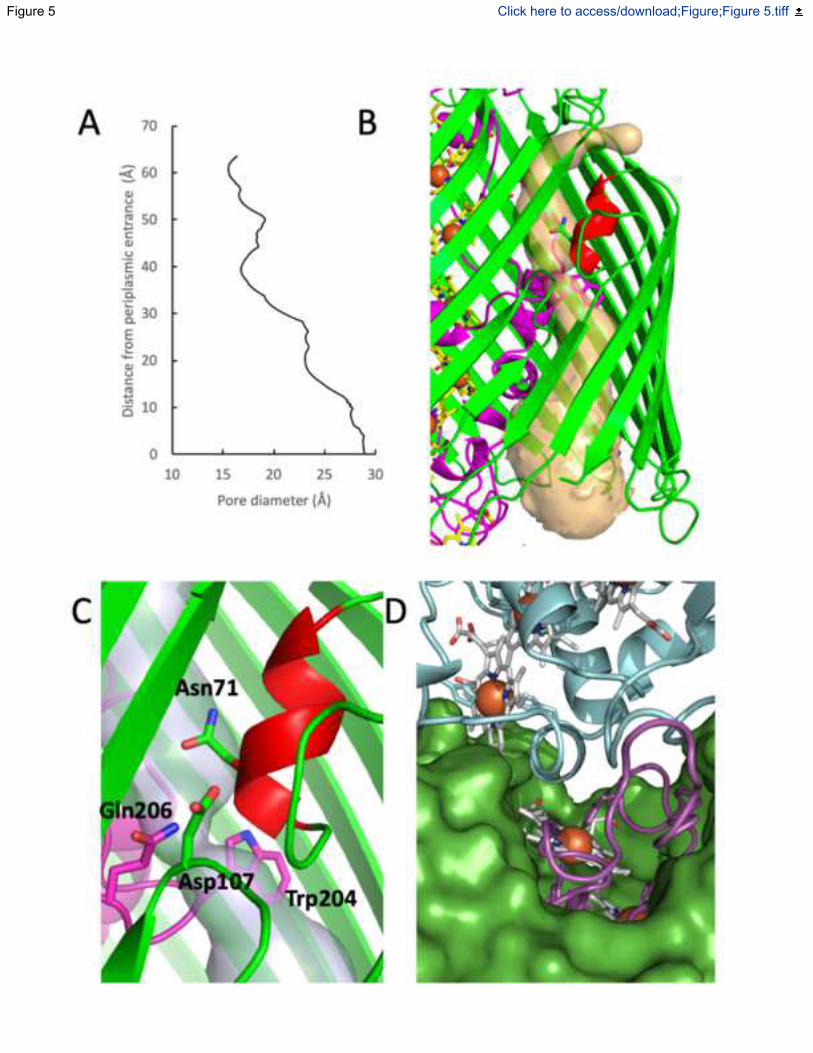
Figure 5 Click here to access/download;Figure;Figure 5.tiff
Supplemental Figure 1 Click here to access/download;Supplemental Figure;Figure S1.tiff
Supplemental Figure 2 Click here to access/download;Supplemental Figure;Figure S2.tiff
Supplemental Figure 3 Click here to access/download;Supplemental Figure;Figure S3.tiff
Supplemental Figure 4 Click here to access/download;Supplemental Figure;Figure S4.tiff
Supplemental Figure 5 Click here to access/download;Supplemental Figure;Figure S5.tiff
Supplemental Figure 6 Click here to access/download;Supplemental Figure;Figure S6.tiff


![Chapter 11 Chiral Crystal Faces of Common …Progress in Biological Chirality, G.Palyi, C.Zucchi & L.Caglioti [Eds], Oxford: Elsevier, 2004. pp.137-151] Chapter 11 Chiral Crystal Faces](https://img.pdfslide.us/doc/110x75/5c695e0a09d3f263648d0b07/chapter-11-chiral-crystal-faces-of-common-progress-in-biological-chirality-gpalyi.jpg)