Embed Size (px)
Citation preview
THE CROSS-BORDER IMPACT OF VIOLENT EVENTS
Mohamad Al-Ississ
Harvard University
April 2010
Abstract
This paper argues that violent events have two economic effects: a direct
loss from the destruction of physical and human capital, and a reallocation of
financial and economic resources. It is the first to document the positive cross-
border impact that follows violent events as a result of this reallocation. Thus, it
reconciles the two existing perspectives in the literature on whether violence has a
small or large economic effect. Our results show that, in globally integrated
markets, the substitution of financial and economic activities away from afflicted
countries magnifies their losses. Additionally, the paper evaluates the impact of
certain geographic, political and financial country characteristics on the reallocation
of capital.
JEL codes: F20, F41, F43, G11, G14, G15, F36
Harvard Kennedy School of Government, 79 John F. Kennedy Street, Cambridge, MA 02138.
[email protected]. All errors and opinions expressed herein are my own. This paper is copyrighted
by the author. For permission to reproduce or to request a copy, contact the author
The Cross-Border Impact of Violent Events
2
1 Introduction
This paper investigates the cross-border financial impact of violence. It examines
the global reallocation of capital in the wake of violent events, and analyzes its
determinants. Consequently, this paper helps reconcile the divergent arguments in the
existing discourse on the magnitude of the economic impact of violent events. It does so
by highlighting the role played by interconnected financial and economic global markets.
There is a dichotomy in the literature on the magnitude of the economic impact of
terrorism and violence. Studies that measure the direct impact of violent events tend to
find a small impact on the economy. Such studies argue that terrorism and violent events
destroy only a small portion of human and physical capital. Thus, they argue terrorism
results in a small negative impact. Other economists argue, however, that the impact of
violence is large, and use reduced form estimates to demonstrate that.
Abadie and Gardeazabal (2008) take the first key step toward bridging the two
camps by arguing that “the mobility of productive capital in an open economy may
account for much of the difference between the direct and the equilibrium impact of
terrorism” (Abadie and Gardeazabal 2008, 1). They further assert that “diversification
opportunities that arise in an integrated world economy can greatly amplify the economic
impact of terrorism” (Abadie and Gardeazabal 2008, 8). Abadie and Gardeazabal (2008)
find that a standard deviation increase in terrorism risk is associated with a 5 percent drop
of GDP in Foreign Direct Investment (FDI).
We offer an approach to reconcile these existing points of view and propose that
violence causes two types of economic effects. The first is a small actual loss caused by
the destruction of physical and human capital. The second takes the form of a reallocation
of financial and economic activity from the event country to alternative non-event
countries. This reallocation causes a large negative effect on the event country.
However, if reallocation of assets to other countries exists, then we should be able
to document both sides of this transaction. Numerous studies have successfully recorded
the negative impact of violence on affected countries. Yet, no study has previously
recorded the other side of this transaction i.e. the positive impact on the other countries to
The Cross-Border Impact of Violent Events
3
which capital has been reallocated. This is the first study to document the positive flow
from countries where violence took place to other countries. We find support for the
argument that while the direct impact of violence on the afflicted country is relatively
small, the interconnectedness of global markets results in an outflow of financial and
economic activity that intensifies its effects. This global reallocation leads us to believe
that the net global impact of terror is smaller than previously thought. This study also
explores factors that determine the magnitude of this cross-border reallocation.
Specifically, it examines the effects of geographic distance, relative safety, openness of
global financial markets, and depth of financial markets in the event country.
This research uses financial data covering 57 stock exchanges in 49 countries over
a period of 20 years. It analyzes the impact of 66 violent events that took place in 32
countries. Throughout this paper, the term “violent events” is used to describe politically
motivated acts of violence including wars, bombings, assassinations, hijackings, and
firearm shootings. Also, we will refer to a country that suffers a specific violent event as
the “event country” and to countries that were not directly afflicted by the violent event
as “non-event countries”.
The rest of this paper is organized in the following seven sections. Section 2
reviews the existing literature on the impact of violence and instability on an economy.
Section 3 introduces the theoretical models and hypotheses and section 4 presents the
methodology used in this study. Section 5 discusses the empirical model and data, while
Section 6 displays the results of the analyses, and section 7 concludes.
2 Literature Review
In his book What Makes a Terrorist, Alan Krueger outlines the two existing views
on how terrorism impacts the economy of the country it targets (Krueger 2007). The first
view argues that human capital is the primary engine in modern economies and,
fortunately, only a small fraction of it falls victim to violent events. The substitution from
activities that are highly susceptible to violence such as tourism toward less susceptible
activities in an afflicted city mitigates the impact of violence. Finally, the fact that
The Cross-Border Impact of Violent Events
4
defense and security companies actually benefit from such events, as Berrebi and Klor
(2005) show in the case of Israel, dampens the negative impact of violence.
Supporters of this small impact view include Alan Krueger himself, who wrote an
article in the New York Times several days after the September 11 attacks in which he
argued that terrorist events lead to a small impact on the economy (Krueger 2001).
Supporters of this argument also include Gary Becker and Kevin Murphy. In their Wall
Street Journal article “Prosperity Will Rise Out of the Ashes,” published shortly after the
9/11 attacks, they argue that the attacks destroyed only 0.06 percent of the total
productive assets in the US. Even with conservative estimates, the impact of the attacks
on US GDP would only amount to a loss of 0.3 percent (Becker and Murphy 2001). Like
Krueger, they compare terrorist attacks to natural disasters and point to the earthquake
that destroyed more than 100,000 buildings in the Japanese city of Kobe in 1995 yet left
the region’s GDP almost unaffected one year later.
The second view argues that the economic impact of terrorism is large. Its
supporters point out that, in the wake of a fresh attack, people overreact to the threat of
future violent events and the economy experiences increased uncertainty. Bloom (2006)
depicts stock market volatility around key events in history. The period after 9/11
witnessed a significant increase in volatility. Supporters of the “large impact” argument
further assert that while the economy as a whole may successfully adjust following an
attack, certain industries, such as the tourism and travel industries, suffer long-term
effects.
A number of empirical studies find evidence for the “large impact” argument.
Abadie and Gardeazabal (2003) measure the impact of terrorism on the economy of the
Basque region. They use the ceasefire truce of September 1998 as a natural experiment to
evaluate the impact of violence. Their event study finds that the stocks of firms with
significant presence in the Basque region experience significant positive performance as
the truce becomes credible. The stocks, however, suffer negative performance once the
truce comes to an end. Additionally, Abadie and Gardeazabal (2003) construct a
counterfactual Basque region from other Spanish regions that economically resemble the
The Cross-Border Impact of Violent Events
5
Basque region prior to the outbreak of conflict in the 1970s. They find that the GDP per
capita for the Basque region dropped by 10 percent as compared to its counterfactual
control region. The gap was shown to widen following spikes in terrorist events.
The majority of empirical studies that support the “large impact” argument rely on
the event study methodology to evaluate the impact of violent events. The use of event
studies to measure the impact of various events has long been established. As MacKinlay
(1997, 13) points out, “perhaps the first published study is James Dolley (1933)”. Key
improvements to the utilized methodology have been deployed over the decades, most
notably by Eugene Fama et al. (1969). Event studies are commonly used to evaluate the
impact of firm-level events on their stock prices, such as quarterly earnings
announcements. Recently, event studies have been used to evaluate the impact of
terrorism and conflict. Generally, these studies found that such turbulent events lead to a
large negative impact on the valuation of listed securities.
Chen and Seims (2004) deploy the event study to evaluate the impact of 14
negative events, such as Pearl Harbor and Iraq’s invasion of Kuwait in 1990 on stock
market indices. They report negative market reaction ranging from -6.45 percent for Pearl
Harbor, to -7.90 percent for the 9/11 attacks over an 11-day window. They show that U.S.
stock exchange markets are more resilient than in the past and that they require less time
to recover from negative shocks than other global capital markets. They argue that the
increased market resilience is partially explained by a stable financial sector that offers
sufficient liquidity and minimizes panic (Chen and Seims 2004, 20).
Berrebi and Klor (2005) evaluate the impact of such attacks on Israeli companies
during the period 1998 to 2000. In order to isolate common industry shocks from
negative events, they pair US and Israeli companies with similar characteristics. They
find that the second Palestinian Intifada had a negative impact of 5 percent on non-
defense firms, while defense and security companies had a significant positive reaction to
this event of 7 percent.
Karolyi and Martell (2005) examine the impact of 75 terrorist attacks against
firms on their valuation. They find a statistically significant negative impact of 0.83
The Cross-Border Impact of Violent Events
6
percent. Their results differ depending on whether the attack resulted in a loss of physical
or human capital. They found that attacks against human capital, like kidnappings of firm
executives, lead to higher losses in stock prices than those resulting from attacks against
physical targets such as facilities or buildings. They also found that attacks in wealthier
and more democratic countries result in larger drops in share prices.
Eldor and Melnick (2004) investigated the impact of violent events in Israel on its
stock market. They find that suicide attacks result in a permanent impact on the stock and
foreign exchange markets. The number of fatalities and injuries also left a permanent
impact. On the other hand, the location of a terror attack had no effect on either market.
They found that markets did not become desensitized to terror attacks. They concluded
that financial markets continued to efficiently perform and that market-liberalization
policies contributed to coping with terror.
So far, existing literature has documented only the negative impact of violent
events. The single outlier is the study of Berrebi and Klor (2005) that found a positive
impact of such events on Israeli defense companies. Nonetheless, the existing research
has not explored the cross-border effects of such turbulent events.
Abadie and Gardeazabal (2008) introduce the integrated world economy channel
to the investigation of the impact of terror. Their model emphasizes the one-sidedness of
terror shocks and their effect on decreasing the mean of expected return to capital, in
addition to increasing its variance (Abadie and Gardeazabal 2008, 5). They analyze the
impact of terrorism risk, measured using the Global Terrorism Index for the period
2003/2004, on FDI positions of a cross-section of countries using World Bank data. Their
findings reveal a 5 percent drop in FDI positions (normalized by GDP) for a one standard
deviation increase in the intensity of terrorism (Abadie and Gardeazabal 2008, 21).
3 Theoretic Model and Hypotheses
Building on the aforementioned literature, we offer a way to reconcile the two
existing positions regarding the economic impact of violence. We propose that violence
causes two types of economic effects. The first is an actual loss caused by the destruction
The Cross-Border Impact of Violent Events
7
of physical and human capital. This is a small negative impact that event countries suffer,
and is documented by researchers using direct measurements. The second is a
reallocation of financial and economic activity from the event country to alternative non-
event countries in the wake of the event. This reallocation causes a large negative effect
on the event country and is documented by reduced form estimate studies. It is this
substitution effect, resulting from the integration of global financial and economic
markets, which magnifies the effect of violence on the event country, and is consistent
with Abadie and Gardeazabal (2008).
In order for this proposition to hold, however, we must be able to document the
other side of the substitution effect: the positive impact that non-event countries
experience in the wake of violent events. So far, the literature has focused exclusively on
the impact of violence on event countries and therefore only documents its negative
effect. In order to document the positive, we examine the impact of violence on non-
event countries.
Two frameworks can predict the cross-border impact of violent events. The first
model works through the financial channel and the second through the economic one.
Both channels will result in the substitution of financial investments and economic
activities from an event country to non-event countries. Both frameworks are discussed
below.
A Financial Framework for Violence-Induced Substitution of
Optimal Equity Allocation
We base our model on Merton’s (1976) model of an asset that is susceptible to
shock as a result of new information that occurs according to a Poisson process.
dS/S= αdt + ζ dZ - λδ dq(t)
Where α is the instantaneous expected return on the stock, ζ2 is the instantaneous
variance of the return, which is conditional on no arrival of new information and follows
a standard Gauss-Wiener process, dZ, q(t) is the independent Poisson process and λ is the
The Cross-Border Impact of Violent Events
8
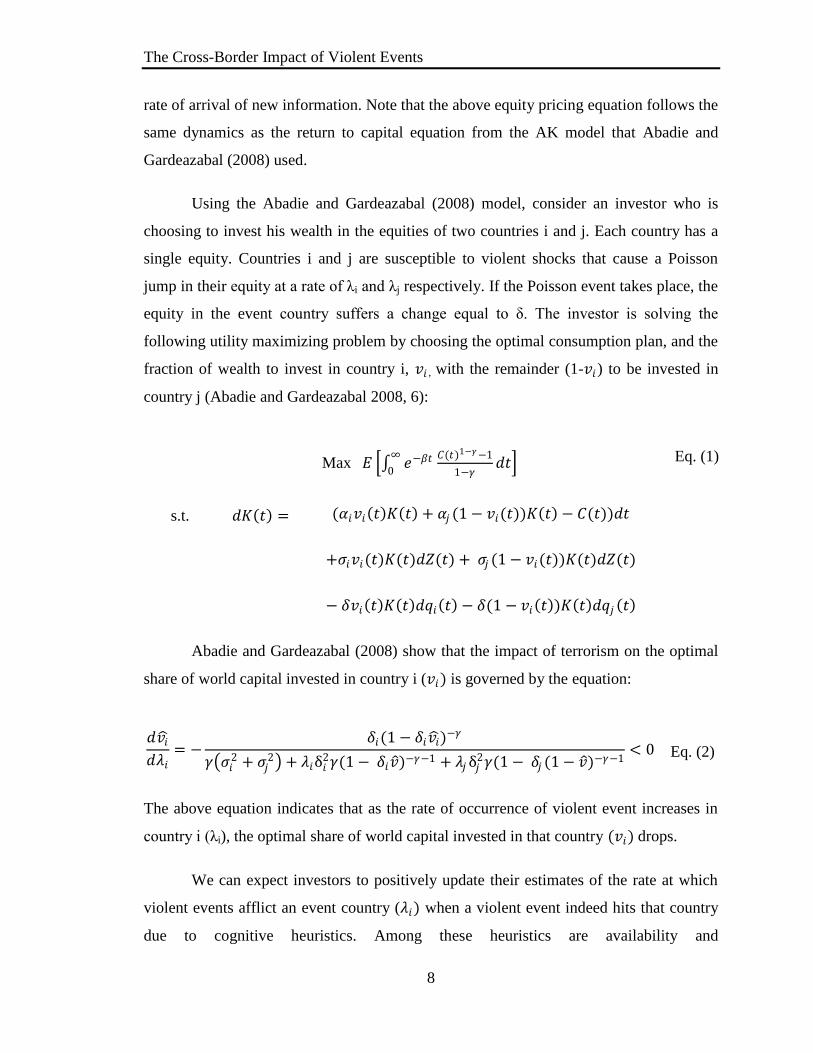
rate of arrival of new information. Note that the above equity pricing equation follows the
same dynamics as the return to capital equation from the AK model that Abadie and
Gardeazabal (2008) used.
Using the Abadie and Gardeazabal (2008) model, consider an investor who is
choosing to invest his wealth in the equities of two countries i and j. Each country has a
single equity. Countries i and j are susceptible to violent shocks that cause a Poisson
jump in their equity at a rate of λi and λj respectively. If the Poisson event takes place, the
equity in the event country suffers a change equal to δ. The investor is solving the
following utility maximizing problem by choosing the optimal consumption plan, and the
fraction of wealth to invest in country i, 𝑣𝑖 , with the remainder (1-𝑣𝑖) to be invested in
country j (Abadie and Gardeazabal 2008, 6):
Max 𝐸 𝑒−𝛽𝑡 𝐶(𝑡)1−𝛾−1
1−𝛾
∞
0𝑑𝑡 Eq. (1)
s.t. 𝑑𝐾 𝑡 = (𝛼𝑖𝑣𝑖 𝑡 𝐾 𝑡 + 𝛼𝑗 (1 − 𝑣𝑖(𝑡))𝐾 𝑡 − 𝐶(𝑡))𝑑𝑡
+𝜎𝑖𝑣𝑖(𝑡)𝐾(𝑡)𝑑𝑍(𝑡) + 𝜎𝑗 (1 − 𝑣𝑖(𝑡))𝐾(𝑡)𝑑𝑍(𝑡)
− 𝛿𝑣𝑖 𝑡 𝐾 𝑡 𝑑𝑞𝑖 𝑡 − 𝛿(1 − 𝑣𝑖 𝑡 )𝐾 𝑡 𝑑𝑞𝑗 𝑡
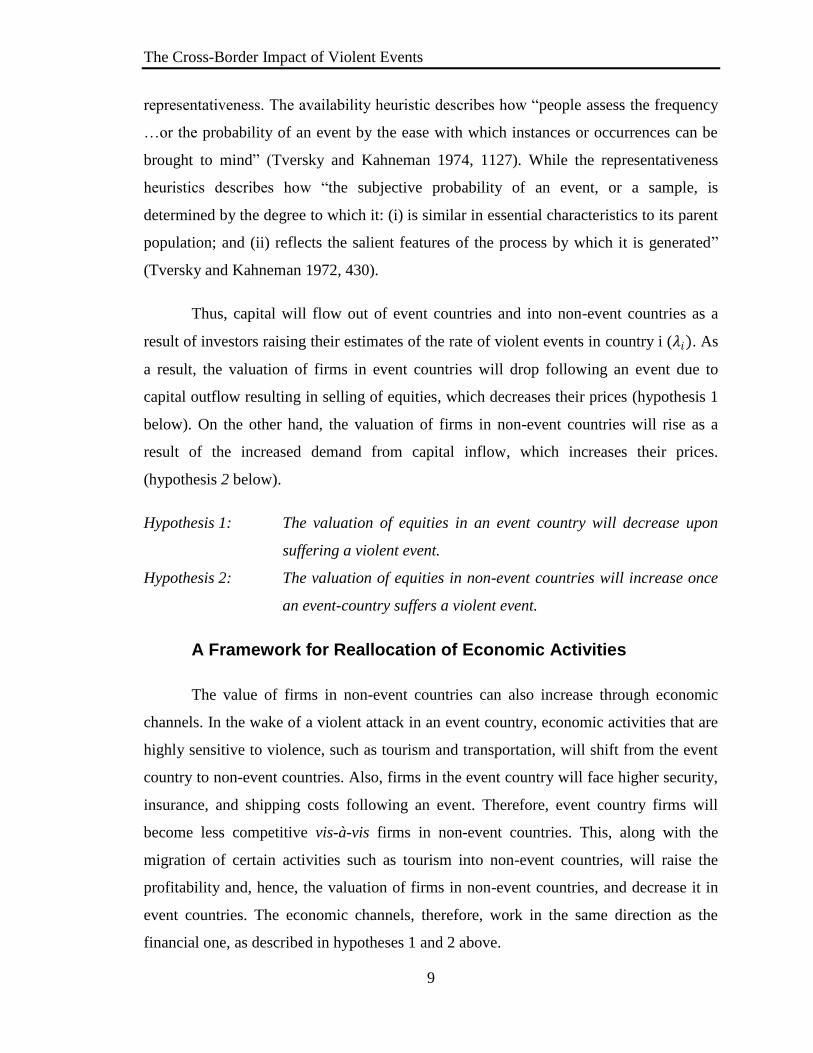
Abadie and Gardeazabal (2008) show that the impact of terrorism on the optimal
share of world capital invested in country i (𝑣𝑖) is governed by the equation:
𝑑𝑣𝑖
𝑑𝜆𝑖= −
𝛿𝑖(1 − 𝛿𝑖𝑣𝑖 )−𝛾
𝛾 𝜎𝑖2 + 𝜎𝑗
2 + 𝜆𝑖δ𝑖2𝛾(1 − 𝛿𝑖𝑣 )−𝛾−1 + 𝜆𝑗δ𝑗
2𝛾(1 − 𝛿𝑗 (1 − 𝑣 )−𝛾−1< 0 Eq. (2)
The above equation indicates that as the rate of occurrence of violent event increases in
country i (λi), the optimal share of world capital invested in that country (𝑣𝑖) drops.
We can expect investors to positively update their estimates of the rate at which
violent events afflict an event country (𝜆𝑖) when a violent event indeed hits that country
due to cognitive heuristics. Among these heuristics are availability and
The Cross-Border Impact of Violent Events
9
representativeness. The availability heuristic describes how “people assess the frequency
…or the probability of an event by the ease with which instances or occurrences can be
brought to mind” (Tversky and Kahneman 1974, 1127). While the representativeness
heuristics describes how “the subjective probability of an event, or a sample, is
determined by the degree to which it: (i) is similar in essential characteristics to its parent
population; and (ii) reflects the salient features of the process by which it is generated”
(Tversky and Kahneman 1972, 430).
Thus, capital will flow out of event countries and into non-event countries as a
result of investors raising their estimates of the rate of violent events in country i (𝜆𝑖). As
a result, the valuation of firms in event countries will drop following an event due to
capital outflow resulting in selling of equities, which decreases their prices (hypothesis 1
below). On the other hand, the valuation of firms in non-event countries will rise as a
result of the increased demand from capital inflow, which increases their prices.
(hypothesis 2 below).
Hypothesis 1: The valuation of equities in an event country will decrease upon
suffering a violent event.
Hypothesis 2: The valuation of equities in non-event countries will increase once
an event-country suffers a violent event.
A Framework for Reallocation of Economic Activities
The value of firms in non-event countries can also increase through economic
channels. In the wake of a violent attack in an event country, economic activities that are
highly sensitive to violence, such as tourism and transportation, will shift from the event
country to non-event countries. Also, firms in the event country will face higher security,
insurance, and shipping costs following an event. Therefore, event country firms will
become less competitive vis-à-vis firms in non-event countries. This, along with the
migration of certain activities such as tourism into non-event countries, will raise the
profitability and, hence, the valuation of firms in non-event countries, and decrease it in
event countries. The economic channels, therefore, work in the same direction as the
financial one, as described in hypotheses 1 and 2 above.
The Cross-Border Impact of Violent Events
10
Determinants of the Impact of Violence on Non-Event Countries
In addition to evaluating hypotheses 1 and 2 above, we examine the effect of the
following factors on the reallocation of financial and economic activities to non-event
countries as a result of violent events.
Geographic Distance
While the financial and economic channels lead us to the same conclusions about
the impact of violent events, they may differ in the geographic dispersion of these effects.
Reallocating capital across large distances is not necessarily associated with large
increases in transaction costs, as is the case for reallocation of economic activities.
Capital flows are also more sensitive to risk than economic activity due to their lower
transaction costs of reallocation and, as a result, may follow a different geographic
dispersion that emphasizes risk mitigation.
On the other hand, distance has a large impact on information, transportation, and
transaction costs associated with reallocating economic activities. Geographic
specialization in certain products and services, such as olive oil and Caribbean tourism,
also plays an important role in the geographic reallocation of economic activities. This
imposes distance restrictions on potential substitute destinations. Also, given regional
specialization, the valuation of firms in regional non-event countries may increase as a
result of the decreased competitiveness of firms in the event country due to their higher
transportation and security costs and lower available capital. Regional countries,
therefore, may receive a positive windfall from the violent event.
The different effect that distance has on financial and economic reallocation leads
us to believe that the relationship between the geographic distance and the valuation of
securities in non-event countries is not necessarily monotonic. As a result, we use two
variables to ascertain this relationship. The first is the distance between the event and
non-event countries and the second is the geographic contiguity of these two countries.
The Cross-Border Impact of Violent Events
11
Relative Safety
An increase in (𝜆𝑗 ) in equation (2) above will decrease the capital outflow from
event country i to non-event country j. We will empirically verify this prediction by
investigating the impact of perceived relative safety between the event and non-event
countries on the reallocation of financial and economic activity.
Alternative Open Country Destinations
Abadie and Gardeazabal (2008) show that the optimal share of world capital
invested in country i (𝑣𝑖) is a decreasing function of the number of economies in the
world to which capital can flow. In other words, the more diversification locations that
exist in the world, the less the share of world capital any given country will receive. We
test if this prediction holds - that is whether the amount of capital that will flee to a
certain non-event country will decrease as the number of alternative potential destinations
increases.
Depth of the Event Countries Financial Markets
Chen and Seims (2004) propose that a well-functioning and developed financial
market is a key determinant to an economy’s ability to absorb shocks such as violent
events (Chen and Seims 2004, 361). While the depth of financial markets is a sign of
their maturity, it can also be an indicator of a market bubble that leaves it susceptible to
violent shocks. We investigate how the depth of the event country’s financial markets
affects the cross-border reallocation of capital and its ability to absorb shocks and prevent
reallocation.
4 Methodology
The event study is used to measure the impact of a violent event on the valuation
of the equities in event and non-event countries. Parametric and nonparametric tests of
the event study results will test hypotheses 1 and 2 that violent events impact the equities
of event countries negatively and those of non-event countries positively. Then, the
The Cross-Border Impact of Violent Events
12
measured impacts from the event study on non-event countries will be entered into a
cross-sectional regression to assess the determinant of cross-border reallocation.
The Event Study Design
The event study begins with the assumption that stock markets are rational and
therefore reflect investors’ valuation of firms as soon as new information becomes
available. Given this rationality assumption, investors update their valuation of firms
upon receiving new information. The impact of an event on an economy is evaluated
through measuring the response it generates on its stock market. For example, if violent
events negatively impact investors’ perception of the attractiveness or wellbeing of
country i’s economy, this information will be transmitted rapidly to the country’s
financial market.
The event study starts by describing a specific event that will be investigated and
the specific equities that will be analyzed. First, the event date is established. If the event
took place during the working hours of the stock market, then the day of the event’s
occurrence is the event date. If the event took place after the working hours of the market
or on a holiday, then the event date is the first trading day after the event.
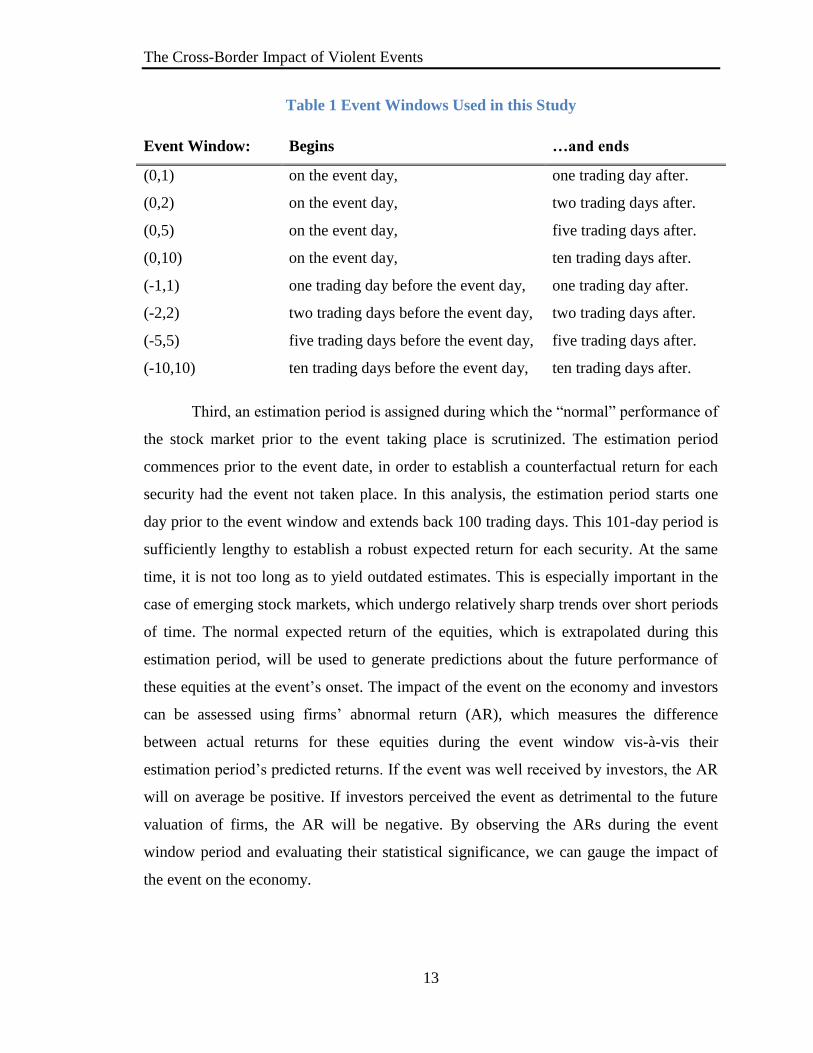
Second, the study selects an event window during which the event is expected to
affect the stock market. If the event was unexpected, such as a terrorist attack, the event
window begins on the event date and usually includes a number of days after the event
date, during which the event is still affecting market performance. If the event has been
expected, such as the declaration of war on Iraq in 2003, then the event window includes
the days leading up to the event date, and hence the effect of anticipation of the event on
the stock market. This event window, including the days before the event date, depicts a
visual comparison of the trend before and after the event date. We include both kinds of
event windows in our analysis. For the sake of robustness, eight event windows are
deployed in this study. Together, these eight event windows compose a comprehensive
evaluation of the impact of an event.
The Cross-Border Impact of Violent Events
13
Table 1 Event Windows Used in this Study
Event Window: Begins …and ends
(0,1) on the event day, one trading day after.
(0,2) on the event day, two trading days after.
(0,5) on the event day, five trading days after.
(0,10) on the event day, ten trading days after.
(-1,1) one trading day before the event day, one trading day after.
(-2,2) two trading days before the event day, two trading days after.
(-5,5) five trading days before the event day, five trading days after.
(-10,10) ten trading days before the event day, ten trading days after.
Third, an estimation period is assigned during which the “normal” performance of
the stock market prior to the event taking place is scrutinized. The estimation period
commences prior to the event date, in order to establish a counterfactual return for each
security had the event not taken place. In this analysis, the estimation period starts one
day prior to the event window and extends back 100 trading days. This 101-day period is
sufficiently lengthy to establish a robust expected return for each security. At the same
time, it is not too long as to yield outdated estimates. This is especially important in the
case of emerging stock markets, which undergo relatively sharp trends over short periods
of time. The normal expected return of the equities, which is extrapolated during this
estimation period, will be used to generate predictions about the future performance of
these equities at the event’s onset. The impact of the event on the economy and investors
can be assessed using firms’ abnormal return (AR), which measures the difference
between actual returns for these equities during the event window vis-à-vis their
estimation period’s predicted returns. If the event was well received by investors, the AR
will on average be positive. If investors perceived the event as detrimental to the future
valuation of firms, the AR will be negative. By observing the ARs during the event
window period and evaluating their statistical significance, we can gauge the impact of
the event on the economy.
The Cross-Border Impact of Violent Events
14
There are several methods to measure the normal performance of equities during
the estimation period. The most deployed of these are the constant mean, market, and
factors models. This study utilizes the constant mean model for two reasons. First, the
constant mean model has been found by Brown and Warner (1980, 1985) to perform as
well as other more sophisticated models in their widely quoted simulated investigation of
the performance of different event study methodologies. Second, while most studies
focus on firm-level events such as earning announcements, this study focuses on market-
level macro events like violent events that impact the whole market and are not restricted
to specific firms. Unlike other methods, the constant mean model allows for analyzing
the impact of events affecting the whole market. For example, the market return model
uses the stock market’s performance to predict the performance of specific firms. Yet,
when the whole market is impacted by the event, we cannot use its performance to make
predictions for specific firms. Thus, the constant mean model was utilized in this study
for its convenience and performance. This model is individually applied to the returns of
each of the stock exchange indices.
Measuring Abnormal Return
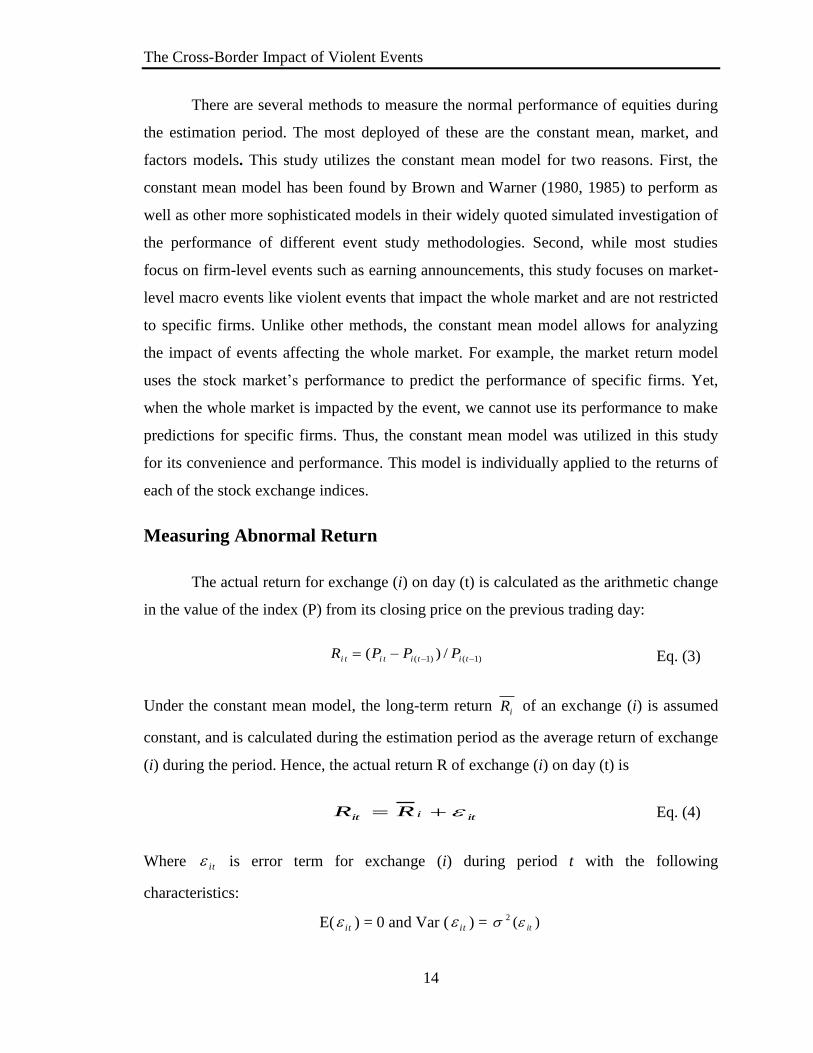
The actual return for exchange (i) on day (t) is calculated as the arithmetic change
in the value of the index (P) from its closing price on the previous trading day:
)1()1( /)( titii ti t PPPR Eq. (3)
Under the constant mean model, the long-term return iR of an exchange (i) is assumed
constant, and is calculated during the estimation period as the average return of exchange
(i) during the period. Hence, the actual return R of exchange (i) on day (t) is
itiit RR Eq. (4)
Where it is error term for exchange (i) during period t with the following
characteristics:
E( it ) = 0 and Var ( it ) = )(2
it
The Cross-Border Impact of Violent Events
15
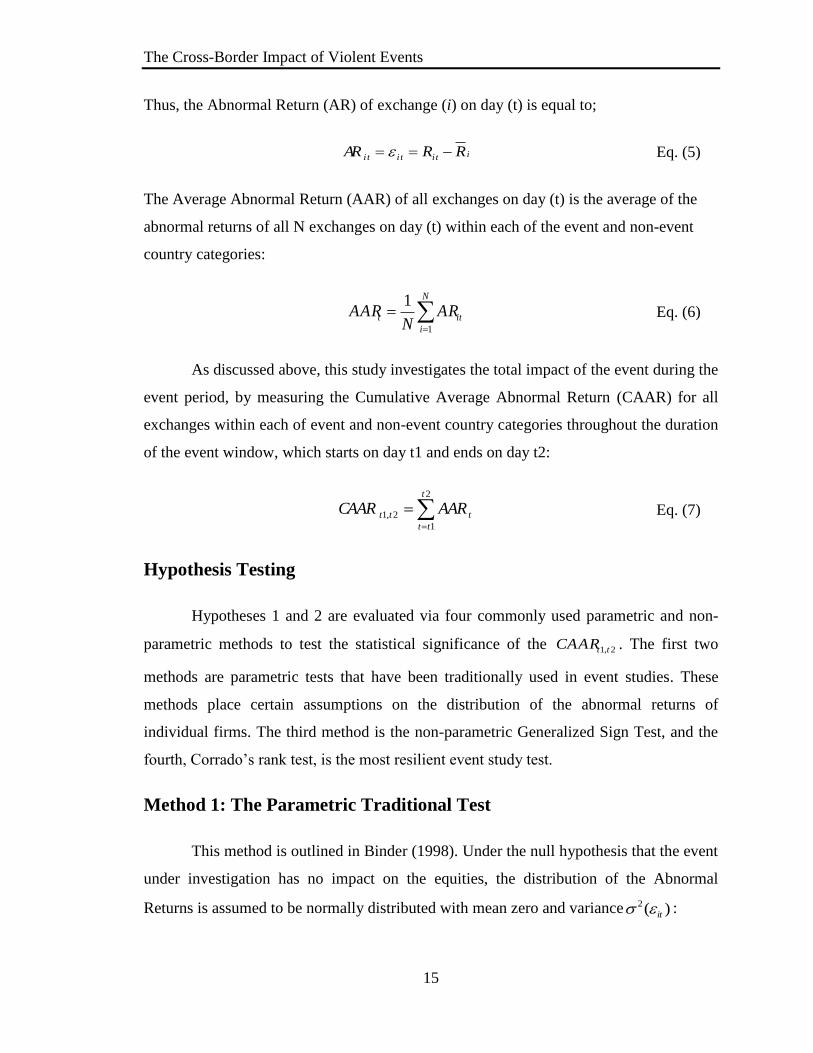
Thus, the Abnormal Return (AR) of exchange (i) on day (t) is equal to;
ii ti ti t RRAR Eq. (5)
The Average Abnormal Return (AAR) of all exchanges on day (t) is the average of the
abnormal returns of all N exchanges on day (t) within each of the event and non-event
country categories:
N
i
itt ARN
AAR1
1 Eq. (6)
As discussed above, this study investigates the total impact of the event during the
event period, by measuring the Cumulative Average Abnormal Return (CAAR) for all
exchanges within each of event and non-event country categories throughout the duration
of the event window, which starts on day t1 and ends on day t2:
2
1
2,1
t
tt
ttt AARCAAR Eq. (7)
Hypothesis Testing
Hypotheses 1 and 2 are evaluated via four commonly used parametric and non-
parametric methods to test the statistical significance of the 2,1 ttCAAR . The first two
methods are parametric tests that have been traditionally used in event studies. These
methods place certain assumptions on the distribution of the abnormal returns of
individual firms. The third method is the non-parametric Generalized Sign Test, and the
fourth, Corrado’s rank test, is the most resilient event study test.
Method 1: The Parametric Traditional Test
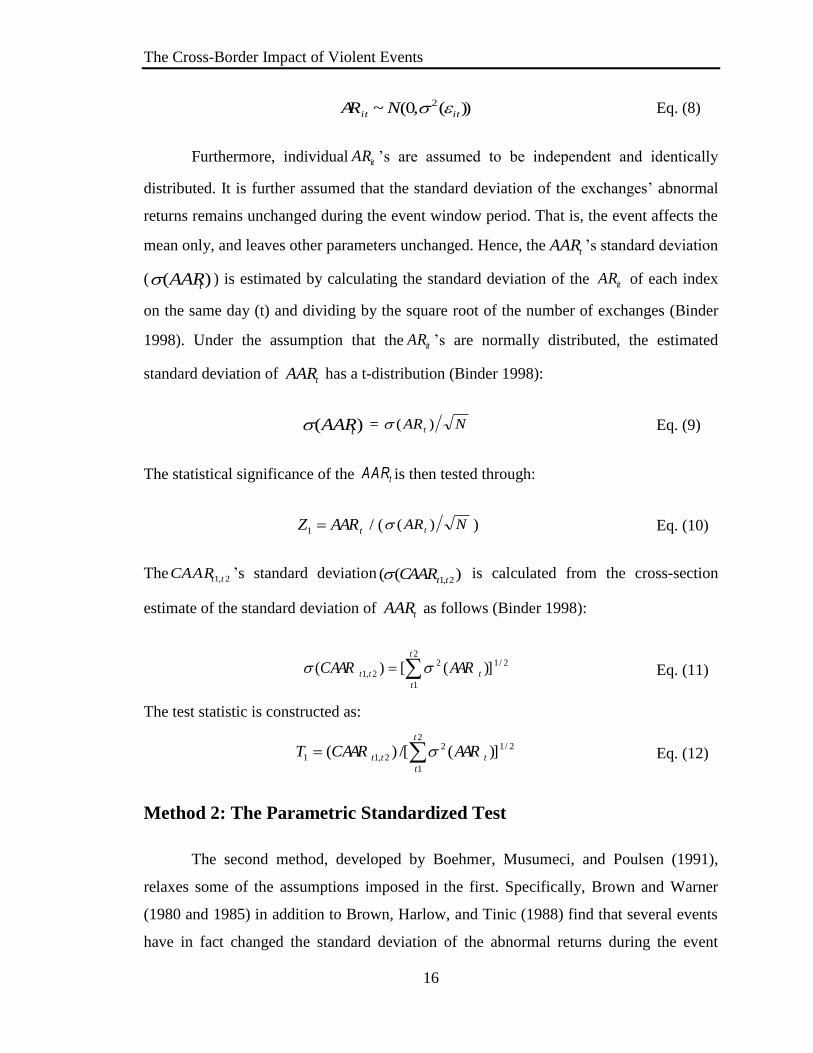
This method is outlined in Binder (1998). Under the null hypothesis that the event
under investigation has no impact on the equities, the distribution of the Abnormal
Returns is assumed to be normally distributed with mean zero and variance )(2
it :
The Cross-Border Impact of Violent Events
16
))(,0(~ 2
itit NAR Eq. (8)
Furthermore, individual itAR ’s are assumed to be independent and identically
distributed. It is further assumed that the standard deviation of the exchanges’ abnormal
returns remains unchanged during the event window period. That is, the event affects the
mean only, and leaves other parameters unchanged. Hence, the tAAR ’s standard deviation
( )( tAAR ) is estimated by calculating the standard deviation of the itAR of each index
on the same day (t) and dividing by the square root of the number of exchanges (Binder
1998). Under the assumption that the itAR ’s are normally distributed, the estimated
standard deviation of tAAR has a t-distribution (Binder 1998):
)( tAAR = NARt )( Eq. (9)
The statistical significance of the tAAR is then tested through:
tAARZ 1 / ( NARt )( ) Eq. (10)
The 2,1 ttCAAR ’s standard deviation )(( 2,1 ttCAAR is calculated from the cross-section
estimate of the standard deviation of tAAR as follows (Binder 1998):
2/12
1
2
2,1 )]([)( t
t
t
tt AARCAAR Eq. (11)
The test statistic is constructed as:
2/12
1
2
2,11 )](/[)( t
t
t
tt AARCAART Eq. (12)
Method 2: The Parametric Standardized Test
The second method, developed by Boehmer, Musumeci, and Poulsen (1991),
relaxes some of the assumptions imposed in the first. Specifically, Brown and Warner
(1980 and 1985) in addition to Brown, Harlow, and Tinic (1988) find that several events
have in fact changed the standard deviation of the abnormal returns during the event
The Cross-Border Impact of Violent Events
17
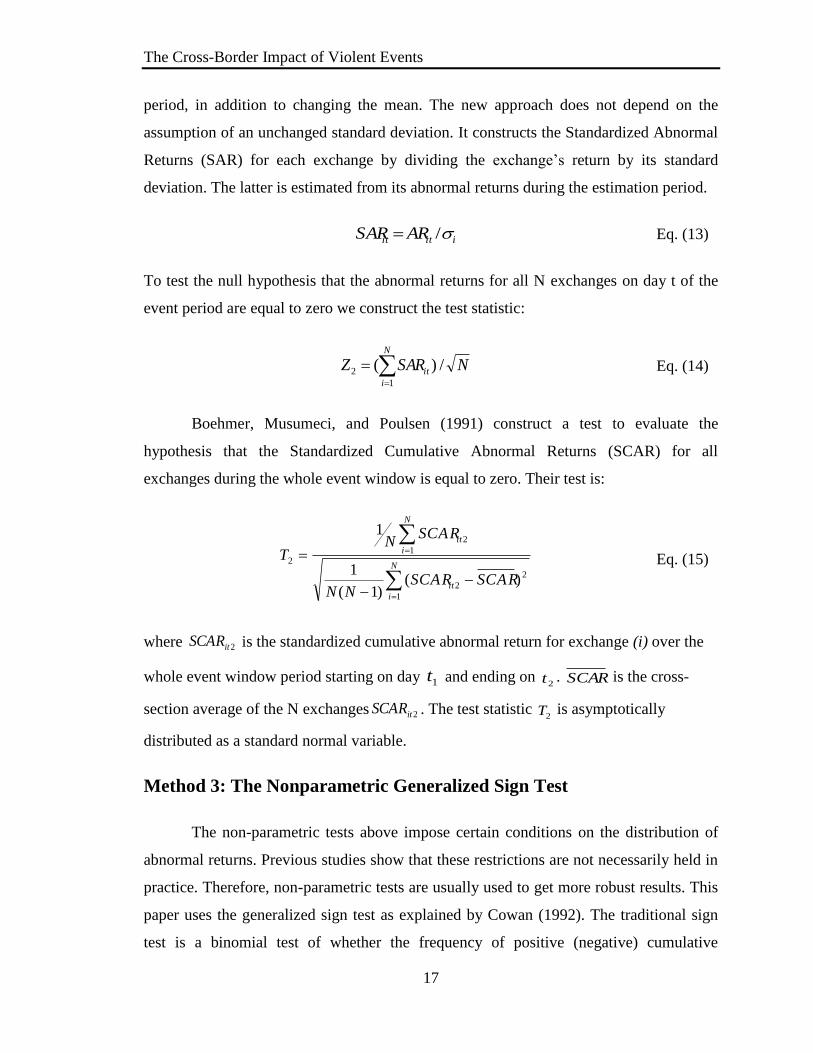
period, in addition to changing the mean. The new approach does not depend on the
assumption of an unchanged standard deviation. It constructs the Standardized Abnormal
Returns (SAR) for each exchange by dividing the exchange’s return by its standard
deviation. The latter is estimated from its abnormal returns during the estimation period.
iitit ARSAR / Eq. (13)
To test the null hypothesis that the abnormal returns for all N exchanges on day t of the
event period are equal to zero we construct the test statistic:
NSARZN
i
it / )(1
2
Eq. (14)
Boehmer, Musumeci, and Poulsen (1991) construct a test to evaluate the
hypothesis that the Standardized Cumulative Abnormal Returns (SCAR) for all
exchanges during the whole event window is equal to zero. Their test is:
2
1
2
1
2
2
)()1(
1
1
SCARSCARNN
SCARN
TN
i
it
N
i
it
Eq. (15)
where 2itSCAR is the standardized cumulative abnormal return for exchange (i) over the
whole event window period starting on day 1t and ending on 2t . SCAR is the cross-
section average of the N exchanges 2itSCAR . The test statistic 2T is asymptotically
distributed as a standard normal variable.
Method 3: The Nonparametric Generalized Sign Test
The non-parametric tests above impose certain conditions on the distribution of
abnormal returns. Previous studies show that these restrictions are not necessarily held in
practice. Therefore, non-parametric tests are usually used to get more robust results. This
paper uses the generalized sign test as explained by Cowan (1992). The traditional sign
test is a binomial test of whether the frequency of positive (negative) cumulative
The Cross-Border Impact of Violent Events
18
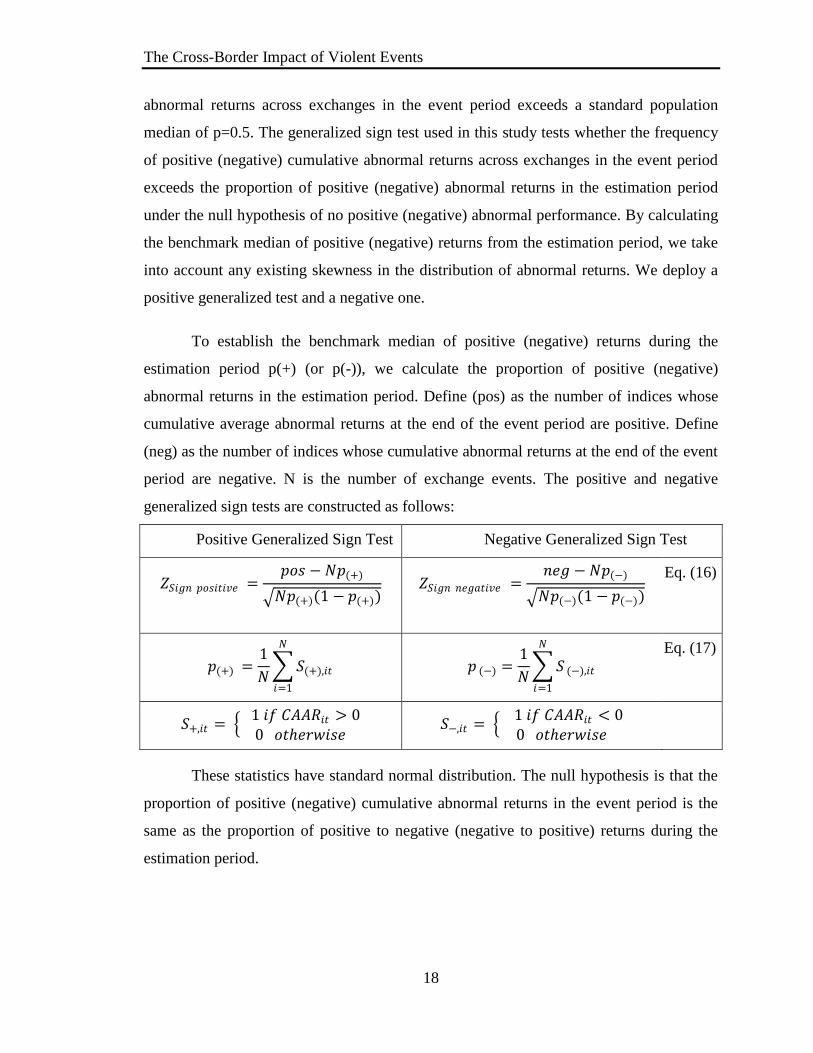
abnormal returns across exchanges in the event period exceeds a standard population
median of p=0.5. The generalized sign test used in this study tests whether the frequency
of positive (negative) cumulative abnormal returns across exchanges in the event period
exceeds the proportion of positive (negative) abnormal returns in the estimation period
under the null hypothesis of no positive (negative) abnormal performance. By calculating
the benchmark median of positive (negative) returns from the estimation period, we take
into account any existing skewness in the distribution of abnormal returns. We deploy a
positive generalized test and a negative one.
To establish the benchmark median of positive (negative) returns during the
estimation period p(+) (or p(-)), we calculate the proportion of positive (negative)
abnormal returns in the estimation period. Define (pos) as the number of indices whose
cumulative average abnormal returns at the end of the event period are positive. Define
(neg) as the number of indices whose cumulative abnormal returns at the end of the event
period are negative. N is the number of exchange events. The positive and negative
generalized sign tests are constructed as follows:
Positive Generalized Sign Test Negative Generalized Sign Test
𝑍𝑆𝑖𝑔𝑛 𝑝𝑜𝑠𝑖𝑡𝑖𝑣𝑒 =𝑝𝑜𝑠 − 𝑁𝑝(+)
𝑁𝑝(+)(1 − 𝑝(+)) 𝑍𝑆𝑖𝑔𝑛 𝑛𝑒𝑔𝑎𝑡𝑖𝑣𝑒 =
𝑛𝑒𝑔 − 𝑁𝑝(−)
𝑁𝑝(−)(1 − 𝑝(−))
Eq. (16)
𝑝(+) =1
𝑁 𝑆(+),𝑖𝑡
𝑁
𝑖=1
𝑝 (−) =1
𝑁 𝑆 (−),𝑖𝑡
𝑁
𝑖=1
Eq. (17)
𝑆+,𝑖𝑡 = 1 𝑖𝑓 𝐶𝐴𝐴𝑅𝑖𝑡 > 0
0 𝑜𝑡𝑒𝑟𝑤𝑖𝑠𝑒 𝑆−,𝑖𝑡 =
1 𝑖𝑓 𝐶𝐴𝐴𝑅𝑖𝑡 < 00 𝑜𝑡𝑒𝑟𝑤𝑖𝑠𝑒
These statistics have standard normal distribution. The null hypothesis is that the
proportion of positive (negative) cumulative abnormal returns in the event period is the
same as the proportion of positive to negative (negative to positive) returns during the
estimation period.
The Cross-Border Impact of Violent Events
19
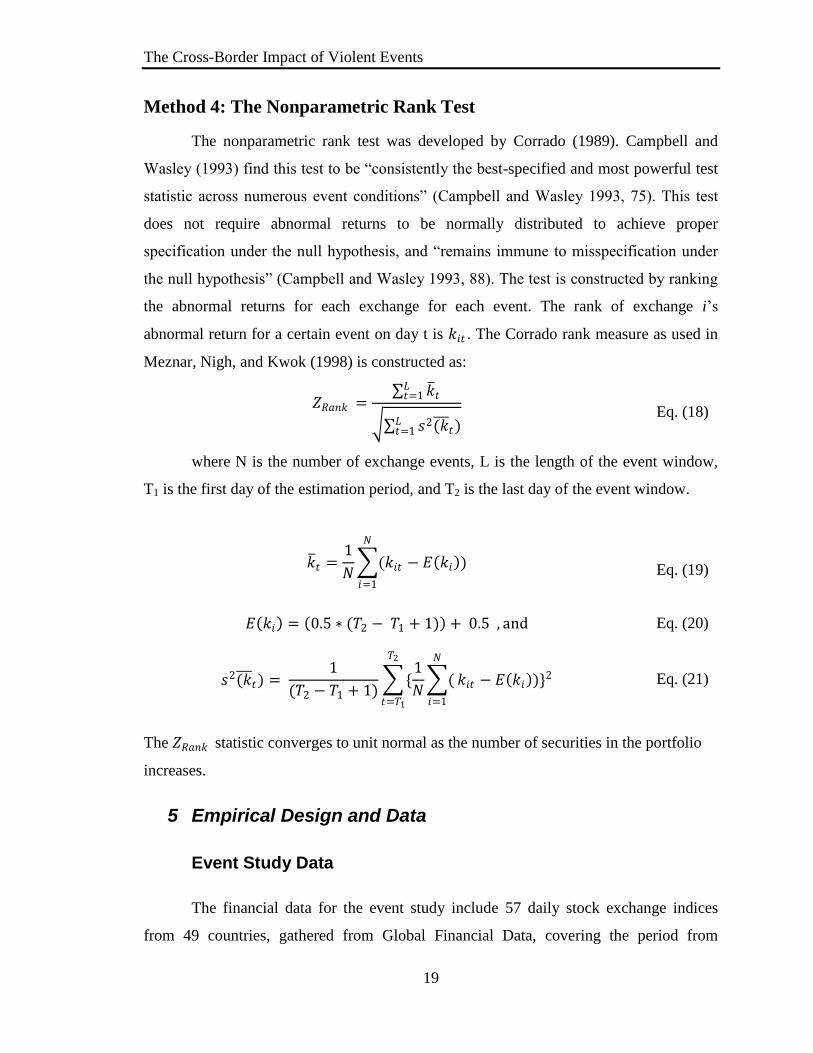
Method 4: The Nonparametric Rank Test
The nonparametric rank test was developed by Corrado (1989). Campbell and
Wasley (1993) find this test to be “consistently the best-specified and most powerful test
statistic across numerous event conditions” (Campbell and Wasley 1993, 75). This test
does not require abnormal returns to be normally distributed to achieve proper
specification under the null hypothesis, and “remains immune to misspecification under
the null hypothesis” (Campbell and Wasley 1993, 88). The test is constructed by ranking
the abnormal returns for each exchange for each event. The rank of exchange i’s
abnormal return for a certain event on day t is 𝑘𝑖𝑡 . The Corrado rank measure as used in
Meznar, Nigh, and Kwok (1998) is constructed as:
𝑍𝑅𝑎𝑛𝑘 = 𝑘 𝑡
𝐿𝑡=1
𝑠2(𝑘 𝑡)𝐿𝑡=1
Eq. (18)
where N is the number of exchange events, L is the length of the event window,
T1 is the first day of the estimation period, and T2 is the last day of the event window.
𝑘 𝑡 =1
𝑁 (𝑘𝑖𝑡 − 𝐸 𝑘𝑖 )
𝑁
𝑖=1
Eq. (19)
𝐸 𝑘𝑖 = 0.5 ∗ (𝑇2 − 𝑇1 + 1) + 0.5 , and Eq. (20)
𝑠2(𝑘 𝑡) = 1
(𝑇2 − 𝑇1 + 1) {
1
𝑁 (
𝑁
𝑖=1
𝑘𝑖𝑡 − 𝐸 𝑘𝑖 )
𝑇2
𝑡=𝑇1
}2 Eq. (21)
The 𝑍𝑅𝑎𝑛𝑘 statistic converges to unit normal as the number of securities in the portfolio
increases.
5 Empirical Design and Data
Event Study Data
The financial data for the event study include 57 daily stock exchange indices
from 49 countries, gathered from Global Financial Data, covering the period from
The Cross-Border Impact of Violent Events
20
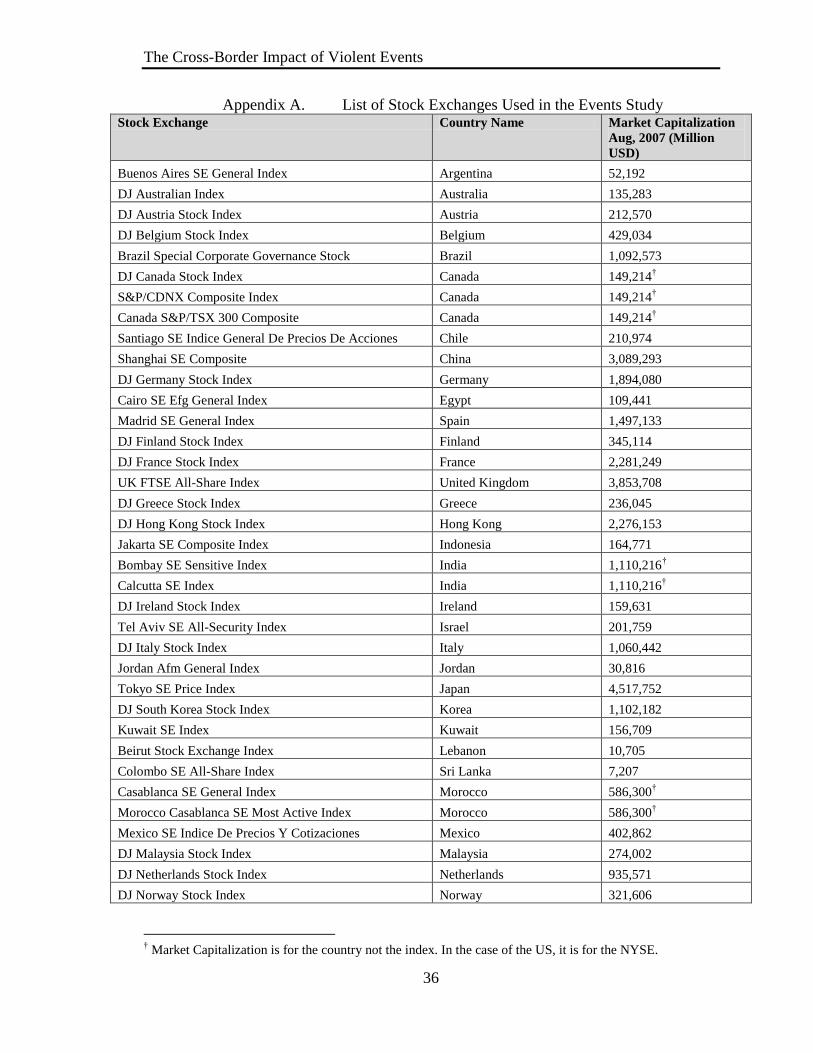
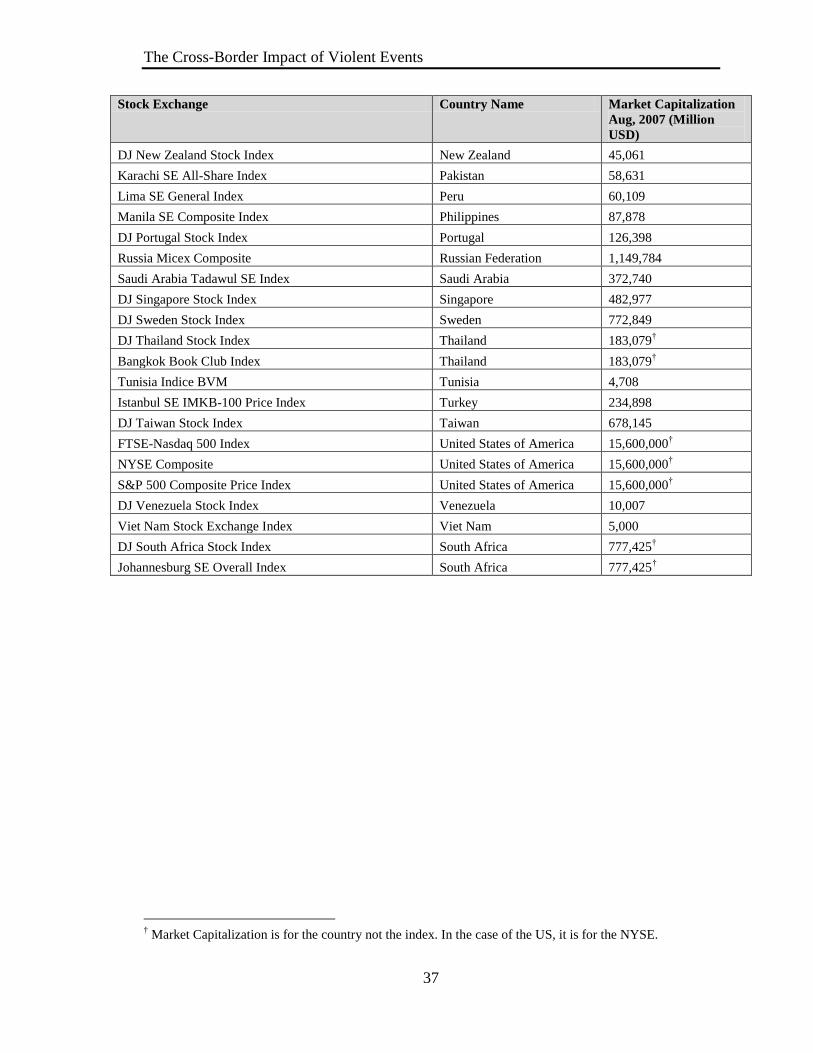
January 1, 1988 to December 31, 2007. Appendix A lists the stock exchange indices used
in this study.
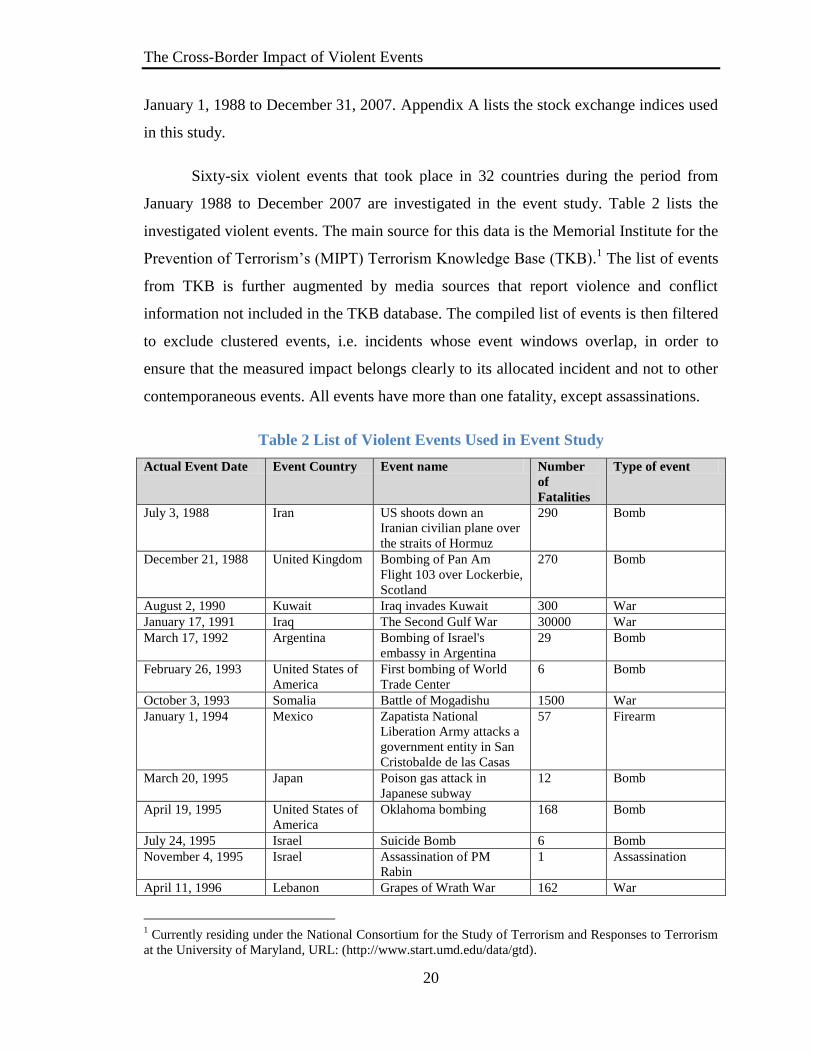
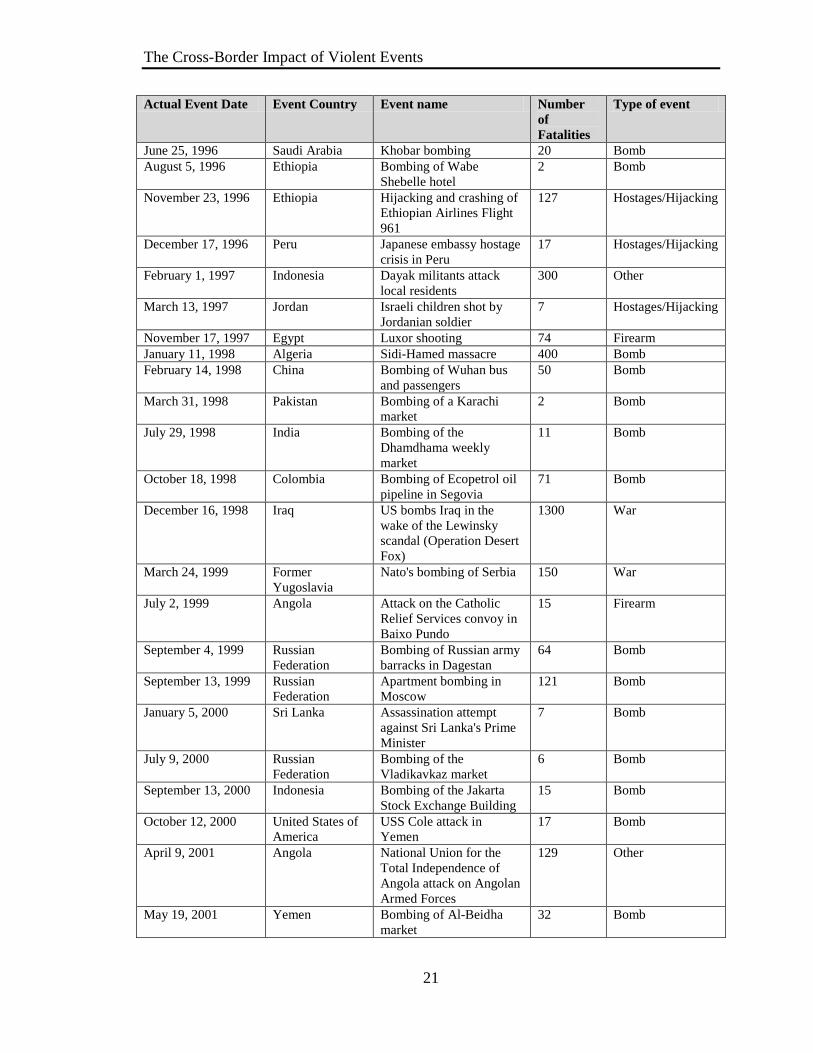
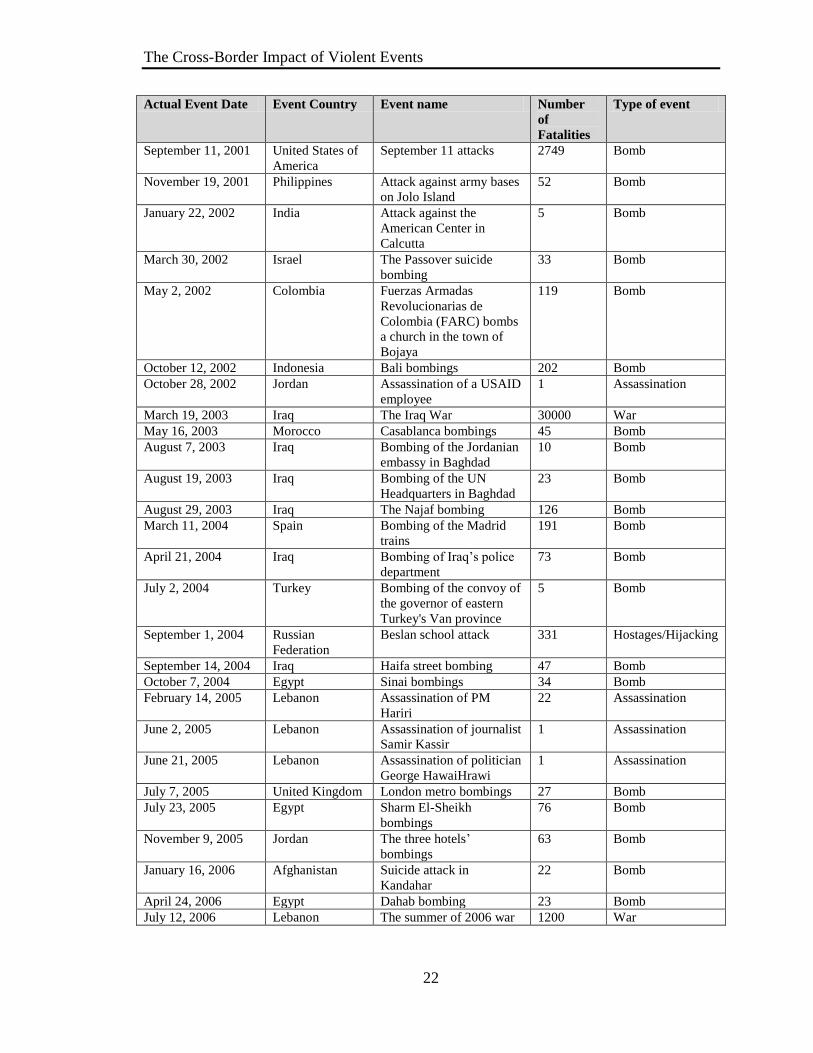
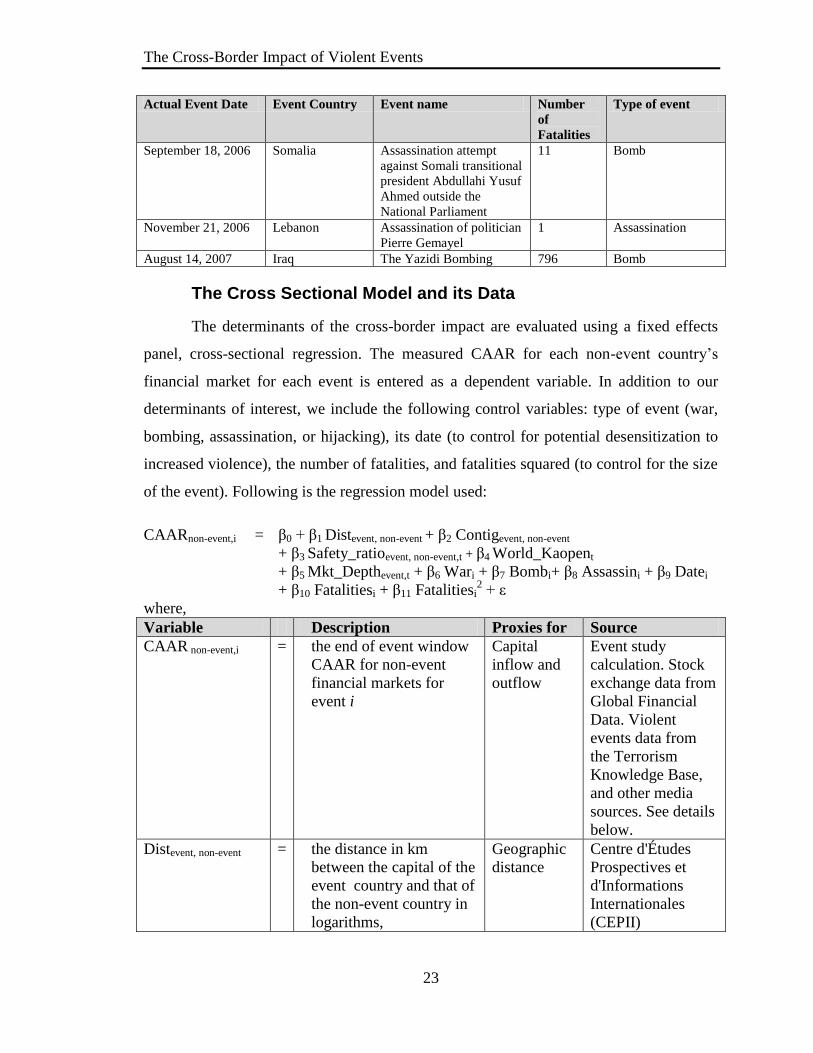
Sixty-six violent events that took place in 32 countries during the period from
January 1988 to December 2007 are investigated in the event study. Table 2 lists the
investigated violent events. The main source for this data is the Memorial Institute for the
Prevention of Terrorism’s (MIPT) Terrorism Knowledge Base (TKB).1 The list of events
from TKB is further augmented by media sources that report violence and conflict
information not included in the TKB database. The compiled list of events is then filtered
to exclude clustered events, i.e. incidents whose event windows overlap, in order to
ensure that the measured impact belongs clearly to its allocated incident and not to other
contemporaneous events. All events have more than one fatality, except assassinations.
Table 2 List of Violent Events Used in Event Study
Actual Event Date Event Country Event name Number
of
Fatalities
Type of event
July 3, 1988 Iran US shoots down an
Iranian civilian plane over
the straits of Hormuz
290 Bomb
December 21, 1988 United Kingdom Bombing of Pan Am
Flight 103 over Lockerbie,
Scotland
270 Bomb
August 2, 1990 Kuwait Iraq invades Kuwait 300 War
January 17, 1991 Iraq The Second Gulf War 30000 War
March 17, 1992 Argentina Bombing of Israel's
embassy in Argentina
29 Bomb
February 26, 1993 United States of
America
First bombing of World
Trade Center
6 Bomb
October 3, 1993 Somalia Battle of Mogadishu 1500 War
January 1, 1994 Mexico Zapatista National
Liberation Army attacks a
government entity in San
Cristobalde de las Casas
57 Firearm
March 20, 1995 Japan Poison gas attack in
Japanese subway
12 Bomb
April 19, 1995 United States of
America
Oklahoma bombing 168 Bomb
July 24, 1995 Israel Suicide Bomb 6 Bomb
November 4, 1995 Israel Assassination of PM
Rabin
1 Assassination
April 11, 1996 Lebanon Grapes of Wrath War 162 War
1 Currently residing under the National Consortium for the Study of Terrorism and Responses to Terrorism
at the University of Maryland, URL: (http://www.start.umd.edu/data/gtd).
The Cross-Border Impact of Violent Events
21
Actual Event Date Event Country Event name Number
of
Fatalities
Type of event
June 25, 1996 Saudi Arabia Khobar bombing 20 Bomb
August 5, 1996 Ethiopia Bombing of Wabe
Shebelle hotel
2 Bomb
November 23, 1996 Ethiopia Hijacking and crashing of
Ethiopian Airlines Flight
961
127 Hostages/Hijacking
December 17, 1996 Peru Japanese embassy hostage
crisis in Peru
17 Hostages/Hijacking
February 1, 1997 Indonesia Dayak militants attack
local residents
300 Other
March 13, 1997 Jordan Israeli children shot by
Jordanian soldier
7 Hostages/Hijacking
November 17, 1997 Egypt Luxor shooting 74 Firearm
January 11, 1998 Algeria Sidi-Hamed massacre 400 Bomb
February 14, 1998 China Bombing of Wuhan bus
and passengers
50 Bomb
March 31, 1998 Pakistan Bombing of a Karachi
market
2 Bomb
July 29, 1998 India Bombing of the
Dhamdhama weekly
market
11 Bomb
October 18, 1998 Colombia Bombing of Ecopetrol oil
pipeline in Segovia
71 Bomb
December 16, 1998 Iraq US bombs Iraq in the
wake of the Lewinsky
scandal (Operation Desert
Fox)
1300 War
March 24, 1999 Former
Yugoslavia
Nato's bombing of Serbia 150 War
July 2, 1999 Angola Attack on the Catholic
Relief Services convoy in
Baixo Pundo
15 Firearm
September 4, 1999 Russian
Federation
Bombing of Russian army
barracks in Dagestan
64 Bomb
September 13, 1999 Russian
Federation
Apartment bombing in
Moscow
121 Bomb
January 5, 2000 Sri Lanka Assassination attempt
against Sri Lanka's Prime
Minister
7 Bomb
July 9, 2000 Russian
Federation
Bombing of the
Vladikavkaz market
6 Bomb
September 13, 2000 Indonesia Bombing of the Jakarta
Stock Exchange Building
15 Bomb
October 12, 2000 United States of
America
USS Cole attack in
Yemen
17 Bomb
April 9, 2001 Angola National Union for the
Total Independence of
Angola attack on Angolan
Armed Forces
129 Other
May 19, 2001 Yemen Bombing of Al-Beidha
market
32 Bomb
The Cross-Border Impact of Violent Events
22
Actual Event Date Event Country Event name Number
of
Fatalities
Type of event
September 11, 2001 United States of
America
September 11 attacks 2749 Bomb
November 19, 2001 Philippines Attack against army bases
on Jolo Island
52 Bomb
January 22, 2002 India Attack against the
American Center in
Calcutta
5 Bomb
March 30, 2002 Israel The Passover suicide
bombing
33 Bomb
May 2, 2002 Colombia Fuerzas Armadas
Revolucionarias de
Colombia (FARC) bombs
a church in the town of
Bojaya
119 Bomb
October 12, 2002 Indonesia Bali bombings 202 Bomb
October 28, 2002 Jordan Assassination of a USAID
employee
1 Assassination
March 19, 2003 Iraq The Iraq War 30000 War
May 16, 2003 Morocco Casablanca bombings 45 Bomb
August 7, 2003 Iraq Bombing of the Jordanian
embassy in Baghdad
10 Bomb
August 19, 2003 Iraq Bombing of the UN
Headquarters in Baghdad
23 Bomb
August 29, 2003 Iraq The Najaf bombing 126 Bomb
March 11, 2004 Spain Bombing of the Madrid
trains
191 Bomb
April 21, 2004 Iraq Bombing of Iraq’s police
department
73 Bomb
July 2, 2004 Turkey Bombing of the convoy of
the governor of eastern
Turkey's Van province
5 Bomb
September 1, 2004 Russian
Federation
Beslan school attack 331 Hostages/Hijacking
September 14, 2004 Iraq Haifa street bombing 47 Bomb
October 7, 2004 Egypt Sinai bombings 34 Bomb
February 14, 2005 Lebanon Assassination of PM
Hariri
22 Assassination
June 2, 2005 Lebanon Assassination of journalist
Samir Kassir
1 Assassination
June 21, 2005 Lebanon Assassination of politician
George HawaiHrawi
1 Assassination
July 7, 2005 United Kingdom London metro bombings 27 Bomb
July 23, 2005 Egypt Sharm El-Sheikh
bombings
76 Bomb
November 9, 2005 Jordan The three hotels’
bombings
63 Bomb
January 16, 2006 Afghanistan Suicide attack in
Kandahar
22 Bomb
April 24, 2006 Egypt Dahab bombing 23 Bomb
July 12, 2006 Lebanon The summer of 2006 war 1200 War
The Cross-Border Impact of Violent Events
23
Actual Event Date Event Country Event name Number
of
Fatalities
Type of event
September 18, 2006 Somalia Assassination attempt
against Somali transitional
president Abdullahi Yusuf
Ahmed outside the
National Parliament
11 Bomb
November 21, 2006 Lebanon Assassination of politician
Pierre Gemayel
1 Assassination
August 14, 2007 Iraq The Yazidi Bombing 796 Bomb
The Cross Sectional Model and its Data
The determinants of the cross-border impact are evaluated using a fixed effects
panel, cross-sectional regression. The measured CAAR for each non-event country’s
financial market for each event is entered as a dependent variable. In addition to our
determinants of interest, we include the following control variables: type of event (war,
bombing, assassination, or hijacking), its date (to control for potential desensitization to
increased violence), the number of fatalities, and fatalities squared (to control for the size
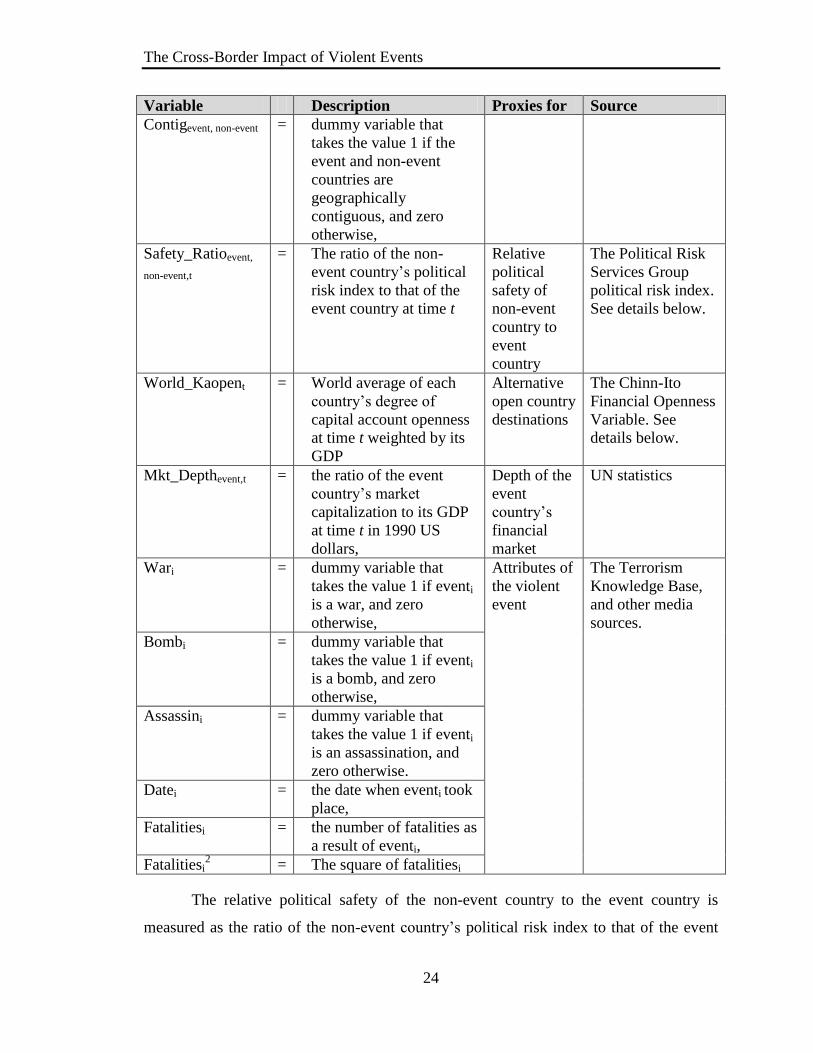
of the event). Following is the regression model used:
CAARnon-event,i = β0 + β1 Distevent, non-event + β2 Contigevent, non-event
+ β3 Safety_ratioevent, non-event,t + β4 World_Kaopent
+ β5 Mkt_Depthevent,t + β6 Wari + β7 Bombi+ β8 Assassini + β9 Datei
+ β10 Fatalitiesi + β11 Fatalitiesi2 + ε
where,
Variable Description Proxies for Source
CAAR non-event,i = the end of event window
CAAR for non-event
financial markets for
event i
Capital
inflow and
outflow
Event study
calculation. Stock
exchange data from
Global Financial
Data. Violent
events data from
the Terrorism
Knowledge Base,
and other media
sources. See details
below.
Distevent, non-event = the distance in km
between the capital of the
event country and that of
the non-event country in
logarithms,
Geographic
distance
Centre d'Études
Prospectives et
d'Informations
Internationales
(CEPII)
The Cross-Border Impact of Violent Events
24
Variable Description Proxies for Source
Contigevent, non-event = dummy variable that
takes the value 1 if the
event and non-event
countries are
geographically
contiguous, and zero
otherwise,
Safety_Ratioevent,
non-event,t
= The ratio of the non-
event country’s political
risk index to that of the
event country at time t
Relative
political
safety of
non-event
country to
event
country
The Political Risk
Services Group
political risk index.
See details below.
World_Kaopent = World average of each
country’s degree of
capital account openness
at time t weighted by its
GDP
Alternative
open country
destinations
The Chinn-Ito
Financial Openness
Variable. See
details below.
Mkt_Depthevent,t = the ratio of the event
country’s market
capitalization to its GDP
at time t in 1990 US
dollars,
Depth of the
event
country’s
financial
market
UN statistics
Wari = dummy variable that
takes the value 1 if eventi
is a war, and zero
otherwise,
Attributes of
the violent
event
The Terrorism
Knowledge Base,
and other media
sources.
Bombi = dummy variable that
takes the value 1 if eventi
is a bomb, and zero
otherwise,
Assassini = dummy variable that
takes the value 1 if eventi
is an assassination, and
zero otherwise.
Datei = the date when eventi took
place,
Fatalitiesi = the number of fatalities as
a result of eventi,
Fatalitiesi2 = The square of fatalitiesi
The relative political safety of the non-event country to the event country is
measured as the ratio of the non-event country’s political risk index to that of the event
The Cross-Border Impact of Violent Events
25
country at time t. The political risk index, constructed by the Political Risk Services
Group, takes into account each country’s government stability, socioeconomic
conditions, investment profile, internal conflict, external conflict, corruption, military in
politics, religious tensions, law and order, ethnic tensions, democratic accountability, and
bureaucracy quality.
We proxy the number of alternative open economies that capital can flow to using
the Financial Openness Variable (Kaopen) developed by Chinn and Ito (2008). The
Kaopen combines four binary dummy variables reported in the IMF’s Annual Report on
Exchange Arrangements and Exchange Restrictions to measure the nature and extent of a
country’s capital account openness. We use the average of Kaopen across all countries
for a given year weighted by each country’s GDP for that year, to proxy for the number
of open countries in a given time.
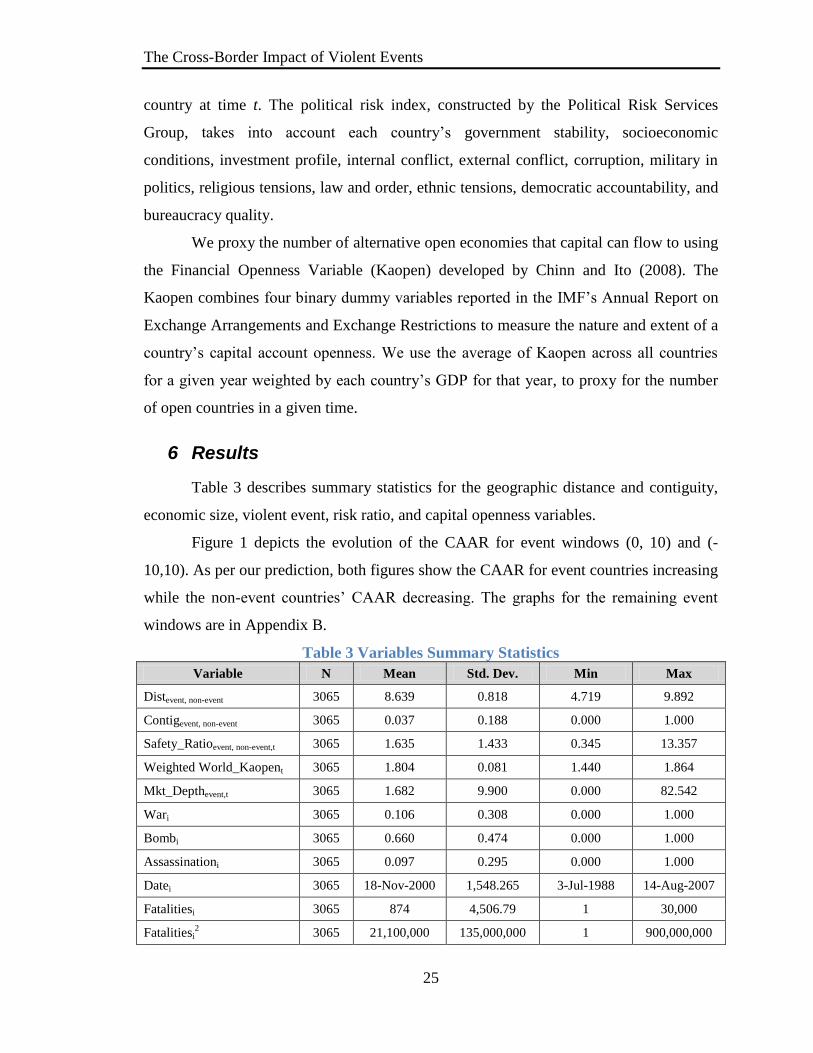
6 Results
Table 3 describes summary statistics for the geographic distance and contiguity,
economic size, violent event, risk ratio, and capital openness variables.
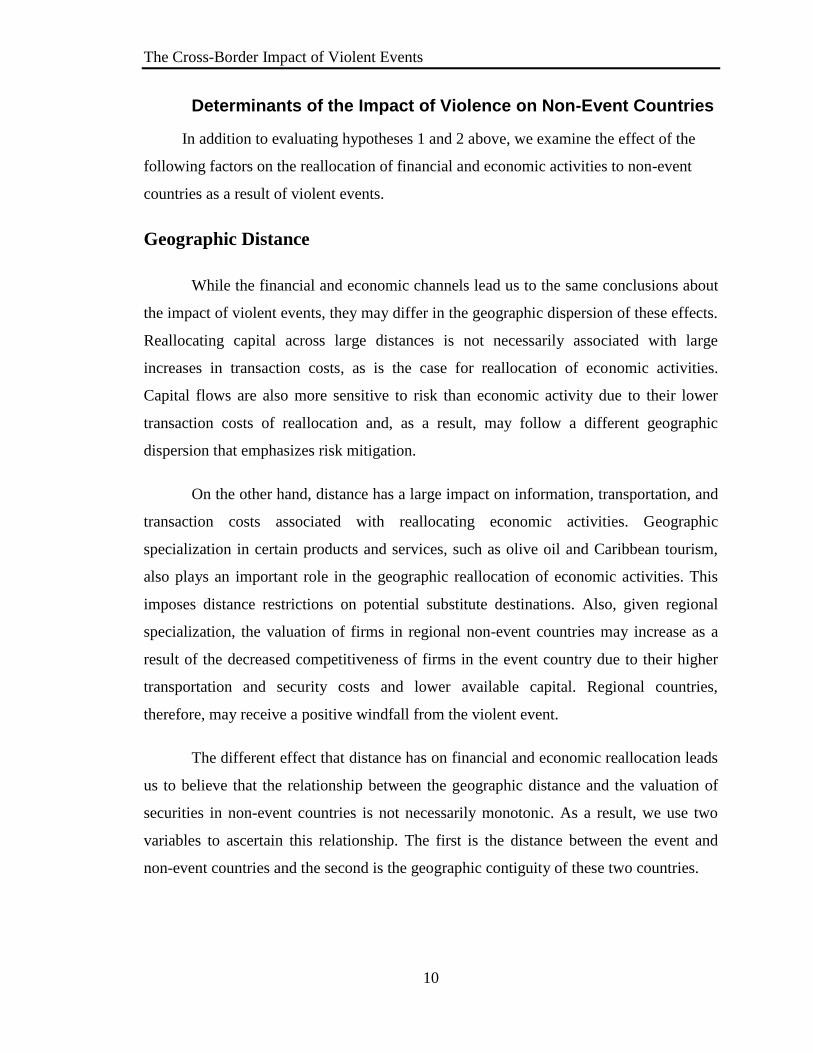
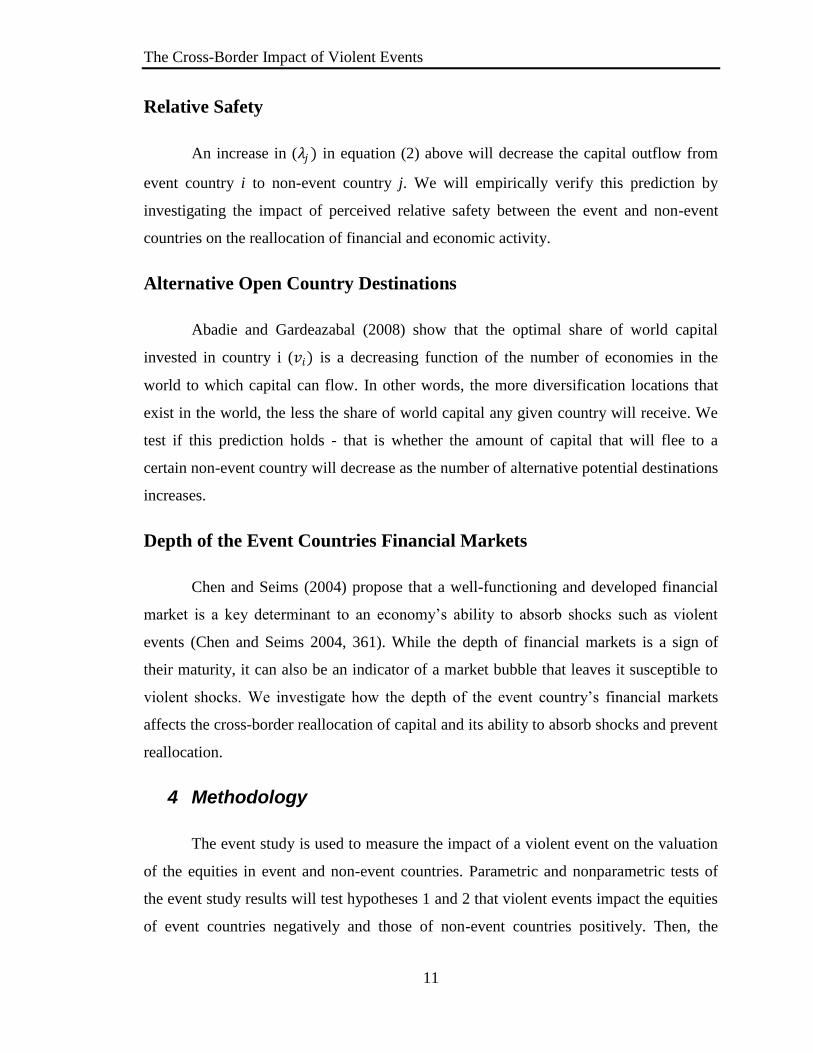
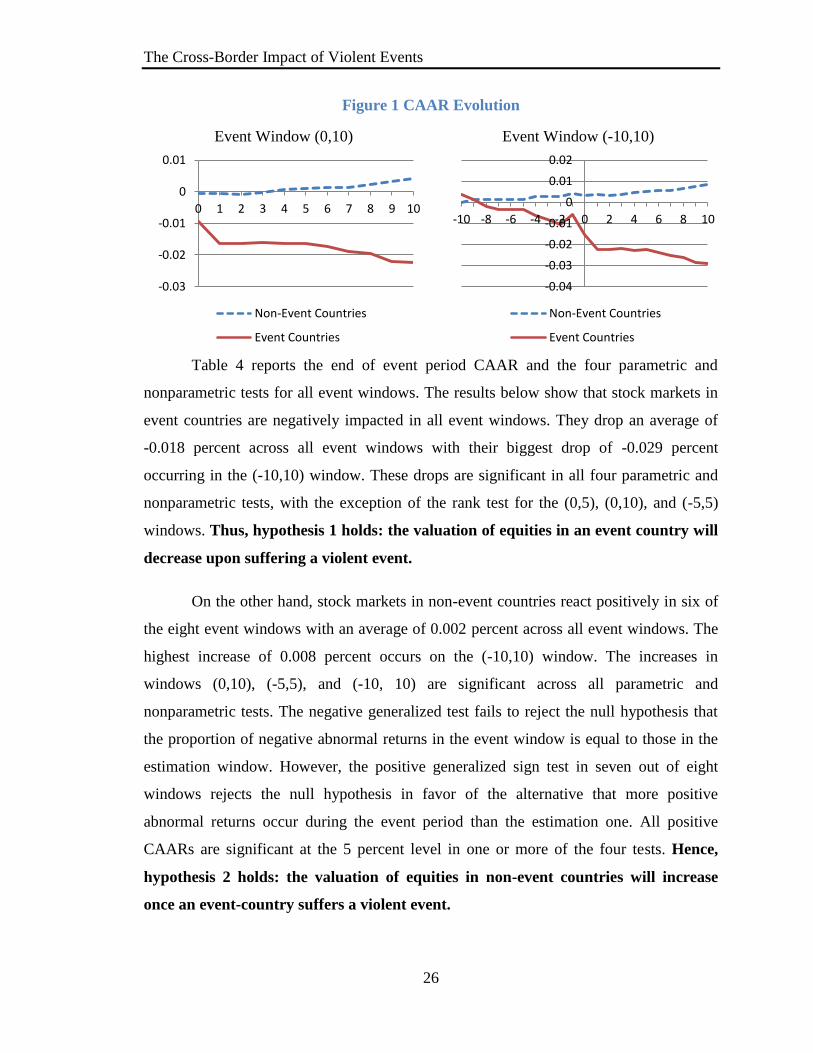
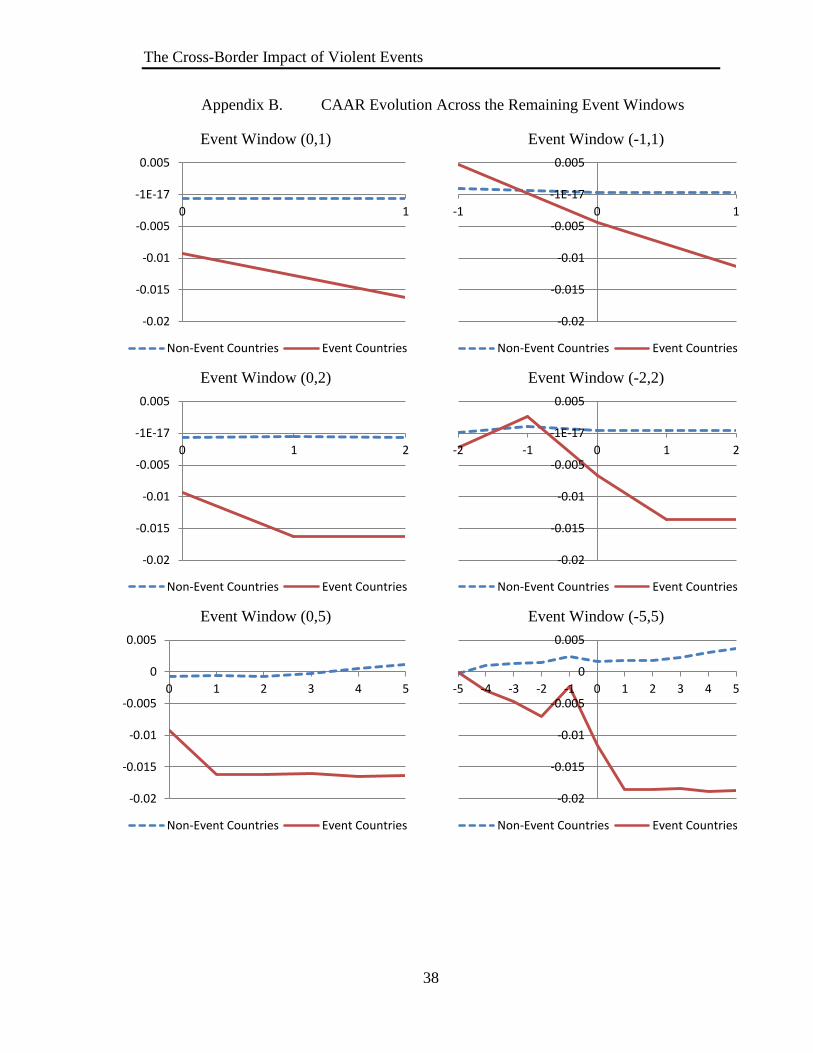
Figure 1 depicts the evolution of the CAAR for event windows (0, 10) and (-
10,10). As per our prediction, both figures show the CAAR for event countries increasing
while the non-event countries’ CAAR decreasing. The graphs for the remaining event
windows are in Appendix B.
Table 3 Variables Summary Statistics
Variable N Mean Std. Dev. Min Max
Distevent, non-event 3065 8.639 0.818 4.719 9.892
Contigevent, non-event 3065 0.037 0.188 0.000 1.000
Safety_Ratioevent, non-event,t 3065 1.635 1.433 0.345 13.357
Weighted World_Kaopent 3065 1.804 0.081 1.440 1.864
Mkt_Depthevent,t 3065 1.682 9.900 0.000 82.542
Wari 3065 0.106 0.308 0.000 1.000
Bombi 3065 0.660 0.474 0.000 1.000
Assassinationi 3065 0.097 0.295 0.000 1.000
Datei 3065 18-Nov-2000 1,548.265 3-Jul-1988 14-Aug-2007
Fatalitiesi 3065 874 4,506.79 1 30,000
Fatalitiesi2 3065 21,100,000 135,000,000 1 900,000,000
The Cross-Border Impact of Violent Events
26
Figure 1 CAAR Evolution
Event Window (0,10) Event Window (-10,10)
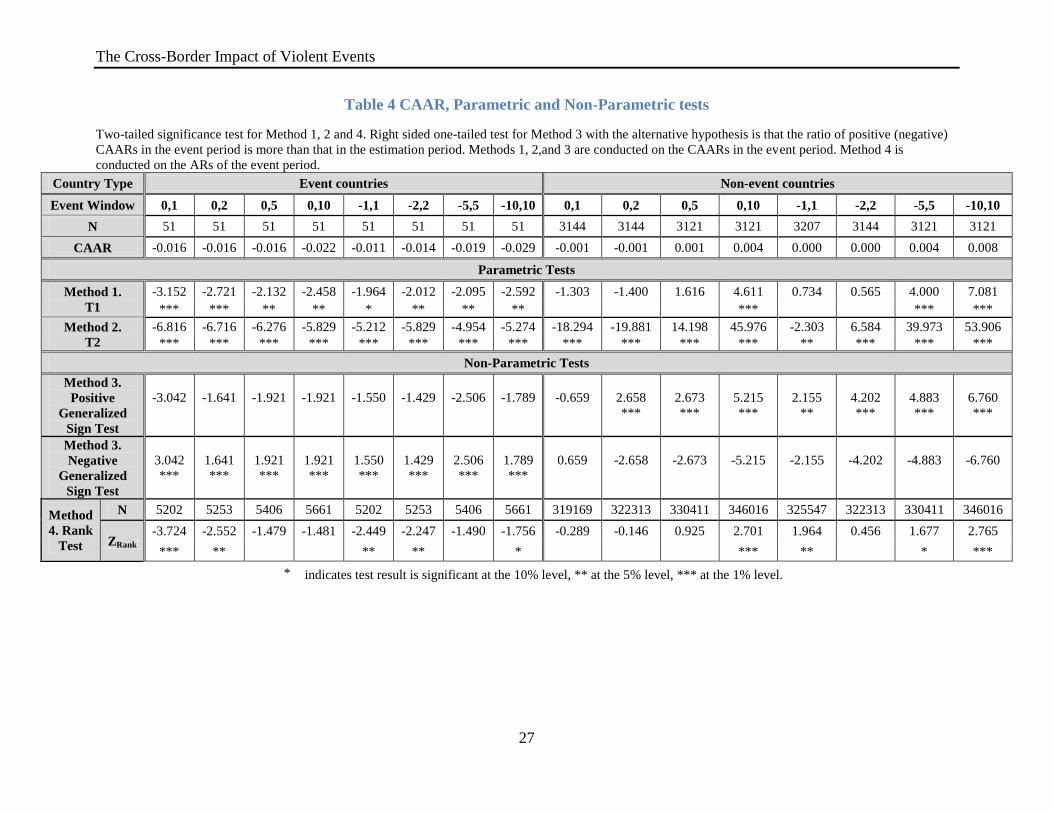
Table 4 reports the end of event period CAAR and the four parametric and
nonparametric tests for all event windows. The results below show that stock markets in
event countries are negatively impacted in all event windows. They drop an average of
-0.018 percent across all event windows with their biggest drop of -0.029 percent
occurring in the (-10,10) window. These drops are significant in all four parametric and
nonparametric tests, with the exception of the rank test for the (0,5), (0,10), and (-5,5)
windows. Thus, hypothesis 1 holds: the valuation of equities in an event country will
decrease upon suffering a violent event.
On the other hand, stock markets in non-event countries react positively in six of
the eight event windows with an average of 0.002 percent across all event windows. The
highest increase of 0.008 percent occurs on the (-10,10) window. The increases in
windows (0,10), (-5,5), and (-10, 10) are significant across all parametric and
nonparametric tests. The negative generalized test fails to reject the null hypothesis that
the proportion of negative abnormal returns in the event window is equal to those in the
estimation window. However, the positive generalized sign test in seven out of eight
windows rejects the null hypothesis in favor of the alternative that more positive
abnormal returns occur during the event period than the estimation one. All positive
CAARs are significant at the 5 percent level in one or more of the four tests. Hence,
hypothesis 2 holds: the valuation of equities in non-event countries will increase
once an event-country suffers a violent event.
-0.03
-0.02
-0.01
0
0.01
0 1 2 3 4 5 6 7 8 9 10
Non-Event Countries
Event Countries
-0.04
-0.03
-0.02
-0.01
0
0.01
0.02
-10 -8 -6 -4 -2 0 2 4 6 8 10
Non-Event Countries
Event Countries
The Cross-Border Impact of Violent Events
27
Table 4 CAAR, Parametric and Non-Parametric tests
Two-tailed significance test for Method 1, 2 and 4. Right sided one-tailed test for Method 3 with the alternative hypothesis is that the ratio of positive (negative)
CAARs in the event period is more than that in the estimation period. Methods 1, 2,and 3 are conducted on the CAARs in the event period. Method 4 is
conducted on the ARs of the event period.
Country Type Event countries Non-event countries
Event Window 0,1 0,2 0,5 0,10 -1,1 -2,2 -5,5 -10,10 0,1 0,2 0,5 0,10 -1,1 -2,2 -5,5 -10,10
N 51 51 51 51 51 51 51 51 3144 3144 3121 3121 3207 3144 3121 3121
CAAR -0.016 -0.016 -0.016 -0.022 -0.011 -0.014 -0.019 -0.029 -0.001 -0.001 0.001 0.004 0.000 0.000 0.004 0.008
Parametric Tests
Method 1.
T1
-3.152 -2.721 -2.132 -2.458 -1.964 -2.012 -2.095 -2.592 -1.303 -1.400 1.616 4.611 0.734 0.565 4.000 7.081
*** *** ** ** * ** ** ** *** *** ***
Method 2.
T2
-6.816 -6.716 -6.276 -5.829 -5.212 -5.829 -4.954 -5.274 -18.294 -19.881 14.198 45.976 -2.303 6.584 39.973 53.906
*** *** *** *** *** *** *** *** *** *** *** *** ** *** *** ***
Non-Parametric Tests
Method 3.
Positive
Generalized
Sign Test
-3.042
-1.641
-1.921
-1.921
-1.550
-1.429
-2.506
-1.789
-0.659
2.658
***
2.673
***
5.215
***
2.155
**
4.202
***
4.883
***
6.760
***
Method 3.
Negative
Generalized
Sign Test
3.042
***
1.641
***
1.921
***
1.921
***
1.550
***
1.429
***
2.506
***
1.789
***
0.659
-2.658
-2.673
-5.215
-2.155
-4.202
-4.883
-6.760
Method
4. Rank
Test
N 5202 5253 5406 5661 5202 5253 5406 5661 319169 322313 330411 346016 325547 322313 330411 346016
ZRank -3.724 -2.552 -1.479 -1.481 -2.449 -2.247 -1.490 -1.756 -0.289 -0.146 0.925 2.701 1.964 0.456 1.677 2.765
*** ** ** ** * *** ** * ***
*
indicates test result is significant at the 10% level, ** at the 5% level, *** at the 1% level.
The Cross-Border Impact of Violent Events
28
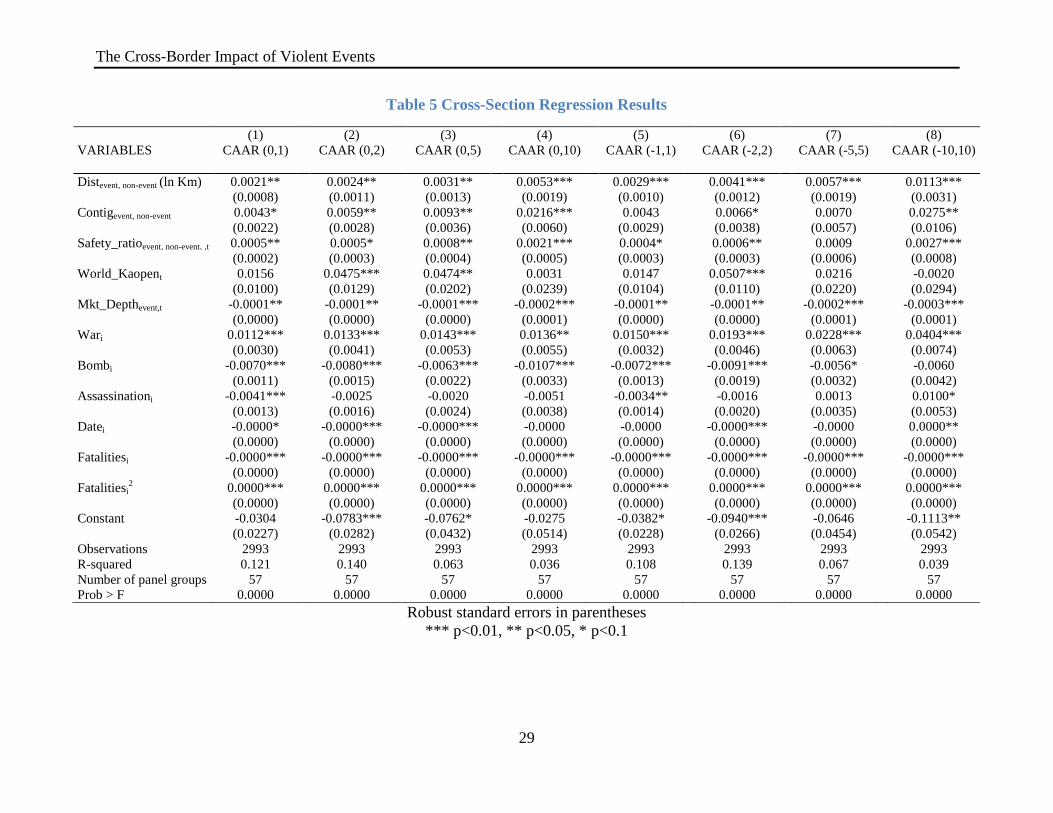
Table 5 below reports the results of the cross-section fixed effects panel regression for all
event windows. The coefficient of the geographic distance between event and non-event
countries (Distevent, non-event) is positive and significant at the 5 percent level across all event
windows. However, the (Contigevent, non-event) dummy variable, which describes whether the event
and non-event countries are geographically contiguous, is also positive and significant. This
confirms predictions that the impact of geographic distance on the valuation of securities in non-
event countries is not monotonic. It is possible that capital is flowing from event countries to
geographically distant destinations to mitigate its risk exposure in the wake of the violent event,
while economic activities are shifting to geographically contiguous destinations. Further research
is required to test this proposition and examine the underlying interactions between distance and
each of the financial and economic channels following a violent event.
The relative perceived safety of the non-event country to the event country
(Safety_ratioevent, non-event, ,t) is positive as predicted. It is significant in seven of the eight event
windows. In seeking to mitigate risk, investors will reallocate more of their investment and
economic activities into safer non-event countries.
The (World_Kaopent) variable, which proxies the number of alternative open non-event
destinations into which capital can flow, is positive in seven of the eight event windows, and is
significant in three of these instances. This is the opposite direction of the prediction of Abadie
and Gardeazabal (2008) that the more alternative open destinations into which capital can flow,
the less the share that a given country will receive. It is possible that our proxy is measuring the
ease of reallocating capital due to the openness of financial markets rather than the number of
alternative open destinations and is, therefore, inadequate. This would yield a positive result, as
opposed to the negative one resulting from increased competing destinations.
The coefficient for (Mkt_Depthevent,t) is negative and significant, indicating that event
countries with deeper financial markets are less susceptible to capital reallocation following an
event. This supports Chen and Seims’ (2004) proposition that mature financial markets play an
important role in enabling countries to absorb shocks from violent events.
The Cross-Border Impact of Violent Events
29
Table 5 Cross-Section Regression Results
(1) (2) (3) (4) (5) (6) (7) (8)
VARIABLES CAAR (0,1) CAAR (0,2) CAAR (0,5) CAAR (0,10) CAAR (-1,1) CAAR (-2,2) CAAR (-5,5) CAAR (-10,10)
Distevent, non-event (ln Km) 0.0021** 0.0024** 0.0031** 0.0053*** 0.0029*** 0.0041*** 0.0057*** 0.0113***
(0.0008) (0.0011) (0.0013) (0.0019) (0.0010) (0.0012) (0.0019) (0.0031)
Contigevent, non-event 0.0043* 0.0059** 0.0093** 0.0216*** 0.0043 0.0066* 0.0070 0.0275**
(0.0022) (0.0028) (0.0036) (0.0060) (0.0029) (0.0038) (0.0057) (0.0106)
Safety_ratioevent, non-event, ,t 0.0005** 0.0005* 0.0008** 0.0021*** 0.0004* 0.0006** 0.0009 0.0027***
(0.0002) (0.0003) (0.0004) (0.0005) (0.0003) (0.0003) (0.0006) (0.0008)
World_Kaopent 0.0156 0.0475*** 0.0474** 0.0031 0.0147 0.0507*** 0.0216 -0.0020
(0.0100) (0.0129) (0.0202) (0.0239) (0.0104) (0.0110) (0.0220) (0.0294)
Mkt_Depthevent,t -0.0001** -0.0001** -0.0001*** -0.0002*** -0.0001** -0.0001** -0.0002*** -0.0003***
(0.0000) (0.0000) (0.0000) (0.0001) (0.0000) (0.0000) (0.0001) (0.0001)
Wari 0.0112*** 0.0133*** 0.0143*** 0.0136** 0.0150*** 0.0193*** 0.0228*** 0.0404***
(0.0030) (0.0041) (0.0053) (0.0055) (0.0032) (0.0046) (0.0063) (0.0074)
Bombi -0.0070*** -0.0080*** -0.0063*** -0.0107*** -0.0072*** -0.0091*** -0.0056* -0.0060
(0.0011) (0.0015) (0.0022) (0.0033) (0.0013) (0.0019) (0.0032) (0.0042)
Assassinationi -0.0041*** -0.0025 -0.0020 -0.0051 -0.0034** -0.0016 0.0013 0.0100*
(0.0013) (0.0016) (0.0024) (0.0038) (0.0014) (0.0020) (0.0035) (0.0053)
Datei -0.0000* -0.0000*** -0.0000*** -0.0000 -0.0000 -0.0000*** -0.0000 0.0000**
(0.0000) (0.0000) (0.0000) (0.0000) (0.0000) (0.0000) (0.0000) (0.0000)
Fatalitiesi -0.0000*** -0.0000*** -0.0000*** -0.0000*** -0.0000*** -0.0000*** -0.0000*** -0.0000***
(0.0000) (0.0000) (0.0000) (0.0000) (0.0000) (0.0000) (0.0000) (0.0000)
Fatalitiesi2 0.0000*** 0.0000*** 0.0000*** 0.0000*** 0.0000*** 0.0000*** 0.0000*** 0.0000***
(0.0000) (0.0000) (0.0000) (0.0000) (0.0000) (0.0000) (0.0000) (0.0000)
Constant -0.0304 -0.0783*** -0.0762* -0.0275 -0.0382* -0.0940*** -0.0646 -0.1113**
(0.0227) (0.0282) (0.0432) (0.0514) (0.0228) (0.0266) (0.0454) (0.0542)
Observations 2993 2993 2993 2993 2993 2993 2993 2993
R-squared 0.121 0.140 0.063 0.036 0.108 0.139 0.067 0.039
Number of panel groups 57 57 57 57 57 57 57 57
Prob > F 0.0000 0.0000 0.0000 0.0000 0.0000 0.0000 0.0000 0.0000
Robust standard errors in parentheses
*** p<0.01, ** p<0.05, * p<0.1
The Cross-Border Impact of Violent Events
30
The cross-section regression reveals other interesting results. The event date is
negatively correlated with the impact on non-event countries. This may indicate a
desensitization effect whereby investors become less apprehensive of violent events as
time goes by, even as global markets become more integrated. This may be due to
investors’ better assessment of the true risk in the event-country, or to their belief that
non-event countries are not less prone to such events.
Finally, war events lead to more positive reactions in non-event countries, unlike
bombings and assassinations. This result may arise because investors perceive war as a
permanent and real risk and are thus more likely to move their activities elsewhere. It
could also be because war is beneficial to certain economic activities such as the defense
and logistics industries.
7 Conclusion
This is the first study to document a positive cross-border impact of violent
events. In doing so, it reconciles the two perspectives in the existing literature on the
impact of violence. While some researchers argue that violent events have a small effect
on the economy based on direct measurements, others use reduced form estimates to
show that it has a large impact. This study argues that these two points of view reflect
two different effects and are therefore not necessarily contradictory. The first effect is a
small one, resulting from the destruction of physical and human capital. The second
effect is large, resulting from the reallocation of financial and economic activity from the
event country to non-event countries in the wake of violence. The small actual impact of
violence on afflicted countries is, therefore, magnified through substitution to other
destinations in the globally integrated financial and economic markets. This means that
the magnitude of the net global impact of violence is less than that documented by
equilibrium studies on event countries.
This study also evaluates certain factors that affect the impact of violence on non-
event countries. Geographic distance is not monotonic in its effect on the valuation of
equities in non-event countries. Larger distances between the event and non-event
The Cross-Border Impact of Violent Events
31
countries are associated with greater positive impacts in non-event countries. Non-event
countries that are geographically contiguous to the event country, however, pick up a
positive windfall in the valuation of their firms. This may reflect differences in the
geographic dispersion patterns between financial and economic activities. Also, the safer
a non-event country is perceived to be relative to the event country, the greater the
positive impact on its financial markets following a violent event. Finally, event countries
with deeper financial markets are less susceptible to capital reallocation following an
event.
The Cross-Border Impact of Violent Events
32
References
Abadie, A., Gardeazabal J., (2008). Terrorism And The World Economy. European
Economic Review (52), 1-27.
Abadie, A., Gardeazabal, J., (2003). The Economic Costs Of Conflict: A Case-Control
Study For The Basque Country. American Economic Review (94), 113-132.
Agrawal, J., Kamakura, W.A., (1995). The Economic Worth Of Celebrity Endorsers: An
Event Study Analysis. Journal of Marketing 59 (3), 56-62.
Becker, G., Murphy, K., October 29, 2001. Prosperity Will Rise Out Of The Ashes. The
Wall Street Journal.
Berrebi, C., Klor, E., (2005). The Impact Of Terrorism Across Industries: An Empirical
Study. Hebrew University of Jerusalem working paper.
Binder, J.J., (1983). Measuring The Effects Of Regulation With Stock Price Data: A New
Methodology. University of Chicago, Ph. D. dissertation.
Binder, J.J., (1998). The Event Study Methodology Since 1969. Review of Quantitative
Finance And Accounting 11, 111-137.
Blomberg, S., Hess, G., Orphanides, A., (2004). The Macroeconomic Consequences Of
Terrorism. Journal of Monetary Economics 51 (5), 1007-1032.
Bloom, N., (2006). The Impact Of Uncertainty Shocks: Firm-Level Estimation And A
9/11 Simulation. Center for Economic Performance Discussion Paper, 718.
Boehmer, E., Musumeci, J., Poulsen, A.B., (1991). Event Study Methodology Under
Conditions Of Event Induced Variance. Journal of Financial Economics 30, 253-
272.
Brown, S.J., Warner J.B., (1980). Measuring Security Price Performance. Journal of
Financial Economics 8, 205-258.
Brown, S., Warner, J., (1985). Using Daily Stock Returns: The Case Of Event Studies.
Journal of Financial Economics 14, 3-31.
Brück, T., Wickström B., (2004). The Economic Consequences Of Terror: A Brief
Survey. HiCN Working Paper 3.
Campbell, C., Wesley, C., (1993). Measuring Security Price Performance Using Daily
NASDAQ Returns. Journal of Financial Economics 33 (1), 73-92.
Campbell, J.Y., Lo, A.W., MacKinlay A.C., (1997). The Econometrics Of Financial
Markets. Princeton: Princeton University Press.
The Cross-Border Impact of Violent Events
33
Chen, A.H., Siems, T.F., (2004). The Effects Of Terrorism On Global Capital Markets.
European Journal of Political Economy, 20.
Chinn, M., Ito, H., (2008). A New Measure Of Financial Openness. Journal Of
Comparative Policy Analysis 10 (3), 309-322.
Berrebi, C., Klor, E., (2006). On Terrorism And Electoral Outcomes: Theory And
Evidence From The Israeli-Palestinian Conflict. Journal of Conflict Resolution 50
(6), 899-925.
Berrebi, C., Klor, E., (2006). The Impact Of Terrorism On The Defense Industry. Rand
Corporation.
Corrado, C., (1989). A nonparametric Test For Abnormal Security-Price Performance In
Event Studies. Journal of Financial Economics 23, 385-395.
Coval, J., Moskowitz, T., (1999). Home Bias At Home: Local Equity Preference In
Domestic Portfolios. Journal of Finance, 54 (6).
Cowan, A., (1992). Nonparametric Event Study Tests. Review of Finance and
Accounting, 343-358.
Eldor, R., Melnick, R., (2004). Financial Markets And Terrorism. European Journal of
Political Economy.
Enders, W., Sandler, T., (2000). Is Transnational Terrorism Becoming More Threatening:
A Time-Series Investigation. Journal of Conflict Resolution 44, 307-332.
Enders, W., Sandler, T., (1993). The Effectiveness Of Antiterrorism Policies: A Vector-
Auto-Regression Intervention Analysis. American Political Science Review 87
(4), 829-844.
Fama, E.F. et al., (1969). The Adjustment Of Stock Prices To New Information. The
International Economics Review Journal 10 (1), 1-21.
Fama, E.F., (1970). Efficient Capital Markets: A Review Of Theory And Empirical
Work. The Journal of Finance 25 (2), 383-417.
French, K., Poterba, J., (1991). Investor Diversification And International Equity
Markets. American Economic Review, Papers and Proceedings, 222-226.
Gehrig, T., (1993). An Information Based Explanation Of The Domestic Bias In
International Equity Investment. Scandinavian Journal of Economics, 97-109.
Global Financial Data, URL:(https://www.globalfinancialdata.com).
The Cross-Border Impact of Violent Events
34
Hendersen, G.V., (1990). Problems And Solutions In Conducting Event Studies. The
Journal of Risk and Insurance 57 (2), 282-306.
Hon, M., Strauss, J., Yong, S.K., (2003. Contagion In Financial Markets After September
11 –Myth Or Reality? Journal of Financial Research 27 (1), 95-114.
Jaffe, J.F., (1974). The Effect Of Regulatory Changes On Insider Trading. Bell Journal of
Economics and Management Science 5 (1), 93-121.
Jensen, N.M., Schmith, S., (2005). Market Responses To Politics: The Rise Of Lula And
The Decline Of The Brazilian Stock Market. Comparative Political Studies.
Kang, J., Stulz, R., (1997). Why Is There A Home Bias? An Analysis Of Foreign
Portfolio Equity Ownership In Japan. Journal of Financial Economics 46, 3-28.
Karolyi, G.A., Martell, R., (2006). Terrorism And The Stock Market. Ohio State
University working paper, URL: (http://ssrn.com/abstract=823465).
Kolari, J., Pynnönen, S., (2005). Event-Study Methodology: Correction For Cross-
Sectional Correlation In Standardized Abnormal Return Tests. Working Papers of
the University of Vaasa, Department of Mathematics and Statistics 9.
Krueger, A.B., Maleckova, J., (2003). Education, Poverty And Terrorism: Is There A
Causal Connection? Journal of Economic Perspectives 17 (4), 119-144.
Krueger, A.B., (2001). Economic Scene; Gross Domestic Product Vs. Gross Domestic
Well-Being. The New York Times.
Krueger, A.B., (2007). What Makes A Terrorist: Economics And The Roots Of
Terrorism. Princeton University Press, Princeton and Oxford.
MacKinlay, C., (1997). Event Studies In Economics And Finance. Journal of Economic
Literature 35 (1), 13-39.
Merton, R., (1976). Option Pricing When Underlying Stock Returns Are Discontinuous.
Journal of Financial Economics, 128-129.
Meznar, M., Nigh, D., Kwok, C., (1998). Announcements Of Withdrawal From South
Africa Revisited: Making Sense Of Contradictory Event Study Findings. The
Academy of Management Journal 41 (6), 715-730.
National Consortium for the Study of Terrorism and Responses to Terrorism, University
of Maryland, URL: (http://www.start.umd.edu/data/gtd).
The Cross-Border Impact of Violent Events
35
Patell, J., (1976). Corporate Forecasts Of Earnings Per Share And Stock Price Behavior:
Empirical Tests. Journal of Accounting Research 14, 246–276.
Portes, R., Rey, H., (2005). The Determinants Of Cross-Border Equity Flows. Journal of
International Economics, 65 (2), 269-296.
Sweeney, R.J., (1991. Levels Of Significance In Event Studies. Review of Quantitative
Finance and Accounting 1, 373-382.
Tesar, L., Werner, I., (1995). Home Bias and High Turnover. Journal of International
Money and Finance 14, 467-493.
The Political Risk Services Group, URL: (http://www.prsgroup.com).
Tversky, A., Kahneman, D., (1972). Subjective Probability: A Judgment Of
Representativeness. Cognitive Psychology 3 (3), 430-454.
Tversky, A., Kahneman, D., (1974). Judgment Under Uncertainty: Heuristics And Biases.
Science 185, 1124-31.
Wikipedia contributors, The Free Encyclopedia, URL:(http://en.wikipedia.org).
The Cross-Border Impact of Violent Events
36
Appendix A. List of Stock Exchanges Used in the Events Study Stock Exchange Country Name Market Capitalization
Aug, 2007 (Million
USD)
Buenos Aires SE General Index Argentina 52,192
DJ Australian Index Australia 135,283
DJ Austria Stock Index Austria 212,570
DJ Belgium Stock Index Belgium 429,034
Brazil Special Corporate Governance Stock Brazil 1,092,573
DJ Canada Stock Index Canada 149,214†
S&P/CDNX Composite Index Canada 149,214†
Canada S&P/TSX 300 Composite Canada 149,214†
Santiago SE Indice General De Precios De Acciones Chile 210,974
Shanghai SE Composite China 3,089,293
DJ Germany Stock Index Germany 1,894,080
Cairo SE Efg General Index Egypt 109,441
Madrid SE General Index Spain 1,497,133
DJ Finland Stock Index Finland 345,114
DJ France Stock Index France 2,281,249
UK FTSE All-Share Index United Kingdom 3,853,708
DJ Greece Stock Index Greece 236,045
DJ Hong Kong Stock Index Hong Kong 2,276,153
Jakarta SE Composite Index Indonesia 164,771
Bombay SE Sensitive Index India 1,110,2162
†
Calcutta SE Index India 1,110,216†
DJ Ireland Stock Index Ireland 159,631
Tel Aviv SE All-Security Index Israel 201,759
DJ Italy Stock Index Italy 1,060,442
Jordan Afm General Index Jordan 30,816
Tokyo SE Price Index Japan 4,517,752
DJ South Korea Stock Index Korea 1,102,182
Kuwait SE Index Kuwait 156,709
Beirut Stock Exchange Index Lebanon 10,705
Colombo SE All-Share Index Sri Lanka 7,207
Casablanca SE General Index Morocco 586,300†
Morocco Casablanca SE Most Active Index Morocco 586,300†
Mexico SE Indice De Precios Y Cotizaciones Mexico 402,862
DJ Malaysia Stock Index Malaysia 274,002
DJ Netherlands Stock Index Netherlands 935,571
DJ Norway Stock Index Norway 321,606
† Market Capitalization is for the country not the index. In the case of the US, it is for the NYSE.
The Cross-Border Impact of Violent Events
37
Stock Exchange Country Name Market Capitalization
Aug, 2007 (Million
USD)
DJ New Zealand Stock Index New Zealand 45,061
Karachi SE All-Share Index Pakistan 58,631
Lima SE General Index Peru 60,109
Manila SE Composite Index Philippines 87,878
DJ Portugal Stock Index Portugal 126,398
Russia Micex Composite Russian Federation 1,149,784
Saudi Arabia Tadawul SE Index Saudi Arabia 372,740
DJ Singapore Stock Index Singapore 482,977
DJ Sweden Stock Index Sweden 772,849
DJ Thailand Stock Index Thailand 183,079†
Bangkok Book Club Index Thailand 183,079†
Tunisia Indice BVM Tunisia 4,708
Istanbul SE IMKB-100 Price Index Turkey 234,898
DJ Taiwan Stock Index Taiwan 678,145
FTSE-Nasdaq 500 Index United States of America 15,600,000†
NYSE Composite United States of America 15,600,000†
S&P 500 Composite Price Index United States of America 15,600,000†
DJ Venezuela Stock Index Venezuela 10,007
Viet Nam Stock Exchange Index Viet Nam 5,000
DJ South Africa Stock Index South Africa 777,425†
Johannesburg SE Overall Index South Africa 777,4253
†
† Market Capitalization is for the country not the index. In the case of the US, it is for the NYSE.
The Cross-Border Impact of Violent Events
38
Appendix B. CAAR Evolution Across the Remaining Event Windows
Event Window (0,1) Event Window (-1,1)
Event Window (0,2) Event Window (-2,2)
Event Window (0,5) Event Window (-5,5)
-0.02
-0.015
-0.01
-0.005
-1E-17
0.005
0 1
Non-Event Countries Event Countries
-0.02
-0.015
-0.01
-0.005
-1E-17
0.005
-1 0 1
Non-Event Countries Event Countries
-0.02
-0.015
-0.01
-0.005
-1E-17
0.005
0 1 2
Non-Event Countries Event Countries
-0.02
-0.015
-0.01
-0.005
-1E-17
0.005
-2 -1 0 1 2
Non-Event Countries Event Countries
-0.02
-0.015
-0.01
-0.005
0
0.005
0 1 2 3 4 5
Non-Event Countries Event Countries
-0.02
-0.015
-0.01
-0.005
0
0.005
-5 -4 -3 -2 -1 0 1 2 3 4 5
Non-Event Countries Event Countries