Embed Size (px)
Citation preview

econstorMake Your Publication Visible
A Service of
zbwLeibniz-InformationszentrumWirtschaftLeibniz Information Centrefor Economics
Werding, Martin; Primorac, Marko
Working Paper
Old-Age Provision in Transition: The Case of Croatia
CESifo Working Paper, No. 5761
Provided in Cooperation with:Ifo Institute – Leibniz Institute for Economic Research at the University ofMunich
Suggested Citation: Werding, Martin; Primorac, Marko (2016) : Old-Age Provision in Transition:The Case of Croatia, CESifo Working Paper, No. 5761
This Version is available at:http://hdl.handle.net/10419/128464
Standard-Nutzungsbedingungen:
Die Dokumente auf EconStor dürfen zu eigenen wissenschaftlichenZwecken und zum Privatgebrauch gespeichert und kopiert werden.
Sie dürfen die Dokumente nicht für öffentliche oder kommerzielleZwecke vervielfältigen, öffentlich ausstellen, öffentlich zugänglichmachen, vertreiben oder anderweitig nutzen.
Sofern die Verfasser die Dokumente unter Open-Content-Lizenzen(insbesondere CC-Lizenzen) zur Verfügung gestellt haben sollten,gelten abweichend von diesen Nutzungsbedingungen die in der dortgenannten Lizenz gewährten Nutzungsrechte.
Terms of use:
Documents in EconStor may be saved and copied for yourpersonal and scholarly purposes.
You are not to copy documents for public or commercialpurposes, to exhibit the documents publicly, to make thempublicly available on the internet, or to distribute or otherwiseuse the documents in public.
If the documents have been made available under an OpenContent Licence (especially Creative Commons Licences), youmay exercise further usage rights as specified in the indicatedlicence.
www.econstor.eu
Old-Age Provision in Transition: The Case of Croatia
Martin Werding Marko Primorac
CESIFO WORKING PAPER NO. 5761 CATEGORY 3: SOCIAL PROTECTION
FEBRUARY 2016
An electronic version of the paper may be downloaded • from the SSRN website: www.SSRN.com • from the RePEc website: www.RePEc.org
• from the CESifo website: Twww.CESifo-group.org/wp T
ISSN 2364-1428
CESifo Working Paper No. 5761
Old-Age Provision in Transition: The Case of Croatia
Abstract The Croatian system of old-age provision comprises a traditional public pay-as-you-go scheme and a mandatory funded scheme (“second pillar”) that will provide increasing amounts of supplementary pensions to those entering retirement in the future. Due to the continuing economic crisis, the public scheme is currently under enormous financial strain, with a sizeable impact on central government public finances. At the same time, the level of benefits deriving from the overall system is likely to become inadequately low in the long run. In this paper, we describe the existing system and project its future development under current rules. Building on lessons from recent pension theory, we also discuss options for further reforming the system, highlighting their potential impact on pension finances, public budgets, and retirement incomes.
JEL-codes: H550, H600, J110, J260.
Keywords: old-age provision, pay-as-you-go pensions, funded pensions, demographic ageing, public debt, fiscal sustainability, reforms.
Martin Werding* Chair in Social Policy and Public Finance
Ruhr-University Bochum Department of Social Science
Germany – 44780 Bochum [email protected]
Marko Primorac University of Zagreb
Faculty of Economics and Business Zagreb / Croatia
*corresponding author February 2016

1 Introduction
The Croatian system of old-age provision is in the midst of a transition to a new overall structure, following a half-hearted attempt at establishing a funded pillar for younger workers more than ten years ago. It is also plagued by lasting consequences of the Great Recession, with a low level of economic activity and massive inflows into disability and early retirement. The Croatian pension system is thus in a particularly difficult situation and clearly yearns for further reforms. But its institutional set-up shares a number of features with other transition economies in Central and Eastern Europe, among them several EU member countries, such as the Baltic states, Bulgaria, Hungary, Poland or the Slovak Republic (Nickel and Almenberg 2006). Analyzing the current stance and the prospects for further reforming the system may therefore provide lessons that are of interest not only to Croatia but also elsewhere. According to the latest EU-level “Ageing Report”, Croatia is among the few countries in the EU-28 where public pension expenditure per GDP is expected to decline until 2060 (European Commission and EU Economic Policy Committee 2015, p. 9). The projected reduction by 3.9 percentage points, from about 11% in 2013, is by far the largest reported there. This outlook does not appear to be unrealistic, in spite of an ageing process of considerable scale. This is mainly due to the fact that, over time, pension benefits will become inadequately low under current rules. In fact, the benefit level is rather low already today, while the pension system and the entire public budget are under enormous pressure. As a result, securing sufficient amounts of retirement income will become an issue soon, while the fiscal room for doing so first needs to be established. We begin by describing the system as it is shaped today, in the run-up to a period of acute demographic ageing (Section 2). Then, we summarize a few lessons from the theory of old-age provision applying to a situation of this kind (Section 3). Against this background, we illustrate the main current and future challenges for operating the system using projections regarding expected performance under the existing legal framework over the next five decades (Section 4). Last but not least, we discuss a number of options for reforming the system (Section 5), showing their potential impact on pension finances, public budgets and retirement incomes as much as this appears possible from today’s perspective. Section 6 concludes, summarizing the main lessons which can be derived.
2 The current system
Old-age provision in Croatia is dominated by a (“Bismarckian”) public pension scheme which is pay-as-you-go financed and offers benefits that are related to earlier wages and to the length of individual work records (Bejaković 2002; Nestić and Rašić Bakarić 2008, pp. 82–83). In an attempt to fundamentally overhaul the system, a “second” funded pillar was added in 2002 (Šonje 2011, p. 14). It is financed from earnings-related
1
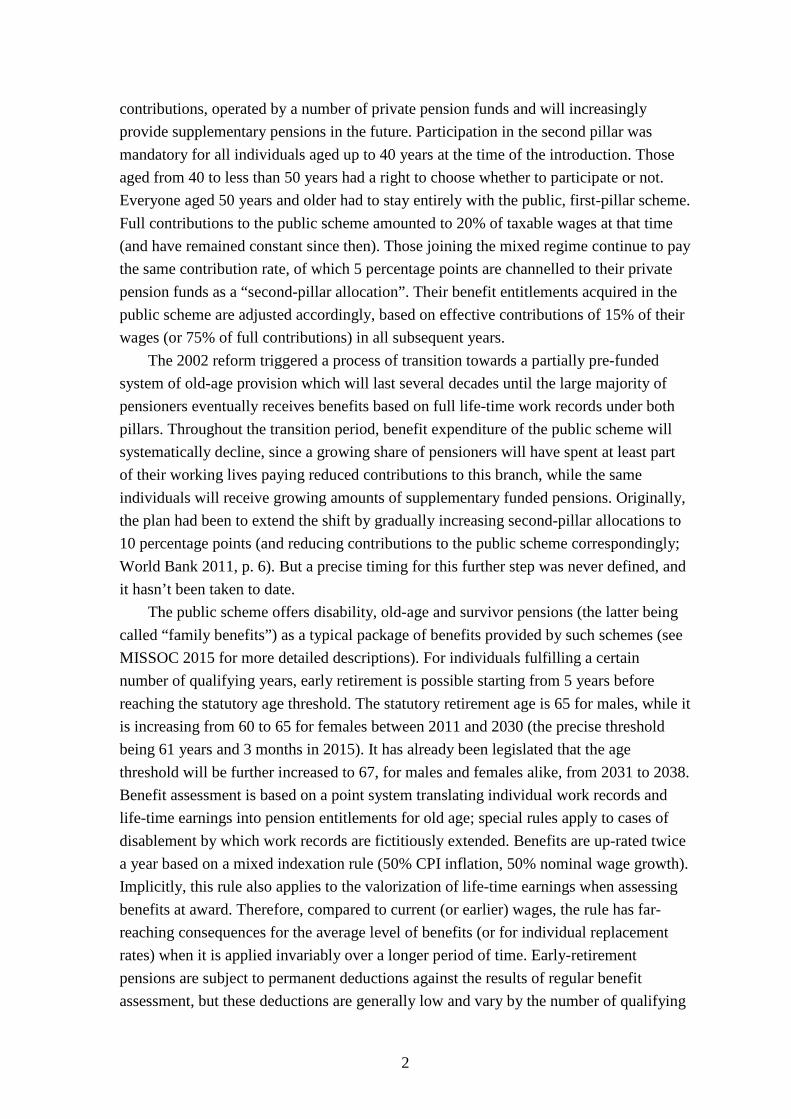
contributions, operated by a number of private pension funds and will increasingly provide supplementary pensions in the future. Participation in the second pillar was mandatory for all individuals aged up to 40 years at the time of the introduction. Those aged from 40 to less than 50 years had a right to choose whether to participate or not. Everyone aged 50 years and older had to stay entirely with the public, first-pillar scheme. Full contributions to the public scheme amounted to 20% of taxable wages at that time (and have remained constant since then). Those joining the mixed regime continue to pay the same contribution rate, of which 5 percentage points are channelled to their private pension funds as a “second-pillar allocation”. Their benefit entitlements acquired in the public scheme are adjusted accordingly, based on effective contributions of 15% of their wages (or 75% of full contributions) in all subsequent years. The 2002 reform triggered a process of transition towards a partially pre-funded system of old-age provision which will last several decades until the large majority of pensioners eventually receives benefits based on full life-time work records under both pillars. Throughout the transition period, benefit expenditure of the public scheme will systematically decline, since a growing share of pensioners will have spent at least part of their working lives paying reduced contributions to this branch, while the same individuals will receive growing amounts of supplementary funded pensions. Originally, the plan had been to extend the shift by gradually increasing second-pillar allocations to 10 percentage points (and reducing contributions to the public scheme correspondingly; World Bank 2011, p. 6). But a precise timing for this further step was never defined, and it hasn’t been taken to date. The public scheme offers disability, old-age and survivor pensions (the latter being called “family benefits”) as a typical package of benefits provided by such schemes (see MISSOC 2015 for more detailed descriptions). For individuals fulfilling a certain number of qualifying years, early retirement is possible starting from 5 years before reaching the statutory age threshold. The statutory retirement age is 65 for males, while it is increasing from 60 to 65 for females between 2011 and 2030 (the precise threshold being 61 years and 3 months in 2015). It has already been legislated that the age threshold will be further increased to 67, for males and females alike, from 2031 to 2038. Benefit assessment is based on a point system translating individual work records and life-time earnings into pension entitlements for old age; special rules apply to cases of disablement by which work records are fictitiously extended. Benefits are up-rated twice a year based on a mixed indexation rule (50% CPI inflation, 50% nominal wage growth). Implicitly, this rule also applies to the valorization of life-time earnings when assessing benefits at award. Therefore, compared to current (or earlier) wages, the rule has far-reaching consequences for the average level of benefits (or for individual replacement rates) when it is applied invariably over a longer period of time. Early-retirement pensions are subject to permanent deductions against the results of regular benefit assessment, but these deductions are generally low and vary by the number of qualifying
2

years. Survivor benefits are derived (as a certain percentage) from pension entitlements of the deceased; in Croatia, they also apply to divorced spouses, cohabiting partners and parents if any of these persons were economically dependent. In 2014, the gross level of old-age pensions (i.e., average old-age pensions divided by current average taxable wages) has been about 32%.1 On net terms, the figure would look a little more friendly (estimated to be around 40% in Worldbank 2011, p. 10).2 Nevertheless, it is very low compared to benefit levels in other EU or OECD countries (OECD 2015, pp. 138–141). Also, the figure encompasses cases with privileged pension entitlements (mainly for soldiers and policemen, but also for politicians or academics) included in the Croatian general public pension scheme which can be substantially higher. Further types of privileged pensions (especially for war veterans) are administered separately and are even higher. All in all, the system gives rise to considerable inequities, both within and across age cohorts, but it is not very generous in terms of average annual benefits provided. The system is generous, however, in terms of granting access to pensions relatively early. The total number of beneficiaries amounts to 130% of the population of pensionable age (defined by statutory age limits). Conversely, almost 20% of the population aged 20 to 64 (for males) or 20 to 60 (for females) are receiving some kind of pension benefits. The support ratio (i.e., the number of active members per beneficiary) is currently no more than 1.2, down from 1.4 around 2000 and 3.0 in 1990 (Nestić and Rašić Bakarić 2008, pp. 88). Also, the system provides minimum pensions that are relatively generous, at least when compared to average pensions. Total expenditure of the first-pillar pension scheme amounts to 11.1% of GDP in 2014.3 However, contributions cover only about 55% of expenditure. The actual current cost rate – i.e., the contribution rate which would balance the budget – is correspondingly higher: including the second-pillar allocation of 5 percentage points, it is no less than 32.5% of taxable wages. Therefore, the public scheme regularly receives a sizable subsidy from the central-government budget, amounting to 5.0% of GDP in 2014. One could argue that the subsidy is tax-financed to the extent that the central budget is. But the size of the state subsidy compares unfavourably to the current budget deficit of 5.7% of GDP (European Commission, DG ECFIN 2015); in fact, the state subsidy could be considered to be fully debt-financed virtually each year since 2000. In any case, the scheme imposes a substantial burden on central-government finances which are under
1 The figure is based on own calculations using data kindly provided by the Croatian Pension Insurance Institute (Hrvatski zavod za mirovinsko osiguranje, HZMO). Many of these data are published in HZMO (2015). These (and other) data are also used as an important input for preparing long-term projections regarding the future performance of the system (until 2065) presented in Sections 4 and 5.
2 Looking at net benefit levels instead of gross levels would clearly be more informative. However, in our long-term simulations we will be unable to project net benefit levels, as we are mainly simulating pension parameters, not health-insurance contributions, wage taxes, etc.
3 This figure is based on calculations using data provided by HZMO and data on national accounts collected in the EU-level AMECO database (European Commission, DG ECFIN 2015).
3

pressure also for other reasons in the current situation of a lasting crisis (European Commission 2015, pp. 39–47). The fully-funded second-pillar scheme offers benefits for old age, but also for disability and survivors, based on actuarial principles. It follows a defined-contribution (DC) logic, so that rate-of-return risks lie entirely with the individuals covered, while no funding risks or budgetary risks should arise. As a consequence, benefit entitlements are determined by individual contributions, hence by wages and the percentage of the second-pillar allocation; by the number of years covered with contributions to this pillar; and by the effective rate of return, including the effects of compound interest, earned by a specific pension fund. First benefits were paid out in 2007, but their total annual amount is still negligible. The system is in the early phase of net accumulation, total assets held in the second pillar now having reached 20% of GDP (HANFA 2015a).4 Under current rules, this ratio will continue to grow over the next few decades. Second-pillar pensions were meant to be operated by a larger number of pension funds competing with each other. After an initial phase, when new funds had to find a certain minimum number of members, four large providers effectively established themselves in this market. This structure has been basically stable since 2003. In 2014, each of these providers had to split their funds into three separate categories (“A, B and C”), differentiated by risk classes (and expected returns) of their investment. Before, the structure of investment had been rather similar across funds, with about 20% of foreign assets and about 80% of domestic assets. Among the latter, bonds issued by the central government (and, to a very limited extent, by municipalities) have been by far the dominant form of investment. They currently account for 70% of total assets. Together with shares and corporate bonds issued by (quasi-)publicly owned firms, this fraction is even higher. Preference for domestic government bonds is strongly backed by regulations, requiring initially that at least 50% of assets be held in long-term bonds and securities of this kind. More recently, this rule has been extended to bonds issued by public bodies from the EU and OECD (and it is now differentiated across categories of funds), but this had only limited effect for actual investment strategies. Average returns since 2002 have been around 6.1% p.a. on nominal terms (measured by the MIREX index; HANFA 2015b). As in many other countries with mandatory or voluntary private provision (Mitchell 1998; Dobronogov and Murti 2005), overhead costs charged to members’ accounts were an issue of repeated debates. They have been limited by law from the very beginning, the current upper limit being 0.45% of total investment per year, down from 1.2% applying until 2006. While the first pillar of the Croatian pension system is struggling with a strained financial situation – due to the persistent crisis, but also to a number of structural
4 Here and in the following, we use data provided by the Croatian Financial Services Supervisory Agency (Hrvatska agencija za nadzor financijskih usluga, HANFA) which is in charge of monitoring second-pillar pension funds and other financial intermediaries.
4
problems – the shift towards a partially funded system which was initiated more than ten years ago basically appears to be a good idea (see Section 3). Some features of the new, second pillar may not appear ideal. But the main reason for a fundamentally positive assessment is the perspective for a pronounced ageing process which is likely to materialize over the next two to five decades. Croatia currently has a total population of about 4.3 million individuals, the old-age dependency ratio being around 28 (individuals aged 65 and over per 100 individuals aged 15 to 64). For several decades into the future, demographic trends are mostly determined by the age composition of the population which is currently alive. Future fertility, mortality and migration can do something to modify the on-going ageing process, but they cannot stop it entirely (see Appendix A.1 for further details). Total population may thus shrink only by about 300,000 or by up to 1.5 million individuals over the next fifty years, a reasonable “baseline” variant leading to a reduction by 1 million or by about 20%. Old-age dependency will increase substantially, to a ratio between 47 and 71, the baseline result being that it doubles to around 57. Besides the difficult economic situation and some issues in the design of the system, this is a perspective that old-age provision in Croatia has to be adapted to.
3 Lessons from the theory of old-age provision
After the fall of the “Iron Curtain”, transition countries in Central and Eastern Europe went through far-reaching reforms of their political and economic systems. In the course of doing so, many of them also embarked on pension reforms which were typically more fundamental than those taken in highly developed countries at that time. Among other things, this broad-based move was driven by a difficult present and an uncertain future of their post-socialist pension systems, some optimism regarding the effects of including market-oriented elements in their political set-up, and early discussions about demographic ageing (see, e.g., the early reviews and assessments provided in Cangiano et al. 1998 or Lindeman et al. 2000). In fact, between 1994 and 2004 the majority of those countries that have now joined the EU introduced mandatory, funded schemes meant to supplement, or even replace, existing pay-as-you-go pension schemes (Dupont 2004; Nickel and Almenberg 2006).5 In debates held in the 1980s and 1990s, funded pension schemes were often regarded as unambiguously superior to unfunded schemes (see, e.g., Feldstein 1995). Unfunded pensions were seen as a kind of “forced saving”, easy to administer but with inefficiently low returns. Basically, the internal rate of return in pay-as-you-go schemes is given by the rate of payroll growth (Aaron 1966). Since there are strong reasons, both empirical and theoretical ones (Abel et al. 1989), to expect that this rate is lower than the
5 Besides the current EU member states already listed in the introduction, these sources cover further transition countries located in Eastern Europe and Central Asia (including Russia) which did the same.
5
capital-market interest rate – apart from exceptional situations which could last only for limited periods of time – switching to funded systems was generally thought to be a good idea. The expectation was that existing benefit entitlements of the older generation could be paid off, over a transition period of limited duration, by taxing away (part of) the gains of younger generations resulting from higher returns to their retirement savings. Closer inspection revealed that this view was simplistic and ultimately flawed. Breyer (1989) and Fenge (1995) showed that such a transition is never Pareto-improving, i.e., beneficial for future generations once the transition is completed.6 Higher capital-market returns would have to be channelled indefinitely into paying off the implicit public debt involved in outstanding liabilities of an unfunded system. Per se, pay-as-you-go pensions are thus “inter-generationally efficient” (see Sinn 2000 or Barr and Diamond 2008, ch. 6.4, for illustrative demonstrations). The difference vis-à-vis funded schemes starts when systems of both types are initiated: pay-as-you-go pensions can be paid out immediately, without any accumulation of funds, and the lower returns for subsequent generations are simply a price for this advantage. Ideally, the “gains” accruing to a first generation of pensioners who did not pay contributions over their entire working life should have appeared justified.7 In any case, these gains can never be called back without imposing a burden on members of other generations. Therefore, replacing unfunded schemes by funded ones, fully or just partially, is not about efficiency gains, but about inter-generational redistribution. It should again be justified on these grounds. This is precisely the point where demographic ageing starts to matter. If the population is ageing due to low fertility, the internal rate of return on contributions to a pay-as-you-go scheme tends to become even lower than in the benchmark case with a stable population. Increasing contribution rates to keep up the level of benefits (in a notionally-defined-benefits, or NDB, variant of such schemes) is effectively a way of manipulating this internal rate of return. Yet, if low fertility rates persist, this would have to be done again and again until contribution rates could eventually reach a natural limit (that they must not exceed 100%) and may become prohibitively high much earlier. This strategy may thus not be feasible under a strong ageing process, if domestic production is to remain competitive at an international level. If contribution rates remain fixed (in a notionally-defined-contributions, or NDC, variant), the level of benefits which can be financed necessarily declines. Therefore, unfunded pensions need to be supplemented by other means of old-age provision for total retirement income to remain adequate. The
6 The proofs mainly relate to “Bismarckian” schemes with a tax-benefit link. Alternative results obtained for “Beveridgean” pension systems (Homburg 1990) rest on the abolition of distortions resulting from the intra-generational redistribution involved in such schemes (through a combination of earnings-related contributions with lump-sum elements in the assessment of benefits). However, this could be dealt with separately, without altering the pay-as-you-go nature of a given scheme.
7 E.g., by unexpected losses of their pension wealth through hyperinflation, war, natural disaster, or the like (or simply because the public scheme replaced older, intra-family arrangements for old-age provision of a pay-as-you-go nature, an aspect which could have implications for how pay-as-you-go systems should be designed; see Cigno and Werding 2007, ch. 2, 5 and 7).
6
only alternative that exists, then, are funded pensions which need to be provided for in good time (Sinn 2000). In this shift towards partial pre-funding, the use of coercion (or some kind of quasi-obligation framing individual decisions) may appear appropriate not only for “myopic” individuals, but also due to broad-based evidence regarding “behavioural” imperfections in individual decision-making (Mitchell and Utkus 2004). Things are slightly different if (or to the extent to which) demographic ageing is driven by increasing life expectancy. In this case, the internal rate of return to contributions tends to remain constant if contribution rates are fixed, since annual benefits decline, while the retirement period becomes longer. Increasing contribution rates increases returns for current pensioners at the expense of current contributors, with long-run implications and difficulties that are similar to those with low fertility. Supplementary funded pensions may again contribute to keeping up annual old-age income during an extended period of retirement. However, a more natural approach which goes to the root of this specific problem is to increase the retirement age (Barr and Diamond 2008, ch. 5.4). This is exactly fitting to improvements in age-specific productivity and health which go along with higher life expectancy (Garibaldi et al. 2010). Also, it directly relaxes the pressure on pay-as-you-go pension budgets from changes in the support ratio. Again, these changes may be brought about voluntarily, e.g., based on individual strategies for coping with decreasing benefit levels, or they may have to be reinforced through mandatory rules. Increases in the statutory pension age, combined with actuarial deductions for early retirement, usually offer a strong orientation for relevant decisions (Gruber and Wise 2004). In the light of these considerations, two drawbacks of the transition path currently pursued in Croatia need to be highlighted. Switching to a (partially) funded system ideally means that (i) (part of the) burdens involved in providing for current benefits are shifted across time and borne earlier, as much as this is possible via an increase in aggregate saving and investment (see Barr 2002 for a rather sceptic view; Diamond 2002, ch. 1 and 3, for a balanced discussion); (ii) the distribution of these burdens is no longer directly linked to demographics of domestic wage-earners, but it is diversified, among other things internationally (Diamond and Geanakoplos 2003; Börsch-Supan et al. 2006). Yet, it appears that none of this really happens in Croatia. First, first-pillar pensions now receive reduced contribution rates and rely on state subsidies that are mostly debt-financed.8 As a result, the implicit debt involved in unfunded pensions is gradually transformed into explicit debt, which leaves the effects for the intergenerational distribution basically unchanged against the case of regular pay-as-you-go financing. Second, domestic government bonds are used as the main type of “investment” of second-pillar funds. This is not uncommon for transition countries (see,
8 This is a stylized view. Constructing a counter-factual scenario for the development of state subsidies and central-government deficits in the absence of the 2002 reform would be a subtle issue, but the actual time series observed in Croatia are rather suggestive of this straightforward assessment.
7

e.g., Nickel and Almenberg 2006, pp. 20–21, or FIAP 2013), and it also applies to the Social Security Trust Fund in the US (Board of Trustees 2015, pp. 160–61). However, depending on whether it absorbs government bonds that would have been issued anyway or rests on an expansion of public debt, it can actually undermine the strategy of pre-funding for future retirement income (and may also reduce the rate of return earned in the funded scheme). Government bonds need to be redeemed to start paying out second-pillar benefits, which requires tax-payers’ money in the same period and turns the strategy for “funding” pensions into a hidden form of pay-as-you-go financing (Barr and Diamond 2008, ch. 6.3). Given these drawbacks which emerge already at a conceptual level, it is not surprising that old-age provision in Croatia is faced with a number of practical challenges regarding its current and future performance.
4 Challenges for the Croatian pension system under current rules
To illustrate the challenges that the Croatian system of old-age provision is faced with we now present long-term projections regarding the future performance of the existing two-pillar system under current rules.
4.1 Assumptions
Given the enormous uncertainties which arise over a long time horizon, constructing a meaningful “baseline” scenario for the future development of Croatian pension finances – with intermediate results regarding employment, wages and GDP growth – is difficult and certainly disputable with respect to virtually any detail. As an important basis, we use the demographic scenarios that were already mentioned, focusing on the medium, or “baseline” scenario (see, again, Appendix A.1). First, we will look at a “static” scenario for pension finances in which we keep many ingredients for our numerical projections unchanged against current figures. Most notably, this relates to age-specific labour-force participation rates for females and males, the unemployment rate and all age- and gender-specific rates of transition into different categories of (disability, early-retirement, old-age and survivor) pensions;9 we also ignore possible behavioural changes to on-going increases in the statutory retirement age. The implicit assumption that nothing changes in any of these areas as the population ages is not meant to be very realistic. However, the results are suited to highlight that the system is currently in a very difficult situation. What is considered as a true “baseline” scenario is then derived building on the following assumptions:
9 Actual data for any of these determinants are taken from Eurostat (labour-market data), from the national pension insurance institute, HZMO (public or first-pillar pensions), and from the national agency supervising financial services, HANFA (funded, second pillar), respectively.
8

- Participation rates by age and gender are projected into the future relying on cohort effects that are present in actual data (using an approach developed by Burniaux et al. 2003).
- Entries into disability and early retirement are adjusted accordingly; age-specific disability risks are also assumed to go down as life expectancy increases (shifting to higher ages with each additional year of life on a one-for-one basis).
- Behavioural reactions to increases in the statutory retirement age are added, assuming that a one-year increase in the age threshold leads to one-year delays in actual retirement.
- Unemployment decreases to current estimates for the NAWRU (14.4% according to the AMECO database) until 2019, thereby removing business-cycle dynamics from our long-term projections (but keeping small demographic fluctuations).
- Growth rates of labour productivity (and wages) are borrowed from projections for the “2015 Ageing Report” (European Commission and EU Economic Policy Committee 2014, pp. 83–86), the average real growth rate being 1.8% p.a.10
- Employment projections and productivity assumptions are combined to obtain simple projections for GDP, which is useful as a background scenario.11
- The real interest rate for government bonds is assumed to be 3% p.a.; to the extent that it matters, the inflation rate is set to 2% p.a.
- The current legal framework for assessing and up-rating public pensions is modelled as it is. Accumulation and decumulation of second-pillar funds is re-constructed assuming that annuitization is actuarially fair.
Some of these assumptions may appear friendly (e.g., those on labour-force participation and retirement), others not (e.g., the high level of structural unemployment). All in all, we believe this to be a meaningful scenario for what could plausibly happen, given our fundamental ignorance about the future. Results for the baseline scenario regarding labour-market performance and economic growth are summarized in Appendix A.2, together with results for parameters of the pension system that we will discuss next.
4.2 Results for pension finances
Under the “baseline” assumptions, the support ratio in the public pension scheme will stabilize at slightly below 1.2 during the period until 2040, in spite of a considerable increase in old-age dependency. Afterwards, it will start declining again and reach 1.0 by 2065. These projected figures are less unfavourable than they may seem. In the “static” scenario, the support ratio would fall to 1.0 already around 2030, and it would approach 0.8 towards the end of the projection horizon. Also, financial pressure associated with a
10 Taking productivity growth to be exogenous reduces the economic content of our projections. But resulting figures defined on relative terms (e.g., current cost rates, GDP-ratios) are not very sensitive with respect to these assumptions.
11 Over long time horizons, relative figures such a s GDP-ratios are easier to interpret than absolute figures, regardless of whether the latter are evaluated on real terms or on nominal terms.
9

Figure 1: Contribution rates and current cost rate (1st and 2nd pillar, 2000–2065)
0%
5%
10%
15%
20%
25%
30%
35%
2000 2005 2010 2015 2020 2025 2030 2035 2040 2045 2050 2055 2060 2065
% o
f tax
able
wag
es
Current cost rateTotal contribution rate2nd-pillar allocation
Notes: Solid lines relate to the “baseline” scenario, dashed lines relate to the “static” scenario. “Current cost rates” are contribution rates that would balance the budget of the public scheme (total first-pillar expenditure per taxable wages), plus the second-pillar allocation included in total contribution rates. Sources: HZMO; own calculations.
given level of the support ratio will diminish over time. In the future, a growing share of pensioners will have paid part of their contributions to the second pillar over considerable fractions of their active period. Their benefit entitlements in the public scheme will thus automatically become smaller, while they can expect to receive supplementary funded pensions of some size. A further effect is due to annual benefit up-ratings which follow inflation, but reflect only half of real wage growth. Since contributions currently cover only just over half of total expenditure of the public scheme, their rate is not very telling. For the scenarios looked at here, we assume that it remains constant throughout at 20% of taxable wages, including a “second-pillar allocation” of 5 percentage points. We also calculate the “current cost rate” that would balance the budget of the public scheme. Results are shown in Figure 1. In the baseline scenario, the cost rate will remain at its current, elevated level only for a few more years. It will then decline a bit between 2020 and 2030 and at accelerated speed until 2040. Nevertheless, it will remain above the total contribution rate until 2065, slowly approaching it towards the end of the projection horizon. Still, these are much better prospects than under the “static” scenario where cost rates remain very high until 2030 and then slowly start declining, the gap vis-à-vis actual contribution rates still being considerable in 2065.
10

Figure 2: Pension expenditure (1st and 2nd pillar, 2000–2065)
0%
2%
4%
6%
8%
10%
12%
2000 2005 2010 2015 2020 2025 2030 2035 2040 2045 2050 2055 2060 2065
% o
f GD
P
Total (1st and 2nd pillar)1st-pillar expenditure1st-pillar state subsidy
Notes: Solid lines relate to the “baseline” scenario, dashed lines relate to the “static” scenario. Sources: HZMO; own calculations.
As the precise rules governing how pension schemes are financed are rather diverse across countries, an important figure for international comparisons is the fraction of GDP spent on public pensions, or on old-age provision in general. Figure 2 illustrates that, relative to GDP, (public) pension expenditure in Croatia declined noticeably between 2000 and 2006, from around 11% to around 9% in a very short time, mainly due to strong GDP growth. Then, a substantial increase was brought about by the Great Recession which still hasn’t given way to a recovery. In our “baseline” simulations, the current peak will disappear within a few years, mainly because we are taking out the unfavourable business-cycle component and let labour-force participation and retirement behaviour adjust as described above. From 2020 onwards, the ratio will continue to decline for more fundamental reasons, again with an accelerated speed in the period between 2030 and 2040. Pension expenditure of the second pillar will be negligible until 2020. Afterwards, it will gradually become more important. Another important result displayed in Figure 2 relates to the state subsidy paid to the public pension scheme. Current levels of around 5% of GDP clearly indicate the strained situation of first-pillar pension finances. If the total contribution rate (including the second-pillar allocation) remains unchanged, the subsidy is projected to decline in line with public pension expenditure, reaching 4% of GDP around 2020, 2% around 2040 and only 0.5% at the end of the projection horizon.
11

Figure 3: Gross level of old-age pension benefits (1st and 2nd pillar, 2000–2065)
0%
5%
10%
15%
20%
25%
30%
35%
40%
2000 2005 2010 2015 2020 2025 2030 2035 2040 2045 2050 2055 2060 2065
% o
f ave
rage
taxa
ble
wag
es
1st-pillar pensions1st and 2nd-pillar pensions
Notes: Solid lines relate to the “baseline” scenario, dashed lines relate to the “static” scenario. The benefit level is assessed relating average old-age pensions to average taxable wages, both gross of taxes and social insurance contributions. Sources: HZMO; own calculations.
The long-term decline in current cost rates and in (public) pension expenditure per GDP does not come entirely unexpected, in spite of a pronounced ageing process. However, we should try to disentangle the relative importance of the two main effects behind these trends, viz., the on-going shift towards a partially funded system, plus the erosion of benefit levels due to restrictive benefit up-ratings over many years. Figure 3 shows results projected for the level of pension benefits. As a meaningful indicator, we take average amounts of old-age pensions paid out by the general public pension scheme (leaving out specific types of privileged pensions offered to war veterans) and relate them to current average taxable wages.12 To obtain a fuller picture, we then add average old-age pensions deriving from the second pillar. All relevant amounts are taken gross of taxes and contributions to the different branches of social insurance (cf. footnote 2). The figure illustrates that the gross level of public pension benefits has been low already in recent years, modified by a few discretionary changes with transitory effects. It is currently about 32% and will continue to decline to less than 25% until 2035, less than 20% until 2050 and just above 15% at the end of the projection horizon. Again, this
12 Taking together all categories of pension benefits would produce even lower benefit levels as, on average, disability and survivor benefits are around 25% smaller than old-age pensions, while early-retirement benefits are almost as high. Over time, however, changes in the composition of pension benefits from these categories would also matter for trends in the joint benefit level.
12
shift is driven by the two effects just mentioned. Pensions deriving from the public scheme are more and more determined by benefit entitlements accrued over long years with reduced contributions, while there is additional cover from the second pillar. In addition, pensions become lower and lower on relative terms because up-ratings fall continuously short of wage growth. The first of these two effects should disappear when we look at the combined benefit level of first and second-pillar pensions – at least, if the scale and timing of the shift towards partial pre-funding has been designed with sufficient care. The expansion of funded pensions does have a visible impact on the overall level of old-age pensions, but this effect is dominated by the reduction of benefit levels in the public scheme. Accounting for second-pillar pensions, the gross benefit level still declines to around 25% of current wages, or by no less than 20% against recent values. In other words, total old-age provision will most likely be inadequate. Higher amounts of second-pillar pensions will thus be needed in the future than those resulting from the 2002 reform. Alternatively, one may have to re-consider the rules for benefit up-ratings in the first pillar at some point in time in the future. Of course, both approaches can be mixed in one way or another – the most important drawback being that they could both have unfavourable effects for current pension finances, either because revenues of the first-pillar scheme will be affected by a higher second-pillar allocation, or because more generous up-ratings will increase expenditure.
4.3 Impact on the sustainability of public finances
Through state subsidies paid to the first-pillar scheme, there is a direct, unfavourable impact of the Croatian pension system on the central-government budget. There is another link through the high share of domestic government bonds among the reserves held in the second pillar. Figure 4 shows what happens on both sides building on our projections. For the years until 2014, we use actual figures (provided in the AMECO database and by HANFA 2015a, respectively). Future trends in the debt ratio are derived interpreting projected changes in state subsidies (per GDP) as changes in the primary deficit ratio (as if expenditure on all other budget items and revenues were to remain constant compared to GDP), while interest payments and total deficit ratios adjust accordingly. As a result, the debt ratio does not continue to increase as sharply as it did since 2008, but it goes up throughout the projection period from 85% in 2014 to 178% in 2065. Meanwhile, funds accumulated in the second pillar also continue to grow, coming close to 90% of GDP by 2065, when the scheme will be almost mature. If the current structure by which 70% of these funds are effectively invested in domestic government bonds is maintained, these particular types of assets will amount to just over 60% of GDP, or to roughly one third of total government debt. Using the same definition of fiscal long-term sustainability as in the EU Sustainability Reports (European Commission 2016, annex A.2), we are also able to assess the (“S2”) sustainability-gap indicator based on the intertemporal government
13
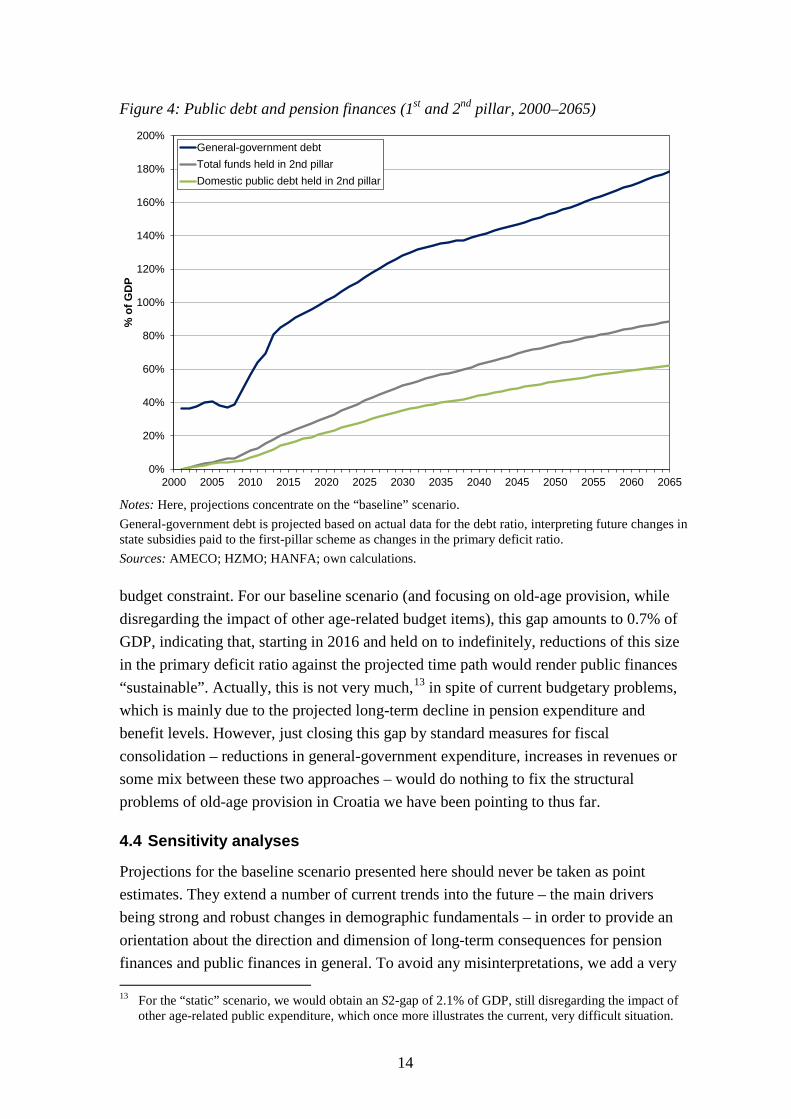
Figure 4: Public debt and pension finances (1st and 2nd pillar, 2000–2065)
0%
20%
40%
60%
80%
100%
120%
140%
160%
180%
200%
2000 2005 2010 2015 2020 2025 2030 2035 2040 2045 2050 2055 2060 2065
% o
f GD
P
General-government debtTotal funds held in 2nd pillarDomestic public debt held in 2nd pillar
Notes: Here, projections concentrate on the “baseline” scenario. General-government debt is projected based on actual data for the debt ratio, interpreting future changes in state subsidies paid to the first-pillar scheme as changes in the primary deficit ratio. Sources: AMECO; HZMO; HANFA; own calculations.
budget constraint. For our baseline scenario (and focusing on old-age provision, while disregarding the impact of other age-related budget items), this gap amounts to 0.7% of GDP, indicating that, starting in 2016 and held on to indefinitely, reductions of this size in the primary deficit ratio against the projected time path would render public finances “sustainable”. Actually, this is not very much,13 in spite of current budgetary problems, which is mainly due to the projected long-term decline in pension expenditure and benefit levels. However, just closing this gap by standard measures for fiscal consolidation – reductions in general-government expenditure, increases in revenues or some mix between these two approaches – would do nothing to fix the structural problems of old-age provision in Croatia we have been pointing to thus far.
4.4 Sensitivity analyses
Projections for the baseline scenario presented here should never be taken as point estimates. They extend a number of current trends into the future – the main drivers being strong and robust changes in demographic fundamentals – in order to provide an orientation about the direction and dimension of long-term consequences for pension finances and public finances in general. To avoid any misinterpretations, we add a very
13 For the “static” scenario, we would obtain an S2-gap of 2.1% of GDP, still disregarding the impact of other age-related public expenditure, which once more illustrates the current, very difficult situation.
14
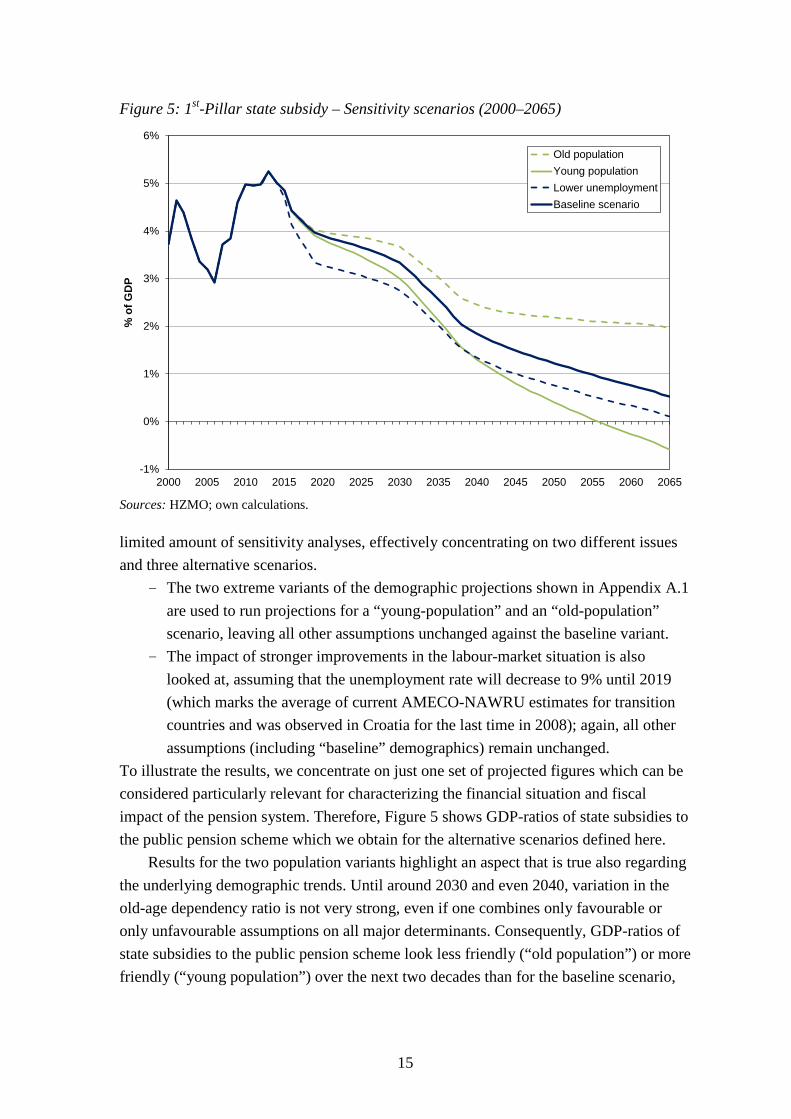
Figure 5: 1st-Pillar state subsidy – Sensitivity scenarios (2000–2065)
-1%
0%
1%
2%
3%
4%
5%
6%
2000 2005 2010 2015 2020 2025 2030 2035 2040 2045 2050 2055 2060 2065
% o
f GD
P
Old populationYoung populationLower unemploymentBaseline scenario
Sources: HZMO; own calculations.
limited amount of sensitivity analyses, effectively concentrating on two different issues and three alternative scenarios.
- The two extreme variants of the demographic projections shown in Appendix A.1 are used to run projections for a “young-population” and an “old-population” scenario, leaving all other assumptions unchanged against the baseline variant.
- The impact of stronger improvements in the labour-market situation is also looked at, assuming that the unemployment rate will decrease to 9% until 2019 (which marks the average of current AMECO-NAWRU estimates for transition countries and was observed in Croatia for the last time in 2008); again, all other assumptions (including “baseline” demographics) remain unchanged.
To illustrate the results, we concentrate on just one set of projected figures which can be considered particularly relevant for characterizing the financial situation and fiscal impact of the pension system. Therefore, Figure 5 shows GDP-ratios of state subsidies to the public pension scheme which we obtain for the alternative scenarios defined here. Results for the two population variants highlight an aspect that is true also regarding the underlying demographic trends. Until around 2030 and even 2040, variation in the old-age dependency ratio is not very strong, even if one combines only favourable or only unfavourable assumptions on all major determinants. Consequently, GDP-ratios of state subsidies to the public pension scheme look less friendly (“old population”) or more friendly (“young population”) over the next two decades than for the baseline scenario,
15

but the problems in financing current pensions and the impact on the central budget are essentially the same. Things become really different only in the long run. Assumptions regarding the unemployment rate were relatively pessimistic in our baseline scenario, while labour market performance is a very important determinant of pension finances in any unfunded scheme – in fact, more important in the short to medium run than demographics. The “lower-unemployment” variant neglects additional up-ward risks and concentrates on a more optimistic scenario. The result is as expected – there is a favourable effect on pension finances which comes about immediately and then remains largely constant. An effect of this kind would be extremely helpful in dealing with the budgetary problems arising in the period until 2030 or 2040.
4.5 Challenges
Having described the system and projected its future performance under current rules, we may now list major challenges for old-age provision in Croatia which ought to be addressed through further pension reforms. First, high unemployment and a low level of economic activity clearly contribute to budgetary pressures in the short to medium run, for the public pension scheme as well as for public finances in general. Consequences which are directly harmful for the pension scheme are high inflows into disability and early retirement. Second, a major problem which becomes more and more pressing in the long run is given by demographic ageing. Through the combined effects of low fertility and increasing life expectancy, it leads to a continuous increase in old-age dependency that is an important fundamental for the support ratio of a pay-as-you-go pension scheme. Third, the pension system and general-government finances are nevertheless not far away from being financially sustainable in the long run (provided that the problems affecting it in the short to medium run can somehow be solved), but this is mainly due to the fact that benefit levels may be, and certainly will become, inadequately low. Fourth, this is partly caused by the fact that the switch to a partially funded system initiated in 2002 is incomplete. Supplementary pensions deriving from the second pillar will be too low to make up for declining levels of public pay-as-you go pensions. Fifth, attempts at solving the last two problems are constrained by severe problems with financing the system in the short to medium run, with a close link to current deficits and accumulating debts in the central government budget. Sixth, the structure of investment of funds accumulated in the second pillar, with a very dominant share of domestic government bonds, is not at all ideal. It does not really isolate funded pensions against the risks of demographic ageing.
16

5 Options for reforms
These challenges and the international experience in how to deal with similar problems (Werding and Konrad 2012, pp. 86–94; Meier and Werding 2010) effectively set the agenda for reforming the Croatian system of old-age provision. Major goals that need to be accomplished are (i) getting the system out of the current situation of enormous financial strain and (ii) setting it on a new path towards sustainability as well as adequacy of old-age provision in the long run. As the problems we have observed are diverse, appropriate reforms will be multi-faceted. Also, some of the elements will have effects for pension finances and retirement incomes that work in opposite directions. Therefore, the ideal timing of reforms will also be an important issue to look at.
5.1 Cutting costs
A problem which needs to be addressed immediately is the current huge inflow of working-age individuals into disability pensions and early retirement, mostly caused by continued effects of the recent crisis for labour-market performance. Measures that are suited to deal with this problem are tighter eligibility criteria for disablement and a higher age for first claiming old-age pensions – say, two or three years rather than five years in advance of the statutory retirement age. When needed, this policy could be supported by increasing deductions from benefits in cases of early retirement to actuarial levels (i.e., to 5% or even 6% p.a.; OECD 2015, pp. 133). Assuming that, by these means, age-specific rates of entries into disablement and early retirement could be reduced by 50% until 2019 compared to the “baseline” scenario, budgetary pressure as measured by the share of state subsidies in GDP would be notably reduced in the short to medium run. Together with improvements in labour-market performance (e.g., those assumed for the “lower unemployment” scenario; see Section 4.4), the ratio of state subsidies to GDP would fall to about 3% until 2020, to about 1% until 2040, and it would decline to 0% at the end of the projection horizon. Another change that should start taking effect soon and fully unfold over the next few decades is a further increase of the statutory pension age. In an unfunded pension scheme, increasing the retirement age is an appropriate response to demographic ageing, certainly to the extent that it is driven by increases in life expectancy. However, enacting increases in statutory age thresholds is often difficult. Those approaching current age limits would have to revise their life-cycle planning, thinking that current rules define an entitlement that they have rightfully acquired. Younger workers who would be faced with a substantially higher age threshold could be uncertain as to whether these increases will be in fair compared to higher life expectancy they will actually be experiencing – not knowing whether this perspective is indeed reliable. An elegant way of dealing with political difficulties involved in repeated discussions about adjustments in the statutory retirement age is to link the threshold to observed
17

changes in life expectancy by a transparent, rule-based definition which works automatically. For instance, under the current law the number of years individuals are “expected” to be economically active (from around age 20 to age 60 which, according to our calculations, is the current average retirement age across all types of pension benefits) and then in retirement (for about another 16 years) relate to each other in a 5:2-ratio. One could try to keep this ratio constant if life expectancy is increasing, implying that the statutory retirement age needs to be increased by 1 month against current age limits when life expectancy has increased by 1.4 months in the preceding year (or any multiple of these two figures). Once enacted, political debates about adjusting the statutory age threshold in a discretionary fashion should subside, and actual changes only come about if longevity indeed goes up. The simple parameters for this rule have been set on a unisex basis. Yet, they should be directly applied only to the situation of males (for which the current statutory pension age is 65). Under the assumptions for the baseline scenario, this age limit would automatically increase to about 70 years of age until 2060 in a continuous process. The increase suggested here starts considerably earlier than the increase to 67 scheduled to begin in 2030 in the existing legal framework, but it is far less steep in the period between 2030 and 2038. It will therefore have a positive impact on pension finances starting soon, but will reduce inequities between different age cohorts involved in the current law. The age limit for females is brought in line with the one for males in an on-going process lasting until 2030. This process could be modified in such a way that it tends to follow the automatic adjustments for males, but avoids extra-increases which become too strong. For instance, increases by 3 months per year involved in the current schedule could be accelerated by just one week if life expectancy has increased by 1.4 months in the preceding year. As a result, statutory pension ages for females and males would be the same starting from 2038 and move together over the remaining projection period. Compared to the options for reform already considered, changes in the statutory pension age would have relatively weak effects in the short run, but very strong ones in the long run. If everything else remains unchanged against the baseline scenario, state subsidies would decline to just under 4% of GDP until 2020, to 1.5% until 2040, and they would fall below zero around 2060. Afterwards, expenditure of the public pension scheme could be fully covered by the contribution rate. Combined with the other reforms, this situation could in fact be reached already by 2050. However, while this result sounds like good news with respect to budgetary effects and fiscal sustainability, it is still based on a level of public pension benefits which declines considerably throughout the projection period – to about half of the current, low level. The total benefit level deriving from both pillars is therefore reduced by close to 20%.14
14 In the reform scenario, the reduction would become somewhat smaller than in the baseline case, because longer periods of activity increase public pensions as well as second-pillar pensions.
18

5.2 Stabilizing the benefit level
This prospect is not satisfactory from a social-policy point of view. It may as well not be politically feasible, since a growing share of older voters may reject the idea that public pensions and the overall level of old-age income continue to decline, while they have had to pay the same contribution rate as preceding age cohorts throughout their working life. Within a more complex bundle of reforms, there are thus good reasons to do something about future benefit levels and to give future pensioners a share in the cost-saving effects of those options for reform considered thus far. Basically, there are two ways of keeping up future benefit levels. Supplementary funded provisions could be strengthened by increasing the second-pillar allocation. Alternatively, the level of public pension benefits could be stabilized by replacing the current, mixed rule for benefit up-ratings (50% inflation, 50% nominal wage growth) with stronger, or even pure, wage-indexation. Both approaches have their pros and cons. In Section 3, we have argued that, besides increasing the retirement age, switching to partial pre-funding is indeed the way to go if existing pay-as-you-go systems can no longer deliver adequate benefits due to demographic ageing – or could do so only with a massive increase in contribution rates. However, this strategy needs time to fully unfold its effects. If a reform of this kind has not been taken well before the financial pressure in the unfunded scheme becomes acute (or if the switch has not been strong enough), it takes about (another) two decades until (additional) funded pensions will be sizeable, five to six decades until the system is mature. Also, increasing the second-pillar allocation would have an immediate effect on the budget of the first-pillar scheme, hence on state subsidies required from the central budget, if the total contribution rate remained constant. This could be avoided by increasing the total contribution rate as well, either on a one-for-one basis or at least to partially cover revenue losses for the public scheme. Then, the downside might be an unfavourable effect for total wage costs and/or for labour supply of working-age individuals. However, it can be argued that these effects should be small if the increase is caused by higher injections into a funded pension scheme, not by higher contributions to a pay-as-you-go scheme. The reason is that funded pensions which are actuarially fair contain no tax-like element which might create behavioural responses in the contexts of wage bargaining or labour supply.15 While expanding supplementary provisions through the second pillar has an impact on the total level of pension benefits only with a considerable delay, more generous up-ratings of benefits deriving from the first pillar have an immediate effect. The latter may thus not be a measure of first choice in the context of ageing, but they could be used to
15 Higher contributions to a funded pension scheme could create distortions, (i) if the scheme is less than actuarially fair and (ii) if these contributions exceed savings corresponding to optimal life-cycle plans of the individuals covered. But these effects should be small compared to those of the “implicit tax” involved in contributions to Bismarckian pension schemes or, even worse, to the tax-like character of contributions in Beveridgean schemes (Fenge and Werding 2004).
19
stabilize the level of pension benefits for a limited period of time. Again, a drawback is that this triggers an immediate effect on public-pension finances, hence on the central-government budget, if the share of the total contribution rate which is effectively paid to the public scheme is held constant. Yet, an advantage of changes in rules for benefit up-ratings is that they can be used at short foresight. For instance, they can be suspended or cancelled entirely, if other reforms have not established the financial room for manoeuvre which would be required.
5.3 Results for a combined reform strategy
Taking together these considerations, a mixed strategy for cutting pension expenditure in the short run and for (re-)increasing future levels of benefits can be conceived of. Ideally, it should combine a further shift towards partial pre-funding that is initiated soon and pursued unwaveringly with (temporary) increases in benefit up-ratings which can be used flexibly, depending on what the benefit level appears to require and what other circumstances allow for. To illustrate the potential effects, we look at two additional projections which are built on the baseline scenario (see Section 4.1), modified by the following assumptions.
- Reductions in age specific rates of entry into disability pensions and early retirement (to 50% of their baseline values until 2019) and in the unemployment rate (to 9% until 2019) are assumed to take place, with favourable effects for pension finances that were already discussed.
- The same applies to increases in the statutory pension age (throughout the projection period) that are automatically linked to on-going increases in life expectancy and lead to a uniform age threshold for both males and females at age 70 around 2060.
- Also, total contribution rates and second-pillar allocations are increased by 1 percentage point per year against their current values (20% and 5% of taxable wages, respectively) starting from 2016. At least temporarily, the weight of nominal wage growth in the rule for benefit up-ratings (currently: 50%) is also increased. However, both these changes come in two possible variants: (i) in the “8/80 scenario”, second-pillar allocations reach 8% of taxable wages (in
2018), then remain constant; the weight of wage growth in benefit up-ratings goes up to 80% (until 2018), but back to 50% later on (from 2039 to 2041);
(ii) in the “10/100 scenario”, second-pillar allocations go up to 10% (until 2020), while the weight of wage growth becomes 100% (in 2020) and then goes down to 50% again (from 2042 to 2047).
In each of the scenarios considered, total contributions rates and second-pillar allocations move parallelly, so that the effective contribution rate for the first-pillar scheme always remains the same.
20
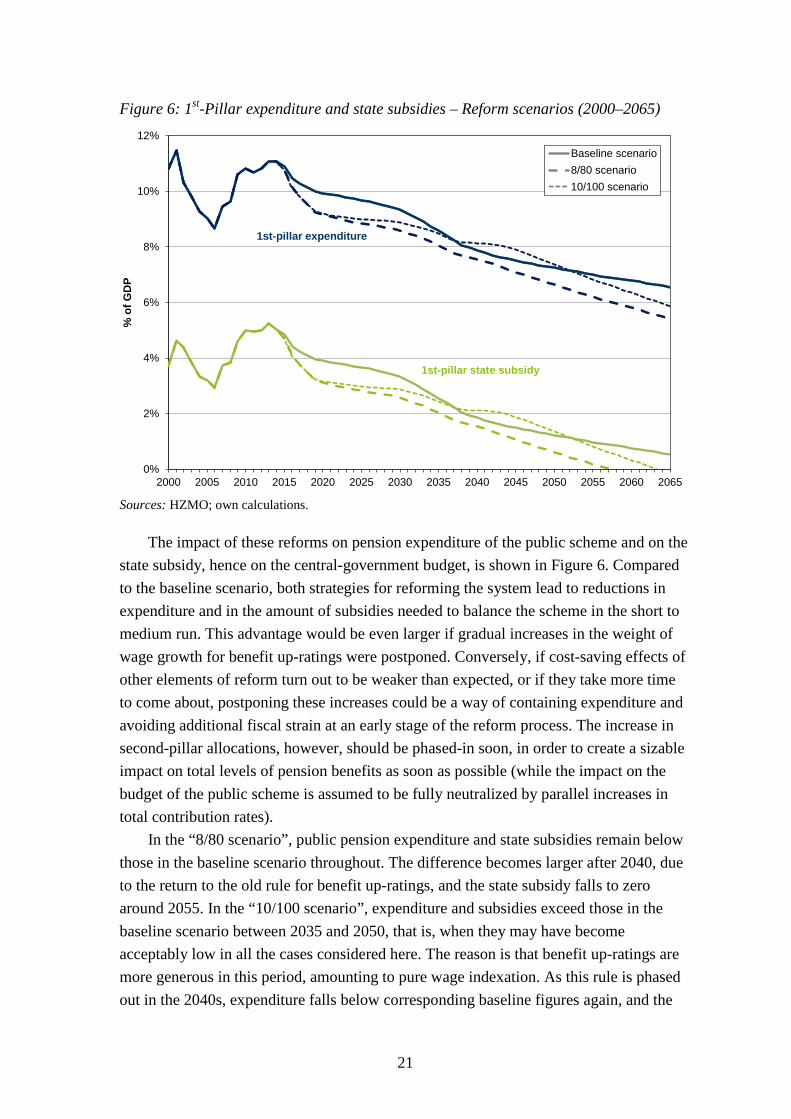
Figure 6: 1st-Pillar expenditure and state subsidies – Reform scenarios (2000–2065)
0%
2%
4%
6%
8%
10%
12%
2000 2005 2010 2015 2020 2025 2030 2035 2040 2045 2050 2055 2060 2065
% o
f GD
P
Baseline scenario8/80 scenario10/100 scenario
1st-pillar expenditure
1st-pillar state subsidy
Sources: HZMO; own calculations.
The impact of these reforms on pension expenditure of the public scheme and on the state subsidy, hence on the central-government budget, is shown in Figure 6. Compared to the baseline scenario, both strategies for reforming the system lead to reductions in expenditure and in the amount of subsidies needed to balance the scheme in the short to medium run. This advantage would be even larger if gradual increases in the weight of wage growth for benefit up-ratings were postponed. Conversely, if cost-saving effects of other elements of reform turn out to be weaker than expected, or if they take more time to come about, postponing these increases could be a way of containing expenditure and avoiding additional fiscal strain at an early stage of the reform process. The increase in second-pillar allocations, however, should be phased-in soon, in order to create a sizable impact on total levels of pension benefits as soon as possible (while the impact on the budget of the public scheme is assumed to be fully neutralized by parallel increases in total contribution rates). In the “8/80 scenario”, public pension expenditure and state subsidies remain below those in the baseline scenario throughout. The difference becomes larger after 2040, due to the return to the old rule for benefit up-ratings, and the state subsidy falls to zero around 2055. In the “10/100 scenario”, expenditure and subsidies exceed those in the baseline scenario between 2035 and 2050, that is, when they may have become acceptably low in all the cases considered here. The reason is that benefit up-ratings are more generous in this period, amounting to pure wage indexation. As this rule is phased out in the 2040s, expenditure falls below corresponding baseline figures again, and the
21

Figure 7: Gross level of old-age pension benefits (1st and 2nd pillar, 2000–2065)
0%
5%
10%
15%
20%
25%
30%
35%
40%
2000 2005 2010 2015 2020 2025 2030 2035 2040 2045 2050 2055 2060 2065
% o
f ave
rage
taxa
ble
wag
es
Baseline8/80 scenario10/100 scenario
1st-pillar pensions
1st and 2nd-pillar pensions
Notes: The benefit level is assessed relating average old-age pensions to average taxable wages, both gross of taxes and social insurance contributions. Sources: HZMO; own calculations.
state subsidy becomes zero shortly before the end of the projection horizon. Once again, the timing and strength of the phase-out can be adjusted to avoid increasing fiscal pressure or to exploit any unexpected financial leeway. Figure 7 displays the impact of the reform scenarios on the (gross) level of average pension benefits – those provided by the public scheme as well as total benefits deriving from the two-pillar system. Our two scenarios have been deliberately designed to demonstrate the options arising in this respect. The “8/80 scenario” stabilizes total pension benefits almost perfectly at their current level. The “10/100 scenario” even leads to a long-term recovery of the benefit level, in case this is considered desirable.16 In both cases, the long-run effects are mainly driven by higher second-pillar pensions. Adjustments in up-ratings of public pension benefits can be used to fill any gaps in benefit levels which arise in the short to medium run – provided that this is made possible by the budgetary situation of the pension scheme and by favourable effects of other elements of reform. Last but not least, we can consider the consequences of these reforms for public finances and their long-term sustainability. Building on projections for state subsidies paid to the first pillar (see Section 4.3), general-government debt would increase to about 125% of GDP in the “8/80 scenario”, to just over 150% in the “10/100 scenario” until
16 Alternatively, it could be a way of stabilizing the net benefit level, if other public charges (e.g., contributions for health care) will increase in the future.
22
2065 (instead of close to 180%, as in the baseline scenario). Due to higher annual injections, total funds accumulated in the second pillar would reach 140% and 170% of GDP, respectively (instead of 90%). An important aside in our considerations is that these funds should no longer be mostly invested in domestic government bonds. Investment rules that contributed to this bias have already been modified, but there may be informal rules that are still working in this direction. Instead of defining lower limits for the share of domestic government bonds (e.g., a minimum of 50%, as until 2007), new rules imposing an upper limit on this share may be called for (e.g., a maximum of considerably less than 50%, allowing for a sufficient time for restructuring investment). Besides making retirement income – and also public finances – less exposed to the impact of ageing, this may also have effects for the rate of return, hence for the level of second-pillar pensions accruing in the future, that we do not want to speculate about in our projections. While long-term debt ratios projected for the reform scenarios may still sound a little uncomfortable, the EU sustainability indicator shows that public finances could be called “sustainable” in the “8/80” case (S2 is –0.1% of GDP,17 instead of 0.7%). In spite of relative generous changes in total benefit levels, fiscal sustainability is at least clearly improved in the “10/100” case (S2 being 0.35%). Of course, these results are partly due to the fact that we are neglecting the potential impact of increasing health costs and other budget items by which ageing creates additional sustainability risks.18 Yet, the fiscal effects of the system of old-age provision are fully captured here. We can demonstrate that, through a combination of different measures, major challenges can be fixed over the next five decades without abandoning the idea of providing adequate benefits and, at the same time, without necessarily deteriorating fiscal sustainability.
6 Conclusion
In this paper, we have described in some detail problems and possible reforms of the Croatian system of old-age provision. This system is currently in a particularly difficult situation. But institutions in Croatia have similarities with those in other transition economies, including a majority of those that joined the EU, and the same is true for some of the problems we have discussed. Essentially, the agenda we have been looking at consists of two types of measures: (i) measures suited to bring down the high level of pension expenditure in the short to medium term and (ii) measures which will avert the erosion of retirement income in the long run.
17 By definition, negative figures indicate that public finances are sustainable; they should not be interpreted as a leeway for increasing primary deficits. Here, the “safety margin” against a sustainability gap of zero is small anyway.
18 According to our projections, the Croatian general-government budget could actually run a sizable primary surplus, once financial pressure from high state subsidies to the public pension scheme is gone. Given that, it will be able to shoulder considerable interest payments and still make sure that public debt grows exactly in line with GDP year by year, so that the debt ratio remains exactly constant.
23

Specific measures of the first type are changes in eligibility rules for disability pensions and early retirement, plus gradual increases in the retirement age which are automatically linked to increases in life expectancy. Where they appear appropriate, reforms of this kind need to be taken soon. Depending on the budgetary situation of existing pension schemes and the strength of ageing processes, there are not many alternatives to going in these directions. Measures of the second type are further expansions of pre-funded pensions, probably complemented with (intermediate) switches to more generous benefit up-ratings of unfunded pensions. These elements can be combined in various ways – with parallel increases in total (first and second-pillar) contribution rates to avoid financial pressure for the unfunded scheme – and with a timing that can be flexibly adjusted. The expansion of second-pillar contributions should not be postponed, as this is an element of reform which needs time to fully unfold its effects and, subject to a few caveats (see Section 3), can be really favourable. All in all, our projections are meant to illustrate important pre-requisites and ingredients of successful reform strategies for old-age provision in Croatia, applicable also to other countries facing similar problems. In doing so, we do not want to come up with a one-size-fits-all solution, but try to provide a set of tools which can be applied with some flexibility, depending on the goals pursued and on the economic conditions affecting the pension system.
References
Aaron, Henry J. (1966), “The social insurance paradox”, Canadian Journal of Economics and Political Science 32(3): 371–374.
Abel, Andrew B., N. Gregory Mankiw, Lawrence H. Summers and Richard J. Zeckhauser (1989), “Assessing dynamic efficiency: theory and evidence”, Review of Economic Studies 56(1): 1–19.
Barr, Nicholas (2002), “Reforming pensions: Myths, truths, and policy choices”, International Social Security Review 55(2): 3–36.
Barr, Nicholas and Diamond, Peter A. (2008), Reforming Pensions: Principles and Policy Choices, Oxford, New York: Oxford University Press
Bejaković, Predrag (2002), “Iskustva i pouke iz reformi mirovinskih sustava u tranzicijskim zemljama”, Financijska teorija i praksa 26(2): 405–434.
Breyer, Friedrich (1989), “On the intergenerational Pareto efficiency of pay-as-you-go financed pension systems”, Journal of Institutional and Theoretical Economics 145(4): 643–658.
Board of Trustees (2015), “The 2015 annual report of the Board of Trustees of the Federal OASDI Trust Funds”, 114th Congress, House Document No. 114-51.
24
Börsch-Supan, Axel; Alexander Ludwig and Joachim Winter (2006), “Ageing, pension reform and capital flows: A multi-country simulation model”, Economica 73(292): 625–658.
Burniaux, Jean-Marc, Romain Duval and Florence Jaumotte (2003), “Coping with aging: A dynamic approach to quantify the impact of alternative policy options on future labor supply in OECD countries”, OECD Economics Department Working Paper No. 371.
Cangiano, Marco, Carlo Cottarelli and Luis Cubeddu (1998), “Pension developments and reforms in transition economies”, IMF Working Paper WP/98/151.
Cigno, Alessandro and Martin Werding (2007), Children and Pensions, Cambridge, MA, London: MIT-Press.
Diamond, Peter A. (2002), Social Security Reform, Oxford, New York: Oxford University Press.
Diamond, Peter A. and John Geanakoplos (2003), “Social security investment in equities”, American Economic Review 93(4): 1047–1074.
Dobronogov, Anton and Mamta Murthi (2005), “Administrative fees and costs of mandatory private pensions in transition economies”, Journal of Pension Economics and Finance 4(1): 31–55.
Dupont, Gaël (2004), “Pensions reforms in acceding countries”, Revue de l’OFCE 91(bis): 55–81.
European Commission (2015), “Country report Croatia 2015”, Commission Staff Working Document No. COM(2015) 85 final.
European Commission (2016), “Fiscal sustainability report 2015”, European Economy Institutional Paper No. 018.
European Commission, DG ECFIN (2015), Annual Macro-Economic (AMECO) database, http://ec.europa.eu/economy_finance/db_indicators/ameco/index_en.htm.
European Commission and EU Economic Policy Committee (2014), “2015 ageing report: Underlying assumptions and projection methodologies”, European Economy No. 8/2014.
European Commission and EU Economic Policy Committee (2015), “2015 ageing report: Economic and budgetary projections for the 28 EU Member States (2013-2060)”, European Economy No. 3/2015.
Feldstein, Martin S. (1995), “Would privatizing social security raise economic welfare?”, NBER Working Paper No. 5281.
Fenge, Robert (1995), “Pareto-efficiency of the pay-as-you-go pension system with intragenerational fairness”, Finanzarchiv 52(3): 357–363.
Fenge, Robert and Martin Werding (2004), “Ageing and the tax implied in public pension schemes: Simulations for selected OECD countries”, Fiscal Studies 25(2): 159–200.
25

FIAP (International Federation of Pension Fund Administrators; 2013), Yearly Report No. 34, http://www.fiap.cl/prontus_fiap/site/artic/20150618/asocfile/ 20150618171248/yearly_report_no__34___dec__2013.pdf.
Garibaldi, Pietro, Joaquim Oliveira Martins and Jan van Ours (2010), Ageing, Health, and Productivity: The Economics of Increased Life Expectancy, Oxford, New York: Oxford University Press.
Gruber, Jonathan and David A. Wise (2004), Social Security Programs Around the World: Micro-Estimation, Chicago: University of Chicago Press.
Homburg, Stefan (1990), “The efficiency of unfunded pension schemes”, Journal of Institutional and Theoretical Economics 146(4): 640–647.
HANFA (2015a), Statistics, http://www.hanfa.hr/EN/nav/106/statistics.html. HANFA (2015b), Vrijednost MIREX-a (MIREX value), http://www.hanfa.hr/mirex.html. HZMO (2015), Statističke informacije Hrvatskog zavoda za mirovinsko osiguranje
(Statistical Information of the Croatian Pension Insurance Institute, various years), http://www.mirovinsko.hr/default.aspx?id=723.
Lindeman, David, Michal Rutkowski and Oleksiy Sluchynskyy (2000), The Evolution of Pension Systems in Eastern Europe and Central Asia: Opportunities, Constraints, Dilemmas and Emerging Best Practices, Washington, D.C.: The World Bank.
Meier, Volker and Martin Werding (2010), “Ageing and the welfare state: Securing sustainability“, Oxford Review of Economic Policy 26(4): 655–673.
MISSOC (2015), Mutual Information System on Social Protection, http://www.missoc.org.
Mitchell, Olivia S. (1998), “Administrative costs in public and private retirement systems”, in: Martin S. Feldstein (ed.), Privatizing Social Security, Chicago, IL: University of Chicago Press, pp. 403–456.
Mitchell, Olivia S. and Stephen P. Utkus (eds., 2004), Pension Design and Structure: New Lessons from Behavioral Finance, Oxford, New York: Oxford University Press.
Nestić, Danijel and Ivana Rašić Bakarić (2008), “From work to retirement: Pension system incentives to continued labour market participation in Croatia”, in: Maja Vehovec (ed.), New Perspectives on a Longer Working Life in Croatia and Slovenia, Zagreb: Ekonomski Institut and Friedrich Ebert Stiftung, pp. 81–99.
Nickel, Christiane and Johan Almenberg (2006), “Ageing, pension reforms and capital market development in transition countries”, EBRD Working Paper No. 99.
OECD (2015), Pensions at a Glance 2015: OECD and G20 Indicators, Paris: Organization for Economic Co-operation and Development.
Sinn, Hans-Werner (2000), “Why a funded pension system is needed and why it is not needed”, International Tax and Public Finance 7(4/5): 389–410.
26
Šonje, Velimir (2011), Pension Systems and Pension Reforms: Case of Croatia, Report prepared for the USAID PFS Project, Arlington, VA: Partners for Financial Stability (PFS).
Werding, Martin and Kai A. Konrad (2012), “Reforming the European welfare state”, in: Thiess Büttner and Wolfgang Ochel (eds.), The Continuing Evolution of Europe, Cambridge, MA, London: MIT-Press, pp. 71–118.
World Bank (2011), Croatia: Policy Options for Further Pension System Reform, Washington, D.C.: The World Bank.
Appendix A.1: Demographic perspectives
Demographic projections for the “baseline” scenario have been prepared using data on total population (differentiated by gender and single years of age) for 2013 provided by Eurostat. They are based on cohort-wise, year-by-year projections using the following assumptions.
- The total fertility rate remains constant at 1.5 (children per woman) throughout the projection period
- Life expectancy at birth goes up to 87.6 years for females and to 82.7 years for males until 2060 (year-2013 figures are 80.7 and 74.0 years, respectively)
- Net immigration is zero throughout the projection period Given the uncertainties about any of these determinants of future demographic trends, alternative projections are also made, introducing the following changes against baseline assumptions.
- Total fertility rate: ± 0.3 children until 2060 (in a continuous process) - Life expectancy at birth: ± 3 years for both females and males in 2060 - Net immigration: ± 5,000 per year throughout the projection period
Of the 3 × 3 × 3 = 27 variants that are obtained combining any of these assumptions, two are considered to be particularly interesting. The “old population” scenario is based on assumptions implying declining fertility, a strong increase in life expectancy, and negative net migration. The “young population” scenario is based on assumptions implying increasing fertility, a weak increase in life expectancy, and positive net migration. Simulations for total population and old-age dependency for all 27 scenarios are shown in Figures A.1 and A.2. The two extreme variants are highlighted, like the baseline scenario, in Figure A.2.
27

Figure A.1: Total population (2000–2065)
2,5
3,0
3,5
4,0
4,5
5,0
2000 2005 2010 2015 2020 2025 2030 2035 2040 2045 2050 2055 2060 2065
Popu
latio
n (o
n 1
Janu
ary;
in m
illio
ns)
(± 0.3 children)(± 3 years)(± 5,000)
Baselinescenario
Assumptions:total fertility rate: 1.5 children (per woman)life expectancy: m 82.7; f 87.6 yearsnet immigration: 0 individuals p.a.
Sources: Eurostat; own calculations.
Figure A.2: Old-age dependency ratio (2000–2065)
0
10
20
30
40
50
60
70
2000 2005 2010 2015 2020 2025 2030 2035 2040 2045 2050 2055 2060 2065
Popu
latio
n 65
+ / P
opul
atio
n 15
–64 ×
100
Baselinescenario
Assumptions:total fertility rate: 1.5 children (per woman)life expectancy: m 82.7; f 87.6 yearsnet immigration: 0 individuals p.a.
(± 0.3 children)(± 3 years)(± 5,000)
"old population"
"young population"
Sources: Eurostat; own calculations.
28

Appendix A.2: Results of long-term projections
Table A.1: Selected results for the “baseline” scenario
2010 2020 2030 2040 2050 2060
Total population (1,000s) 4,303 4,190 4,043 3,852 3,637 3,419 Old-age dependency (%) 26.7 32.3 39.7 44.4 50.5 55.1
Labour force (1,000s) 1,752 1,755 1,696 1,679 1,535 1,403 Employment (1,000s) 1,523 1,487 1,439 1,416 1,295 1,184 Unemployment rate (%) 11.7 14.4 14.4 14.8 14.8 14.7
Labour productivity (± % p.a.) -1.2 1.3 1.9 2.1 1.9 1.7 Real GDP (± % p.a.) -1.7 1.2 1.4 1.3 1.0 0.8 Real interest rate (% p.a.) 5.4 3.0 3.0 3.0 3.0 3.0 Inflation rate (% p.a.) 0.8 2.0 2.0 2.0 2.0 2.0
Pensioners (1,000s) 1,523 1,487 1,439 1,416 1,295 1,184 Support ratio (%) 127 123 116 119 110 104
Total contrib. rate (% wages) 20.0 20.0 20.0 20.0 20.0 20.0 Current cost rate (% wages) 30.0 29.7 28.3 24.6 23.1 21.9 2nd-pillar allocation (% wages) 5.0 5.0 5.0 5.0 5.0 5.0
1st-pillar expenditure (% GDP) 10.8 9.9 9.3 7.9 7.2 6.8 State subsidy (% GDP) 5.0 3.9 3.3 1.8 1.2 0.8
2nd-pillar expenditure (% GDP) 0.0 0.1 0.6 1.3 2.0 2.5 2nd-pillar funds (% GDP) 11.1 31.1 50.1 62.5 74.8 84.4
Average benefit level (% wages): 1st pillar 31.6 29.8 26.6 23.4 20.0 17.6 Total (1st and 2nd pillar) 31.6 30.3 29.1 28.1 26.9 25.5
Notes: Results reported for the years from 2020 onwards are a projection, based on many assumptions explained in the text, never a prognosis. – Definitions: “old-age dependency” is measured based on the population groups aged 65+ and 15–64; the “unemployment rate” is measured as a percentage of the total labour force; the “real interest rate” relates to domestic government bonds; the “support ratio” is the number of active workers covered by the pension system divided by the total number of beneficiaries; “total contribution rate” and “current cost rate” both include the “2nd-pillar allocation”; in addition, the “current cost rate” measures the contribution rate (as a percentage of taxable wages) that would balance the budget of the 1st-pillar scheme; the “average benefit level” is assessed relating average old-age pensions to average taxable wages, both gross of taxes and social insurance contributions. Sources: Actual 2010 data are taken from Eurostat, the EU-DG ECFIN’s AMECO database, HZMO and HANFA as indicated in the text; projected data from 2020 onwards are based on own calculations.
29