Embed Size (px)
Citation preview
The critical role of catalase in prooxidant andantioxidant function of p53
MY Kang1,2,6, H-B Kim1,2,6, C Piao1,2, KH Lee3, JW Hyun4, I-Y Chang1,5 and HJ You*,1,2
The tumor suppressor p53 is an important regulator of intracellular reactive oxygen species (ROS) levels, although downstreammediators of p53 remain to be elucidated. Here, we show that p53 and its downstream targets, p53-inducible ribonucleotidereductase (p53R2) and p53-inducible gene 3 (PIG3), physically and functionally interact with catalase for efficient regulation ofintracellular ROS, depending on stress intensity. Under physiological conditions, the antioxidant functions of p53 are mediatedby p53R2, which maintains increased catalase activity and thereby protects against endogenous ROS. After genotoxic stress,high levels of p53 and PIG3 cooperate to inhibit catalase activity, leading to a shift in the oxidant/antioxidant balance toward anoxidative status, which could augment apoptotic cell death. These results highlight the essential role of catalase in p53-mediatedROS regulation and suggest that the p53/p53R2–catalase and p53/PIG3–catalase pathways are critically involved in intracellularROS regulation under physiological conditions and during the response to DNA damage, respectively.Cell Death and Differentiation (2013) 20, 117–129; doi:10.1038/cdd.2012.102; published online 24 August 2012
Reactive oxygen species (ROS) are generated as productsor by-products in cells and function as signalingmolecules and cellular toxicants.1,2 Therefore, a series ofantioxidant mechanisms maintain and protect intracellularredox homeostasis.2–4 A shift in the balance between oxidantsand antioxidants toward oxidation causes DNA mutations,protein oxidation, and lipid peroxidation, which eventually leadto loss of molecular function1,2,5 and contribute to thepathogenesis of human diseases, including aging andcancer.3
The p53 protein has been proposed as a critical regulator ofintracellular ROS levels. Upon activation following DNA
damage, p53 can activate several genes that result in
increased ROS generation, which contributes to the induction
of apoptosis in cells with unrepaired DNA damage.6–10 The
induction of apoptosis is central to the tumor-suppressive
activity of p53.11,12 By using the serial analysis of gene
expression technique to evaluate the patterns of gene
expression following p53 expression, a series of p53-induciblegenes (PIG genes) have been identified that are predicted to
encode proteins that could generate ROS.8 Of particular
interest is p53-inducible gene 3 (PIG3), which shares
sequence similarity with NADPH-quinine oxidoreductase,
and is induced by p53 before the onset of apoptosis and
contributes to ROS generation.8 Thus, PIG3 is believed to be
one of the major factors involved in p53-induced apoptosis
through ROS generation. This was the first clear connection
between p53 and ROS generation, but the molecular
mechanisms of PIG3-induced ROS generation have notyet been elucidated. Under physiological condition, basallevels of p53 can also upregulate antioxidant genesthat function to lower ROS levels, and this antioxidant functionof p53 is important in preventing oxidative stress-inducedDNA damage and tumor development under low-stressconditions.13–21 Thus, p53 has opposing roles in the regula-tion of ROS, depending on the nature and intensity of thestress and on the cellular context. However, the precisemolecular mechanisms of the balance between prooxidantand antioxidant states caused by p53 are not completelyunderstood.
In this study we sought to identify cellular and molecularmechanism of p53-mediated positive and negative regulationof ROS generation. Our study reveals that p53 cooperatingwith PIG3 or p53-inducible ribonucleotide reductase (p53R2),p53 downstream targets, regulates ROS levels through up-and downregulation of catalase activity.
Results
p53 and PIG3 directly bind with catalase. To clarify themolecular mechanisms of p53-mediated ROS regulation, ayeast two-hybrid screen was used to identify molecularpartners of p53 and PIG3 implicated in the regulation ofintracellular ROS levels. We isolated catalase, the antiox-idant enzyme that defends against hydrogen peroxide(H2O2),5,22 by searching for new p53- and PIG3-interacting
1DNA Damage Response Network Center, Chosun University School of Medicine, Gwangju, South Korea; 2Department of Pharmacology, Chosun University School ofMedicine Gwangju, South Korea; 3Department of Marine Life Science, College of Natural Sciences, Chosun University, Gwangju, South Korea; 4Department ofBiochemistry, School of Medicine, Jeju National University, Jeju, South Korea and 5Department of Anatomy, Chosun University School of medicine, Gwangju, South Korea*Corresponding author: HJ You, DNA Damage Response Network Center, Department of Pharmacology, Chosun University School of Medicine, 375 Seosuk-Dong, Gwangju,501-759 Korea. Tel: +82 62 230 6337; Fax: +82 62 230 6586; E-mail: [email protected] authors contributed equally to this work.
Received 23.4.12; revised 03.7.12; accepted 19.7.12; Edited by G Melino; published online 24.8.12
Keywords: p53; reactive oxygen species; catalase; PIG3; p53R2Abbreviations: PIG3, p53-inducible gene 3; p53R2, p53-inducible ribonucleotide reductase; ROS, reactive oxygen species; H2O2, hydrogen peroxide; BiFC,bimolecular fluorescence complementation
Cell Death and Differentiation (2013) 20, 117–129& 2013 Macmillan Publishers Limited All rights reserved 1350-9047/13
www.nature.com/cdd
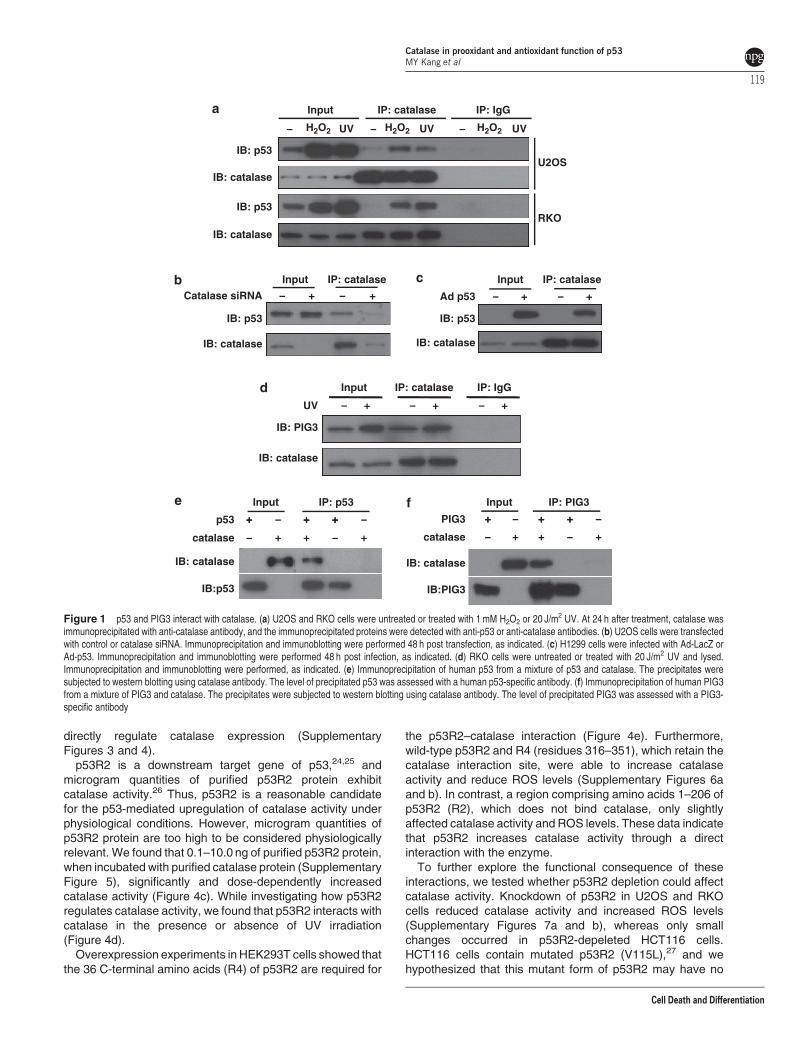
proteins. To examine the interaction between endogenousp53 and catalase, cell extracts from U2OS and RKO cellswere immunoprecipitated with the anti-catalase. Western blotanalyses revealed that p53 was present in the immunopre-cipitates obtained with anti-catalase antiserum, and that thisinteraction increased significantly after H2O2 or UV treatment(Figure 1a). To demonstrate the specificity of the catalaseantibody, we created a catalase-deficient U2OS cell lineusing catalase-targeting small interference RNA and per-formed the co-immunoprecipitation in these cells. Immuno-precipitation of the catalase in catalase-knockdown cellstreated with UV irradiation resulted in only a very faint band,indicating the specificity of this interaction (Figure 1b).Overexpression experiments in H1299 (p53–/–) cells furtherconfirmed that p53 specifically bound to catalase (Figure 1c).
To determine whether PIG3 interacts with catalase in a cellendogenously expressing PIG3 protein, cell extracts fromRKO cells were immunoprecipitated with the anti-catalaseantibody. Western blot analyses revealed that PIG3 wasclearly present in the immunoprecipitates obtained with anti-catalase antiserum, and this interaction increased after UVtreatment (Figure 1d).
We next used purified recombinant proteins to test thepossibility of a direct interaction of p53 and PIG3 to catalase.We premixed the purified human p53 or PIG3 with recombi-nant human catalase (Supplementary Figures 1a and b) andsubjected the protein precipitates that we obtained to westernblot assays using antibody specific to catalase. Immunopre-cipitation with antibody to p53 pulled down catalase from thep53-catalase mixture (Figure 1e). Similarly, immunoprecipita-tion with antibody to PIG3 captured catalase from the PIG3-catalase mixture (Figure 1f). These results suggest that p53and PIG3 directly interacted with catalase.
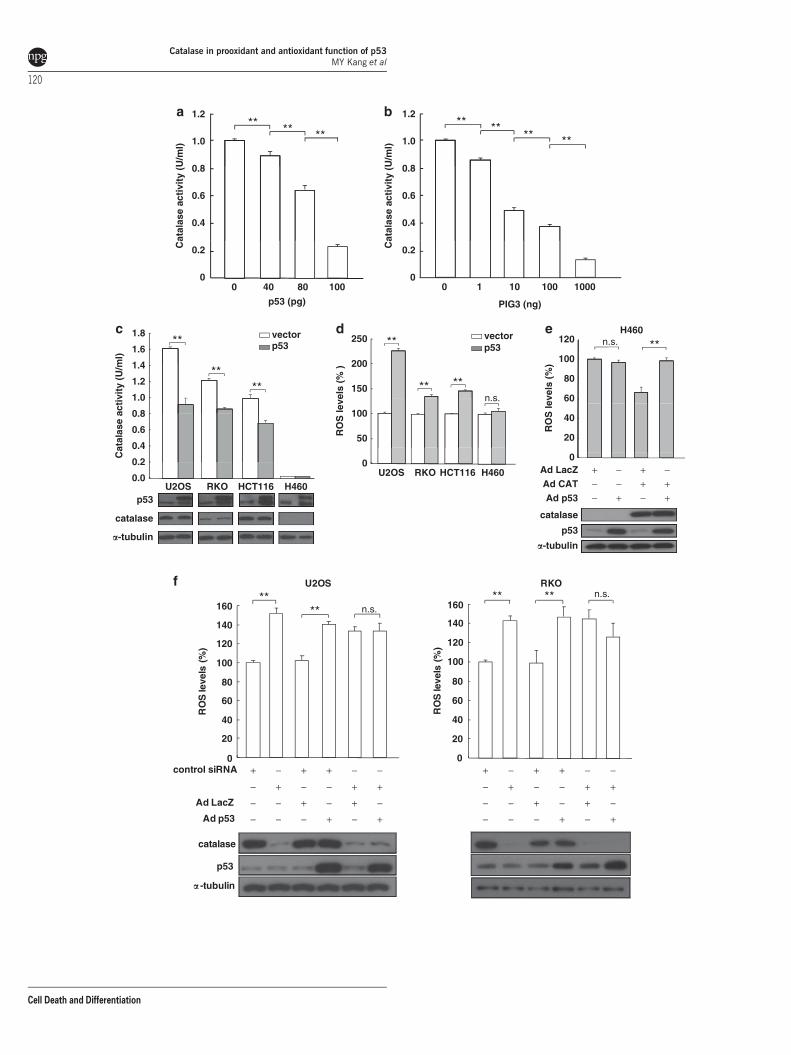
p53 and PIG3 suppress catalase activity throughassociation with catalase. The affinity of p53 and PIG3for catalase described above prompted a search for afunctional interaction between these proteins. Because p53and PIG3 have no catalase activity (data not shown), thepossibility that they may affect the enzymatic activity ofcatalase was investigated. Using recombinant purifiedhuman proteins, catalase activity was tested in the presenceor absence of p53 and PIG3. Catalase activity was stronglyand dose-dependently repressed by recombinant p53(Figure 2a) and PIG3 (Figure 2b) protein. To further evaluatethe role of p53 in the regulation of catalase function in vivo, weexamined whether catalase is inhibited when p53 is over-expressed. Consistent with these in vitro results, ectopicallyexpressed p53 decreased catalase activity in U2OS, RKO,and HCT116 cells (Figure 2c). Coincidently, p53-expressingcells showed increased ROS production (Figure 2d). How-ever, we did not detect differences in the ROS levels betweencontrol and p53 expressing H460 cells (Figure 2d, lane 4). AsH460 cells are deficient in catalase (Figure 2c, lane 4), p53expression would likely fail to upregulate ROS production incatalase-deficient cells. Indeed, ectopic expression of p53increased ROS levels in catalase-overexpressing H460 cells(Figure 2e) but not in catalase-depleted U2OS and RKO cells(Figure 2f), indicating that catalase is required for p53-mediated ROS regulation.
We next tested whether PIG3 expression influencescatalase activity in p53-deficient cells. SW480 cells (p53mutant), H1299 cells (p53 null), and HCT116 p53–/– cells weretransiently transfected with either the PIG3 expression vectoror its control vector, and catalase activity was measured.Ectopic expression of PIG3 reduced catalase activity andstimulated ROS production (Supplementary Figures 2a andb). Together, these results indicate that p53 and PIG3suppress catalase activity in vitro and in vivo.
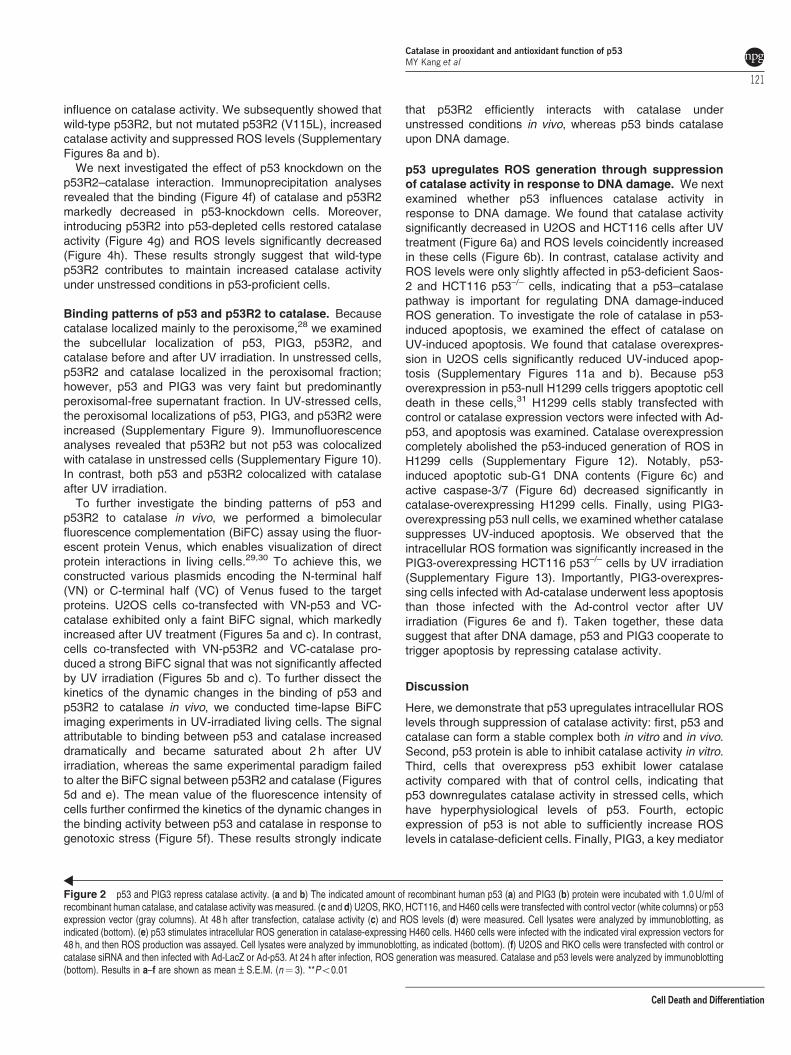
To identify the p53 region responsible for the interactionwith catalase, we generated various fragments of V5-taggedhuman p53 and performed a series of co-immunoprecipitationexperiments. We found that amino acid residues 301–393 inthe C-terminus of p53 (P5) have a crucial role in the interactionwith catalase (Figure 3a). Similarly, we generated expressionconstructs for a series of GFP-tagged PIG3 deletion mutantsto identify the PIG3 domain responsible for the PIG3–catalaseinteraction. The immunoprecipitation results indicated thatdeletion of PIG3 residues 201–332 (PG3) abolished PIG3binding to catalase (Figure 3b).
Catalase-binding region of p53 and PIG3 may inhibitcatalase activity. If so, p53 mutants and PIG3 mutants thatdo not bind catalase should not affect catalase activity. Thefull-length p53 and P5 constructs, which retain the catalaseinteraction site, were able to suppress catalase activity(Figure 3c) and increase ROS levels (Figure 3d). In contrast,a region between amino acids 1 and 300 of p53 (P1), whichdoes not bind catalase, only slightly affected catalase activityand ROS levels. Similarly, the expression of full-length PIG3and PG5 reduced catalase activity (Figure 3e) and increasedROS levels (Figure 3f), whereas a PIG3 mutant missing aminoacids 201–332 (PG3) did not. Thus, the p53 and PIG3 regionnecessary for interacting with catalase is crucial for regulatingcatalase activity and ROS levels.
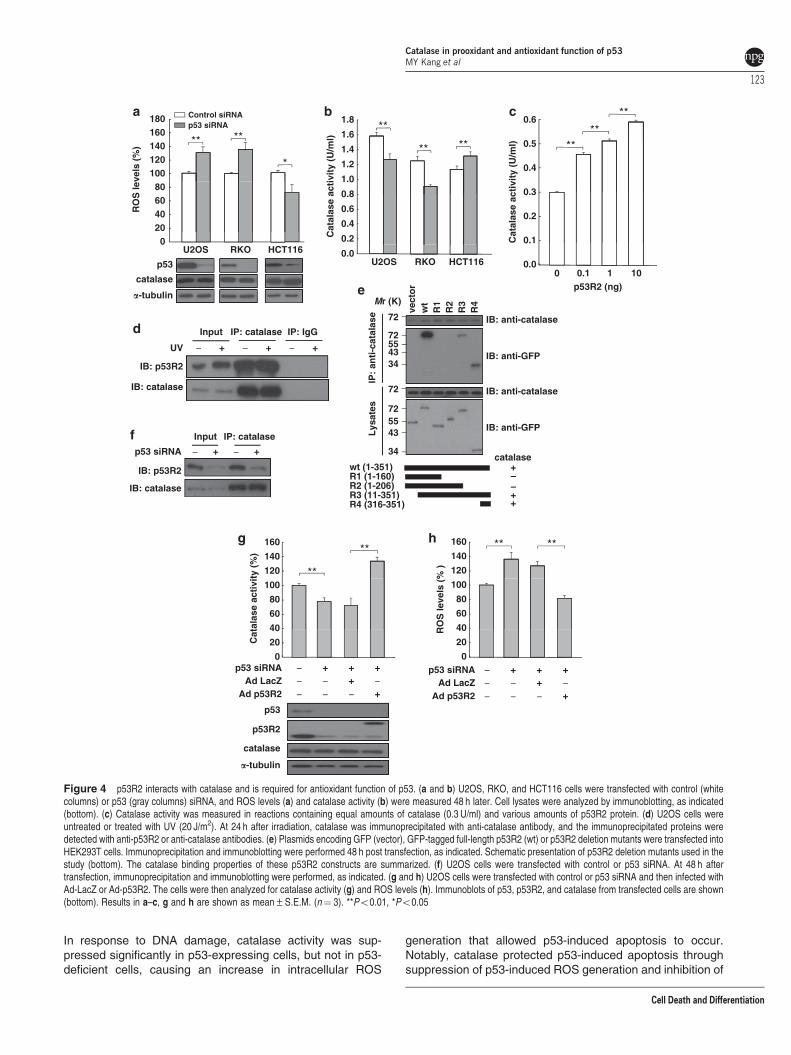
p53R2 mainly contributes to p53-mediated antioxidantfunction in physiological conditions. Previous studieshave indicated that p53 knockdown increases ROS levelsthrough the downregulation of antioxidant genes.14,17,20 Thepresent study also confirmed that p53 knockdown in U2OSand RKO cells increased ROS production (Figure 4a).However, interestingly, p53 knockdown in HCT116 cellsdecreased ROS levels. p53 knockdown may differentlymodulate the expression of antioxidant genes in these cells,consequently altering ROS levels. However, the expressionof antioxidant genes was comparable among p53-depeletedU2OS, RKO, and HCT116 cells (Supplementary Figure 3),indicating that the different patterns of ROS levels are notdependent on these antioxidants. In an effort to explain theseobserved differences in ROS levels, we examined the effectof p53 knockdown on catalase activity. Indeed, ROS levelswere significantly inversely correlated with catalase activity inall three p53-depleted cell lines (Figures 4a and b). Giventhat purified p53 protein inhibited catalase activity in vitro(Figure 2a) and that p53 overexpression reduced catalaseactivity in vivo (Figure 2c), p53 knockdown-dependentdownregulation of catalase activity in U2OS and RKO cells(Figure 4b) is likely mediated by an additional factor.Catalase has been shown not to be regulated15 orupregulated23 by p53, and our data imply that p53 cannot
Catalase in prooxidant and antioxidant function of p53MY Kang et al
118
Cell Death and Differentiation
directly regulate catalase expression (SupplementaryFigures 3 and 4).
p53R2 is a downstream target gene of p53,24,25 andmicrogram quantities of purified p53R2 protein exhibitcatalase activity.26 Thus, p53R2 is a reasonable candidatefor the p53-mediated upregulation of catalase activity underphysiological conditions. However, microgram quantities ofp53R2 protein are too high to be considered physiologicallyrelevant. We found that 0.1–10.0 ng of purified p53R2 protein,when incubated with purified catalase protein (SupplementaryFigure 5), significantly and dose-dependently increasedcatalase activity (Figure 4c). While investigating how p53R2regulates catalase activity, we found that p53R2 interacts withcatalase in the presence or absence of UV irradiation(Figure 4d).
Overexpression experiments in HEK293T cells showed thatthe 36 C-terminal amino acids (R4) of p53R2 are required for
the p53R2–catalase interaction (Figure 4e). Furthermore,wild-type p53R2 and R4 (residues 316–351), which retain thecatalase interaction site, were able to increase catalaseactivity and reduce ROS levels (Supplementary Figures 6aand b). In contrast, a region comprising amino acids 1–206 ofp53R2 (R2), which does not bind catalase, only slightlyaffected catalase activity and ROS levels. These data indicatethat p53R2 increases catalase activity through a directinteraction with the enzyme.
To further explore the functional consequence of theseinteractions, we tested whether p53R2 depletion could affectcatalase activity. Knockdown of p53R2 in U2OS and RKOcells reduced catalase activity and increased ROS levels(Supplementary Figures 7a and b), whereas only smallchanges occurred in p53R2-depeleted HCT116 cells.HCT116 cells contain mutated p53R2 (V115L),27 and wehypothesized that this mutant form of p53R2 may have no
− H2O2 UV − H2O2 UV − H2O2 UV
Input IP: catalase IP: IgG
IB: p53
IB: catalase
IB: p53
U2OS
IB: catalase
RKO
Catalase siRNA
Input
− + − +
Input
Ad p53 − + − +
IB: catalase
IB: p53 IB: p53
IB: catalase
Input
IB: PIG3
UV − + − + − +
IB: catalase
+ − + + −p53
Input
+ − + + −PIG3
Input
catalase
+ + +
IB: catalase
− + + − +
IB:p53
catalase
+ + +
IB:PIG3
− + + − +
IB: catalase
IP: catalase IP: catalase
IP: IgGIP: catalase
IP: p53 IP: PIG3
Figure 1 p53 and PIG3 interact with catalase. (a) U2OS and RKO cells were untreated or treated with 1 mM H2O2 or 20 J/m2 UV. At 24 h after treatment, catalase wasimmunoprecipitated with anti-catalase antibody, and the immunoprecipitated proteins were detected with anti-p53 or anti-catalase antibodies. (b) U2OS cells were transfectedwith control or catalase siRNA. Immunoprecipitation and immunoblotting were performed 48 h post transfection, as indicated. (c) H1299 cells were infected with Ad-LacZ orAd-p53. Immunoprecipitation and immunoblotting were performed 48 h post infection, as indicated. (d) RKO cells were untreated or treated with 20 J/m2 UV and lysed.Immunoprecipitation and immunoblotting were performed, as indicated. (e) Immunoprecipitation of human p53 from a mixture of p53 and catalase. The precipitates weresubjected to western blotting using catalase antibody. The level of precipitated p53 was assessed with a human p53-specific antibody. (f) Immunoprecipitation of human PIG3from a mixture of PIG3 and catalase. The precipitates were subjected to western blotting using catalase antibody. The level of precipitated PIG3 was assessed with a PIG3-specific antibody
Catalase in prooxidant and antioxidant function of p53MY Kang et al
119
Cell Death and Differentiation
1.0
1.2a
c d e
f
b
1.0
1.2
0.4
0.6
0.8 0.8
0.4
0.6
0
0.2
0
p53 (pg)
Cat
alas
e ac
tivi
ty (
U/m
l)
PIG3 (ng)
Cat
alas
e ac
tivi
ty (
U/m
l)
00
0.2
1.6
1.4
1.8 vectorp53
vectorp53
250
1.0
1.2150
200
n.s.
Cat
alas
e ac
tivi
ty (
U/m
l)
0.4
0.2
0.6
0.8
50
100
RO
S le
vels
(%
)
0.0HCT116 U2OS
p53
0
H460
�-tubulin
catalase
H460120 n.s.
60
80
100
RO
S le
vels
(%
)
20
40
Ad LacZAd CATAd p53 +
++
0
catalase
p53
�-tubulin
40 80 100 1 10 100 1000
RKOHCT116 U2OS H460RKO + +
+−
−− −
−−
** ** **** ** ** **
**
****
**
** **
**
catalase
p53
� -tubulin
Ad LacZ
Ad p53
control siRNA
− + − −
− − + − + −
− − − + − +
+ − + + − −
RO
S le
vels
(%
)
− + − −
− − + − + −
− − − + − +
+ −
+ + + +
+ + − −
RKOU2OS
0
20
40
60
80
100
120
140
160
0
20
40
60
80
100
120
140
160
RO
S le
vels
(%
)
**n.s.
** ** n.s.
**
Catalase in prooxidant and antioxidant function of p53MY Kang et al
120
Cell Death and Differentiation
influence on catalase activity. We subsequently showed thatwild-type p53R2, but not mutated p53R2 (V115L), increasedcatalase activity and suppressed ROS levels (SupplementaryFigures 8a and b).
We next investigated the effect of p53 knockdown on thep53R2–catalase interaction. Immunoprecipitation analysesrevealed that the binding (Figure 4f) of catalase and p53R2markedly decreased in p53-knockdown cells. Moreover,introducing p53R2 into p53-depleted cells restored catalaseactivity (Figure 4g) and ROS levels significantly decreased(Figure 4h). These results strongly suggest that wild-typep53R2 contributes to maintain increased catalase activityunder unstressed conditions in p53-proficient cells.
Binding patterns of p53 and p53R2 to catalase. Becausecatalase localized mainly to the peroxisome,28 we examinedthe subcellular localization of p53, PIG3, p53R2, andcatalase before and after UV irradiation. In unstressed cells,p53R2 and catalase localized in the peroxisomal fraction;however, p53 and PIG3 was very faint but predominantlyperoxisomal-free supernatant fraction. In UV-stressed cells,the peroxisomal localizations of p53, PIG3, and p53R2 wereincreased (Supplementary Figure 9). Immunofluorescenceanalyses revealed that p53R2 but not p53 was colocalizedwith catalase in unstressed cells (Supplementary Figure 10).In contrast, both p53 and p53R2 colocalized with catalaseafter UV irradiation.
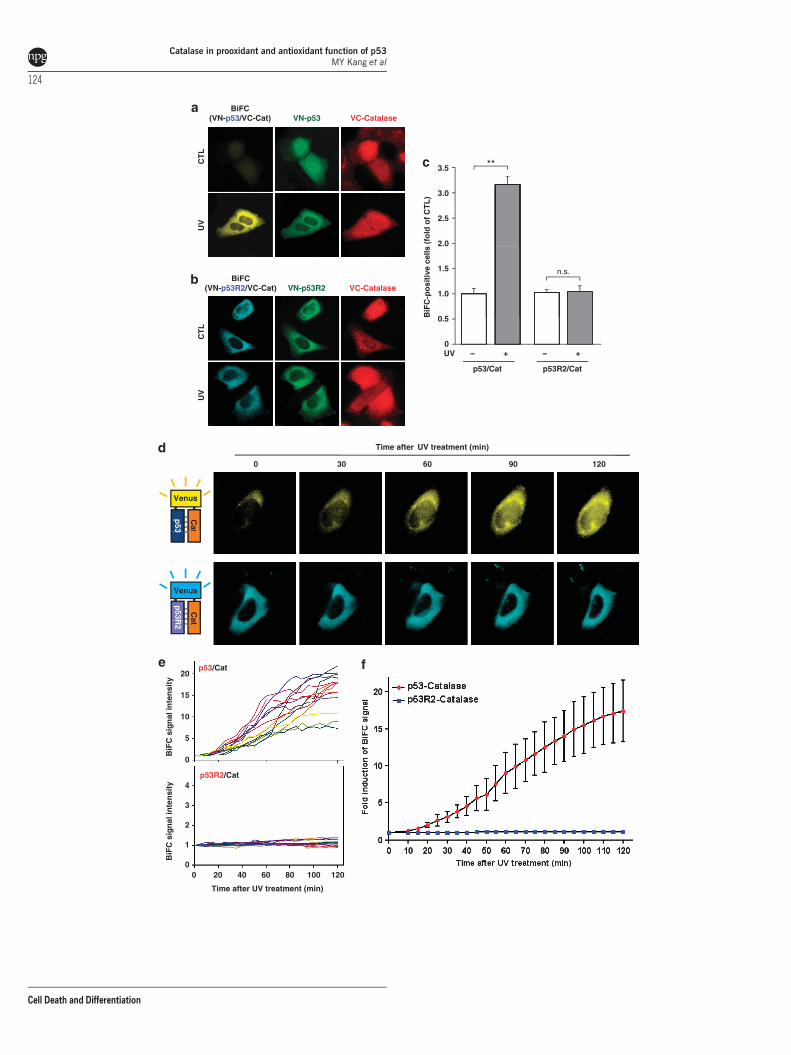
To further investigate the binding patterns of p53 andp53R2 to catalase in vivo, we performed a bimolecularfluorescence complementation (BiFC) assay using the fluor-escent protein Venus, which enables visualization of directprotein interactions in living cells.29,30 To achieve this, weconstructed various plasmids encoding the N-terminal half(VN) or C-terminal half (VC) of Venus fused to the targetproteins. U2OS cells co-transfected with VN-p53 and VC-catalase exhibited only a faint BiFC signal, which markedlyincreased after UV treatment (Figures 5a and c). In contrast,cells co-transfected with VN-p53R2 and VC-catalase pro-duced a strong BiFC signal that was not significantly affectedby UV irradiation (Figures 5b and c). To further dissect thekinetics of the dynamic changes in the binding of p53 andp53R2 to catalase in vivo, we conducted time-lapse BiFCimaging experiments in UV-irradiated living cells. The signalattributable to binding between p53 and catalase increaseddramatically and became saturated about 2 h after UVirradiation, whereas the same experimental paradigm failedto alter the BiFC signal between p53R2 and catalase (Figures5d and e). The mean value of the fluorescence intensity ofcells further confirmed the kinetics of the dynamic changes inthe binding activity between p53 and catalase in response togenotoxic stress (Figure 5f). These results strongly indicate
that p53R2 efficiently interacts with catalase underunstressed conditions in vivo, whereas p53 binds catalaseupon DNA damage.
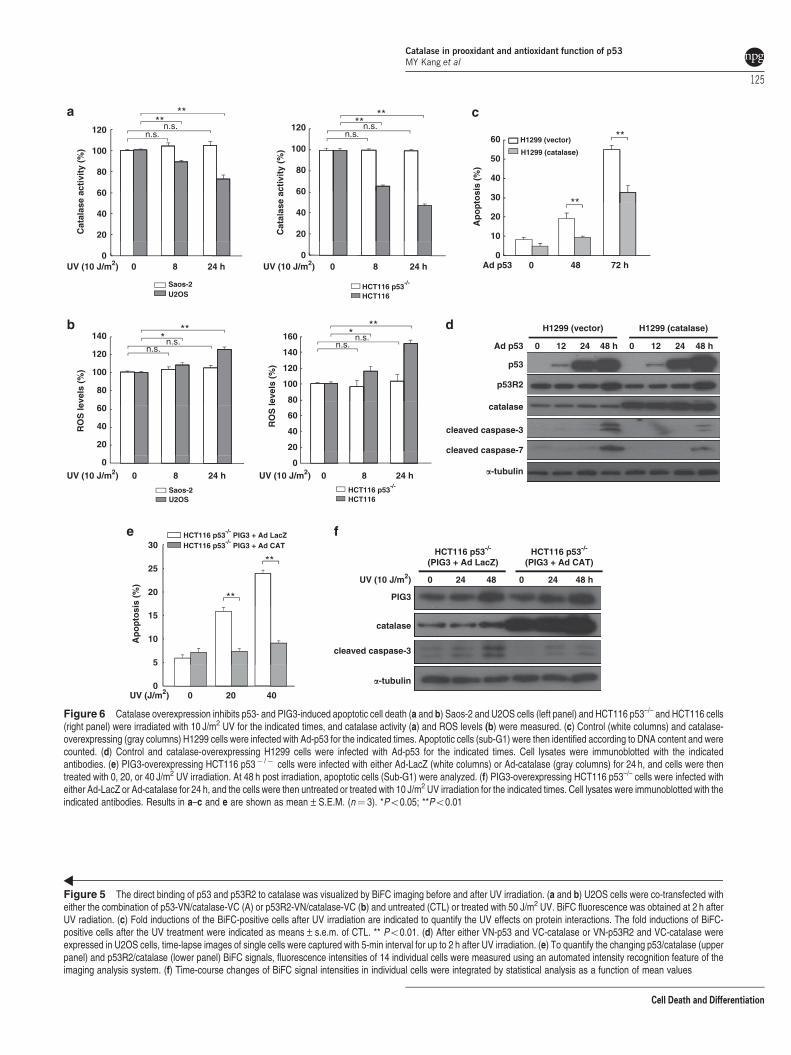
p53 upregulates ROS generation through suppressionof catalase activity in response to DNA damage. We nextexamined whether p53 influences catalase activity inresponse to DNA damage. We found that catalase activitysignificantly decreased in U2OS and HCT116 cells after UVtreatment (Figure 6a) and ROS levels coincidently increasedin these cells (Figure 6b). In contrast, catalase activity andROS levels were only slightly affected in p53-deficient Saos-2 and HCT116 p53–/– cells, indicating that a p53–catalasepathway is important for regulating DNA damage-inducedROS generation. To investigate the role of catalase in p53-induced apoptosis, we examined the effect of catalase onUV-induced apoptosis. We found that catalase overexpres-sion in U2OS cells significantly reduced UV-induced apop-tosis (Supplementary Figures 11a and b). Because p53overexpression in p53-null H1299 cells triggers apoptotic celldeath in these cells,31 H1299 cells stably transfected withcontrol or catalase expression vectors were infected with Ad-p53, and apoptosis was examined. Catalase overexpressioncompletely abolished the p53-induced generation of ROS inH1299 cells (Supplementary Figure 12). Notably, p53-induced apoptotic sub-G1 DNA contents (Figure 6c) andactive caspase-3/7 (Figure 6d) decreased significantly incatalase-overexpressing H1299 cells. Finally, using PIG3-overexpressing p53 null cells, we examined whether catalasesuppresses UV-induced apoptosis. We observed that theintracellular ROS formation was significantly increased in thePIG3-overexpressing HCT116 p53–/– cells by UV irradiation(Supplementary Figure 13). Importantly, PIG3-overexpres-sing cells infected with Ad-catalase underwent less apoptosisthan those infected with the Ad-control vector after UVirradiation (Figures 6e and f). Taken together, these datasuggest that after DNA damage, p53 and PIG3 cooperate totrigger apoptosis by repressing catalase activity.
Discussion
Here, we demonstrate that p53 upregulates intracellular ROSlevels through suppression of catalase activity: first, p53 andcatalase can form a stable complex both in vitro and in vivo.Second, p53 protein is able to inhibit catalase activity in vitro.Third, cells that overexpress p53 exhibit lower catalaseactivity compared with that of control cells, indicating thatp53 downregulates catalase activity in stressed cells, whichhave hyperphysiological levels of p53. Fourth, ectopicexpression of p53 is not able to sufficiently increase ROSlevels in catalase-deficient cells. Finally, PIG3, a key mediator
Figure 2 p53 and PIG3 repress catalase activity. (a and b) The indicated amount of recombinant human p53 (a) and PIG3 (b) protein were incubated with 1.0 U/ml ofrecombinant human catalase, and catalase activity was measured. (c and d) U2OS, RKO, HCT116, and H460 cells were transfected with control vector (white columns) or p53expression vector (gray columns). At 48 h after transfection, catalase activity (c) and ROS levels (d) were measured. Cell lysates were analyzed by immunoblotting, asindicated (bottom). (e) p53 stimulates intracellular ROS generation in catalase-expressing H460 cells. H460 cells were infected with the indicated viral expression vectors for48 h, and then ROS production was assayed. Cell lysates were analyzed by immunoblotting, as indicated (bottom). (f) U2OS and RKO cells were transfected with control orcatalase siRNA and then infected with Ad-LacZ or Ad-p53. At 24 h after infection, ROS generation was measured. Catalase and p53 levels were analyzed by immunoblotting(bottom). Results in a–f are shown as mean±S.E.M. (n¼ 3). **Po0.01
Catalase in prooxidant and antioxidant function of p53MY Kang et al
121
Cell Death and Differentiation
of p53-dependent ROS generation, also associates withcatalase and inhibits catalase activity both in vitro andin vivo. This suggests that after genotoxic stress, high levelsof p53 and PIG3 cooperate in cells to cause a strong inhibitionof catalase activity, resulting in an increase in ROS
generation. Collectively, the inhibition of catalase activitycaused by p53 is probably the main prooxidant function ofp53.
We found that the decreased catalase activity causedby p53 contributed substantially to p53-induced apoptosis.
wt
vect
or
Mr (K)
IB: anti-catalase72 −
p1
p2
p3
p4
p5 Mr (K)
wt
PG
1
PG
2
PG
3
PG
4
PG
5
vect
or
IB: anti-catalase72 −
IB: anti-V5IP
: an
ti-c
atal
ase
72 −−55−34
− IP:
anti
-cat
alas
e
−
−
72
55
43
IB: anti-GFP
72 IB: ant-catalase−
IB: anti-V5
7255
17
−−
72 −IB: anti-catalase
72 −
−
−
catalasewt (1-393)p1 (1-300) pG1 (1-300)
+-
Lys
ates
34
17
−
−
wt (1-332) ++
Lys
ates
55
43 −
IB:anti-GFP
catalase
-
-+
+p2 (1-100)p3 (101-393)p4 (101-300)p5 (301-393)
--+
PG2 (1-250)PG3 (1-200)PG4 (1-160)PG5 (161-332)
+
120 n.s.**
** 120
140
n.s.**
**
60
80
100
60
80
100
Cat
alas
e ac
tivi
ty (
%)
wt P1 P50
20
40
RO
S le
vels
(%
)
0
20
40
vector vector wt P1 P5
120 n.s.**
** n.s.**
250
60
80
100 **
100
150
200
Cat
alas
e ac
tivi
ty (
%)
0
20
40 RO
S le
vels
(%
)
0
50
vector wt PG3 PG5 vector wt PG3 PG5
Figure 3 The C-terminal region of p53 and PIG3 is required for its interaction with catalase and upregulates ROS levels. (a) Plasmids encoding V5-tagged LacZ (vector),full-length p53 (wt) or deletion mutants of p53 were transfected into HEK293T cells. Catalase was immunoprecipitated with anti-catalase antibody, and the immunoprecipitatedproteins were detected with anti-V5 antibody or anti-catalase antibody. (b) Lysates of HEK293T cells expressing the GFP control vector (vector), GFP-tagged full-length PIG3(wt) or PIG3 deletion mutants were subjected to immunoprecipitation with anti-catalase, and the resulting precipitates were subjected to immunoblot analysis with anti-GFP oranti-catalase antibodies. Schematic presentation of the p53 and PIG3 deletion mutants used in the study (a and b, bottom). The catalase binding properties of these p53 andPIG3 constructs are summarized. (c and d) Control plasmid (vector), plasmids encoding full-length p53 (wt) or p53 deletion mutants (P1 and P5) were transfected into H1299cells. After 48 h, catalase activity (c) and ROS levels (d) were measured. (e and f) Control plasmid (vector) or plasmids encoding full-length PIG3 (wt) or PIG3 deletion mutants(PG3 and PG5) were transfected into H1299 cells. After 48 h, catalase activity (e) and ROS levels (f) were measured. Results in c–f are shown as mean±S.E.M. (n¼ 3).**Po0.01
Catalase in prooxidant and antioxidant function of p53MY Kang et al
122
Cell Death and Differentiation
In response to DNA damage, catalase activity was sup-pressed significantly in p53-expressing cells, but not in p53-deficient cells, causing an increase in intracellular ROS
generation that allowed p53-induced apoptosis to occur.Notably, catalase protected p53-induced apoptosis throughsuppression of p53-induced ROS generation and inhibition of
1.6
1.8**
180a
d
e
f
g h
b cControl siRNAp53 siRNA
0.8
1.0
1.2
1.4 ** **
100120140160
** **
*
Cat
alas
e ac
tivi
ty (
U/m
l)
0.2
0.4
0.6
20406080
RO
S le
vels
(%
)
p53
catalase
HCT116U2OS RKO0.0
0U2OS HCT116
�-tubulin
0.6
Input
UV − + − + − +
**
**
0.4
0.3
0.5
IB: p53R2
IB: catalase
**
0.1
0.2
Cat
alas
e ac
tivi
ty (
U/m
l)
0.00
p53R2 (ng)
R1Mr (K)
IB: anti-catalase72 − wt
R2
R3
R4
vect
or
IB: anti-GFP
IP:
anti
-cat
alas
e
72 −−55−43−34
− +p53 siRNA
IB: p53R2
Input
− +
72 IB: anti-catalase−
IB: anti-GFP
72 −−55
IB: catalase
catalasewt (1-351)R1 (1-160)
+–
Lys
ates
−43
−34
–
++
R2 (1-206)R3 (11-351)R4 (316-351)
120
140
160
**
**
120
140
160 ** **
60
80
100
RO
S le
vels
(%
)
60
80
100
Cat
alas
e ac
tivi
ty (
%)
0
20
40
p53 siRNAAd LacZ
−− − +
0
20
40
p53 siRNAAd LacZ
Ad p53R2
+ + +
− − −−+
p53Ad p53R2
�-tubulin
p53R2
catalase
RKO
1010.1
IP: IgGIP: catalase
IP: catalase
−− − +
+ + +
− − −−+
Figure 4 p53R2 interacts with catalase and is required for antioxidant function of p53. (a and b) U2OS, RKO, and HCT116 cells were transfected with control (whitecolumns) or p53 (gray columns) siRNA, and ROS levels (a) and catalase activity (b) were measured 48 h later. Cell lysates were analyzed by immunoblotting, as indicated(bottom). (c) Catalase activity was measured in reactions containing equal amounts of catalase (0.3 U/ml) and various amounts of p53R2 protein. (d) U2OS cells wereuntreated or treated with UV (20 J/m2). At 24 h after irradiation, catalase was immunoprecipitated with anti-catalase antibody, and the immunoprecipitated proteins weredetected with anti-p53R2 or anti-catalase antibodies. (e) Plasmids encoding GFP (vector), GFP-tagged full-length p53R2 (wt) or p53R2 deletion mutants were transfected intoHEK293T cells. Immunoprecipitation and immunoblotting were performed 48 h post transfection, as indicated. Schematic presentation of p53R2 deletion mutants used in thestudy (bottom). The catalase binding properties of these p53R2 constructs are summarized. (f) U2OS cells were transfected with control or p53 siRNA. At 48 h aftertransfection, immunoprecipitation and immunoblotting were performed, as indicated. (g and h) U2OS cells were transfected with control or p53 siRNA and then infected withAd-LacZ or Ad-p53R2. The cells were then analyzed for catalase activity (g) and ROS levels (h). Immunoblots of p53, p53R2, and catalase from transfected cells are shown(bottom). Results in a–c, g and h are shown as mean±S.E.M. (n¼ 3). **Po0.01, *Po0.05
Catalase in prooxidant and antioxidant function of p53MY Kang et al
123
Cell Death and Differentiation
BiFC(VN-p53/VC-Cat) VN-p53 VC-Catalase
**CT
LU
V
BiFC(VN-p53R2/VC-Cat) VN-p53R2 VC-Catalase
n.s.
BiF
C-p
osi
tive
cel
ls (
fold
of
CT
L)
UV
3.5
2.0
2.5
3.0
1.5
1.0
0
0.5
p53/Cat
− + − +
CT
LU
V
Time after UV treatment (min)
Venus
Cat
p53
Venus
20
0
5
10
15
BiF
C s
ign
al in
ten
sity
p53/Cat
p53R2/Cat
1
3
4
2
0
BiF
C s
ign
al in
ten
sity
Time after UV treatment (min)
p53R2/Cat
p53R
2
Cat
0 30 60 90 120
0 6020 40 12080 100
Catalase in prooxidant and antioxidant function of p53MY Kang et al
124
Cell Death and Differentiation
n.s.**n.s.
**
n.s.**n.s.
**
Cat
alas
e ac
tivi
ty (
%)
Cat
alas
e ac
tivi
ty (
%)
Saos-2
120
a
b d
e f
c
80
100
20
40
60
0
HCT116 p53-/-
120
80
100
20
40
60
0UV (10 J/m2)UV (10 J/m2)
U2OS HCT116
n.s.*
**n.s. n.s.
***
n.s.
RO
S le
vels
(%
)
RO
S le
vels
(%
)
UV (10 J/m2)
HCT116 p53-/-
160
100
120
140
20
40
60
80
0
Saos-2U2OS
UV (10 J/m2)
140
80
100
120
20
40
60
0
HCT116
Ad p53
H1299 (vector) H1299 (catalase)
**
catalase
p53
p53R2
**
H1299 (vector)
H1299 (catalase)
�-tubulin
cleaved caspase-3
cleaved caspase-7
Ap
op
tosi
s (%
)
60
30
40
50
0
10
20
Ad p53
PIG3
HCT116 p53-/-
(PIG3 + Ad CAT)
UV (10 J/m2)
HCT116 p53-/-
(PIG3 + Ad LacZ)
HCT116 p53-/-
PIG3 + Ad LacZHCT116 p53
-/- PIG3 + Ad CAT
catalase
�-tubulin
**
**
cleaved caspase-3
0 8 24 h
Ap
op
tosi
s (%
)
UV (J/m2)
20
25
30
10
15
0
5
0 8 24 h
0 8 24 h 0 8 24 h
0 48 72 h
0 20 40
0 12 24 48 h 0 12 24 48 h
0 24 48 0 24 48 h
Figure 6 Catalase overexpression inhibits p53- and PIG3-induced apoptotic cell death (a and b) Saos-2 and U2OS cells (left panel) and HCT116 p53–/– and HCT116 cells(right panel) were irradiated with 10 J/m2 UV for the indicated times, and catalase activity (a) and ROS levels (b) were measured. (c) Control (white columns) and catalase-overexpressing (gray columns) H1299 cells were infected with Ad-p53 for the indicated times. Apoptotic cells (sub-G1) were then identified according to DNA content and werecounted. (d) Control and catalase-overexpressing H1299 cells were infected with Ad-p53 for the indicated times. Cell lysates were immunoblotted with the indicatedantibodies. (e) PIG3-overexpressing HCT116 p53� /� cells were infected with either Ad-LacZ (white columns) or Ad-catalase (gray columns) for 24 h, and cells were thentreated with 0, 20, or 40 J/m2 UV irradiation. At 48 h post irradiation, apoptotic cells (Sub-G1) were analyzed. (f) PIG3-overexpressing HCT116 p53–/– cells were infected witheither Ad-LacZ or Ad-catalase for 24 h, and the cells were then untreated or treated with 10 J/m2 UV irradiation for the indicated times. Cell lysates were immunoblotted with theindicated antibodies. Results in a–c and e are shown as mean±S.E.M. (n¼ 3). *Po0.05; **Po0.01
Figure 5 The direct binding of p53 and p53R2 to catalase was visualized by BiFC imaging before and after UV irradiation. (a and b) U2OS cells were co-transfected witheither the combination of p53-VN/catalase-VC (A) or p53R2-VN/catalase-VC (b) and untreated (CTL) or treated with 50 J/m2 UV. BiFC fluorescence was obtained at 2 h afterUV radiation. (c) Fold inductions of the BiFC-positive cells after UV irradiation are indicated to quantify the UV effects on protein interactions. The fold inductions of BiFC-positive cells after the UV treatment were indicated as means±s.e.m. of CTL. ** Po0.01. (d) After either VN-p53 and VC-catalase or VN-p53R2 and VC-catalase wereexpressed in U2OS cells, time-lapse images of single cells were captured with 5-min interval for up to 2 h after UV irradiation. (e) To quantify the changing p53/catalase (upperpanel) and p53R2/catalase (lower panel) BiFC signals, fluorescence intensities of 14 individual cells were measured using an automated intensity recognition feature of theimaging analysis system. (f) Time-course changes of BiFC signal intensities in individual cells were integrated by statistical analysis as a function of mean values
Catalase in prooxidant and antioxidant function of p53MY Kang et al
125
Cell Death and Differentiation
PIG3-dependent apoptosis after UV irradiation. Thus, afterDNA damage, p53-dependent suppression of catalaseactivity can regulate overall cellular ROS levels, leading toapoptosis induction. This regulation is biologically importantbecause the magnitude and duration of p53 activity is a criticaldeterminant of cell fate via regulation of ROS levels, whichhave a significant impact on cell growth, survival, andtumorigenesis.33
Another important finding is that the antioxidant function ofp53 is derived from the p53R2-catalase pathway, whichmaintains low ROS levels under physiological conditions. Atphysiological levels, p53 has a subtle but vital function inmaintaining ROS at nontoxic levels through transactivation ofa series of genes, including glutathione peroxidase (GPX1),sestrin family members SESN1 and SESN2,14 aldehydedehydrogenase (ALDH4A1),34 TP53-induced glycolysis andapoptosis regulator (TIGAR),17 TP53-induced nuclearprotein 1 (TP53INP1),20 and mitochondrial SOD2 (MnSOD)expression.35 p53 can also repress the expression ofMnSOD35 and Nrf236 and subsequently modulate ROS levels.We found that p53 knockdown increased ROS levels in U2OSand RKO cells, whereas p53 knockdown decreased ROSgeneration in HCT116 cells. However, the expressionpatterns of p53-dependent antioxidant genes were similaramong p53-depeleted U2OS, RKO, and HCT116 cells,implying that these antioxidant genes might not be contribut-ing to p53’s role in regulating ROS levels under no stress orlow stress. Importantly, our finding of an inverse correlationbetween catalase activity and ROS levels in p53-deficientU2OS, RKO, and HCT116 cells raised the possibility that aphysiological level of p53 might modulate ROS generationthrough the regulation of catalase activity. However, becauseour results showed that hyperphysiological levels of p53suppressed catalase activity, we enquired why p53 knock-down paradoxically suppressed catalase activity in U2OS andRKO cells. p53 deficiency led to a decrease in levels ofcatalase in rat retina cells,23 whereas p53 did not affect theexpression of catalase in human cells.15 Our observationsthat both p53 overexpression and p53 knockdown did notaffect catalase expression indicate that the different catalaseactivities among the p53-deficient HCT116, U2OS, and RKOcells are independent of catalase transcription.
We elucidated the mechanism by which p53-knockdownregulates catalase activity and identified an important role forp53R2, a p53-downstream target, in upregulating catalaseactivity in unstressed p53-proficient cells. Physiological levelsof p53 powerfully negatively regulated intracellular ROS levelsvia this regulation. Previous reports showed that p53R2possesses catalase activity.26 p53R2, however, exerts itscatalase activity through p53R2/catalase protein–proteininteractions because p53R2 directly interacts with catalase,leading to an increase in catalase activity in vitro. Expressionof a deletion mutant of p53R2 (R2), which does not interactwith catalase, had no effect on either catalase activity or ROSlevels. p53R2 has been reported to be induced by genotoxicstress in a p53-dependent manner.24,37 Our observation thatthe basal expression of p53R2 in p53-proficient cells issignificantly higher than in p53-deficient cells, and that thedepletion of endogenous p53 leads to a significant decrease inp53R2 expression, indicates that physiological levels of p53
are sufficient for upregulation of p53R2 in unstressed cells. Innormal and unstressed conditions, the subcellular localizationof p53 is mainly nuclear,38 and both p53R2 and catalase arepresent in the cytosol. Thus, basal levels of p53 mayupregulate catalase activity through p53R2. Indeed, we foundthat knockdown of endogenous p53 in unstressed cellsresulted in a significant decrease in catalase activity, whichwas associated with decreased binding of p53R2 to catalase.p53R2 expression restored catalase activity in p53 knock-down cells, and consequently, ROS levels were reduced tobasal levels. These observations imply that the increasedcatalase activity induced by p53R2 is probably the mainantioxidant function of p53. Our data also established thatmutated p53R2 (V115L) was not sufficient to increasecatalase activity; ectopic expression of wild-type p53R2, butnot mutant p53R2, resulted in increased catalase activity anddecreased ROS levels in U2OS, RKO, and HCT116 cells.Because HCT116 cells contain mutated p53R2 (V115L),27
p53R2 downregulation did not affect catalase activity in thesecells. These results explain why p53 knockdown led toincreased catalase activity in HCT116 cells, in contrast toU2OS and RKO cells.
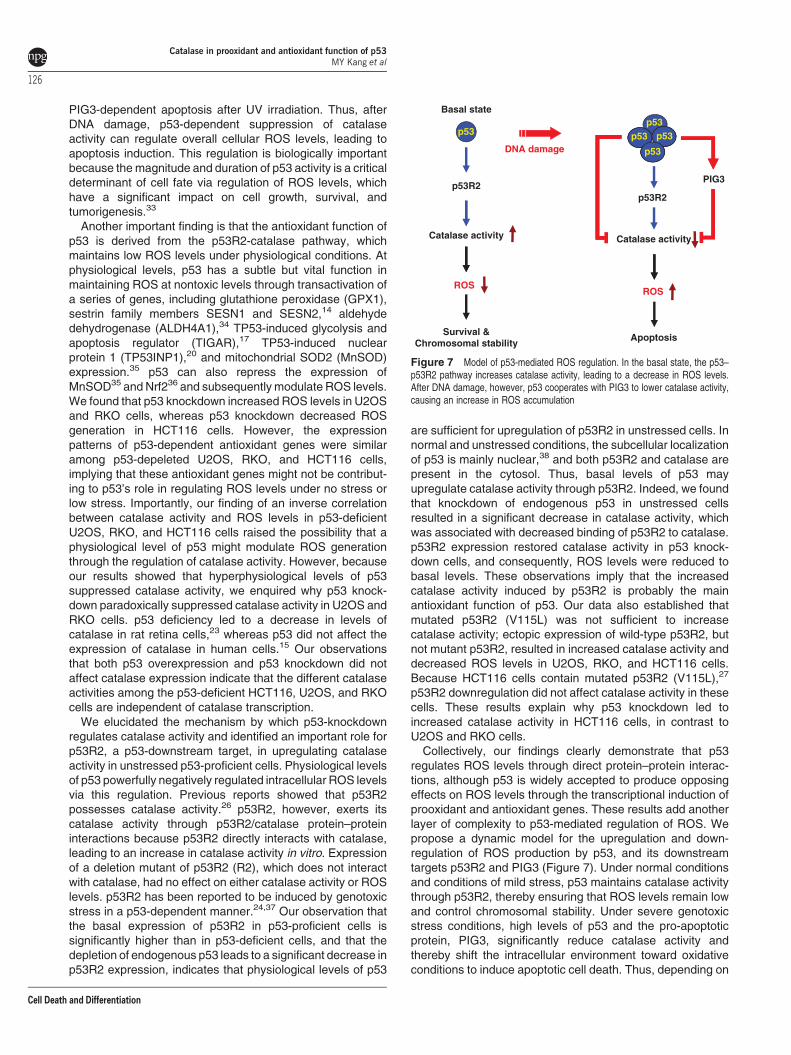
Collectively, our findings clearly demonstrate that p53regulates ROS levels through direct protein–protein interac-tions, although p53 is widely accepted to produce opposingeffects on ROS levels through the transcriptional induction ofprooxidant and antioxidant genes. These results add anotherlayer of complexity to p53-mediated regulation of ROS. Wepropose a dynamic model for the upregulation and down-regulation of ROS production by p53, and its downstreamtargets p53R2 and PIG3 (Figure 7). Under normal conditionsand conditions of mild stress, p53 maintains catalase activitythrough p53R2, thereby ensuring that ROS levels remain lowand control chromosomal stability. Under severe genotoxicstress conditions, high levels of p53 and the pro-apoptoticprotein, PIG3, significantly reduce catalase activity andthereby shift the intracellular environment toward oxidativeconditions to induce apoptotic cell death. Thus, depending on
Basal state
p53p53
p53R2
DNA damage p53
p53p53
p53R2
PIG3
Catalase activity Catalase activity
ROSROS
Survival &Chromosomal stability
Apoptosis
Figure 7 Model of p53-mediated ROS regulation. In the basal state, the p53–p53R2 pathway increases catalase activity, leading to a decrease in ROS levels.After DNA damage, however, p53 cooperates with PIG3 to lower catalase activity,causing an increase in ROS accumulation
Catalase in prooxidant and antioxidant function of p53MY Kang et al
126
Cell Death and Differentiation
the transcriptional activation of specific downstream targetgenes and the specific interacting partners, p53 has eitherprooxidant or antioxidant functions. Given the complexinteractions among p53, ROS, and cancer,1,39,40 our findingsshould have a major impact on clarifying the molecularpathways that regulate chromosome stability and cancerprogression.
Materials and MethodsMaterials. Reagents were obtained from the following sources: antibodies tocatalase, p53, p53-HRP, PIG3, and p53R2, from Santa Cruz (Santa Cruz, CA,USA); anti-cleaved caspase-3 and anti-cleaved caspase-7, from Cell Signaling;(Beverly, MA, USA) antibody to the V5 tag, from Invitrogen (Carlsbad, CA, USA);antibody to a-tubulin, from NeoMarker (Rocklin, CA, USA); anti-rabbit IgG, andanti-goat IgG, from R&D Systems (Minneapolis, MN, USA); anti-mouse IgG, fromUpstate (Lake Placid, NY, USA); peroxidase-conjugated anti-goat, anti-rabbit, andanti-mouse secondary antibodies, from Jackson ImmunoResearch Laboratories(West Grove, PA, USA); anti-PMP70, hydrogen peroxide, poly-L-lysine, neomycin,and propidium iodide, from Sigma-Aldrich (St. Louis, MO, USA); protease inhibitorcocktail, from Roche (Mannheim, Germany); Amplex Red catalase assay kit and5-(and-6)-chloromethyl-20,70-dichlorodihydrofluoescein diacetate, acetyl ester (CM-H2DCFDA), from Molecular Probes (Carlsbad, CA, USA); protein G-Sepharosebeads, from GE Healthcare (Milwaukee, WI, USA); IMDM (Iscove’s modifiedDulbecco’s medium), EMEM (Eagle’s minimum essential medium), RPMI 1640medium, McCoy’s 5A medium, penicillin-streptomycin (PS), and trypsin, fromGibco-BRL (Gaithersburg, MD, USA); and fetal bovine serum (FBS), fromCambrex (East Rutherford, NJ, USA).
Cell culture. The human colon carcinoma cell lines HCT116 and HCT116p53� /� were cultured in IMDM with 10% FBS and 1% PS. The human coloncarcinoma cell line RKO was grown in EMEM with 10% FBS and 1% PS. Thehuman osteosarcoma cell lines U2OS and Saos-2 were cultured in McCoy’s 5Amedium with 15% FBS and 1% PS. The human lung carcinoma cell lines, NCIH460 and NCI H1299, and colon carcinoma cell line, SW480, were maintained inRPMI 1640 medium with 10% FBS and 1% PS. The human embryonic kidney cellline HEK293T was grown in DMEM with 10% FBS and 1% PS. The HCT116p53� /� cell line was a gift from Dr. Bert Vogelstein (Johns Hopkins UniversitySchool of Medicine, Baltimore, MD, USA), and the HEK293T cell line was obtainedfrom the Cornell Institute for Medical Research. All other cell lines were obtainedfrom the American Type Culture Collection (Rockville, MD, USA).
Immunoprecipitation assay and western blot analysis. Cells wererinsed once with ice-cold PBS and lysed in ice-cold NP-40 lysis buffer (50 mM Tris-HCl (pH 8.0), 150 mM NaCl, and 1% Nonidet P-40) with one tablet of EDTA-freeprotease inhibitor cocktail (Roche). The soluble fraction of the cell lysates wasisolated by centrifugation at 13 000� g for 20 min in a microfuge. Supernatantswere measured for protein concentration using a detergent-compatible proteinassay (Bio-Rad, Hercules, CA, USA), and equal amounts of proteins wereseparated by 6–15% SDS-PAGE, followed by electrotransfer onto a polyvinylidenedifluoride membrane (Millipore, Bedford, MA, USA). The membranes were blockedfor 2 h with TBS-t (10 mM Tris-HCl (pH 7.4), 150 mM NaCl, and 0.1% Tween-20)containing 5% non-fat milk at room temperature and then incubated with primaryantibodies overnight at 41C. The blots were washed four times for 15 min withTBS-t containing 0.1% Tween 20 and then incubated for 2 h with peroxidase-conjugated secondary antibodies (1:4000) at room temperature. The membraneswere washed four more times and developed using an enhanced chemilumines-cence detection system (iNtRON Biotech, Gyeonggi-do, Korea). For theimmunoprecipitation assay, lysates were precleared with protein G-Sepharosebeads before adding the primary antibody for 15 min. After removing proteinG-Sepharose by centrifugation, supernant was transferred and incubated withprimary antibodies for 16 h at 41C. Twenty microliter of 50% slurry of proteinG-Sepharose beads were added, and the incubation was continued for anadditional 1 h. The immunoprecipitates were washed three times with modifiedRIPA buffer (25 mM Tris (pH 7.2), 150 mM NaCl, 5 mM MgCl2, 0.5% NP-40, 1 mMDTT, and 5% glycerol). Immunoprecipitated proteins were denatured in SDSsample buffer, boiled for 5 min, and analyzed by western blotting using theappropriate antibodies.
For the in vitro protein binding assay, purified recombinant catalase wasincubated with p53 or PIG3 in NP-40 lysis buffer overnight at 41C. After incubationwith antibody to p53 or PIG3 overnight at 41C, protein G-Sepharose beads werethen added. The beads were washed, and the bound immunocomplexes wereanalyzed by western blotting with anti-catalase antibody.
Expression and purification of recombinant proteins. The p53R2and PIG3 cDNAs were cloned into the His-pET vector via BamHI and XhoI sites.Recombinant 6His-tagged p53R2 and PIG3 protein was expressed in Escherichiacoli BL21 (DE3) cells after induction with 1 mM IPTG for 6 h in LB-medium at371C. The bacterial cells were collected by centrifugation, resuspended in lysisbuffer (20 mM Tris-HCl (pH 7.9), 500 mM NaCl, 5 mM imidazole, 1 mM NaF, and1 mM PMSF), sonicated, and then centrifuged at 12 000� g at 41C for 30 min Therecombinant proteins were purified with a Ni–NTA affinity column (Qiagen,Chatsworth, CA, USA), according to the manufacturer’s instructions. Recombinantpurified p53 protein was obtained from Calbiochem and recombinant purifiedcatalase was purchased from Sigma (St. Louis, MO, USA).
Semiquantitative RT-PCR analysis. RNA extraction was carried outusing TRIzol (Invitrogen), according to the manufacturer’s instructions. Reversetranscription was performed using a M-MLV RT (Invitrogen). The following primerswere synthesized and used for PCR: p53 sense 50-ATGGAGGAGCCGCAGTCAGATC-30 and antisense 50-TCAGTCTGAGTCAGGCCCTTCT-30; p53R2 sense 50-ATGGGCGACCCGGAAAGGCCG-30 and antisense 50-TTAAAAATCTGCATCCAAGGTGAA-30; catalase sense 50-ATGGCTGACAGCCGGGATCCC-30 and antisense50-TCACAGATTTGCCTTCTCCCTTG-30; SESN1 sense 50-CGACCAGGACGAG-GAACTT-30 and antisense 50-CCAATGTAGTGACGATAATGTAGG-30; SESN2sense 50-ATGATCGTGGCGGACTCCGAG-30 and antisense 50-TCAGGTCATGTAGCGGGTGATG-30; GPX1 sense 50-ATGAACGAGCTGCAGCGGCGC-30 and anti-sense 50-CTAGGCACAGCTGGGCCCTTG-30; ALDH4A1 sense 50-ATGCTGCTGCCGGCGCCCGC-30 and antisense 50-TCACTGCATGTACGCGTAGCTC-30; SOD2sense 50-ATGTTGAGCCGGGCAGTGTGC-30 and antisense 50-TTACTTTTTGCAAGCCATGTATCT-30; TIGAR sense 50-ATGGCTCGCTTCGCTCTGACTG-30 andantisense 50-TTAGCGAGTTTCAGTCAGTCCAT-30; Nrf-2 sense 50-ATGATGGACTTGGAGCTGCCGC-30 and antisense 50-CTAGTTTTTCTTAACATCTGGCTT-30;TP53INP1 sense 50-ATGTTCCAGAGGCTGAATAAAATG-30 and antisense 50-TTAGTAATTGTACTGACGCGGGC-30; GAPDH sense 50-TGACCACAGTCCATGCCATC-30 and antisense 50-TTACTCCTTGGAGGCCATGT-30.
Plasmid constructs and clones. The cDNA for human wild-type p53 wasamplified from GM00637 human fibroblast cells by RT-PCR using the p53 primers50-ATGGAGGAGCCGCAGTCAGATCCT-30 (sense) and 50-GTCTGAGTCAGGCCCTTCTGTC-30 (antisense). The amplified p53 cDNA construct was cloned into themammalian expression vector pcDNA3.1/V5-His TOPO (Invitrogen) and confirmedby DNA sequencing. The various truncated p53 cDNA fragments (coding foramino acids 1–300, 1–100, 101–393, 101–300, and 301–393) were PCR-amplifiedusing NOVA-Taq polymerase (Genenmed Inc, Seoul, Korea), and the resultingPCR products were cloned into pcDNA3.1/V5-His TOPO.
The cDNA for human p53R2 and PIG3 was amplified from GM00637 humanfibroblast cells by RT-PCR using the p53R2 primers, 50-GAATTCATGGGCGACCCGGAAAGGC-30 (sense) and 50-AAAATCTGCATCCAAGGTGAA-30 (anti-sense); and PIG3 primers, 50-GGTACCATGTTAGCCGTGCACTTTGA-30 (sense)and 50-GAATTCTCACTGGGGCAGTTCCAGG-30 (antisense); respectively. Theamplified p53R2 and PIG3 cDNA constructs were cloned into the mammalianexpression vector pcDNA3.1/V5-His TOPO (Invitrogen) and confirmed by DNAsequencing. The full-length p53R2 cDNA and various truncated p53R2 cDNAfragments (coding for amino acids 1–351, 1–160, 1–206, 11–351, and 316–351)were PCR-amplified using NOVA-Taq polymerase (Genenmed Inc), and theresulting PCR products were cloned into the Gateway Entry vector pENTR/D-TOPO(Invitrogen). The full-length PIG3 cDNA and various truncated PIG3cDNA fragments (coding for amino acids 1–332, 1–300, 1–250, 1–200, 1–160and 161–332) were constructed using same procedure. The constructs werechecked for integrity by sequencing and then used for transfer of the inserts intoplasmid pcDNA-DEST47 (C-terminal GFP tag) (Invitrogen) by Gateway LRreactions.
The cDNA for human wild-type catalase was amplified from GM00637 humanfibroblast cells by RT-PCR using the catalase primers 50-ATGGCTGACAGCCGGGATCCC-30 (sense) and 50-CAGATTTGCCTTCTCCCTTGCC-30 (antisense). Theamplified catalase cDNA construct was cloned into the mammalian expression
Catalase in prooxidant and antioxidant function of p53MY Kang et al
127
Cell Death and Differentiation
vector pcDNA3.1/V5-His TOPO (Invitrogen) and confirmed by DNA sequencing. Forstable transfection, the catalase expression vector and control vector weretransfected into NCI H1299 cells using Lipofectamine 2000 (Invitrogen), accordingto the manufacturer’s instructions. After transfection, the cells were incubated for 5weeks in complete medium containing 400mg/ml neomycin, and the clonesresistant to neomycin were isolated and analyzed.
Expression of p53, p53R2, and catalase by the adenovirussystem. The full-length cDNAs for p53, p53R2, and catalase were cloned intopENTR/D-TOPO vector using a pENTR Directional TOPO cloning kit (Invitrogen).After purification of the plasmids from the transformed DH5a competent cells, thecDNA inserts were transferred to pAd/CMV/V5-DEST vector (Invitrogen) by meansof a Gateway system using LR clonase (Invitrogen). The plasmids were purifiedand digested with PacI (New England Biolabs, Ipswich, MA, USA). The linearizedplasmids (1mg) were then mixed with 3ml of Lipofectamine 2000 (Invitrogen) in200ml Opti-MEM medium (Invitrogen) and transfected into subconfluent HEK293Tcells in 1 ml of Opti-MEM in six-well plates (Iwaki Glass). The HEK293T cells werecultured for 1–2 weeks in DMEM medium containing 10% FBS and 1% PS, withreplacement of the medium every 2–3 days. When most of the cells had becomedetached from the plates, the cells and culture medium were harvested together,freeze-thawed twice, and centrifuged to obtain the adenovirus-enriched super-natants. Aliquots of the supernatants were added to fresh HEK293T cells andcultured for 1 week to amplify the adenoviruses. After two to four amplifications,the resulting adenovirus-containing media were used as virus stocks. Viral titerswere determined by the plaque-forming assay with HEK293T cells. As a control,pAd/CMV/V5-GW/lacZ vector (Invitrogen) was digested with PacI and transfectedinto HEK293T cells, to produce lacZ-bearing adenovirus. Aliquots of theadenovirus-containing media were added to cells and cultured for the appropriateperiods for subsequent analyses.
Small-interference RNA knockdown of p53, p53R2, and cata-lase. Using the small-interference RNA (siRNA) Target Finder Program (Ambion,Austin, TX, USA), siRNA sequences targeting human p53, p53R2, and catalasewere designed. The sequences of the 21-bp siRNA duplexes were: p53, 50-UUACACAUGUAGUUGUAGUGGAUGG-30 (sense strand); p53R2, 50-UGAGUUUGUAGCUGACAGAUU-30 (sense strand); and catalase, 50-UGGAUAUGGAUCACAUACU-30 (sense strand). Control siRNA was purchased from Bioneer (Daejeon,Korea). Cells were transiently transfected with siRNA duplexes usingLipofectamine RNAiMAX (Invitrogen).
Measurement of intracellular ROS levels. Intracellular ROS productionwas assayed using the fluorochrome marker 5-(and-6)-chloromethyl-20,70-diclorodihydrofluoescein diacetate, acetyl ester (CM-H2DCFDA) probe(Invitrogen, Molecular Probes). A fresh stock solution of CM-H2DCFDA wasprepared in DMSO and diluted to a final concentration of 5 mM in 1�PBS. Cellswere washed with 1� PBS, followed by incubation with CM-H2DCFDA workingsolution for 30 min in the dark at 371C. The cells were washed twice andresuspended in PBS, and the increase in fluorescence was detected by flowcytometry (FACSCalibur, BD Biosciences, San Diego, CA, USA). We analyzed thedata with CellQuest software and used the mean fluorescence intensity to quantifyresponses. The mean fluorescence of 30 000 analyzed cells (corrected forautofluorescence) of each treatment group was taken as a measure of the totalROS load.
Assay for catalase activity. Cells were sonicated in 0.1 M Tris-HCl (pH7.5) for two 30-s bursts. After centrifugation at 12 000� g for 20 min, thesupernatants were measured for protein concentration using a detergent-compatible protein assay (Bio-Rad), and catalase activity was measured with anAmplex Red catalase assay kit, according to the manufacturer’s protocol(Molecular Probes). After incubating the samples with 40 mM H2O2 for 30 min, theremaining H2O2 was measured to determine the catalase activity. Amplex Red andhorseradish peroxidase react with H2O2 to produce resorufin, a fluorescentcompound detectable by spectrophotometry. Standard curves for the enzymaticactivity of catalase were determined using purified catalase. Enzyme-specificactivity was expressed as units/ml of protein, where one unit of catalase activitywas defined as 1mmol H2O2 consumed per min.
Apoptosis assay. Floating and trypsin-detached cells were collected andwashed once with ice-cold PBS, followed by fixing in 70% cold ethanol for 30 min
at 41C. The cells were then washed with ice-cold PBS, resuspended in PBScontaining propidium iodide (50 mg/ml), RNase A (100mg/ml), and 0.1% TritonX-100, and left for 30 min at room temperature. To analyze apoptosis, hypodiploidDNA (sub-G1) populations were assayed using a FACSCalibur flow cytometer withCellQuest software (Becton Dickinson, Franklin Lakes, NJ, USA). The resultsrepresent the means of triplicate determinations in which a minimum of 10 000cells was assayed for each determination. Any sub-G1 populations were countedas apoptotic cells.
Preparation of peroxisomal-free and peroxisomal fraction. Peroxi-somal-free and peroxisomal fraction were isolated by using Peroxisome Isolation Kit(PEROX1, Sigma), according to the instructions of the manufacturer. Briefly, U2OScells were treated with or without 10 J/m2 UV irradiation. At 24 h after UV treatment,cells were harvested and added in peroxisome extraction buffer, and then transfercell suspension to in a Dounce homogenizer tube and carefully homogenized for 25strokes using pestle B on ice. Centrifuge tube at 1000� g for 10 min at 41C. Transferthe supernatant and centrifuge at 2000� g for 10 min at 41C. Transfer thesupernatant to a new centrifuge tube and centrifuge at 25 000� g for 20 min Transferthe supernatant liquid (peroxisomal-free fraction) to a new tube and collect the pellet(peroxisomal fraction) in a peroxisome extraction buffer.
Immunofluorescence microscopy. U2OS cells were cultured on coverslips coated with poly-L-lysine (Sigma) and were treated with or without 10 J/m2
UV irradiation. At 24 h after UV treatment, cells were then washed twice with PBS,fixed in 4% paraformaldehyde for 10 min, followed by permeabilization with 0.3%Triton X-100 for 15 min at room temperature. Next, the cover slips were washedthree times with PBS and then blocked with 0.1% BSA in PBS for 1 h at roomtemperature. The cells were double-immunostained with primary antibodiesagainst various proteins overnight at 41C, after which the cells were washed withPBS and stained with Alexa Fluor 488- (green fluorescence; Molecular Probes) orAlexa Fluor 594- (red fluorescence; Molecular Probes) conjugated secondaryantibodies, as appropriate. After washing, the cells were mounted usingVectashield mounting medium with 4,6-diamidino-2-phenylindole (Vector Labora-tories, Burlingame, CA, USA). Fluorescence images were taken using a confocalmicroscope (Zeiss LSM 510 Meta; Carl Zeiss, Jena, Germany) and Zeiss LSMImage Examiner software (Carl Zeiss).
BiFC analyses. The BiFC assay is based on the complementation of two non-fluorescent receptor molecule fragments that generate a fluorescence signal onlywhen they directly interact in vivo. By fusing cDNAs encoding residues 1–172(VN173) of Venus to sequences encoding p53 or p53R2, and the C-terminus ofVenus (residues 155–238) (VC155) to a sequence-encoding catalase, wegenerated three different plasmids: p53-VN, p53R2-VN, and catalase-VC. pHA-VC155 were kindly provided by Chang-Deng Hu (Purdue University School ofPharmacy, West Lafayette, IN, USA).41 U2OS cells were cultivated in 35-mmculture dishes overnight and then cotransfected with the expression vectors(200 ng each) using a Microporator Neon (Invitrogen). At 24 h post transfection,the cells were exposed to UV radiation (50 J/m2). Samples were examined under afluorescence microscope, and the images were captured using a YFP filter set(excitation, 500 nm; dichromic beam splitter, 515 nm; emission, 535 nm). Cellsproducing fluorescent signals after UV irradiation (BiFC signal-positive cells) werecounted. For immunofluorescence analyses, cells were fixed with 3.75%paraformaldehyde in PBS and incubated with anti-GFP N-terminus and anti-GFP C-terminus antibodies. The cells were visualized with secondary antibodiesconjugated to Alexa Fluor 350 (Invitrogen) or TRITC (Jackson ImmunoResearchLaboratories).
Time-lapse imaging analyses. Cells were transferred to a live cellchamber (Live Cell Instrument, Seoul, South Korea) in growth medium containing10% FBS and cotransfected with the BiFC expression vectors (300 ng each) usinga Microporator Neon (Invitrogen). For the UV radiation experiments, transfectedcells were incubated in a humidified chamber at 371C and ambient CO2 levels for12 h, and then exposed to UV radiation (50 J/m2). Images were collected at 371Cusing an Olympus IX-81 microscope. At each time point, a fluorescence imagewas taken using a YFP filter set. To quantify changes in the BiFC signals, thefluorescence intensities of 15 individual fluorescent cells were measured using anautomated intensity recognition feature of the MetaMorph Imaging System(Universal Imaging Corporation, Downingtown, PA, USA).
Catalase in prooxidant and antioxidant function of p53MY Kang et al
128
Cell Death and Differentiation

Yeast two-hybrid analysis. A yeast two-hybrid screen was performedusing a Matchmaker GAL4 Two-Hybrid System 3 (Clontech, Mountain View, CA),following the manufacturer’s directions. Saccharomyces cerevisiae strain AH109,containing distinct ADE2, HIS3, lacZ, and MEL1 reporter constructs, was used forthe assay. The AH109 strain was transformed with the bait plasmid pGBT9,encoding an in-frame fusion of the GAL4 DNA-binding domain with full-length p53and PIG3. Transformants were plated onto selective SD medium lacking Trp andincubated for 3–5 days at 301C. Yeast strains containing the bait plasmid weretransformed with a prostate cDNA library fused to the GAL4 activation domain inpACT2 vector. Diploids were plated on SD-Leu/-Trp/-His medium, and growingcolonies, indicative of a potentially positive interaction between the bait (p53 orPIG3) and prey (library protein), were re-streaked on SD-Leu/-Trp/-His/-Adeplates. Finally, positive clones were replica-plated on maximally selective SD-Leu/-Trp/-His/-Ade/X-a-gal medium to ensure that the colonies contained the correctphenotype. Plasmid DNA was isolated from positive clones and sequenced toidentify the genes encoding the interacting proteins. The sequences wereanalyzed using the BLAST program available from NCBI.
Statistical analysis. The statistical significance of the difference betweenmean values was tested using Student’s t-test (**Po0.01; *Po0.05). Data aremeans±S.E.M.
Conflict of InterestThe authors declare no conflict of interest.
Acknowledgements. This research was supported by the Ministry ofEducation, Science and Technology funded by the Korea Government (2012–0001122).
1. Liu B, Chen Y, St Clair DK. ROS and p53: a versatile partnership. Free Radic Biol Med2008; 44: 1529–1535.
2. Valko M, Rhodes CJ, Moncol J, Izakovic M, Mazur M. Free radicals, metals andantioxidants in oxidative stress-induced cancer. Chem Biol Interact 2006; 160: 1–40.
3. Valko M, Leibfritz D, Moncol J, Cronin MT, Mazur M, Telser J. Free radicals andantioxidants in normal physiological functions and human disease. Int J Biochem Cell Biol2007; 39: 44–84.
4. Terada LS. Specificity in reactive oxidant signaling: think globally, act locally. J Cell Biol2006; 174: 615–623.
5. Giorgio M, Trinei M, Migliaccio E, Pelicci PG. Hydrogen peroxide: a metabolic by-product ora common mediator of ageing signals? Nat Rev Mol Cell Biol 2007; 8: 722–728.
6. Liu G, Chen X. The ferredoxin reductase gene is regulated by the p53 family and sensitizescells to oxidative stress-induced apoptosis. Oncogene 2002; 21: 7195–7204.
7. Macip S, Igarashi M, Berggren P, Yu J, Lee SW, Aaronson SA. Influence of induced reactiveoxygen species in p53-mediated cell fate decisions. Mol Cell Biol 2003; 23: 8576–8585.
8. Polyak K, Xia Y, Zweier JL, Kinzler KW, Vogelstein B. A model for p53-induced apoptosis.Nature 1997; 389: 300–305.
9. Johnson TM, Yu ZX, Ferrans VJ, Lowenstein RA, Finkel T. Reactive oxygen species aredownstream mediators of p53-dependent apoptosis. Proc Natl Acad Sci USA 1996; 93:11848–11852.
10. Donald SP, Sun XY, Hu CA, Yu J, Mei JM, Valle D et al. Proline oxidase, encoded by p53-induced gene-6, catalyzes the generation of proline-dependent reactive oxygen species.Cancer Res 2001; 61: 1810–1815.
11. Schmitt CA, Fridman JS, Yang M, Baranov E, Hoffman RM, Lowe SW. Dissecting p53tumor suppressor functions in vivo. Cancer Cell 2002; 1: 289–298.
12. Vousden KH, Prives C. Blinded by the Light: The Growing Complexity of p53. Cell 2009;137: 413–431.
13. Matoba S, Kang JG, Patino WD, Wragg A, Boehm M, Gavrilova O et al. p53 regulatesmitochondrial respiration. Science 2006; 312: 1650–1653.
14. Sablina AA, Budanov AV, Ilyinskaya GV, Agapova LS, Kravchenko JE, Chumakov PM.The antioxidant function of the p53 tumor suppressor. Nat Med 2005; 11: 1306–1313.
15. Hussain SP, Amstad P, He P, Robles A, Lupold S, Kaneko I et al. p53-inducedup-regulation of MnSOD and GPx but not catalase increases oxidative stress andapoptosis. Cancer Res 2004; 64: 2350–2356.
16. Meiller A, Alvarez S, Drane P, Lallemand C, Blanchard B, Tovey M et al. p53-dependentstimulation of redox-related genes in the lymphoid organs of gamma-irradiated–mice
identification of Haeme-oxygenase 1 as a direct p53 target gene. Nucleic Acids Res 2007;
35: 6924–6934.17. Bensaad K, Tsuruta A, Selak MA, Vidal MN, Nakano K, Bartrons R et al. TIGAR,
a p53-inducible regulator of glycolysis and apoptosis. Cell 2006; 126: 107–120.18. Budanov AV, Sablina AA, Feinstein E, Koonin EV, Chumakov PM. Regeneration of
peroxiredoxins by p53-regulated sestrins, homologs of bacterial AhpD. Science 2004; 304:
596–600.19. Chen W, Sun Z, Wang XJ, Jiang T, Huang Z, Fang D et al. Direct interaction between Nrf2
and p21(Cip1/WAF1) upregulates the Nrf2-mediated antioxidant response. Mol Cell 2009;
34: 663–673.20. Cano CE, Gommeaux J, Pietri S, Culcasi M, Garcia S, Seux M et al. Tumor protein
53-induced nuclear protein 1 is a major mediator of p53 antioxidant function. Cancer Res
2009; 69: 219–226.21. Hu W, Zhang C, Wu R, Sun Y, Levine A, Feng Z. Glutaminase 2, a novel p53 target gene
regulating energy metabolism and antioxidant function. Proc Natl Acad Sci U S A 2010;
107: 7455–7460.22. Chelikani P, Fita I, Loewen PC. Diversity of structures and properties among catalases.
Cell Mol Life Sci 2004; 61: 192–208.23. O0Connor JC, Wallace DM, O0Brien CJ, Cotter TG. A novel antioxidant function for the
tumor-suppressor gene p53 in the retinal ganglion cell. Invest Ophthalmol Vis Sci 2008;
49: 4237–4244.24. Tanaka H, Arakawa H, Yamaguchi T, Shiraishi K, Fukuda S, Matsui K et al. A
ribonucleotide reductase gene involved in a p53-dependent cell-cycle checkpoint for DNA
damage. Nature 2000; 404: 42–49.25. Bourdon A, Minai L, Serre V, Jais JP, Sarzi E, Aubert S et al. Mutation of RRM2B, encoding
p53-controlled ribonucleotide reductase (p53R2), causes severe mitochondrial DNA
depletion. Nat Genet 2007; 39: 776–780.26. Xue L, Zhou B, Liu X, Wang T, Shih J, Qi C et al. Structurally dependent redox property of
ribonucleotide reductase subunit p53R2. Cancer Res 2006; 66: 1900–1905.27. Yamaguchi T, Matsuda K, Sagiya Y, Iwadate M, Fujino MA, Nakamura Y et al. p53R2-
dependent pathway for DNA synthesis in a p53-regulated cell cycle checkpoint. Cancer
Res 2001; 61: 8256–8262.28. Amstad P, Peskin A, Shah G, Mirault ME, Moret R, Zbinden I et al. The balance between
Cu, Zn-superoxide dismutase and catalase affects the sensitivity of mouse epidermal cells
to oxidative stress. Biochemistry 1991; 30: 9305–9313.29. Hu CD, Kerppola TK. Simultaneous visualization of multiple protein interactions in living
cells using multicolor fluorescence complementation analysis. Nat Biotechnol 2003; 21:
539–545.30. Lee Y, Lee J, Kwon I, Nakajima Y, Ohmiya Y, Son GH et al. Coactivation of the CLOCK-
BMAL1 complex by CBP mediates resetting of the circadian clock. J Cell Sci 2010; 123
(Pt 20): 3547–3557.31. Unger T, Sionov RV, Moallem E, Yee CL, Howley PM, Oren M et al. Mutations in
serines 15 and 20 of human p53 impair its apoptotic activity. Oncogene 1999; 18:
3205–3212.32. Hafsi H, Hainaut P. Redox control and interplay between p53 isoforms: roles in the
regulation of basal p53 levels, cell fate, and senescence. Antioxid Redox Signal 2011; 15:
1655–1667.33. Ladelfa MF, Toledo MF, Laiseca JE, Monte M. Interaction of p53 with tumor suppressive
and oncogenic signaling pathways to control cellular reactive oxygen species production.
Antioxid Redox Signal 2011; 15: 1749–1761.34. Yoon KA, Nakamura Y, Arakawa H. Identification of ALDH4 as a p53-inducible gene and its
protective role in cellular stresses. J Hum Genet 2004; 49: 134–140.35. Pani G, Galeotti T. Role of MnSOD and p66shc in mitochondrial response to p53. Antioxid
Redox Signal 2011; 15: 1715–1727.36. Faraonio R, Vergara P, Di Marzo D, Pierantoni MG, Napolitano M, Russo T et al. p53
suppresses the Nrf2-dependent transcription of antioxidant response genes. J Biol Chem
2006; 281: 39776–39784.37. Lin ZP, Belcourt MF, Cory JG, Sartorelli AC. Stable suppression of the R2 subunit of
ribonucleotide reductase by R2-targeted short interference RNA sensitizes p53(-/-) HCT-
116 colon cancer cells to DNA-damaging agents and ribonucleotide reductase inhibitors.
J Biol Chem 2004; 279: 27030–27038.38. O0Brate A, Giannakakou P. The importance of p53 location: nuclear or cytoplasmic zip
code? Drug Resist Updat 2003; 6: 313–322.39. Oberdoerffer P, Sinclair DA. The role of nuclear architecture in genomic instability and
ageing. Nat Rev Mol Cell Biol 2007; 8: 692–702.40. Finkel T, Serrano M, Blasco MA. The common biology of cancer and ageing. Nature 2007;
448: 767–774.41. Hu CD, Grinberg AV, Kerppola TK. Visualization of protein interactions in living cells using
bimolecular fluorescence complementation (BiFC) analysis. Curr Protoc Cell Biol 2006
Chapter 21: Unit 21 3.
Supplementary Information accompanies the paper on Cell Death and Differentiation website (http://www.nature.com/cdd)
Catalase in prooxidant and antioxidant function of p53MY Kang et al
129
Cell Death and Differentiation