Embed Size (px)
Citation preview
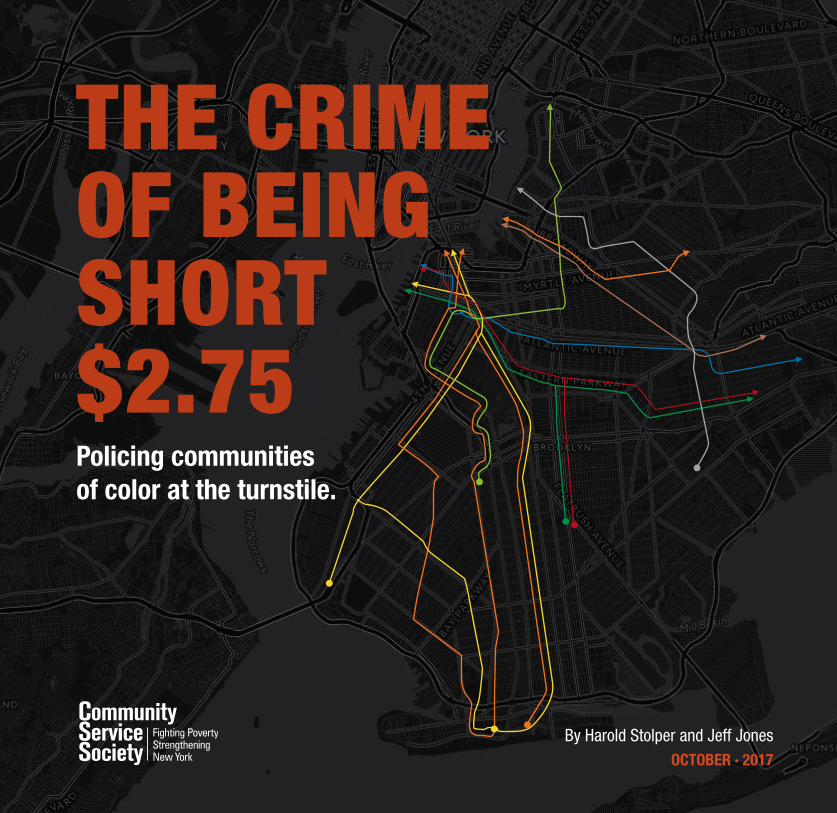
THE CRIME OF BEING SHORT$2.75Policing communities of color at the turnstile.
OCTOBER · 2017
By Harold Stolper and Jeff Jones

1
RACIALIZED POLICING AND THE CRIMINALIZATION
OF POVERTYFare evasion arrests in Brooklyn
2
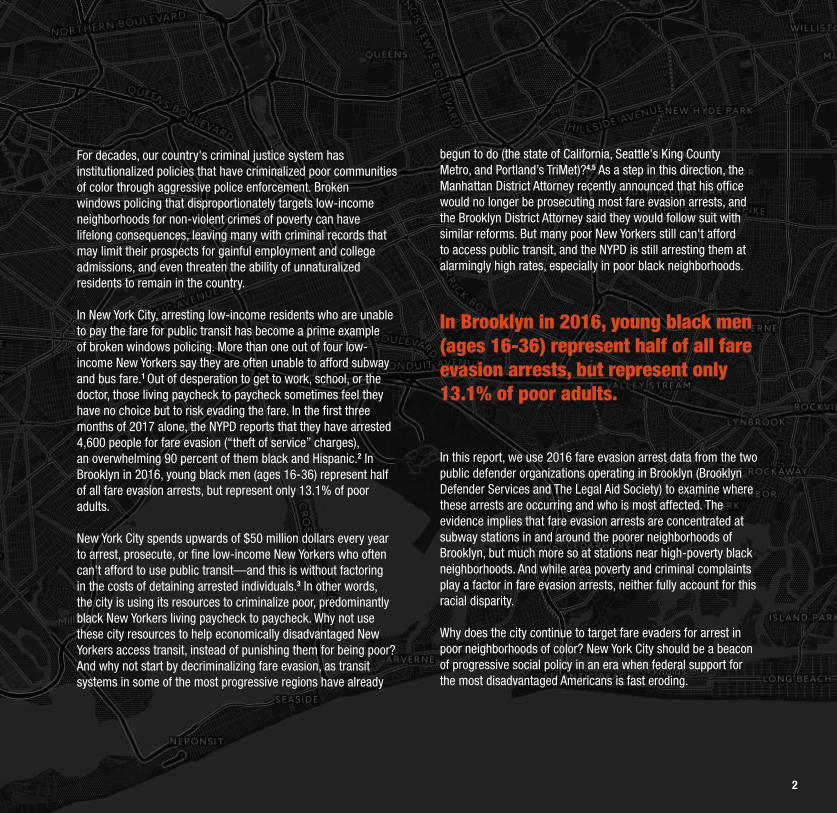
begun to do (the state of California, Seattle's King County Metro, and Portland’s TriMet)?4,5 As a step in this direction, the Manhattan District Attorney recently announced that his office would no longer be prosecuting most fare evasion arrests, and the Brooklyn District Attorney said they would follow suit with similar reforms. But many poor New Yorkers still can't afford to access public transit, and the NYPD is still arresting them at alarmingly high rates, especially in poor black neighborhoods.
In this report, we use 2016 fare evasion arrest data from the two public defender organizations operating in Brooklyn (Brooklyn Defender Services and The Legal Aid Society) to examine where these arrests are occurring and who is most affected. The evidence implies that fare evasion arrests are concentrated at subway stations in and around the poorer neighborhoods of Brooklyn, but much more so at stations near high-poverty black neighborhoods. And while area poverty and criminal complaints play a factor in fare evasion arrests, neither fully account for this racial disparity.
Why does the city continue to target fare evaders for arrest in poor neighborhoods of color? New York City should be a beacon of progressive social policy in an era when federal support for the most disadvantaged Americans is fast eroding.
For decades, our country's criminal justice system has institutionalized policies that have criminalized poor communities of color through aggressive police enforcement. Broken windows policing that disproportionately targets low-income neighborhoods for non-violent crimes of poverty can have lifelong consequences, leaving many with criminal records that may limit their prospects for gainful employment and college admissions, and even threaten the ability of unnaturalized residents to remain in the country.
In New York City, arresting low-income residents who are unable to pay the fare for public transit has become a prime example of broken windows policing. More than one out of four low-income New Yorkers say they are often unable to afford subway and bus fare.1 Out of desperation to get to work, school, or the doctor, those living paycheck to paycheck sometimes feel they have no choice but to risk evading the fare. In the first three months of 2017 alone, the NYPD reports that they have arrested 4,600 people for fare evasion (“theft of service” charges), an overwhelming 90 percent of them black and Hispanic.2 In Brooklyn in 2016, young black men (ages 16-36) represent half of all fare evasion arrests, but represent only 13.1% of poor adults.
New York City spends upwards of $50 million dollars every year to arrest, prosecute, or fine low-income New Yorkers who often can't afford to use public transit—and this is without factoring in the costs of detaining arrested individuals.3 In other words, the city is using its resources to criminalize poor, predominantly black New Yorkers living paycheck to paycheck. Why not use these city resources to help economically disadvantaged New Yorkers access transit, instead of punishing them for being poor? And why not start by decriminalizing fare evasion, as transit systems in some of the most progressive regions have already
In Brooklyn in 2016, young black men (ages 16-36) represent half of all fare evasion arrests, but represent only 13.1% of poor adults.
3
FARE EVASION ARRESTS?What do we mean by
4
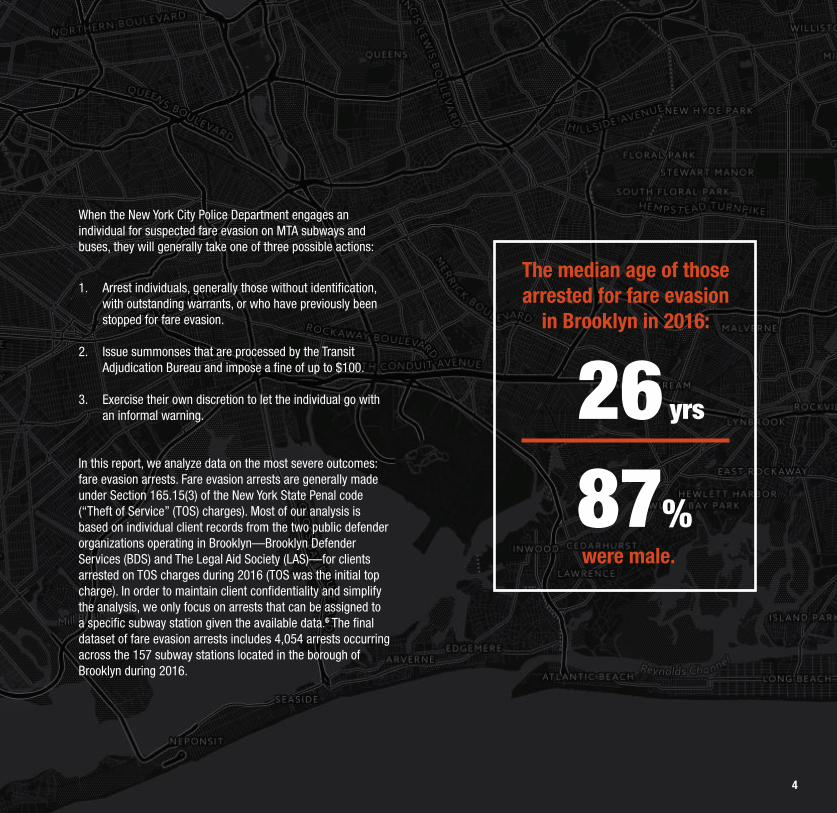
1. Arrest individuals, generally those without identification, with outstanding warrants, or who have previously been stopped for fare evasion.
2. Issue summonses that are processed by the Transit Adjudication Bureau and impose a fine of up to $100.
3. Exercise their own discretion to let the individual go with an informal warning.
In this report, we analyze data on the most severe outcomes: fare evasion arrests. Fare evasion arrests are generally made under Section 165.15(3) of the New York State Penal code (“Theft of Service” (TOS) charges). Most of our analysis is based on individual client records from the two public defender organizations operating in Brooklyn—Brooklyn Defender Services (BDS) and The Legal Aid Society (LAS)—for clients arrested on TOS charges during 2016 (TOS was the initial top charge). In order to maintain client confidentiality and simplify the analysis, we only focus on arrests that can be assigned to a specific subway station given the available data.6 The final dataset of fare evasion arrests includes 4,054 arrests occurring across the 157 subway stations located in the borough of Brooklyn during 2016.
When the New York City Police Department engages an individual for suspected fare evasion on MTA subways and buses, they will generally take one of three possible actions:
The median age of those arrested for fare evasion
in Brooklyn in 2016:
2687 were male.
%
yrs

5
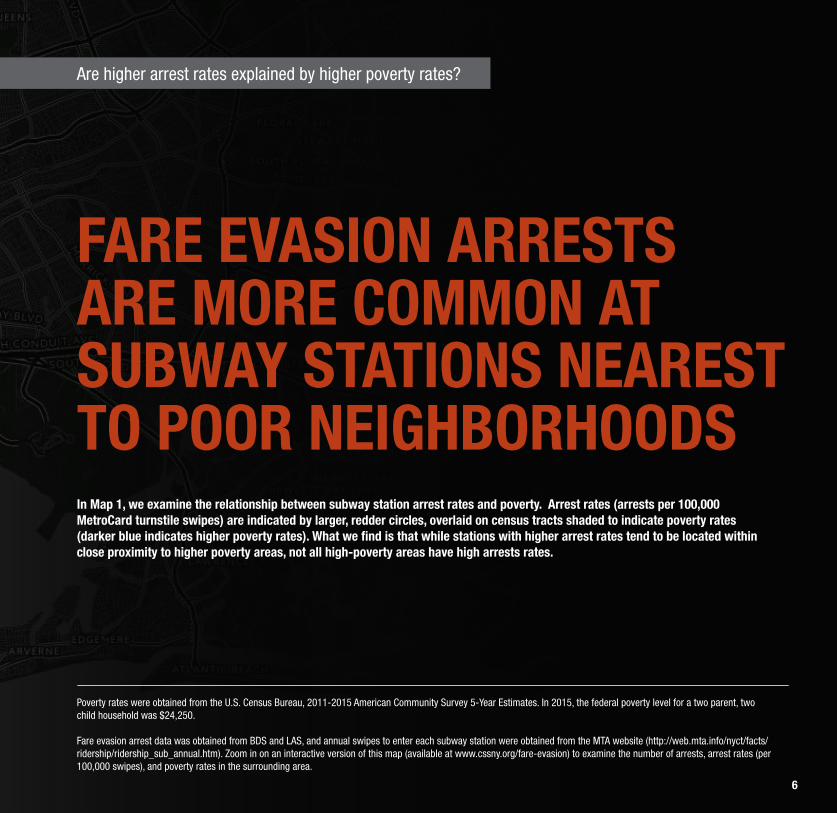
Percent of residents below federal poverty level
0 71MAP 1
Number of fare evasion arrests per 100k swipes
0-0.2 0.2-1.5 2.3-6.9 ≥6.91.5-2.3
5
6
FARE EVASION ARRESTS ARE MORE COMMON AT SUBWAY STATIONS NEAREST TO POOR NEIGHBORHOODS
Poverty rates were obtained from the U.S. Census Bureau, 2011-2015 American Community Survey 5-Year Estimates. In 2015, the federal poverty level for a two parent, two child household was $24,250.
Fare evasion arrest data was obtained from BDS and LAS, and annual swipes to enter each subway station were obtained from the MTA website (http://web.mta.info/nyct/facts/ridership/ridership_sub_annual.htm). Zoom in on an interactive version of this map (available at www.cssny.org/fare-evasion) to examine the number of arrests, arrest rates (per 100,000 swipes), and poverty rates in the surrounding area.
Are higher arrest rates explained by higher poverty rates?
In Map 1, we examine the relationship between subway station arrest rates and poverty. Arrest rates (arrests per 100,000 MetroCard turnstile swipes) are indicated by larger, redder circles, overlaid on census tracts shaded to indicate poverty rates (darker blue indicates higher poverty rates). What we find is that while stations with higher arrest rates tend to be located within close proximity to higher poverty areas, not all high-poverty areas have high arrests rates.
6

7
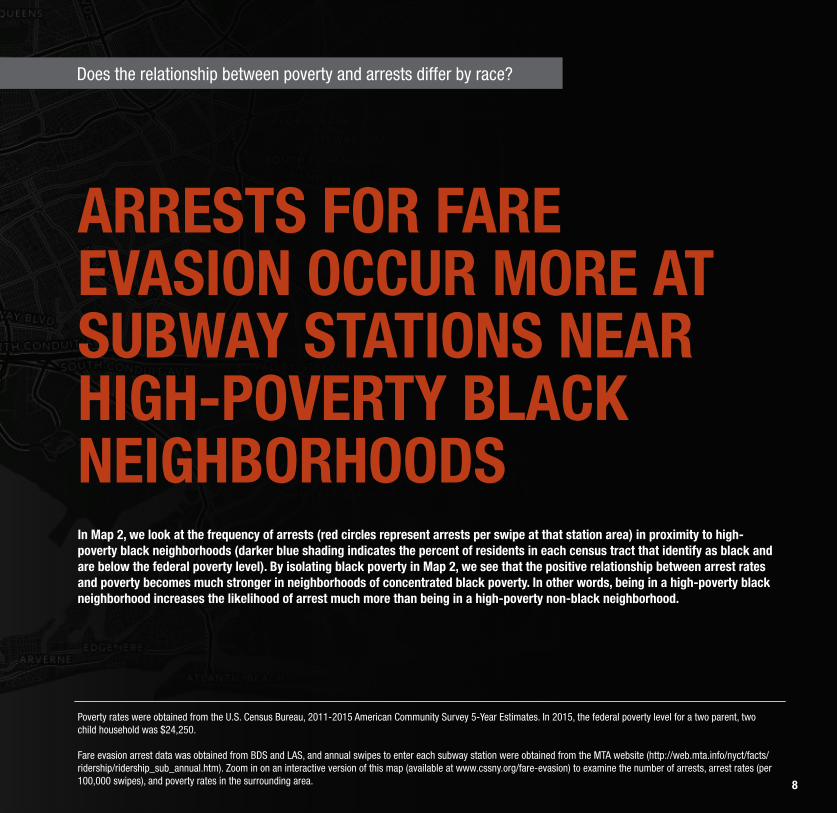
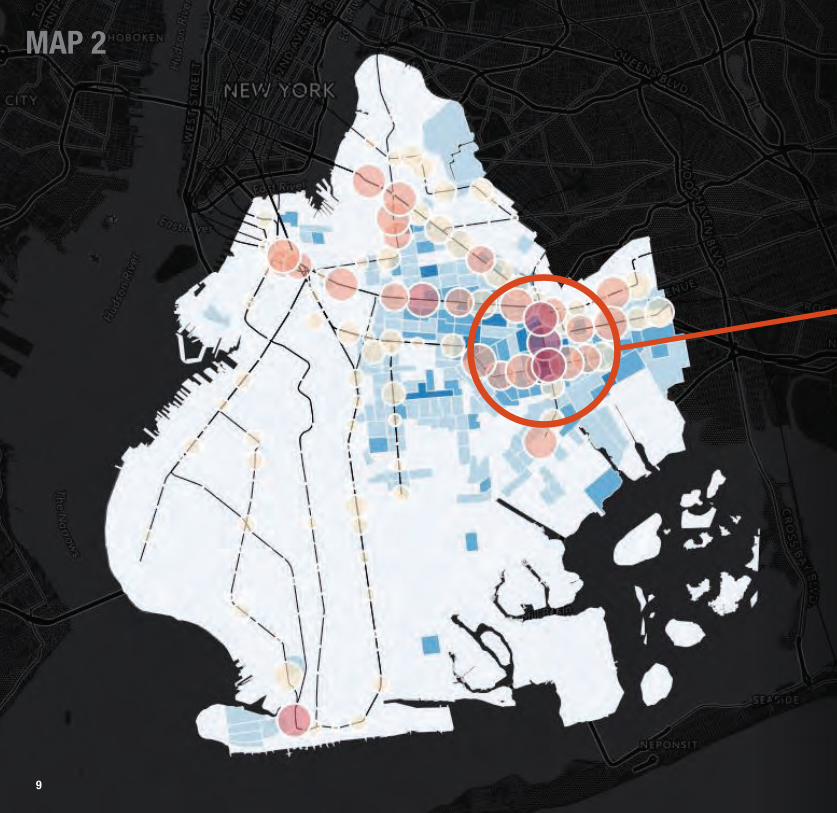
Percent of residents who are black and living below the federal poverty level
0 57
MAP 2
Number of fare evasion arrests per 100k swipes
0-0.2 0.2-1.5 2.3-6.9 ≥6.91.5-2.3
7
8
ARRESTS FOR FARE EVASION OCCUR MORE AT SUBWAY STATIONS NEAR HIGH-POVERTY BLACK NEIGHBORHOODS
Poverty rates were obtained from the U.S. Census Bureau, 2011-2015 American Community Survey 5-Year Estimates. In 2015, the federal poverty level for a two parent, two child household was $24,250.
Fare evasion arrest data was obtained from BDS and LAS, and annual swipes to enter each subway station were obtained from the MTA website (http://web.mta.info/nyct/facts/ridership/ridership_sub_annual.htm). Zoom in on an interactive version of this map (available at www.cssny.org/fare-evasion) to examine the number of arrests, arrest rates (per 100,000 swipes), and poverty rates in the surrounding area.
In Map 2, we look at the frequency of arrests (red circles represent arrests per swipe at that station area) in proximity to high-poverty black neighborhoods (darker blue shading indicates the percent of residents in each census tract that identify as black and are below the federal poverty level). By isolating black poverty in Map 2, we see that the positive relationship between arrest rates and poverty becomes much stronger in neighborhoods of concentrated black poverty. In other words, being in a high-poverty black neighborhood increases the likelihood of arrest much more than being in a high-poverty non-black neighborhood.
Does the relationship between poverty and arrests differ by race?
8
9
MAP 2
9
10
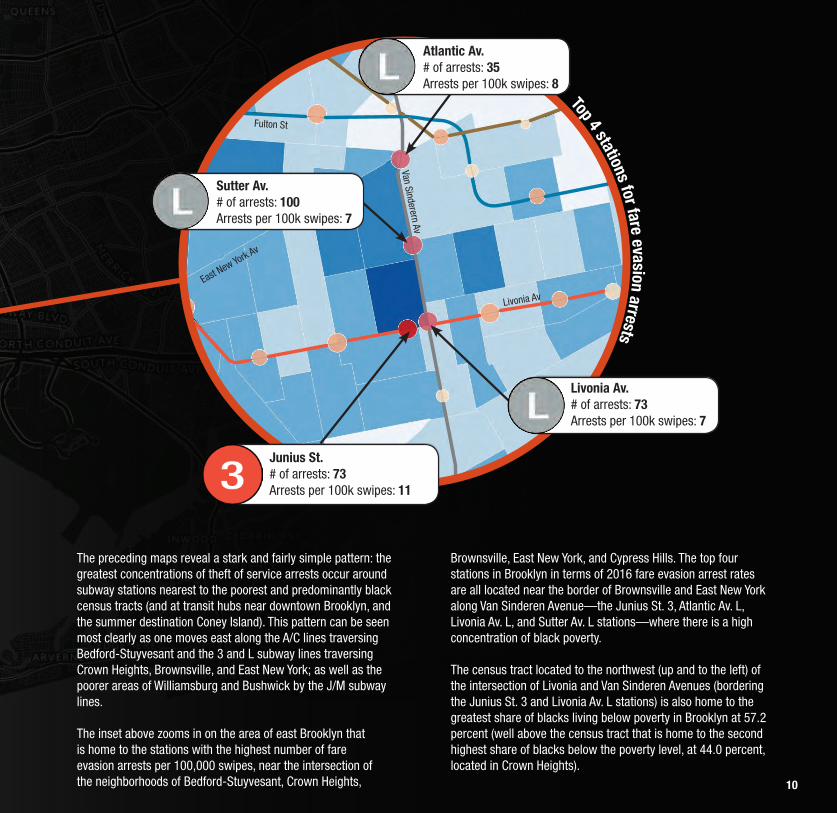
The preceding maps reveal a stark and fairly simple pattern: the greatest concentrations of theft of service arrests occur around subway stations nearest to the poorest and predominantly black census tracts (and at transit hubs near downtown Brooklyn, and the summer destination Coney Island). This pattern can be seen most clearly as one moves east along the A/C lines traversing Bedford-Stuyvesant and the 3 and L subway lines traversing Crown Heights, Brownsville, and East New York; as well as the poorer areas of Williamsburg and Bushwick by the J/M subway lines.
The inset above zooms in on the area of east Brooklyn that is home to the stations with the highest number of fare evasion arrests per 100,000 swipes, near the intersection of the neighborhoods of Bedford-Stuyvesant, Crown Heights,
Brownsville, East New York, and Cypress Hills. The top four stations in Brooklyn in terms of 2016 fare evasion arrest rates are all located near the border of Brownsville and East New York along Van Sinderen Avenue—the Junius St. 3, Atlantic Av. L, Livonia Av. L, and Sutter Av. L stations—where there is a high concentration of black poverty.
The census tract located to the northwest (up and to the left) of the intersection of Livonia and Van Sinderen Avenues (bordering the Junius St. 3 and Livonia Av. L stations) is also home to the greatest share of blacks living below poverty in Brooklyn at 57.2 percent (well above the census tract that is home to the second highest share of blacks below the poverty level, at 44.0 percent, located in Crown Heights).
Top 4 stations for fare evasion arrests
Junius St. # of arrests: 73Arrests per 100k swipes: 11
Livonia Av. # of arrests: 73Arrests per 100k swipes: 7
Sutter Av. # of arrests: 100Arrests per 100k swipes: 7
Atlantic Av. # of arrests: 35Arrests per 100k swipes: 8
East New York Av
Fulton St
Van Sinderern Av
Livonia Av
10

11
POVERTY ALONE DOESN’T EXPLAIN
RACIAL DISPARITIES IN FARE EVASION
ARRESTS
12
PERCENT OFADULTS IN
POVERTYin Brooklyn
PERCENT OFFARE EVASION
ARRESTSin Brooklyn
Black White OtherAsianHispanic
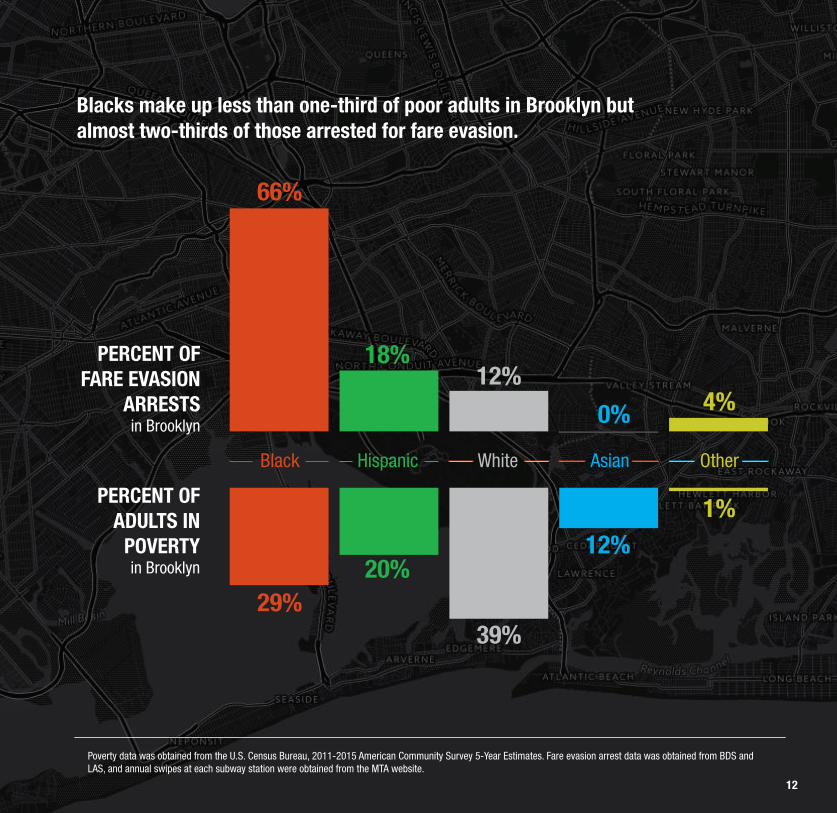
66%
0%
1%
4%
18%12%
12%
39%
20%29%
Blacks make up less than one-third of poor adults in Brooklyn but almost two-thirds of those arrested for fare evasion.
Poverty data was obtained from the U.S. Census Bureau, 2011-2015 American Community Survey 5-Year Estimates. Fare evasion arrest data was obtained from BDS and LAS, and annual swipes at each subway station were obtained from the MTA website.
13
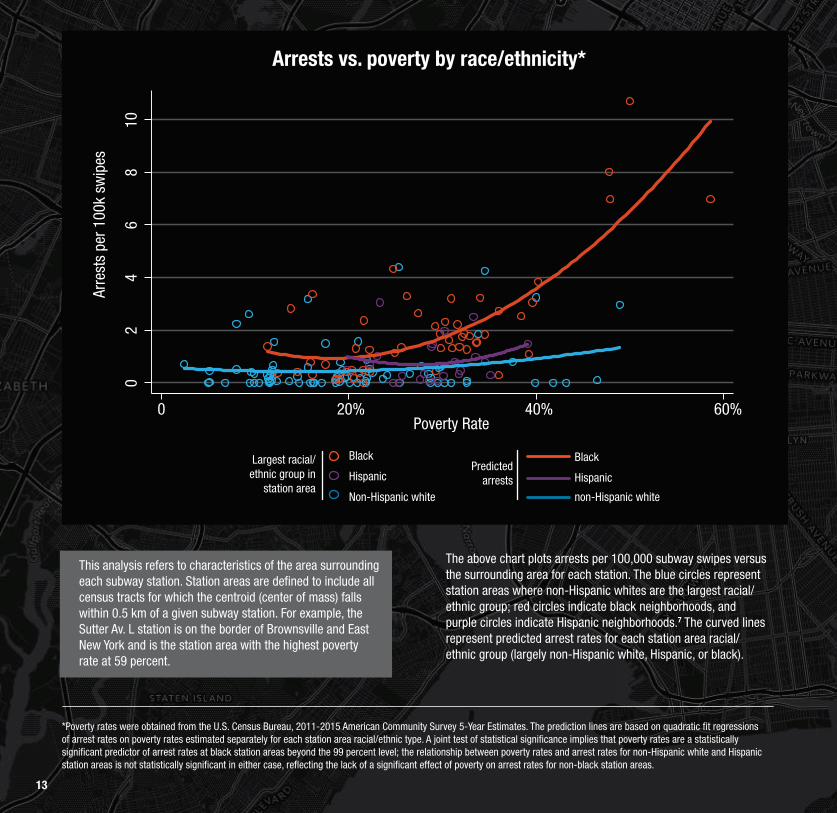
The above chart plots arrests per 100,000 subway swipes versus the surrounding area for each station. The blue circles represent station areas where non-Hispanic whites are the largest racial/ethnic group; red circles indicate black neighborhoods, and purple circles indicate Hispanic neighborhoods.7 The curved lines represent predicted arrest rates for each station area racial/ethnic group (largely non-Hispanic white, Hispanic, or black).
This analysis refers to characteristics of the area surrounding each subway station. Station areas are defined to include all census tracts for which the centroid (center of mass) falls within 0.5 km of a given subway station. For example, the Sutter Av. L station is on the border of Brownsville and East New York and is the station area with the highest poverty rate at 59 percent.
Arrests vs. poverty by race/ethnicity*
02
46
810
0 20% 40% 60%Poverty Rate
Arre
sts
per 1
00k
swip
es
*Poverty rates were obtained from the U.S. Census Bureau, 2011-2015 American Community Survey 5-Year Estimates. The prediction lines are based on quadratic fit regressions of arrest rates on poverty rates estimated separately for each station area racial/ethnic type. A joint test of statistical significance implies that poverty rates are a statistically significant predictor of arrest rates at black station areas beyond the 99 percent level; the relationship between poverty rates and arrest rates for non-Hispanic white and Hispanic station areas is not statistically significant in either case, reflecting the lack of a significant effect of poverty on arrest rates for non-black station areas.
BlackLargest racial/ethnic group in
station areaHispanic
Non-Hispanic white
Predicted arrests
Black
Hispanic
non-Hispanic white
14
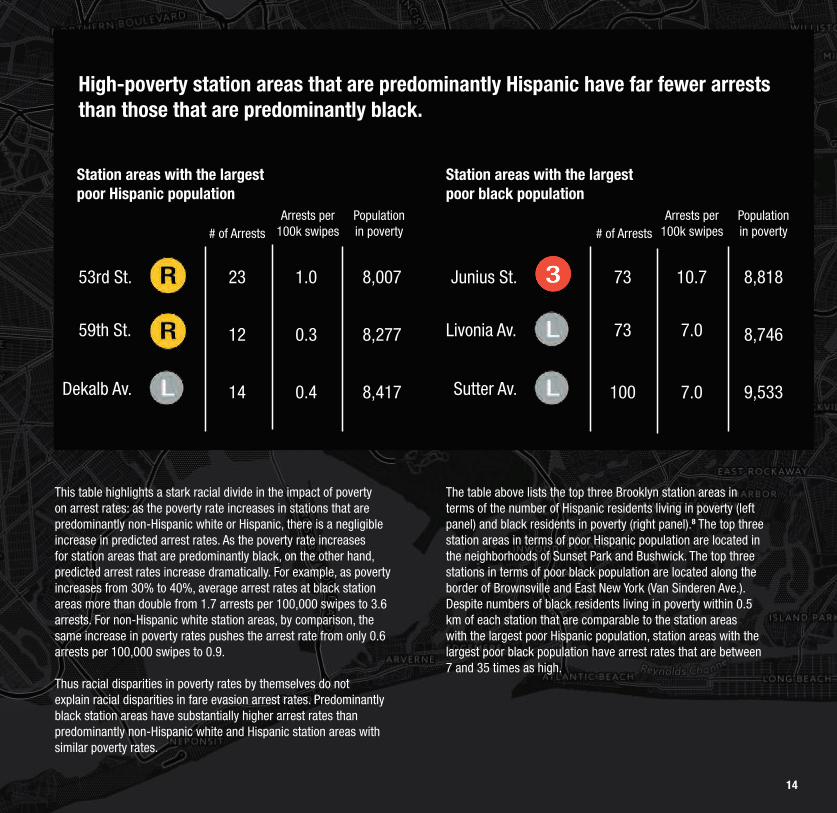
This table highlights a stark racial divide in the impact of poverty on arrest rates: as the poverty rate increases in stations that are predominantly non-Hispanic white or Hispanic, there is a negligible increase in predicted arrest rates. As the poverty rate increases for station areas that are predominantly black, on the other hand, predicted arrest rates increase dramatically. For example, as poverty increases from 30% to 40%, average arrest rates at black station areas more than double from 1.7 arrests per 100,000 swipes to 3.6 arrests. For non-Hispanic white station areas, by comparison, the same increase in poverty rates pushes the arrest rate from only 0.6 arrests per 100,000 swipes to 0.9.
Thus racial disparities in poverty rates by themselves do not explain racial disparities in fare evasion arrest rates. Predominantly black station areas have substantially higher arrest rates than predominantly non-Hispanic white and Hispanic station areas with similar poverty rates.
The table above lists the top three Brooklyn station areas in terms of the number of Hispanic residents living in poverty (left panel) and black residents in poverty (right panel).8 The top three station areas in terms of poor Hispanic population are located in the neighborhoods of Sunset Park and Bushwick. The top three stations in terms of poor black population are located along the border of Brownsville and East New York (Van Sinderen Ave.). Despite numbers of black residents living in poverty within 0.5 km of each station that are comparable to the station areas with the largest poor Hispanic population, station areas with the largest poor black population have arrest rates that are between 7 and 35 times as high.
High-poverty station areas that are predominantly Hispanic have far fewer arrests than those that are predominantly black.
Station areas with the largest poor Hispanic population
Station areas with the largest poor black population
# of ArrestsArrests per
100k swipesPopulation in poverty
Population in poverty
53rd St. 23 1.0 8,007 8,818
12 0.3 8,277 8,746
14 0.4 8,417 9,533
59th St.
Dekalb Av.
# of ArrestsArrests per
100k swipes
Junius St. 73 10.7
73 7.0
100 7.0
Livonia Av.
Sutter Av.

15
Are residents of high-poverty areas the most
likely to be arrested?
Percent of poor who rely on public transitworking-age adults below the federal poverty line
2% 11%
Poverty by zip codeMAP 3
15
16
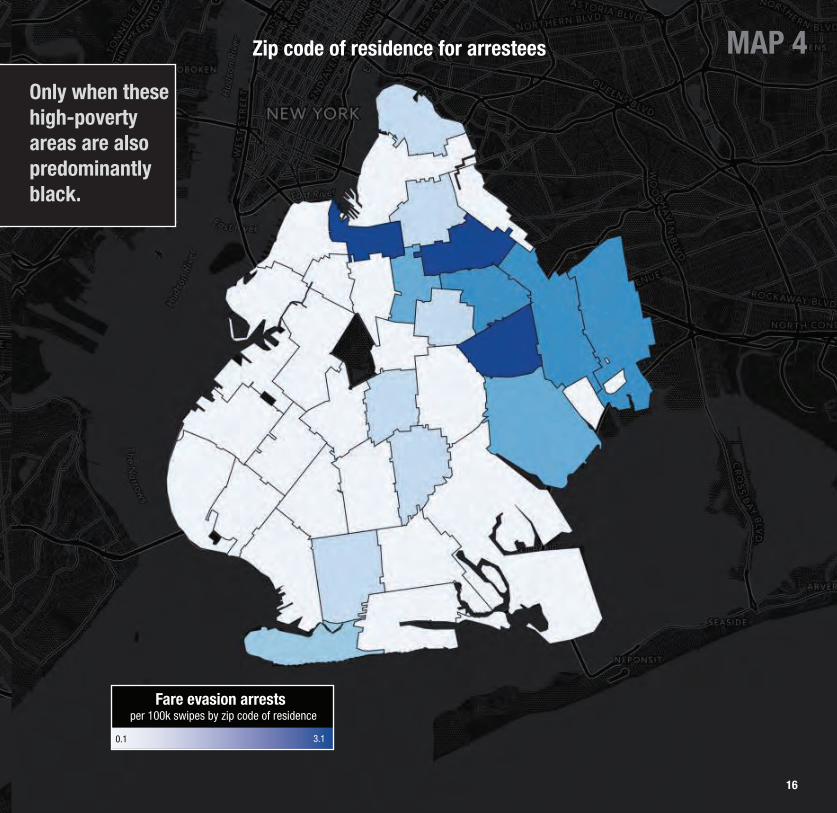
Only when these high-poverty areas are also predominantly black.
Fare evasion arrests per 100k swipes by zip code of residence
0.1 3.1
Zip code of residence for arrestees MAP 4
16
17
WHY ARE BLACKS LIVING IN POVERTY
ARRESTED AT SIGNIFICANTLY
HIGHER RATES?

18
We have just seen that higher fare evasion arrest rates of blacks living in poverty in Brooklyn cannot be explained by underlying racial disparities in poverty. What is it then that explains the disparate impact of fare evasion arrests by race—especially for young black men?
One factor is the rise in broken windows policing here in New York, wherein police officers target people committing low-level offenses. The original theory behind broken windows policing was that focusing on maintaining order leads to heightened community engagement and less serious crime.9 But in the 1990s under Mayor Rudolph Giuliani, the focus shifted towards heightened enforcement of low-level crimes to catch individuals who were committing more serious crimes. While the evidence is mixed on whether broken windows policing can effectively reduce more serious crime, it is clear that it has had a disproportionate impact on young men of color—especially black men.10
A second factor is that while policing of low-level crimes leads to higher arrest rates in the short term and a potential reduction in the crime rate over a longer period of time, this type of policing creates a system where officers are expected to maintain high arrest volumes. This can effectively establish a quota system that institutionalizes the overpolicing of low-level offenses in historically high crime—and predominantly minority—neighborhoods. Overpolicing of communities of color through fines is also a tactic used by municipalities across the country to generate revenues, irrespective of public safety concerns.11 While the NYPD Chief has publicly come out in opposition to supervisors who prioritize quantity over quality when it comes to their enforcement activities, numerous minority officers have spoken out in recent years about their experience being punished for opposing an ongoing quota system.12,13
In addition to these institutionalized departmental policing strategies, the fact remains that police officers always have some degree of discretion when it comes to issuing summonses and making arrests for low-level offenses such as fare evasion. And this discretion opens the door to both explicit and implicit biases that correlate with race, ethnicity, age, and gender.14
Taken together, the policing system in New York has institutionalized broken windows and enforcement quotas, which are reinforced by individually held biases that affect officers’ enforcement decisions. Collectively, these forces open the door for fare evasion arrest and summons rates that vary substantially across neighborhoods and racial/ethnic groups and may not, in fact, be driven primarily by legitimate public safety concerns or criminal activity.
The fact remains that police officers always have some degree of discretion when it comes to issuing summonses and making arrests for low-level offenses such as fare evasion. And this discretion opens the door to both explicit and implicit biases.
Do crime rates explain the relationship between race and arrests?

19
Does the idea that police are deployed in response to legitimate public safety concerns explain higher arrest rates of black individuals? We analyze the relationship between station fare evasion arrest rates and the number of criminal complaints in the surrounding station areas (for 2016). If nearby criminal activity is in fact the driving force for more local policing activity that
also leads to more fare evasion arrests, then increases in nearby criminal activity should lead to higher arrest rates irrespective of the racial/ethnic composition of the surrounding area.
Unfortunately, this is not in fact the case, and the results echo the pattern we saw when relating arrest rates to poverty rates across
Arrest rate vs. criminal activity byrace/ethnicity*
02
46
810
0 500 1000 1500 2000
Criminal Complaints
Arre
sts
per 1
00k
swip
es
*This chart excludes the five stations located within 0.5km of the Kings County Criminal Courthouse, as well as the Coney Island-Stillwell Av and the W 8 St – NY Aquarium stations that exhibit strong seasonal variation, due to the unique nature of criminal activity around these particular stations. Criminal complaints include all valid felony, misdemeanor, and violation crimes reported to the NYPD during 2016, using data obtained from NYC OpenData. The prediction lines are based on quadratic fit regressions of arrest rates on criminal complaints estimated separately for each station area racial/ethnic type. Joint tests of statistical significance imply that criminal complaints are a statistically significant predictor of arrest rates for both non-Hispanic white and black station areas at the 90 percent level; the relationship between criminal complaints and arrest rates for the 23 Hispanic station areas is not statistically significant.
BlackLargest racial/ethnic group in
station areaHispanic
Non-Hispanic white
Predicted arrests
Black
Hispanic
non-Hispanic white
20
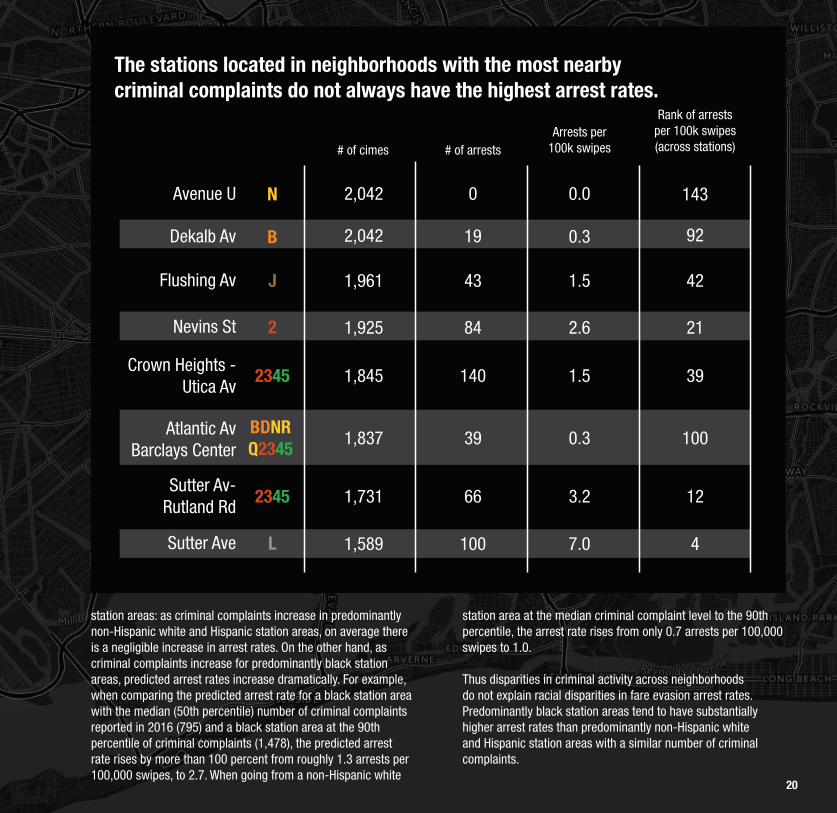
The stations located in neighborhoods with the most nearby criminal complaints do not always have the highest arrest rates.
# of cimes # of arrests
Rank of arrests per 100k swipes(across stations)
Avenue U
Nevins St
Sutter Av-Rutland Rd
2,042
1,925 84 2.6 21
N
B
J
2
2345
2345
BDNRQ2345
L
0 0.0
2,042
1,845 140 1.5 39
19 0.3
1,961
1,837 39 0.3 100
1,731 66 3.2 12
1,589 100 7.0 4
43 1.5
Dekalb Av
Crown Heights - Utica Av
Sutter Ave
Flushing Av
Atlantic Av Barclays Center
Arrests per 100k swipes
143
92
42
station areas: as criminal complaints increase in predominantly non-Hispanic white and Hispanic station areas, on average there is a negligible increase in arrest rates. On the other hand, as criminal complaints increase for predominantly black station areas, predicted arrest rates increase dramatically. For example, when comparing the predicted arrest rate for a black station area with the median (50th percentile) number of criminal complaints reported in 2016 (795) and a black station area at the 90th percentile of criminal complaints (1,478), the predicted arrest rate rises by more than 100 percent from roughly 1.3 arrests per 100,000 swipes, to 2.7. When going from a non-Hispanic white
station area at the median criminal complaint level to the 90th percentile, the arrest rate rises from only 0.7 arrests per 100,000 swipes to 1.0.
Thus disparities in criminal activity across neighborhoods do not explain racial disparities in fare evasion arrest rates. Predominantly black station areas tend to have substantially higher arrest rates than predominantly non-Hispanic white and Hispanic station areas with a similar number of criminal complaints.

21
"
22
““
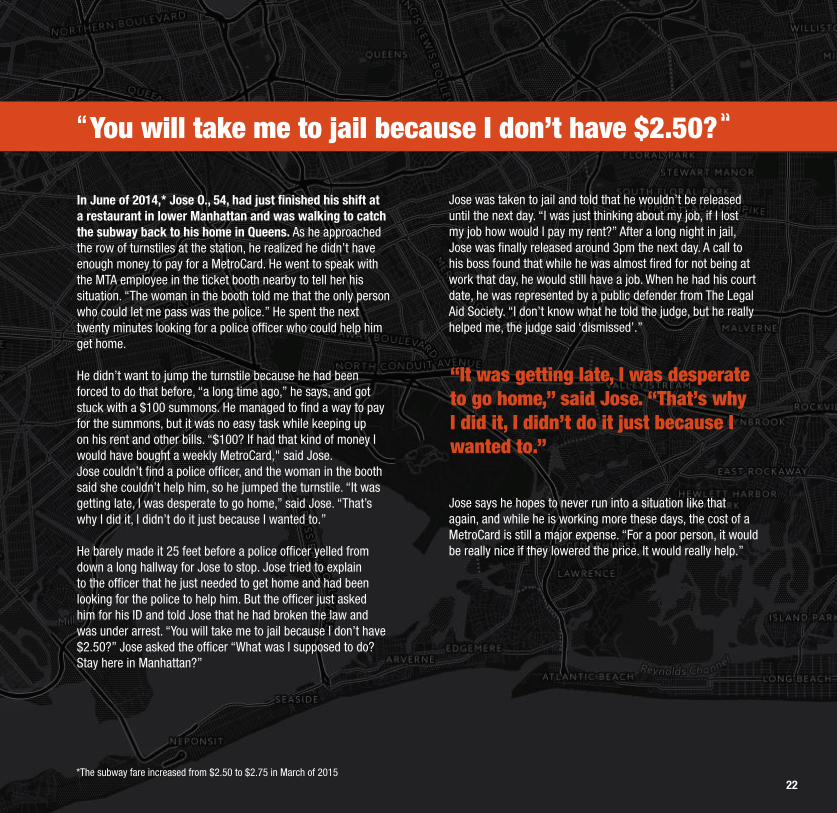
In June of 2014,* Jose O., 54, had just finished his shift at a restaurant in lower Manhattan and was walking to catch the subway back to his home in Queens. As he approached the row of turnstiles at the station, he realized he didn’t have enough money to pay for a MetroCard. He went to speak with the MTA employee in the ticket booth nearby to tell her his situation. “The woman in the booth told me that the only person who could let me pass was the police.” He spent the next twenty minutes looking for a police officer who could help him get home.
He didn’t want to jump the turnstile because he had been forced to do that before, “a long time ago,” he says, and got stuck with a $100 summons. He managed to find a way to pay for the summons, but it was no easy task while keeping up on his rent and other bills. “$100? If had that kind of money I would have bought a weekly MetroCard," said Jose.Jose couldn’t find a police officer, and the woman in the booth said she couldn’t help him, so he jumped the turnstile. “It was getting late, I was desperate to go home,” said Jose. “That’s why I did it, I didn’t do it just because I wanted to.”
He barely made it 25 feet before a police officer yelled from down a long hallway for Jose to stop. Jose tried to explain to the officer that he just needed to get home and had been looking for the police to help him. But the officer just asked him for his ID and told Jose that he had broken the law and was under arrest. “You will take me to jail because I don’t have $2.50?” Jose asked the officer “What was I supposed to do? Stay here in Manhattan?”
Jose was taken to jail and told that he wouldn’t be released until the next day. “I was just thinking about my job, if I lost my job how would I pay my rent?” After a long night in jail, Jose was finally released around 3pm the next day. A call to his boss found that while he was almost fired for not being at work that day, he would still have a job. When he had his court date, he was represented by a public defender from The Legal Aid Society. “I don’t know what he told the judge, but he really helped me, the judge said ‘dismissed’.”
Jose says he hopes to never run into a situation like that again, and while he is working more these days, the cost of a MetroCard is still a major expense. “For a poor person, it would be really nice if they lowered the price. It would really help.”
You will take me to jail because I don’t have $2.50?
“It was getting late, I was desperate to go home,” said Jose. “That’s why I did it, I didn’t do it just because I wanted to.”
*The subway fare increased from $2.50 to $2.75 in March of 2015

23
THE CONSEQUENCES OF NOT HAVING $2.75
24
Being arrested for fare evasion can have serious, lifelong consequences, all for the mere lack of $2.75. The time and stress of being arrested and processed through the criminal justice system alone can cost hourly workers their job if they are forced to miss a shift. But the more far-reaching human toll often comes in the form of a criminal record, in cases when individuals are convicted. A fare evasion conviction can result in jail time of up to one year. But even in the more common case where those arrested plead to a lesser charge and only get time served or community service, they are still left with court costs that far exceed the original shortfall of $2.75, and may still be saddled with a criminal record that can limit opportunities for gainful employment, renting an apartment, and college admissions.
For undocumented immigrants, a fare evasion arrest can be even more serious. Theft of services (fare evasion) is considered a “crime involving moral turpitude” by the Immigration and Naturalization Act, a deportable offense. Under the Trump administration, arrests for low-level offenses such as fare evasion are increasingly leading to detainment by Immigration and Customs Enforcement.15 This now leaves many poor immigrants in the position of having to risk deportation just to get to work.
The NYPD says that they have changed their policy to only arrest people for evading the fare (instead of writing a civil summons) when that person has an outstanding warrant, has a criminal record, or has been cited for fare evasion three times in the past two years.16 But it is unclear how this new policy is enforced, and whether officer discretion results in disparate treatment for New Yorkers of color and lesser means.
The consequences for this essential crime of poverty are draconian and insensitive to reality that people jump a turnstile out of complete necessity.
Tina LuongoAttorney-In-Charge, Criminal Practice The Legal Aid Society
“
“

25
NEW YORK CITY IS NOT ALONE
This is a national issue

26
Across the country, cities are beginning to tackle the issue of the criminalization of poverty and the disparate racial impact of their transit policing policies. When the very communities who are most reliant on public transit are largely unable to afford public transit, and are heavily policed at the turnstile, then public transit is no longer truly public.
In 2008, San Francisco became the first city to stop issuing criminal citations to fare evaders and instead issuing the equivalent of a parking ticket. King County, Washington—home to Seattle’s Metro system—decriminalized fare evasion for youth under the age 18 in 2015, and the state of California did the same for young riders in 2016. In Oregon, Portland State University released a study in December 2016 that showed
black riders on the city’s TriMet transit system were significantly more likely to be banned from riding as a result of fare evasion than other racial/ethnic groups.17 In response, the District Attorneys of three of the counties TriMet serves said they would no longer prosecute the majority of fare evasion cases. Legislators in Washington, D.C. also recently introduced a bill to decriminalize fare evasion.18
The U.S. Department of Transportation announced in January of 2017 that it would be investigating a civil rights complaint brought against the Los Angeles Metro and the L.A. County Sheriff's Department in California for disproportionately ticketing black transit riders for fare evasion.19 It’s not just the largest coastal cities that are starting to see the problem. Minneapolis’s Metro Transit conducted its own study that showed that blacks and Native Americans are much more likely to be ticketed than riders of other groups, and are working internally to address the issue.20 Cleveland's The Plain Dealer reported that black riders received citations for not paying the fare far more than fellow riders of other racial backgrounds.21
Residents of Chicago and Pittsburgh have also expressed concerns about racial discrimination and arresting the poor for avoiding fare payment to get to where they need to go.22,23
When the very communities who are most reliant on public transit are largely unable to afford public transit, and are heavily policed at the turnstile, then public transit is no longer truly public.
27
ARRESTS OR ACCESS?
What is the best use of city resources?
28
In June 2017, the Manhattan District Attorney’s Office announced that beginning in September it will no longer prosecute individuals charged with theft of services for fare evasion, “unless there is a demonstrated public safety reason to do so.”24 Instead they will implement a pre-arraignment diversion program and encourage the NYPD to favor summonses over arrests. The Brooklyn District Attorney’s Office said that they will be following suit with similar reforms.25 Building on this idea, New York State Senator Jesse Hamilton has proposed legislation to decriminalize fare evasion on a broader scale by amending the theft of service statute of the state penal code to exclude turnstile jumping.26
These announcements are a long overdue acknowledgment that criminalizing poverty not only requires a tremendous investment of criminal justice resources on the part of the city, but imposes unnecessary hardships on individuals whose only real crime is being poor. The decision to decriminalize most fare evasion arrests in Manhattan and Brooklyn will help reduce citywide costs of incarceration and prosecution, but the District Attorney’s office is not in a position to directly address overpolicing of poor, black communities.
The combination of citywide policing policies and transit fare policy have made the turnstile a gateway to the criminal justice system for poor communities of color—especially young black men. Without concerted institutional change in the enforcement policies of the NYPD, the city will continue to pay millions of dollars for the police to engage and punish poor New Yorkers of color in ways that do not appear to be driven by legitimate public safety concerns.
Instead of spending city funds to arrest poor people for fare evasion, why not redirect these city resources to policing more serious crimes? And why not direct city resources to actually help low-income people afford the fare?
The Swipe It Forward campaign, created by the Coalition to End Broken Windows and the Police Reform Project, among other activists and advocacy groups, has been working to raise awareness of racial disparities in transit access and transit policing through their grassroots efforts at subway stations in neighborhoods with high concentrations of people of color and immigrants. The Swipe it Forward campaign has played a critical role in highlighting the interconnected problems of transit affordability and racialized policing practices, furthering the case for systematic policy change initiated and funded by the City or State to ensure affordable public transit for the most economically disadvantaged New Yorkers.
New York City Mayor de Blasio's recently proposed plan to increase the "millionaire's" tax on city residents includes dedicated funding for half-price MetroCards for working-age New Yorkers living in poverty. Embracing a progressive funding source—such as but not limited to the millionaire’s tax—to subsidize MetroCards for the neediest New Yorkers is a strong step towards ensuring that the turnstile is a gateway to economic opportunity, not a barrier.
The combination of citywide policing policies and transit fare policy have made the turnstile a gateway to the criminal justice system for poor communities of color.

29
WHAT YOU CAN DO
30
Support the #FairFares campaign to make transit affordable to all New Yorkers.
Under the leadership of the Community Service Society and the Riders Alliance, the #FairFares campaign to bring half-priced MetroCards to low-income New Yorkers has garnered the support of leading anti-poverty organizations, labor unions, transit activists, and community groups across the five boroughs, as well as 40 (out of 51) members of the City Council, the Public Advocate, City Comptroller, four out of five Borough Presidents, and other leading progressive voices.
Learn more at www.cssny.org/fairfares
Get involved in efforts to decriminalize fare evasion.
The Legal Aid Society, Brooklyn Defender Services, and the Bronx Defenders have been leading voices for reforms to decriminalize poverty and limit discrimination through sentencing.
Learn about efforts to shift resources from policing communities to strengthening communities.
Organizations such as the Coalition to End Broken Windows and coalition-led campaigns such as #SwipeItForward have been organizing affected communities to advocate for the end of broken windows policing and a redistribution of resources from criminalization to community support, such as truly universal transit access.
Join the national movement to end racialized policing and the criminalization of poverty.
The Black Lives Matter movement has chapters in many cities and is working to end systemic racism and discrimination. You can also join your local ACLU affiliate and their work fighting to protect civil liberties and rights for all.

31
Endnotes
1. Community Service Society, The Unheard Third 2016.
2. Figures provided by the NYPD to CSS in a private meeting.
3. Schreibersdorf, Lisa and Jared Chausow. “The unfair attack on fare evasion: Rather than pulling out all stops to collect every last dime from the indigent, the city should make it easier for low-income New Yorkers to ride subways and buses.” New York Daily News, August 29, 2016.
4. Schmitt, Angie. “Why Cities Are Starting to Decriminalize Fare Evasion.” Streetsblog USA, March 8, 2017.
5. Green, Aimee. “Prosecutors will stop pursuing charges against most TriMet fare evaders.” The Oregonian/OregonLive, January 6, 2017.
6. Based on BDS data, 89% of clients arrests for TOS charges can be assigned to the immediate vicinity of a specific subway station. The arrest location data is based on the original police reports, which are not based on standardized station names or identifiers. The majority remaining 11% of arrests that are excluded from this analysis likely represent arrests for TOS charges other than fare evasion (e.g. skipping out on cabfare or a meal), or TOS charges for bus fare evasion which are generally impossible to identify based solely on location of arrest. It should also be noted that nearly all clients arrested for fare evasion in Brooklyn are represented by BDS or LAS—if the client couldn’t afford $2.75 for subway fare, they almost certainly can’t afford to hire a private lawyer.
7. Of the 157 stations in Brooklyn, there are 80 station areas where non-Hispanic whites are the largest racial/ethnic group, 54 are largely black, and 23 are largely Hispanic
8. Here we choose to focus on the black vs. Hispanic comparison instead of white, because the poorest non-Hispanic white station areas are found in ultra-Orthodox Jewish areas of Borough Park and South Williamsburg. These communities tend to be less transit reliant, and thus may not serve as the best comparison station areas to predominantly black station areas.
9. Kelling, George L. and James Q. Wilson. “Broken Windows; The police and neighborhood safety.” The Atlantic, March 1982.
10. Chauhan, P., Fera, A.G., Welsh, M.B., Balazon, E., and Misshula, E. with an Introduction by Jeremy Travis. “Trends in misdemeanor arrest rates in New York.” Report Presented to the Citizens Crime Commission, New York, NY.. October, 2014.
11. The Data Team at The Economist. "A study suggests that black Americans are unfairly fined by police." The Economist, Jul. 27, 2017.
12. Starling, Lakin. “12 Minority NYPD Officers Say They’re Being Punished For Bucking Arrest Quotas.” NewsOne.com, September 2015.

32
13. Robbins, Christopher. “NYPD Punishes Esteemed Black Officer Who Fights Quotas.” The Gothamist, Feb. 18, 2016.
14. Bertrand, Marianne, Dolly Chugh, and Sendhil Mullainathan. "Implicit discrimination." American Economic Review, May 2005.
15. Bendix, Aria. “Immigrant Arrests Are Up, but Deportation Is Down.” The Atlantic, May 17, 2017.
16. Figures provided by the NYPD to CSS.
17. Njus, Elliot. “Study: Black MAX riders more likely to be banned from TriMet for fare evasion.” The Oregonian/OregonLive, December 14. 2016.
18. MacFarlane, Scott. "Metro Fare Evasion Could Be Decriminalized in DC Under New Council Bill." News 4 Washington, Jul. 11, 2017.
19. Carino, Meghan McCarty. “Feds investigating Metro fare enforcement after discrimination complaint.” SCPR.org, January 19, 2017.
20. Moore, Janet. “Study: Minorities more likely to be cited by Metro Transit police for fare evasion.” Star Tribune, December 18, 2015.
21. Baird, Gabriel. “Blacks being ticketed in high numbers for not paying RTA fares in Cleveland.” The Plain Dealer, December 12, 2010.
22. Greenfield, John. “Chicago should decriminalize fare evasion.” Chicago Reader, March 21, 2017.
23. Blazine, Ed. “Coalition 'disappointed' with Port Authority fare enforcement policy meeting.” Pittsburgh Post-Gazette, June 7, 2017.
24. Vance, Jr., Cyrus R. “District Attorney Vance to End Criminal Prosecution of Approximately 20,000 Low-level, Non-violent Misdemeanors per Year.” Press Release, District Attorney, New York County, June 30, 2017.
25. Jacobs, Shayna. “New effort to eliminate turnstile-jumping crime starts in September, Manhattan DA says.” New York Daily News, June 30, 2017.
26. Hamilton, Jesse.”Turning Lives Around; The Need to Decriminalize Turnstile Jumping.” July, 2017.
27. Vance, Jr., Cyrus R. June 30, 2017.

We are grateful to Brooklyn Defenders Services and
The Legal Aid Society for providing the data used in
this report. We would also like to acknowledge the
following individuals for providing valuable input
that has helped shape the substance of this report:
Tina Luongo, Anthony Posada, and the data team at
The Legal Aid Society; Jared Chausow and the data
team at Brooklyn Defender Services; Albert Saint
Jean (Black Alliance for Just Immigration); Nancy
Rankin, Judith Whiting, Irene Lew, Jeff Maclin, and
Alia Winters (Community Service Society); Samuel
Stolper (MIT Department of Economics); and Michelle
Marques.
Harold Stolper is the Senior Labor Economist at the
Community Service Society, where he conducts research to
raise awareness about income inequality and the economic
hardships facing low-income New Yorkers. He is also
an adjunct professor at Columbia University’s School of
International and Public Affairs (SIPA). Harold has a PhD in
economics from Columbia University, and a Master of Public of
Administration from SIPA.
Jeff Jones is the Director of Marketing and Design at the
Community Service Society, where he guides the overall
creative and brand strategy for the organization. His design,
marketing, and messaging work is an integral part of CSS
research and advocacy campaigns. Jeff has an MFA in design
from Boston University.
33
To see an interactive version of this report visit: www.cssny.org/fare-evasion
Acknowledgments About the Authors
34
Executive Officers
Community Service Society of New York
2017–2018 Board of Trustees
David R. JonesPresident and Chief Executive Officer
Steven L. KrauseExecutive Vice President and Chief Operating Officer
Deborah M. Sale Chairperson
Steven BrownVice Chairperson
Ralph Da Costa-Núñez, Ph.D. Treasurer
Hon. Betsy GotbaumSecretary
Terry AgrissKaren Y. Bitar, Esq.Judy ChambersSylvia E. DiPietro, Esq.Richard W. EaddyFlorence H. FrucherPatricia GlazerNicholas A. Gravante, Jr., Esq.Khaled HaramJoseph J. HaslipMichael Horodniceanu, Ph.D.Magda Jimenez Train, Esq.Micah C. LasherKhary Lazarre-White, Esq.Hon. Kelly O'Neill Levy, Esq.Mark E. LiebermanRosalie Margolis, Esq.Joyce L. Miller
Geoffrey NewmanCarol L. O'NealeRegan Kelley OrillacDavid J. PollakMargarita Rosa, Esq.Donald W. Savelson, Esq.Marla Eisland Sprie, Esq.Ken SunshineBarbara Nevins TaylorPhyllis TaylorJeffery J. WeaverJerry WebmanAbby Wenzel, Esq.Mark A. Willis
Honorary Life Trustees
Stephen R. Aiello, Ph.D.Hon. David N. DinkinsMarian S. HeiskellDouglas Williams
34

633 Third Ave, 10th FLNew York, NY 10017 PH 212.254.8900www.cssny.org