Embed Size (px)
Citation preview
J u n e 2 0 0 8
The Credit Cycle: Where Are We Now and Where Are We Heading?
2008 © Probitas Partners


C o n t e n t s
Introduction ........................................................................
The Current Credit Cycle ................................................
The Growth of Leverage — and of Risk .......................
Strategic Impacts on the Buyout Market ....................
The Market Turn .................................................................
The Next Stage: Increasing Defaults .............................
Ramifications for Private Equity ...................................
Distressed Debt & Restructuring Funds: The Other Side of the Coin ..............................................
Other Opportunities in Private Equity ........................
Conclusion ...........................................................................
1
2
2
6
8
11
14
15
17
19


Confidential & Trade Secret ©2008 Do not circulate or publish. 1
I n t r o d u c t i o n
Probitas Partners is a leading independent knowledge, innovation and solutions provider to private markets clients globally. We focus our expertise in fund placement, liquidity management, and portfolio management to constantly build and grow powerful, lasting relationships that deliver value, execution, and service to our partners and clients. We emphasize private equity and real assets including debt and equity funds, venture capital, special situations, opportunistic real estate, and infrastructure from around the world.
Accurate data is elusive in private markets. Probitas Partners offers research and investment tools on the alternative investment market as aids to its institutional investor and general partner clients. Probitas Partners shares this data in an effort to improve professionalism, consistently raise the bar on professional services, and assist all participants in their investment, portfolio management, and fund raising endeavors.
Recent publications by Probitas Partners include the 2008 Private Equity Deskbook and the 2008 Real Estate & Hard Asset Deskbook, both of which report on recent key trends and include listings of funds in or coming to market. Investing in Infrastructure Funds addresses the growing demand for this asset class. Probitas Partners’ and Axiom Asia Private Capital’s The Emerging Private Equity Market in Asia details the opportunities and challenges of private equity investing in Asia. Probitas Partners also holds roundtables on critical topics of interest for its private market clients.
Recently, we hosted a roundtable on the Distressed Debt Cycle featuring Dr. Edward Altman, an expert on corporate bankruptcy, high yield bonds, distressed debt, and credit risk analysis. This white paper summarizes the insights shared at the roundtable by Dr. Altman, as well as conclusions from a panel discussion with a distinguished group of general partners active in the sector: Bruce Grossman, Avenue Capital; Michael Madden, BlackEagle Partners; Mike Psaros, KPS Capital Partners; and Wilbur Ross, W.L. Ross & Co. Additionally, we present our further research and conclusions about the implications of current market conditions on the alternative investment space. Probitas Partners continues to host smaller, interactive, invitation-only roundtables. These gatherings bring together senior institutional investment professionals and industry experts to address the most meaningful topics of the day.

Confidential & Trade Secret ©2008 Do not circulate or publish.2
The Current Credit Cycle
The turn in the credit markets was long
expected. Anticipated even before the sub-
prime crisis in the second half of 2007, the
crisis in the broader credit markets firmly
established itself during the first half of 2008.
Earlier in the year, speculation focused on
the possibility of a U.S. recession. This has
since been replaced by serious discussion
of how much pain the crack in the credit
markets and seemingly imminent recession
will bring. Indeed, today there are forecasts
of skyrocketing defaults, with headlines
covering the first wave of bankruptcies,
including companies such as Aloha Airlines,
ATA, Lillian Vernon, PRC and The Sharper
Image.
We are at a key inflection point in the
culture and practices of the global financial
system. This white paper provides insights
to investors on the impacts of this stage of
the credit market cycle on different sectors of
the private equity market, highlighting both
areas of concern and targets of opportunity.
It also underlines how this cycle is different
from prior ones, especially in regard to the
growth and evolution of the international
private equity market.
The Growth of Leverage – and of Risk
The major factors that transformed the
credit market in the last few years ultimately
emanated from a fundamental and system-
wide misreading and mispricing of risk. A
glut of global liquidity expanded overall
financial markets dramatically, spurring a
corresponding growth of the institutional
loan market, Collateralized Debt Obligation
vehicles (“CDOs”), and second lien loans,
while also dramatically increasing hedge
fund and Mergers & Acquisitions activity
(spurred by leveraged buyouts). In this
changed environment, credit standards
applied by both bank and non-bank debt
arrangers slackened. Investment banks
fought to broker deals to remain competitive.
Many of these intermediaries focused on
originating and selling loans as quickly as
possible to generate syndication fee income,
with little focus on holding the underlying
assets or quantifying the inherent risk on
their own balance sheets.
At the same time, new types of structured
credit products — CDOs and Collateralized
Loan Obligations (“CLOs”) — multiplied to
serve the demand for highly-rated interest
paying investments. With investor interest
in specific tranches primarily driven by their
ratings, the inherent value of these products
became increasingly complex to calculate.
Historical models of risk and return were
no longer adequate predictors of risk for
these instruments as credit agencies helped
to market these structured products with
favorable “stable” ratings.
Increasing investor interest in buyout funds
led to increased equity deployed in the
sector and significant growth in amounts
of leverage, spurred on by increasingly
lax loan documents (so called “covenant-
lite” arrangements). Chart I and Chart II
highlight the surge in issuance of leveraged
loans to support buyout activity in the U.S.
and Europe over the last four years.
While the amount of leveraged loan activity
increased over the last four years, the credit
quality of the new debt being issued declined.

Confidential & Trade Secret ©2008 Do not circulate or publish. 3
Chart I U.S. Buyout Leveraged Loan Volumes
Chart II European Buyout Leveraged Loan Volumes
Chart III New Issues Rated B- or Below as a % of All New Issues
Source: Standard & Poor’s Leveraged Buyout Review
Source: Standard & Poor’s Leveraged Buyout Review
Source: Standard & Poor’s LCD
$ in
bill
ions
200
180
160
140
120
100
80
60
40
20
0
1996 1997 1998 1999 2000 2001 2002 2003 2004 2005 2006 2007
17.8 18.6 22.311.1
20.1
64.5
121.5
189.0
30.8
9.8
47.130.2
€ in
bill
ions
16014012010080 80 6040 20 0
1999 2000 2001 2002 2003 2004 2005 2006 2007
15.3 18.829.5
102.9115.8
24.744.4
140.1
28.4
60%
50%
40%
30%
20%
10%
0%
1993 1994 1995 1996 1997 1998 1999 2000 2001 2002 2003 2004 2005 2006 2007
26.0% 22.0%
32.0% 30.0% 31.0%
21.1%
31.0%
45.2%
28.0%
38.0%
21.0%
26.0%
42.0% 42.4%
49.2%

Confidential & Trade Secret ©2008 Do not circulate or publish.4
As noted in Chart III, beginning in 2004, over
40% of new issues were rated as B- or worse
(a rating indicating a high probability of
default). In 2007, newly issued bonds rated
B- or worse reached an all-time high of 49.2%
of all new issuances.
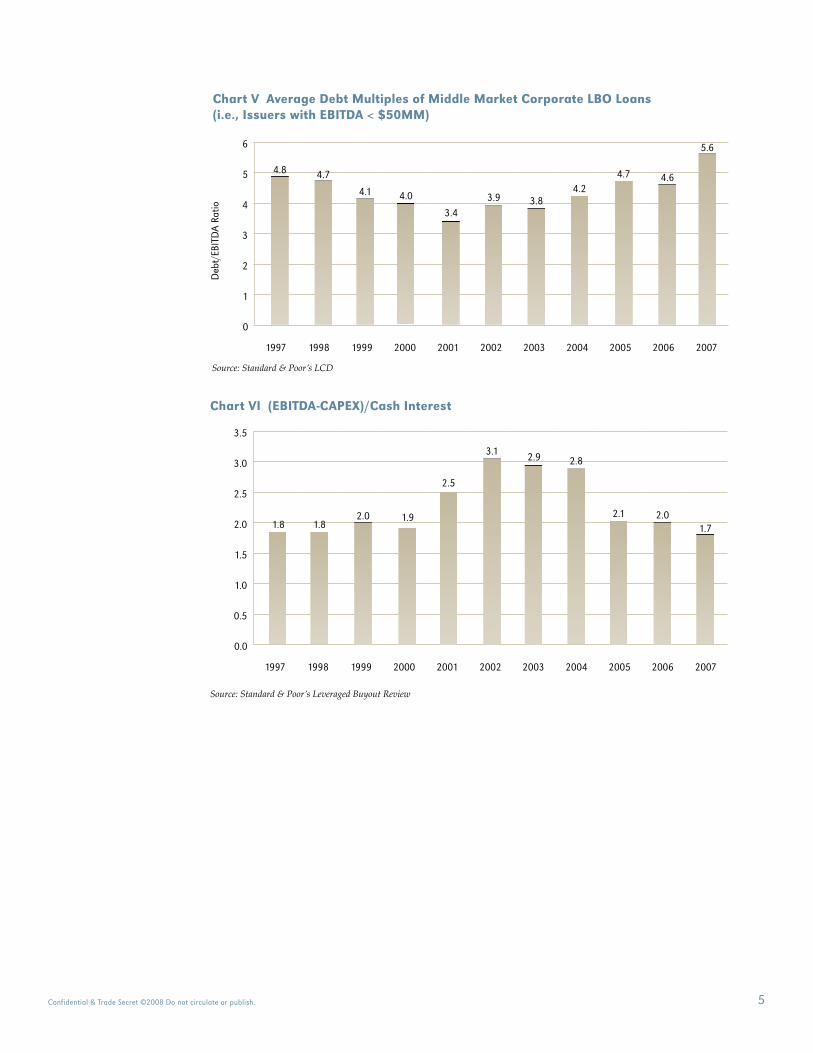
Chart IV and Chart V illustrate a key reason
for this decline in the quality of new issuances
— the steadily rising ratio of debt to earnings
for U.S. and European buyout transactions
during this period. Debt to EBITDA ratios
for both large and middle market buyouts
have risen steadily over the last five years,
Chart IV Average Debt Multiples of Large Corporate LBO Loans(i.e., Issuers with EBITDA > $50MM)
Source: Standard & Poor’s LCD
Deb
t/EB
ITD
A R
atio
7
6
5
4
3
2
1
0
1997 1998 1999 2000 2001 2002 2003 2004 2005 2006 2007
5.75.4
4.24.0
4.6
5.3 5.4
6.2
4.7
4.1
4.8
reaching a ten-year high in 2007 for
both sectors. During this period, the debt
multiples for larger transactions were higher
and increased more rapidly than the debt
multiples for middle market transactions.
Chart VI illustrates the other side of the
coin — the decreasing liquidity cushion that
these companies had to service their debt.
After interest coverage ratios increased
during the last period of economic weakness
(1999-2002), these ratios began a steady
decline in 2003, reaching a ten-year low of
1.7x in 2007.
Confidential & Trade Secret ©2008 Do not circulate or publish. 5
Deb
t/EB
ITD
A Ra
tio
6
5
4
3
2
1
0
1997 1998 1999 2000 2001 2002 2003 2004 2005 2006 2007
4.8 4.7
4.0 3.9 3.8
4.7 4.6
5.6
4.1
3.4
4.2
Chart V Average Debt Multiples of Middle Market Corporate LBO Loans(i.e., Issuers with EBITDA < $50MM)
Source: Standard & Poor’s LCD
Chart VI (EBITDA-CAPEX)/Cash Interest
Source: Standard & Poor’s Leveraged Buyout Review
3.5
3.0
2.5
2.0
1.5
1.0
0.5
0.0
1997 1998 1999 2000 2001 2002 2003 2004 2005 2006 2007
1.8
3.1 2.9
2.1 2.01.7
2.5
2.8
1.82.0 1.9

Confidential & Trade Secret ©2008 Do not circulate or publish.6
Strategic Impacts on the Buyout Market
The increasing availability of large
amounts of debt over the past four years
has transformed the private equity buyout
markets in other critical ways. Over the
past twenty-five years, small buyout funds
have tended to outperform large buyout
funds, as demonstrated in the bottom half of
Chart VII, which shows time horizon return
trends for U.S. buyout funds through 2002.
The differentiated performance between
smaller and larger buyout funds is intuitive.
Though returns for small buyout funds
are often volatile, their target companies
are smaller and often not professionally
managed, leaving fund managers ample
scope to improve company-level operations
and increase earnings.
As detailed in the top half of Chart VII,
larger funds inverted this trend over the
last five years. They began to utilize their
deeper relationships with large financial
intermediaries and their power in the
capital markets fully to finance buyouts
of increasingly larger target companies.
Chart VII Investment Horizon Performance in the U.S. Market (Small vs. Large Buyouts)
As of 12/31/07
Fund Size 1 Year 3 Year 5 Year 10 Year 20 Year
Small Buyouts 15.00 7.30 8.10 4.20 11.90
Medium Buyouts 28.60 12.80 12.00 9.40 12.60
Large Buyouts 25.40 11.40 15.00 7.90 12.80
Mega Buyouts 25.40 15.10 16.50 9.10 12.30
All Buyouts 25.40 14.00 15.50 8.60 12.40
As of 12/31/02
Fund Size 1 Year 3 Year 5 Year 10 Year 20 Year
Small Buyouts -0.80 -1.30 1.00 11.20 16.50
Medium Buyouts -1.30 -5.10 7.40 12.00 18.70
Large Buyouts -4.10 -5.50 1.70 10.10 12.10
Mega Buyouts -4.30 -4.90 0.00 7.80 9.30
All Buyouts -3.90 -4.80 1.30 9.30 12.30
Source: Venture Economics
Definitions: Small Buyouts = Funds less than $250 million in commitments Medium Buyouts = Funds greater than $250 million and less than $500 million in commitments Large Buyouts = Funds greater than $500 million and less than $1 billion in commitments Mega Buyouts = Funds greater than $1 billion in commitments

Confidential & Trade Secret ©2008 Do not circulate or publish. 7
Financial engineering techniques such as
rapid dividend recapitalizations came to
the fore, allowing funds quickly to generate
distributions and increase interim internal
rates of return. These strategies worked well
in the period of high liquidity that existed for
the last four years.
The increasing attractiveness of buyout
returns reflected in Chart VII and the
formation of true Mega Buyout funds (funds
with committed capital of more than $10
billion), led to a surge in buyout fundraising.
Chart VIII tracks the long-term trends in
buyout fundraising in the U.S. — the most
developed fundraising market. After a
volatile period from 1999 through 2003,
each year since 2005 has seen a new record
for buyout fundraising. The increased capital
along with the availability of increasing
leverage to support this capital made the
largest buyout funds dominant players in the
capital markets and enabled these funds,
whether alone or in club deals, to acquire
companies that were previously out of reach
for private equity buyout funds.
The surge in buyout fundraising coincided
with the rise of Mega Buyout funds. These
vehicles became dominant factors in
global M&A markets as well as in private
equity fundraising. A number of these fund
managers became global asset managers
as well, with separate vehicles addressing
real estate, hedge funds, mezzanine and
distressed debt.
Chart VIII Commitments to U.S. Corporate Finance Private Equity Partnerships
Source: Private Equity Analyst, January 2008
$ in
bill
ions
250
200
150
100
50
0
1993 1994 1995 1996 1997 1998 1999 2000 2001 2002 2003 2004 2005 2006 2007
9.2
60.0
41.250.2
43.528.533.0
78.7
14.0 21.6 21.3 28.5
111.5
180.0205.4
Confidential & Trade Secret ©2008 Do not circulate or publish.8
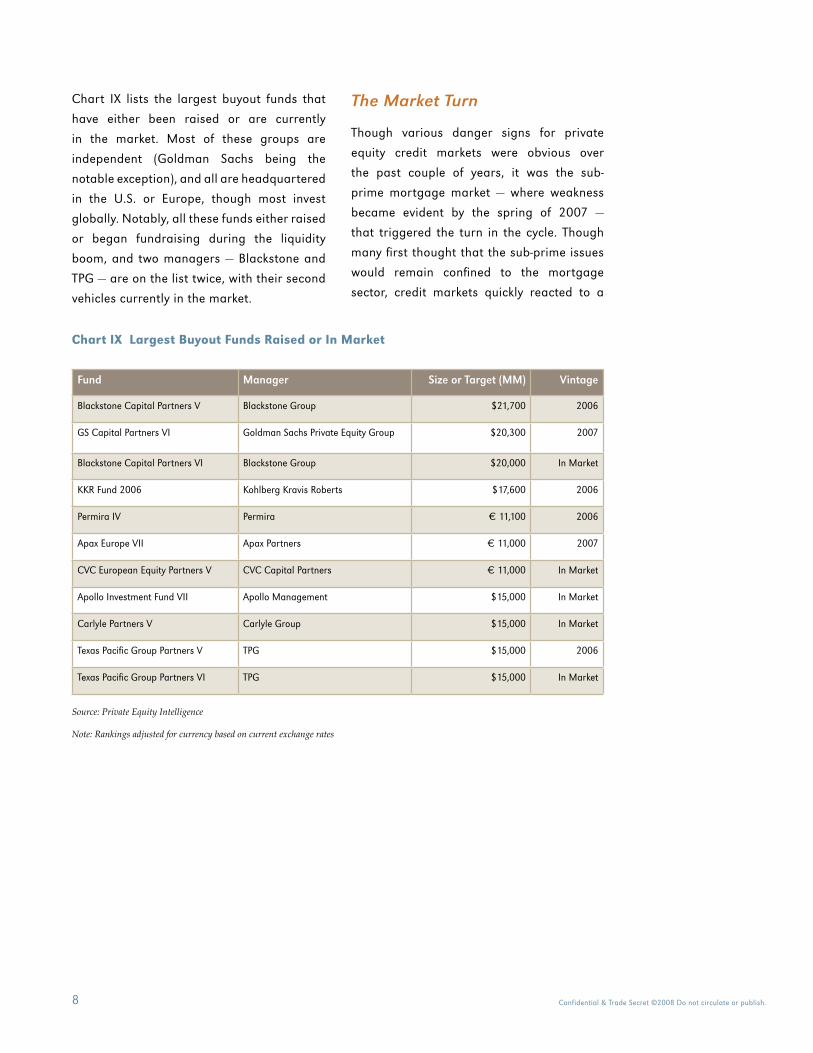
Chart IX Largest Buyout Funds Raised or In Market
Source: Private Equity Intelligence
Note: Rankings adjusted for currency based on current exchange rates
Chart IX lists the largest buyout funds that
have either been raised or are currently
in the market. Most of these groups are
independent (Goldman Sachs being the
notable exception), and all are headquartered
in the U.S. or Europe, though most invest
globally. Notably, all these funds either raised
or began fundraising during the liquidity
boom, and two managers — Blackstone and
TPG — are on the list twice, with their second
vehicles currently in the market.
The Market Turn
Though various danger signs for private
equity credit markets were obvious over
the past couple of years, it was the sub-
prime mortgage market — where weakness
became evident by the spring of 2007 —
that triggered the turn in the cycle. Though
many first thought that the sub-prime issues
would remain confined to the mortgage
sector, credit markets quickly reacted to a
Fund Manager Size or Target (MM) Vintage
Blackstone Capital Partners V Blackstone Group $21,700 2006
GS Capital Partners VI Goldman Sachs Private Equity Group $20,300 2007
Blackstone Capital Partners VI Blackstone Group $20,000 In Market
KKR Fund 2006 Kohlberg Kravis Roberts $17,600 2006
Permira IV Permira € 11,100 2006
Apax Europe VII Apax Partners € 11,000 2007
CVC European Equity Partners V CVC Capital Partners € 11,000 In Market
Apollo Investment Fund VII Apollo Management $15,000 In Market
Carlyle Partners V Carlyle Group $15,000 In Market
Texas Pacific Group Partners V TPG $15,000 2006
Texas Pacific Group Partners VI TPG $15,000 In Market

Confidential & Trade Secret ©2008 Do not circulate or publish. 9
more general questioning of previous credit
risk analyses. The credit markets began to
reassess and re-price risk broadly across the
full spectrum of investment classes.
Chart X shows the long-term trends for
spreads over treasuries for both high yield
and corporate bonds in the U.S. Noticeably,
during this last four-year period of increasing
debt issuance and decreasing credit quality,
spreads continued to decline. The sudden
sharp reversal of that trend in mid-2007
corresponds to the eruption of the sub-prime
mortgage crisis.
Furthermore, this renewed focus on risk had
specific impacts on private equity investing.
The sudden increase in credit spreads
detailed in Chart X hit many banks and other
credit issuers hard. Many of these entities
had underwritten loans in support of large
buyout transactions with the intent of widely
syndicating them. The sudden shift in the
credit markets resulted in many loans being
stuck or hung on lenders’ balance sheets.
The standard practice for lenders originating
these loans was not to hold them on their
books, but to generate syndication fee income
by quickly selling them to other parties, such
as hedge funds, CDOs and CLOs, once the
transaction closed. To win these lucrative
mandates, banks were required to use their
balance sheets to pre-commit the financing
at specific prices. The dramatic movement
in credit spreads left these banks with loans
and commitments that could only be sold at
significant losses. The result, as has become
evident, has been twofold: first, as banks
sought to renege on their under writings, a
number of transactions simply collapsed;
second, massive losses have been sustained
that lenders have been forced to recognize
on their books when these value-impaired
loans could not be sold at a profit.
Chart X Corporate Bond to Treasury Spreads
Source: Moody’s Investor Service
Basi
s Po
ints
1200
1000
800
600
400
200
0
Jan-90 Sep-92 Jun-95 Mar-98 Dec-00 Sep-03 Jun-06
High Yield Index Investment Grade Corporate Index
Confidential & Trade Secret ©2008 Do not circulate or publish.10
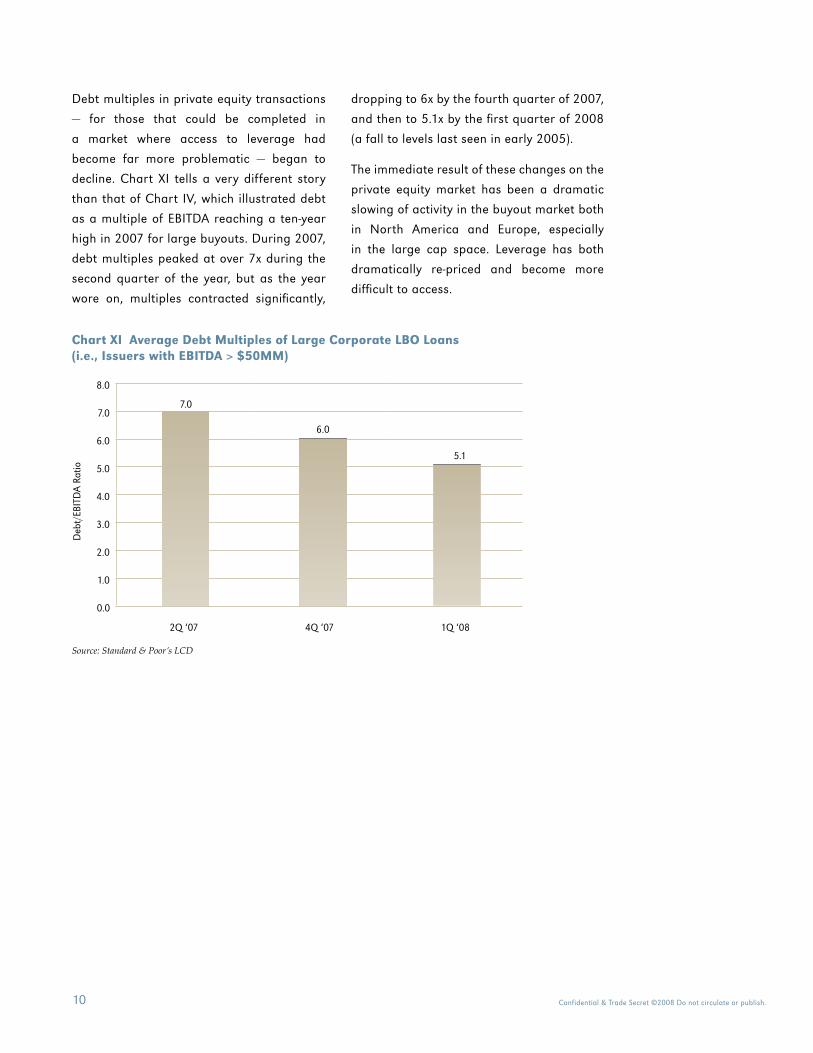
Debt multiples in private equity transactions
— for those that could be completed in
a market where access to leverage had
become far more problematic — began to
decline. Chart XI tells a very different story
than that of Chart IV, which illustrated debt
as a multiple of EBITDA reaching a ten-year
high in 2007 for large buyouts. During 2007,
debt multiples peaked at over 7x during the
second quarter of the year, but as the year
wore on, multiples contracted significantly,
dropping to 6x by the fourth quarter of 2007,
and then to 5.1x by the first quarter of 2008
(a fall to levels last seen in early 2005).
The immediate result of these changes on the
private equity market has been a dramatic
slowing of activity in the buyout market both
in North America and Europe, especially
in the large cap space. Leverage has both
dramatically re-priced and become more
difficult to access.
Chart XI Average Debt Multiples of Large Corporate LBO Loans (i.e., Issuers with EBITDA > $50MM)
Source: Standard & Poor’s LCD
Deb
t/EB
ITD
A Ra
tio
8.0
7.0
6.0
5.0
4.0
3.0
2.0
1.0
0.0
2Q ‘07 4Q ‘07 1Q ‘08
5.1
6.0
7.0
Confidential & Trade Secret ©2008 Do not circulate or publish. 11
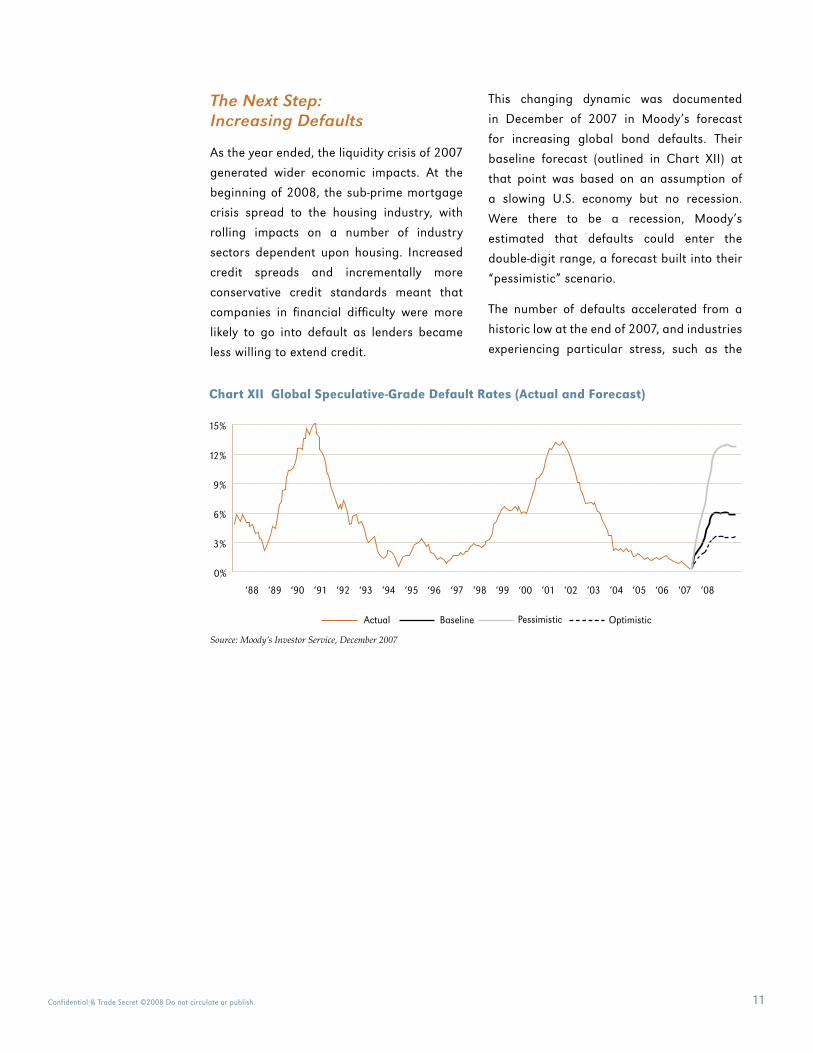
The Next Step: Increasing Defaults
As the year ended, the liquidity crisis of 2007
generated wider economic impacts. At the
beginning of 2008, the sub-prime mortgage
crisis spread to the housing industry, with
rolling impacts on a number of industry
sectors dependent upon housing. Increased
credit spreads and incrementally more
conservative credit standards meant that
companies in financial difficulty were more
likely to go into default as lenders became
less willing to extend credit.
This changing dynamic was documented
in December of 2007 in Moody’s forecast
for increasing global bond defaults. Their
baseline forecast (outlined in Chart XII) at
that point was based on an assumption of
a slowing U.S. economy but no recession.
Were there to be a recession, Moody’s
estimated that defaults could enter the
double-digit range, a forecast built into their
“pessimistic” scenario.
The number of defaults accelerated from a
historic low at the end of 2007, and industries
experiencing particular stress, such as the
15%
12%
9%
6%
3%
0%
‘88 ‘89 ‘90 ‘91 ‘92 ‘93 ‘94 ‘95 ‘96 ‘97 ‘98 ‘99 ‘00 ‘01 ‘02 ‘03 ‘04 ‘05 ‘06 ‘07 ‘08
OptimisticPessimisticBaselineActual
Source: Moody’s Investor Service, December 2007
Chart XII Global Speculative-Grade Default Rates (Actual and Forecast)

Confidential & Trade Secret ©2008 Do not circulate or publish.12
airline and retail industries, have seen a
number of high profile bankruptcies over
the last few months. A number of these
bankruptcies, such as Aloha Airlines, ATA,
Lillian Vernon and The Sharper Image, are
portfolio companies of private equity funds.
Through mid-March of 2008, 12 companies
with rated debt worth $9.6 billion had
defaulted on their debt. Though 22 companies
defaulted on rated debt in all of 2007,
the value of the debt that defaulted totaled
only $8.1 billion.
Chart XIII illustrates that the dramatic
spikes in default rates over the last thirty-
five years have been linked to periods of
economic recession. Since the creation
of the new issuance market for high yield
bonds in the 1980s, the last two spikes
in default rates in 1990-91 and 2001 hit
historic highs. Depending upon the depth
and length of the recession, Moody’s worst
case scenario today may be optimistic. As
of March 2008, Dr. Altman’s worst case
scenario forecasts that defaults could peak
at 16%, a historic high.
Periods of Recession: 11/73-3/75, 1/80-7/80, 7/81-11/82, 7/90-3/91, 4/01-12/01
Source: Edward Altman (NYU Salomon Center) & National Bureau of Economic Research
Chart XIII Historical Default Rates and Recession Periods in the U.S. High Yield Bond Market, 1972-2007
14%
12%
10%
8%
6%
4%
2%
0%
1972 1974 1976 1978 1980 1982 1984 1986 1988 1990 1992 1994 1996 1998 2000 2002 2004 2006

Confidential & Trade Secret ©2008 Do not circulate or publish. 13
The increase in the issuance of “junk” bonds
(those rated as single B- or lower) noted
previously in Chart III shows that in the past
four years almost half of the newly issued
bonds have been rated as “junk” at their
outset. Chart XIV shows the danger of default
inherent in these bonds based upon long-
term historical trends, with 53.6% of CCC
rated bonds defaulting in just four years.
Over the last five years, defaults on “junk”
bonds have been much lower than the
long-term trends detailed above would
have predicted, and forecasts of default by
sources like Dr. Altman and Moody’s, which
depend upon technical analysis, have been
higher than what has actually occurred. In
retrospect, these deviations from the norm
can be explained by nuances in this recent
cycle: given the large amount of liquidity in
the market over the recent five-year period,
a number of bonds that would normally
have defaulted were refinanced, while more
recently the rise of “covenant-lite” bonds
meant that, for these debt issuers, any event
short of a failure to pay interest would not
result in a default.
At this point, decreased market liquidity and
increasingly conservative credit standards
mean that these historic default rates
are likely to recur, supporting the more
pessimistic forecasts.
Source: Edward Altman (NYU Salomon Center)
Chart XIV Default Lag After Issuance: B & CCC Rated Corporate Bonds
1 2 3 4 5 6 7 8 9 10
20%18%16%14%12%10%8%6%4%2%0%
B Ratings CCC Ratings
Years After Issuance
2.8%
6.7%
7.9%
15.3%
18.7%
11.7%
4.1%
9.3%
5.8%8.2%
5.7% 4.7%7.3% 8.4%6.0%
4.3% 3.9%2.4%
1.9%1.0%
Confidential & Trade Secret ©2008 Do not circulate or publish.14
Ramifications for Private Equity
Of all the sectors of the private equity industry,
the buyout sectors in North America and
Europe are most dependent upon leverage.
The problems in buyout portfolios are just
becoming apparent, and the final impact on
fund returns has yet to be appreciated.
At the Probitas Partners’ Distressed Debt and
Restructuring Roundtable, both Dr. Altman
and the participating fund managers
expected that the level of defaults would be
modest early in 2008, building in the latter
half of the year and into 2009. Perhaps only
in early 2009 will the full extent of problems
be evident. The participating fund managers,
conversely, believe that only into 2009 will
the full extent of the opportunities that they
are seeing become evident.
The extent of future problems for buyout
funds was made evident in Standard & Poor’s
latest quarterly update on its “Weakest
Links” list covering those debt instruments
rated B- or lower that either have a Negative
Outlook or are on Creditwatch with Negative
implications. An analysis by Buyouts
magazine in March revealed that 42 out of
the 114 firms on the list (or nearly 37%) were
portfolio companies of private equity funds.
Most of these companies are based in North
America, reflecting the fact that 82% of the
names on the overall list are U.S. companies,
with another 6% based in Canada.
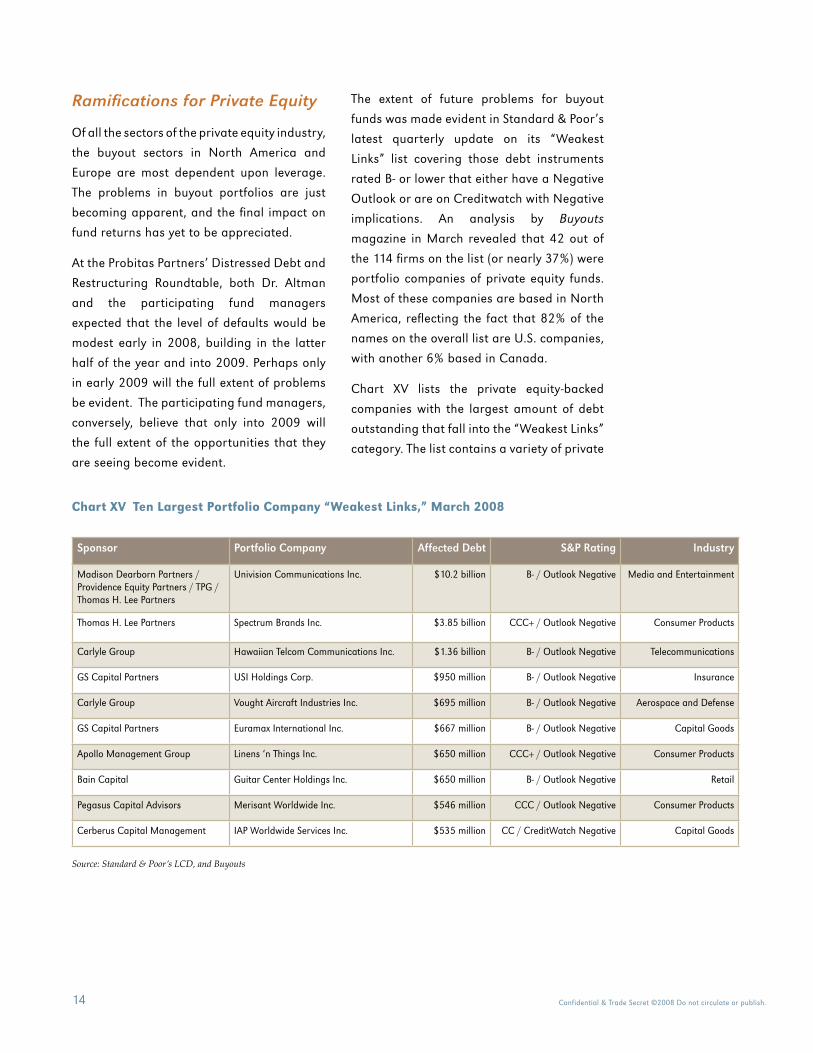
Chart XV lists the private equity-backed
companies with the largest amount of debt
outstanding that fall into the “Weakest Links”
category. The list contains a variety of private
Chart XV Ten Largest Portfolio Company “Weakest Links,” March 2008
Source: Standard & Poor’s LCD, and Buyouts
Sponsor Portfolio Company Affected Debt S&P Rating Industry
Madison Dearborn Partners / Providence Equity Partners / TPG / Thomas H. Lee Partners
Univision Communications Inc. $10.2 billion B- / Outlook Negative Media and Entertainment
Thomas H. Lee Partners Spectrum Brands Inc. $3.85 billion CCC+ / Outlook Negative Consumer Products
Carlyle Group Hawaiian Telcom Communications Inc. $1.36 billion B- / Outlook Negative Telecommunications
GS Capital Partners USI Holdings Corp. $950 million B- / Outlook Negative Insurance
Carlyle Group Vought Aircraft Industries Inc. $695 million B- / Outlook Negative Aerospace and Defense
GS Capital Partners Euramax International Inc. $667 million B- / Outlook Negative Capital Goods
Apollo Management Group Linens ‘n Things Inc. $650 million CCC+ / Outlook Negative Consumer Products
Bain Capital Guitar Center Holdings Inc. $650 million B- / Outlook Negative Retail
Pegasus Capital Advisors Merisant Worldwide Inc. $546 million CCC / Outlook Negative Consumer Products
Cerberus Capital Management IAP Worldwide Services Inc. $535 million CC / CreditWatch Negative Capital Goods

Confidential & Trade Secret ©2008 Do not circulate or publish. 15
equity sponsors and companies operating in
a number of industry sectors, though three of
the ten are consumer products companies.
The month of April itself was difficult for
airlines and their private equity backers.
Though not on the “Weakest Links” list
because they lacked publicly traded bonds,
three small U.S.-based airlines sponsored by
private equity firms ceased operations during
the month: Aloha Airlines (Yucaipa), ATA
(MatlinPatterson), and Eos Airlines (Golden
Gate Capital, Maveron, and Sutter Hill). All
three were impacted by the combination of
recession, high fuel prices, and unforgiving
debt markets. By the beginning of May,
Apollo’s Linens ‘n Things moved from the
“Weakest Links” list into bankruptcy court.
As 2008 unfolds, we see an increasing number
of defaults impacting buyout funds, especially
those from vintages 2005 and 2006. Which
funds will be most impacted at this point is
difficult to determine, but a deep and long
lasting recession will have significant impact
and will, of course, extend beyond buyouts.
For example, even low leverage users like
venture funds are not immune. Volatility in the
public markets related to the recession has
already had an impact on the IPO markets
and on the plans of venture firms to exit long-
held investments using the public markets.
Distressed Debt & Restructuring Funds: The Other Side of the Coin
Amidst this environment of gloom and
doom, Distressed Debt and Turnaround
fund managers see 2008 and 2009 as
vintage years of opportunity. As noted
previously, managers in both these sectors
forecast an increasingly attractive investment
environment as we move through this
year and into 2009. Fundraising in these
sectors began to increase substantially in
2006 (Chart XVI) in anticipation of a turn in
the credit markets and set a new record in
2007. The fundraising pace quickened as the
opportunity became clearer at the turn of the
year. Through April 30, 2008, fundraising in
these sectors has already matched that for
all of 2007.
Source: Private Equity Intelligence/Probitas Partners
Chart XVI Distressed/Turnaround Fundraising
45.0
$ in
bill
ions
40.0
35.0
30.0
25.0
20.0
15.0
10.0
5.0
0.0
2003 2004 2005 2006 2007 April 2008
0.14 5.23
1.00 6.86
1.61 8.70
3.99 15.34
9.60 29.41
0.64 38.46
Distressed Turnaround

Confidential & Trade Secret ©2008 Do not circulate or publish.16
Fundraising in these sectors is not over.
Chart XVII lists the ten largest funds
currently in the market in the sector. These
funds are seeking a total of $28 billion and,
when combined with the smaller funds in the
market, upwards of $37 billion is being sought
for distressed and turnaround strategies.
It is worthwhile considering “how much is
enough,” especially in certain strategies such
as Distressed Debt Trading where hedge
funds are particularly active. Both Chart XVI
and Chart XVII track activity for investment
vehicles utilizing private equity structures.
The amount of money available in hedge
funds for trading strategies is not included in
these figures.
The bulk of the funds in Chart XVII are
headquartered in and focused on the U.S.
— as are the names on the “Weakest Links”
list. Though there are companies in Europe
experiencing difficulties, forecasts to date of
defaults in Europe have been lower than in
the U.S., in large part because leverage was
not as aggressively used. The ultimate impact
of a U.S. recession on the world economy and
the ripple effects, not only in Europe but in
the rest of the world, remain unclear, but we
expect to see detrimental impacts globally.
Year-to-date public markets in every country
have been volatile, and most stock indices
have produced losses in anticipation of
difficult times ahead.
Source: Private Equity Intelligence/ Probitas Partners
Chart XVII Largest Distressed Debt and Restructuring Funds in Market, May 2008
Fund Manager Type Size (MM)
Texas Pacific Group Special Opportunities Fund
TPG Restructuring 7,000 USD
Cerberus International Fund IV Cerberus Capital Management Distressed Debt 4,000 EUR
Avenue Special Situations V Avenue Capital Group Distressed Debt 4,000 USD
OCM Opportunities Fund VII Oaktree Capital Management Distressed Debt 3,000 USD
TCW Mortgage Credit Opportunity Fund
TCW Group Distressed Debt 3,000 USD
Blackstone Distressed Opportunities Fund II
Blackstone Group Distressed Debt 2,500 USD
Wayzata Investment Partners II
Wayzata Investment Partners Distressed Debt 2,500 USD
H.I.G. Bayside Debt and LBO Fund II
HIG Capital Distressed Debt 2,000 USD
OCM European Principal Opportunities Fund II
Oaktree Capital Management Distressed Debt 1,250 EUR
Schultze Master Fund Schultze Asset Management Distressed Debt 1,500 USD

Confidential & Trade Secret ©2008 Do not circulate or publish. 17
Other Opportunities in Private Equity
Distressed Debt and Restructuring funds
represent the obvious immediate investment
opportunities in private equity with the turn
in the credit cycle, but there are others. The
need for leverage in this market has increased
investor interest in Mezzanine funds and
other current income vehicles. Though the
current lack of leverage in the market is not
permanent but part of the overall credit
cycle, the availability of leverage is likely
to be low for at least two to three years
(especially when compared to the period
2005 through mid-2007). This environment
provides Mezzanine funds and current
income vehicles (that are unburdened by
problem-plagued legacy portfolios) with an
attractive investment environment that will
extend beyond 2008.
A number of credit dislocation funds have
also been raised over the last few months.
These vehicles were opportunistically raised
to target the purchase of hung loans at
the heart of the liquidity crisis, seeking to
purchase these loans at a discount from
lenders that could no longer syndicate them
at par value. These funds do not represent
a new sub-asset class, as new inventory of
hung loans is not being created, but they
are temporary capital pools addressing a
unique opportunity. These vehicles do have
some of the attributes of both mezzanine
and distressed debt funds and, interestingly,
a number of them have been raised by
Mega Buyout groups who helped create the
inventory in the first place.
Other investors are developing a renewed
interest in smaller buyout funds. As
detailed in Chart VII, the long-term trend
in buyout returns before the recent liquidity
boom favored smaller funds. A number of
investors speculate that a more normal
credit environment will favor smaller buyouts
on a go-forward basis, with their focus on
operating improvements generating
increased earnings viewed as a more
stable way to generate returns — if the fund
manager has the right skill set.
Secondary funds have also seen an upsurge
in interest. Investors anticipate a rerun of the
2001 to 2003 period, when the bursting of the
Internet Bubble led to dramatically increased
secondary sales as investors coped with
the resulting problems. The year 2007 was
the largest ever for secondary fundraising,
with $15.1 billion of commitments closed.
Nearly double that amount is currently being
sought by secondary funds in anticipation of
increased sales activity.
Many investors are also considering whether
they are over-allocated to Mega Buyout funds,
especially in the 2005 and 2006 vintages. In
order to increase their exposure to current
attractive investment opportunities, these
investors have or are considering selling
down a portion of their positions in these
vintage year funds in the secondary market
and freeing up capital for future investment.

Confidential & Trade Secret ©2008 Do not circulate or publish.18
Confidential & Trade Secret ©2008 Do not circulate or publish. 19
Five years of rapid growth driven by extremely liquid markets whose players had increasingly lost their risk discipline came to an abrupt end in the second half of 2007. Traditional measures of credit risk analysis are now back in vogue, and those tools of finance indicate that the markets in general, and private equity in particular, are in for increasingly difficult times, with more bankruptcies and other similar distress situations looming.
There are several impacts of this change in the credit markets on private equity:
• Legacy Buyout Portfolios: In the private equity sector, legacy buyout portfolios heavily dependent upon large amounts of leverage, especially those in vintages 2005 and 2006, are at particular risk for increasing bankruptcies and poor performance. Distributions from these portfolios to investors have slowed considerably and will remain slow.
• Distressed Debt and Restructuring Opportunities: Funds in these sectors are likely to find increasing opportunities as 2008 progresses, but fundraising levels in the sector, especially in Distressed Debt Trading strategies, where hedge funds are very active, may be worrisome.
• Fresh Buyout Investing: Legacy buyout portfolios will have their problems. Buyout fund managers with “dry powder” may find more interesting opportunities as the year progresses and seller price expectations begin to moderate. Leverage will continue to be difficult (and more expensive) to access, but fund managers, especially those investing with smaller funds with strategic focus and operating expertise, are likely to find increasing opportunities. Mega Buyout funds that are more dependent upon financial engineering are likely to find control investing more difficult as long as the drought in leverage lasts, especially when compared to the easier period of 2004 through mid-2007.
• Other Areas of Private Equity: For other areas of private equity, the major issue is not debt but the economic slowdown and how this impacts their specific plans. New Mezzanine funds and current income vehicles, for example, are likely to benefit by providing a scarce commodity — debt — while increasing energy prices are likely to continue to buoy that sector of the economy even as others falter.
• Secondary Activity: Interest in the secondary market is increasing, both from limited partners seeking to invest in secondary funds that will benefit from a more active secondary market and from investors seeking to use the market to rebalance their portfolio allocations in advance of a major re-pricing in the market.
C o n c l u s i o n

S a n F r a n c i s c o 425 California Street
Suite 2300
San Francisco, CA 94104
Tel 1 415 402 0700
Fax 1 415 402 0052
N e w Yo r k 1251 Avenue of the Americas
Suite 2390
New York, NY 10020
Tel 1 212 403 3662
Fax 1 212 403 3537
L o n d o n
Dudley House
36-38 Southampton Street
1st Floor
London WC2E 7HF
Tel 44 20 7280 5801
Fax 44 20 7280 1866