Embed Size (px)
Citation preview
The Creation of Baranca de Caliza:
Excavation of the Canyon Lake Spillway Gorge, Comal County Texas, July 2002
By:
Forrest D. Wilkerson and Ginger L. Schmid
Department of Geography
Minnesota State University - Mankato
Geography 4430 & 5430
Field Methods Class
Texas State University - San Marcos, Fall 2002
Cynthia Agold, Charles W. Bickham, Stephanie Brzozowski, Gregg Chalk,
Eric Chandler, Aaron Ciarkowski, Virginia Cox, Kevin Deal, Saundra Edwards,
Frank Engel, Ronnie Herrera, Naoko Ishida, Colin Johnson, Natalie Mazaheri,
David Nicosia, Skyler North, Bradford O’Brien, Marian O’Brien, Komal Patel,
Nevada Smith, Trish Thode, Veronica Vazquez, and Amylia Williams.
An occasional paper for
The James and Marilyn Lovell Center for Natural Hazards Research.
Department of Geography
Texas State University – San Marcos
i
FORWARD
The research and written summary presented in this paper represent a class project started
in September 2002 and completed in mid-December of that year. Student research was limited to
two and one-half days in the field and any supporting data were restricted to what was available
during that time period. Given the timeliness of this project, there are discrepancies between the
preliminary data presented here (e.g. rainfall totals and stream discharge) and later official totals.
In the spirit of the purpose of this research as a student project, and to emphasis that preliminary
data are just that, the original summary has not been changed to reflect the data released at later
dates. In this process, we hope that our readers will remember that even in this age of nearly
instantaneous electronic information, accurate data from reliable government agencies should not
be expected to be available instantaneously, especially in the weeks immediately following
natural disasters such as the flooding in the Canyon Lake area.
ii
TABLE OF CONTENTS
List of Figures .......................................................................................................................iii
List of Tables ........................................................................................................................iv
Abstract .................................................................................................................................v
Introduction ..........................................................................................................................1
Canyon Lake Reservoir and Dam ......................................................................................6
Canyon Lake’s Flood History .............................................................................................9
The 2002 Flood Event ......................................................................................................10
Methods and Results ............................................................................................................14
Global Positioning System ..............................................................................................14
Longitudinal Profile .........................................................................................................17
Cross-Section Profiles .....................................................................................................19
Headward Erosion of the Spillway ..................................................................................25
Spring Locations ..............................................................................................................27
Sketching, Field Notes, and Photographic Methods ........................................................31
GIS Modeling ...................................................................................................................32
Conclusions ...........................................................................................................................36
Acknowledgements ..............................................................................................................38
Works Cited ..........................................................................................................................39
Appendix A ...........................................................................................................................42
Appendix B ...........................................................................................................................60
Appendix C ...........................................................................................................................63
iii
List of Figures
Figure Page
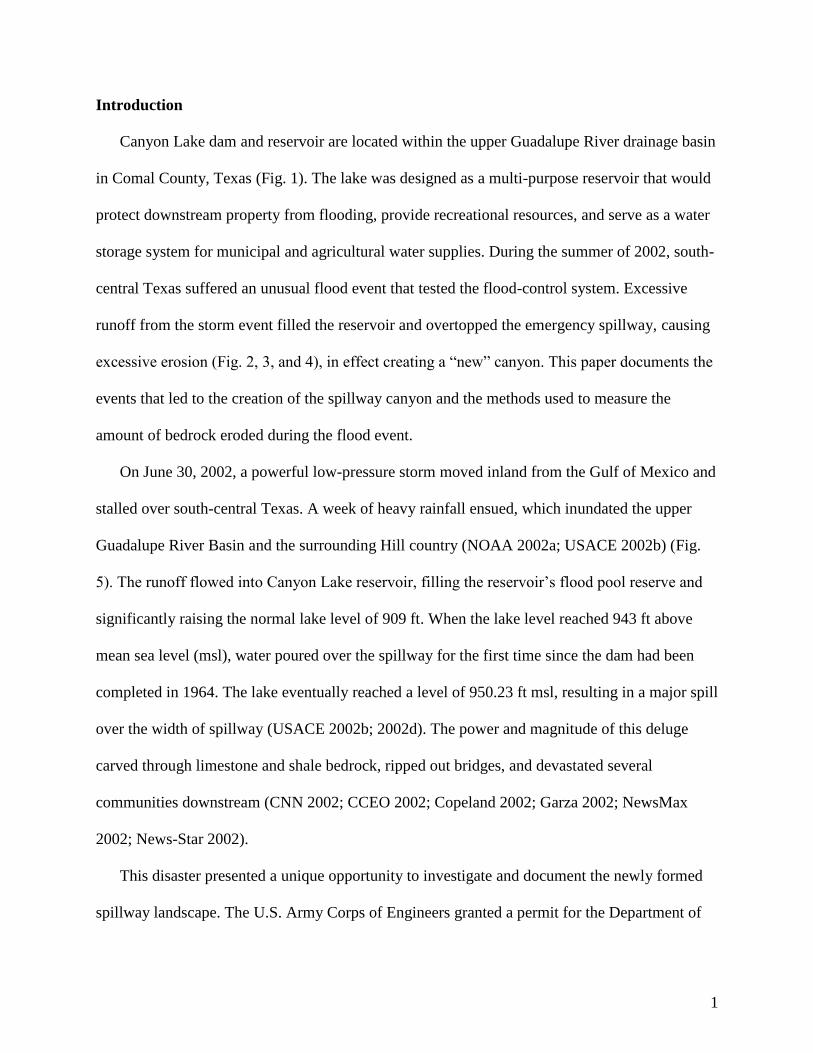
1. The location of the upper Guadalupe River drainage basin and Canyon Lake Reservoir....... 2
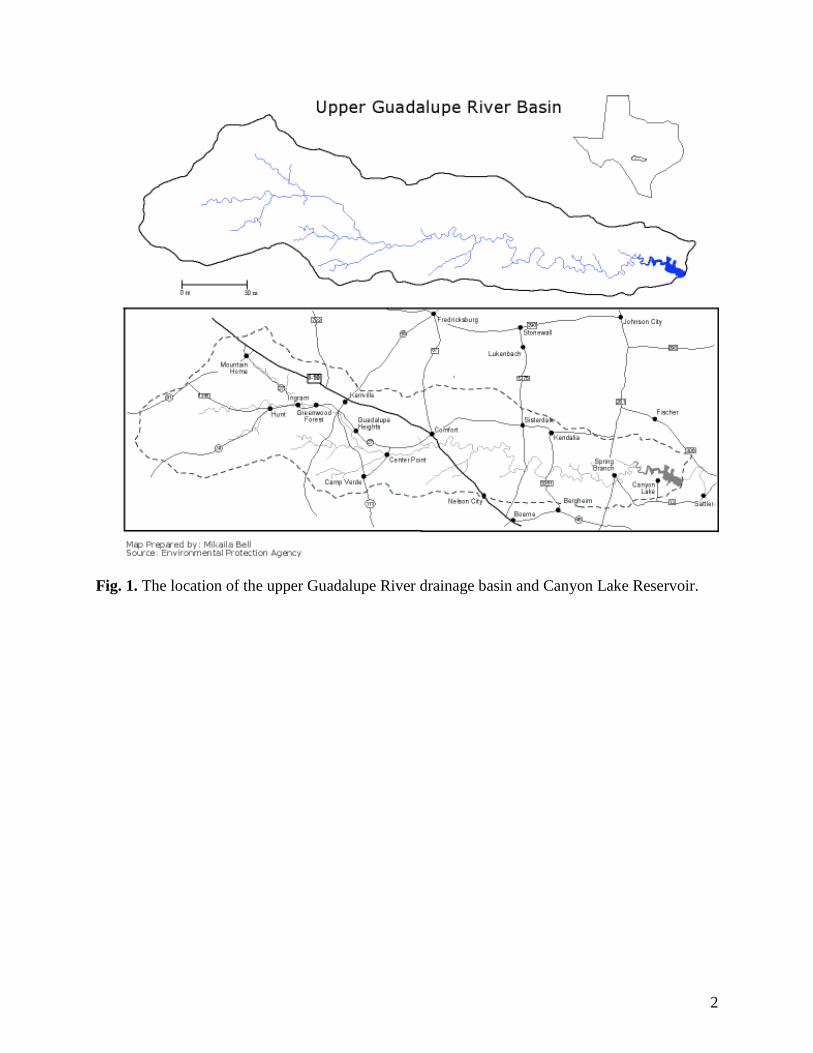
2. An aerial photograph of the newly eroded canyon. ..................................................................3
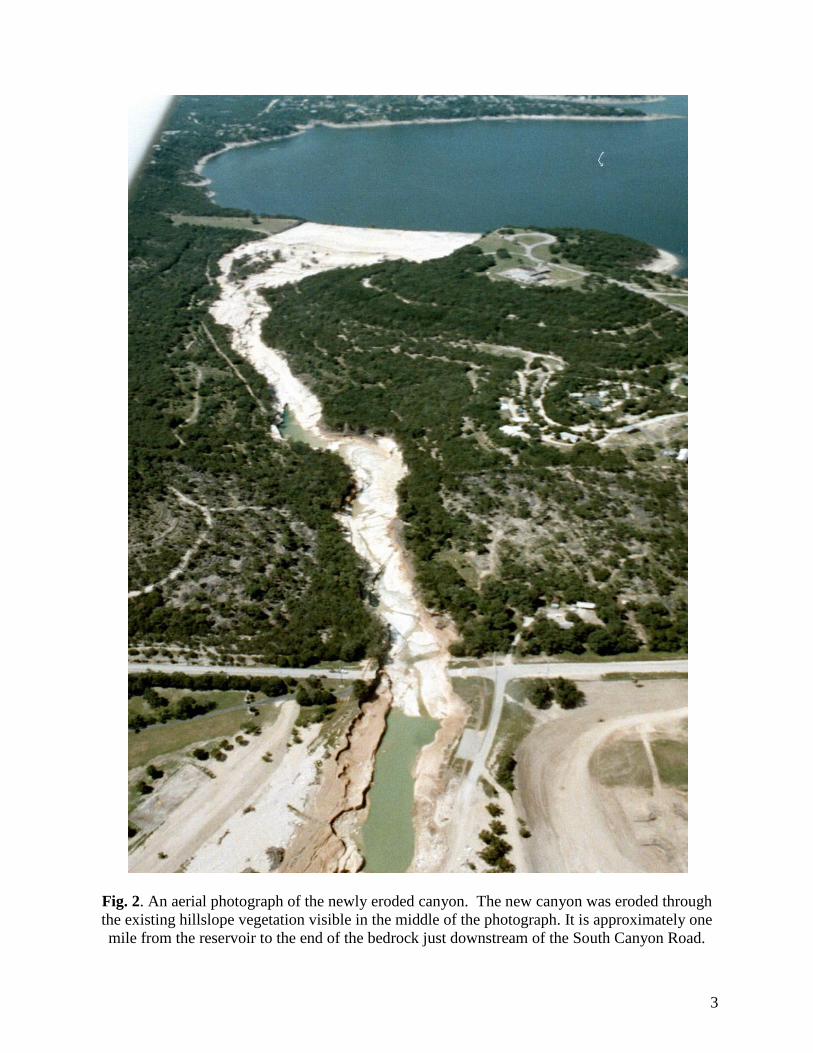
3. Erosion in the upper reaches of the spillway canyon. ...............................................................4
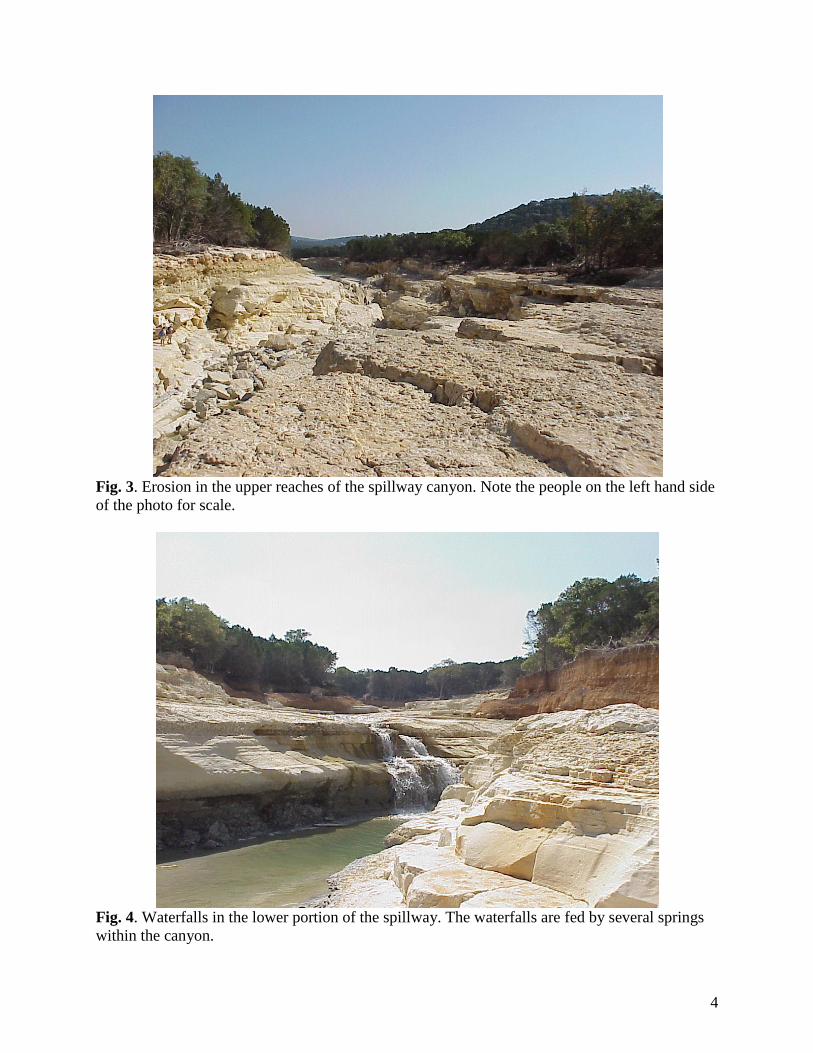
4. Waterfalls in the lower portion of the spillway. .......................................................................4
5. A map of rainfall totals for south-central Texas for June 30 to July 6, 2002. ..........................5
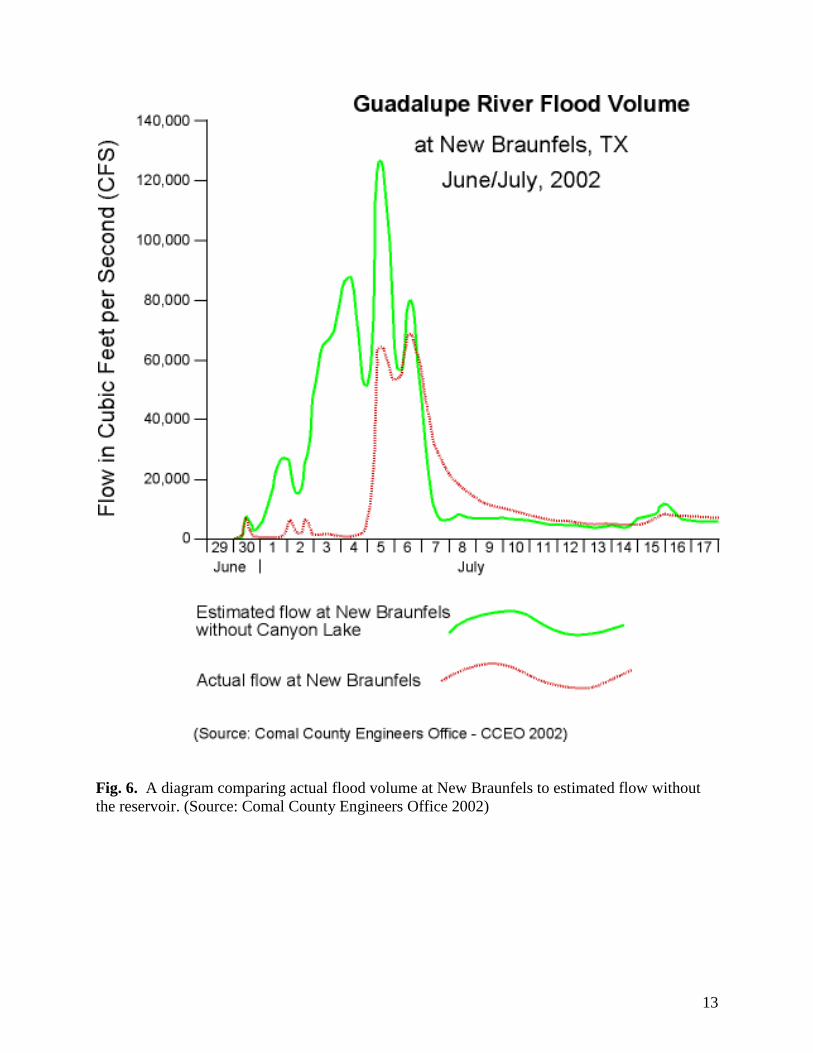
6. A diagram comparing actual flood volume at New Braunfels to estimated flow without the
reservoir. ............................................................................................................................................13
7. A 1995 Digital Orthophoto Quadrangle (DOQ) of the Canyon Lake spillway area. ...............17
8. Sighting the stadia rod in the upper stretches of the canyon.....................................................18
9. The longitudinal profile of the channel thalweg. ......................................................................20
10. A sample of the profile data sheet used for describing field measurements along the
longitudinal transect. ..........................................................................................................................21
11. A sample of the field data sheet used to record the cross sectional measurements. .................23
12. Erosion along the downstream edge (drop-off) of the spillway. ..............................................25
13. The telescopic level set up near the spillway sill on October 14, 2002. ...................................26
14. A geologic cross section of the Glen Rose Formation that comprises the spillway ................29
15. The location of the springs relative to the channel profile........................................................30
16. A comparison of the field based cross section and the GIS derived cross section. ..................33
17. The net loss of material predicted by the GIS model. ...............................................................34
18. The TIN created to represent the eroded material from the canyon. ........................................35
19. The completed GIS model including all of the data points. .....................................................36
iv
List of Tables
Table Page
1. A comparison of major storms that have impacted the Canyon Lake reservoir ..........................9
2. Summary of methods used to estimate volume of bedrock eroded .............................................15
3. Spring locations and elevations. ..................................................................................................28
4 . The results of the cross section measurements. ...........................................................................37
iv
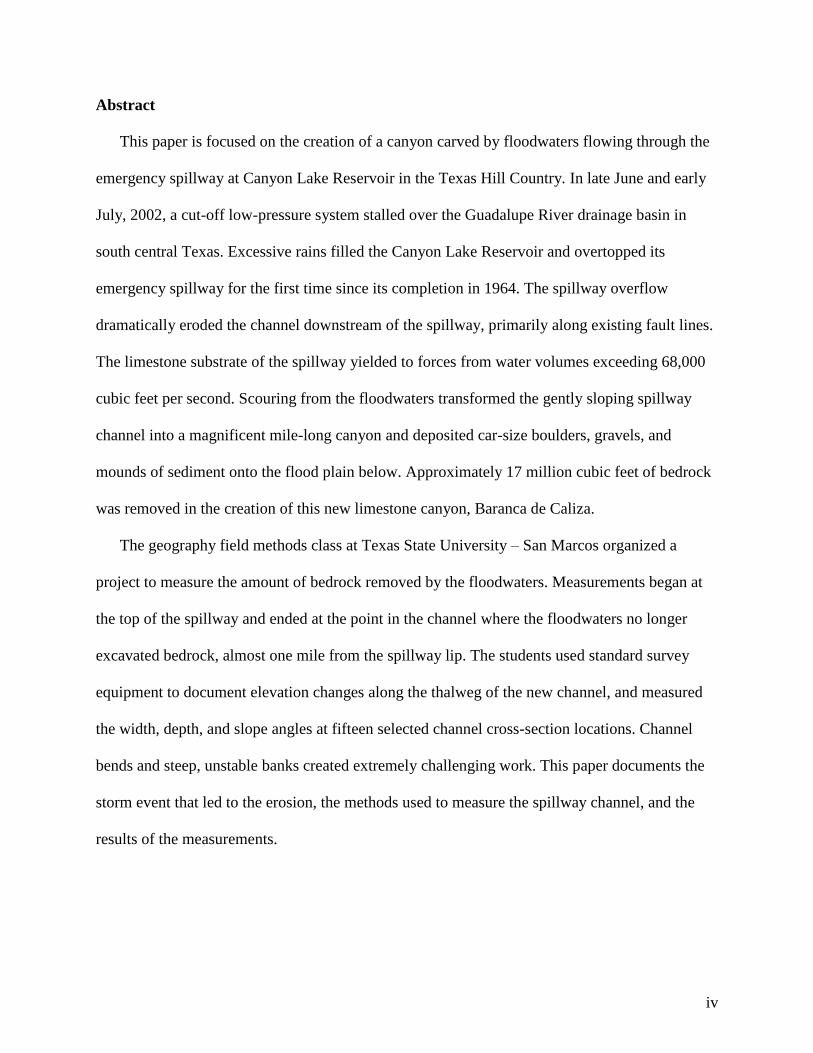
Abstract
This paper is focused on the creation of a canyon carved by floodwaters flowing through the
emergency spillway at Canyon Lake Reservoir in the Texas Hill Country. In late June and early
July, 2002, a cut-off low-pressure system stalled over the Guadalupe River drainage basin in
south central Texas. Excessive rains filled the Canyon Lake Reservoir and overtopped its
emergency spillway for the first time since its completion in 1964. The spillway overflow
dramatically eroded the channel downstream of the spillway, primarily along existing fault lines.
The limestone substrate of the spillway yielded to forces from water volumes exceeding 68,000
cubic feet per second. Scouring from the floodwaters transformed the gently sloping spillway
channel into a magnificent mile-long canyon and deposited car-size boulders, gravels, and
mounds of sediment onto the flood plain below. Approximately 17 million cubic feet of bedrock
was removed in the creation of this new limestone canyon, Baranca de Caliza.
The geography field methods class at Texas State University – San Marcos organized a
project to measure the amount of bedrock removed by the floodwaters. Measurements began at
the top of the spillway and ended at the point in the channel where the floodwaters no longer
excavated bedrock, almost one mile from the spillway lip. The students used standard survey
equipment to document elevation changes along the thalweg of the new channel, and measured
the width, depth, and slope angles at fifteen selected channel cross-section locations. Channel
bends and steep, unstable banks created extremely challenging work. This paper documents the
storm event that led to the erosion, the methods used to measure the spillway channel, and the
results of the measurements.
1
Introduction
Canyon Lake dam and reservoir are located within the upper Guadalupe River drainage basin
in Comal County, Texas (Fig. 1). The lake was designed as a multi-purpose reservoir that would
protect downstream property from flooding, provide recreational resources, and serve as a water
storage system for municipal and agricultural water supplies. During the summer of 2002, south-
central Texas suffered an unusual flood event that tested the flood-control system. Excessive
runoff from the storm event filled the reservoir and overtopped the emergency spillway, causing
excessive erosion (Fig. 2, 3, and 4), in effect creating a “new” canyon. This paper documents the
events that led to the creation of the spillway canyon and the methods used to measure the
amount of bedrock eroded during the flood event.
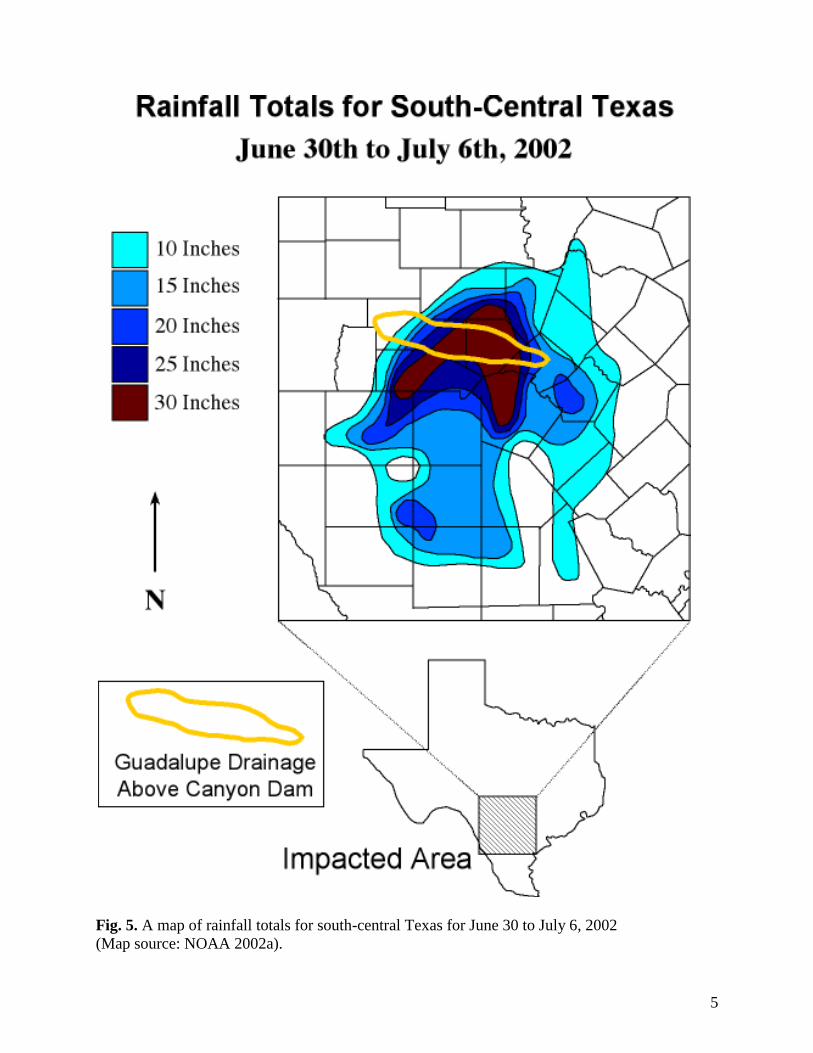
On June 30, 2002, a powerful low-pressure storm moved inland from the Gulf of Mexico and
stalled over south-central Texas. A week of heavy rainfall ensued, which inundated the upper
Guadalupe River Basin and the surrounding Hill country (NOAA 2002a; USACE 2002b) (Fig.
5). The runoff flowed into Canyon Lake reservoir, filling the reservoir’s flood pool reserve and
significantly raising the normal lake level of 909 ft. When the lake level reached 943 ft above
mean sea level (msl), water poured over the spillway for the first time since the dam had been
completed in 1964. The lake eventually reached a level of 950.23 ft msl, resulting in a major spill
over the width of spillway (USACE 2002b; 2002d). The power and magnitude of this deluge
carved through limestone and shale bedrock, ripped out bridges, and devastated several
communities downstream (CNN 2002; CCEO 2002; Copeland 2002; Garza 2002; NewsMax
2002; News-Star 2002).
This disaster presented a unique opportunity to investigate and document the newly formed
spillway landscape. The U.S. Army Corps of Engineers granted a permit for the Department of
2
Fig. 1. The location of the upper Guadalupe River drainage basin and Canyon Lake Reservoir.
3
Fig. 2. An aerial photograph of the newly eroded canyon. The new canyon was eroded through
the existing hillslope vegetation visible in the middle of the photograph. It is approximately one
mile from the reservoir to the end of the bedrock just downstream of the South Canyon Road.
4
Fig. 3. Erosion in the upper reaches of the spillway canyon. Note the people on the left hand side
of the photo for scale.
Fig. 4. Waterfalls in the lower portion of the spillway. The waterfalls are fed by several springs
within the canyon.
5
Fig. 5. A map of rainfall totals for south-central Texas for June 30 to July 6, 2002
(Map source: NOAA 2002a).
6
Geography at Texas State University - San Marcos to study the newly formed canyon. The field
methods class accessed and conducted research within the spillway canyon on September 28,
October 14, and October 20, 2002. The main objective of this investigation was to determine
how much bedrock was eroded during the flood event. The methods used to determine the
volume of eroded bedrock included a survey transect down the length of the new channel, cross-
section measurements at 300-foot intervals, and GPS (Global Positioning System) mapping. The
researchers involved in this project were Texas State University - San Marcos geography
students and faculty, (Wilkerson and Schmid now at Minnesota State University - Mankato), and
US Army Corps of Engineers specialists in geology and hydrology. In the spring of 2003 the
geography field methods class led by Professor Rich Earl conducted a detailed mapping and
analysis of the concrete spillway structure (Earl et al. 2003).
Canyon Lake Reservoir and Dam
Canyon Lake is located on the Guadalupe River, 16 miles northwest of the city of New
Braunfels in Comal County, Texas (Fig. 1). Construction of Canyon Dam began in 1958 and was
completed in 1964, at a total cost of $20.2 million (Eckhardt 2002, USACE 2002a). The lake
covers a total of 8,230 acres, with a maximum depth of 125 ft (USACE 2002c). The surrounding
perimeter of the lake is composed of steep, rocky banks and oak and juniper forests. The water
within Canyon Lake is relatively clear, which is a typical characteristic of a highland reservoir
(Texas Parks and Wildlife 2002). The average depth of Texas lakes is 43 ft, which makes
Canyon Lake one of the deepest lakes in Texas.
The dam and spillway were both built by the U.S. Army Corps of Engineers. Spillways are
hydraulic structures built to divert floodwater when a reservoir is at its maximum capacity.
7
Larger spillways are constructed to accommodate areas impacted by more frequent large floods.
Modern dam engineers are focusing on the emergency spillway designs to help solve dam
failures and lower flood damage and probable risk (Sentürk 1994). The dam is operated by the
Army Corps of Engineers (USACE) and the Guadalupe-Blanco River Authority (GBRA)
(Broker 2002; Eckhardt 2002; Handbook of Texas 2002b; USACE 2002a). The GBRA controls
the “conservation pool” (the lake level up to 909 ft msl), and diverts the discharge through a new
hydroelectric plant at the base of the dam when releases are between 200 and 1100 cfs. The
construction of the plant began in August 1978, and service began in February 1989. The GBRA
also uses the reservoir for irrigation, industry, and water supplies, and presently shares the cost of
the operation and maintenance of the dam with the U.S. government (USACE 2002a).
Canyon Dam was built to control floodwaters originating from the 1,432 square miles of the
Guadalupe River drainage lying above the dam. Enhanced flood protection was necessary
because the lower Guadalupe River basin is more susceptible to flooding than the upper portion
of the basin. The channel of the upper Guadalupe River above Canyon Lake has a bankful flood
capacity 40,000 to 50,000 cubic feet per second (cfs), while the lower river has a bankful
capacity of only 13,000 to 30,000 cfs. The U.S. Army Corps of Engineers is responsible for
controlling water in the reservoir’s “flood pool” (area 909-943 ft msl), which captures
floodwaters and helps to protect the land downstream from flooding (USACE 2002a).
The addition of the dam and reservoir has strengthened the economy of the surrounding
communities by introducing recreation and tourism to the area. Residents and tourists support a
variety of businesses and service industries that have transformed the former farm and ranch
communities of Sattler and Startzville into small commercial centers and helped create the new
town of Canyon City (Handbook of Texas 2002a; 2002c; 2002d, 2002e). The Guadalupe River
8
supports more water recreation than any other river in Texas (Young 2002). Communities along
the river and around Canyon Lake thrive on income from tourism associated with the river,
including tube and raft rentals, camping, lodging, dining, and other services. New Braunfels
alone receives $200 million every year from approximately 200,000 river visitors, with over
forty percent of these annual revenues gained in the months of July and August (Young 2002).
The communities along Canyon Lake and the Guadalupe River suffered great economic
losses not only from property damage, but from businesses closed due to river conditions during
summer and fall of 2002. According to Judy Young, director of the Convention and Visitors
Bureau at the New Braunfels Chamber of Commerce, this flood hit “the peak weekend of the
peak month of the peak season”. Recreational use of the Guadalupe was banned for the
remainder of 2002, with the exception of some kayaking by special permission. While the full
impact of the flood has not been assessed, the sales taxes generated in August were down 9%
from normal for the city of New Braunfels (Young 2002).
Tourism income is so important to the city of New Braunfels that the Convention and
Visitor’s Bureau has developed a comprehensive emergency communication plan. The plan is
designed to ensure that potential tourists understand exactly what has been affected in an
emergency, and what has not. During the flood specially trained public relations personnel and
volunteers were dispatched to make sure that potential tourists understood that non-water tourism
was still in business. The staff of the New Braunfels chamber of commerce also worked for 43
days straight, including answering the toll free Chamber of Commerce number, available 24
hours 7 days a week (Young 2002).
9
Canyon Lake’s Flood History
Canyon Lake has experienced heavy flooding on several occasions since it was completed in
1964. The Army Corps of Engineers has estimated that the water would reach the spillway
approximately every 70 to 85 years, and the Federal Emergency Management Agency (FEMA)
has estimated the 100-year flood event (a flood event that has a one percent statistical probability
of occurring in any given year) would raise lake levels to 946 ft, which is three feet above the
spillway (USACE 2002a). Canyon Lake’s first major flood event occurred in August 1978, when
40 inches of rain fell over a two day period on the upper Guadalupe River (Table 1). Water
flowed into the lake at 115,000 cfs, causing the lake to rise to 21.6 ft above the conservation pool
level of 909 ft. The lake reached a final of elevation of 930.6 ft msl (USACE 2002a, 2002d). The
dam prevented an estimated $24 million of downstream damage.
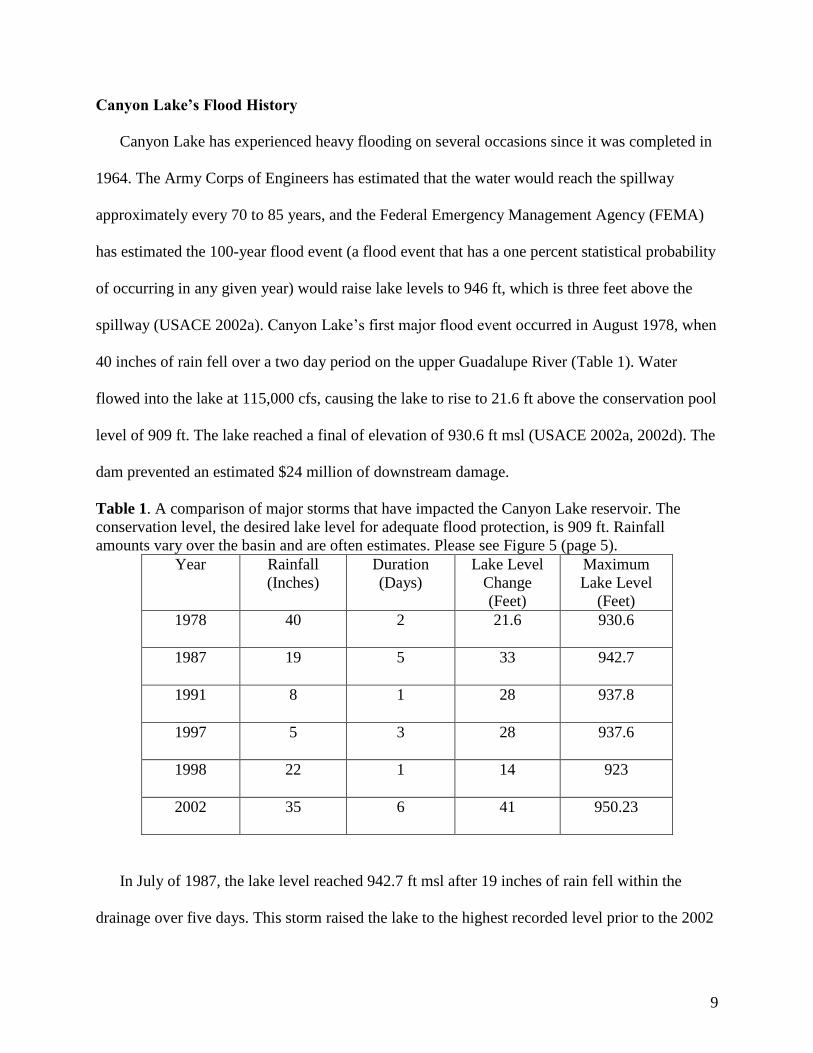
Table 1. A comparison of major storms that have impacted the Canyon Lake reservoir. The
conservation level, the desired lake level for adequate flood protection, is 909 ft. Rainfall
amounts vary over the basin and are often estimates. Please see Figure 5 (page 5).
Year Rainfall
(Inches)
Duration
(Days)
Lake Level
Change
(Feet)
Maximum
Lake Level
(Feet)
1978 40 2 21.6 930.6
1987 19 5 33 942.7
1991 8 1 28 937.8
1997 5 3 28 937.6
1998 22 1 14 923
2002 35 6 41 950.23
In July of 1987, the lake level reached 942.7 ft msl after 19 inches of rain fell within the
drainage over five days. This storm raised the lake to the highest recorded level prior to the 2002
10
storm. In 1991, flooding caused the lake to reach 937.8 ft msl, and a similar flood in late July-
early August 1997 reached a maximum elevation of 937.6 ft msl (USACE 2002c; 2002d). In
October of 1998, one most intense storms to ever strike central Texas hit the Guadalupe River
basin. This storm was the result of the overriding moisture from hurricanes Lester and Madeline
in the Pacific Ocean, combined with a mid-latitude cold front associated with an atmospheric
trough of low pressure in the western United States. Approximately 22 inches of rainfall was
recorded in western Comal County during a 24-hour period. The stream gauge station at the
Guadalupe River in New Braunfels (downstream of the dam) on October 22, 1998 registered a
maximum stream flow of 220,000 cfs, almost four times higher than its previous highest
recorded flow of 56,000 cfs in September 1921 (GBRA 1998; Slade and Persky 1999). It is
interesting to note that there was no water released from Canyon Lake during the 1998 storm and
that the stream flow of 220,000 cfs was generated within the 14 miles of drainage between New
Braunfels and the reservoir. Please refer to Earl et al. (2003) for more up-to-date flows and
discharge data.
The 2002 Flood Event
Beginning on June 30, 2002 a strong low-pressure system stalled over the Guadalupe River
drainage in south-central Texas. By July 6 rainfall totals had reached more that 35 inches in
some areas and drenched 33,000 square miles in the San Antonio and Austin areas. Between
June 30 and July 6, the average rainfall over the Canyon Lake watershed was approximately 22
inches (NOAA 2002a; 2002b)(Fig. 5). On July 4th
, 2002 water from Canyon Lake began to flow
over the 1237 foot-wide spillway, which is adjacent to the southern end of the dam, and
continued to flow over the spillway until August 12, 2002 (USACE 2002b). During the night of
11
July 4th
, the water levels flowing through the spillway rose to impressive levels, excavating most
of the spillway canyon before morning. Continued heavy runoff swelled the lake to a record high
level of 950.23 ft msl on July 6, 2002, more than four feet higher than the predicted 100-year
event (Garza 2002; USACE 2002b). The maximum discharge reached 66,880 cfs, and was
approximately seven feet and four inches above the spillway (USACE 2002a). During the length
of the 2002 flood, approximately 700,000 acre-feet of water entered Canyon Lake reservoir,
enough to fill the Canyon Lake flood pool (the area between 909 and 943 ft msl) at least twice
(USACE 2002b). The conservation storage capacity, the water between the lake bed and the
normal storage pool at 909 ft, is 382,000 acre ft (Handbook of Texas 2002a). An acre foot of
water, approximately 326,000 gallons, would fill one square acre to a depth of one foot.
The storm and subsequent flooding impacted the entire Guadalupe River watershed. The
death toll by July 7, 2002 was 12 people, and preliminary assessments showed at least 48,000
homes had to be evacuated (NOAA 2002b). On July 8, Governor Rick Perry predicted that
damage from the flooding would exceed $1 billion. Perry requested that an additional 17
counties be declared federal disaster areas, along with the 13 counties that President Bush had
previously declared (NewsMax 2002).
After pouring over the spillway and down the canyon, the flood waters re-entered the
Guadalupe River. The volume of water was great enough to fill the original river channel and
back the river upstream to the base of the dam. The backup of excess water near the dam outlet
(floodgate) forced the river level high enough so that it was able to direct water being released
through the floodgate onto the slopes that surround the outlet works. The boulders, concrete, and
other materials intended to protect the banks were then washed into the channel, forming a dam
in front of the outlet. The Army Corps, concerned about the erosion around the outlet, shut down
12
all releases from the floodgate. Water was not released through the floodgate again until July 26,
2002 (USACE 2002a). In order to release water through the floodgates, the Corps of Engineers
had to clear a channel through the rock, gravel and debris that had plugged the outlet channel.
The Army Corps of Engineers hired Phillips and Jordan Incorporated of North Carolina, through
an emergency contract, to remove the debris in the channel. Work began July 15 and was
completed July 26, 2002 (USACE 2002b).
The communities along Canyon Lake and the Guadalupe River suffered great economic
losses, not only from property loss and damage, but also from businesses forced to close due to
river conditions. Even though areas downstream of Canyon Lake suffered catastrophic flooding,
the damage would have been far greater if the reservoir had not been in place (Fig. 6). Without
the dam, it is estimated that flows in the Guadalupe would have crested three times, on July 4, 5,
and 6, 2002. Each crest would have exceeded 80,000 cfs, with a maximum discharge of over
126,000 cfs at New Braunfels. The observed peak at New Braunfels was approximately 70,000
cfs, which suggests that the dam and reservoir were able to successfully cut the maximum flow
nearly in half (CCEO 2002; USACE 2002b).
The geologic composition of the spillway is the Glen Rose Formation consisting of limestone
interbedded with shale. The shale is easily eroded which can undercut the limestone and make it
susceptible to headward erosion. This undercutting fractured and collapsed the more resistant
limestone and served to deepen and widen the channel (Whipple, Hancock, and Anderson 2000).
The erosion propagated along a series of main and splinter faults that are located throughout the
spillway area (USACE 1957). The splinter faults are areas of weakened rock that are more easily
eroded. Prior movement of the faults grinds and pulverizes the bedrock and makes it more
susceptible to erosion.
13
Fig. 6. A diagram comparing actual flood volume at New Braunfels to estimated flow without
the reservoir. (Source: Comal County Engineers Office 2002)
14
Methods and Results
After the floodwaters had receded and lake levels returned to the 909 ft conservation storage
level, the Army Corps was contacted by the instructors concerning a proposal to conduct
research within the newly excavated spillway canyon. The proposal outlined a project that would
use standard field techniques to measure the volume of the bedrock eroded from the spillway
canyon. The students and instructors from the field methods class, within the Department of
Geography at Texas State University - San Marcos, conducted the research. A variety of
techniques were employed to determine the amount of material removed, beginning with a
transect placed along the thalweg (the line of maximum depth along a channel) to determine
elevation change with distance downstream, and cross-sectional measurements at 300 foot
intervals along the transect line. Additional techniques included photographs tied to GPS
locations for repeat photography, spring locations, detailed mapping and geomorphic description
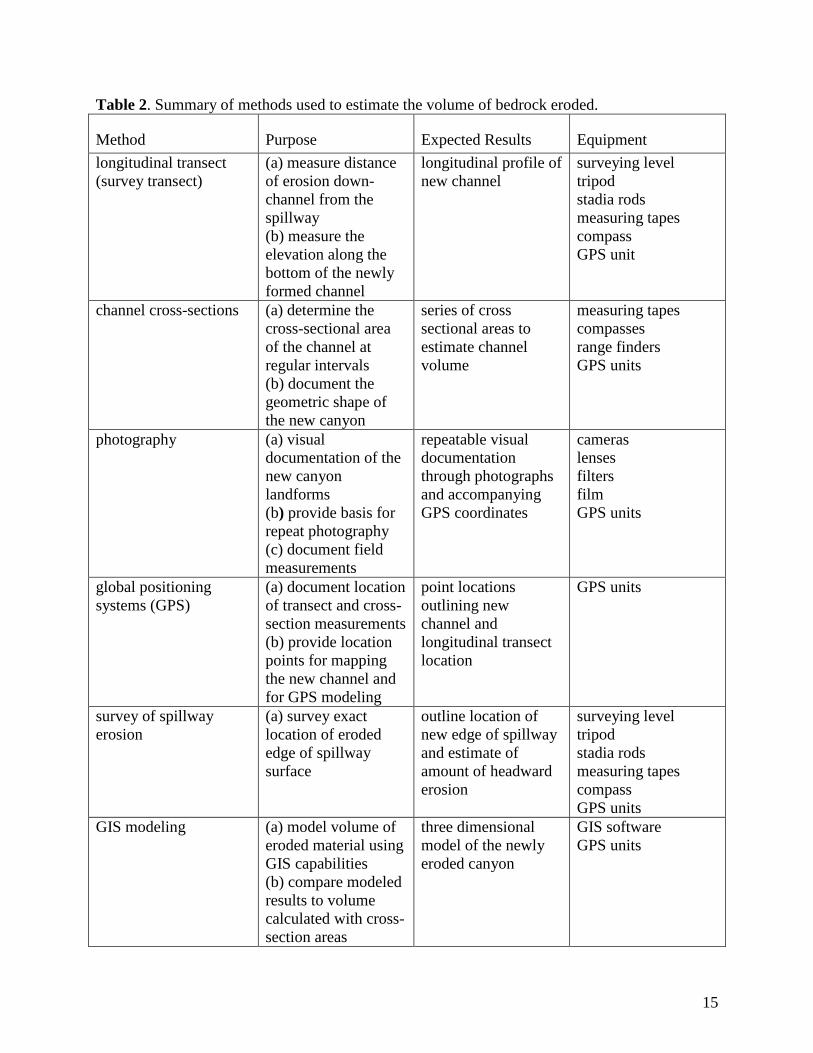
of the first big drop from the spillway, and GIS modeling of the eroded area. A breakdown of
each method and the instruments and applications used for the project is located in Table 2.
The class was divided into several teams in order to facilitate the large task of measuring the
spillway erosion. Teams included photographers, sketchers and notetakers, a GPS location crew,
two survey teams measuring the headward erosion of the spillway, one survey team measuring
the thalweg, and two cross-section teams set up on either side of the channel to take cross
sectional measurements at the end of each transect section.
Global Positioning System
In order to ensure that the research could be repeated, an exact location was recorded for
each significant location using a Global Positioning System (GPS) receiver. A GPS is a
15
Table 2. Summary of methods used to estimate the volume of bedrock eroded.
Method Purpose Expected Results Equipment
longitudinal transect
(survey transect)
(a) measure distance
of erosion down-
channel from the
spillway
(b) measure the
elevation along the
bottom of the newly
formed channel
longitudinal profile of
new channel
surveying level
tripod
stadia rods
measuring tapes
compass
GPS unit
channel cross-sections (a) determine the
cross-sectional area
of the channel at
regular intervals
(b) document the
geometric shape of
the new canyon
series of cross
sectional areas to
estimate channel
volume
measuring tapes
compasses
range finders
GPS units
photography (a) visual
documentation of the
new canyon
landforms
(b) provide basis for
repeat photography
(c) document field
measurements
repeatable visual
documentation
through photographs
and accompanying
GPS coordinates
cameras
lenses
filters
film
GPS units
global positioning
systems (GPS)
(a) document location
of transect and cross-
section measurements
(b) provide location
points for mapping
the new channel and
for GPS modeling
point locations
outlining new
channel and
longitudinal transect
location
GPS units
survey of spillway
erosion
(a) survey exact
location of eroded
edge of spillway
surface
outline location of
new edge of spillway
and estimate of
amount of headward
erosion
surveying level
tripod
stadia rods
measuring tapes
compass
GPS units
GIS modeling (a) model volume of
eroded material using
GIS capabilities
(b) compare modeled
results to volume
calculated with cross-
section areas
three dimensional
model of the newly
eroded canyon
GIS software
GPS units
16
navigation system developed by the Department of Defense originally for strategic military
applications. The GPS satellites orbit over 12,700 miles above Earth and transmit signals to
ground receiver stations located less than 300 miles apart over most of the world. The satellite
positions in space are precisely known, so the time it takes for the signal to travel from the
satellite to the receiver on the ground, multiplied by the speed of light, is the distance of the
receiver from the satellite. A minimum of four satellites is needed to synchronize the receiver’s
clock and locate the intersection of the satellites with a position on Earth. In order to obtain
accurate coordinate readings, differential correction was implemented to adjust travel time for
the most recent satellite ephemeris. Differential correction helps triangulate the position of the
receiver with a base station whose position is precisely known and helps to improve the accuracy
of the GPS position in the field. The ephemeris is a table that provides satellite locations at any
given day and time and also lists the nearest base stations within 300 miles of where the readings
were taken (Hurn 1993).
Three Trimble Geoexplorer GPS units were used to measure the thalweg and the left and
right cross-section end points. Smaller Garmin Etrex GPS units were used to document spring
and photograph locations. At each location, the Geoexplorer units took one hundred waypoints
(positions), so that differential correction could be used to help eliminate positional error. A
waypoint is a single location point and multiple waypoints were gathered to statistically increase
the accuracy of the position. The data were downloaded from the receivers and loaded into
Trimble GPS Pathfinder Office Software (2000). Post-processing and differential correction of
the positions allowed the accuracy to improve to less than five meters. The San Antonio base
station ephemeris was used for differential correction (TXDOT 2002). The GPS locations
ensured the repeatability and precision of the positional measurements obtained, so that they can
17
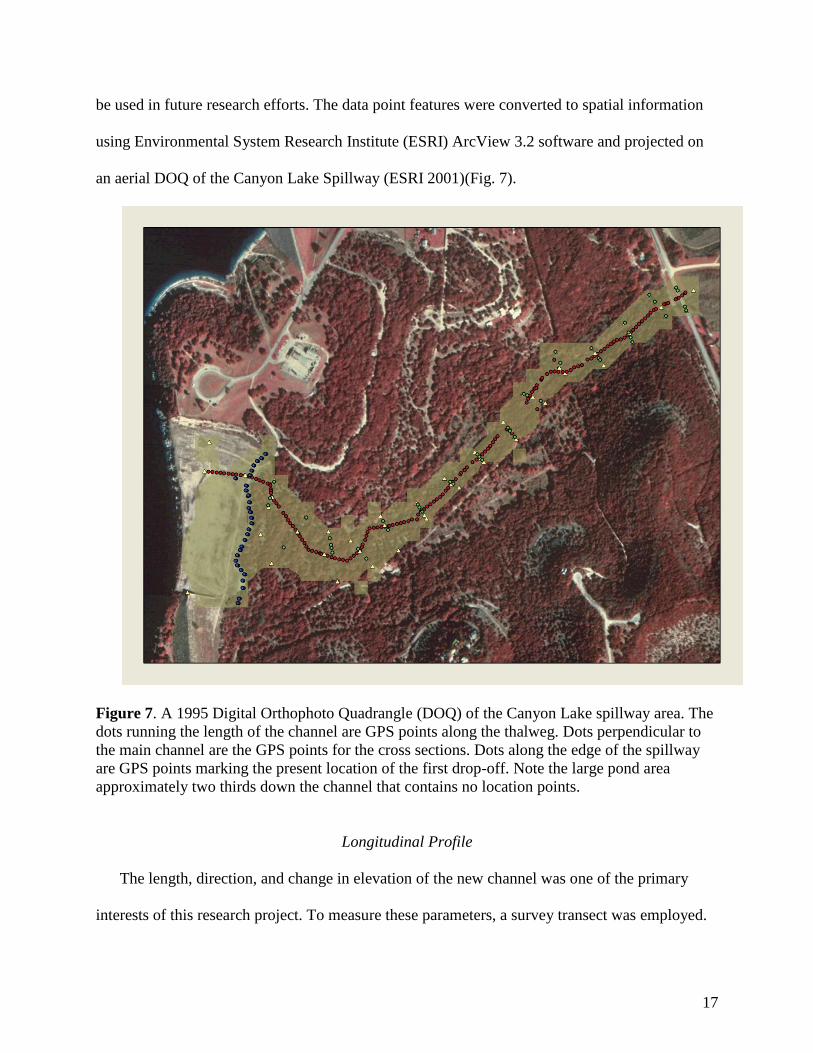
be used in future research efforts. The data point features were converted to spatial information
using Environmental System Research Institute (ESRI) ArcView 3.2 software and projected on
an aerial DOQ of the Canyon Lake Spillway (ESRI 2001)(Fig. 7).
Figure 7. A 1995 Digital Orthophoto Quadrangle (DOQ) of the Canyon Lake spillway area. The
dots running the length of the channel are GPS points along the thalweg. Dots perpendicular to
the main channel are the GPS points for the cross sections. Dots along the edge of the spillway
are GPS points marking the present location of the first drop-off. Note the large pond area
approximately two thirds down the channel that contains no location points.
Longitudinal Profile
The length, direction, and change in elevation of the new channel was one of the primary
interests of this research project. To measure these parameters, a survey transect was employed.
18
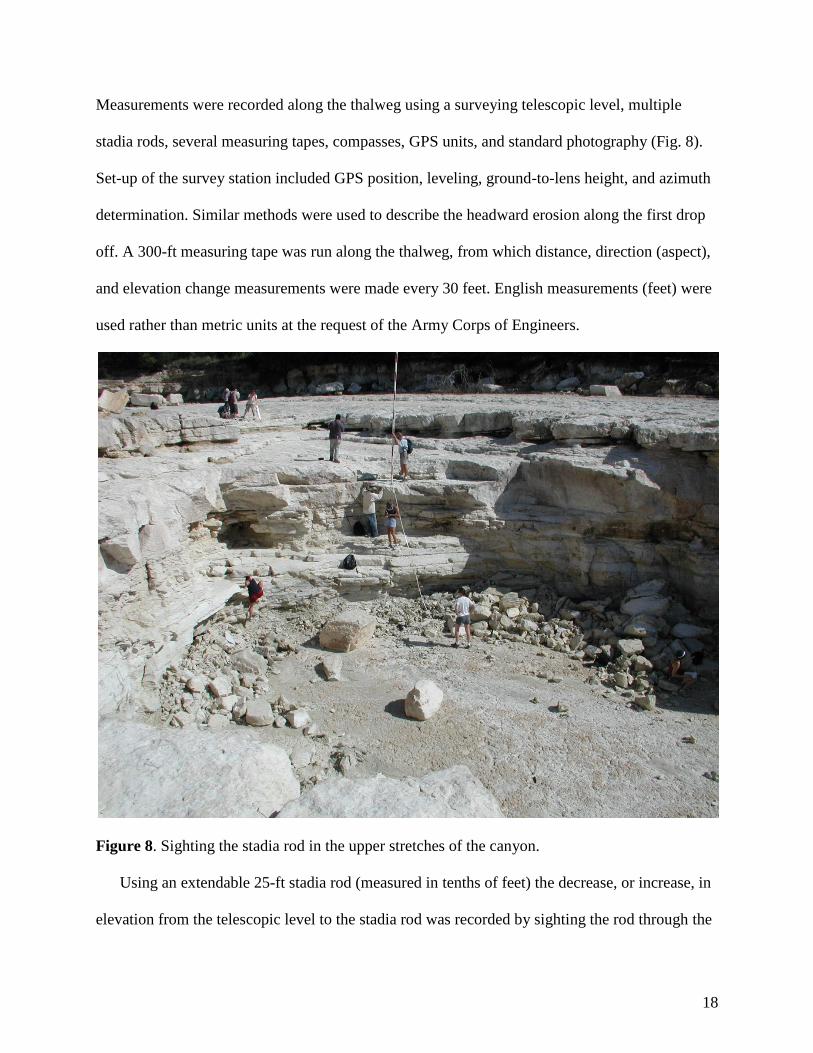
Measurements were recorded along the thalweg using a surveying telescopic level, multiple
stadia rods, several measuring tapes, compasses, GPS units, and standard photography (Fig. 8).
Set-up of the survey station included GPS position, leveling, ground-to-lens height, and azimuth
determination. Similar methods were used to describe the headward erosion along the first drop
off. A 300-ft measuring tape was run along the thalweg, from which distance, direction (aspect),
and elevation change measurements were made every 30 feet. English measurements (feet) were
used rather than metric units at the request of the Army Corps of Engineers.
Figure 8. Sighting the stadia rod in the upper stretches of the canyon.
Using an extendable 25-ft stadia rod (measured in tenths of feet) the decrease, or increase, in
elevation from the telescopic level to the stadia rod was recorded by sighting the rod through the
19
scope on the telescopic level. Readings from the upper and lower bounds of the scope were used
to double-check distance accuracy, while the middle reading was used to determine elevation. At
the end of the tape, or when the stadia rod could no longer be viewed through the transit sight,
the telescope level had to be moved. Using a plumb bob, it was possible to reposition the transect
station with the best possible accuracy on the spot where the last measurement was made. After
the machine was recalibrated for its new position, the tape was run out again and the
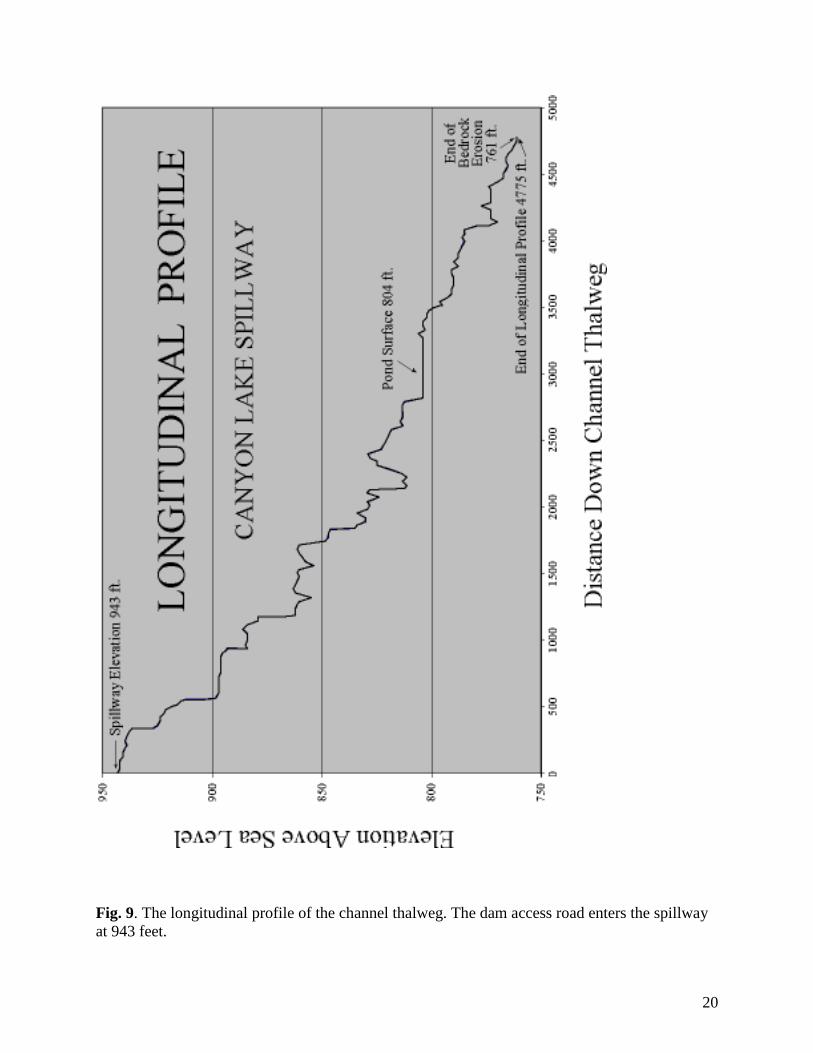
measurements continued. The result was a longitudinal profile of the channel thalweg (Fig. 9).
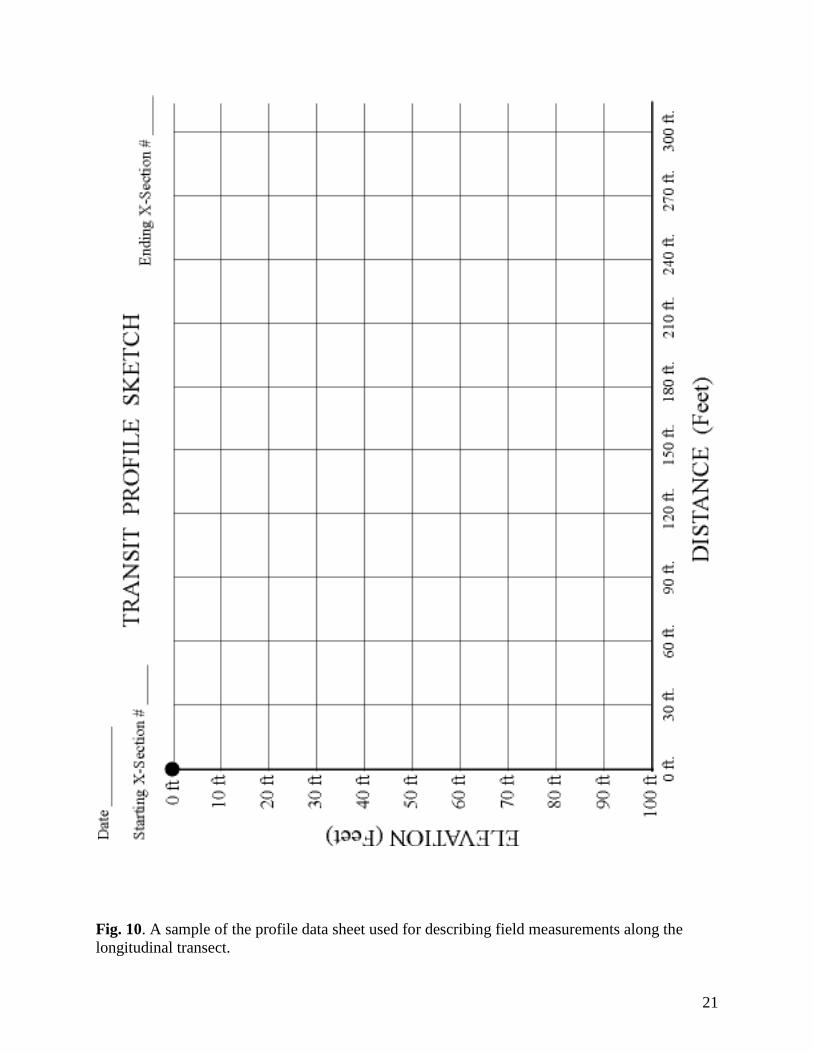
Measurements were made from 178 positions along the canyon floor and recorded onto a
profile data sheet (Fig. 10). Not all of the positions could be made at the prescribed 30-ft
increment due to several factors. Large rocks and ponds often restricted measuring areas along
the thalweg, which required the measurements to be modified. Occasionally, measurements were
made before or after the 30 ft increment due to topographic restrictions. In some cases, such as
the large pond (Fig. 7, Fig. 9), no measurements were recorded at all. Elevation change of steep
cliffs and slopes were recorded, while deep ponds were only recorded as flat surfaces. Focus and
limited range of the scope made some height determinations difficult, while the tilt and sway of
the stadia rod also introduced minor error in the measurements. Despite these factors,
measurements went smoothly throughout the procedure. Mistakes were minimal and many were
corrected on sight with little delay, adding to the reliability and precision of the longitudinal
profile.
Cross Section Profiles
A total of 15 cross-sections were measured along the length of the channel transect
(Appendix A). The cross section profiles were measured by both a left and right cross section
20
Fig. 9. The longitudinal profile of the channel thalweg. The dam access road enters the spillway
at 943 feet.
21
Fig. 10. A sample of the profile data sheet used for describing field measurements along the
longitudinal transect.
22
team at 300 foot intervals along the channel thalweg. The objective at each cross section was to
determine the bank length and slope, the distance and angle between the tops of the banks, and
the width of the channel bottom. Each cross section is a two-dimensional area of the canyon at
that point (Appendix A). Again, feet were substituted for metric measurements at the request of
the U.S. Army Corps of Engineers. The cross section teams began measurements at the second
longitudinal profile point location (600 feet downstream) because the first 300 feet of the transect
is located on the spillway ledge before the first drop off (Fig. 7).
At each GPS measurement location, channel thalweg and bank tops were also marked with a
stake and cairn (rocks stacked to act as a landmark) to ensure the successful relocation of original
positions when the canyon was accessed again in October. Again, three Geoexplorer GPS
handheld units were utilized to find the absolute locations of the center of the channel and the top
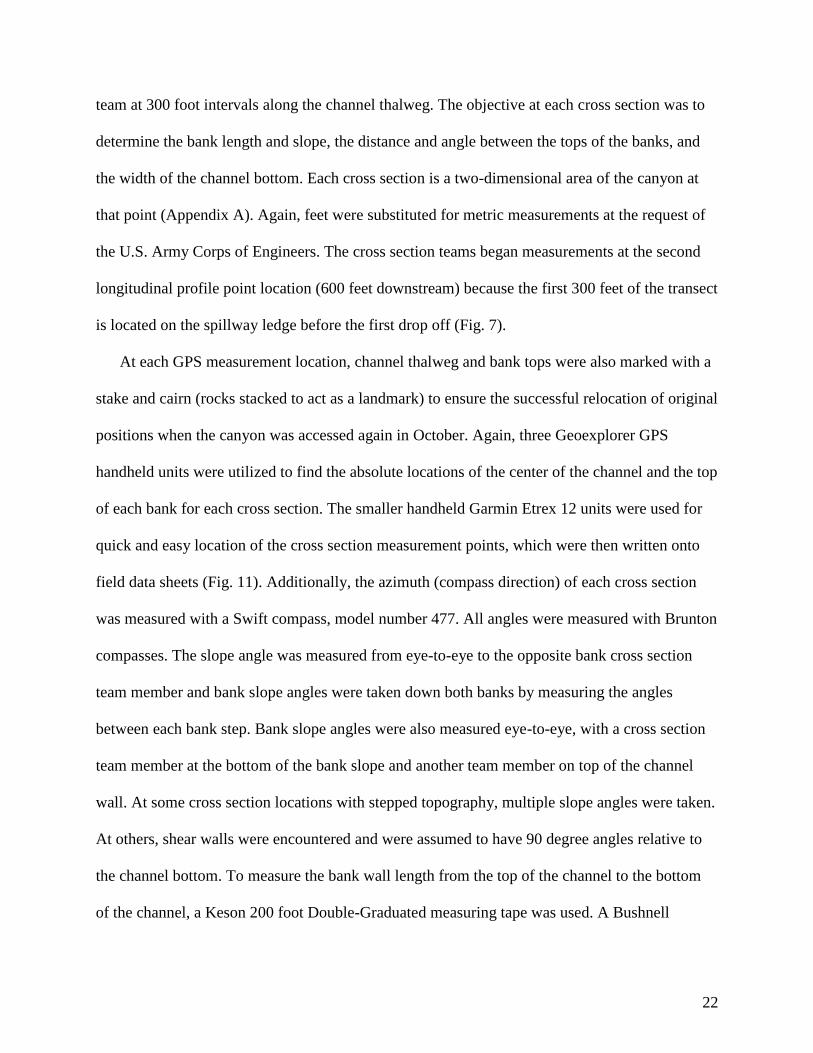
of each bank for each cross section. The smaller handheld Garmin Etrex 12 units were used for
quick and easy location of the cross section measurement points, which were then written onto
field data sheets (Fig. 11). Additionally, the azimuth (compass direction) of each cross section
was measured with a Swift compass, model number 477. All angles were measured with Brunton
compasses. The slope angle was measured from eye-to-eye to the opposite bank cross section
team member and bank slope angles were taken down both banks by measuring the angles
between each bank step. Bank slope angles were also measured eye-to-eye, with a cross section
team member at the bottom of the bank slope and another team member on top of the channel
wall. At some cross section locations with stepped topography, multiple slope angles were taken.
At others, shear walls were encountered and were assumed to have 90 degree angles relative to
the channel bottom. To measure the bank wall length from the top of the channel to the bottom
of the channel, a Keson 200 foot Double-Graduated measuring tape was used. A Bushnell
23
Fig. 11. A sample of the field data sheet used to record the cross sectional measurements.
24
Yardage Pro 1000 range finder determined channel width from the top of the left bank to the top
of the right bank for the first six cross sections. A more accurate Leica Vector Range Finder was
available for the final nine cross sections.
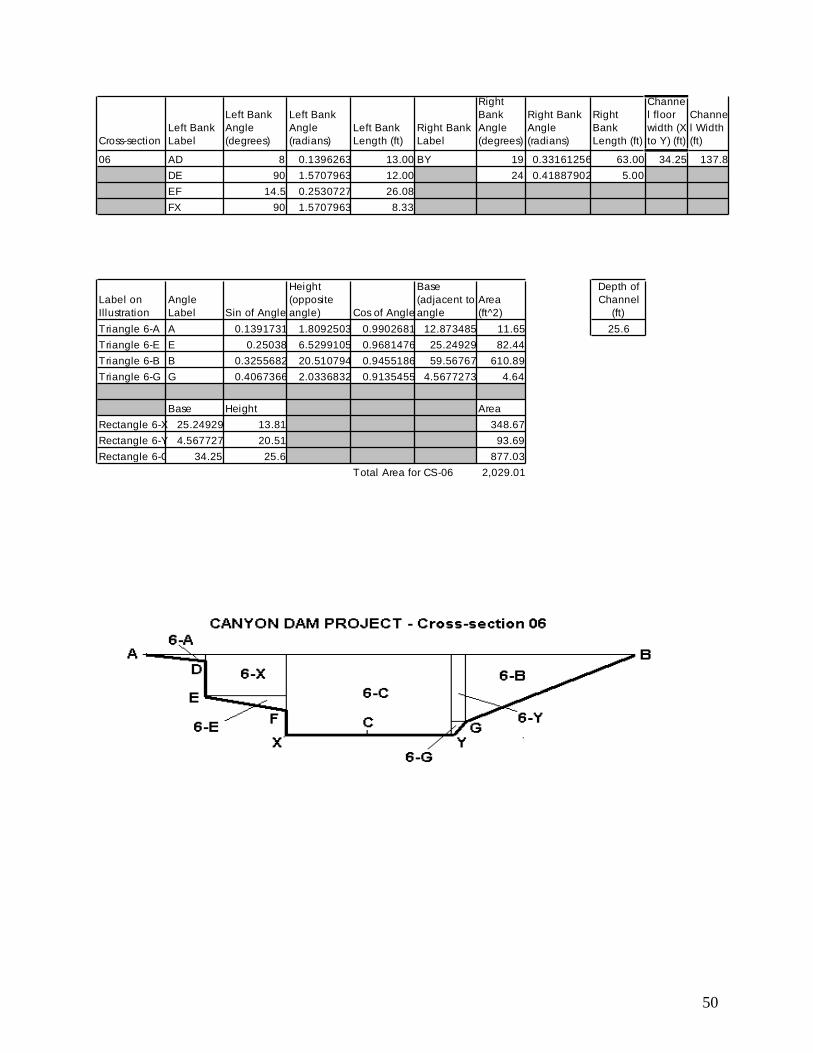
Each of the 15 measured cross-sections was broken down into a collection of trigonometric
shapes, triangles and rectangles. The area of each primitive shape was calculated and the sum of
the areas became the total area of the cross-section. Cross-sections were measured every 300 ft,
so each cross-sectional area was multiplied by the section length to produce a section volume.
The sum of the section volumes provided an estimate of total volume of bedrock removed from
the study area. All of the data collected during the cross section measurements are provided in
the appendices (Appendix A).
Although great care was taken to minimize errors of omission and commission, some error
inevitably occurred. Limits in time and equipment reduced precision and required the
incorporation of assumptions. For example, multiple disturbed layers of rock and soil along with
heavy brush decreased accessibility to bank-top cross-section locations and also visibility
between opposite team members. Two-way radios were used to help opposite bank members
communicate in bad visibility situations. Also, GPS handheld units occasionally had problems
receiving enough satellites to provide an exact location. The channel bank walls often had
multiple steps at multiple heights that prohibited exact measurements. It was necessary to
compensate for some of the steps by assuming a smooth bank at an average angle. Additionally,
some of the angles measured with the Brunton compasses were not precise due to the difficulty
of holding and balancing the level in the field. Last, both fatigue and distraction were negative
factors, which demonstrated the need for good field data sheet and method design.
25
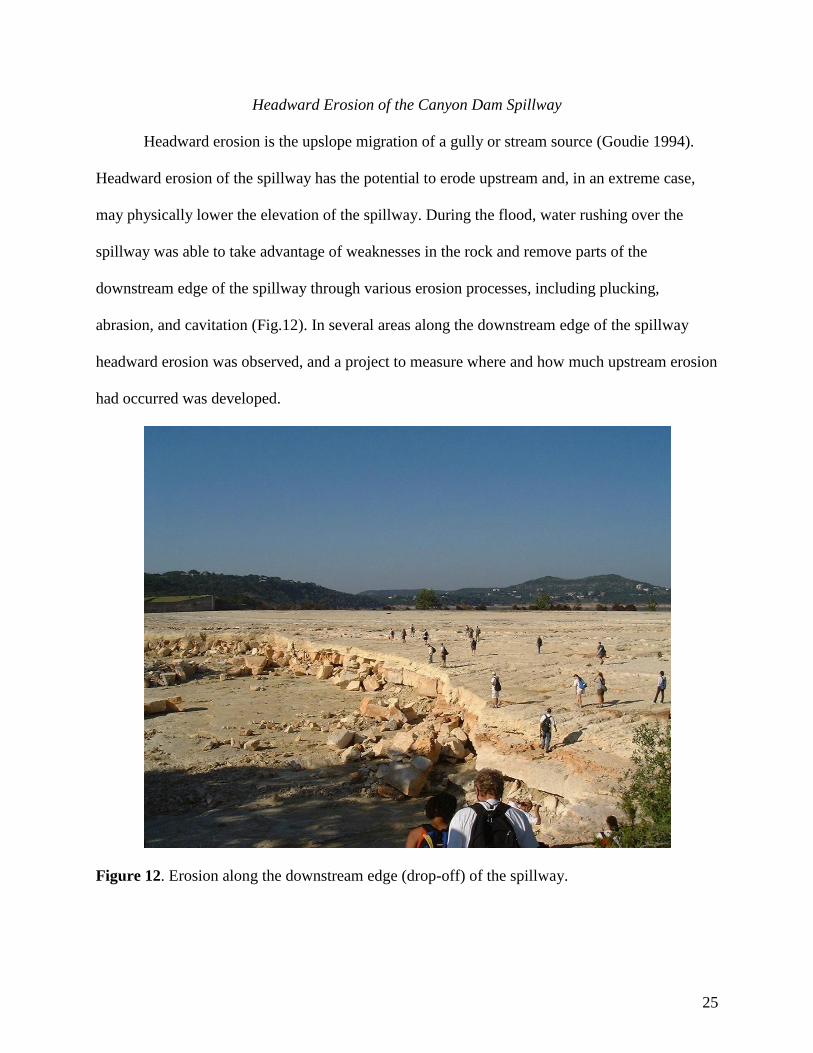
Headward Erosion of the Canyon Dam Spillway
Headward erosion is the upslope migration of a gully or stream source (Goudie 1994).
Headward erosion of the spillway has the potential to erode upstream and, in an extreme case,
may physically lower the elevation of the spillway. During the flood, water rushing over the
spillway was able to take advantage of weaknesses in the rock and remove parts of the
downstream edge of the spillway through various erosion processes, including plucking,
abrasion, and cavitation (Fig.12). In several areas along the downstream edge of the spillway
headward erosion was observed, and a project to measure where and how much upstream erosion
had occurred was developed.
Figure 12. Erosion along the downstream edge (drop-off) of the spillway.
26
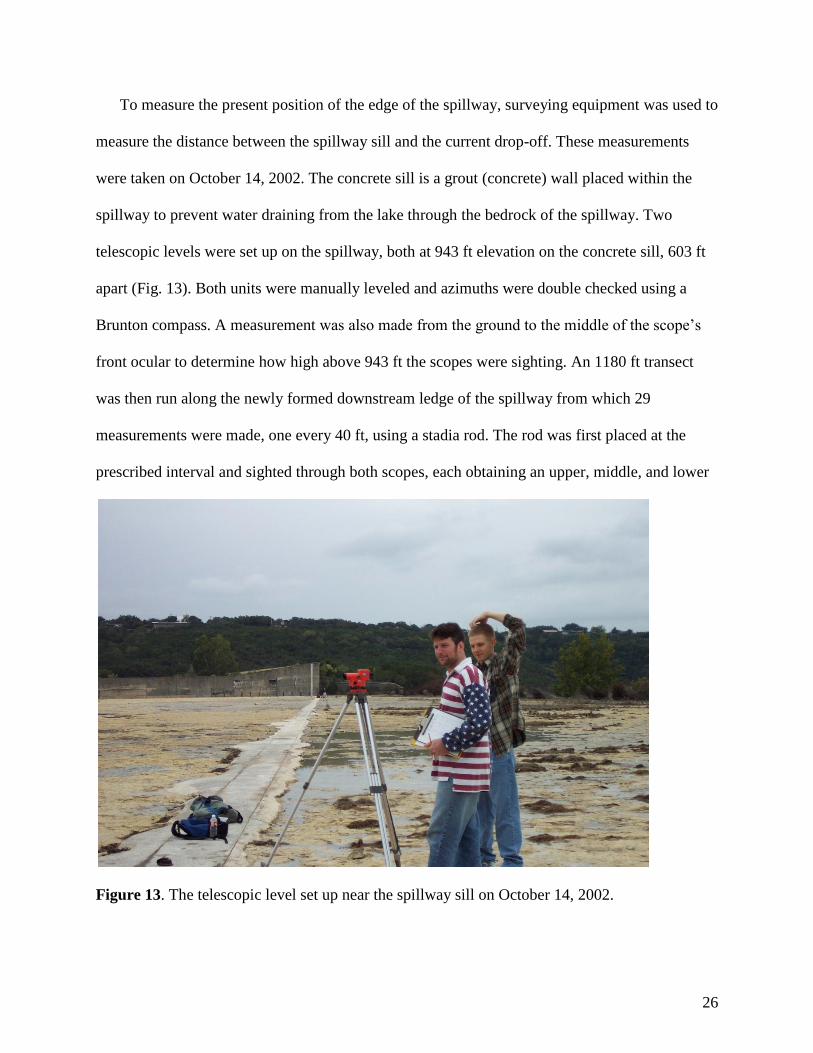
To measure the present position of the edge of the spillway, surveying equipment was used to
measure the distance between the spillway sill and the current drop-off. These measurements
were taken on October 14, 2002. The concrete sill is a grout (concrete) wall placed within the
spillway to prevent water draining from the lake through the bedrock of the spillway. Two
telescopic levels were set up on the spillway, both at 943 ft elevation on the concrete sill, 603 ft
apart (Fig. 13). Both units were manually leveled and azimuths were double checked using a
Brunton compass. A measurement was also made from the ground to the middle of the scope’s
front ocular to determine how high above 943 ft the scopes were sighting. An 1180 ft transect
was then run along the newly formed downstream ledge of the spillway from which 29
measurements were made, one every 40 ft, using a stadia rod. The rod was first placed at the
prescribed interval and sighted through both scopes, each obtaining an upper, middle, and lower
Figure 13. The telescopic level set up near the spillway sill on October 14, 2002.
27
reading. Using the upper and lower readings, the distance from each transit station to the back
ledge of the spillway was calculated using the formula: (upper-lower) x 100, which resulted in a
profile of the edge of the drop-off. The rod was then passed from the top ledge of the spillway to
the bottom, and a middle measurement was sighted at the base of the ledge to determine the
depth of the cliff. By using the data collected from each station, a model of the new spillway
ledge was constructed and an estimate of the headward erosion was calculated.
Spring Locations
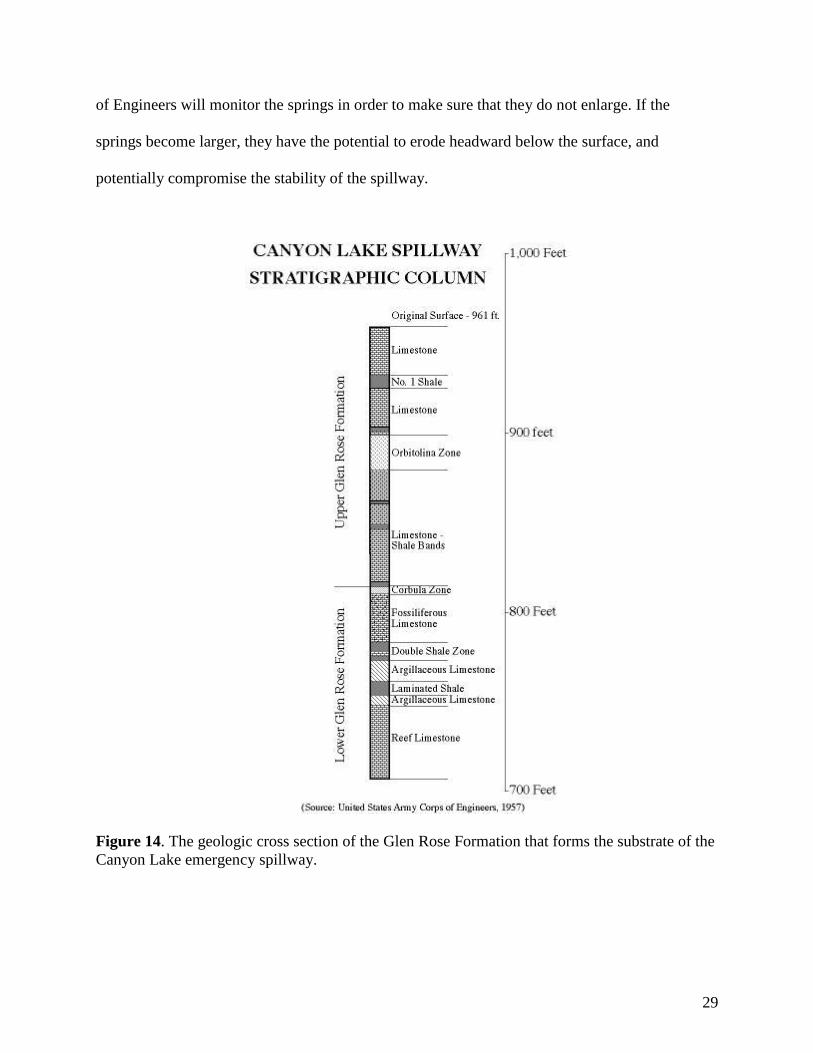
The erosion of the spillway revealed several springs within the Glen Rose Formation that
presumably drain from the lake through the substrate and into the current channel. The combined
flow of the springs is approximately 25 cubic feet per second (cfs) at the end of the spillway
channel. The springs are believed to emanate from the lake for several reasons. The water
coming from the springs is slightly discolored and has the same organic scent as the lake water.
Water coming from Edwards Aquifer springs would be clear and without the organic scent. The
springs are confined by shale layers within the Glen Rose Formation and are below the level of
the lake (909 ft)(Fig. 14). The springs emanate from limestone strata with relatively constant
elevations that correspond strongly with the shale layers in the Glen Rose Formation (USACE
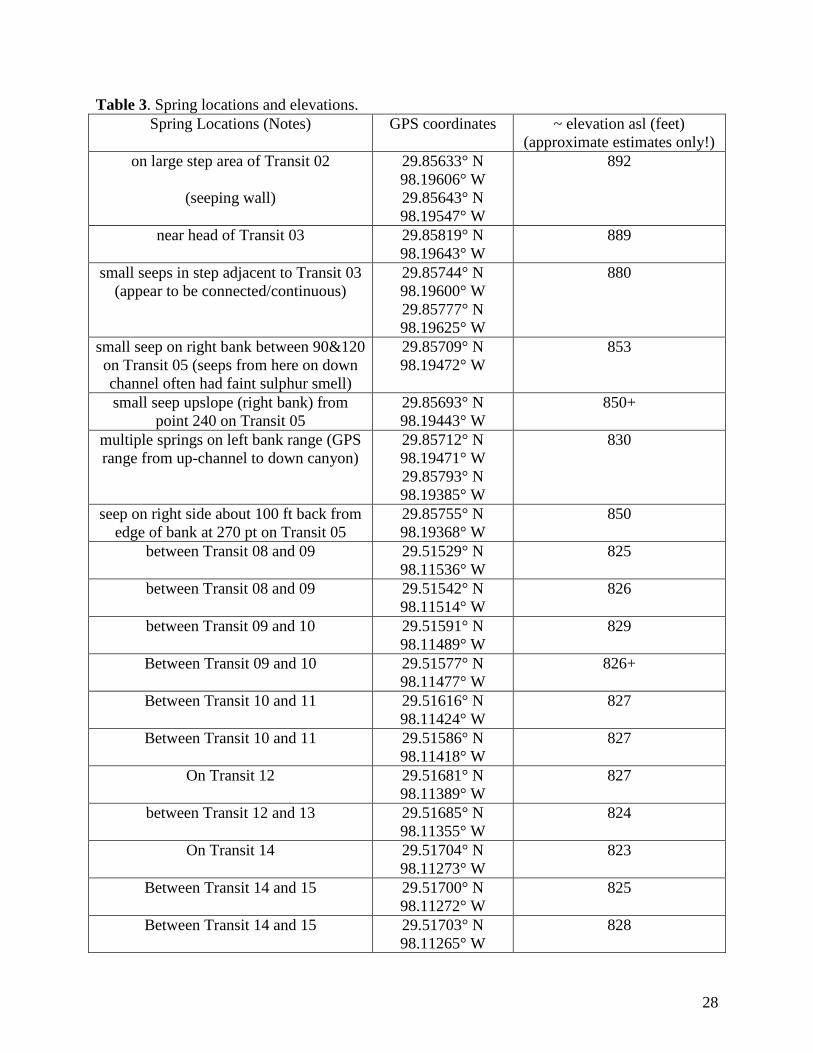
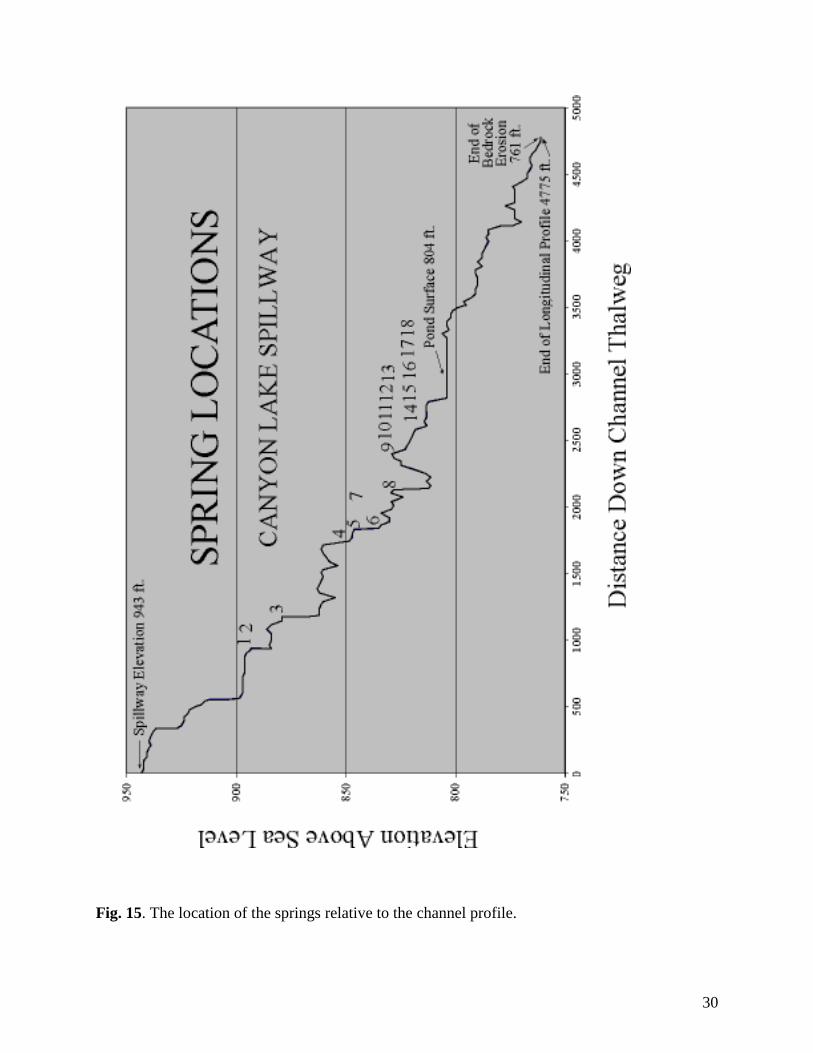
1951). A total of 18 springs were identified and located using GPS and elevation data taken from
the transect (Table 3). Springs were differentiated from seeps by the spring having a
recognizable current emanating from the rock. There are numerous small seeps in the canyon
that were not mapped. Once the springs were located, they were then plotted onto the
longitudinal profile to display their location relative to the distance down the channel (Fig. 15).
The location and outflow from the springs is significant for several reasons. The US Army Corps
28
Table 3. Spring locations and elevations.
Spring Locations (Notes) GPS coordinates ~ elevation asl (feet)
(approximate estimates only!)
on large step area of Transit 02
(seeping wall)
29.85633° N
98.19606° W
29.85643° N
98.19547° W
892
near head of Transit 03 29.85819° N
98.19643° W
889
small seeps in step adjacent to Transit 03
(appear to be connected/continuous)
29.85744° N
98.19600° W
29.85777° N
98.19625° W
880
small seep on right bank between 90&120
on Transit 05 (seeps from here on down
channel often had faint sulphur smell)
29.85709° N
98.19472° W
853
small seep upslope (right bank) from
point 240 on Transit 05
29.85693° N
98.19443° W
850+
multiple springs on left bank range (GPS
range from up-channel to down canyon)
29.85712° N
98.19471° W
29.85793° N
98.19385° W
830
seep on right side about 100 ft back from
edge of bank at 270 pt on Transit 05
29.85755° N
98.19368° W
850
between Transit 08 and 09 29.51529° N
98.11536° W
825
between Transit 08 and 09 29.51542° N
98.11514° W
826
between Transit 09 and 10 29.51591° N
98.11489° W
829
Between Transit 09 and 10 29.51577° N
98.11477° W
826+
Between Transit 10 and 11 29.51616° N
98.11424° W
827
Between Transit 10 and 11 29.51586° N
98.11418° W
827
On Transit 12 29.51681° N
98.11389° W
827
between Transit 12 and 13 29.51685° N
98.11355° W
824
On Transit 14 29.51704° N
98.11273° W
823
Between Transit 14 and 15 29.51700° N
98.11272° W
825
Between Transit 14 and 15 29.51703° N
98.11265° W
828
29
of Engineers will monitor the springs in order to make sure that they do not enlarge. If the
springs become larger, they have the potential to erode headward below the surface, and
potentially compromise the stability of the spillway.
Figure 14. The geologic cross section of the Glen Rose Formation that forms the substrate of the
Canyon Lake emergency spillway.
30
Fig. 15. The location of the springs relative to the channel profile.
31
Sketching, Field Notes, and Photographic Methods
Sketching is a useful way to record details of the study area not easily captured by
photographs or direct measurement. It provides an alternative perspective to descriptions and
data. One of the students spent the majority of September 28th recording observations in sketch
form with some descriptive notations. Photographers in the class employed a variety of
equipment and techniques to accomplish three main goals: document the fieldwork, interpret the
new canyon, and record the current state of the canyon at measured places for possible use in
future geological change or biotic succession studies (repeat photography). Students used
observation and composition skills to capture the effects of the flood on the plant and animal life.
They encountered scenes of destruction, as well as new life moving into the area. Their goal was
to follow the transect team and take photographs in four cardinal directions every 300 ft, using
Garmin Etrex GPS units to mark the photographic locations. Sometimes the intended location for
these directional photos was inaccessible, such as on a slope, in a mud pit, or in a pool of water,
and adjustments had to be made accordingly. The GPS-documented shots were limited to the
first 1500 ft of the thalweg, and the students focused on photographing other elements on the
second day of fieldwork. Cameras used included a Nikon N65 body with Nikkor 28-80mm zoom
lens and a standard UV filter; a Pentax K-1000 with polarizing filter; and an Olympus Camedia
3.3 megapixel digital camera with a C-3040 zoom lens. A variety of film types were used
including Kodak T-max 400 ISO, Kodachrome 64, and Kodak Gold 100. While two students
focused strictly on photography, many others also took photographs, which created a final
collection of over 800 images (See Appendix B). Photographs were converted to digital data
using a Polaroid Sprint Scan 35 Plus. Adobe Photoshop 6.0 enabled students to tone and crop the
images for publication.
32
GIS Modeling
Two methods were used to compute the volume of bedrock material eroded based on the data
gathered. The first method used the channel cross-sectional area and distance between cross-
sections to produce a volume estimate, which has been discussed above. The second method
used a Geographic Information System (GIS) to produce a model of the canyon based on the
collected data combined with several computer-generated coverages. A coverage is a digital map
layer that can consist of images, computer generated graphics, and maps. GIS is a tool to aid in
spatial analysis by enabling the integration of spatial and non-spatial data to perform analysis.
The GIS model had the potential to be very accurate but suffered due to the unavailability of
high-resolution terrain data from before the flood and the limited vertical accuracy of
measurements available from the GPS units.
The GIS model utilized a variety of data including the data gathered in the field and existing
data sources. All of the GPS were differentially corrected. Because of the different sources of
data (GPS points and manually collected data from the survey instruments), a consistent
reference had to be established. To establish a reference, the upper most GPS location was
measured twice on September 28 and October 14, 2002. The points taken at different dates were
then averaged. This average was then used to establish a benchmark coordinate so that all
manual measurements could be normalized to the same location. Next, the telescopic level
measurements of the channel thalweg were converted from raw data into 3-dimensional (3-D)
UTM coordinates (X, Y, Z) where X and Y represent UTM (planar) coordinates and Z represents
elevation. Since the measurements were based on magnetic north, the coordinates had to be
rotated for magnetic declination. The angle producing the best fit with respect to the GPS points
and used throughout the study was five degrees. Thus the model had to be adjusted five degrees
33
east in order to fit the known channel thalweg. The points were normalized, using the benchmark
as the initial coordinate for the chain of measurements. The thalwag points were imported into
the GIS, along with the differentially corrected GPS points.
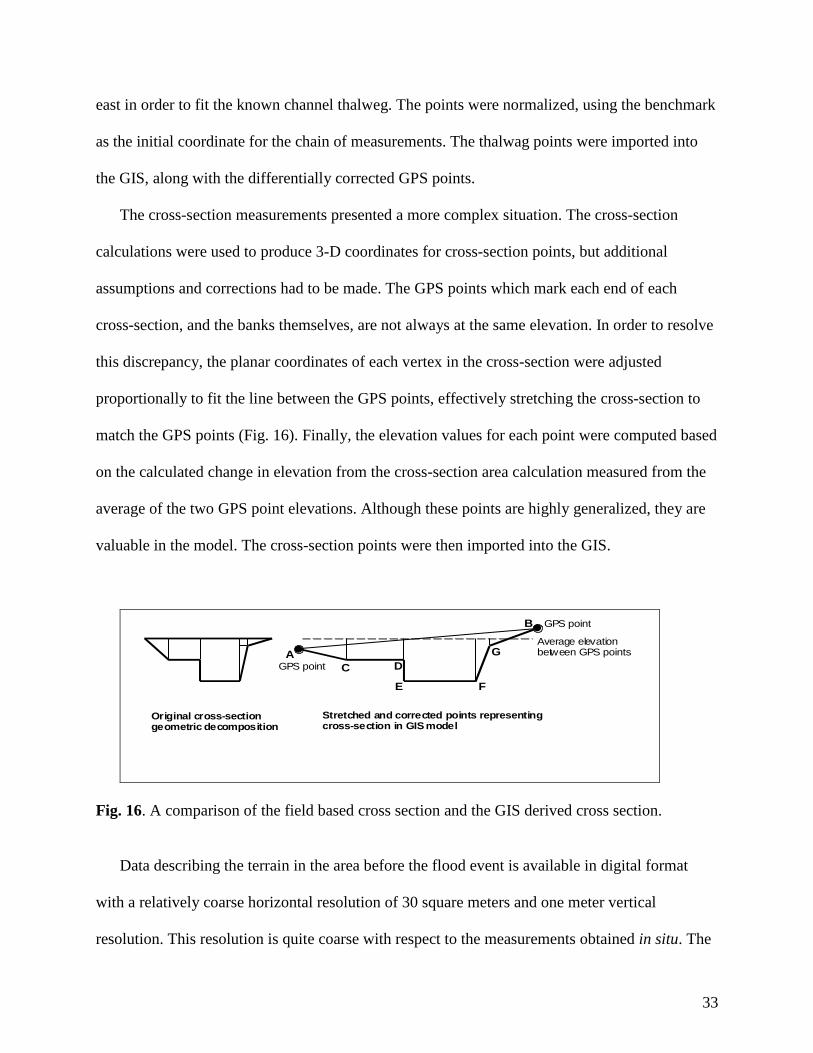
The cross-section measurements presented a more complex situation. The cross-section
calculations were used to produce 3-D coordinates for cross-section points, but additional
assumptions and corrections had to be made. The GPS points which mark each end of each
cross-section, and the banks themselves, are not always at the same elevation. In order to resolve
this discrepancy, the planar coordinates of each vertex in the cross-section were adjusted
proportionally to fit the line between the GPS points, effectively stretching the cross-section to
match the GPS points (Fig. 16). Finally, the elevation values for each point were computed based
on the calculated change in elevation from the cross-section area calculation measured from the
average of the two GPS point elevations. Although these points are highly generalized, they are
valuable in the model. The cross-section points were then imported into the GIS.
GPS point
GPS point
Average elevation between GPS points A
B
C D
E F
G
Original cross-section geometric decomposition
Stretched and corrected points representing cross-section in GIS model
Fig. 16. A comparison of the field based cross section and the GIS derived cross section.
Data describing the terrain in the area before the flood event is available in digital format
with a relatively coarse horizontal resolution of 30 square meters and one meter vertical
resolution. This resolution is quite coarse with respect to the measurements obtained in situ. The
34
elevation data was converted from an elevation grid DEM (Digital Elevation Model) into points,
which were then re-projected from NAD27 to NAD83 to match the projection of other data in
the GIS. A simple correction was applied to the terrain point elevation values to normalize the
points to the benchmark. The dataset was clipped to an appropriate extent to encompass the study
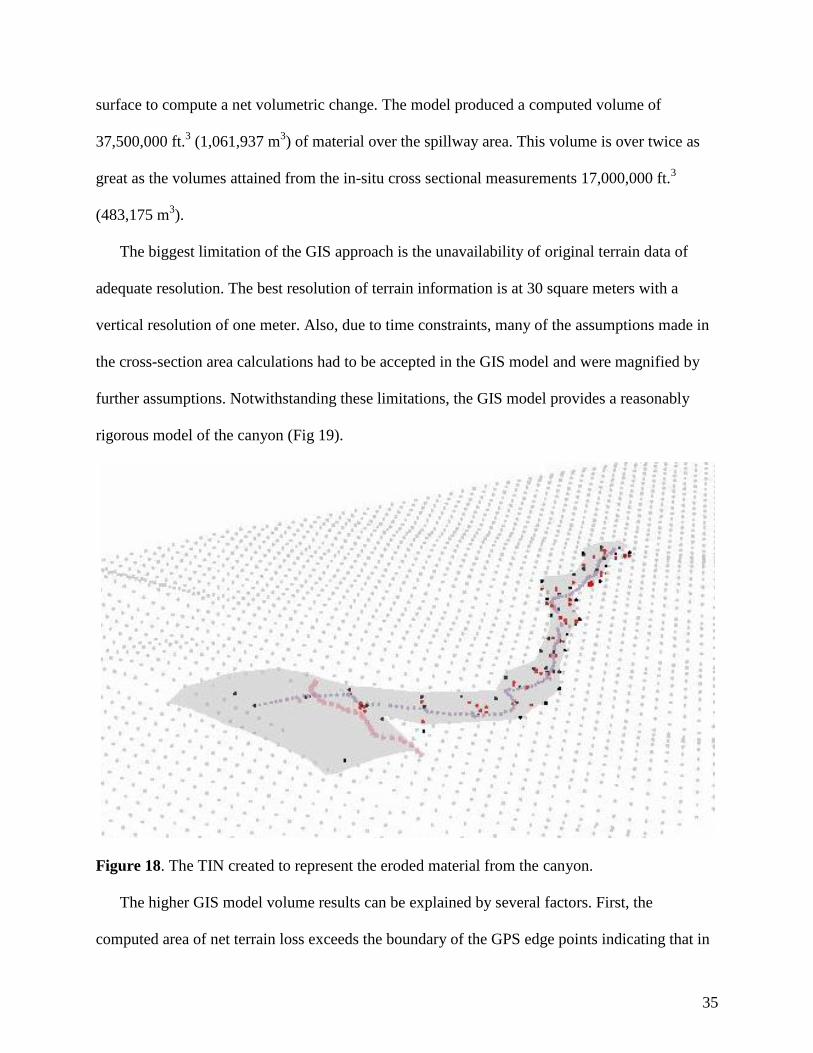
area and a triangulated irregular network (TIN) was produced to represent the original terrain
(Fig. 17). A boundary was created using the outer-most extent of all measured points to represent
a generalized canyon boundary. The terrain elevation point data set, that pre-dated the flood
erosion, was copied and the original elevation points within the canyon boundary were deleted.
This removed the set of points representing the original terrain of the inner canyon area. This
data set was combined with the GPS and other measured points to produce the new terrain TIN
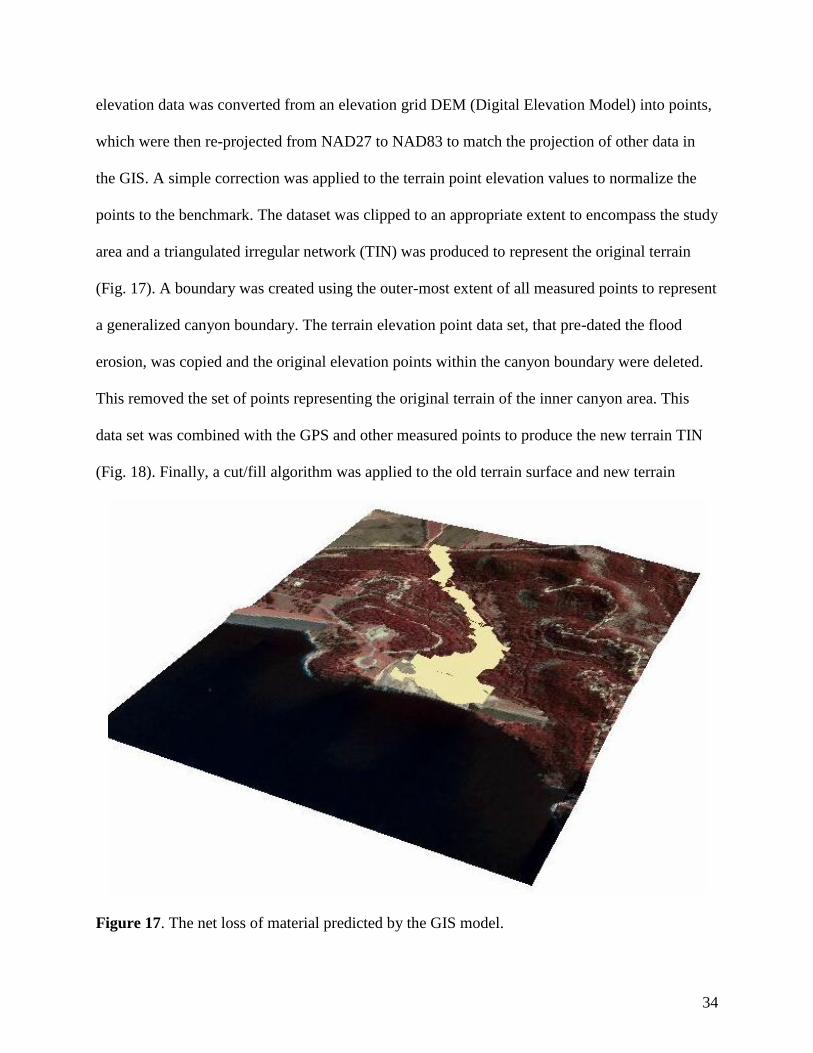
(Fig. 18). Finally, a cut/fill algorithm was applied to the old terrain surface and new terrain
Figure 17. The net loss of material predicted by the GIS model.
35
surface to compute a net volumetric change. The model produced a computed volume of
37,500,000 ft.3 (1,061,937 m
3) of material over the spillway area. This volume is over twice as
great as the volumes attained from the in-situ cross sectional measurements 17,000,000 ft.3
(483,175 m3).
The biggest limitation of the GIS approach is the unavailability of original terrain data of
adequate resolution. The best resolution of terrain information is at 30 square meters with a
vertical resolution of one meter. Also, due to time constraints, many of the assumptions made in
the cross-section area calculations had to be accepted in the GIS model and were magnified by
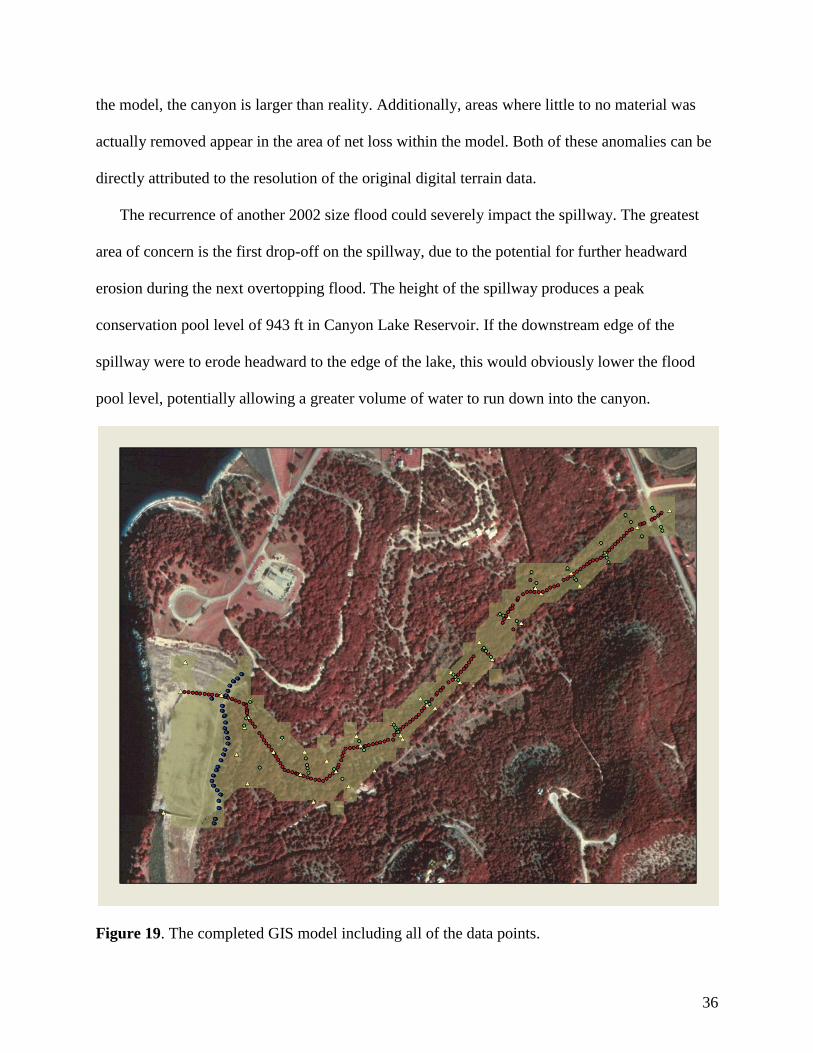
further assumptions. Notwithstanding these limitations, the GIS model provides a reasonably
rigorous model of the canyon (Fig 19).
Figure 18. The TIN created to represent the eroded material from the canyon.
The higher GIS model volume results can be explained by several factors. First, the
computed area of net terrain loss exceeds the boundary of the GPS edge points indicating that in
36
the model, the canyon is larger than reality. Additionally, areas where little to no material was
actually removed appear in the area of net loss within the model. Both of these anomalies can be
directly attributed to the resolution of the original digital terrain data.
The recurrence of another 2002 size flood could severely impact the spillway. The greatest
area of concern is the first drop-off on the spillway, due to the potential for further headward
erosion during the next overtopping flood. The height of the spillway produces a peak
conservation pool level of 943 ft in Canyon Lake Reservoir. If the downstream edge of the
spillway were to erode headward to the edge of the lake, this would obviously lower the flood
pool level, potentially allowing a greater volume of water to run down into the canyon.
Figure 19. The completed GIS model including all of the data points.
37
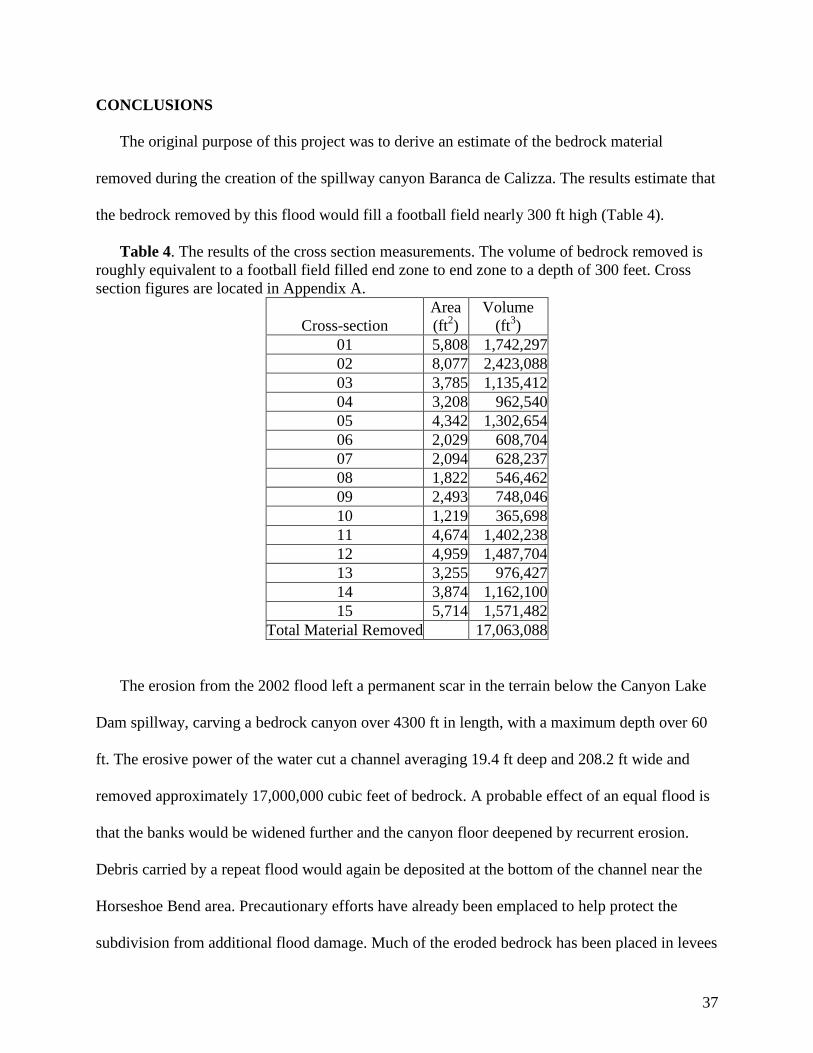
CONCLUSIONS
The original purpose of this project was to derive an estimate of the bedrock material
removed during the creation of the spillway canyon Baranca de Calizza. The results estimate that
the bedrock removed by this flood would fill a football field nearly 300 ft high (Table 4).
Table 4. The results of the cross section measurements. The volume of bedrock removed is
roughly equivalent to a football field filled end zone to end zone to a depth of 300 feet. Cross
section figures are located in Appendix A.
Cross-section
Area
(ft2)
Volume
(ft3)
01 5,808 1,742,297
02 8,077 2,423,088
03 3,785 1,135,412
04 3,208 962,540
05 4,342 1,302,654
06 2,029 608,704
07 2,094 628,237
08 1,822 546,462
09 2,493 748,046
10 1,219 365,698
11 4,674 1,402,238
12 4,959 1,487,704
13 3,255 976,427
14 3,874 1,162,100
15 5,714 1,571,482
Total Material Removed 17,063,088
The erosion from the 2002 flood left a permanent scar in the terrain below the Canyon Lake
Dam spillway, carving a bedrock canyon over 4300 ft in length, with a maximum depth over 60
ft. The erosive power of the water cut a channel averaging 19.4 ft deep and 208.2 ft wide and
removed approximately 17,000,000 cubic feet of bedrock. A probable effect of an equal flood is
that the banks would be widened further and the canyon floor deepened by recurrent erosion.
Debris carried by a repeat flood would again be deposited at the bottom of the channel near the
Horseshoe Bend area. Precautionary efforts have already been emplaced to help protect the
subdivision from additional flood damage. Much of the eroded bedrock has been placed in levees
38
as additional protection. Time will tell how well the new channel will handle another severe
flood event.
ACKNOWLEDGEMENTS
There are a large number of people and organizations who contributed to this project.
Invariably, some of them will be mistakenly left out of the acknowledgements and we sincerely
apologize for that oversight. We would foremost like to thank the United States Army Corps of
Engineers for allowing us access to the canyon. In particular, Doug Massoth, Jerry Brite, Judd
McNett, and Judy Scott, were invaluable with their assistance and suggestions. We would also
like to thank the James and Marilyn Lovell Center for Natural Hazards Research for their
assistance with the production of this manuscript. The Department of Geography at Texas State
University - San Marcos provided the equipment and travel for this investigation. Richard Earl,
Mark Fonstad, David Butler, Richard Dixon, and Denise Blanchard-Boehm kindly reviewed the
document and their suggestions have greatly improved the final version. Mark Fonstad, Richard
Earl, Jonathon Herbert, Alain Basurco, Nikki Williams, Mike O’Brien, and Bobby Taylor
provided valuable assistance in the field. Mikaila Bell donated her time and efforts to produce
the map used as Figure 1 and Byron Augustin was instrumental in providing contact information
as well as showing the field methods class an excellent slide show of the canyon before we
implemented the field work. Craig Schofield and the Texas Wildlife Department provided
assistance with GPS units and provided the 1995 DOQ used to plot our GPS locations. Dan
Hemenway and David Jordan were instrumental in keeping the equipment running smoothly and
helped enormously with the GPS differential correction. David was also very helpful in the field.
Jeff Sanders was our pilot and was very influential for the creation of Figure 2.
39
Works Cited
Broker, Bret. 2002. History. In Cabins over Canyon Lake.
http://www.cabinsovercanyonlake.com. Accessed 21 October 2002.
Cable News Network (CNN). 2002. „Devastating‟ Texas floods kill 9.
http://www.cnn.com/2002/WEATHER/07/05/texas.flooding. Accessed 06 November
2002.
Comal County Engineer’s Office (CCEO). 2002. Aerial pictures of 2002 flood.
http://www.cceo.org/FloodPics. Accessed 27 October 2002.
Copeland, Larry. 2002. Nature takes hard swing at Texas.
http://www.usatoday.com/weather/news/2002/2002-07-22-texasflding.htm; Accessed 29
October 2002.
Earl, Richard A., Rachel D. Benke, and Kristy Knaupp. 2003. Analysis of the July 2002 flood at
the Canyon Dam Spillway, Guadalupe River, south-central Texas. Papers of the Applied
Geography Conferences. Eds, Graham Tobin and Burrell Montz. Vol 26: 371-79.
Eckhardt, Gregg. 2002. Canyon Lake and the Guadalupe River.
http://www.edwardsaquifer.net/canyon.html. Accessed 30 October 2002.
Environmental Systems Research Institute (ESRI). 2001. ArcView GIS 3.2a; available
from http://www.esri.com; Internet accessed 17 November 2002.
Garza, Adrienne Smith. 2002. Comal County flood waters finally receding.
http://www.timesguardian.com/news/7-10floodwaterreceding.html. Accessed 04
December 2002.
Goudie, Andrew, ed. 1994. The encyclopedia dictionary of physical geography. 2nd
ed.
Cambridge, MA: Basil Blackwell Ltd.
Guadalupe-Blanco River Authority (GBRA). 1998. New releases 1998.
http://www.gbra.org/news98.html. Accessed 05 November 2002.
Handbook of Texas Online. 2002a. Canyon Lake. In Handbook of Texas Online.
http://www.tsha.utexas.edu/handbook/online/articles/view/CC/roc4.html. Accessed 16
November 2002.
_______. 2002b. Guadalupe-Blanco River Authority. In Handbook of Texas Online.
http://www.tsha.utexas.edu/handbook/online/articles/view/CC/roc4.html. Accessed 16
November 2002.
40
_______. 2002c. Guadalupe River. In Handbook of Texas Online.
http://www.tsha.utexas.edu/handbook/online/articles/view/CC/roc4.html. Accessed 16
November 2002.
_______. 2002d. Sattler. In Handbook of Texas Online.
http://www.tsha.utexas.edu/handbook/online/articles/view/CC/roc4.html. Accessed 16
November 2002.
_______. 2002e. Startzville. In Handbook of Texas Online.
http://www.tsha.utexas.edu/handbook/online/articles/view/CC/roc4.html. Accessed 16
November 2002.
Hurn, Jeff. 1993. Differential GPS explained. Sunnyvale, CA: Trimble Navigation.
National Oceanic and Atmospheric Administration (NOAA). 2002a. Late June and early July
floods of 2002 over the Texas Hill Country and south central Texas.
http://www.srh.noaa.gov/ewx/html/wxevent/2002/jul2002/julfld2002.htm. Accessed 04
November 2002.
_______. 2002b. Storm-tossed Texans finally see a ray of sunshine.
http://www.noanews.noaa.gov/stories/s935.htm. Accessed 06 November 2002.
NewsMax. 2002. Texas flood damage estimated at $1 billion.
http://www.newsmax.com/archives/articles/2002/7/8/184804.shtml. Accessed 02
December 2002.
News-Star. 2002. As water goes down, Texas flood victims face muddy task.
http://www.news-star.com/stories/071402/New_50.shtml. Accessed 27 October 2002.
Sentürk, Fuat. 1994. Hydraulics of dams and reservoirs. Colorado: Water
Resources Publications.
Slade, R. M., Jr., and Kristie Persky. 1999. Floods in the Guadalupe and San Antonio River
Basins in Texas, October 1998. U. S. Geological Survey Fact Sheet FS-147-99.
Trimble Navigation. 2002. GPS Pathfinder Office, version 2.70; available from
http://www.trimble.com; Internet accessed 20 November 2002.
Texas Department of Transportation (TXDOT). 2002. Global positioning system data.
San Antonio High Accuracy Regional Network (HARN).
ftp://ftp.dot.state.tx.us/pub/txdot-info/isd/gps/Positions.txt. Accessed 28 October 2002.
Texas Parks and Wildlife Department. 2002. Canyon Lake.
http://www.tpwd.state.tx.us/fish/infish/lakes/canyon/lake_id.htm. Accessed 03 November
2002.
41
United States Army Corps of Engineers (USACE). 1951. Core borings location plate. Appendix
III. Plate 2. File: Guad. 702-39.
_______. 1957. Geologic profile spillway and Dike “A”. Plate 2. Design Memorandum Number
10. File: Guad. 706-1.
_______. 2002a. The history of Canyon Dam and reservoir. In Canyon Lake information page.
http://swf67.swf-wc.usace.army.mil/canyon/Damhistory.htm Accessed 30 October 2002.
_______. 2002b. Canyon Lake flood of 2002. In Canyon Lake information page.
http://swf67.swf-wc.usace.army.mil/canyon/QA%20Fact%20Sheet.doc. Accessed 02
December 2002.
_______. 2002c. Canyon Lake historical statistics. In Canyon Lake information page.
http://www.canyonlakeinfo.net/flood_2002/. Accessed 04 December 2002.
_______. 2002d. Query hydrologic data on Ft. Worth district lakes. In Canyon Lake information
page. http://www1.swf-wc.usace.army.mil/cgi-bin/hydrologic_data.cgi. Accessed 05
November 2002.
Young, Judy. 2002. Interview by Amylia M. Williams, 4 November. Director of the
Convention and Visitors Bureau, New Braunfels Chamber of Commerce.
Whipple, Kelin X., Gregory S. Hancock, and Robert S. Anderson. 2000. River incision into
bedrock: mechanics and relative efficacy of plucking, abrasion, and cavitation.
Geological Society of America Bulletin. 112, no. 3: 490-503.
42
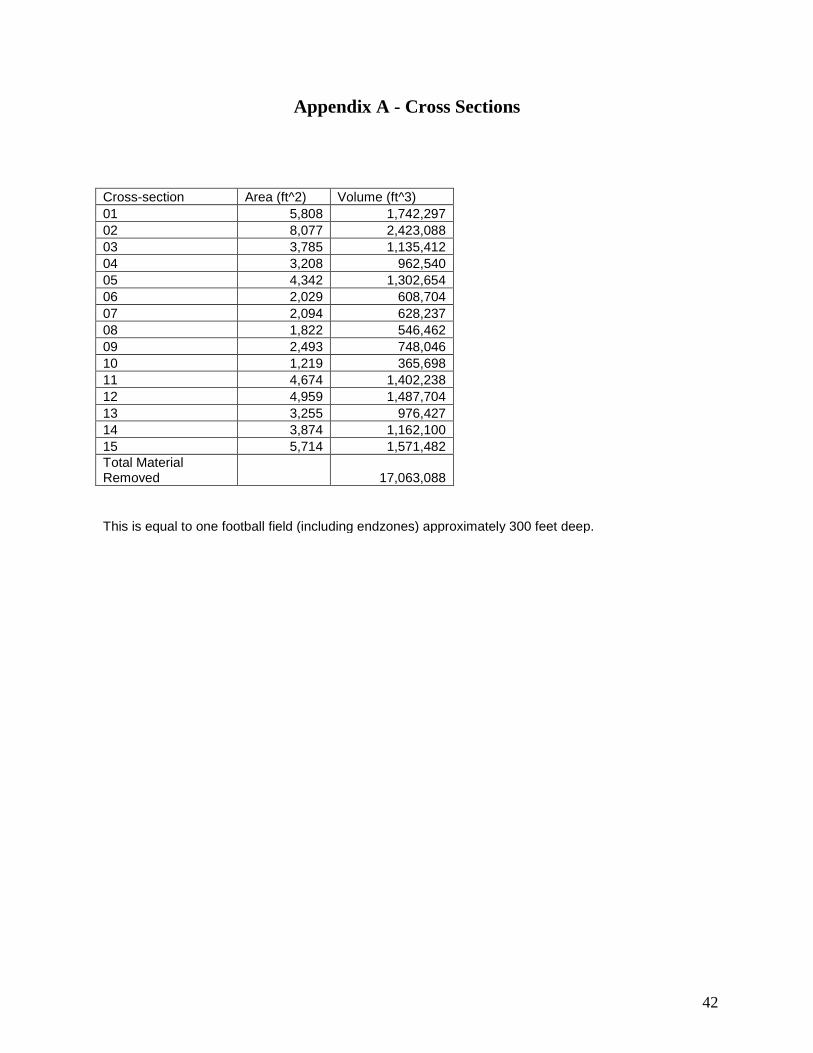
Appendix A - Cross Sections
Cross-section Area (ft^2) Volume (ft^3)
01 5,808 1,742,297
02 8,077 2,423,088
03 3,785 1,135,412
04 3,208 962,540
05 4,342 1,302,654
06 2,029 608,704
07 2,094 628,237
08 1,822 546,462
09 2,493 748,046
10 1,219 365,698
11 4,674 1,402,238
12 4,959 1,487,704
13 3,255 976,427
14 3,874 1,162,100
15 5,714 1,571,482
Total Material Removed 17,063,088
This is equal to one football field (including endzones) approximately 300 feet deep.
43
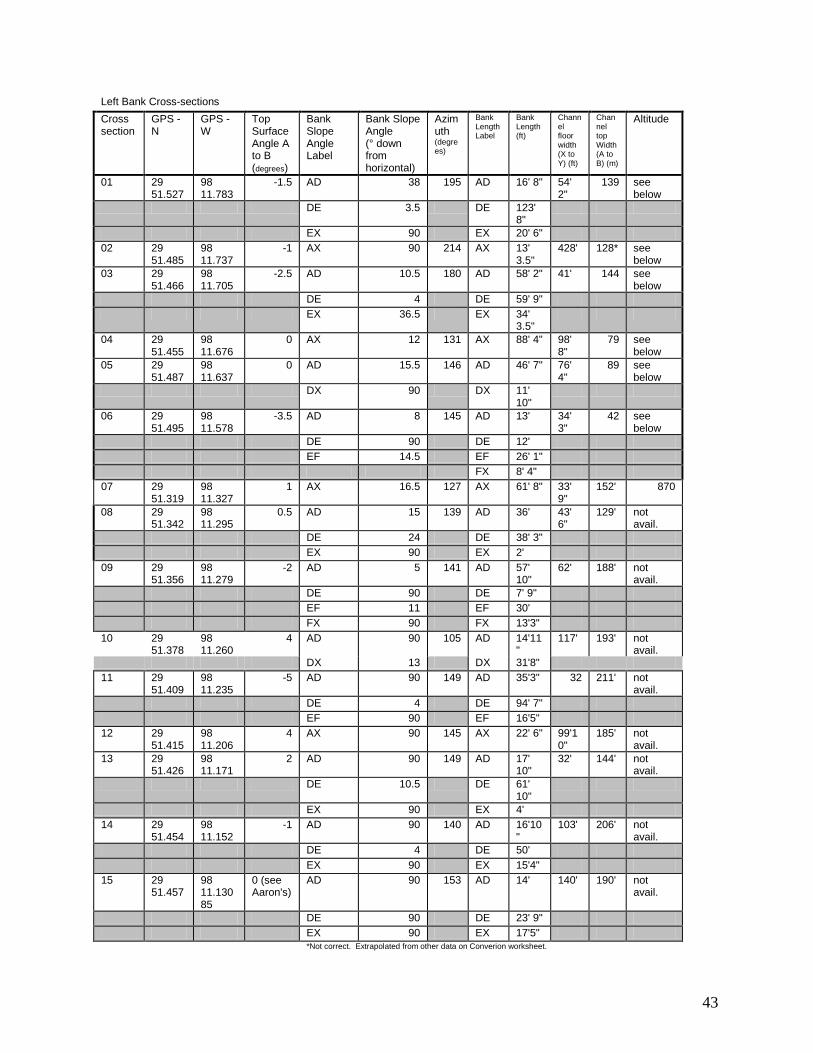
Left Bank Cross-sections
Cross section
GPS - N
GPS - W
Top Surface Angle A to B (degrees)
Bank Slope Angle Label
Bank Slope Angle (° down from horizontal)
Azimuth (degrees)
Bank Length Label
Bank Length (ft)
Channel floor width (X to Y) (ft)
Channel top Width (A to B) (m)
Altitude
01 29 51.527
98 11.783
-1.5 AD 38 195 AD 16' 8" 54' 2"
139 see below
DE 3.5 DE 123' 8"
EX 90 EX 20' 6"
02 29 51.485
98 11.737
-1 AX 90 214 AX 13' 3.5"
428' 128* see below
03 29 51.466
98 11.705
-2.5 AD 10.5 180 AD 58' 2" 41' 144 see below
DE 4 DE 59' 9"
EX 36.5 EX 34' 3.5"
04 29 51.455
98 11.676
0 AX 12 131 AX 88' 4" 98' 8"
79 see below
05 29 51.487
98 11.637
0 AD 15.5 146 AD 46' 7" 76' 4"
89 see below
DX 90 DX 11' 10"
06 29 51.495
98 11.578
-3.5 AD 8 145 AD 13' 34' 3"
42 see below
DE 90 DE 12'
EF 14.5 EF 26' 1"
FX 8' 4"
07 29 51.319
98 11.327
1 AX 16.5 127 AX 61' 8" 33' 9"
152' 870
08 29 51.342
98 11.295
0.5 AD 15 139 AD 36' 43' 6"
129' not avail.
DE 24 DE 38' 3"
EX 90 EX 2'
09 29 51.356
98 11.279
-2 AD 5 141 AD 57' 10"
62' 188' not avail.
DE 90 DE 7' 9"
EF 11 EF 30'
FX 90 FX 13'3"
10 29 51.378
98 11.260
4 AD 90 105 AD 14'11"
117' 193' not avail.
DX 13 DX 31'8"
11 29 51.409
98 11.235
-5 AD 90 149 AD 35'3" 32 211' not avail.
DE 4 DE 94' 7"
EF 90 EF 16'5"
12 29 51.415
98 11.206
4 AX 90 145 AX 22' 6" 99'10"
185' not avail.
13 29 51.426
98 11.171
2 AD 90 149 AD 17' 10"
32' 144' not avail.
DE 10.5 DE 61' 10"
EX 90 EX 4'
14 29 51.454
98 11.152
-1 AD 90 140 AD 16'10"
103' 206' not avail.
DE 4 DE 50'
EX 90 EX 15'4"
15 29 51.457
98 11.13085
0 (see Aaron's)
AD 90 153 AD 14' 140' 190' not avail.
DE 90 DE 23' 9"
EX 90 EX 17'5"
*Not correct. Extrapolated from other data on Converion worksheet.
44
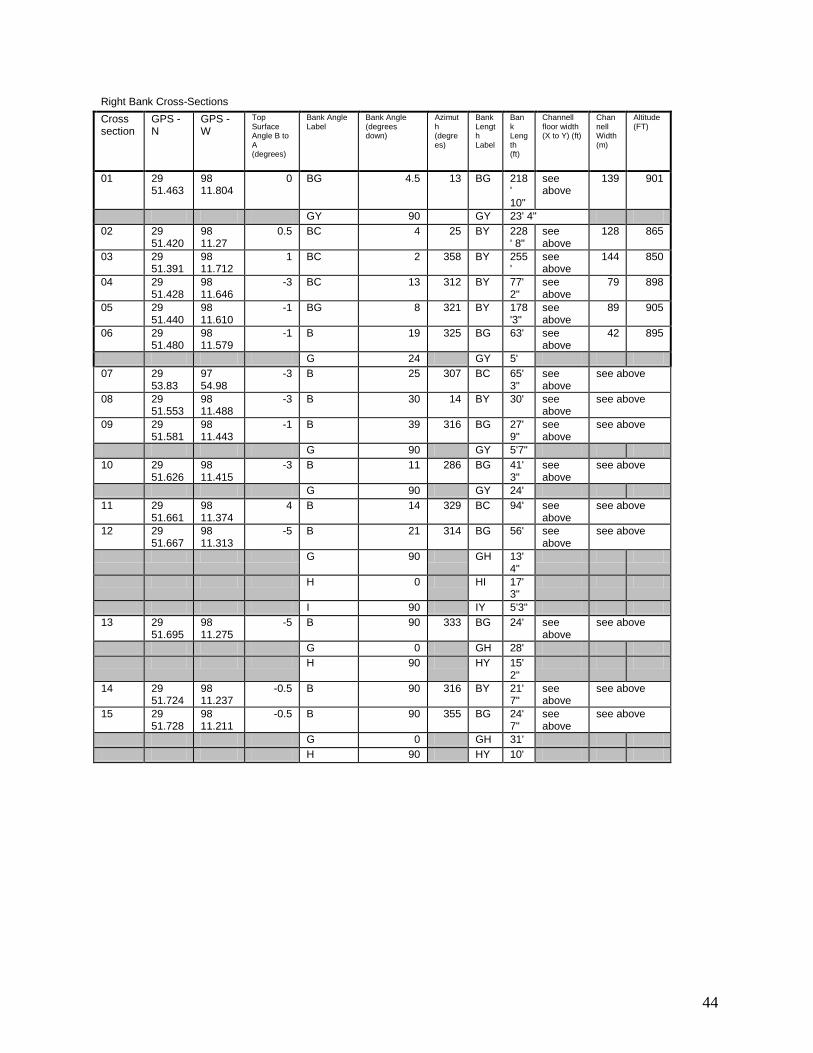
Right Bank Cross-Sections Cross section
GPS - N
GPS - W
Top Surface Angle B to A (degrees)
Bank Angle Label
Bank Angle (degrees down)
Azimuth (degrees)
Bank Length Label
Bank Length (ft)
Channell floor width (X to Y) (ft)
Channell Width (m)
Altitude (FT)
01 29 51.463
98 11.804
0 BG 4.5 13 BG 218' 10"
see above
139 901
GY 90 GY 23' 4"
02 29 51.420
98 11.27
0.5 BC 4 25 BY 228' 8"
see above
128 865
03 29 51.391
98 11.712
1 BC 2 358 BY 255'
see above
144 850
04 29 51.428
98 11.646
-3 BC 13 312 BY 77'2"
see above
79 898
05 29 51.440
98 11.610
-1 BG 8 321 BY 178'3"
see above
89 905
06 29 51.480
98 11.579
-1 B 19 325 BG 63' see above
42 895
G 24 GY 5'
07 29 53.83
97 54.98
-3 B 25 307 BC 65' 3"
see above
see above
08 29 51.553
98 11.488
-3 B 30 14 BY 30' see above
see above
09 29 51.581
98 11.443
-1 B 39 316 BG 27' 9"
see above
see above
G 90 GY 5'7"
10 29 51.626
98 11.415
-3 B 11 286 BG 41'3"
see above
see above
G 90 GY 24'
11 29 51.661
98 11.374
4 B 14 329 BC 94' see above
see above
12 29 51.667
98 11.313
-5 B 21 314 BG 56' see above
see above
G 90 GH 13'4"
H 0 HI 17'3"
I 90 IY 5'3"
13 29 51.695
98 11.275
-5 B 90 333 BG 24' see above
see above
G 0 GH 28'
H 90 HY 15'2"
14 29 51.724
98 11.237
-0.5 B 90 316 BY 21'7"
see above
see above
15 29 51.728
98 11.211
-0.5 B 90 355 BG 24' 7"
see above
see above
G 0 GH 31'
H 90 HY 10'
45
Cross-
section
Left
Bank
Label
Left Bank
Angle
(degrees)
Left Bank
Angle
(radians)
Left Bank
Length (ft)
Right Bank
Label
Right Bank
Angle
(degrees)
Right Bank
Angle
(radians)
Right
Bank
Length (ft)
Channe
l floor
width (X
to Y) (ft)
Channe
l Width
(ft) (X
to Y)
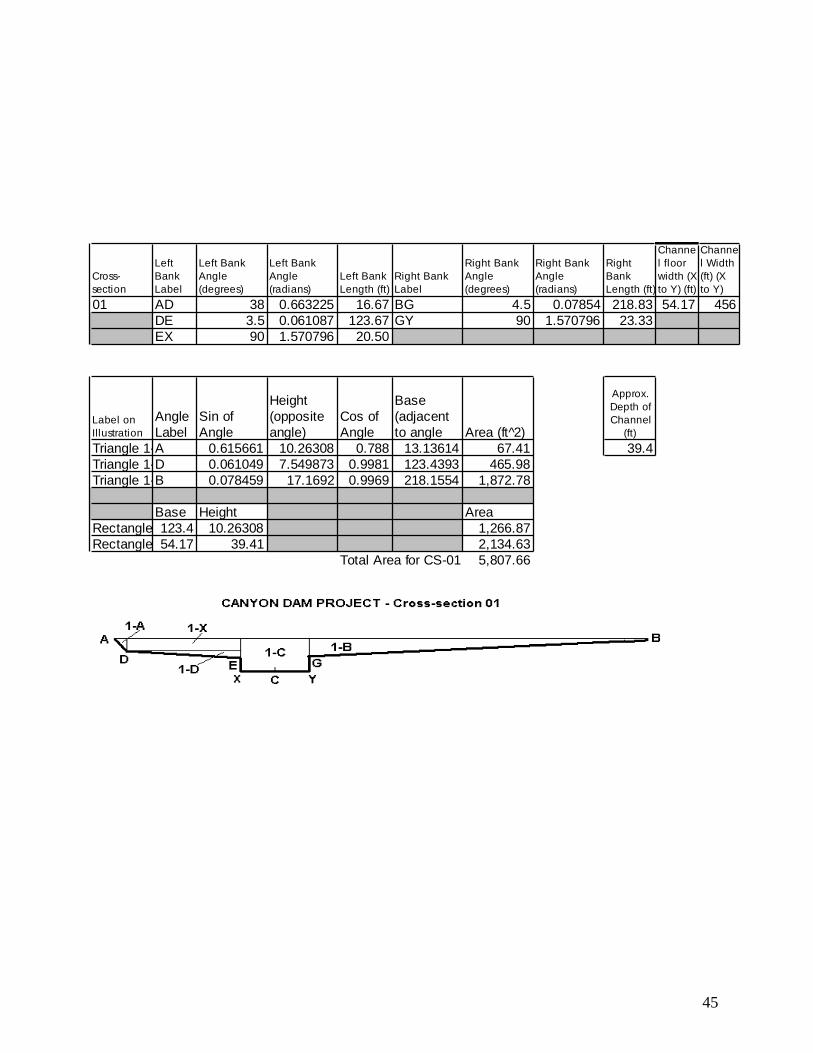
01 AD 38 0.663225 16.67 BG 4.5 0.07854 218.83 54.17 456
DE 3.5 0.061087 123.67 GY 90 1.570796 23.33
EX 90 1.570796 20.50
Label on
Illustration
Angle
Label
Sin of
Angle
Height
(opposite
angle)
Cos of
Angle
Base
(adjacent
to angle Area (ft^2)
Approx.
Depth of
Channel
(ft)
Triangle 1-AA 0.615661 10.26308 0.788 13.13614 67.41 39.4
Triangle 1-DD 0.061049 7.549873 0.9981 123.4393 465.98
Triangle 1-BB 0.078459 17.1692 0.9969 218.1554 1,872.78
Base Height Area
Rectangle 1-X123.4 10.26308 1,266.87
Rectangle 1-C54.17 39.41 2,134.63
Total Area for CS-01 5,807.66
46
Cross-section
Left
Bank
Label
Left Bank
Angle
(degrees)
Left Bank
Angle
(radians)
Left Bank
Length (ft)
Right Bank
Label
Right
Bank
Angle
(degrees)
Right Bank
Angle
(radians)
Right
Bank
Length
(ft)
Channel
l floor
width (X
to Y) (ft)
Channell
Width (ft)
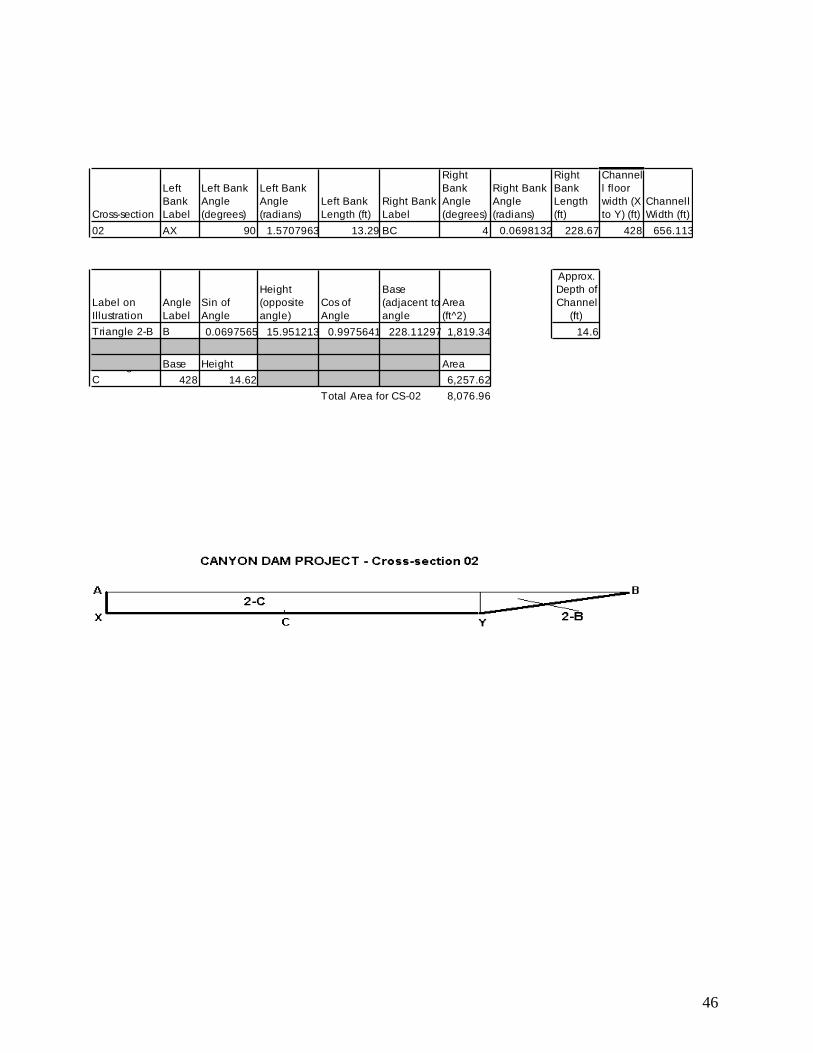
02 AX 90 1.5707963 13.29 BC 4 0.0698132 228.67 428 656.113
Label on
Illustration
Angle
Label
Sin of
Angle
Height
(opposite
angle)
Cos of
Angle
Base
(adjacent to
angle
Area
(ft^2)
Approx.
Depth of
Channel
(ft)
Triangle 2-B B 0.0697565 15.951213 0.9975641 228.11297 1,819.34 14.6
Base Height AreaRectangle 2-
C 428 14.62 6,257.62
Total Area for CS-02 8,076.96
47
Cross-section
Left Bank
Label
Left Bank
Angle
(degrees)
Left Bank
Angle
(radians)
Left Bank
Length (ft)
Right Bank
Label
Right
Bank
Angle
(degrees
)
Right Bank
Angle
(radians)
Right
Bank
Length
(ft)
Chann
el floor
width
(X to Y)
(ft)
Chann
el
Width
(ft)
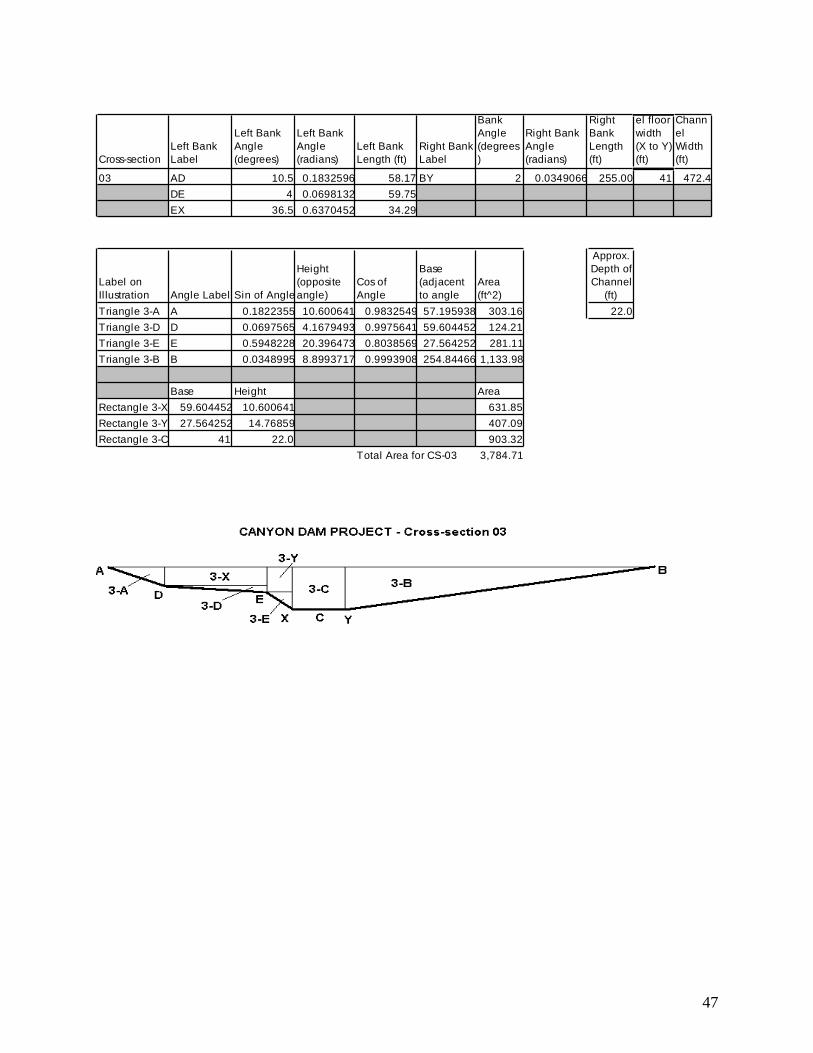
03 AD 10.5 0.1832596 58.17 BY 2 0.0349066 255.00 41 472.4
DE 4 0.0698132 59.75
EX 36.5 0.6370452 34.29
Label on
Il lustration Angle Label Sin of Angle
Height
(opposite
angle)
Cos of
Angle
Base
(adjacent
to angle
Area
(ft^2)
Approx.
Depth of
Channel
(ft)
Triangle 3-A A 0.1822355 10.600641 0.9832549 57.195938 303.16 22.0
Triangle 3-D D 0.0697565 4.1679493 0.9975641 59.604452 124.21
Triangle 3-E E 0.5948228 20.396473 0.8038569 27.564252 281.11
Triangle 3-B B 0.0348995 8.8993717 0.9993908 254.84466 1,133.98
Base Height Area
Rectangle 3-X 59.604452 10.600641 631.85
Rectangle 3-Y 27.564252 14.76859 407.09
Rectangle 3-C 41 22.0 903.32
Total Area for CS-03 3,784.71
48
Cross-section
Left
Bank
Label
Left Bank
Angle
(degrees)
Left Bank
Angle
(radians)
Left Bank
Length (ft)
Right Bank
Label
Right
Bank
Angle
(degrees)
Right Bank
Angle
(radians)
Right
Bank
Length
(ft)
Channel
floor width
(X to Y)
(ft)
Channel
Width (ft)
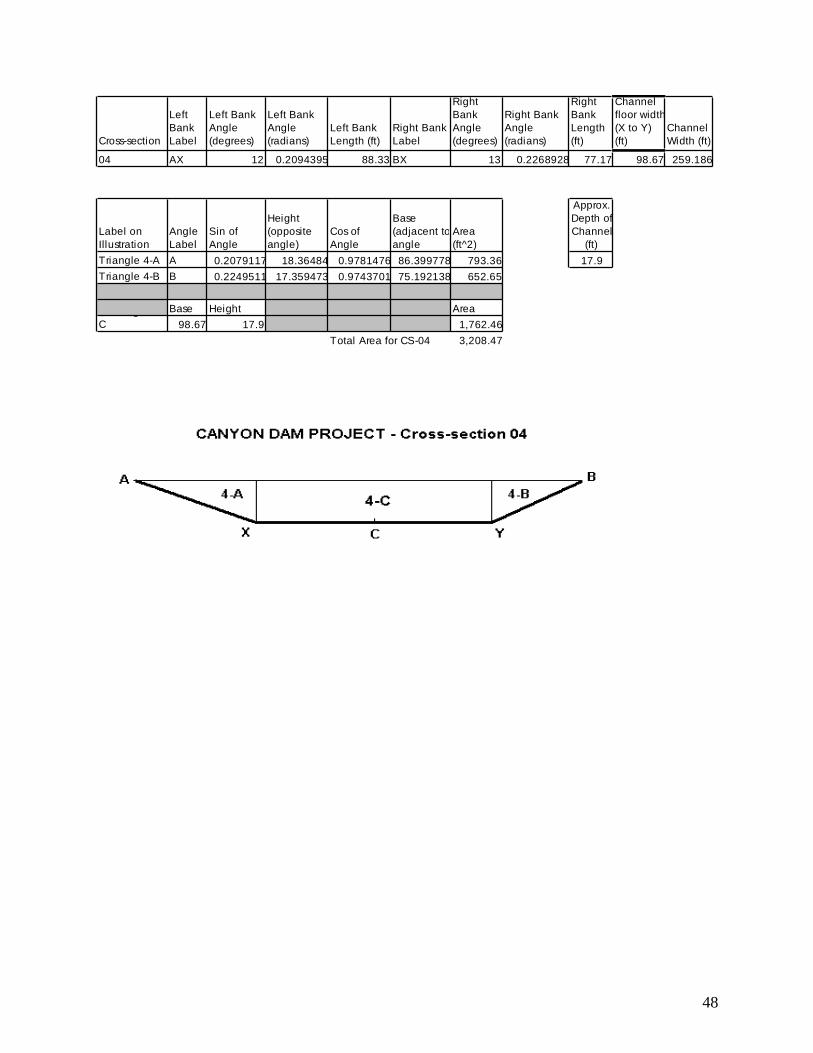
04 AX 12 0.2094395 88.33 BX 13 0.2268928 77.17 98.67 259.186
Label on
Illustration
Angle
Label
Sin of
Angle
Height
(opposite
angle)
Cos of
Angle
Base
(adjacent to
angle
Area
(ft^2)
Approx.
Depth of
Channel
(ft)
Triangle 4-A A 0.2079117 18.36484 0.9781476 86.399778 793.36 17.9
Triangle 4-B B 0.2249511 17.359473 0.9743701 75.192138 652.65
Base Height AreaRectangle 4-
C 98.67 17.9 1,762.46
Total Area for CS-04 3,208.47

49
Cross-section
Left
Bank
Label
Left Bank
Angle
(degrees)
Left Bank
Angle
(radians)
Left Bank
Length (ft)
Right Bank
Label
Right
Bank
Angle
(degrees)
Right Bank
Angle
(radians)
Right
Bank
Length
(ft)
Channel
floor
width (X
to Y) (ft)
Channel
Width (ft)
05 AD 15.5 0.270526034 46.58 BC 8 0.1396263 178.25 76.33 291.9948
DX 90 1.570796327 11.83
Label on
Illustration
Angle
Label
Sin of
Angle
Height
(opposite
angle) Cos of Angle
Base
(adjacent
to angle
Area
(ft^2)
Approx.
Depth of
Channel
(ft)
Triangle 5-A A 0.26724 12.44796356 0.9636305 44.885907 279.37 24.5
Triangle 5-B B 0.13917 24.80760525 0.9902681 176.51528 2,189.46
Base Height Area
Rectangle 5-C 76.33 24.5 1,873.35
Total Area for CS-05 4,342.18
50
Cross-section
Left Bank
Label
Left Bank
Angle
(degrees)
Left Bank
Angle
(radians)
Left Bank
Length (ft)
Right Bank
Label
Right
Bank
Angle
(degrees)
Right Bank
Angle
(radians)
Right
Bank
Length (ft)
Channe
l floor
width (X
to Y) (ft)
Channe
l Width
(ft)
06 AD 8 0.1396263 13.00 BY 19 0.33161256 63.00 34.25 137.8
DE 90 1.5707963 12.00 24 0.41887902 5.00
EF 14.5 0.2530727 26.08
FX 90 1.5707963 8.33
Label on
Illustration
Angle
Label Sin of Angle
Height
(opposite
angle) Cos of Angle
Base
(adjacent to
angle
Area
(ft^2)
Approx.
Depth of
Channel
(ft)
Triangle 6-A A 0.1391731 1.8092503 0.9902681 12.873485 11.65 25.6
Triangle 6-E E 0.25038 6.5299105 0.9681476 25.24929 82.44
Triangle 6-B B 0.3255682 20.510794 0.9455186 59.56767 610.89
Triangle 6-G G 0.4067366 2.0336832 0.9135455 4.5677273 4.64
Base Height Area
Rectangle 6-X 25.24929 13.81 348.67
Rectangle 6-Y 4.567727 20.51 93.69
Rectangle 6-C 34.25 25.6 877.03
Total Area for CS-06 2,029.01
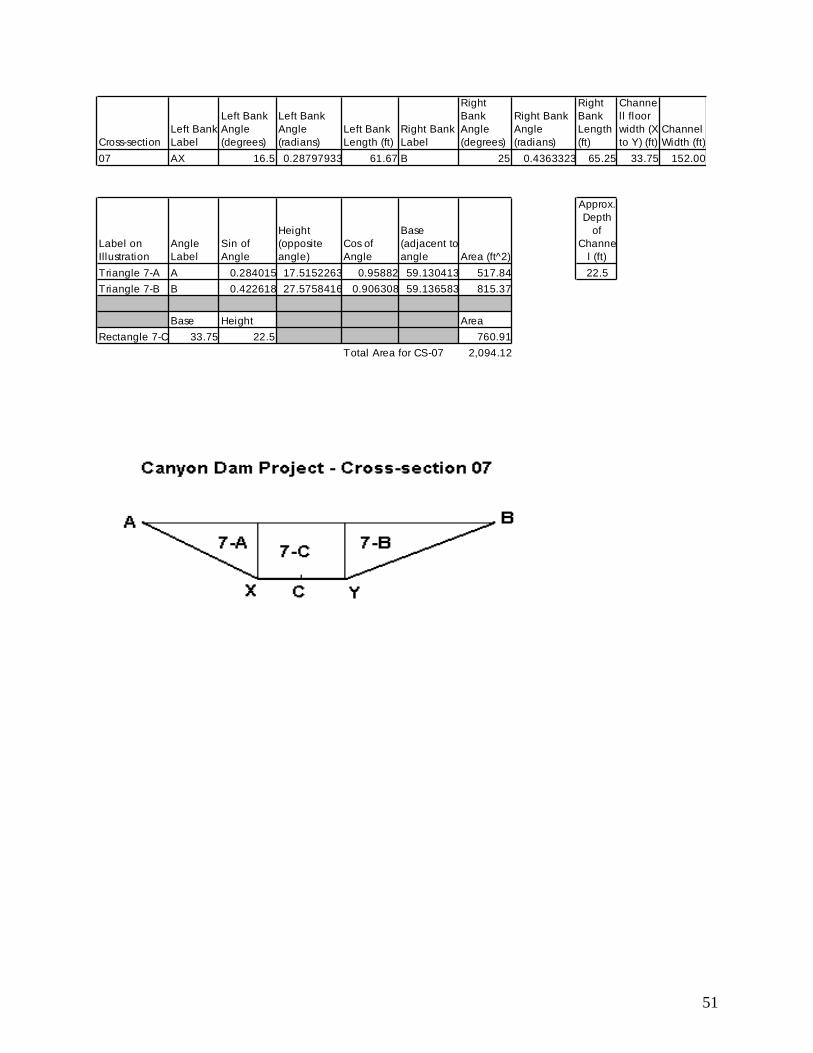
51
Cross-section
Left Bank
Label
Left Bank
Angle
(degrees)
Left Bank
Angle
(radians)
Left Bank
Length (ft)
Right Bank
Label
Right
Bank
Angle
(degrees)
Right Bank
Angle
(radians)
Right
Bank
Length
(ft)
Channe
ll floor
width (X
to Y) (ft)
Channel
Width (ft)
07 AX 16.5 0.28797933 61.67 B 25 0.4363323 65.25 33.75 152.00
Label on
Illustration
Angle
Label
Sin of
Angle
Height
(opposite
angle)
Cos of
Angle
Base
(adjacent to
angle Area (ft^2)
Approx.
Depth
of
Channe
l (ft)
Triangle 7-A A 0.284015 17.5152263 0.95882 59.130413 517.84 22.5
Triangle 7-B B 0.422618 27.5758416 0.906308 59.136583 815.37
Base Height Area
Rectangle 7-C 33.75 22.5 760.91
Total Area for CS-07 2,094.12
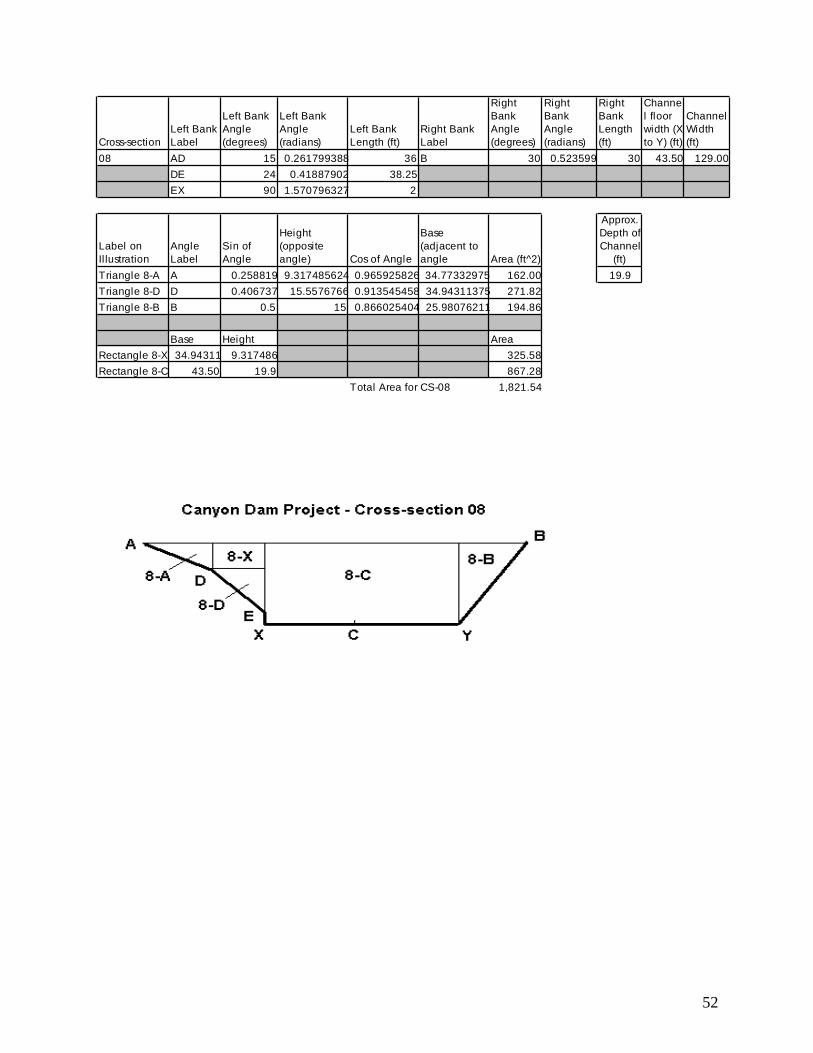
52
Cross-section
Left Bank
Label
Left Bank
Angle
(degrees)
Left Bank
Angle
(radians)
Left Bank
Length (ft)
Right Bank
Label
Right
Bank
Angle
(degrees)
Right
Bank
Angle
(radians)
Right
Bank
Length
(ft)
Channe
l floor
width (X
to Y) (ft)
Channel
Width
(ft)
08 AD 15 0.261799388 36 B 30 0.523599 30 43.50 129.00
DE 24 0.41887902 38.25
EX 90 1.570796327 2
Label on
Il lustration
Angle
Label
Sin of
Angle
Height
(opposite
angle) Cos of Angle
Base
(adjacent to
angle Area (ft^2)
Approx.
Depth of
Channel
(ft)
Triangle 8-A A 0.258819 9.317485624 0.965925826 34.77332975 162.00 19.9
Triangle 8-D D 0.406737 15.5576766 0.913545458 34.94311375 271.82
Triangle 8-B B 0.5 15 0.866025404 25.98076211 194.86
Base Height Area
Rectangle 8-X 34.94311 9.317486 325.58
Rectangle 8-C 43.50 19.9 867.28
Total Area for CS-08 1,821.54
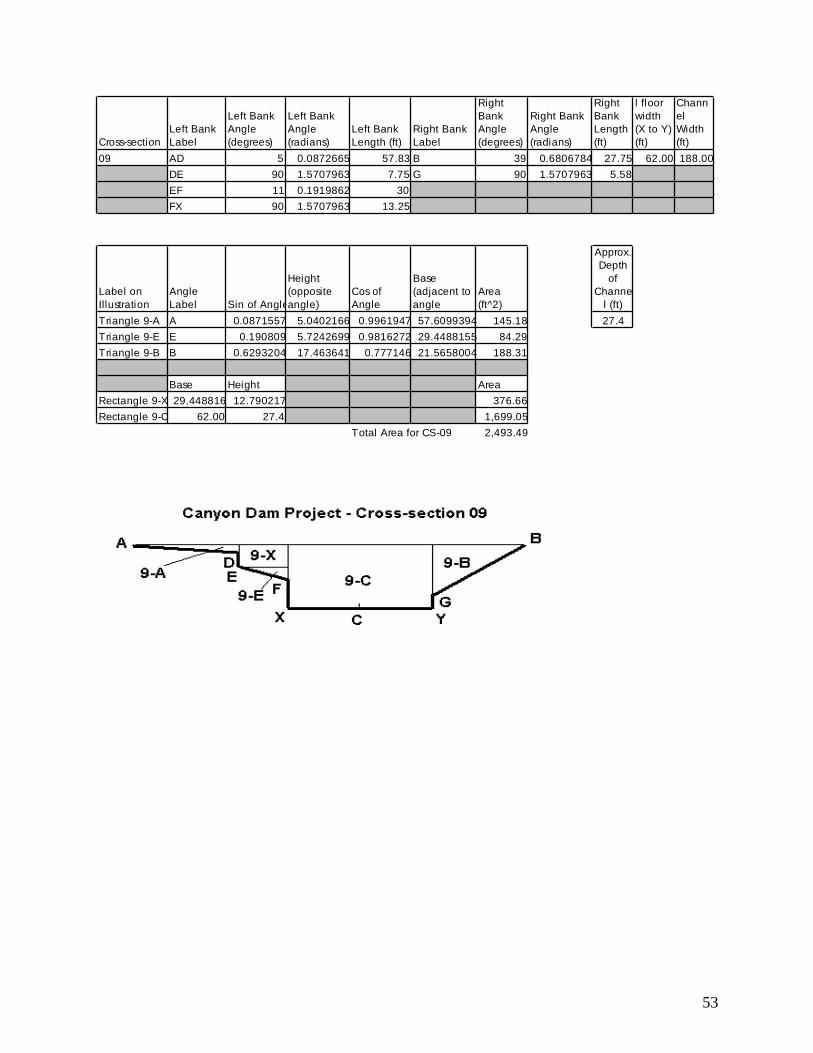
53
Cross-section
Left Bank
Label
Left Bank
Angle
(degrees)
Left Bank
Angle
(radians)
Left Bank
Length (ft)
Right Bank
Label
Right
Bank
Angle
(degrees)
Right Bank
Angle
(radians)
Right
Bank
Length
(ft)
Channe
l floor
width
(X to Y)
(ft)
Chann
el
Width
(ft)
09 AD 5 0.0872665 57.83 B 39 0.6806784 27.75 62.00 188.00
DE 90 1.5707963 7.75 G 90 1.5707963 5.58
EF 11 0.1919862 30
FX 90 1.5707963 13.25
Label on
Illustration
Angle
Label Sin of Angle
Height
(opposite
angle)
Cos of
Angle
Base
(adjacent to
angle
Area
(ft^2)
Approx.
Depth
of
Channe
l (ft)
Triangle 9-A A 0.0871557 5.0402166 0.9961947 57.6099394 145.18 27.4
Triangle 9-E E 0.190809 5.7242699 0.9816272 29.4488155 84.29
Triangle 9-B B 0.6293204 17.463641 0.777146 21.5658004 188.31
Base Height Area
Rectangle 9-X 29.448816 12.790217 376.66
Rectangle 9-C 62.00 27.4 1,699.05
Total Area for CS-09 2,493.49
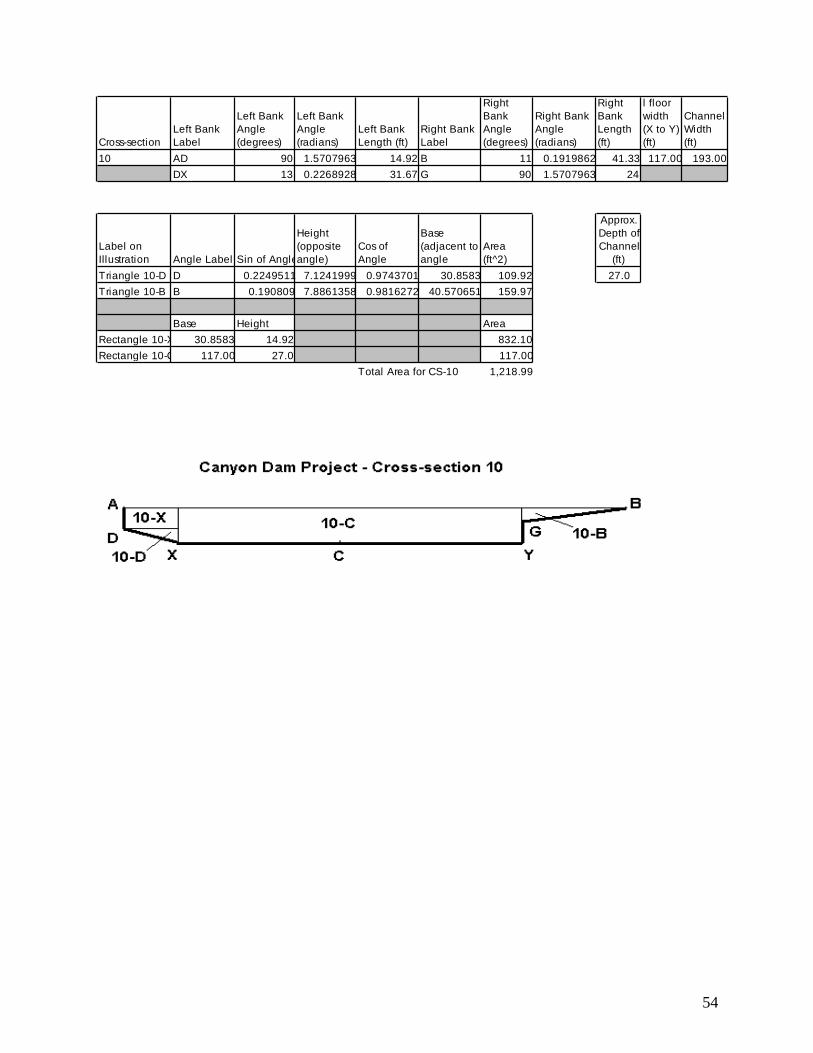
54
Cross-section
Left Bank
Label
Left Bank
Angle
(degrees)
Left Bank
Angle
(radians)
Left Bank
Length (ft)
Right Bank
Label
Right
Bank
Angle
(degrees)
Right Bank
Angle
(radians)
Right
Bank
Length
(ft)
Channe
l floor
width
(X to Y)
(ft)
Channel
Width
(ft)
10 AD 90 1.5707963 14.92 B 11 0.1919862 41.33 117.00 193.00
DX 13 0.2268928 31.67 G 90 1.5707963 24
Label on
Illustration Angle Label Sin of Angle
Height
(opposite
angle)
Cos of
Angle
Base
(adjacent to
angle
Area
(ft^2)
Approx.
Depth of
Channel
(ft)
Triangle 10-D D 0.2249511 7.1241999 0.9743701 30.8583 109.92 27.0
Triangle 10-B B 0.190809 7.8861358 0.9816272 40.570651 159.97
Base Height Area
Rectangle 10-X 30.8583 14.92 832.10
Rectangle 10-C 117.00 27.0 117.00
Total Area for CS-10 1,218.99
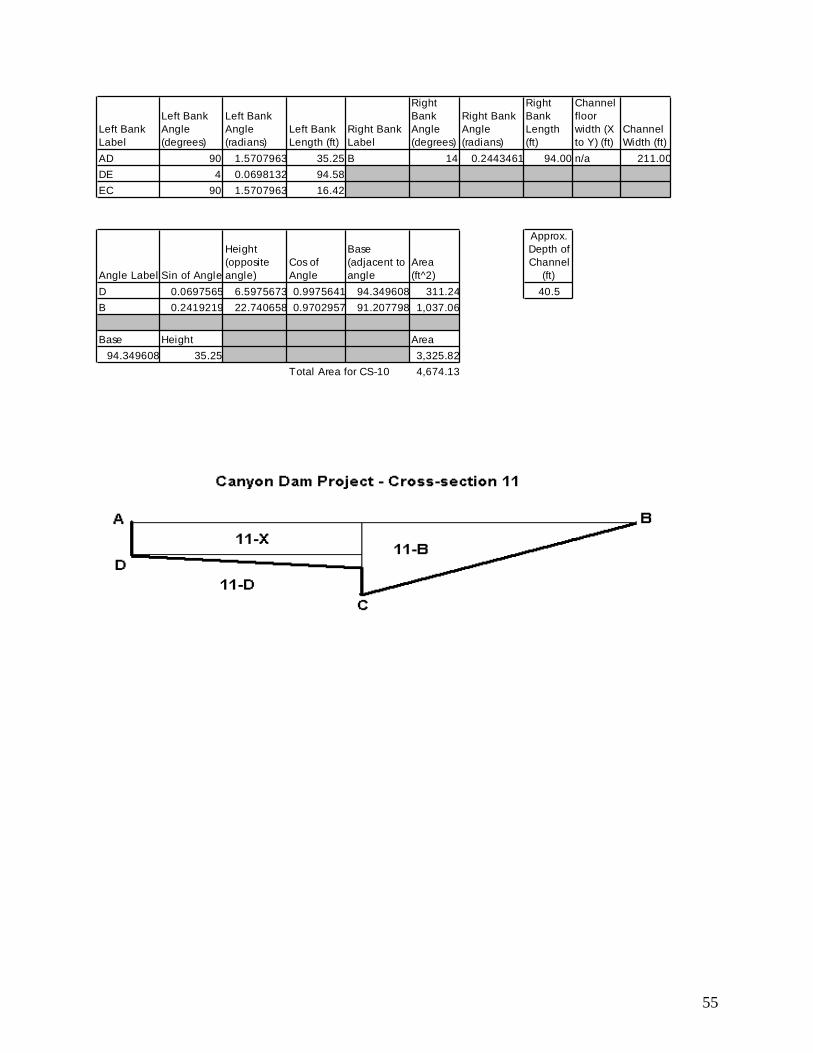
55
Left Bank
Label
Left Bank
Angle
(degrees)
Left Bank
Angle
(radians)
Left Bank
Length (ft)
Right Bank
Label
Right
Bank
Angle
(degrees)
Right Bank
Angle
(radians)
Right
Bank
Length
(ft)
Channel
floor
width (X
to Y) (ft)
Channel
Width (ft)
AD 90 1.5707963 35.25 B 14 0.2443461 94.00 n/a 211.00
DE 4 0.0698132 94.58
EC 90 1.5707963 16.42
Angle Label Sin of Angle
Height
(opposite
angle)
Cos of
Angle
Base
(adjacent to
angle
Area
(ft^2)
Approx.
Depth of
Channel
(ft)
D 0.0697565 6.5975673 0.9975641 94.349608 311.24 40.5
B 0.2419219 22.740658 0.9702957 91.207798 1,037.06
Base Height Area
94.349608 35.25 3,325.82
Total Area for CS-10 4,674.13
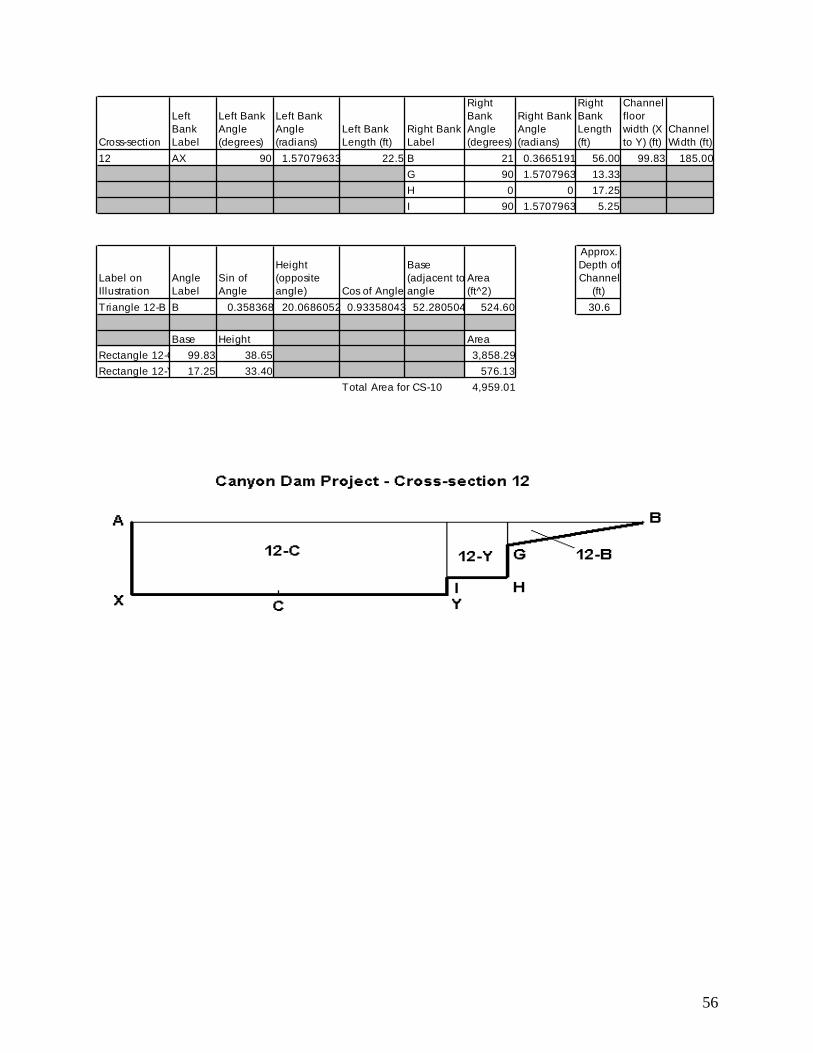
56
Cross-section
Left
Bank
Label
Left Bank
Angle
(degrees)
Left Bank
Angle
(radians)
Left Bank
Length (ft)
Right Bank
Label
Right
Bank
Angle
(degrees)
Right Bank
Angle
(radians)
Right
Bank
Length
(ft)
Channel
floor
width (X
to Y) (ft)
Channel
Width (ft)
12 AX 90 1.57079633 22.5 B 21 0.3665191 56.00 99.83 185.00
G 90 1.5707963 13.33
H 0 0 17.25
I 90 1.5707963 5.25
Label on
Illustration
Angle
Label
Sin of
Angle
Height
(opposite
angle) Cos of Angle
Base
(adjacent to
angle
Area
(ft^2)
Approx.
Depth of
Channel
(ft)
Triangle 12-B B 0.358368 20.0686052 0.93358043 52.280504 524.60 30.6
Base Height Area
Rectangle 12-C 99.83 38.65 3,858.29
Rectangle 12-Y 17.25 33.40 576.13
Total Area for CS-10 4,959.01
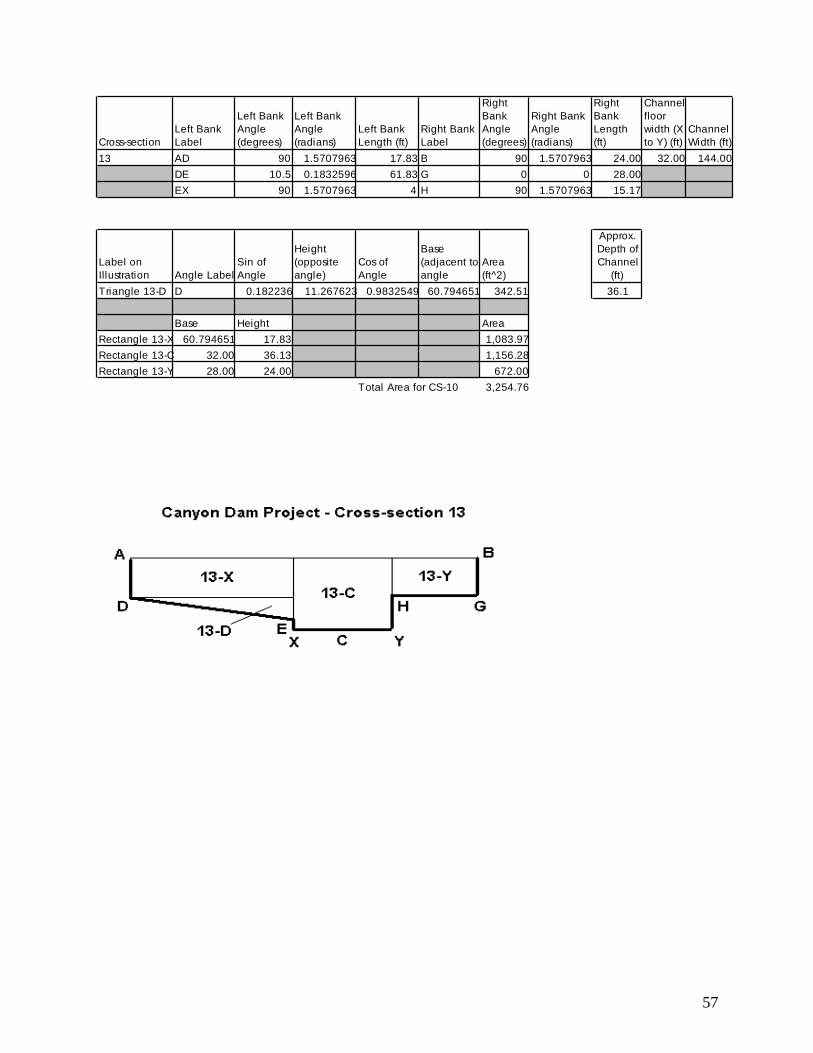
57
Cross-section
Left Bank
Label
Left Bank
Angle
(degrees)
Left Bank
Angle
(radians)
Left Bank
Length (ft)
Right Bank
Label
Right
Bank
Angle
(degrees)
Right Bank
Angle
(radians)
Right
Bank
Length
(ft)
Channel
floor
width (X
to Y) (ft)
Channel
Width (ft)
13 AD 90 1.5707963 17.83 B 90 1.5707963 24.00 32.00 144.00
DE 10.5 0.1832596 61.83 G 0 0 28.00
EX 90 1.5707963 4 H 90 1.5707963 15.17
Label on
Illustration Angle Label
Sin of
Angle
Height
(opposite
angle)
Cos of
Angle
Base
(adjacent to
angle
Area
(ft^2)
Approx.
Depth of
Channel
(ft)
Triangle 13-D D 0.182236 11.267623 0.9832549 60.794651 342.51 36.1
Base Height Area
Rectangle 13-X 60.794651 17.83 1,083.97
Rectangle 13-C 32.00 36.13 1,156.28
Rectangle 13-Y 28.00 24.00 672.00
Total Area for CS-10 3,254.76
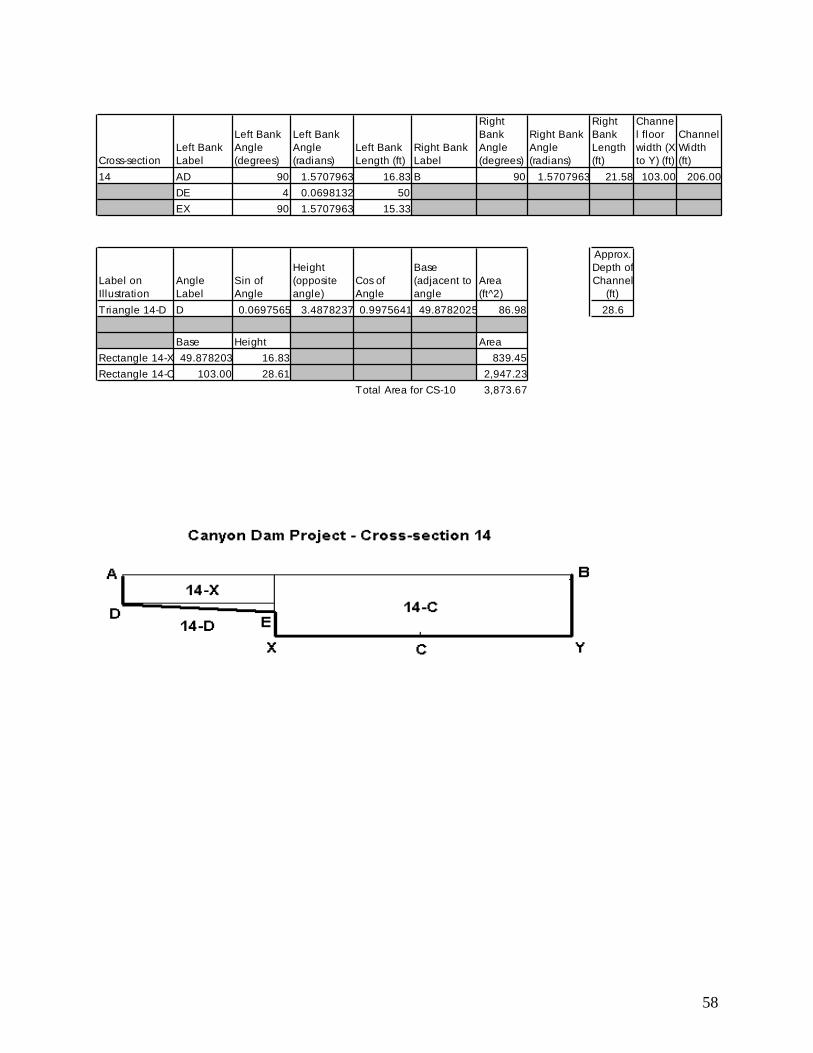
58
Cross-section
Left Bank
Label
Left Bank
Angle
(degrees)
Left Bank
Angle
(radians)
Left Bank
Length (ft)
Right Bank
Label
Right
Bank
Angle
(degrees)
Right Bank
Angle
(radians)
Right
Bank
Length
(ft)
Channe
l floor
width (X
to Y) (ft)
Channel
Width
(ft)
14 AD 90 1.5707963 16.83 B 90 1.5707963 21.58 103.00 206.00
DE 4 0.0698132 50
EX 90 1.5707963 15.33
Label on
Illustration
Angle
Label
Sin of
Angle
Height
(opposite
angle)
Cos of
Angle
Base
(adjacent to
angle
Area
(ft^2)
Approx.
Depth of
Channel
(ft)
Triangle 14-D D 0.0697565 3.4878237 0.9975641 49.8782025 86.98 28.6
Base Height Area
Rectangle 14-X 49.878203 16.83 839.45
Rectangle 14-C 103.00 28.61 2,947.23
Total Area for CS-10 3,873.67
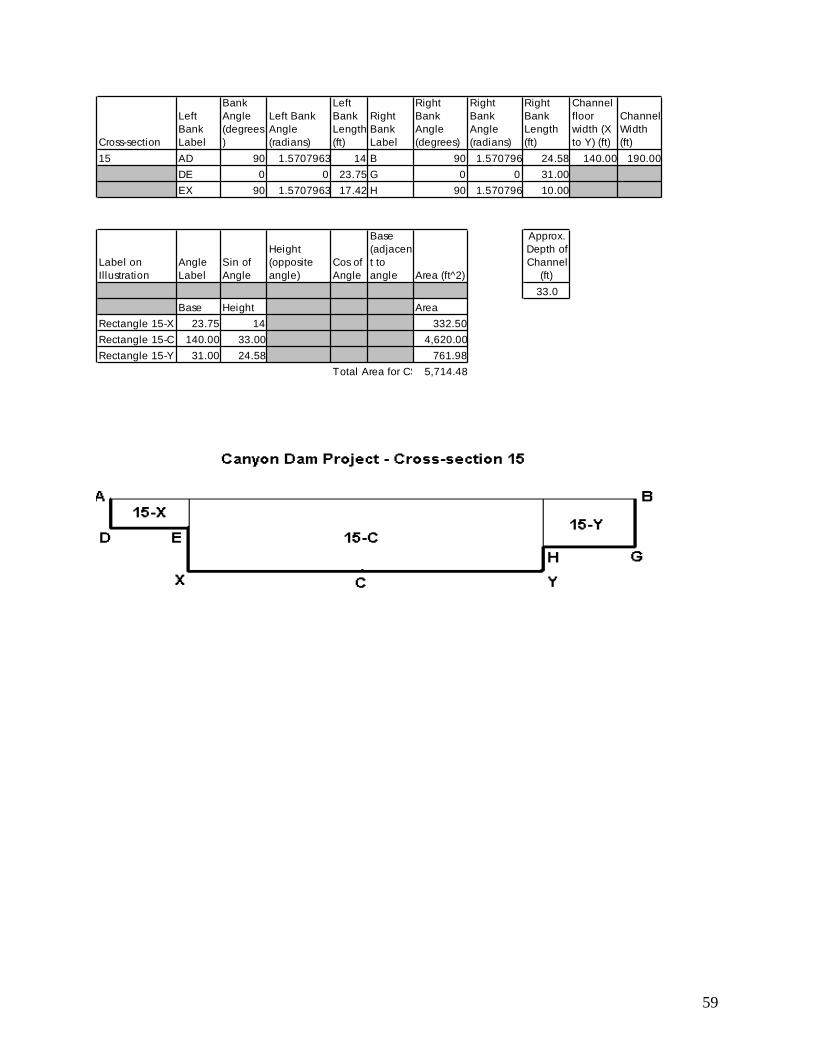
59
Cross-section
Left
Bank
Label
Left
Bank
Angle
(degrees
)
Left Bank
Angle
(radians)
Left
Bank
Length
(ft)
Right
Bank
Label
Right
Bank
Angle
(degrees)
Right
Bank
Angle
(radians)
Right
Bank
Length
(ft)
Channel
floor
width (X
to Y) (ft)
Channel
Width
(ft)
15 AD 90 1.5707963 14 B 90 1.570796 24.58 140.00 190.00
DE 0 0 23.75 G 0 0 31.00
EX 90 1.5707963 17.42 H 90 1.570796 10.00
Label on
Illustration
Angle
Label
Sin of
Angle
Height
(opposite
angle)
Cos of
Angle
Base
(adjacen
t to
angle Area (ft^2)
Approx.
Depth of
Channel
(ft)
33.0
Base Height Area
Rectangle 15-X 23.75 14 332.50
Rectangle 15-C 140.00 33.00 4,620.00
Rectangle 15-Y 31.00 24.58 761.98
Total Area for CS-105,714.48
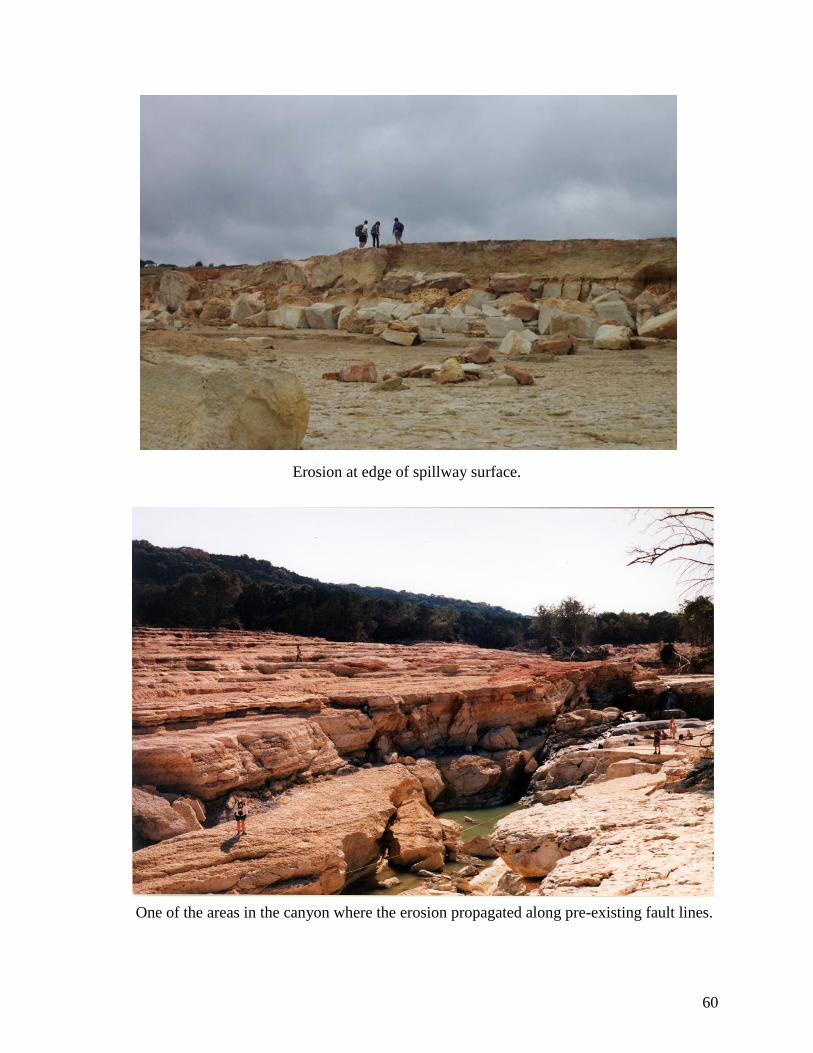
60
Erosion at edge of spillway surface.
One of the areas in the canyon where the erosion propagated along pre-existing fault lines.
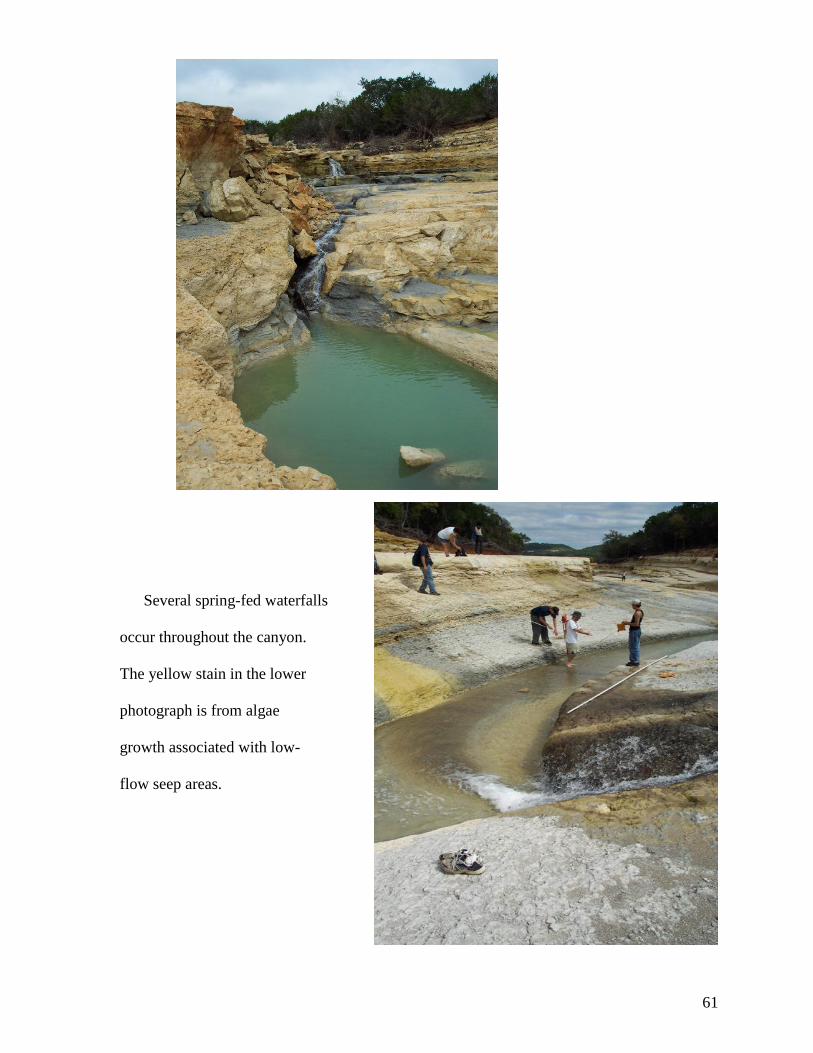
61
Several spring-fed waterfalls
occur throughout the canyon.
The yellow stain in the lower
photograph is from algae
growth associated with low-
flow seep areas.
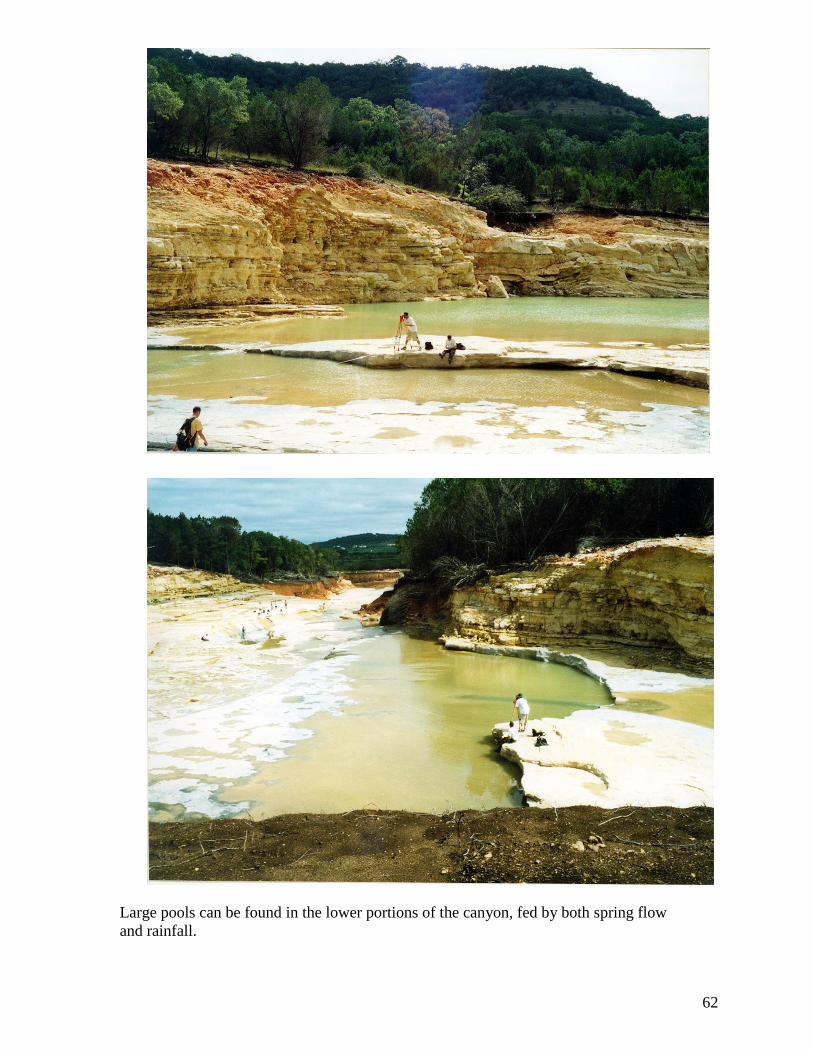
62
Large pools can be found in the lower portions of the canyon, fed by both spring flow
and rainfall.
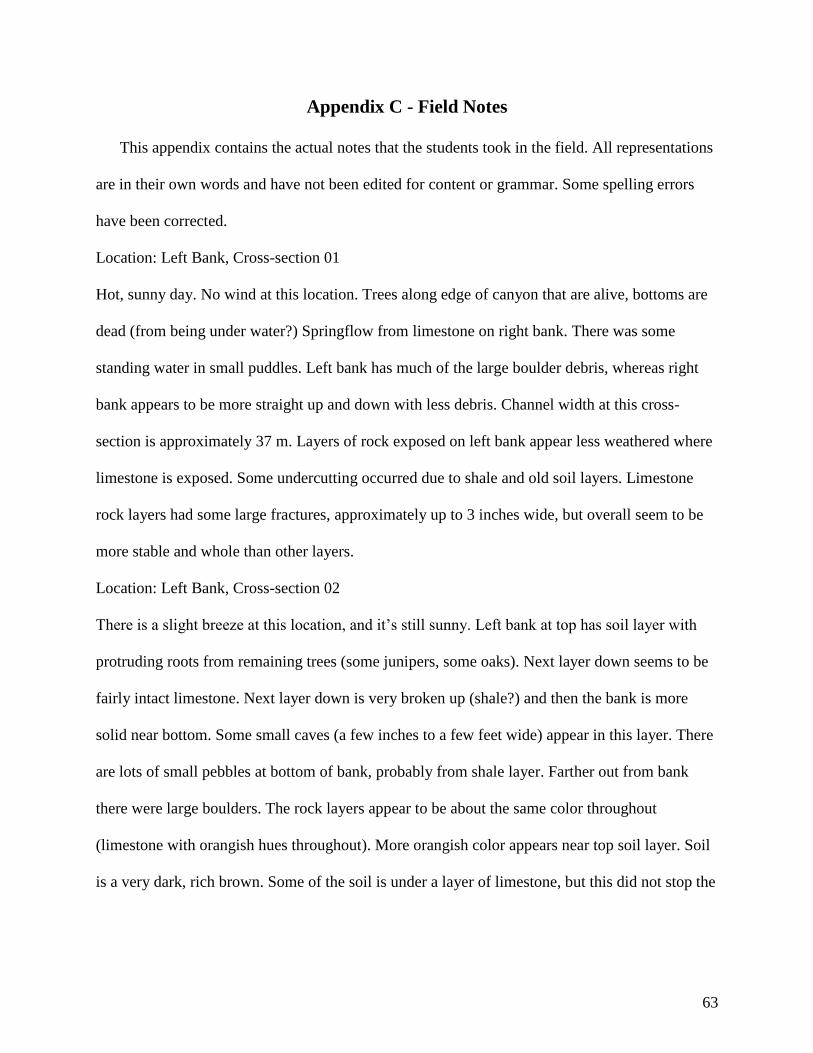
63
Appendix C - Field Notes
This appendix contains the actual notes that the students took in the field. All representations
are in their own words and have not been edited for content or grammar. Some spelling errors
have been corrected.
Location: Left Bank, Cross-section 01
Hot, sunny day. No wind at this location. Trees along edge of canyon that are alive, bottoms are
dead (from being under water?) Springflow from limestone on right bank. There was some
standing water in small puddles. Left bank has much of the large boulder debris, whereas right
bank appears to be more straight up and down with less debris. Channel width at this cross-
section is approximately 37 m. Layers of rock exposed on left bank appear less weathered where
limestone is exposed. Some undercutting occurred due to shale and old soil layers. Limestone
rock layers had some large fractures, approximately up to 3 inches wide, but overall seem to be
more stable and whole than other layers.
Location: Left Bank, Cross-section 02
There is a slight breeze at this location, and it’s still sunny. Left bank at top has soil layer with
protruding roots from remaining trees (some junipers, some oaks). Next layer down seems to be
fairly intact limestone. Next layer down is very broken up (shale?) and then the bank is more
solid near bottom. Some small caves (a few inches to a few feet wide) appear in this layer. There
are lots of small pebbles at bottom of bank, probably from shale layer. Farther out from bank
there were large boulders. The rock layers appear to be about the same color throughout
(limestone with orangish hues throughout). More orangish color appears near top soil layer. Soil
is a very dark, rich brown. Some of the soil is under a layer of limestone, but this did not stop the
64
tree roots from reaching it. Notably, many of the rock fragments at the bottom of the banks in the
canyon have remnants of roots sticking out of the cracks.
Largest boulders are downstream of trees in middle of canyon that were not removed by
flow. They range in size from pebbles to car-sized boulders (about 6 to 8 ft long and 5 ft wide) of
limestone. Another large pile of boulders is located after several lobes appear to have slowed the
flow of water enough to deposit these rocks. These lobes look like old bedrock, and are undercut
where there is old soil or shale that has more easily been weathered away. There are muddy areas
on the channel bottom due to standing water. The mud is the same yellowish color as the rocks
that make up the channel. The channel bottom surface is very rough, with very little loose
material. Loose stuff is generally near the channel walls.
Location: Left Bank, Cross-section 03
Top layer of bank is composed of thick (about 2 feet), fairly intact limestone. An orange/pink
layer under that is more striated and brittle like shale. A similar layer under this is more yellow
in color. The next layer then juts out a bit. It’s lighter in color and comparatively solid. Just
below this is karst, with springflow emerging from the bottom of it. Algae grow here, and where
the water emerges the bank is a bit undercut. The bottom of the channel is fairly flat with some
standing and some flowing water. There are a few insects in and around the water. Especially
notable is the presence of tadpoles in the standing water. Other fauna includes black wormlike
creatures in the areas of running water (leeches?). I also saw a hawk here and some tracks of a
large bird.
Location: Left Bank, Cross-section 04
Top of bank was slightly angled toward channel with trees set back from sloping portion.
Very large trees were at the bottom of the slope before a steep drop off. One of the trees had an
65
exposed root ball that was 10 to 12 feet across. At the drop off section of the bank, there were
two layers of pocked grayish rock, maybe a different limestone. There were large boulders at the
base of the drop up to about 6 feet across. Water flowed through the area due to springflow. The
spring came out of a karst layer near the bottom of the channel drop off. The left bank was again
the steeper bank and the water flow occurred near this side of the channel. The right bank area
contained some silvery, clayish material (marl? ash?).
Location: Left Bank, Cross-section 05
Top layer of left bank was covered in trees were slope was slight, then a layer of slightly
sloping karst limestone emerged and jutted out. Under this layer was a hard, very solid with few
breaks layer of limestone that jutted out slightly more. Next was a layer of karst that was
undercut into the cliff and some springflow emerged. Next layer down was very brittle and jutted
out in a pointy fashion (shale?). The lip of a hard rock jutted out from this which was hard,
orangish in color, and interspersed with the gray clay (marl?). Near the bottom of the bank was a
shallow channel about 8-10” deep and 4 to 5 feet wide. The waterfall leading to this cross-
section was gorgeous!!!
Location: Left Bank, Cross-section 06
Top of bank was composed of hard bedrock and jutted out. The undercut layer beneath is was
a yellowish shale. Next down from that looked like about 12 feet of very old soil (composition?).
There was then a flat lobe of bedrock again, then a porous limestone layer, fairly solid limestone,
and a bit of springflow from the next 10 foot drop. Not much flow, but the rocks were moist.
There was a scary chunk of bedrock about 6 feet thick on the right bank that was undercut by a
very weak layer of shale that made these cool cave-like formations.