Embed Size (px)
Citation preview
Running head: PERCEIVED SAFETY SCALE 1
The Creation and Validation of the Perceived Safety Scale
Stylianos Syropoulos
Franklin and Marshall College
Department of Psychology
Independent Study in Psychology (PSY 490)
Date of Graduation: 05/12/2018
Date of Submission: 04/16/2018
PERCEIVED SAFETY SCALE 2
Abstract
Safety is necessary for all societies. Without safety, our lives are impaired. In order to have an
accurate understanding of how safety is perceived across individuals and communities, the
proper assessment of safety perceptions is vital. Previous research has not used one standardized
measure; instead, researchers have used either one item to measure perceived safety or related
scales pertaining to walkability (i.e., the degree to which a neighborhood or city is considered
safe for walking) and fear of crime. The main goal of the present studies was to construct and
validate a measure of perceived safety that will encompass the complex nature of safety. In
exploratory Studies 1 and 2, Principal Component Analysis revealed that four factors seem to
explain variance in the overall perception of safety: Fear of Crime, Feeling Safe, Neighborhood
Walkability and Safety Confidence. Study 3 utilized a confirmatory factor analysis to confirm
the validation of the scale and replicate the previous findings. The construction of this measure
will allow researchers to build meaningful interventions and allow future cross-cultural and
meta-analytic studies to be conducted.
PERCEIVED SAFETY SCALE 3
-Safety is something that happens between your ears, not something you hold in your hands.
-Jeff Cooper
The Creation and Validation of the Perceived Safety Scale
Safety is not only a crucial aspect of our lives, it is also a pre-requisite for societies to
prosper and flourish (Galtung, 1969; Maslow 1943). We only have to look into the news to
understand that safety is a widely discussed topic of today’s society, with mass shootings, racial
issues and cross-national conflict constantly affecting how safe individuals feel. Thus, despite
living in the most peaceful era in human history (Pinker, 2012), these recurrent local and national
events (e.g., terrorist attacks, police brutality, mass shootings) continually challenge daily
experiences of safety. Adding to this phenomenon, the complex character of safety only
increases the difficulty of measuring it as a construct. Different facets of safety pertain to
different aspects of life, such as health (Dierynck, Leroy, Savage, & Choi, 2017; Elf, Nordin,
Wijk, & Mckee, 2017), occupation (Sheehan et al., 2016), and living conditions (Maillot,
Dommes, Dang, & Vienne, 2017). As psychologists currently lack a proper measure of safety
(see Hinkle, 2015), the present research sought to introduce a new measure of safety that can be
used to examine the complex and fundamental construct.
Effect of a Safe/Unsafe Environment on an Individual
Living in an unsafe neighborhood directly influences a person’s health. People who do
not feel safe, for example, tend not to enjoy recreational activities (Snyder & Evans, 2017) which
negatively impacts their life satisfaction. Moreover, health is negatively impacted by high
anxiety (Davidson et al., 2016) and stress (Henderson et al., 2016; Won, Lee, Forjuoh, & Ory,
2016), which are caused by the lack of safety. Adding to these, safety is associated with reduced
PERCEIVED SAFETY SCALE 4
walkability (i.e., the degree to which a neighborhood or city is considered safe for walking)
leading to increased levels of obesity and other negative effects on physical health (Burdette,
Wadden, & Whitaker, 2006; Ferrão et al., 2013; Sundquist, Eriksson, Mezuk, & Ohlsson, 2015),
particularly for older adults (Towne et al., 2016; Won, Forjuoh & Ory, 2016).
In addition to walkability, being in a safe neighborhood greatly affects parenting style
and child development. Higher fear of crime, higher crime rates, and reduced feelings of safety
are associated with more austere parenting styles (McDonell, 2007). Studies have also shown
that parental warmth (Tendulkar et al., 2010) and parental restriction (Cooper-Vince et al., 2014)
are affected by neighborhood safety. Neighborhood safety is, in turn, correlated with reduced
physical activity outside of the home (Fueyo et al., 2016), as well as increased anxiety (Vieno et
al., 2010) and decreased self-esteem and motivation (Roan-Belle, 2015) in early adolescence. To
combat these negative outcomes, applied research has focused on interventions that increase
safety through the introduction of new lighting and revitalization programs (Dulin-Keita et al.,
2015).
Additionally, safety is impacted by demographic factors such as age, gender, and race,
with older adults, and minorities feeling less safe overall (Jiang et al., 2017). Furthermore,
women feel less safe than men (Camerino, 2016; Jiang, Mak, Larsen, & Zhong, 2017; Zaplluzha
& Shahini, 2016). Age, socioeconomic status, neighborhood type and familiarity also have been
shown to be predictors of safety, with the elderly, a more urban and unfamiliar neighborhood
together with a low socioeconomic status being predictors of lowers levels of safety (Semyonov,
Gorodzeisky, & Glikman, 2012).
In academic settings, when students do not feel safe, their academic performance tends to
suffer (Hamada et al., 2016; Martin-Storey & Crosnoe, 2014; Milam, Furr-Holden, & Leaf,
PERCEIVED SAFETY SCALE 5
2010; Nijs et al., 2014). Being the victim of school violence in turn decreases perceptions of
safety while at school (Yablon & Addington, 2017), creating a cycle of unsafety that negatively
affects both the emotional and physical health of the students, as well as the function of the
school as an institution. Further, being victimized and bullied at school, which is more prevalent
in unsafe institutions, is associated with a higher risk for suicidal behavior (Brunstein-Klomek et
al., 2007) and an increased need for mental health services (Evans-Lacko et al., 2017). Increased
fear of victimization in school can also lead to students being more likely to carry a firearm at
school (May, 1999).
Perceived safety mediates street harassment and anxiety experienced while outside one’s
household (Davidson et al., 2016). Feeling unsafe is also associated with experiencing
uncertainty in one’s life which can be the underlying cause for chronic anxiety, stress, obesity,
loneliness and depression (Brosschot, Verkuil, & Thayer, 2016). Moreover, one study has linked
neighborhood unsafety with childhood psychopathology, and in particular emotional disorders
(Meltzer et al., 2007).
Feeling unsafe is often tied with habituating an aesthetically unpleasing and not socially
cohesive environment (Ruijsbroek et al., 2015). In some specific cases, safety has also been
correlated with the feeling of solidarity, which in turn increased safety, and the aesthetic appeal
of a touristic attraction (Woosnam et al., 2015). Other works on the relationship between tourism
and safety have revealed that in order for tourists to go out more at night, safety is a necessary
pre-requisite (George, 2003). In a study conducted in Cape Town (George, 2003), participants
agreed that they did not feel safe roaming the streets at night which in turn reduced their
satisfaction. Outside of tourism, perceived neighborhood safety is associated with a better quality
of sleep (Hill et al., 2016), while also being intertwined with a higher level of well-being in
PERCEIVED SAFETY SCALE 6
children living both in rural and urban areas (Eriksson et al., 2011).
Commonly Used Items Assessing Safety
As safety is a prerequisite for happy and healthy lives, it is necessary for experts to utilize
an instrument that will adequately examine perceived safety and all of its facets. The majority of
past research has used a variety of instruments to measure safety. Some studies have used a
single-item measure (e.g., “I feel safe walking alone late at night” or “I generally feel safe”;
Booth, Ayers, & Marsiglia, 2012; Boxer et al., 2003; Eriksson, Hochwälder, & Sellström, 2011;
Latham & Clarke, 2013; Mason et al., 2009; Mulvey, 2002; Nijs et al., 2014; Ozer & Weinstein,
2004; Peña, García, Hurtado, & Aguilar-Luzón, 2015; Semyonov, Gorodzeisky, & Glikman,
2012; Sun et al., 2012; Thibodeaux, 2013; Tucker-Seeley, Subramanian, Li, & Sorensen, 2009;
Wiebet et al., 2013). Because safety is affected by a variety of external factors (e.g., prevalence
of crime, neighborhood walkability) and internal factors (e.g., anxiety, confidence), and because
safety can have myriad cognitive, emotional, and behavioral manifestations, using only one item
to measure safety might not encompass the multidimensional nature of this experience and
significantly reduces its external validity. To illustrate this point, imagine two stereotypical
university students: a male student athlete and a female who is socially anxious and usually
keeps to herself. The male athlete would be more likely to perceive an environment as less
dangerous and perhaps more likely to confront a suspect due to his increased physical stature and
strength. On the contrary, a person who is lonely, more anxious in social environments, and has
fewer social interactions may be more likely to feel unsafe and perceive threat more often and
generally feel less safe due to the lack of physical strength and perceived support.
Other studies tend to measure fear of crime instead of perceived safety. These studies
asked participants to express their fear and perceived vulnerability with regard to various types
PERCEIVED SAFETY SCALE 7
of crimes (Barni, Vieno, Roccato, & Russo, 2016; De Biasi, 2017; Hur & Nasar, 2014; Keane,
1998; Rollwagen, 2016; Toet & van Schaik, 2012; Wilson-Doenges, 2000). While fear of crime
is a crucial aspect of safety, it is not the only aspect that matters. To examine this, we can refer
back to the example of the varsity athlete and the socially withdrawn individual. Recall that there
is more than one factor that these two individuals potentially might differ when safety is
concerned. One might perceive more danger due to her stature, while the other might not. This is
linked with perceptions of safety and unsafety, and not directly with fear of crime. Fear of crime
captures the feeling of being afraid that a particular crime will happen to you, in other words, it is
a fear of victimization. That is why after all, previous works have measured fear of crime by
asking participants how afraid of a certain type of crime they are. This only reflects part of their
perception of safety. For example, both individuals (athlete and socially withdrawn) might be
afraid of crime, due to a recent crime spree in their neighborhood, despite one (the athlete) being
more likely to walk alone at night and confront a suspect, or both could also not be afraid of
crime due to a low crime rate in their neighborhood.
In a real life setting other factors would also influence how safe an individual might feel.
Physical stature and trust in one’s self and their ability to remain safe might greatly increase or
decrease fear of crime. For example, a person can be of a small stature but know enough self-
defense or carry a firearm thus reducing fear of crime greatly, while a person who is perceived as
more capable of protecting themselves might still experience a greater fear of crime, especially if
they have been the victim of a traumatic event in their past. Another case might be that a person
feels very safe in general, but instead they might be very afraid of crime. Their daily life might
be very safe resulting in high scores in safety but low scores in fear of crime. Thus, as an
PERCEIVED SAFETY SCALE 8
individual characteristic, fear of crime should not generalized and thought as a perception of
safety, but rather as a facet of safety specifically focusing on crime and victimization.
Another measure that has been widely used in scientific literature for the purposes of
measuring safety (to some extent) is neighborhood walkability (Bracy et al., 2014; Brown et al.,
2014; Datar, Nicosia, Wong, & Shier, 2015; De Meester et al., 2013; Evenson, 2006; Foster et
al., 2016; Florindo, Salvador, & Reis, 2013; Henderson et al., 2016; Koohsari, Karakiewicz, &
Kaczynski, 2013; Lee et al., 2017; Oyeyemi et al., 2016; Peachey & Baller, 2015; Rech et al.,
2012; Sugiyama et al., 2014; Van Dyck et al., 2012). The most widely established measure of
walkability is the Neighborhood Environment Walkability Scale (NEWS; Saelens, Sallis, Black,
& Chen, 2003). This measure assesses participants’ perceptions of their neighborhood design and
features related to physical activity, street connectivity, accessibility of walking/cycling,
neighborhood aesthetics, neighborhood satisfaction, and traffic/crime safety. An abbreviated
measure is also used in the literature (Cerin, Saelens, Sallis, & Frank, 2006)
Although these measures include some questions on perceived safety, they do not
encompass the complexity of safety. This occurs due to their focus on environmental
characteristics and perceptions of neighborhoods. As safety depends on both the perceiver and
the environmental conditions, an individual might feel safe in some places or even in general in
their lives, but they might perceive their neighborhood as not being walkable. The athlete from
our previous example might have been robbed in his neighborhood once and now he perceives it
as less safe and walkable, so he always walks with his friends, while the socially withdrawn
individual has not been victimized and thus perceives the environment as more walkable.
Facets addressing both subjective (perceived safety, confidence in one’s safety habits and
the ability to remain safe) and more objective factors (fear of crime, neighborhood walkability)
PERCEIVED SAFETY SCALE 9
should be taken into consideration when assessing safety. Thus, for an accurate measure of
perceived safety to be created, it needs to focus on all these factors collectively instead of
measuring safety in one single item or measuring any of these factors individually. Ecological
validity and applicability to the real world will be better achieved with a clearer understanding of
which specific factor of safety is lacking in a specific individual or community, which in turn
will allow for more effective interventions to be constructed.
Development of the P-SAFE Scale
The present series of studies reported here aimed to construct, validate, and demonstrate
reliability of a new measure for perceived safety. Specifically, I hypothesized that safety would
be comprised of a number of different factors given the multi-dimensional nature of the
construct. These would likely include subjective factors such as fear of crime and self-
confidence, as well as objective factors such as neighborhood walkability.
The research team generated items by sampling from measures used in previous
literature, as well as creating novel items inspired by qualitative questions included in these
studies (Study 1). It was determined that acceptable reliability would be indicated by Cronbach’s
αs greater than .70. Acceptable construct validity would be indicated by items having a
meaningful loading (> .40) onto a single factor. Acceptable discriminant validity would be
indicated by non-multicollinearity (rs < .80) across factors and between each factor and the most
commonly used items used in scientific literature to date (“I feel safe walking alone late at night”
and “I generally feel safe”). Predictive validity would be indicated by significant correlations
with measures of police legitimacy, social interaction anxiety, locus of control, and extraversion,
emotionality, and conscientiousness. This predictive validity was expected to also be unique for
each subscale, especially for the personality facets. Another prediction of this study was that
PERCEIVED SAFETY SCALE 10
different demographic questions (gender, age, socioeconomic status, religiosity, neighborhood,
and political beliefs) would be significant predictors of safety.
To construct the scale, two exploratory factor analyses were conducted. These employed
principal component analysis (PCA) to achieve the best possible reduction of the items into
factors and to better conceptually visualize how the novel items match with the previously used
items. Then, a confirmatory factor analysis was conducted using Promax rotation. Since Promax
is an oblique rotation, and oblique rotations take into consideration the correlation of all the
items and factors, it was deemed most appropriate given that the different factors were expected
to be interrelated to some extent.
Study 1
The first study was exploratory in its nature, focusing on pinpointing the model of the P-
SAFE scale by utilizing a principal component analysis. In addition to searching for the
components of perceptions of safety, I predicted that an inner locus of control, higher social
interaction anxiety, and a higher sense of police legitimacy would be associated with higher
overall perceptions of safety.
Method
Participants Three hundred and eight participants were initially recruited online
through Amazon Mechanical Turk (MTurk), an online website that has been shown to provide
valid and reliable data for psychological research (Kim & Hodgins, 2017; Thomas & Clifford,
2017; Holden, Dennie, & Hicks, 2013; Mason & Suri, 2012). For the final sample, 263
participants remained (136 female; Mage = 37.28, SDage = 11.98). The exclusion criteria were the
following: Being a U.S. resident (0 participants excluded), agreeing that “There are lights in my
house” (15 participants excluded), disagreeing that “I often go for a week without sleeping” (20
PERCEIVED SAFETY SCALE 11
additional participants excluded), and agreeing that “I am responsible for most of my actions.” (9
additional participants excluded). Participants completed the survey and received remuneration
($1) for their participation in the study.
Materials and Procedure. With the primary focus of the study being perceived safety,
the Perceived Safety (P-SAFE) Scale, which consisted of 48 items rated on a 1–7 Likert scale (1
= Strongly disagree; 7 = Strongly agree), was administered first. To examine how other measures
correlated with this new measure for perceived safety, the Social Interaction Anxiety Scale
(SIAS; Mattick & Clarke, 1998), the Multidimensional Locus of Control Scale (Levenson,
1973), and the Police Legitimacy Scale (Tankebe, Reisig, & Wang, 2016) were administered in a
random order. Several demographic questions pertaining to gender, race, nationality, political
beliefs, religiosity, spirituality, and socioeconomic status were asked. Finally, participants were
asked to provide three things that make them feel safe and three things that make them feel
unsafe.
Study 1 Results
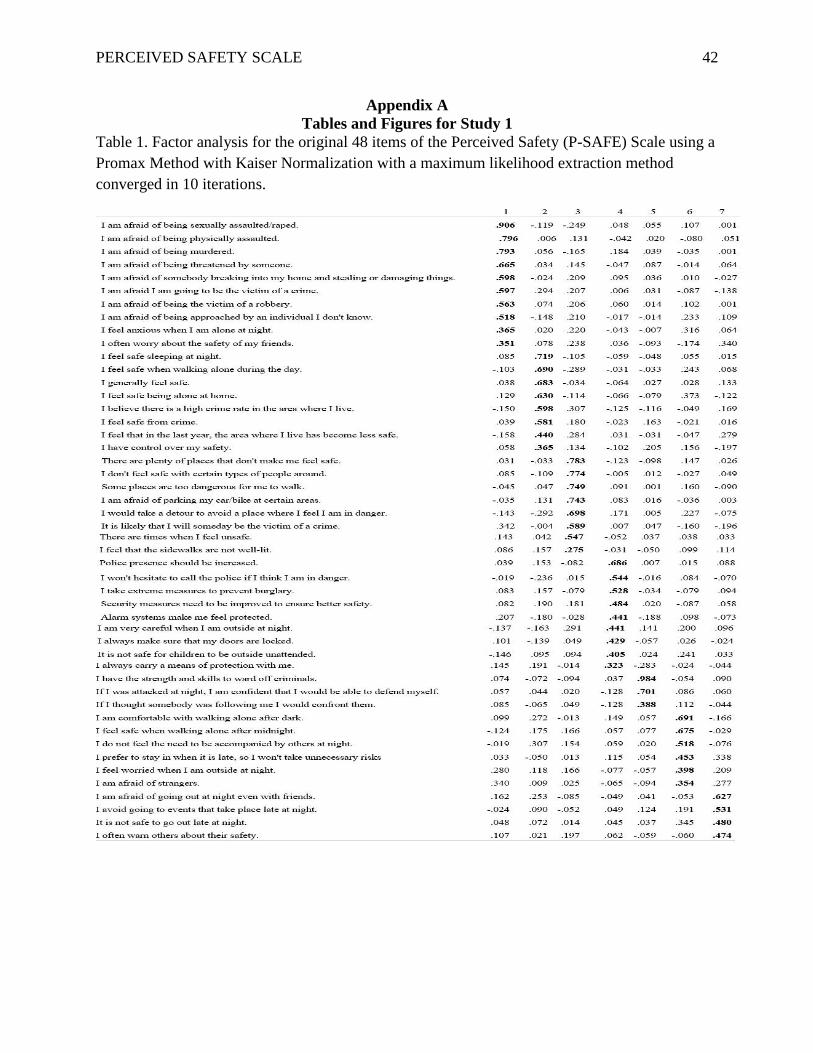
Factor Model. An initial unrestricted factor analysis was performed (see Table 1). A
scree plot indicated seven factors with eigenvalues greater than 1. Several of these factors,
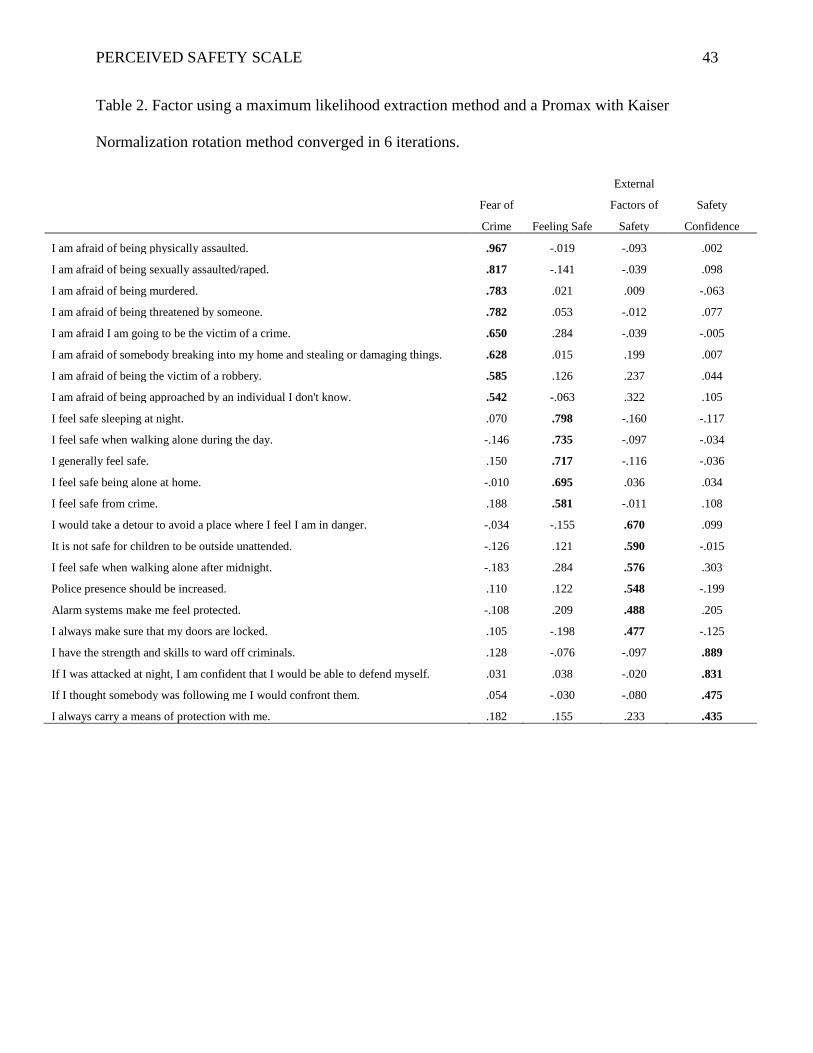
however, were not interpretable. Constraining the model to only four factors produced the most
interpretable solution. These factors were: Fear of Crime (10 items, highest value = .873, lowest
value = .746), Feeling Safe (7 items, highest value = .760, lowest value = .514), External Factors
of Safety (4 items, highest value = .777, lowest value = .456), and Safety Confidence (3 items,
highest value = .953, lowest value = .465). Twenty-four items did not load into any of these four
factors and were thus excluded from the analysis. (See Table 2 for factor loadings.) For these
new factors, the correlation between them was significantly reduced (see Table 3).
PERCEIVED SAFETY SCALE 12
Scale Reliability. A reliability test (Cronbach’s α) was conducted to assess the reliability
of the P-SAFE scale. Overall, the full scale was highly reliable: α = .968. Reliability was found
for two of the four factors identified by the restricted factor analysis (Fear of Crime: α = .938;
Feeling Safe: α = .824; External Factors: α = .346; Safety Confidence: α = .407).
Validity of the P-SAFE Scale. The four subscales were highly correlated. However,
their correlation with the most widely used items in safety literature did not surpass the cut-off
criterion (r = .8): “I generally feel safe”: r = .628, p < .001; “I feel safe walking during the day”:
r = .428, p < .001; “I feel safe when walking alone after midnight”: r = .718, p < .001, indicating
discriminant validity.
To examine predictive validity, several regressions were executed, with the overall
measure for Safety as the outcome variable and SIAS, Locus of Control, and Police Legitimacy
as predictor variables (see Table 4). When a similar regression was executed, with the dependent
variable being the item “I feel safe when walking alone after midnight”, results were still
significant, but with a smaller p value (see Table 5).
Qualitative Data. Lastly, two qualitative questions were included in the survey: “Name
three things/factors that make you feel safe” and “Please name three things/factors that make you
feel unsafe.” These questions were asked to better comprehend what is associated with
perceptions of safety and feelings of unsafety. Since these questions were only asked for the
purpose of generating new items for Study 2 they are not presented here. However, the data are
available upon request.
Study 1 Discussion
Study 1 revealed that safety is multidimensional. It seems to encompass four factors:
Fear of Crime, Feeling Safe, Safety Confidence, and External Factors of Safety. Additionally,
PERCEIVED SAFETY SCALE 13
increased perceptions of safety are associated with lower anxiety levels, an internal locus of
control, and a higher police legitimacy score. Study 2 sought to better examine which factors are
more closely associated with safety. In particular, as previous studies have examined
neighborhood walkability instead of perceived safety, I was interested in examining whether
neighborhood walkability would be a facet of safety.
Study 2
With Study 1 partially supporting our hypothesis for the model of the P-SAFE, Study 2
focused on increasing the reliability and the factor model of the facets produced in the first study.
The same factors as Study 1 were initially hypothesized to be produced through the PCA.
Additionally, Study 2 also examined how different personality traits predict safety and its
facets. I hypothesized that emotionality, extraversion, and conscientiousness would significantly
predict safety. In particular, I hypothesized that emotionality would negatively predict safety, as
the more emotional a person is the more likely they are to be easily affected by an emotionally
negative event, thus reducing their safety. I hypothesized that extraversion and conscientiousness
would positively predict safety, as people who are more likely to go out and explore and who are
able to exert self-control and careful attention would be more likely to have a greater perception
of safety due to increased confidence in themselves.
Method
Participants. Five hundred and ten participants were originally recruited through
MTurk. For the final sample, 455 participants remained (257 female; Mage = 36.29, SDage =
11.69). From the 510 participants 55 were excluded because they failed to pass the exclusion
criteria. Being fluent in English (3 participants were excluded), stating that they at least neither
disagree nor agree with the following two statements: “I often go for a week without sleeping”
PERCEIVED SAFETY SCALE 14
(40 participants excluded), and “There are no lights in my house” (12 participants excluded).
Participants completed the survey and received remuneration ($.45) for their participation in the
study.
Materials and Procedure. Similar to Study 1, this study included several new
exploratory items for the P-SAFE Scale in order to get a greater understanding of how the items
fit together. In this study, 47 items were included originally with two extra attention checks
(similar to Study 1). Furthermore, the Ten Item Personality Inventory (TIPI; Gosling, Rentfrow,
& Swann, 2003) and the demographic questions that were presented in Study 1 were also
included.
For this study, one question asking about participants’ familiarity with their
neighborhood (number of years living in the neighborhood) and one concerning the type of their
neighborhood (urban, suburban, rural) were included. These questions were included based on
the qualitative responses given by the participants in Study 1 when they were asked to provide
factors that make them feel safe and unsafe.
Study 2 Results
Factor Model. An initial unrestricted Promax factor analysis yielded 8 factors. These
were: Fear of Crime, Feeling Safe, Neighborhood Walkability, Safety Confidence, Fate/Religion,
and three additional factors that were either uninterpretable or only consisted of 1–2 items.
When restricted to four factors, in order to determine whether the factor structure from
Study 1 would be replicated, the Promax Factor analysis combined some of the Feeling Safe and
Fear of Crime items in one factor. The Safety Confidence factor was maintained and so was the
Fate/Religion factor. Similar results were produced when the factor analysis was changed from
Promax to Varimax. This initial analysis only supported our hypothesis partially, as the, Fear of
PERCEIVED SAFETY SCALE 15
Crime, Feeling Safe and Safety Confidence factors were unique, but their items were not
grouped as I expected them to be.
A second analysis where the confounding factor of Fate/Religion was excluded, was
executed. To better examine the 4-factor model hypothesis, I only ran a restricted factor analysis
for this stage. The analysis produced the following four factors: Fear of Crime (grouped with a
few items from the original External Factors Scale), Feeling Safe, Neighborhood Walkability,
and Safety Confidence. Similar results were produced when a Varimax analysis was executed.
At this stage 14 items were dropped from the scale due to overlapping factor loadings or not
strong enough factor loadings. From the original 47 items, 33 remained.
When restricted, the Promax analysis grouped these items to their respective groups (see
Table 6). Similar results were produced with a Varimax rotation method (see Table 7) The final
set of factor analyses supported our initial hypothesis with Neighborhood Walkability replacing
External Factors. Semantically this change makes sense, as how walkable an environment is,
depends on external factors influencing perceptions of the specific environment.
Scale Reliability. Overall, reliability was high for all 33 items combined α = .928. Fear
of Crime (9 items) α = .896, Feeling Safe (8 items) α = .813, Neighborhood Walkability (8
items) α = .850, and Safety Confidence (8 items) α = .850.
Validity of the P-SAFE Scale. Once more, to establish discriminant validity for the new
scale a correlational analysis was executed for all the subscales, the scale overall and the three
most common items used in literature to measure safety until now. The four subscales were
highly correlated (see Table 8). However, their correlation with the most widely used items in
safety literature did not surpass the cut-off criterion (r = .8; Spector, 1992). For the construct of
Perceived Safety, correlation also did not exceed the cut-off criterion: “I generally feel safe”: r =
PERCEIVED SAFETY SCALE 16
.672, p < .001; “I feel safe walking during the day”: r = .653, p < .001; “I feel safe when walking
alone after midnight”: r = .752, p < .001, indicating discriminant validity.
To ensure predictive validity for the scale, a regression was executed with the TIPI as the
predictor variable (see Table 9). From the five factors, the results of the regression (R2 = .218,
F(5, 454) = 25.063, p < .001) showed that Agreeableness (β = -3.335, p = .001),
Conscientiousness (β = 2.178, p = .030) and Emotionality (β = 1.185, p < .001) significantly
predicted perceived safety (using the 33 items). Lastly, all the demographic items were also
included to further determine the predictive and construct validity of the scale (see Table 10).
The regression (R2 = .252, F(12, 454) = 12.389, p < .001) showed that age (β = 2.300, p = .017),
household income (β = 3.014, p = .003), gender (β = -10.451, p < .001), being in a committed
relationship (β = 2.002, p = .046), and neighborhood type (β = 3.235, p = .001) significantly
predicted perceived safety. Participants were also asked to provide their zip code so that an
examination of their region’s effect on safety can be made. From the 455 participants 453
provided a zip code. Initially their zip code was searched, their state of residence was noted, and
then depending on their state they were grouped into one of four regions: Northeast (N = 100),
South (N = 161), Midwest (N = 85) and West (N = 107). A one-way ANOVA was executed, and
no significant differences were found for either of the subscales of the P-SAFE or the overall
construct of perceived safety. This was a very limited sample, however, and ideally an
examination of the effect of a person’s city on safety should be conducted.
Study 2 Discussion
Replicating Study 1, a factor analysis constrained to four factors yielded an interpretable
factor structure, with factors corresponding to Fear of Crime, Feeling Safe, Neighborhood
Walkability, and Safety Confidence. When several items were excluded, and when restricted to
PERCEIVED SAFETY SCALE 17
four factors the PCA provided evidence for a much more comprehensive model. This model
included four factors that better explained the variability of the different facets tapping into
safety. Furthermore, since the constructs of the TIPI and the demographics questions predicted
each subscale differently, this study provided further evidence for the construct and discriminant
validity of this new measure. Study 3 sought to confirm this model by conducting a confirmatory
factor analysis.
Study 3
This study served as a confirmatory study of the four-factor structure of the modified P-
SAFE Scale that was derived in Study 2.
Method
Participants. Six hundred and sixty-nine participants were recruited via MTurk. The
final sample consisted by 646 participants (362 female; Mage = 36.83, SDage = 12.10). From the
669 participants 23 were excluded. The exclusion criteria were: Being fluent in English (3
participants excluded) and stating that they at least somewhat disagree to the following
statement: “I am responsible for my actions” (20 participants excluded). Participants completed
the survey and received remuneration ($.45) for their participation in the study.
Materials and Procedure. Participants were presented with the P-SAFE scale, followed
by the Police Legitimacy Scale, the Levenson Multidimensional Locus of Control Scale, and the
Short Social Desirability Scale (Crowne & Marlowe, 1960) in a random order. Participants then
answered the same demographics questions as in Studies 1 and 2. They were also presented with
a question focusing on the frequency of past traumatic experiences (“Some people have
experienced a traumatic event that has had a significant impact on their lives. Please let us know
what is most true of your experience(s)”), in order to determine whether a history of trauma led
PERCEIVED SAFETY SCALE 18
to reduced perceptions of safety and were asked to indicate their height and the weight in order
to determine whether taller and heavier individuals experience heightened feelings of safety.
Study 3 Results
Factor Model. To test whether the factor structure derived in Study 2 would replicate in
a new sample of MTurk participants, a confirmatory factor analyses (CFA) was executed. The
analyses used a Promax rotation, as this oblique rotation method allows for intercorrelations
amongst the four facets of safety. Since not all of the subscales had normal frequency
distributions, a Principal Axis Factoring extraction method was preferred rather than a Maximum
Likelihood extraction method. However, to increase the validity and replicability of the scale,
both extraction methods were utilized. The cut-off criteria were .4 for the factor loadings in each
facet.
Four items failed to load on either of the four factors: “Police presence should be
increased”, “I am not afraid of being murdered”, “I am not afraid of being sexually
assaulted/raped”, and “Staying safe is just a matter of good common sense”. The rest of the items
remained similar to the model derived in Study 2, with the exception of two items that previously
loaded onto Feeling Safe (“I do not feel safe being home alone”, “I do not feel safe even when
my friends are nearby) instead loading onto Fear of Crime. Since the questions were negatively
framed, and they were associated with the experience of lack of safety due to perceived threat
their association with crime and fear of victimization is not (someone who does not feel safe
when alone at home or when friends are nearby, would also be afraid of crime; see Table 11).
Thus, these results mostly replicate the previous factor structure found for the P-SAFE Scale and
confirm that safety is indeed a multidimensional construct. A similar pattern of results was also
found when using Maximum Likelihood extraction (see Table 12).
PERCEIVED SAFETY SCALE 19
Reliability. Overall reliability (26 items) was very high (α = .900). Reliability was also
high for all the subscales: Fear of Crime (9 items): α = .905, Feeling Safe (5 items): α = .737, and
Neighborhood Walkability (7 items): α = .814, and Safety Confidence (5 items): α = .851.
Validity. For correlations between the P-SAFE subscales and additional measures, see
Table 13. Again, there was no multicollinearity across the different subscales. Social desirability
did not strongly influence results, with only one weak significant correlation (with Safety
Confidence, r = -.100). Neighborhood Walkability was only significantly correlated with the
effectiveness of a police force, and not its lawfulness nor its procedural or distributive fairness in
comparison with all the other facets of safety, which were significantly correlated with all of
these traits of police legitimacy.
Regression analyses replicated the results of Study 2, with the exception that gender did
not significantly predict fear of crime and perceived safety (see Tables S15 & S16 for regression
analyses; see Fig. 1 for descriptive statistics split by gender). In a series of regression analyses
with the demographic variables as predictors and each subscale as the outcome variable, trauma
was a significant predictor of fear of crime and perceived safety but not of Neighborhood
Walkability and Safety Confidence, and weight was a significant predictor of Safety Confidence
(see Tables S15-S19).
To determine if the findings from studies 1 and 2 on police legitimacy and locus of
control would replicate 5 more regression were ran. The findings replicated those of studies 1
and 2. Most importantly, when it comes to perceived safety (see Table 14), every aspect of police
legitimacy except for lawfulness (p = .525) and every aspect of locus of control except for
chance (p = .863) are significantly predicting safety (p < .001 for every trait except for
procedural fairness: p = .040). Police forces are the enforcers of the law with their primary duty
PERCEIVED SAFETY SCALE 20
revolving around ensuring security for everyone. Thus, it is natural for police legitimacy to be a
strong predictor of perceived safety.
An inner locus of control is associated with holding one’s self accountable for what
happens to an individual, and thus people who place accountability for their life’s events on their
own shoulders, tend to be more confident and safe. Another important finding is that police
effectiveness is the most important predictor for all subscales and the overall measure of the P-
SAFE (p < .001) with the exception of Safety Confidence. For people scoring higher on this sub-
scale, police effectiveness is not essential as they feel that they are capable of protecting
themselves regardless of an effective police force. For a closer look at the predictive relationship
between the traits of the police legitimacy and the locus of control scales with the subscales of
the P-SAFE scale see Tables S20 -S23.
Finally, individuals living in rural environments scored significantly higher in perceived
safety when compared to city-dwellers [F(2, 643) = 10.898, p < .001], and were also higher on
three of the four subscales: Fear of Crime [F(2, 643) =11.536, p < .001], Safety Confidence [F(2,
643) = 3.180, p = .044], Feeling Safe [F(2, 643) = 8.848, p < .001], and Neighborhood
Walkability [F(2, 643) = 2.722, p = .082].
Study 3 Discussion
Study 3 confirmed a four-factor structure for the P-SAFE scale, demonstrating that safety
is a multidimensional construct that cannot be fully captured with a one- or two-item measure.
Additionally, this study found that scores on the P-SAFE scale are associated with locus of
control and police legitimacy, showing that the scale is a valid measure of safety.
The P-SAFE scale can be used to measure perceptions of safety, broken into four
distinguishable components. Feeling Safe is related to how safe individuals feel at all times. Fear
PERCEIVED SAFETY SCALE 21
of crime is related to the experience of fear and lack of safety in relation with crime.
Neighborhood walkability is related to one’s ability to feel safe walking in one’s immediate
environment. Safety Confidence is related to one’s ability to protect themselves. This
combination of facets captures both subjective (Feeling Safe, Safety Confidence) and objective
(Fear of Crime and Neighborhood Walkability) forms of safety, and these factors are
distinguishable and differentially associated with other validated measures.
General Discussion
The purpose of these studies was to construct and validate the Perceived Safety Scale (P-
SAFE). Items were sampled from previously validated measures and constructed from frequently
mentioned concerns in relevant literature. Factor analyses yielded four distinct subscales: Fear of
Crime, Feeling Safe, Neighborhood Walkability, and Safety Confidence. These subscales were
reliable and had multiple forms of validity (ecological, construct, predictive, discriminant and
external). Two of the subscales are more objective (Fear of Crime and Neighborhood
Walkability), since these are affected by external factors such as the social order or disorder and
crime rates in a specific neighborhood. Feeling Safe and Safety Confidence are more subjective,
as they are more deeply associated with individual differences regarding perceived safety, thus
remaining more unaffected by one’s environment. Thus, the P-SAFE Scale accounts for both
objective and subjective safety, as it encompasses both perceptions of safety and more objective
aspects that contribute to the feeling of safety or the feeling of fear. This finding provides
support for our hypothesis that safety is a multidimensional and complex construct.
Previous research has emphasized only one aspect of safety, not taking into consideration
the multidimensional aspect of the construct. Some researchers only measured safety with a
single item (see Introduction). Although the present research does not question the validity of the
PERCEIVED SAFETY SCALE 22
measures employed in these studies, it shows that potentially was not captured holistically, and
only one aspect of this complex feeling was investigated.
Police legitimacy, loneliness, an external locus of control, social interaction anxiety,
agreeableness, conscientiousness, emotionality, and other demographic measures predicted
perceived safety. Police legitimacy, and especially police effectiveness, naturally makes people
feel safer, as it is the task of a police force to maintain peace and order which in turn leads to
people feeling safe. Loneliness and social interaction anxiety make people feel more secluded
and vulnerable which in turn reduced their levels of safety. Altruistic individuals tend to sacrifice
their own personal benefit in favor of others, thus this bold and courageous characteristic
explains their higher scores in Safety Confidence and Feeling Safe. When individuals have an
external locus of control they tend to depend on others for their safety, which in turn reduces
their overall capacity to feel safe since they depend on other factors for their safety. Moreover,
different personality traits predicted the overall construct safety, and different personality traits
predicted the specific subscales of the P-SAFE scale, adding to the construct and discriminant
validity of the measure.
The present studies had limitations. The samples were not globally representative—
participants were mostly White Americans. Additionally, there could be more facets to safety
than the four factors found in the present research (something that the confounding factor of
fate/religion hinted at). Safety is a complex and multidimensional construct thus leaving room
for more facets to exist. Cross-national validity and test re-test reliability also need to be assessed
in future studies. Despite these limitations, the P-SAFE Scale promises to open doors for future
research on safety, including cross-cultural investigations. Meta-analytic studies will also be
easier if the measure is widely adopted by the scientific community. Understanding between-
PERCEIVED SAFETY SCALE 23
community variance in different aspects of safety will allow for more efficient intervention
programs to be created.
With safety being a recurrent focus of recent news, future studies should focus on
addressing perceptions of safety in relation to current events. In particular, one does not have to
look far to find a recent event that has reduced safety. On average, there has been one school
shooting per week in 2018 in the U.S. (CNN, 2018). Students no longer feel safe. Situations like
these demand an assessment of safety in order for intervention to be created. Other events may
include the effect of immigrant movements on perceptions of safety, the effect of different police
styles on safety, perceptions of safety by law enforcement, and the effect of gun control on
perceptions of safety. This new measure can be used to re-examine findings on implicit biases
towards weapons and race. Additionally, developmental studies focusing on pinpointing the
stage of development where teenagers stop feeling “invincible” and their perceived safety
stabilizes will also be conducted. A different attachment or parenting style might result in a
person scoring higher in Safety Confidence, while Fear of Crime might remain less variable as it
focuses more on objective facts and crime rates
Other topics are also worthy of scientific examination. Immigration movements might
affect safety but only in terms of fear of crime, while police legitimacy and different police styles
might affect walkability. Since the validation of this scale provides evidence for the
multidimensional character of safety, an important part of future investigations will be to
replicate previously established findings, such as the association of perceived safety with health
and behavioral outcomes in various environments (e.g., neighborhood, academic institutions,
one’s residence).
PERCEIVED SAFETY SCALE 24
Recent times have brought two topics in the forefront of safety. The first issue concerns
the numerous police brutality incidents, with a specific focus on racial minorities. Police
legitimacy has been reduced, and since police legitimacy is an important aspect of the policing
and its effectiveness (Crowl, 2017; Duck, 2017; Gerber & Jackson, 2017; Huq, Jackson, &
Trinkner, 2017), it is important to examine how these events have affected perceived safety so
that meaningful interventions can be built with the aim of re-establishing police legitimacy.
The second important issue that has seemingly impacted safety, as it has caused many
political changes in several countries is the refugee/immigration crisis (Kislev, 2017). In recent
years, armed conflict in the Middle East in combination with other problems have created a
humanitarian crisis which has forced the immigration of millions of people. Many displaced
individuals have relocated mainly to Europe, with some also arriving in the United States and
Australia (Kislev, 2017). At the same time, terrorism and violent attacks by non-state actors have
also increased (Federal Bureau of Investigation, 2016).
The confluence of these events has led many people to believe that immigration is largely
responsible for the increase in terrorist attacks. Some countries have thus restricted immigration
by patrolling or closing their borders. The movement of millions of refugees has provided
opportunities for psychologists to study this phenomenon. While many studies to date have
examined the implications of refugee movements on the psychological state and mental health of
the refugees (Anagnostopoulos, Giannakopoulos, & Christodoulou 2017; Brannan et al., 2016;
Jefee-Bahloul et al., 2016; Krausz & Choi, 2017; Leuzinger-Bohleber et al., 2016) or the health
of the individuals choosing to help the refugees (Sifaki-Pistoli et al., 2017, Chatzea et al., 2016),
fewer studies have sought to examine the impact that these migration trends might have had on
the perceived safety of citizens in the countries experiencing these movements. Thus, another
PERCEIVED SAFETY SCALE 25
large-scale phenomenon that requires attention is the immigration crisis, and the P-SAFE scale
would provide a clear image of how safety has been impacted by this movement.
In addition, the examination of how recent mass shootings have affected safety would be
another important contribution that the P-SAFE scale could provide. Aside from these horrible
events and the stain they could have potentially caused in the country, the examination of the
effect of lack of gun control on perceptions of safety could also shed light on a much-heated
debate. On the other hand, smaller scale projects, like recent spikes in crime rates within a
community, a specific terror event in a city, or the examination of a specific environment (a
university/school setting) can also be conducted. A necessary examination is that of the
perceived safety in academic institutions all over the U.S.A. Having an annual measure of safety
would allow for the examination of how violence has changed perceptions of safety in these
institutions thus allowing for pinpointing areas where interventions are required.
In a more theoretical approach another meaningful examination could be that of the
nature of safety. Revealing whether safety is an emotion, or an affective state would be an
important contribution to the literature. With more arguments focusing on the directionality of
the effect in morality and emotions (Gray, Schein, & Cameron, 2017) stating that instead of
being unidimensional (like an arrow), there is a mutual interaction (like a circle). Understanding
how safety is affected by other emotions or affects other emotions would reveal the interaction
between different emotions that are fundamental for our daily existence.
Overall, this study constructed and validated the P-SAFE scale, a novel, reliable and
multidimensional scale capable of matching the complex character of safety, which can be
utilized for smaller and larger scale examinations aimed to accurately capture perceived safety.
PERCEIVED SAFETY SCALE 26
References
Aikawa, A., Fujita, M., & Tanaka, K. (2007). The relationship between social skills deficits and
depression, loneliness, and social anxiety: Rethinking a vulnerability model of social
skills deficits. The Japanese Journal of Social Psychology, 23(1), 95–103.
Anagnostopoulos, D., Giannakopoulos, G., & Christodoulou, N. (2017). The synergy of the
refugee crisis and the financial crisis in Greece: Impact on mental health. International
Journal of Social Psychiatry, 63(4), 352–358.
Anderson, S. F., & Maxwell, S. E. (2017). Addressing the 'replication crisis': Using original
studies to design replication studies with appropriate statistical power. Multivariate
Behavioral Research, 52(3), 305–324.
Barni, D., Vieno, A., Roccato, M., & Russo, S. (2016). Basic personal values, the country’s
crime rate and the fear of crime. Social Indicators Research, 129(3), 1057–1074.
Bogusch, L. M., Fekete, E. M., & Skinta, M. D. (2016). Anxiety and depressive symptoms as
mediators of trait mindfulness and sleep quality in emerging adults. Mindfulness, 7(4),
962–970.
Bonner, R. L., & Rich, A. R. (1991). Predicting vulnerability to hopelessness: A longitudinal
analysis. Journal of Nervous and Mental Disease, 179(1), 29–32.
Booth, J., Ayers, S. L., & Marsiglia, F. F. (2012). Perceived neighborhood safety and
psychological distress: Exploring protective factors. Journal of Sociology and Social
Welfare, 39(4), 137–156.
Boxer, P., Edwards-Leeper, L., Goldstein, S. E., Musher-Eizenman, D., & Dubow, E. F. (2003).
Exposure to 'low-level' aggression in school: associations with aggressive behavior,
future expectations, and perceived safety. Violence and Victims, 18(6), 691–704.
PERCEIVED SAFETY SCALE 27
Bracy, N. L., Millstein, R. A., Carlson, J. A., Conway, T. L., Sallis, J. F., Saelens, B. E., & ...
King, A. C. (2014). Is the relationship between the built environment and physical
activity moderated by perceptions of crime and safety? The International Journal of
Behavioral Nutrition and Physical Activity, 11(1), 11–24
Brannan, S., Campbell, R., Davies, M., English, V., Mussell, R., & Sheather, J. C. (2016). The
Mediterranean refugee crisis: Ethics, international law and migrant health. Journal of the
Institute of Medical Ethics, 42(4), 269–270.
Brosschot, J. F., Verkuil, B., & Thayer, J. F. (2016). The default response to uncertainty and the
importance of perceived safety in anxiety and stress: An evolution-theoretical
perspective. Journal of Anxiety Disorders 41, 4122–4134.
Brown, B. B., Werner, C. M., Smith, K. R., Tribby, C. P., & Miller, H. J. (2014). Physical
activity mediates the relationship between perceived crime safety and obesity. Preventive
Medicine: An International Journal Devoted to Practice and Theory, 66, 140–144.
Brunstein-Klomek, A., Marrocco, F., Kleinman, M., Schonfeld, I. S., & Gould, M. S. (2007).
Bullying, depression, and suicidality in adolescents. Journal of the American Academy of
Child and Adolescent Psychiatry, 46, 40–49.
Burdette, H. L., Wadden, T. A., & Whitaker, R. C. (2006). Neighborhood safety, collective
efficacy, and obesity in women with young children. Obesity, 14(3), 518–525.
Burns, R. (2000). Culture as a determinant of crime: An alternative perspective. Environment
and Behavior, 32(3), 347–360.
Camerino, D. (2016). Gender differences in safety, health and work/family interference—
Promoting equity. In I. Iskra-Golec, J. Barnes-Farrell, P. Bohle, I. Iskra-Golec, J. Barnes-
PERCEIVED SAFETY SCALE 28
Farrell, P. Bohle (Eds.), Social and family issues in shift work and non-standard working
hours (pp. 153-179). Cham, Switzerland: Springer International Publishing.
Cerin, E., Saelens, B. E., Sallis, J. F., & Frank, L. D. (2006). Neighborhood Environment
Walkability Scale: Validity and development of a short form. Medicine & Science in
Sports & Exercise, 38(9), 1682–1691.
Chatzea, V., Sifaki-Pistolla, D., Vlachaki, S., Melidoniotis, E., & Pistolla, G. (2017). PTSD,
burnout and well-being among rescue workers: Seeking to understand the impact of the
European refugee crisis on rescuers. Psychiatry Research, in press.
CNN, (2018), School shootings so far in 2018, https://www.cnn.com/2018/03/02/us/school-
shootings-2018-list-trnd/index.html.
Cooper-Vince, C. E., Chan, P. T., Pincus, D. B., & Comer, J. S. (2014). Paternal autonomy
restriction, neighborhood safety, and child anxiety trajectory in community youth.
Journal of Applied Developmental Psychology, 35(4), 265–272.
Crowl, J. N. (2017). The effect of community policing on fear and crime reduction, police
legitimacy and job satisfaction: An empirical review of the evidence. Police Practice &
Research: An International Journal, 18(5), 449–462.
Crowne D. P., & Marlowe D. A., (1960). A new scale of social desirability independent of
pathology. Journal of Consulting Psychology, 24, 349-354.
Datar, A., Nicosia, N., Wong, E., & Shier, V. (2015). Neighborhood environment and children's
physical activity and body mass index: Evidence from military personnel installation
assignments. Childhood Obesity, 11(2), 130–138.
PERCEIVED SAFETY SCALE 29
Davidson, M. M., Butchko, M. S., Robbins, K., Sherd, L. W., & Gervais, S. J. (2016). The
mediating role of perceived safety on street harassment and anxiety. Psychology of
Violence, 6(4), 553–561.
De Biasi, A. (2017). Transforming vacant lots: Investigating an alternative approach to reducing
fear of crime. Journal of Environmental Psychology, 50, 125–137.
DeLisi, M., & Regoli, B. (2000). Individual neighborhood attachment and perceptions of
neighborhood safety. American Journal of Criminal Justice, 24(2), 181–188.
De Meester, F., Van Dyck, D., De Bourdeaudhuij, I., Deforche, B., & Cardon, G. (2013). Does
the perception of neighborhood built environmental attributes influence active transport
in adolescents? The International Journal of Behavioral Nutrition and Physical Activity,
10:38.
Dierynck, B., Leroy, H., Savage, G. T., & Choi, E. (2017). The role of individual and collective
mindfulness in promoting occupational safety in health care. Medical Care Research and
Review, 74(1), 79–96.
Duck, W. (2017). The complex dynamics of trust and legitimacy: Understanding interactions
between the police and poor black neighborhood residents. Annals of the American
Academy of Political and Social Science, 673(1), 132–149.
Dulin-Keita, A., Clay, O., Whittaker, S., Hannon, L., Adams, I. K., Rogers, M., & Gans, K.
(2015). The influence of HOPE VI neighborhood revitalization on neighborhood-based
physical activity: A mixed-methods approach. Social Science & Medicine. 139, 90-99.
Earp, B. D., & Trafimow, D. (2015). Replication, falsification, and the crisis of confidence in
social psychology. Frontiers in Psychology, 6, 621.
PERCEIVED SAFETY SCALE 30
Elf, M., Nordin, S., Wijk, H., & McKee, K. J. (2017). A systematic review of the psychometric
properties of instruments for assessing the quality of the physical environment in
healthcare. Journal of Advanced Nursing, 73(12), 2796–2816.
Eriksson, U., Hochwälder, J., & Sellström, E. (2011). Perceptions of community trust and
safety—Consequences for children’s well-being in rural and urban contexts. Acta
Paediatrica, 100(10), 1373–1378.
Evans-Lacko, S., Takizawa, R., Brimblecombe, N., King, D., Knapp, M., Maughan, B., &
Arseneault, L. (2017). Childhood bullying victimization is associated with use of mental
health services over five decades: A longitudinal nationally representative cohort study.
Psychological Medicine, 47(1), 127–135.
Evenson, K. R., Birnbaum, A. S., Bedimo-Rung, A. L., Sallis, J. F., Voorhees, C. C., Ring, K., &
Elder, J. P. (2006). Girls' perception of physical environmental factors and transportation:
Reliability and association with physical activity and active transport to school. The
International Journal of Behavioral Nutrition and Physical Activity, 3, 28.
Federal Bureau of Investigation (2016). 2016 Crime in the United States.
Ferrão, M. M., Gama, A., Marques, V. R., Mendes, L. L., Mourão, I., Nogueira, H., & ... Padez,
C. (2013). Association between parental perceptions of residential neighbourhood
environments and childhood obesity in Porto, Portugal. European Journal of Public
Health, 23(6), 1027–1031.
Flake, J. K., Pek, J., & Hehman, E. (2017). Construct validation in social and personality
research: Current practice and recommendations. Social Psychological and Personality
Science, 8(4), 370–378.
PERCEIVED SAFETY SCALE 31
Florindo, A. A., Salvador, E. P., & Reis, R. S. (2013). Physical activity and its relationship with
perceived environment among adults living in a region of low socioeconomic level.
Journal of Physical Activity & Health, 10(4), 563–571.
Foster, S., Hooper, P., Knuiman, M., Christian, H., Bull, F., & Giles-Corti, B. (2016). Safe
RESIDential Environments? A longitudinal analysis of the influence of crime-related
safety on walking. The International Journal of Behavioral Nutrition and Physical
Activity, 13, 22.
Friedmann, R. R., & Sherer, M. (1984). Effect of different policing strategies upon citizens'
attitudes toward the police and their community. Canadian Police College Journal, 8(1),
27–35.
Galtung, J. (1969). Violence, Peace, and Peace Research. Journal of Peace Research, 6(3), 167–
191.
George, R. (2003). Tourists' fear of crime while on holiday in Cape Town. Crime Prevention and
Community Safety, 5(1), 13–25.
Gerber, M. M., & Jackson, J. (2017). Justifying violence: Legitimacy, ideology and public
support for police use of force. Psychology, Crime & Law, 23(1), 79–95.
Gosling, S. D., Rentfrow, P. J., & Swann, W. B., Jr. (2003). a very brief measure of the big five
personality domains. Journal of Research in Personality, 37, 504–528.
Gray, K., Schein, C., & Cameron, C. D. (2017). How to think about emotion and morality:
Circles, not arrows. Current Opinion in Psychology, 17, 41–46.
Hamada, S., Kaneko, H., Ogura, M., Yamawaki, A., Maezono, J., Sillanmäki, L., & ... Honjo, S.
(2016). Association between bullying behavior, perceived school safety, and self‐cutting:
PERCEIVED SAFETY SCALE 32
A Japanese population-based school survey. Child and Adolescent Mental Health.
http://dx.doi.org/10.1111/camh.12200
Henderson, H., Child, S., Moore, S., Moore, J. B., & Kaczynski, A. T. (2016). The influence of
neighborhood aesthetics, safety, and social cohesion on perceived stress in disadvantaged
communities. American Journal of Community Psychology, 58(1-2), 80–88.
Hernandez, R., Kershaw, K. N., Prohaska, T. R., Wang, P., Marquez, D. X., & Sarkisian, C. A.
(2015). The cross-sectional and longitudinal association between perceived neighborhood
walkability characteristics and depressive symptoms in older Latinos: The 'Caminemos'
study. Journal of Aging and Health, 27(3), 551–568.
Hill, T. D., Trinh, H. N., Wen, M., & Hale, L. (2016). Perceived neighborhood safety and sleep
quality: A global analysis of six countries. Sleep Medicine, 18, 56–60.
Hinkle, J. C. (2015). Emotional fear of crime vs. perceived safety and risk: Implications for
measuring 'fear' and testing the broken windows thesis. American Journal of Criminal
Justice, 40(1), 147–168.
Holden, C. J., Dennie, T., & Hicks, A. D. (2013). Assessing the reliability of the M5-120 on
Amazon's Mechanical Turk. Computers in Human Behavior, 29(4), 1749–1754.
Hosker-Field, A. M., Molnar, D. S., & Book, A. S. (2016). Psychopathy and risk taking:
Examining the role of risk perception. Personality and Individual Differences, 91, 123–
132.
Hsu, H., Simon, J. D., Henwood, B. F., Wenzel, S. L., & Couture, J. (2016). Location, location,
location: Perceptions of safety and security among formerly homeless persons
transitioned to permanent supportive housing. Journal of the Society for Social Work and
Research, 7(1), 65–88.
PERCEIVED SAFETY SCALE 33
Hughes, M. E., Waite, L. J., Hawkley, L. C., & Cacioppo, J. T. (2004). A short scale for
measuring loneliness in large surveys: Results from two population-based studies.
Research on Aging, 26(6), 655–672.
Hur, M., & Nasar, J. L. (2014). Physical upkeep, perceived upkeep, fear of crime and
neighborhood satisfaction. Journal of Environmental Psychology, 38, 186–194.
Huq, A. Z., Jackson, J., & Trinkner, R. (2017). Legitimating practices: Revisiting the predicates
of police legitimacy. British Journal of Criminology, 57(5), 1101–1122.
Jefee-Bahloul, H., Bajbouj, M., Alabdullah, J., Hassan, G., & Barkil-Oteo, A. (2016). Mental
health in Europe's Syrian refugee crisis. The Lancet Psychiatry, 3(4), 315–317.
Jiang, B., Mak, C. S., Larsen, L., & Zhong, H. (2017). Minimizing the gender difference in
perceived safety: Comparing the effects of urban back alley interventions. Journal of
Environmental Psychology, 51, 117–131.
John, O. P., & Srivastava, S. (1999). The Big-Five trait taxonomy: History, measurement, and
theoretical perspectives. In L. A. Pervin & O. P. John (Eds.), Handbook of personality:
Theory and research (Vol. 2, pp. 102–138). New York: Guilford Press.
Keane, C. (1998). Evaluating the influence of fear of crime as an environmental mobility
restrictor on women's routine activities. Environment and Behavior, 30(1), 60–74.
Kim, H. S., & Hodgins, D. C. (2017). Reliability and validity of data obtained from alcohol,
cannabis, and gambling populations on Amazon’s Mechanical Turk. Psychology of
Addictive Behaviors, 31(1), 85–94.
Kislev, E. (2017). New trends and patterns in western European immigration to the United
States: Linking European and American databases. Annals of the American Academy of
Political and Social Science, 669(1), 168–189.
PERCEIVED SAFETY SCALE 34
Ko, M., Geedipally, S. R., Walden, T. D., & Wunderlich, R. C. (2017). Effects of red light
running camera systems installation and then deactivation on intersection safety. Journal
of Safety Research, 62, 117–126.
Koohsari, M. J., Karakiewicz, J. A., & Kaczynski, A. T. (2013). Public open space and walking:
The role of proximity, perceptual qualities of the surrounding built environment, and
street configuration. Environment and Behavior, 45(6), 706–736.
Krausz, R. M., & Choi, F. (2017). Psychiatry's response to mass traumatisation and the global
refugee crisis. The Lancet Psychiatry, 4(1), 18–20.
Latham, K., & Clarke, P. J. (2013). The role of neighborhood safety in recovery from mobility
limitations: Findings from a national sample of older Americans (1996–2008). Research
on Aging, 35(4), 481–502.
Lee, S. M., Conway, T. L., Frank, L. D., Saelens, B. E., Cain, K. L., & Sallis, J. F. (2017). The
relation of perceived and objective environment attributes to neighborhood satisfaction.
Environment and Behavior, 49(2), 136–160.
Leuzinger-Bohleber, M., Rickmeyer, C., Tahiri, M., Hettich, N., Fischmann, T., Hettich, N., &
Rickmeyer, C. (2016). What can psychoanalysis contribute to the current refugee crisis?
The International Journal of Psychoanalysis, 97(4), 1077–1093.
Levenson, H. 1973. Multidimensional locus of control in psychiatric patients. Journal of
Consulting and Clinical Psychology 41, 397– 404.
Lilienfeld, S. O. (2017). Psychology’s replication crisis and the grant culture: Righting the ship.
Perspectives on Psychological Science, 12(4), 660–664.
PERCEIVED SAFETY SCALE 35
Maillot, P., Dommes, A., Dang, N., & Vienne, F. (2017). Training the elderly in pedestrian
safety: Transfer effect between two virtual reality simulation devices. Accident Analysis
and Prevention, 99(Part A), 161–170.
Martin-Storey, A., & Crosnoe, R. (2014). Perceived neighborhood safety and adolescent school
functioning. Applied Developmental Science, 18(2), 61–75.
Maslow, A. H. (1943). A theory of human motivation. Psychological Review, 50(4), 370– 396.
Mason, M. J., Mennis, J., Coatsworth, J. D., Valente, T., Lawrence, F., & Pate, P. (2009). The
relationship of place to substance use and perceptions of risk and safety in Urban
adolescents. Journal of Environmental Psychology, 29(4), 485–492.
Mason, W., & Suri, S. (2012). Conducting behavioral research on Amazon’s mechanical Turk.
Behavior Research Methods, 44(1), 1–23.
Mattick, R. P., & Clarke, J. C. (1998). Development and validation of measures of social phobia
scrutiny fear and social interaction anxiety1. Behaviour Research and Therapy, 36(4),
455–470.
Maxwell, S. E., Lau, M. Y., & Howard, G. S. (2015). Is psychology suffering from a replication
crisis? What does 'failure to replicate' really mean? American Psychologist, 70(6), 487–
498.
May, D. C. (1999). Scared kids, unattached kids, or peer pressure: Why do students carry
firearms to school? Youth Society, 31, 100–127.
McDonell, J. R. (2007). Neighborhood characteristics, parenting, and children's safety. Social
Indicators Research, 83(1), 177–199.
PERCEIVED SAFETY SCALE 36
Meltzer, H., Vostanis, P., Goodman, R., & Ford, T. (2007). Children's perceptions of
neighbourhood trustworthiness and safety and their mental health. Journal of Child
Psychology and Psychiatry, 48(12), 1208–1213.
Milam, A. J., Furr-Holden, C. M., & Leaf, P. J. (2010). Perceived school and neighborhood
safety, neighborhood violence and academic achievement in urban school children. The
Urban Review, 42(5), 458–467.
Mulvey, A. (2002). Gender, economic context, perceptions of safety, and quality of life: A case
study of Lowell, Massachusetts (U.S.A.) 1982-96. American Journal of Community
Psychology, 30(5), 655–679.
Nijs, M. M., Bun, C. E., Tempelaar, W. M., de Wit, N. J., Burger, H., Plevier, C. M., & Boks, M.
M. (2014). Perceived school safety is strongly associated with adolescent mental health
problems. Community Mental Health Journal, 50(2), 127–134
Oliveira, L. S., Oliveira, L., Joffily, M., Pereira-Junior, P. P., Lang, P. J., Pereira, M. G., & ...
Volchan, E. (2009). Autonomic reactions to mutilation pictures: Positive affect facilitates
safety signal processing. Psychophysiology, 46(4), 870–873.
Ones, D. S., Viswesvaran, C., & Schmidt, F. L. (2017). Realizing the full potential of
psychometric meta-analysis for a cumulative science and practice of human resource
management. Human Resource Management Review, 27(1), 201–215.
Otto, P. E., & Bolle, F. (2011). Multiple facets of altruism and their influence on blood donation.
The Journal of Socio-Economics, 40(5), 558–563.
Oyeyemi, A. L., Kasoma, S. S., Onywera, V. O., Assah, F., Adedoyin, R. A., Conway, T. L., &
... Sallis, J. F. (2016). NEWS for Africa: Adaptation and reliability of a built environment
PERCEIVED SAFETY SCALE 37
questionnaire for physical activity in seven African countries. The International Journal
of Behavioral Nutrition and Physical Activity, 13, 33.
Ozer, E. J., & Weinstein, R. S. (2004). Urban adolescents' exposure to community violence: The
role of support, school safety, and social constraints in a school-based sample of boys and
girls. Journal of Clinical Child and Adolescent Psychology, 33(3), 463–476.
Peachey, A. A., & Baller, S. L. (2015). Perceived built environment characteristics of on-campus
and off-campus neighborhoods associated with physical activity of college students.
Journal of American College Health, 63(5), 337–342.
Peña-García, A., Hurtado, A., & Aguilar-Luzón, M. C. (2015). Impact of public lighting on
pedestrians’ perception of safety and well-being. Safety Science, 78, 142–148.
Pinker, S. (2012). The Better Angels of Our Nature: A History of Violence and Humanity.
Penguin Books.
Pratto, Felicia, James Sidanius, Lisa M. Stallworth, & Bertram F. Malle. 1994. Social dominance
orientation: A personality variable predicting social and political attitudes. Journal of
Personality and Social Psychology 67(4), 741–763.
Rech, C. R., Reis, R. S., Hino, A. F., Rodriguez-Añez, C. R., Fermino, R. C., Gonçalves, P. B.,
& Hallal, P. C. (2012). Neighborhood safety and physical inactivity in adults from
Curitiba, Brazil. The International Journal of Behavioral Nutrition and Physical Activity,
9, 72.
Roan-Belle, C. (2015). Examining the influence of parents, teachers, and neighborhood safety on
African American adolescents' motivation and achievement. Dissertation Abstracts
International Section A, 76.
PERCEIVED SAFETY SCALE 38
Rollwagen, H. (2016). The relationship between dwelling type and fear of crime. Environment
and Behavior, 48(2), 365–387.
Rosenberg, M. (1965). Society and the adolescent self-image. Princeton, NJ: Princeton
University Press.
Rotter, J. B. (1966). Generalized expectancies of internal versus external control of
reinforcements. Psychological Monographs, 80, 609.
Ruijsbroek, A., Droomers, M., Groenewegen, P. P., Hardyns, W., & Stronks, K. (2015). Social
safety, self-rated general health and physical activity: Changes in area crime, area safety
feelings and the role of social cohesion. Health & Place, 31, 39–45.
Russell, D., Peplau, L. A. & Ferguson, M. L. (1978). Developing a measure of loneliness.
Journal of Personality Assessment, 42, 290–294.
Saelens, B.E., Sallis, J.F., Black, J.B., & Chen, D. (2003). Neighborhood-based differences in
physical activity: An environment scale evaluation. American Journal of Public Health,
93, 1552–1558.
Semyonov, M., Gorodzeisky, A., & Glikman, A. (2012). Neighborhood ethnic composition and
resident perceptions of safety in European countries. Social Problems, 59(1), 117-135.
Sheehan, C., Donohue, R., Shea, T., Cooper, B., & De Cieri, H. (2016). Leading and lagging
indicators of occupational health and safety: The moderating role of safety leadership.
Accident Analysis and Prevention, 92, 130–138.
Sifaki-Pistolla, D., Chatzea, V., Vlachaki, S., Melidoniotis, E., & Pistolla, G. (2017). Who is
going to rescue the rescuers? Post-traumatic stress disorder among rescue workers
operating in Greece during the European refugee crisis. Social Psychiatry and Psychiatric
Epidemiology, 52(1), 45–54.
PERCEIVED SAFETY SCALE 39
Skeem J, Polaschek D, Patrick C, Lilienfeld S. (2011) Psychopathic personality: Bridging the
gap between scientific evidence and public policy. Psychological Science in the Public
Interest, 12(3), 95–162.
Snyder, J. A., & Evans, S. Z. (2017). Fear of crime while camping: Examining perceptions of
risk, safety precautions, and victimization effects. Criminal Justice Studies: A Critical
Journal of Crime, Law & Society, 30(3), 307–319.
Spector, P. E. (1992). Summated rating scale construction: An introduction. Thousand Oaks,
CA, US: Sage Publications, Inc.
Stults, C. B., Kupprat, S. A., Krause, K. D., Kapadia, F., & Halkitis, P. N. (2017). Perceptions of
safety among LGBTQ people following the 2016 Pulse nightclub shooting. Psychology of
Sexual Orientation and Gender Diversity, 4(3), 251–256.
Sugiyama, T., Cerin, E., Owen, N., Oyeyemi, A. L., Conway, T. L., Van Dyck, D., & ... Sallis, J.
F. (2014). Perceived neighbourhood environmental attributes associated with adults'
recreational walking: IPEN Adult study in 12 countries. Health & Place, 28, 22–30.
Sundquist, K., Eriksson, U., Mezuk, B., & Ohlsson, H. (2015). Neighborhood walkability,
deprivation and incidence of type 2 diabetes: A population-based study on 512,061
Swedish adults. Health & Place, 31, 24–30.
Sun, V. K., Cenzer, I. S., Kao, H., Ahalt, C., & Williams, B. A. (2012). How safe is your
neighborhood? Perceived neighborhood safety and functional decline in older adults.
Journal of General Internal Medicine, 27(5), 541–547.
Tankebe, J., Reisig, M. D., & Wang, X. (2016). A multidimensional model of police legitimacy:
A cross-cultural assessment. Law and Human Behavior, 40(1), 11–22.
PERCEIVED SAFETY SCALE 40
Tendulkar, S. A., Buka, S., Dunn, E. C., Subramanian, S. V., & Koenen, K. C. (2010). A
multilevel investigation of neighborhood effects on parental warmth. Journal of
Community Psychology, 38(5), 557–573.
Thibodeaux, J. (2013). Student perceptions of safety in perceived similar and nonsimilar race
high schools. Journal of School Violence, 12(4), 378–394.
Thomas, K., A., & Clifford, S. (2017) Validity and Mechanical Turk: An assessment of
exclusion methods and interactive experiments. Computers in Human Behavior, 77, 184–
197.
Toet, A., & van Schaik, M. G. (2012). Effects of signals of disorder on fear of crime in real and
virtual environments. Journal of Environmental Psychology, 32(3), 260–276.
Towne, S. J., Won, J., Lee, S., Ory, M. G., Forjuoh, S. N., Wang, S., & Lee, C. (2016). Using
Walk Score™ and neighborhood perceptions to assess walking among middle-aged and
older adults. Journal of Community Health: The Publication for Health Promotion and
Disease Prevention, 41(5), 977–988.
Tucker-Seeley, R. D., Subramanian, S. V., Li, Y., & Sorensen, G. (2009). Neighborhood safety,
socioeconomic status, and physical activity in older adults. American Journal of
Preventive Medicine, 37(3), 207–213
Van Dyck, D., Cerin, E., Conway, T. L., De Bourdeaudhuij, I., Owen, N., Kerr, J., & ... Sallis, J.
F. (2012). Associations between perceived neighborhood environmental attributes and
adults’ sedentary behavior: Findings from the USA, Australia and Belgium. Social
Science & Medicine, 74(9), 1375–1384.
PERCEIVED SAFETY SCALE 41
Vieno, A., Nation, M., Perkins, D. D., Pastore, M., & Santinello, M. (2010). Social capital, safety
concerns, parenting, and early adolescents' antisocial behavior. Journal of Community
Psychology, 38(3), 314–328.
Wiebe, D. J., Guo, W., Allison, P. D., Anderson, E., Richmond, T. S., & Branas, C. C. (2013).
Fears of violence during morning travel to school. Journal of Adolescent Health, 53(1),
54–61.
Wilson-Doenges, G. (2000). An exploration of sense of community and fear of crime in gated
communities. Environment and Behavior, 32(5), 597–611.
Won, J., Lee, C., Forjuoh, S. N., & Ory, M. G. (2016). Neighborhood safety factors associated
with older adults' health-related outcomes: A systematic literature review. Social Science
& Medicine, 165, 177–186.
Woosnam, K. M., Shafer, C. S., Scott, D., & Timothy, D. J. (2015). Tourists' perceived safety
through emotional solidarity with residents in two Mexico-United States border regions.
Tourism Management, 46, 263–273.
Yablon, Y. B., & Addington, L. A. (2017). Students’ feeling of safety in school: Does frequency
of victimization matter? American Journal of Criminal Justice, 43(1), 26–38
Zaplluzha, S., & Shahini, M. (2016). Gender differences in the evaluation of school safety
indicators according to adolescents in higher secondary schools in Prizren. International
Journal of Adolescence and Youth, 21(1), 27–33.
PERCEIVED SAFETY SCALE 42
Appendix A
Tables and Figures for Study 1
Table 1. Factor analysis for the original 48 items of the Perceived Safety (P-SAFE) Scale using a
Promax Method with Kaiser Normalization with a maximum likelihood extraction method
converged in 10 iterations.
PERCEIVED SAFETY SCALE 43
Table 2. Factor using a maximum likelihood extraction method and a Promax with Kaiser
Normalization rotation method converged in 6 iterations.
Fear of
Crime Feeling Safe
External
Factors of
Safety
Safety
Confidence
I am afraid of being physically assaulted. .967 -.019 -.093 .002
I am afraid of being sexually assaulted/raped. .817 -.141 -.039 .098
I am afraid of being murdered. .783 .021 .009 -.063
I am afraid of being threatened by someone. .782 .053 -.012 .077
I am afraid I am going to be the victim of a crime. .650 .284 -.039 -.005
I am afraid of somebody breaking into my home and stealing or damaging things. .628 .015 .199 .007
I am afraid of being the victim of a robbery. .585 .126 .237 .044
I am afraid of being approached by an individual I don't know. .542 -.063 .322 .105
I feel safe sleeping at night. .070 .798 -.160 -.117
I feel safe when walking alone during the day. -.146 .735 -.097 -.034
I generally feel safe. .150 .717 -.116 -.036
I feel safe being alone at home. -.010 .695 .036 .034
I feel safe from crime. .188 .581 -.011 .108
I would take a detour to avoid a place where I feel I am in danger. -.034 -.155 .670 .099
It is not safe for children to be outside unattended. -.126 .121 .590 -.015
I feel safe when walking alone after midnight. -.183 .284 .576 .303
Police presence should be increased. .110 .122 .548 -.199
Alarm systems make me feel protected. -.108 .209 .488 .205
I always make sure that my doors are locked. .105 -.198 .477 -.125
I have the strength and skills to ward off criminals. .128 -.076 -.097 .889
If I was attacked at night, I am confident that I would be able to defend myself. .031 .038 -.020 .831
If I thought somebody was following me I would confront them. .054 -.030 -.080 .475
I always carry a means of protection with me. .182 .155 .233 .435
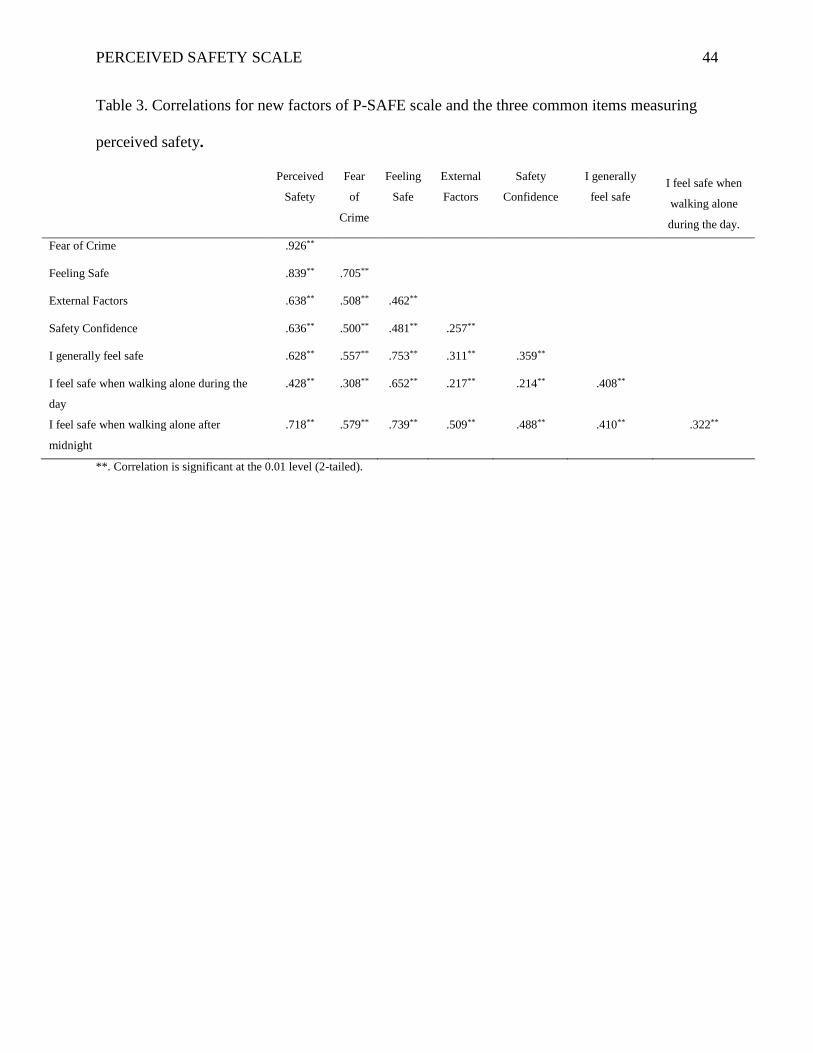
PERCEIVED SAFETY SCALE 44
Table 3. Correlations for new factors of P-SAFE scale and the three common items measuring
perceived safety.
Perceived
Safety
Fear
of
Crime
Feeling
Safe
External
Factors
Safety
Confidence
I generally
feel safe I feel safe when
walking alone
during the day.
Fear of Crime .926**
Feeling Safe .839** .705**
External Factors .638** .508** .462**
Safety Confidence .636** .500** .481** .257**
I generally feel safe .628** .557** .753** .311** .359**
I feel safe when walking alone during the
day
.428** .308** .652** .217** .214** .408**
I feel safe when walking alone after
midnight
.718** .579** .739** .509** .488** .410** .322**
**. Correlation is significant at the 0.01 level (2-tailed).
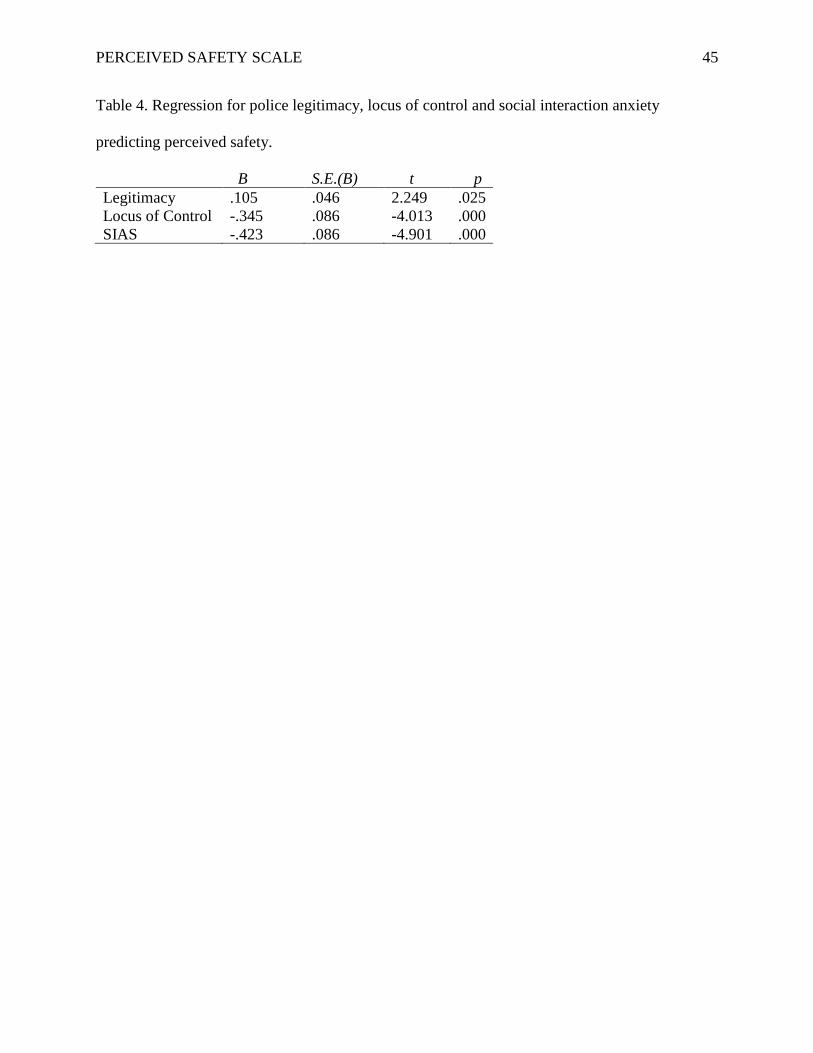
PERCEIVED SAFETY SCALE 45
Table 4. Regression for police legitimacy, locus of control and social interaction anxiety
predicting perceived safety.
B S.E.(B) t p
Legitimacy .105 .046 2.249 .025
Locus of Control -.345 .086 -4.013 .000
SIAS -.423 .086 -4.901 .000
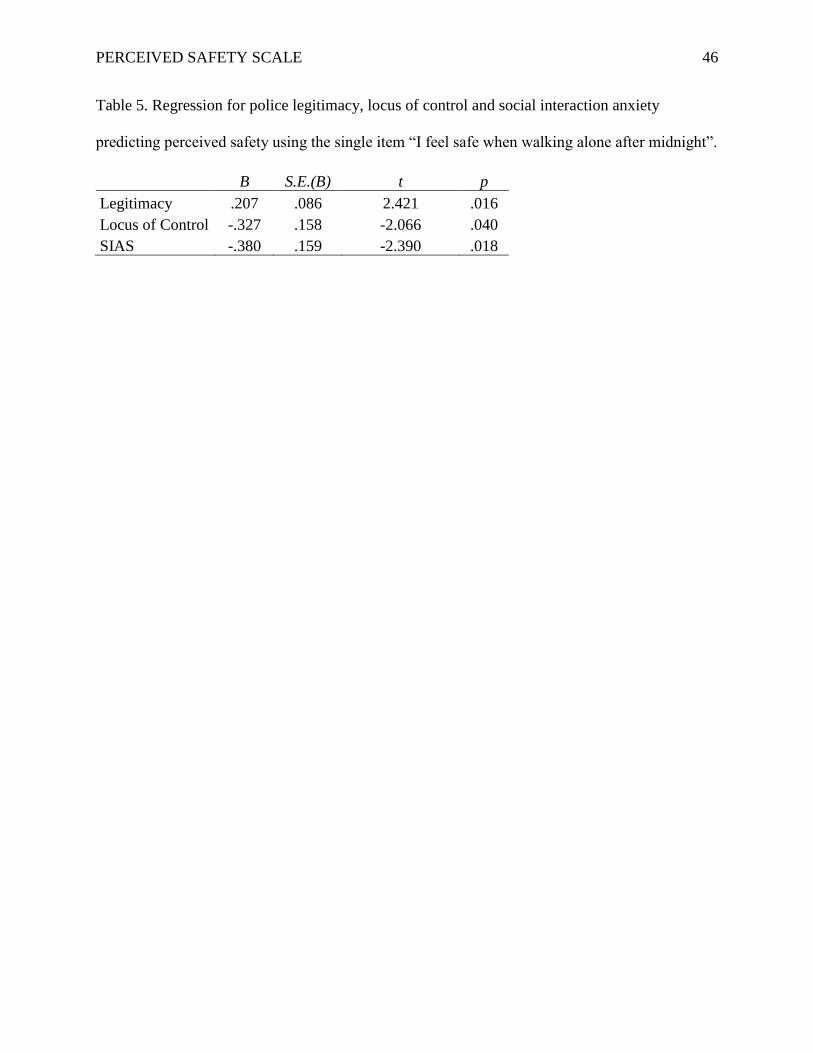
PERCEIVED SAFETY SCALE 46
Table 5. Regression for police legitimacy, locus of control and social interaction anxiety
predicting perceived safety using the single item “I feel safe when walking alone after midnight”.
B S.E.(B) t p
Legitimacy .207 .086 2.421 .016
Locus of Control -.327 .158 -2.066 .040
SIAS -.380 .159 -2.390 .018
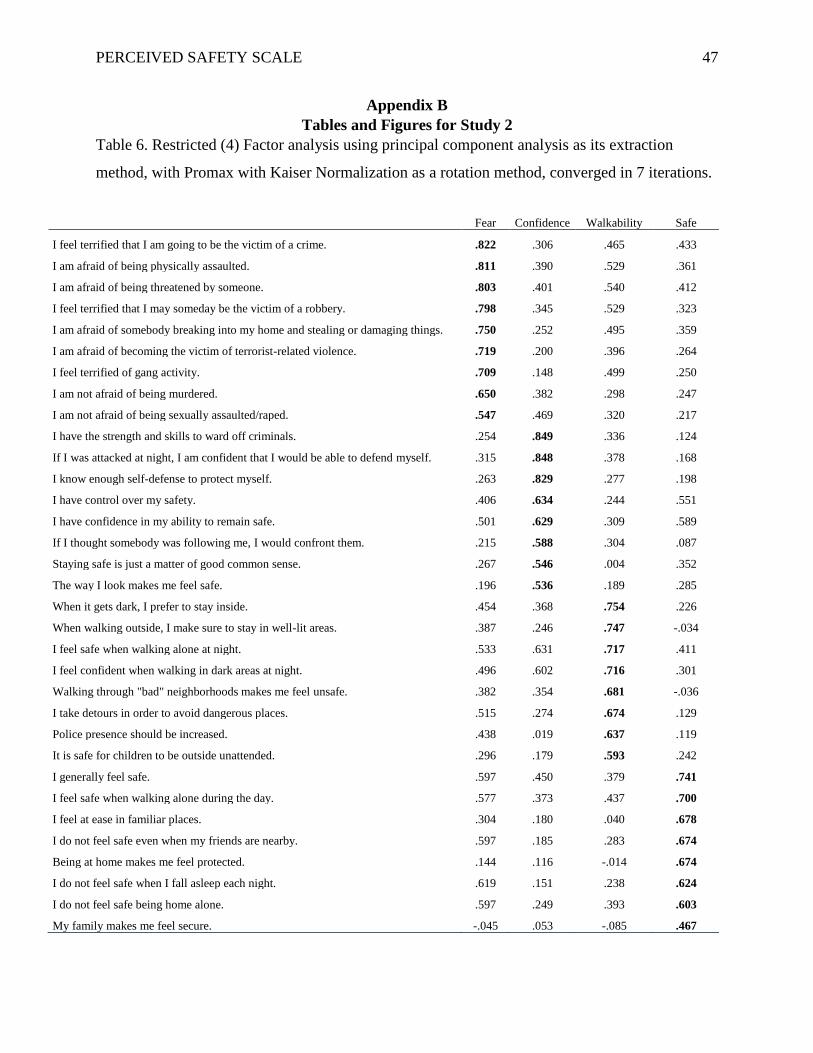
PERCEIVED SAFETY SCALE 47
Appendix B
Tables and Figures for Study 2
Table 6. Restricted (4) Factor analysis using principal component analysis as its extraction
method, with Promax with Kaiser Normalization as a rotation method, converged in 7 iterations.
Fear Confidence Walkability Safe
I feel terrified that I am going to be the victim of a crime. .822 .306 .465 .433
I am afraid of being physically assaulted. .811 .390 .529 .361
I am afraid of being threatened by someone. .803 .401 .540 .412
I feel terrified that I may someday be the victim of a robbery. .798 .345 .529 .323
I am afraid of somebody breaking into my home and stealing or damaging things. .750 .252 .495 .359
I am afraid of becoming the victim of terrorist-related violence. .719 .200 .396 .264
I feel terrified of gang activity. .709 .148 .499 .250
I am not afraid of being murdered. .650 .382 .298 .247
I am not afraid of being sexually assaulted/raped. .547 .469 .320 .217
I have the strength and skills to ward off criminals. .254 .849 .336 .124
If I was attacked at night, I am confident that I would be able to defend myself. .315 .848 .378 .168
I know enough self-defense to protect myself. .263 .829 .277 .198
I have control over my safety. .406 .634 .244 .551
I have confidence in my ability to remain safe. .501 .629 .309 .589
If I thought somebody was following me, I would confront them. .215 .588 .304 .087
Staying safe is just a matter of good common sense. .267 .546 .004 .352
The way I look makes me feel safe. .196 .536 .189 .285
When it gets dark, I prefer to stay inside. .454 .368 .754 .226
When walking outside, I make sure to stay in well-lit areas. .387 .246 .747 -.034
I feel safe when walking alone at night. .533 .631 .717 .411
I feel confident when walking in dark areas at night. .496 .602 .716 .301
Walking through "bad" neighborhoods makes me feel unsafe. .382 .354 .681 -.036
I take detours in order to avoid dangerous places. .515 .274 .674 .129
Police presence should be increased. .438 .019 .637 .119
It is safe for children to be outside unattended. .296 .179 .593 .242
I generally feel safe. .597 .450 .379 .741
I feel safe when walking alone during the day. .577 .373 .437 .700
I feel at ease in familiar places. .304 .180 .040 .678
I do not feel safe even when my friends are nearby. .597 .185 .283 .674
Being at home makes me feel protected. .144 .116 -.014 .674
I do not feel safe when I fall asleep each night. .619 .151 .238 .624
I do not feel safe being home alone. .597 .249 .393 .603
My family makes me feel secure. -.045 .053 -.085 .467
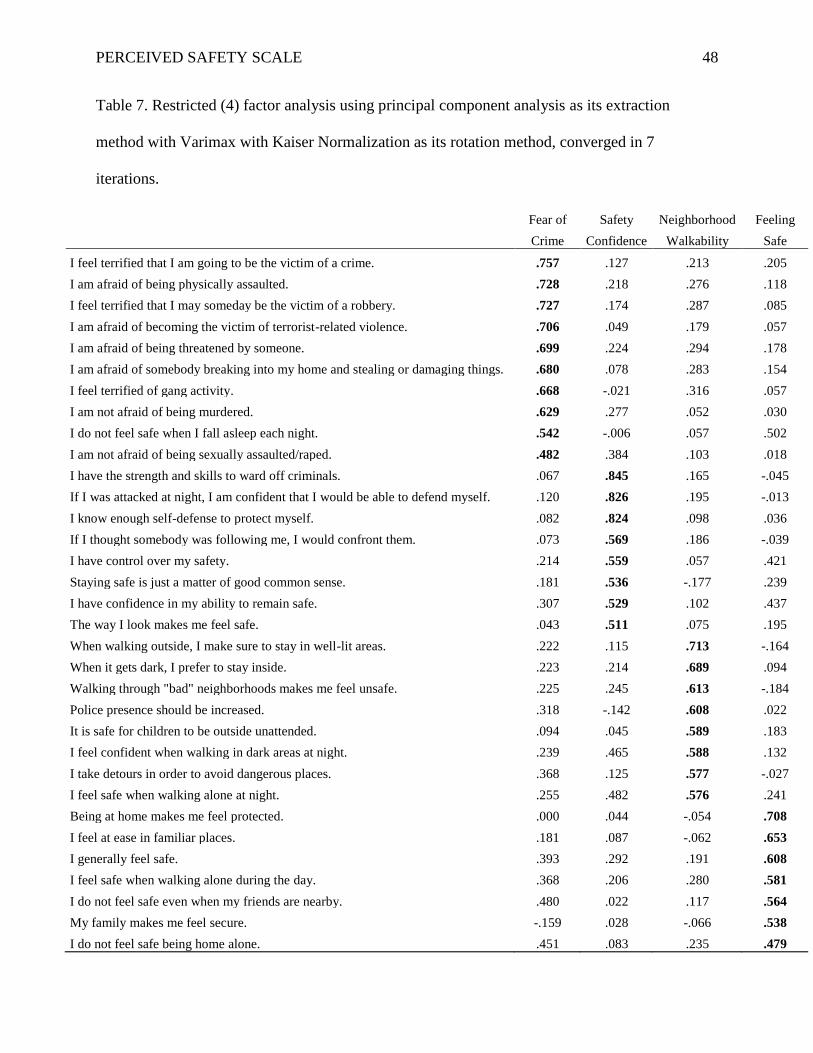
PERCEIVED SAFETY SCALE 48
Table 7. Restricted (4) factor analysis using principal component analysis as its extraction
method with Varimax with Kaiser Normalization as its rotation method, converged in 7
iterations.
Fear of
Crime
Safety
Confidence
Neighborhood
Walkability
Feeling
Safe
I feel terrified that I am going to be the victim of a crime. .757 .127 .213 .205
I am afraid of being physically assaulted. .728 .218 .276 .118
I feel terrified that I may someday be the victim of a robbery. .727 .174 .287 .085
I am afraid of becoming the victim of terrorist-related violence. .706 .049 .179 .057
I am afraid of being threatened by someone. .699 .224 .294 .178
I am afraid of somebody breaking into my home and stealing or damaging things. .680 .078 .283 .154
I feel terrified of gang activity. .668 -.021 .316 .057
I am not afraid of being murdered. .629 .277 .052 .030
I do not feel safe when I fall asleep each night. .542 -.006 .057 .502
I am not afraid of being sexually assaulted/raped. .482 .384 .103 .018
I have the strength and skills to ward off criminals. .067 .845 .165 -.045
If I was attacked at night, I am confident that I would be able to defend myself. .120 .826 .195 -.013
I know enough self-defense to protect myself. .082 .824 .098 .036
If I thought somebody was following me, I would confront them. .073 .569 .186 -.039
I have control over my safety. .214 .559 .057 .421
Staying safe is just a matter of good common sense. .181 .536 -.177 .239
I have confidence in my ability to remain safe. .307 .529 .102 .437
The way I look makes me feel safe. .043 .511 .075 .195
When walking outside, I make sure to stay in well-lit areas. .222 .115 .713 -.164
When it gets dark, I prefer to stay inside. .223 .214 .689 .094
Walking through "bad" neighborhoods makes me feel unsafe. .225 .245 .613 -.184
Police presence should be increased. .318 -.142 .608 .022
It is safe for children to be outside unattended. .094 .045 .589 .183
I feel confident when walking in dark areas at night. .239 .465 .588 .132
I take detours in order to avoid dangerous places. .368 .125 .577 -.027
I feel safe when walking alone at night. .255 .482 .576 .241
Being at home makes me feel protected. .000 .044 -.054 .708
I feel at ease in familiar places. .181 .087 -.062 .653
I generally feel safe. .393 .292 .191 .608
I feel safe when walking alone during the day. .368 .206 .280 .581
I do not feel safe even when my friends are nearby. .480 .022 .117 .564
My family makes me feel secure. -.159 .028 -.066 .538
I do not feel safe being home alone. .451 .083 .235 .479
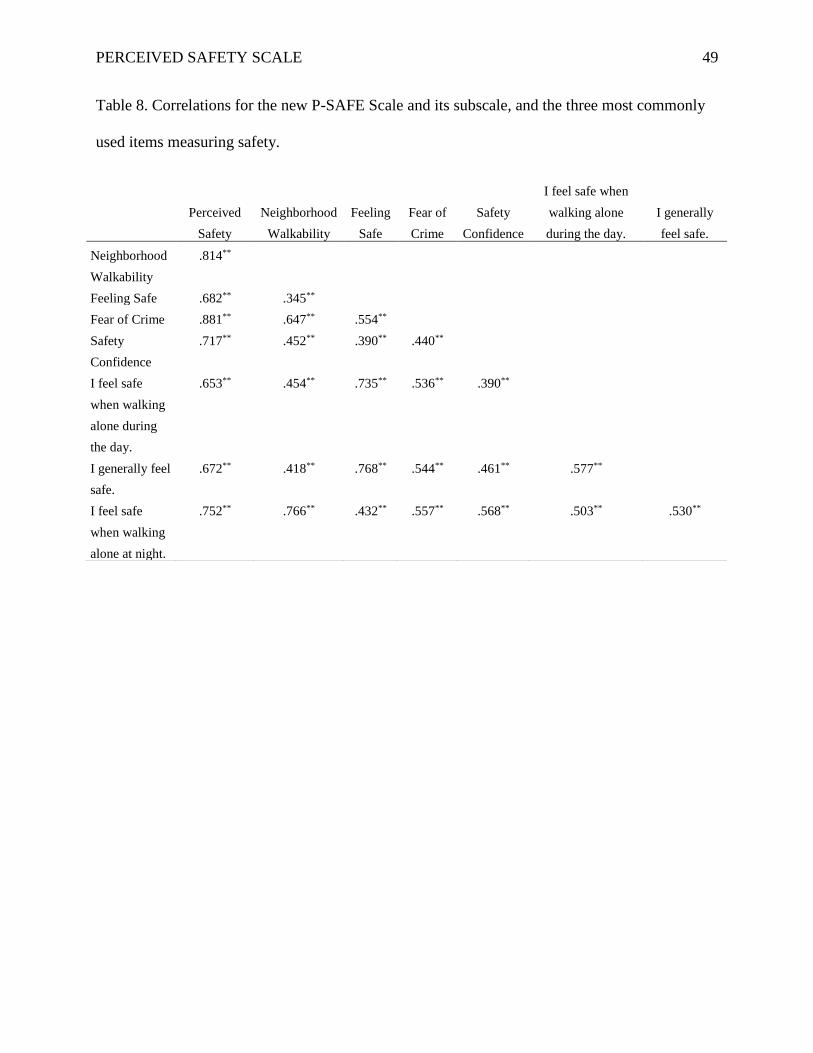
PERCEIVED SAFETY SCALE 49
Table 8. Correlations for the new P-SAFE Scale and its subscale, and the three most commonly
used items measuring safety.
Perceived
Safety
Neighborhood
Walkability
Feeling
Safe
Fear of
Crime
Safety
Confidence
I feel safe when
walking alone
during the day.
I generally
feel safe.
Neighborhood
Walkability
.814**
Feeling Safe .682** .345**
Fear of Crime .881** .647** .554**
Safety
Confidence
.717** .452** .390** .440**
I feel safe
when walking
alone during
the day.
.653** .454** .735** .536** .390**
I generally feel
safe.
.672** .418** .768** .544** .461** .577**
I feel safe
when walking
alone at night.
.752** .766** .432** .557** .568** .503** .530**
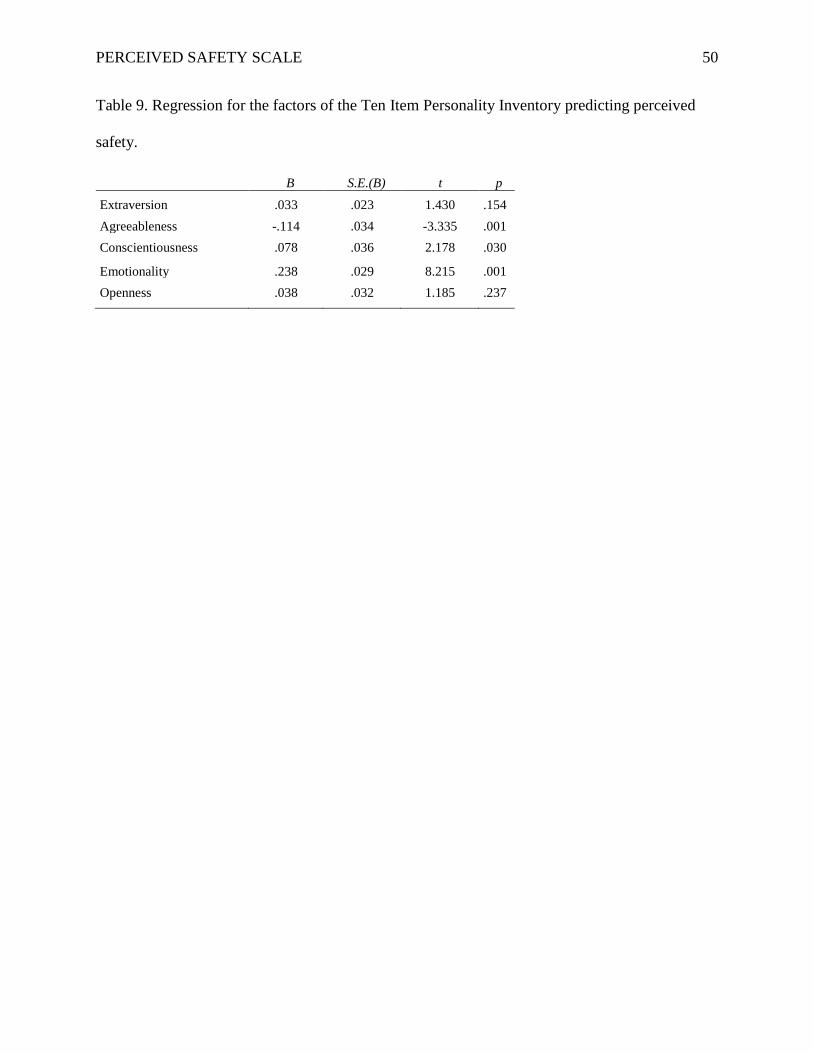
PERCEIVED SAFETY SCALE 50
Table 9. Regression for the factors of the Ten Item Personality Inventory predicting perceived
safety.
B S.E.(B) t p
Extraversion .033 .023 1.430 .154
Agreeableness -.114 .034 -3.335 .001
Conscientiousness .078 .036 2.178 .030
Emotionality .238 .029 8.215 .001
Openness .038 .032 1.185 .237
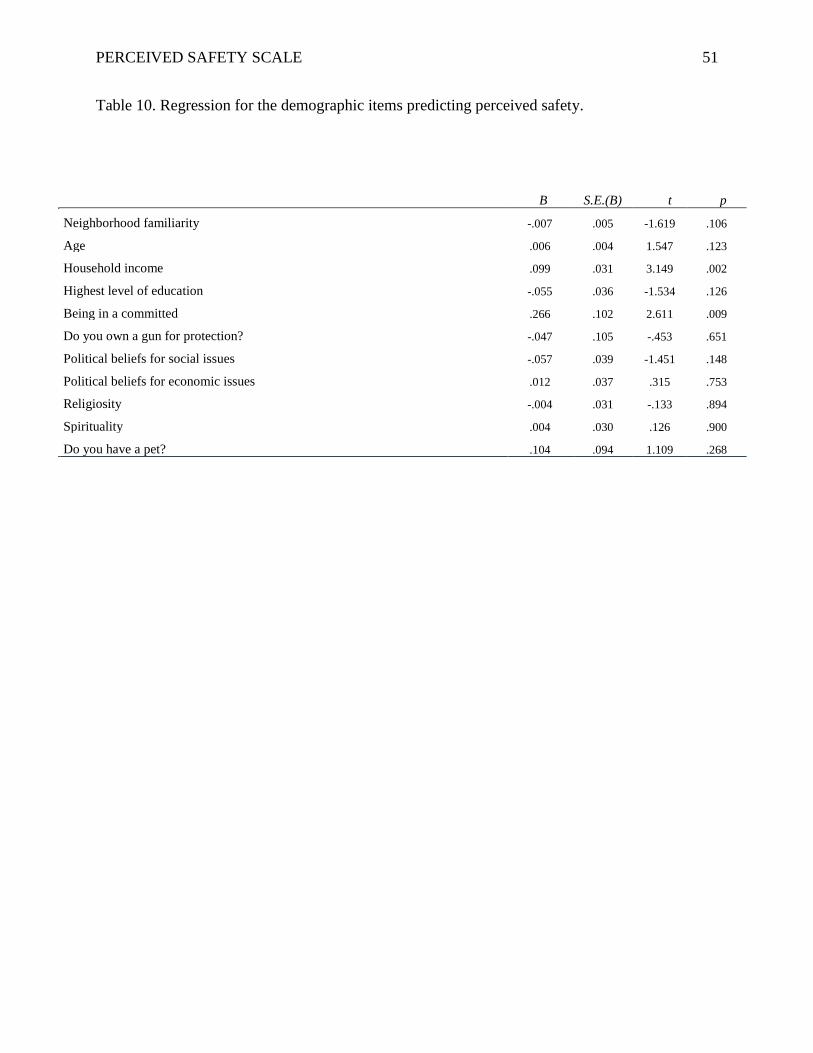
PERCEIVED SAFETY SCALE 51
Table 10. Regression for the demographic items predicting perceived safety.
B S.E.(B) t p
Neighborhood familiarity -.007 .005 -1.619 .106
Age .006 .004 1.547 .123
Household income .099 .031 3.149 .002
Highest level of education -.055 .036 -1.534 .126
Being in a committed .266 .102 2.611 .009
Do you own a gun for protection? -.047 .105 -.453 .651
Political beliefs for social issues -.057 .039 -1.451 .148
Political beliefs for economic issues .012 .037 .315 .753
Religiosity -.004 .031 -.133 .894
Spirituality .004 .030 .126 .900
Do you have a pet? .104 .094 1.109 .268
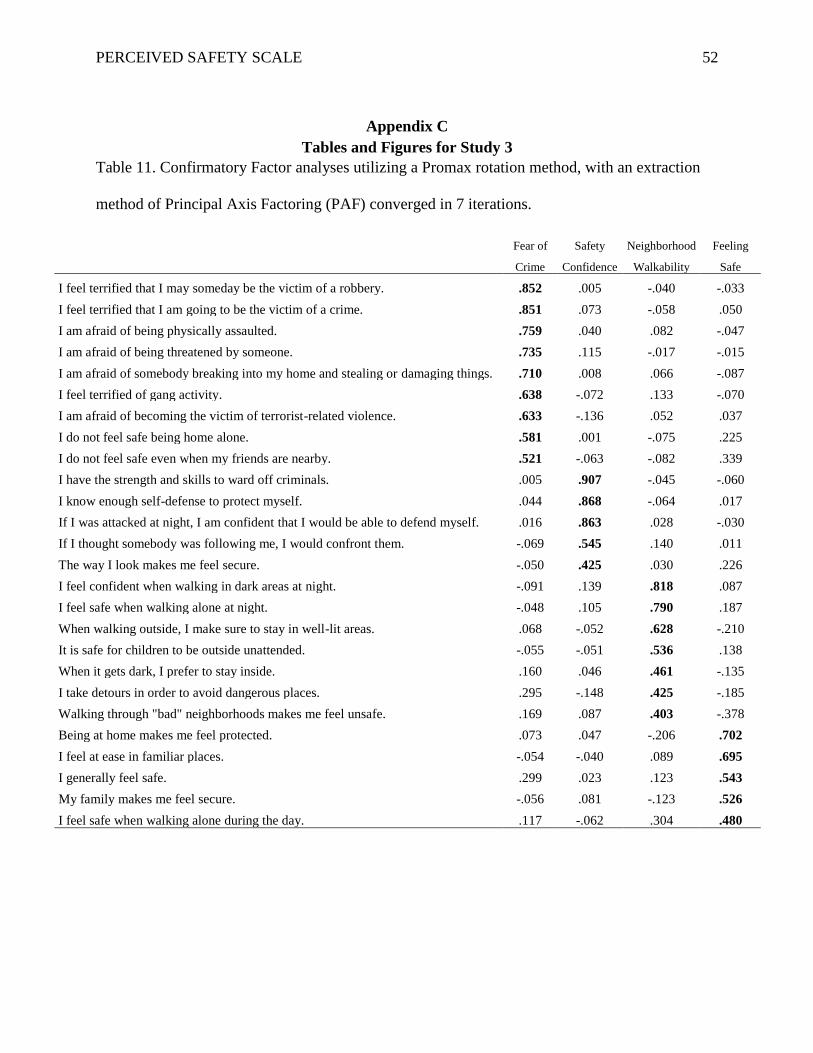
PERCEIVED SAFETY SCALE 52
Appendix C
Tables and Figures for Study 3
Table 11. Confirmatory Factor analyses utilizing a Promax rotation method, with an extraction
method of Principal Axis Factoring (PAF) converged in 7 iterations.
Fear of
Crime
Safety
Confidence
Neighborhood
Walkability
Feeling
Safe
I feel terrified that I may someday be the victim of a robbery. .852 .005 -.040 -.033
I feel terrified that I am going to be the victim of a crime. .851 .073 -.058 .050
I am afraid of being physically assaulted. .759 .040 .082 -.047
I am afraid of being threatened by someone. .735 .115 -.017 -.015
I am afraid of somebody breaking into my home and stealing or damaging things. .710 .008 .066 -.087
I feel terrified of gang activity. .638 -.072 .133 -.070
I am afraid of becoming the victim of terrorist-related violence. .633 -.136 .052 .037
I do not feel safe being home alone. .581 .001 -.075 .225
I do not feel safe even when my friends are nearby. .521 -.063 -.082 .339
I have the strength and skills to ward off criminals. .005 .907 -.045 -.060
I know enough self-defense to protect myself. .044 .868 -.064 .017
If I was attacked at night, I am confident that I would be able to defend myself. .016 .863 .028 -.030
If I thought somebody was following me, I would confront them. -.069 .545 .140 .011
The way I look makes me feel secure. -.050 .425 .030 .226
I feel confident when walking in dark areas at night. -.091 .139 .818 .087
I feel safe when walking alone at night. -.048 .105 .790 .187
When walking outside, I make sure to stay in well-lit areas. .068 -.052 .628 -.210
It is safe for children to be outside unattended. -.055 -.051 .536 .138
When it gets dark, I prefer to stay inside. .160 .046 .461 -.135
I take detours in order to avoid dangerous places. .295 -.148 .425 -.185
Walking through "bad" neighborhoods makes me feel unsafe. .169 .087 .403 -.378
Being at home makes me feel protected. .073 .047 -.206 .702
I feel at ease in familiar places. -.054 -.040 .089 .695
I generally feel safe. .299 .023 .123 .543
My family makes me feel secure. -.056 .081 -.123 .526
I feel safe when walking alone during the day. .117 -.062 .304 .480
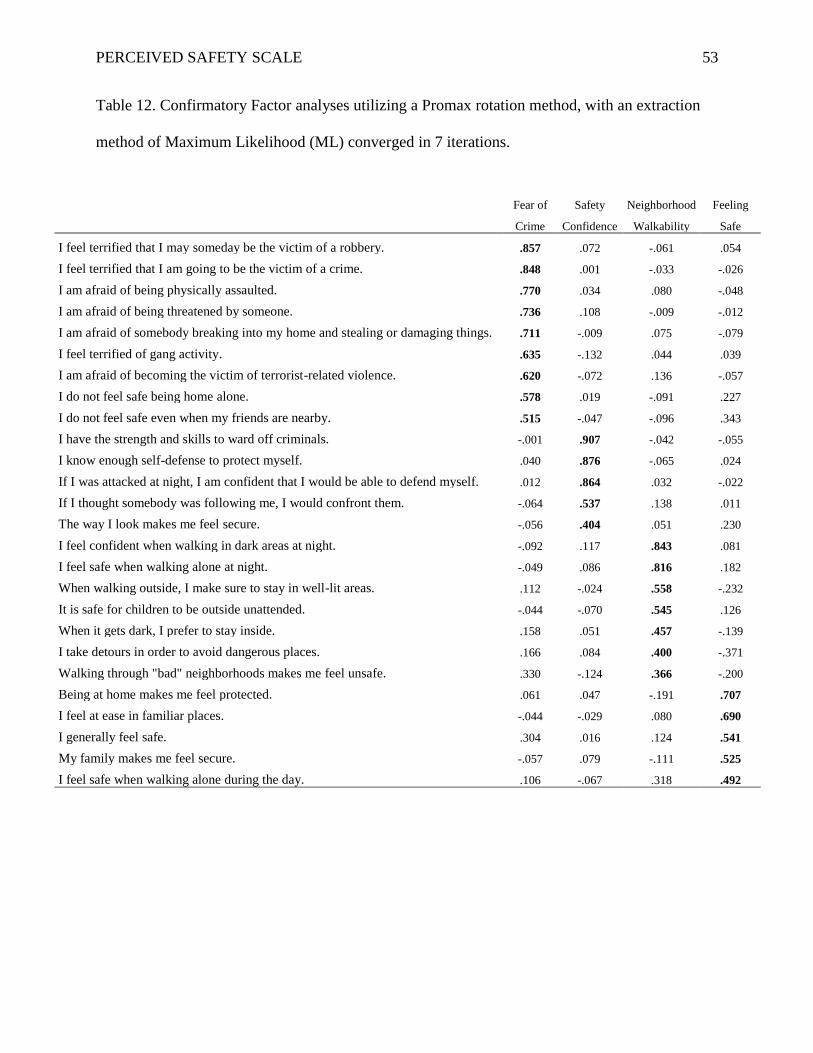
PERCEIVED SAFETY SCALE 53
Table 12. Confirmatory Factor analyses utilizing a Promax rotation method, with an extraction
method of Maximum Likelihood (ML) converged in 7 iterations.
Fear of
Crime
Safety
Confidence
Neighborhood
Walkability
Feeling
Safe
I feel terrified that I may someday be the victim of a robbery. .857 .072 -.061 .054
I feel terrified that I am going to be the victim of a crime. .848 .001 -.033 -.026
I am afraid of being physically assaulted. .770 .034 .080 -.048
I am afraid of being threatened by someone. .736 .108 -.009 -.012
I am afraid of somebody breaking into my home and stealing or damaging things. .711 -.009 .075 -.079
I feel terrified of gang activity. .635 -.132 .044 .039
I am afraid of becoming the victim of terrorist-related violence. .620 -.072 .136 -.057
I do not feel safe being home alone. .578 .019 -.091 .227
I do not feel safe even when my friends are nearby. .515 -.047 -.096 .343
I have the strength and skills to ward off criminals. -.001 .907 -.042 -.055
I know enough self-defense to protect myself. .040 .876 -.065 .024
If I was attacked at night, I am confident that I would be able to defend myself. .012 .864 .032 -.022
If I thought somebody was following me, I would confront them. -.064 .537 .138 .011
The way I look makes me feel secure. -.056 .404 .051 .230
I feel confident when walking in dark areas at night. -.092 .117 .843 .081
I feel safe when walking alone at night. -.049 .086 .816 .182
When walking outside, I make sure to stay in well-lit areas. .112 -.024 .558 -.232
It is safe for children to be outside unattended. -.044 -.070 .545 .126
When it gets dark, I prefer to stay inside. .158 .051 .457 -.139
I take detours in order to avoid dangerous places. .166 .084 .400 -.371
Walking through "bad" neighborhoods makes me feel unsafe. .330 -.124 .366 -.200
Being at home makes me feel protected. .061 .047 -.191 .707
I feel at ease in familiar places. -.044 -.029 .080 .690
I generally feel safe. .304 .016 .124 .541
My family makes me feel secure. -.057 .079 -.111 .525
I feel safe when walking alone during the day. .106 -.067 .318 .492
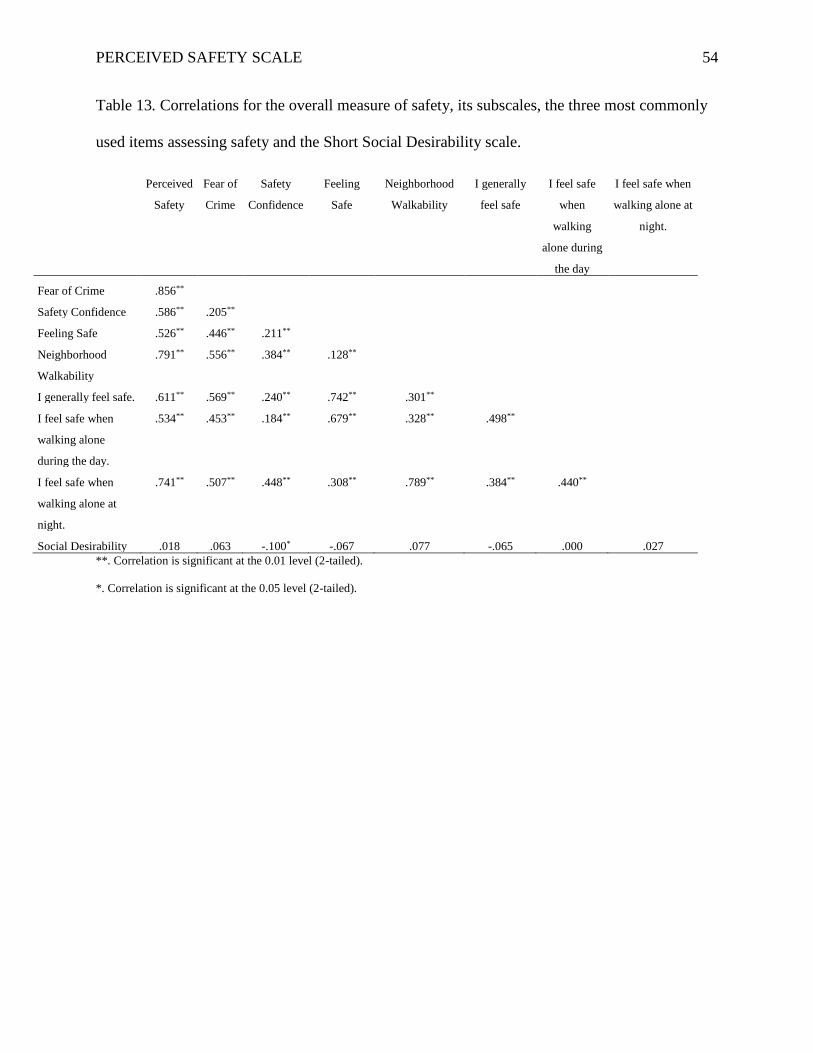
PERCEIVED SAFETY SCALE 54
Table 13. Correlations for the overall measure of safety, its subscales, the three most commonly
used items assessing safety and the Short Social Desirability scale.
Perceived
Safety
Fear of
Crime
Safety
Confidence
Feeling
Safe
Neighborhood
Walkability
I generally
feel safe
I feel safe
when
walking
alone during
the day
I feel safe when
walking alone at
night.
Fear of Crime .856**
Safety Confidence .586** .205**
Feeling Safe .526** .446** .211**
Neighborhood
Walkability
.791** .556** .384** .128**
I generally feel safe. .611** .569** .240** .742** .301**
I feel safe when
walking alone
during the day.
.534** .453** .184** .679** .328** .498**
I feel safe when
walking alone at
night.
.741** .507** .448** .308** .789** .384** .440**
Social Desirability .018 .063 -.100* -.067 .077 -.065 .000 .027
**. Correlation is significant at the 0.01 level (2-tailed).
*. Correlation is significant at the 0.05 level (2-tailed).
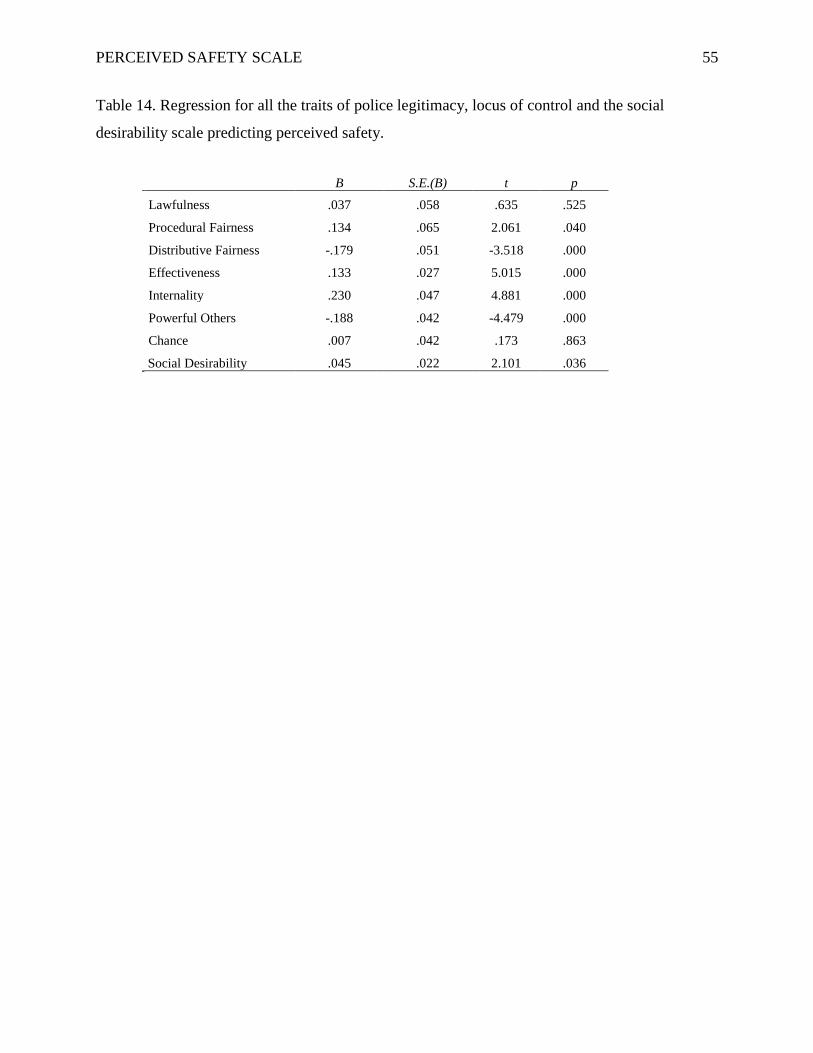
PERCEIVED SAFETY SCALE 55
Table 14. Regression for all the traits of police legitimacy, locus of control and the social
desirability scale predicting perceived safety.
B S.E.(B) t p
Lawfulness .037 .058 .635 .525
Procedural Fairness .134 .065 2.061 .040
Distributive Fairness -.179 .051 -3.518 .000
Effectiveness .133 .027 5.015 .000
Internality .230 .047 4.881 .000
Powerful Others -.188 .042 -4.479 .000
Chance .007 .042 .173 .863
Social Desirability .045 .022 2.101 .036
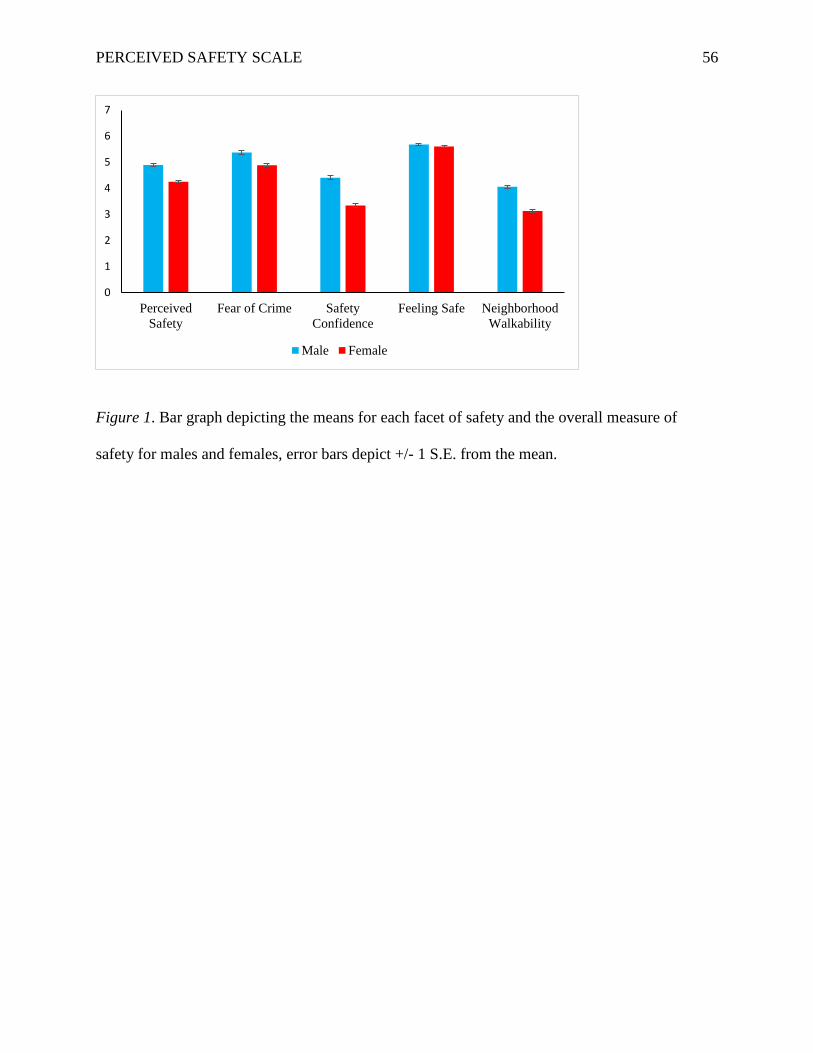
PERCEIVED SAFETY SCALE 56
Figure 1. Bar graph depicting the means for each facet of safety and the overall measure of
safety for males and females, error bars depict +/- 1 S.E. from the mean.
0
1
2
3
4
5
6
7
Perceived
Safety
Fear of Crime Safety
Confidence
Feeling Safe Neighborhood
Walkability
Male Female
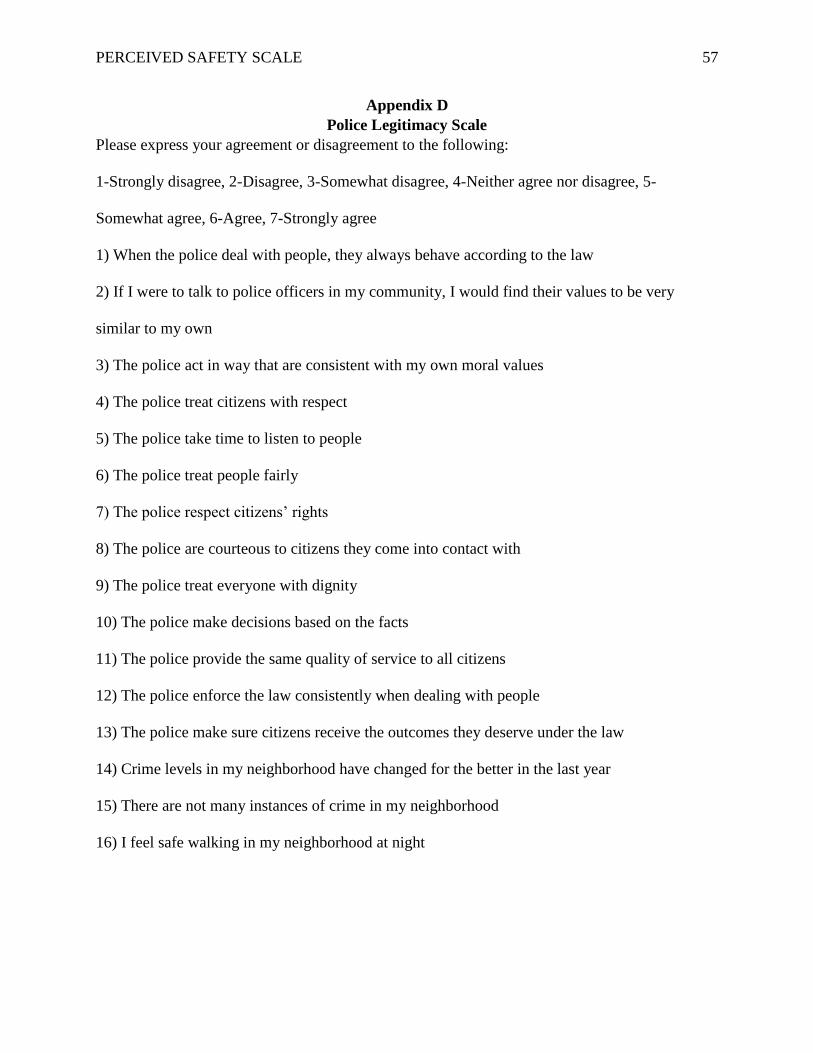
PERCEIVED SAFETY SCALE 57
Appendix D
Police Legitimacy Scale
Please express your agreement or disagreement to the following:
1-Strongly disagree, 2-Disagree, 3-Somewhat disagree, 4-Neither agree nor disagree, 5-
Somewhat agree, 6-Agree, 7-Strongly agree
1) When the police deal with people, they always behave according to the law
2) If I were to talk to police officers in my community, I would find their values to be very
similar to my own
3) The police act in way that are consistent with my own moral values
4) The police treat citizens with respect
5) The police take time to listen to people
6) The police treat people fairly
7) The police respect citizens’ rights
8) The police are courteous to citizens they come into contact with
9) The police treat everyone with dignity
10) The police make decisions based on the facts
11) The police provide the same quality of service to all citizens
12) The police enforce the law consistently when dealing with people
13) The police make sure citizens receive the outcomes they deserve under the law
14) Crime levels in my neighborhood have changed for the better in the last year
15) There are not many instances of crime in my neighborhood
16) I feel safe walking in my neighborhood at night
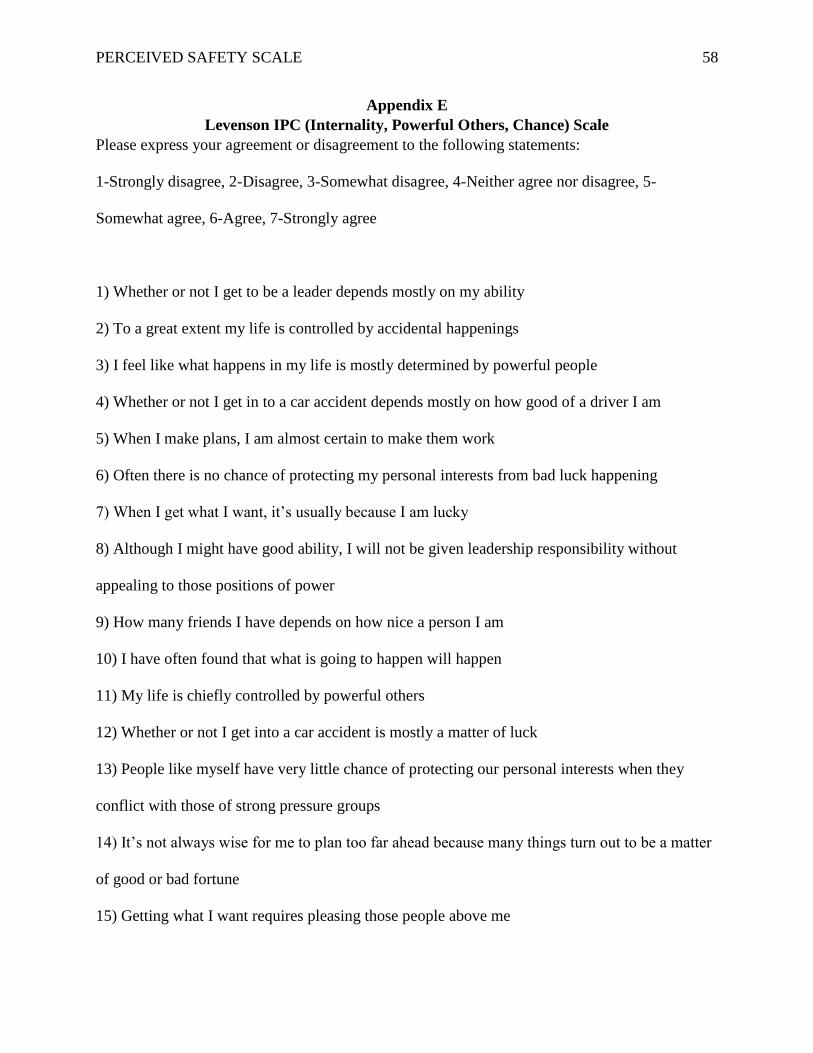
PERCEIVED SAFETY SCALE 58
Appendix E
Levenson IPC (Internality, Powerful Others, Chance) Scale
Please express your agreement or disagreement to the following statements:
1-Strongly disagree, 2-Disagree, 3-Somewhat disagree, 4-Neither agree nor disagree, 5-
Somewhat agree, 6-Agree, 7-Strongly agree
1) Whether or not I get to be a leader depends mostly on my ability
2) To a great extent my life is controlled by accidental happenings
3) I feel like what happens in my life is mostly determined by powerful people
4) Whether or not I get in to a car accident depends mostly on how good of a driver I am
5) When I make plans, I am almost certain to make them work
6) Often there is no chance of protecting my personal interests from bad luck happening
7) When I get what I want, it’s usually because I am lucky
8) Although I might have good ability, I will not be given leadership responsibility without
appealing to those positions of power
9) How many friends I have depends on how nice a person I am
10) I have often found that what is going to happen will happen
11) My life is chiefly controlled by powerful others
12) Whether or not I get into a car accident is mostly a matter of luck
13) People like myself have very little chance of protecting our personal interests when they
conflict with those of strong pressure groups
14) It’s not always wise for me to plan too far ahead because many things turn out to be a matter
of good or bad fortune
15) Getting what I want requires pleasing those people above me
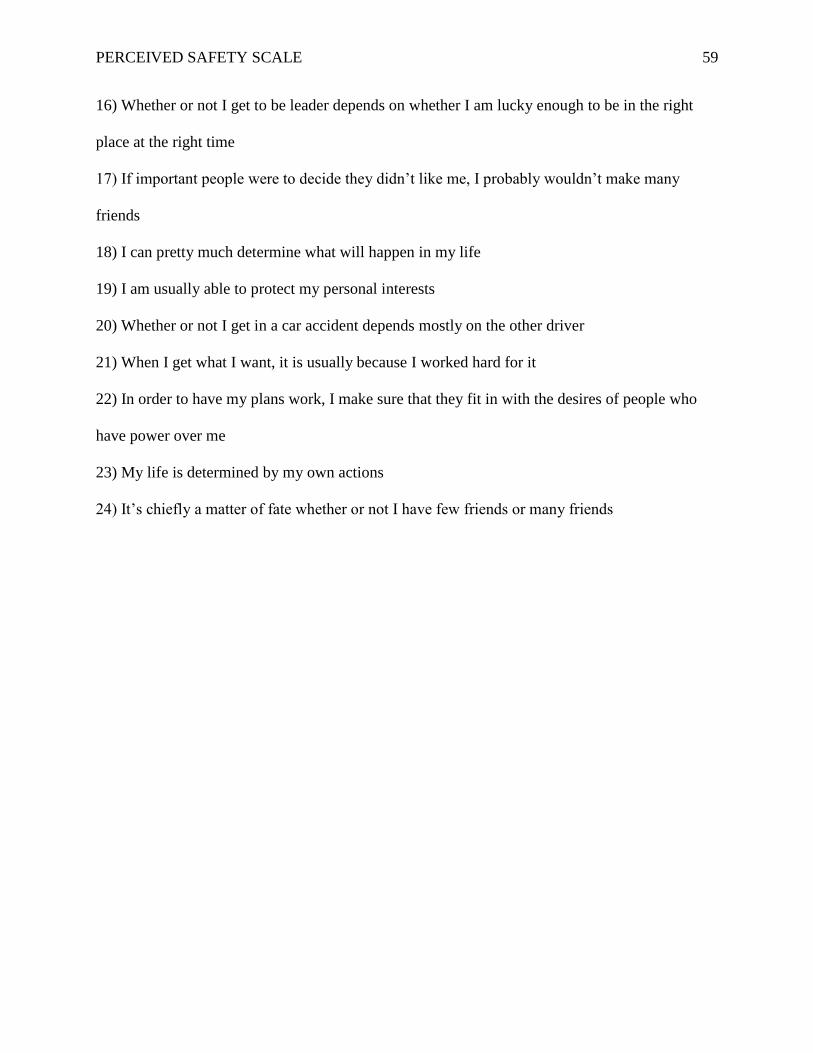
PERCEIVED SAFETY SCALE 59
16) Whether or not I get to be leader depends on whether I am lucky enough to be in the right
place at the right time
17) If important people were to decide they didn’t like me, I probably wouldn’t make many
friends
18) I can pretty much determine what will happen in my life
19) I am usually able to protect my personal interests
20) Whether or not I get in a car accident depends mostly on the other driver
21) When I get what I want, it is usually because I worked hard for it
22) In order to have my plans work, I make sure that they fit in with the desires of people who
have power over me
23) My life is determined by my own actions
24) It’s chiefly a matter of fate whether or not I have few friends or many friends
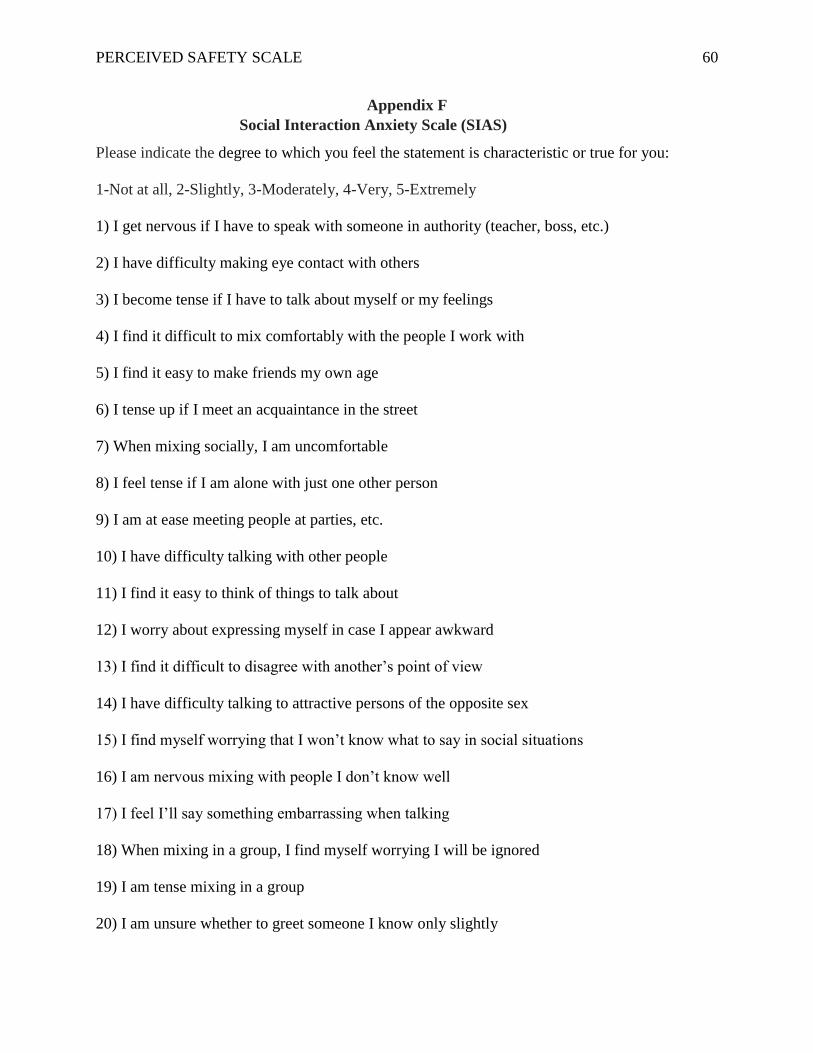
PERCEIVED SAFETY SCALE 60
Appendix F
Social Interaction Anxiety Scale (SIAS)
Please indicate the degree to which you feel the statement is characteristic or true for you:
1-Not at all, 2-Slightly, 3-Moderately, 4-Very, 5-Extremely
1) I get nervous if I have to speak with someone in authority (teacher, boss, etc.)
2) I have difficulty making eye contact with others
3) I become tense if I have to talk about myself or my feelings
4) I find it difficult to mix comfortably with the people I work with
5) I find it easy to make friends my own age
6) I tense up if I meet an acquaintance in the street
7) When mixing socially, I am uncomfortable
8) I feel tense if I am alone with just one other person
9) I am at ease meeting people at parties, etc.
10) I have difficulty talking with other people
11) I find it easy to think of things to talk about
12) I worry about expressing myself in case I appear awkward
13) I find it difficult to disagree with another’s point of view
14) I have difficulty talking to attractive persons of the opposite sex
15) I find myself worrying that I won’t know what to say in social situations
16) I am nervous mixing with people I don’t know well
17) I feel I’ll say something embarrassing when talking
18) When mixing in a group, I find myself worrying I will be ignored
19) I am tense mixing in a group
20) I am unsure whether to greet someone I know only slightly
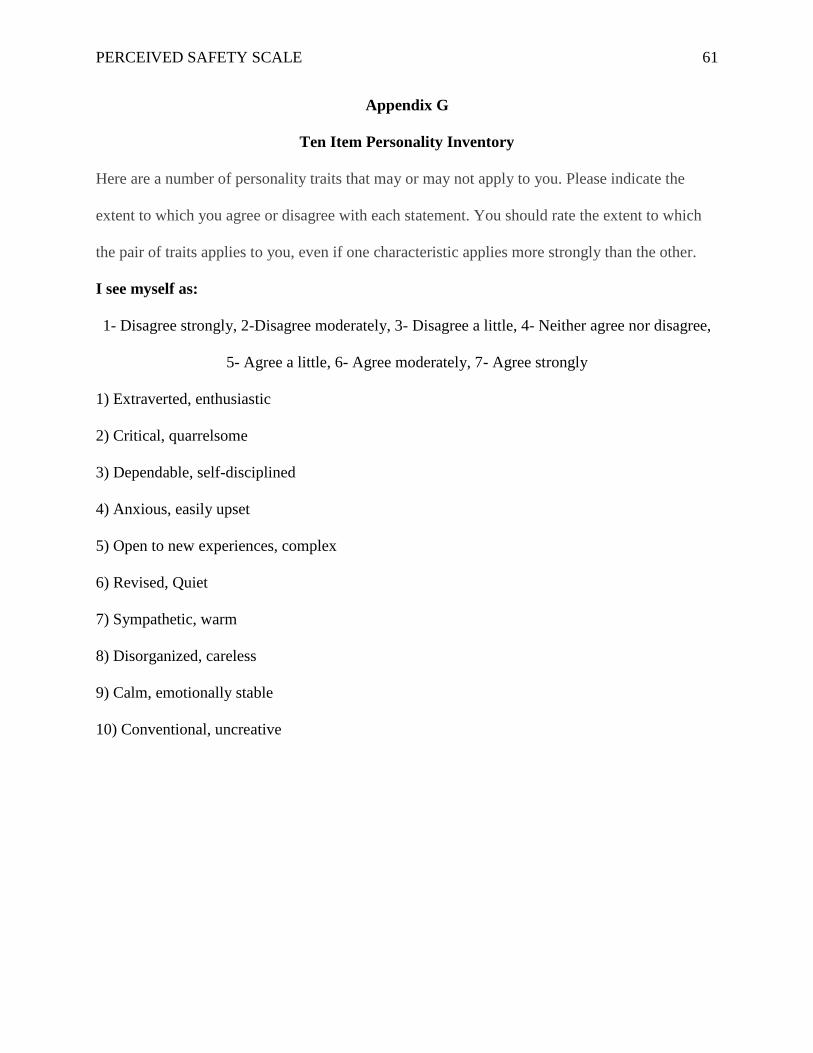
PERCEIVED SAFETY SCALE 61
Appendix G
Ten Item Personality Inventory
Here are a number of personality traits that may or may not apply to you. Please indicate the
extent to which you agree or disagree with each statement. You should rate the extent to which
the pair of traits applies to you, even if one characteristic applies more strongly than the other.
I see myself as:
1- Disagree strongly, 2-Disagree moderately, 3- Disagree a little, 4- Neither agree nor disagree,
5- Agree a little, 6- Agree moderately, 7- Agree strongly
1) Extraverted, enthusiastic
2) Critical, quarrelsome
3) Dependable, self-disciplined
4) Anxious, easily upset
5) Open to new experiences, complex
6) Revised, Quiet
7) Sympathetic, warm
8) Disorganized, careless
9) Calm, emotionally stable
10) Conventional, uncreative
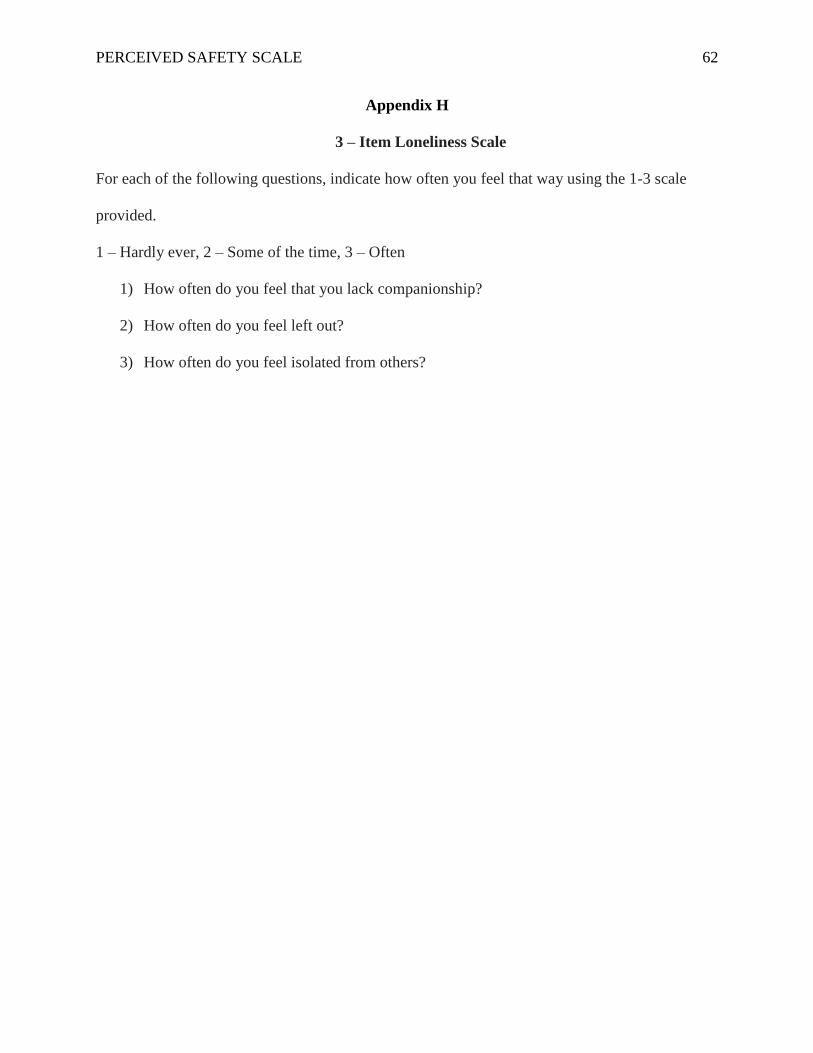
PERCEIVED SAFETY SCALE 62
Appendix H
3 – Item Loneliness Scale
For each of the following questions, indicate how often you feel that way using the 1-3 scale
provided.
1 – Hardly ever, 2 – Some of the time, 3 – Often
1) How often do you feel that you lack companionship?
2) How often do you feel left out?
3) How often do you feel isolated from others?
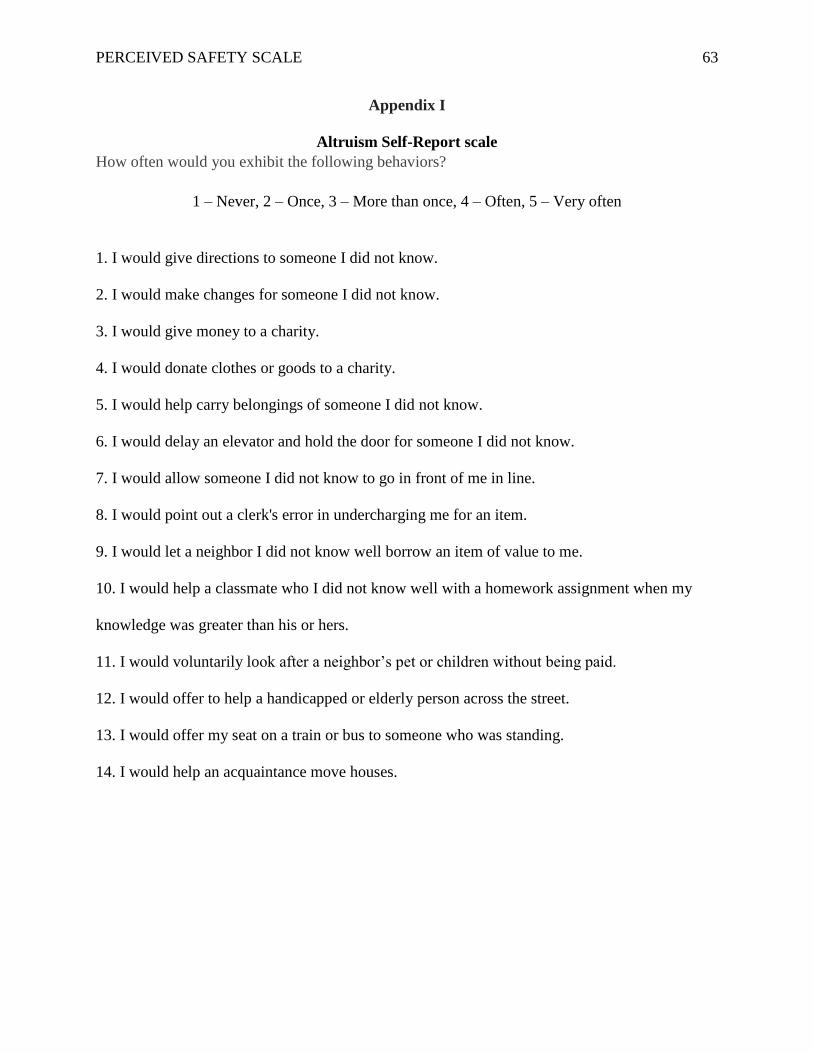
PERCEIVED SAFETY SCALE 63
Appendix I
Altruism Self-Report scale
How often would you exhibit the following behaviors?
1 – Never, 2 – Once, 3 – More than once, 4 – Often, 5 – Very often
1. I would give directions to someone I did not know.
2. I would make changes for someone I did not know.
3. I would give money to a charity.
4. I would donate clothes or goods to a charity.
5. I would help carry belongings of someone I did not know.
6. I would delay an elevator and hold the door for someone I did not know.
7. I would allow someone I did not know to go in front of me in line.
8. I would point out a clerk's error in undercharging me for an item.
9. I would let a neighbor I did not know well borrow an item of value to me.
10. I would help a classmate who I did not know well with a homework assignment when my
knowledge was greater than his or hers.
11. I would voluntarily look after a neighbor’s pet or children without being paid.
12. I would offer to help a handicapped or elderly person across the street.
13. I would offer my seat on a train or bus to someone who was standing.
14. I would help an acquaintance move houses.
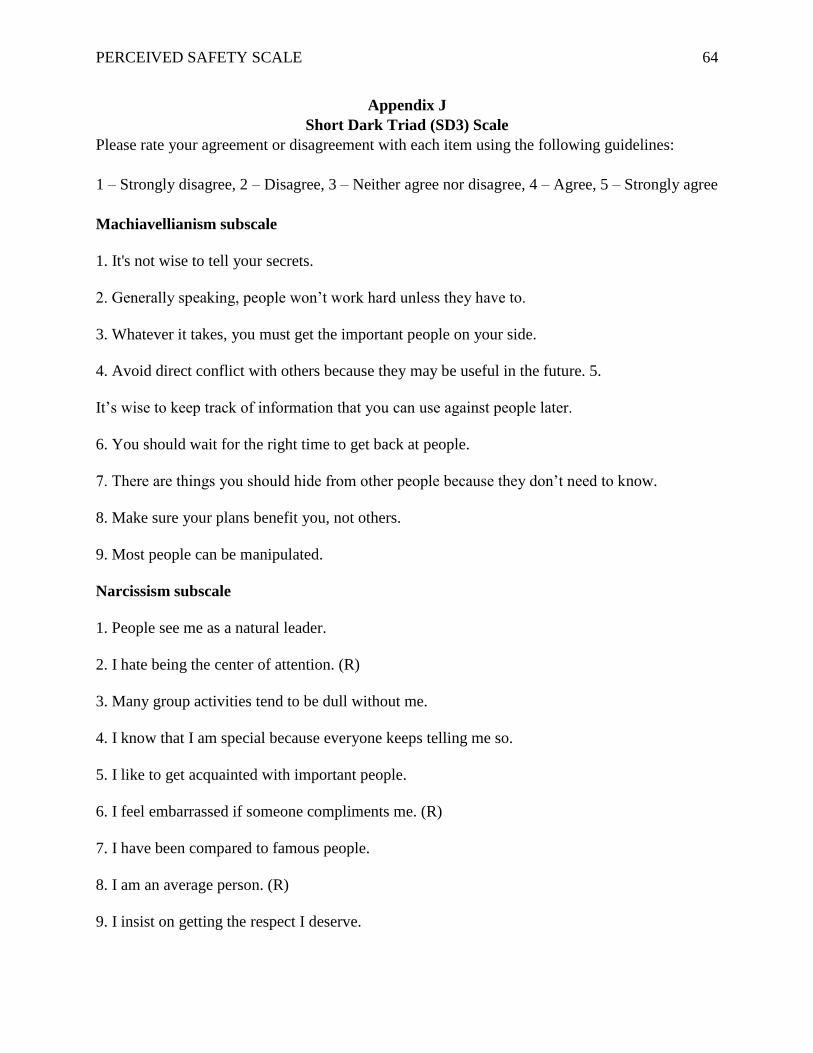
PERCEIVED SAFETY SCALE 64
Appendix J
Short Dark Triad (SD3) Scale
Please rate your agreement or disagreement with each item using the following guidelines:
1 – Strongly disagree, 2 – Disagree, 3 – Neither agree nor disagree, 4 – Agree, 5 – Strongly agree
Machiavellianism subscale
1. It's not wise to tell your secrets.
2. Generally speaking, people won’t work hard unless they have to.
3. Whatever it takes, you must get the important people on your side.
4. Avoid direct conflict with others because they may be useful in the future. 5.
It’s wise to keep track of information that you can use against people later.
6. You should wait for the right time to get back at people.
7. There are things you should hide from other people because they don’t need to know.
8. Make sure your plans benefit you, not others.
9. Most people can be manipulated.
Narcissism subscale
1. People see me as a natural leader.
2. I hate being the center of attention. (R)
3. Many group activities tend to be dull without me.
4. I know that I am special because everyone keeps telling me so.
5. I like to get acquainted with important people.
6. I feel embarrassed if someone compliments me. (R)
7. I have been compared to famous people.
8. I am an average person. (R)
9. I insist on getting the respect I deserve.
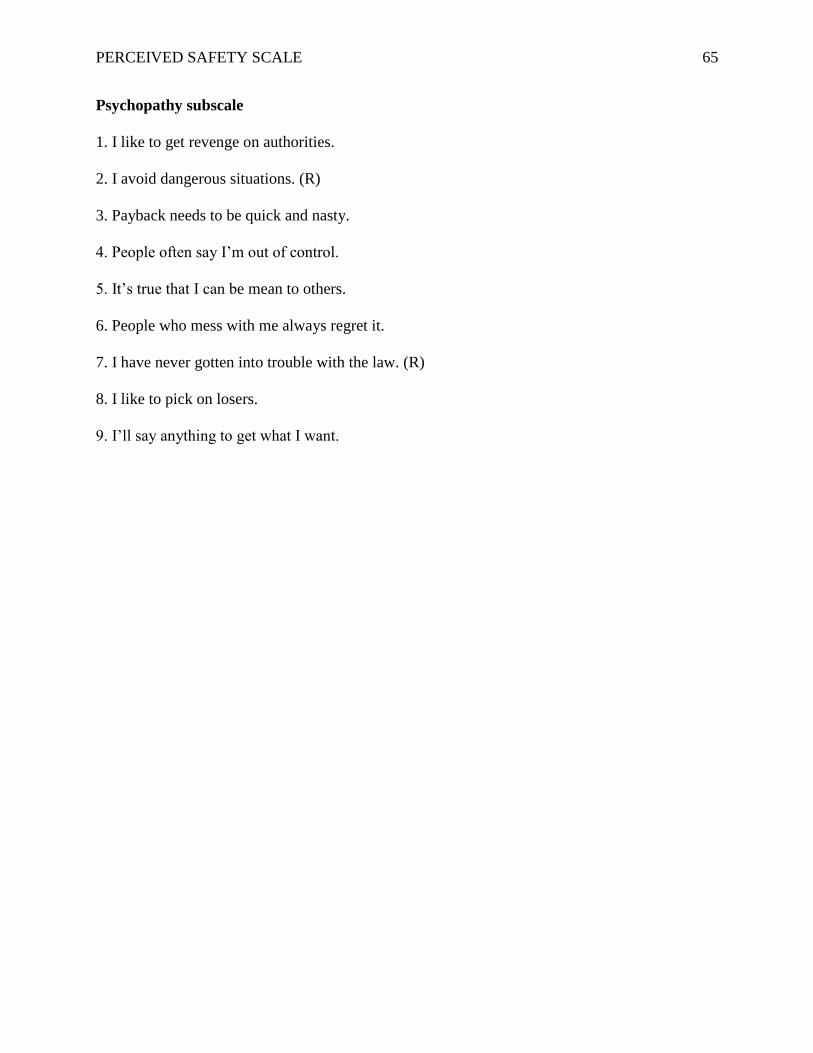
PERCEIVED SAFETY SCALE 65
Psychopathy subscale
1. I like to get revenge on authorities.
2. I avoid dangerous situations. (R)
3. Payback needs to be quick and nasty.
4. People often say I’m out of control.
5. It’s true that I can be mean to others.
6. People who mess with me always regret it.
7. I have never gotten into trouble with the law. (R)
8. I like to pick on losers.
9. I’ll say anything to get what I want.
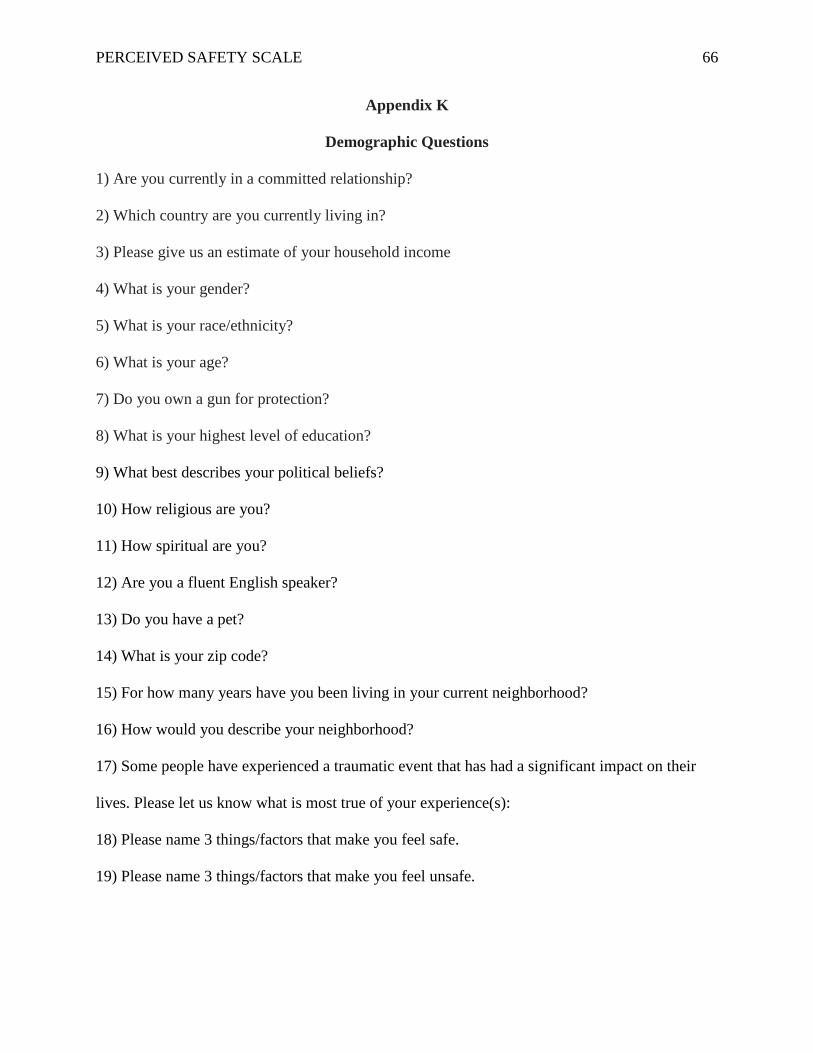
PERCEIVED SAFETY SCALE 66
Appendix K
Demographic Questions
1) Are you currently in a committed relationship?
2) Which country are you currently living in?
3) Please give us an estimate of your household income
4) What is your gender?
5) What is your race/ethnicity?
6) What is your age?
7) Do you own a gun for protection?
8) What is your highest level of education?
9) What best describes your political beliefs?
10) How religious are you?
11) How spiritual are you?
12) Are you a fluent English speaker?
13) Do you have a pet?
14) What is your zip code?
15) For how many years have you been living in your current neighborhood?
16) How would you describe your neighborhood?
17) Some people have experienced a traumatic event that has had a significant impact on their
lives. Please let us know what is most true of your experience(s):
18) Please name 3 things/factors that make you feel safe.
19) Please name 3 things/factors that make you feel unsafe.
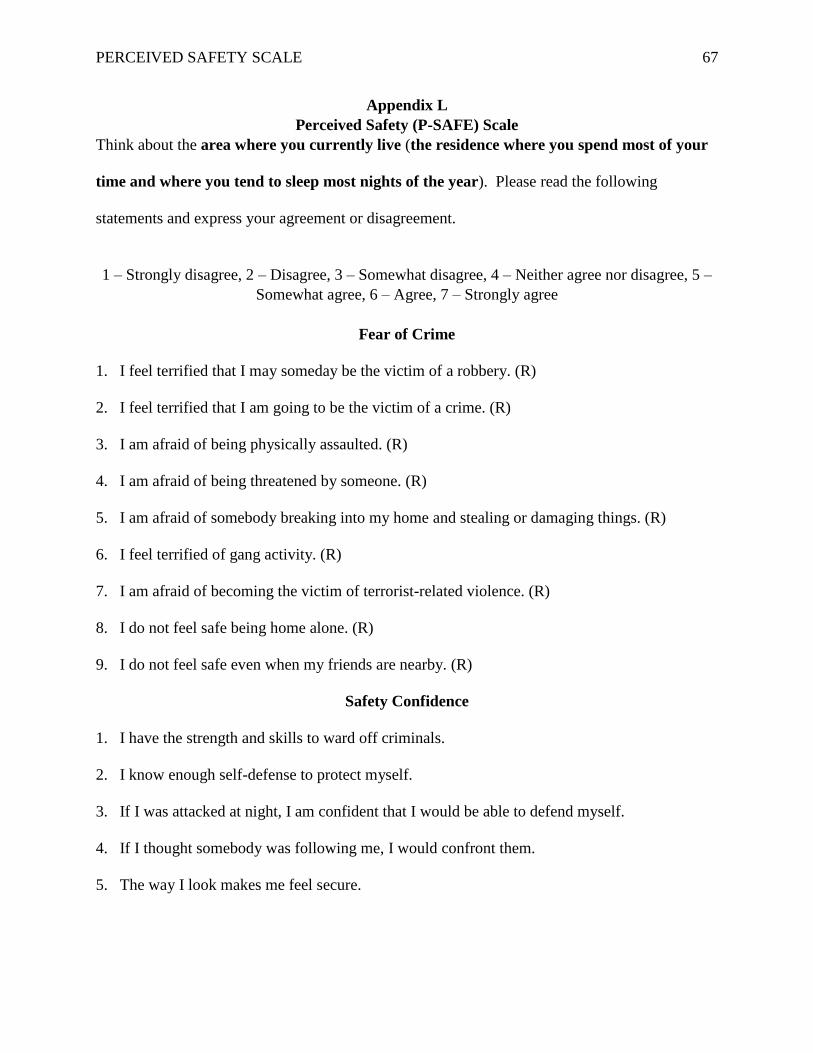
PERCEIVED SAFETY SCALE 67
Appendix L
Perceived Safety (P-SAFE) Scale
Think about the area where you currently live (the residence where you spend most of your
time and where you tend to sleep most nights of the year). Please read the following
statements and express your agreement or disagreement.
1 – Strongly disagree, 2 – Disagree, 3 – Somewhat disagree, 4 – Neither agree nor disagree, 5 –
Somewhat agree, 6 – Agree, 7 – Strongly agree
Fear of Crime
1. I feel terrified that I may someday be the victim of a robbery. (R)
2. I feel terrified that I am going to be the victim of a crime. (R)
3. I am afraid of being physically assaulted. (R)
4. I am afraid of being threatened by someone. (R)
5. I am afraid of somebody breaking into my home and stealing or damaging things. (R)
6. I feel terrified of gang activity. (R)
7. I am afraid of becoming the victim of terrorist-related violence. (R)
8. I do not feel safe being home alone. (R)
9. I do not feel safe even when my friends are nearby. (R)
Safety Confidence
1. I have the strength and skills to ward off criminals.
2. I know enough self-defense to protect myself.
3. If I was attacked at night, I am confident that I would be able to defend myself.
4. If I thought somebody was following me, I would confront them.
5. The way I look makes me feel secure.
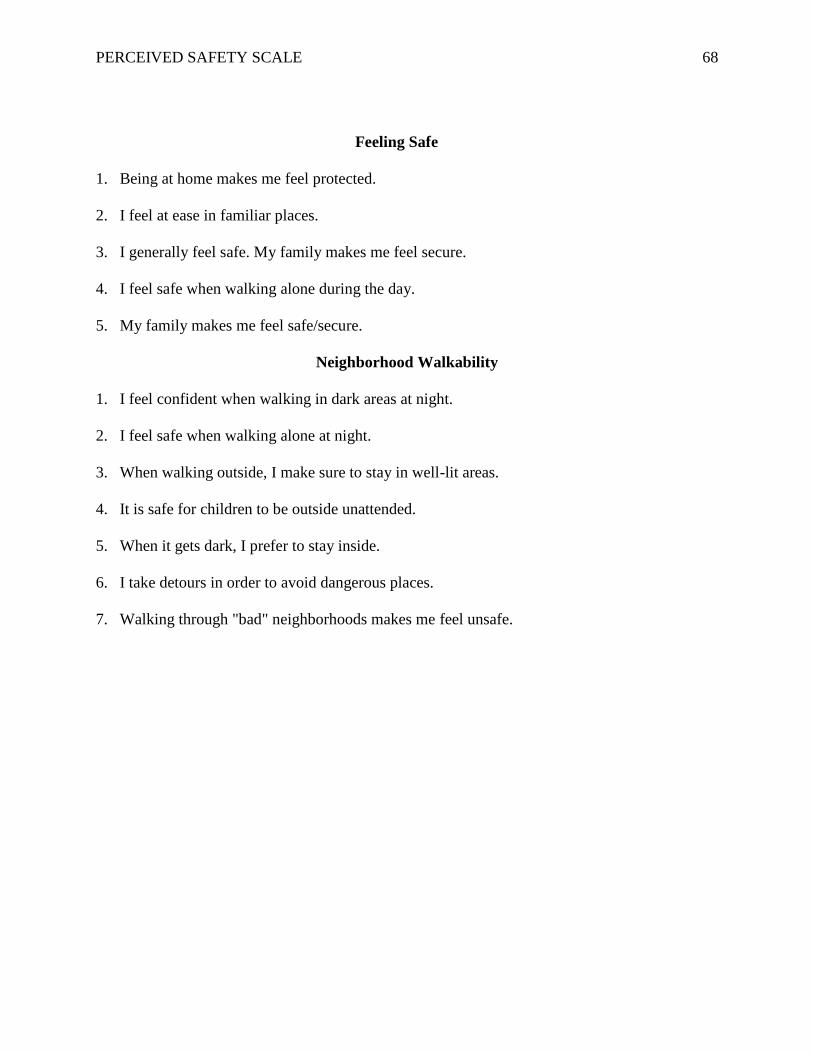
PERCEIVED SAFETY SCALE 68
Feeling Safe
1. Being at home makes me feel protected.
2. I feel at ease in familiar places.
3. I generally feel safe. My family makes me feel secure.
4. I feel safe when walking alone during the day.
5. My family makes me feel safe/secure.
Neighborhood Walkability
1. I feel confident when walking in dark areas at night.
2. I feel safe when walking alone at night.
3. When walking outside, I make sure to stay in well-lit areas.
4. It is safe for children to be outside unattended.
5. When it gets dark, I prefer to stay inside.
6. I take detours in order to avoid dangerous places.
7. Walking through "bad" neighborhoods makes me feel unsafe.
PERCEIVED SAFETY SCALE 69
Appendix M
Supplementary Materials
Study 2A
The purpose of study 2A was to replicate the findings of study 1 & 2. Specifically, this re-
examination would center on the relationship between police legitimacy, locus of control and
safety in a collegiate sample. Additionally, this study aimed to investigate how certain traits,
such as psychopathy, narcissism, loneliness and altruism, were associated with safety. For the
Dark Triad traits, I predicted that narcissism would be correlated with higher scores in the Safety
Confidence subscale, as narcissists are confident in themselves, which would result in higher
scores in items pertaining to one’s ability and trust in their skills to remain safe. I also predicted
that psychopathy would be predictive of higher levels of safety, as psychopaths do not
experience emotions to the same degree as non-psychopathic individuals. For loneliness, I
predicted that individuals who experience greater loneliness would be more vulnerable and thus
feel more unsafe while individuals who are more altruistic would be more fearless and bold, thus
being more confident in their ability to remain safe.
Method
Participants. Seventy undergraduate introductory psychology students (44 female; 44
sophomores) were recruited from Franklin & Marshall College, in exchange for course credit.
Materials and Procedure. Participants were presented with the revised P-SAFE scale,
followed by the Police Legitimacy scale, the Levenson Multidimensional Locus of Control scale,
the 3-Item Loneliness scale (Hughes, Waite, Hawkley, & Cacioppo, 2004), the Altruism Self-
Report scale (Rushton, 1981) and the Short Dark Triad (SD3) questionnaire (Jones & Paulhus,
2014), in random order. Lastly, this study also included several exploratory questions pertaining
to attitudes towards police and safety: “During which semester do you feel safer in general?”,
PERCEIVED SAFETY SCALE 70
“Do you think that the office of Public Safety should have an increased presence on campus?”,
“Imagine that F&M chose to greatly reduce the presence of Public Safety officers on campus by
not allowing them to enter campus grounds in order to allow students to have a greater sense of
independence and freedom. Would that make you feel: Significantly safer than now, Safer than
now, Equally safe as now, Less safe than now, Significantly less safe than now”, and “Imagine
that F&M chose to employ a formal police force in order to better protect the students and to
have a more formal security on campus. Would that make you feel: Significantly safer than now,
Safer than now, Equally safe as now, Less safe than now, Significantly less safe than now”.
These questions focused on whether a different police style (less police presence, same police
presence as now, or more formal police presence) would affect how safe students feel. Further,
the same questions concerning factors that make people feel safe/unsafe similar to study 2.
Study 2 A Results
Reliability of the P-SAFE Scale. The P-SAFE scale was reliable (α = .929). All four
subscales of the P-SAFE were also reliable: Fear of Crime: α = .909, Safety Confidence: α =
.883, Feeling Safe: α = .758, Neighborhood Walkability: α = .756.
Correlations. Once again, all the subscales of the P-SAFE scale were significantly
correlated with the overall measure of safety, without indicating multicollinearity (see Table S1).
Loneliness was negatively correlated with Perceived safety (r = -.339, p < .001), Safety
Confidence (r = -.446, p < .001) and Neighborhood Walkability (r = -.340, p < .001).
Replicating the findings of study 1, the overall measure of Police Legitimacy was
significantly correlated with Safety Confidence (r = .360, p < .001), and police effectiveness
was also significantly correlated with both the Perceived Safety (r = .395, p < .001) and all the
PERCEIVED SAFETY SCALE 71
subscales of the P-SAFE: Fear of Crime (r = .270, p < .001), Feeling Safe (r = .388, p < .001),
Neighborhood Walkability (r = .344, p < .001) and Safety Confidence (r = .329, p < .001).
Police effectiveness was associated with higher scores in Perceived Safety. However, the
other counterparts of police legitimacy are only significantly correlated with Safety Confidence.
This could potentially mean that how much faith a person has in his self and their ability to
remain safe is affected by how effective, fair and lawful a police force is. For a better look at
how all the different aspects of police legitimacy are correlated with the P-SAFE scale see Table
S2.
Ratings on the External Locus of Control scale were negatively correlated with overall
safety (r = -.252, p < .001) and perceived safety (r = -.341, p < .001), indicating that the more
one person depends on others for their safety the less likely they feel safe themselves (see Table
S3). Altruism was not significantly correlated with any of the subscales or the overall measure of
safety. Psychopathy was significantly correlated with Perceived Safety (r = .261, p = .029),
Safety Confidence (r = .406, p < .001) and Neighborhood Walkability (r = .334, p < .001), while
narcissism was significantly correlated with Perceived safety (r = .355, p < .001), Safety
Confidence (r = .552, p < .001) and Neighborhood Walkability (r = .271, p = .023), and
Machiavellianism was not correlated with any subscales of the P-SAFE scale (see Table S4).
Regression Analyses. The main goal of this study was to establish predictive and
discriminant validity for the subscales of the P-SAFE scale while also replicating the findings of
Study 1. Thus, linear regressions with all the measures of the study predicting the individual
subscales and the overall P-SAFE scale were executed. Loneliness (p = .038) and police
effectiveness (p = .002) were the only significant predictors of Perceived safety (see Table S5).
People who are lonelier tend to feel more vulnerable, while police forces are the primary
PERCEIVED SAFETY SCALE 72
enforcers of security. For Fear of Crime, police effectiveness was the sole significant predictor (p
= .020; see Table S6). The more effective a police force is, the less crime is prevalent in a
specific environment. For Feeling Safe, loneliness (p = .016), altruism (p = .037), psychopathy (p
= .042), police distributive fairness (p = .046) and police effectiveness ((p = .007) were
significant predictors (see Table S7). As Feeling Safe captures an underlying notion of safety
pertinent to our everyday functioning, police legitimacy and loneliness are associated with this
construct. For Neighborhood Walkability, psychopathy (p = .004), effectiveness (p = .002) were
significant predictors (see Table S8). Psychopathy specifically is associated with perceiving less
danger, having less friends and engaging in less pro-social behaviors and thus explains why
people higher in this trait are more likely to walk alone at night. Lastly, for Safety Confidence,
loneliness (p = .034), psychopathy (p = .002), narcissism (p = .003), a higher belief in powerful
others (p = .008), and a higher belief in chance (p = .019), were significant predictors while
police effectiveness was marginally significant (p = .063; see Table S9). Supporting our
hypothesis, narcissism was a strong predictor of Safety Confidence, as this facet is associated
with trust in one’s ability, a habit that is prevalent in narcissist. Overall, and in accordance with
previous findings (Camerino, 2016; Jiang, Mak, Larsen & Zhong, 2017; Zaplluzha & Shahini,
2016), gender was a strong predictor (p < .01) of all facets of safety and Perceived Safety overall.
Exploratory Questions. In recent times, police legitimacy has been reduced due to
several incidents involving police brutality. To examine this phenomenon, students were asked
whether the Office of Public Safety, the law enforcement force employed by Franklin &
Marshall College, should have an increased presence on campus (see Table S10). From the 70
students, 25 (35.7%) answered yes, hinting that an increased present might lead to higher scores
in perceived safety. Additional questions were asked pertaining to different police styles. When a
PERCEIVED SAFETY SCALE 73
formal police force is employed 19 students (27.1%) reported that they would feel safer, while
21 (30%) reported that they would feel less safe (see Table S11). This signifies that police
presence, if unwanted, can actually reduce safety. In the scenario where no police force was on
campus, due to a new law prohibiting them, 6 students (8.6%), reported they would feel safer,
while 47 (67.1%), reported that they would feel less safe (see Table S12). Additionally, students
reported no difference concerning what season makes them feel safer, as most of them (N = 61)
reported that they feel equally safe in both semesters of the school year.
Qualitative Data. Participants’ indications of which factors make them feel safe or
unsafe led to similar patterns as were observed in Study 2. Specifically, having a family member
or friend in proximity (N = 74), being in the confines of one’s house (N = 28) and being in
familiar spaces (N = 21) were the most common responses for factors leading to feelings of
safety (see Table S13). As what made them feel unsafe, this study also was similar to Study 2. In
particular, being in a large crowd or an area with people perceived to be dangerous (N = 37),
being in a dark area or being outside at dark (N = 36) and being alone or feeling lonely (N = 26;
see Table S14).
Study 2A Discussion
This study replicated Studies 1 and 2 in terms of reliability and validity for the P-SAFE
scale. Police effectiveness and an internal locus of control are the strongest predictors of safety
and individual facets of safety. Previous works have revealed that psychopaths tend to perceive
less fear, threat while also having a harder time experiencing other peoples’ emotions (Skeem,
Polaschek, Patrick, & Lilienfeld, 2011). In accordance with the hypothesis that people higher in
psychopathy would feel safer, as they experience blunted feelings of threat and take more risks,
psychopathy positively predicted Safety Confidence, Feeling Safe, and how likely people are to
PERCEIVED SAFETY SCALE 74
walk in dangerous environments. Additionally, narcissism also predicted Safety Confidence,
which is supported by previous research that has revealed that narcissists tend to be
overconfident (Macenczak et al, 2016), which in the case of safety, could lead to people who are
higher in narcissism feeling more confident in their ability to remain safe.
Previous works have linked social anxiety and depression with loneliness (Aikawa,
Fujita, & Tanaka, 2007). Loneliness is also predictive of vulnerability to hopelessness (Bonner &
Rich, 1991). Thus, being anxious, depressed and more vulnerable could explain why people who
experience more loneliness also reported lower perceptions of safety in our study. Additionally,
altruism predicted safety overall. Individuals who are altruistic tend to engage in pro-social
behavior such as donating blood, or other types of behaviors that benefit others at the cost of the
self (Otto & Bolle, 2011). Individuals who are more altruistic could potentially be more bold and
courageous since they are willing to help others while risking themselves, which could explain
having increased perceived safety.
Although the sample of this study was small, the question pertaining to policing on
campus grounds, students preferred a private police force, as that would allow for a closer
relationship and better supervision, however more research is needed to further consolidate this
claim. Surprisingly, the qualitative questions asking students to provide factors/things that make
them feel safe showed that police is not one of the primary factors. This could be explained by
recent controversial events regarding police forces in the United States. Thus, this study provided
some additional insight for future work focusing on policing on university grounds.
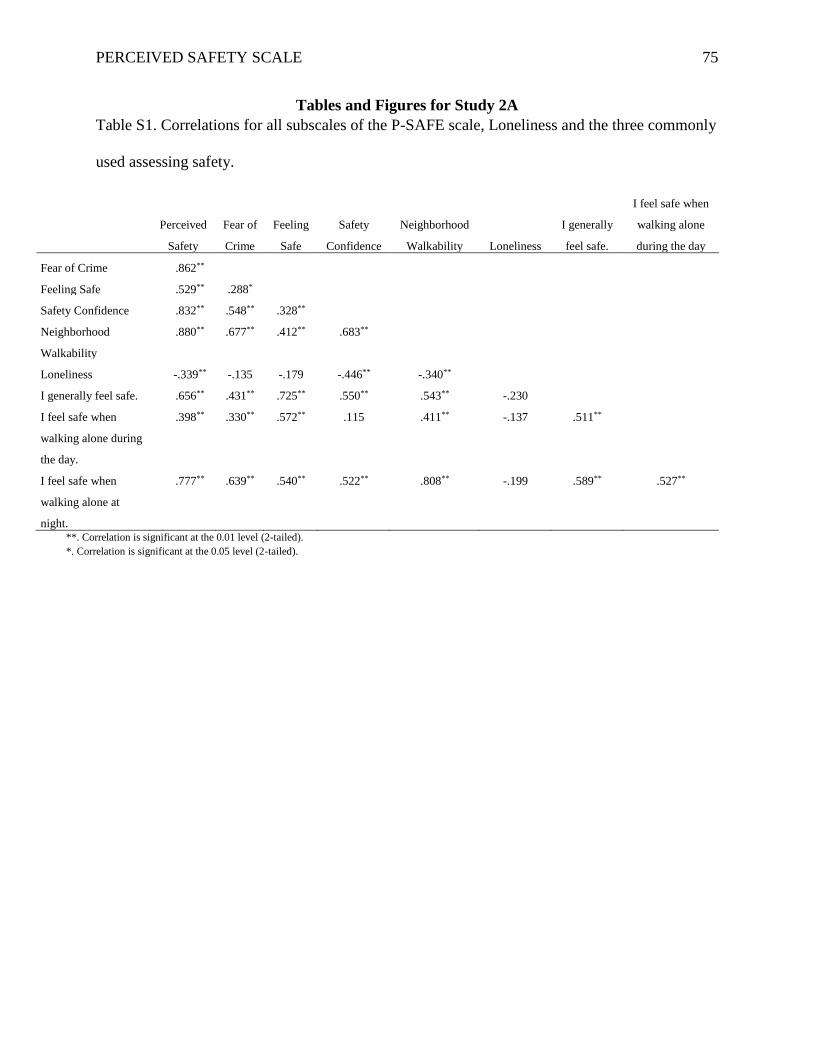
PERCEIVED SAFETY SCALE 75
Tables and Figures for Study 2A
Table S1. Correlations for all subscales of the P-SAFE scale, Loneliness and the three commonly
used assessing safety.
Perceived
Safety
Fear of
Crime
Feeling
Safe
Safety
Confidence
Neighborhood
Walkability Loneliness
I generally
feel safe.
I feel safe when
walking alone
during the day
Fear of Crime .862**
Feeling Safe .529** .288*
Safety Confidence .832** .548** .328**
Neighborhood
Walkability
.880** .677** .412** .683**
Loneliness -.339** -.135 -.179 -.446** -.340**
I generally feel safe. .656** .431** .725** .550** .543** -.230
I feel safe when
walking alone during
the day.
.398** .330** .572** .115 .411** -.137 .511**
I feel safe when
walking alone at
night.
.777** .639** .540** .522** .808** -.199 .589** .527**
**. Correlation is significant at the 0.01 level (2-tailed).
*. Correlation is significant at the 0.05 level (2-tailed).
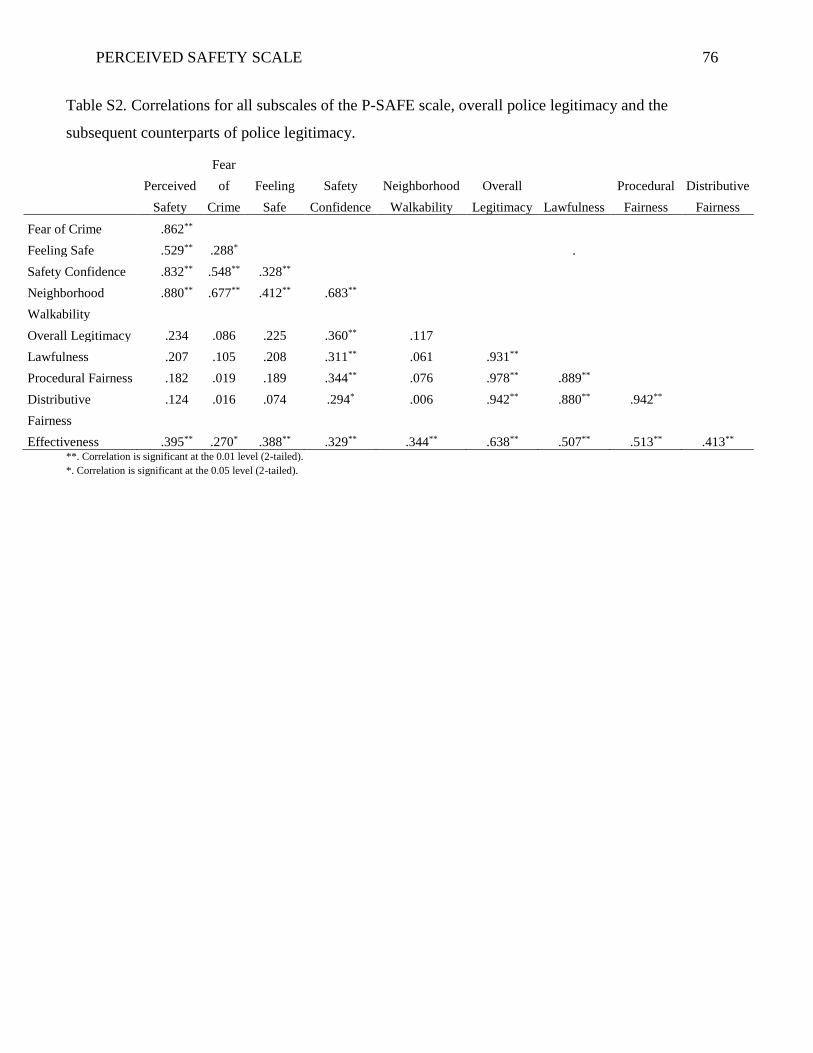
PERCEIVED SAFETY SCALE 76
Table S2. Correlations for all subscales of the P-SAFE scale, overall police legitimacy and the
subsequent counterparts of police legitimacy.
Perceived
Safety
Fear
of
Crime
Feeling
Safe
Safety
Confidence
Neighborhood
Walkability
Overall
Legitimacy Lawfulness
Procedural
Fairness
Distributive
Fairness
Fear of Crime .862**
Feeling Safe .529** .288* .
Safety Confidence .832** .548** .328**
Neighborhood
Walkability
.880** .677** .412** .683**
Overall Legitimacy .234 .086 .225 .360** .117
Lawfulness .207 .105 .208 .311** .061 .931**
Procedural Fairness .182 .019 .189 .344** .076 .978** .889**
Distributive
Fairness
.124 .016 .074 .294* .006 .942** .880** .942**
Effectiveness .395** .270* .388** .329** .344** .638** .507** .513** .413** **. Correlation is significant at the 0.01 level (2-tailed).
*. Correlation is significant at the 0.05 level (2-tailed).
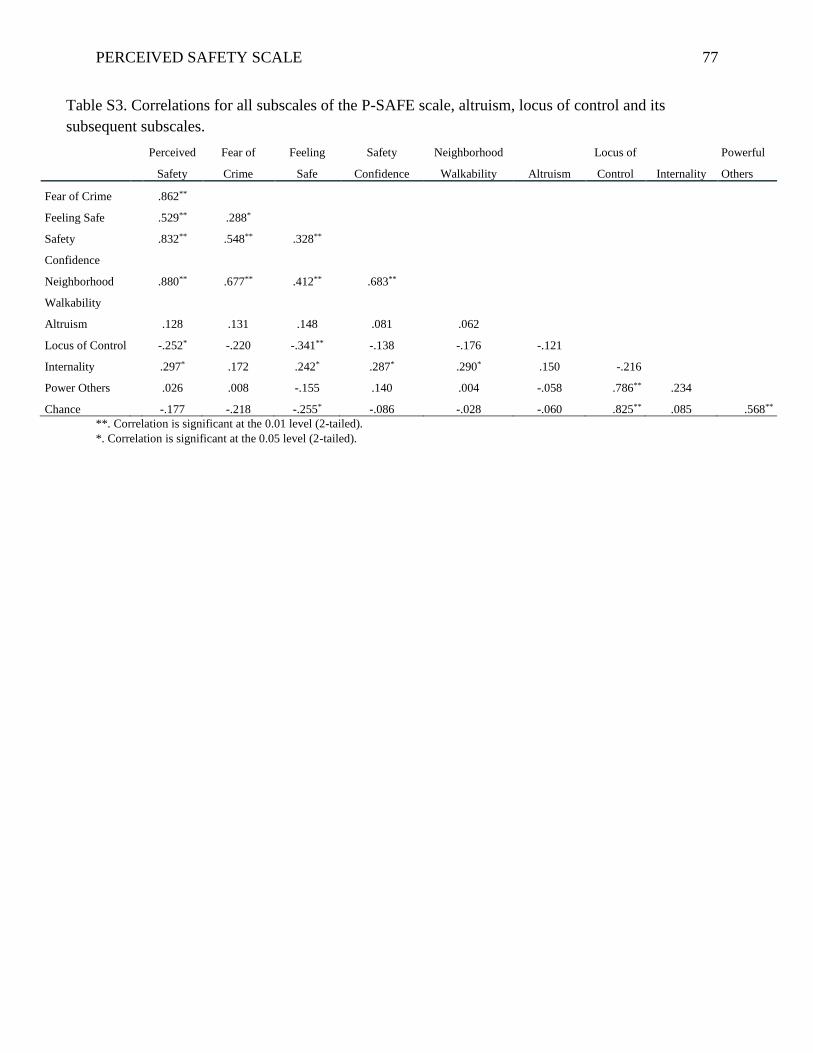
PERCEIVED SAFETY SCALE 77
Table S3. Correlations for all subscales of the P-SAFE scale, altruism, locus of control and its
subsequent subscales.
Perceived
Safety
Fear of
Crime
Feeling
Safe
Safety
Confidence
Neighborhood
Walkability Altruism
Locus of
Control Internality
Powerful
Others
Fear of Crime .862**
Feeling Safe .529** .288*
Safety
Confidence
.832** .548** .328**
Neighborhood
Walkability
.880** .677** .412** .683**
Altruism .128 .131 .148 .081 .062
Locus of Control -.252* -.220 -.341** -.138 -.176 -.121
Internality .297* .172 .242* .287* .290* .150 -.216
Power Others .026 .008 -.155 .140 .004 -.058 .786** .234
Chance -.177 -.218 -.255* -.086 -.028 -.060 .825** .085 .568**
**. Correlation is significant at the 0.01 level (2-tailed).
*. Correlation is significant at the 0.05 level (2-tailed).
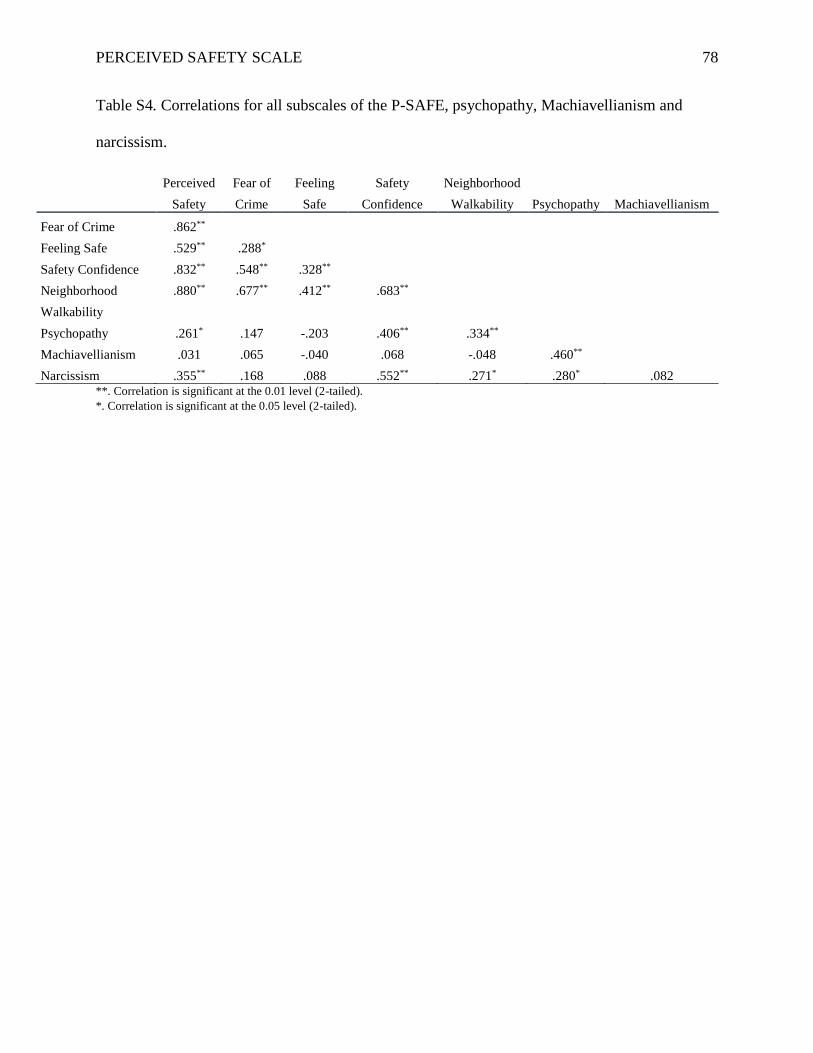
PERCEIVED SAFETY SCALE 78
Table S4. Correlations for all subscales of the P-SAFE, psychopathy, Machiavellianism and
narcissism.
Perceived
Safety
Fear of
Crime
Feeling
Safe
Safety
Confidence
Neighborhood
Walkability Psychopathy Machiavellianism
Fear of Crime .862**
Feeling Safe .529** .288*
Safety Confidence .832** .548** .328**
Neighborhood
Walkability
.880** .677** .412** .683**
Psychopathy .261* .147 -.203 .406** .334**
Machiavellianism .031 .065 -.040 .068 -.048 .460**
Narcissism .355** .168 .088 .552** .271* .280* .082 **. Correlation is significant at the 0.01 level (2-tailed).
*. Correlation is significant at the 0.05 level (2-tailed).
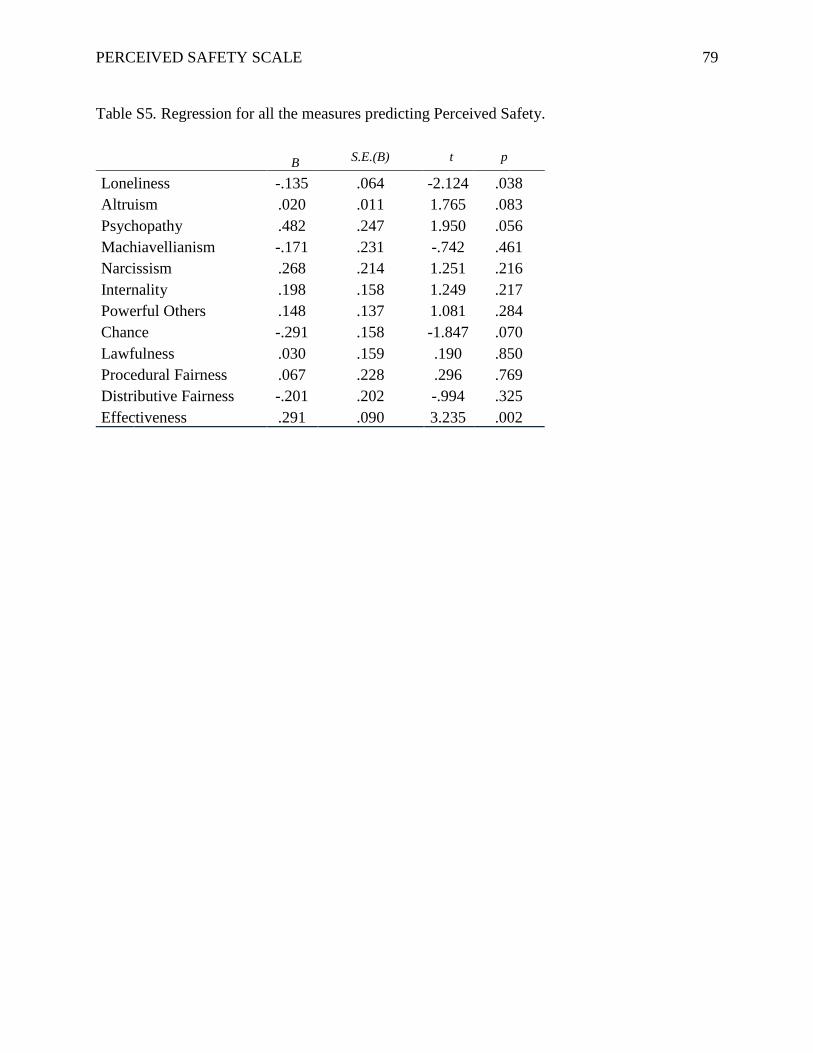
PERCEIVED SAFETY SCALE 79
Table S5. Regression for all the measures predicting Perceived Safety.
B S.E.(B) t p
Loneliness -.135 .064 -2.124 .038
Altruism .020 .011 1.765 .083
Psychopathy .482 .247 1.950 .056
Machiavellianism -.171 .231 -.742 .461
Narcissism .268 .214 1.251 .216
Internality .198 .158 1.249 .217
Powerful Others .148 .137 1.081 .284
Chance -.291 .158 -1.847 .070
Lawfulness .030 .159 .190 .850
Procedural Fairness .067 .228 .296 .769
Distributive Fairness -.201 .202 -.994 .325
Effectiveness .291 .090 3.235 .002
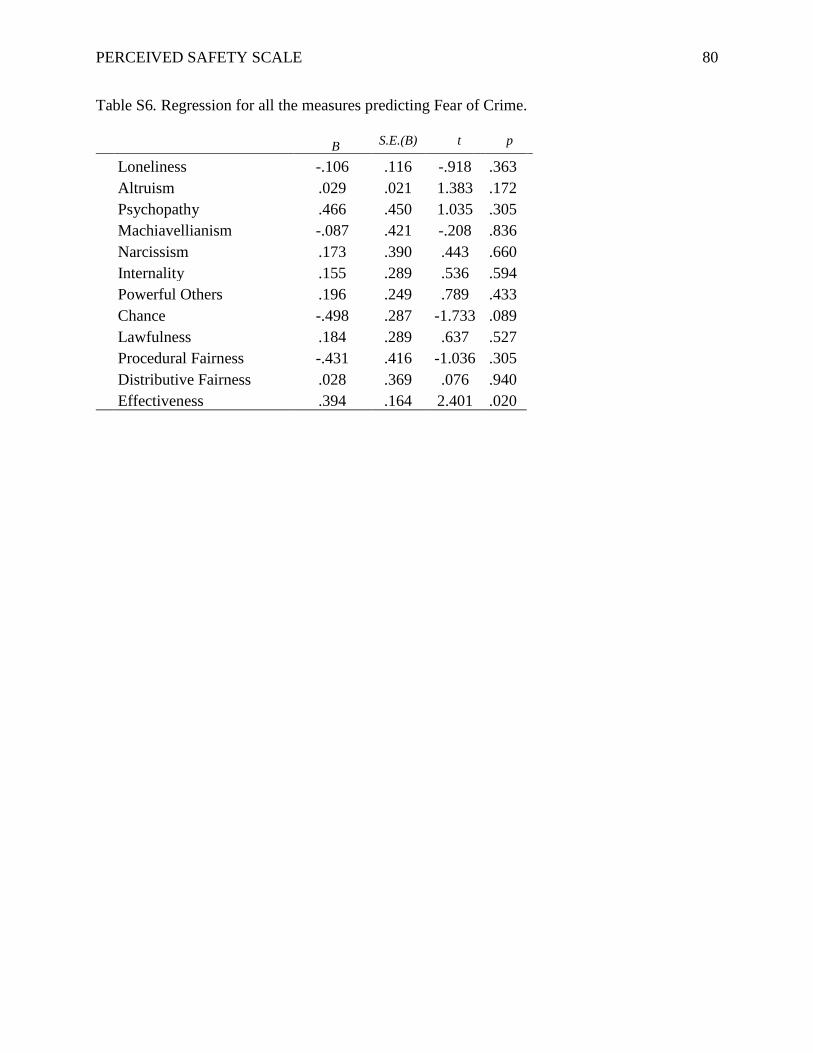
PERCEIVED SAFETY SCALE 80
Table S6. Regression for all the measures predicting Fear of Crime.
B S.E.(B) t p
Loneliness -.106 .116 -.918 .363
Altruism .029 .021 1.383 .172
Psychopathy .466 .450 1.035 .305
Machiavellianism -.087 .421 -.208 .836
Narcissism .173 .390 .443 .660
Internality .155 .289 .536 .594
Powerful Others .196 .249 .789 .433
Chance -.498 .287 -1.733 .089
Lawfulness .184 .289 .637 .527
Procedural Fairness -.431 .416 -1.036 .305
Distributive Fairness .028 .369 .076 .940
Effectiveness .394 .164 2.401 .020
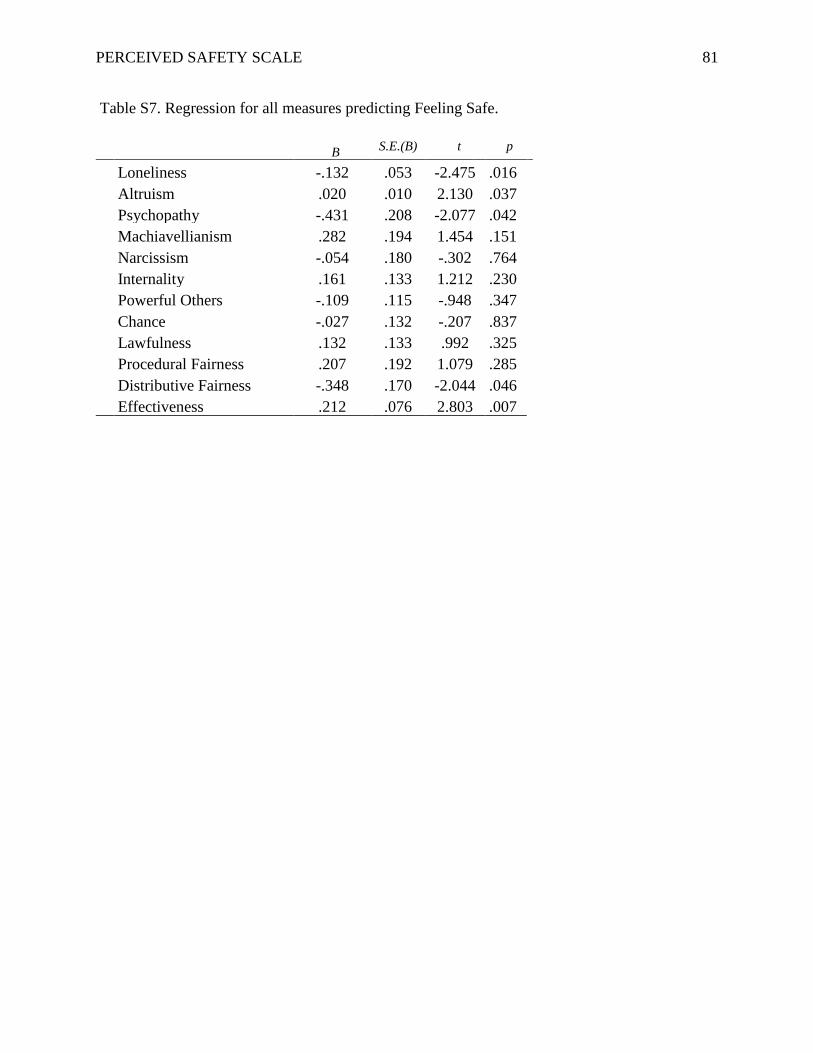
PERCEIVED SAFETY SCALE 81
Table S7. Regression for all measures predicting Feeling Safe.
B S.E.(B) t p
Loneliness -.132 .053 -2.475 .016
Altruism .020 .010 2.130 .037
Psychopathy -.431 .208 -2.077 .042
Machiavellianism .282 .194 1.454 .151
Narcissism -.054 .180 -.302 .764
Internality .161 .133 1.212 .230
Powerful Others -.109 .115 -.948 .347
Chance -.027 .132 -.207 .837
Lawfulness .132 .133 .992 .325
Procedural Fairness .207 .192 1.079 .285
Distributive Fairness -.348 .170 -2.044 .046
Effectiveness .212 .076 2.803 .007
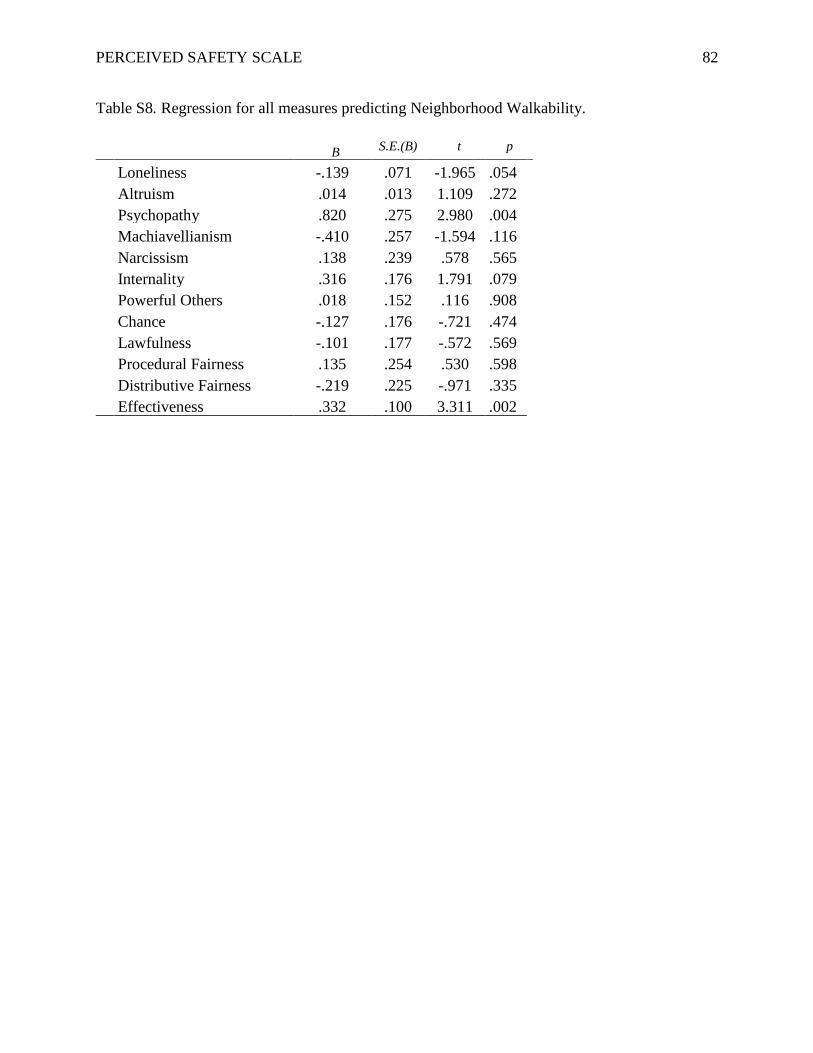
PERCEIVED SAFETY SCALE 82
Table S8. Regression for all measures predicting Neighborhood Walkability.
B S.E.(B) t p
Loneliness -.139 .071 -1.965 .054
Altruism .014 .013 1.109 .272
Psychopathy .820 .275 2.980 .004
Machiavellianism -.410 .257 -1.594 .116
Narcissism .138 .239 .578 .565
Internality .316 .176 1.791 .079
Powerful Others .018 .152 .116 .908
Chance -.127 .176 -.721 .474
Lawfulness -.101 .177 -.572 .569
Procedural Fairness .135 .254 .530 .598
Distributive Fairness -.219 .225 -.971 .335
Effectiveness .332 .100 3.311 .002
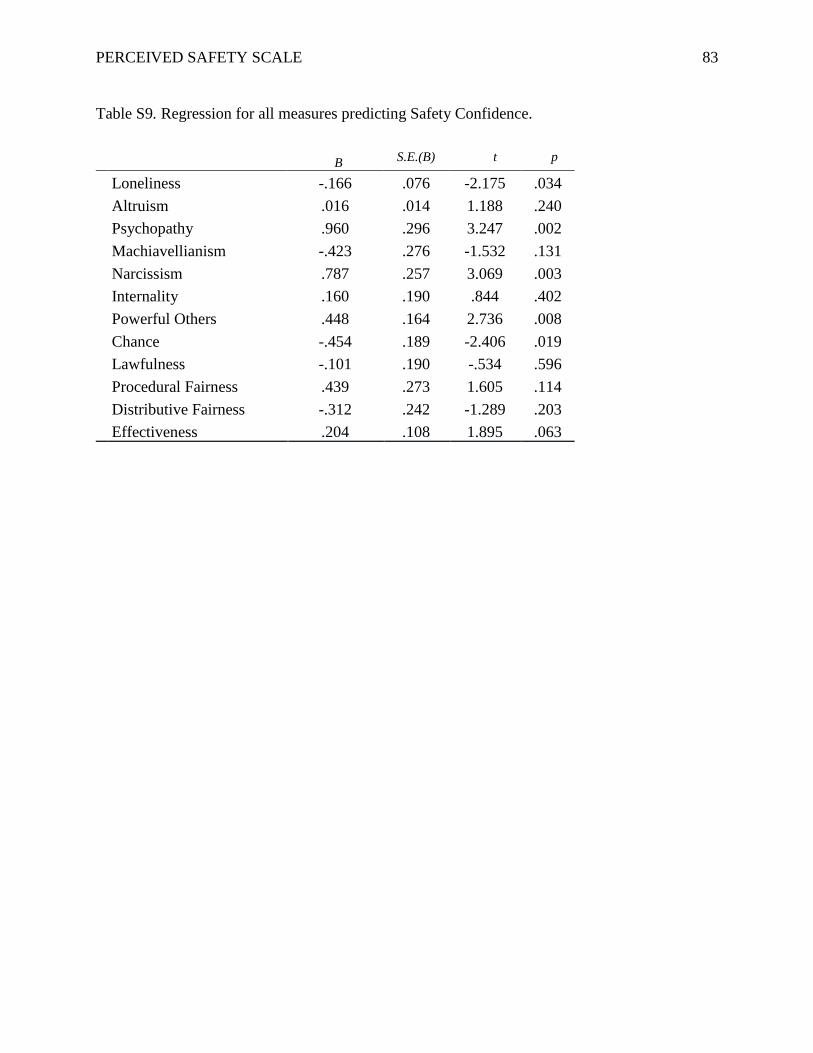
PERCEIVED SAFETY SCALE 83
Table S9. Regression for all measures predicting Safety Confidence.
B S.E.(B) t p
Loneliness -.166 .076 -2.175 .034
Altruism .016 .014 1.188 .240
Psychopathy .960 .296 3.247 .002
Machiavellianism -.423 .276 -1.532 .131
Narcissism .787 .257 3.069 .003
Internality .160 .190 .844 .402
Powerful Others .448 .164 2.736 .008
Chance -.454 .189 -2.406 .019
Lawfulness -.101 .190 -.534 .596
Procedural Fairness .439 .273 1.605 .114
Distributive Fairness -.312 .242 -1.289 .203
Effectiveness .204 .108 1.895 .063
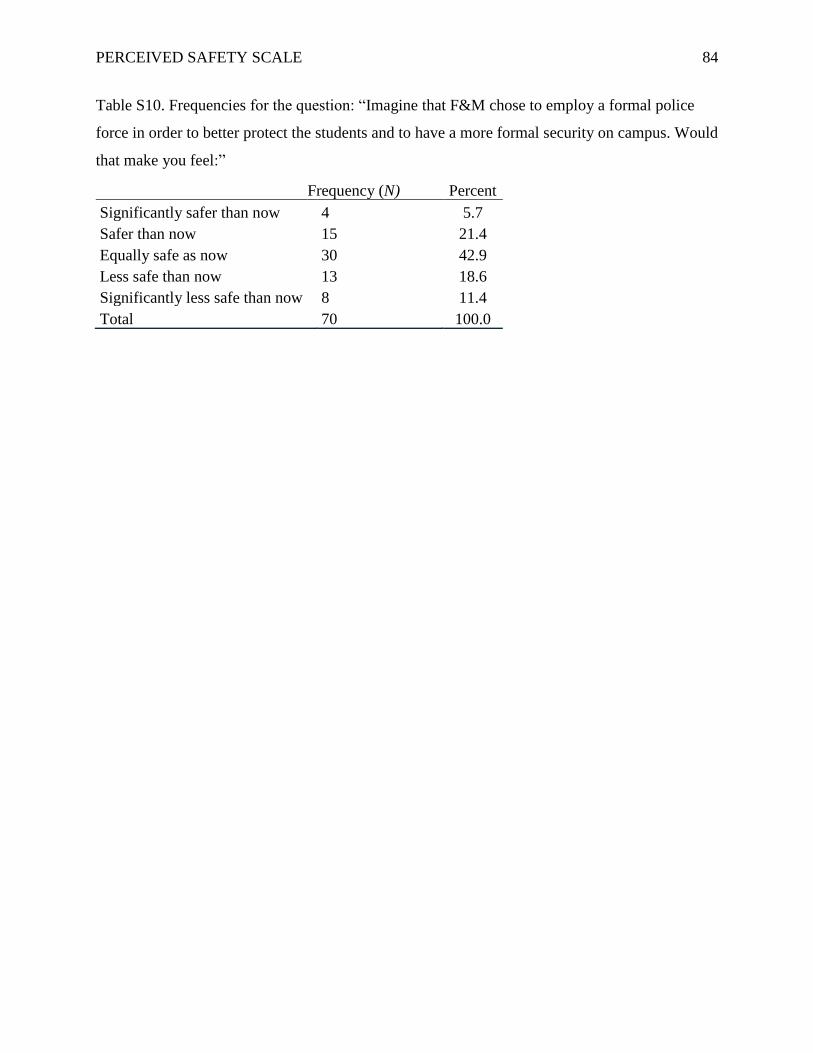
PERCEIVED SAFETY SCALE 84
Table S10. Frequencies for the question: “Imagine that F&M chose to employ a formal police
force in order to better protect the students and to have a more formal security on campus. Would
that make you feel:”
Frequency (N) Percent
Significantly safer than now 4 5.7
Safer than now 15 21.4
Equally safe as now 30 42.9
Less safe than now 13 18.6
Significantly less safe than now 8 11.4
Total 70 100.0
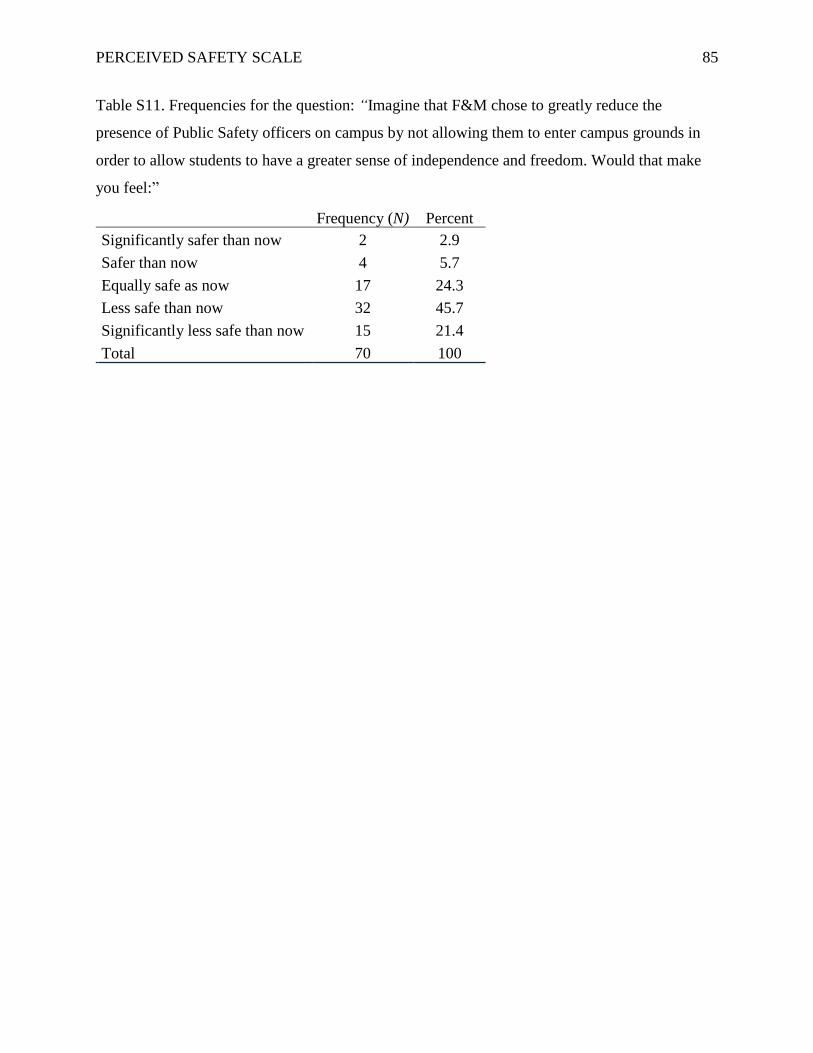
PERCEIVED SAFETY SCALE 85
Table S11. Frequencies for the question: “Imagine that F&M chose to greatly reduce the
presence of Public Safety officers on campus by not allowing them to enter campus grounds in
order to allow students to have a greater sense of independence and freedom. Would that make
you feel:”
Frequency (N) Percent
Significantly safer than now 2 2.9
Safer than now 4 5.7
Equally safe as now 17 24.3
Less safe than now 32 45.7
Significantly less safe than now 15 21.4
Total 70 100
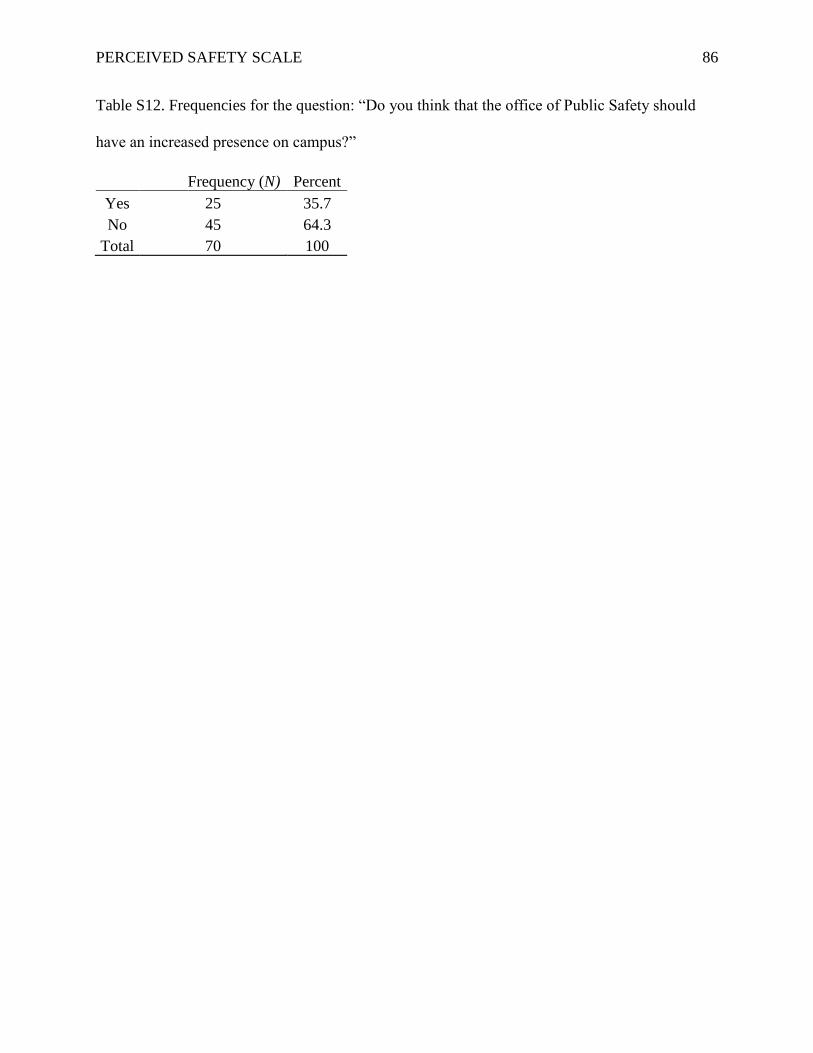
PERCEIVED SAFETY SCALE 86
Table S12. Frequencies for the question: “Do you think that the office of Public Safety should
have an increased presence on campus?”
Frequency (N) Percent
Yes 25 35.7
No 45 64.3
Total 70 100
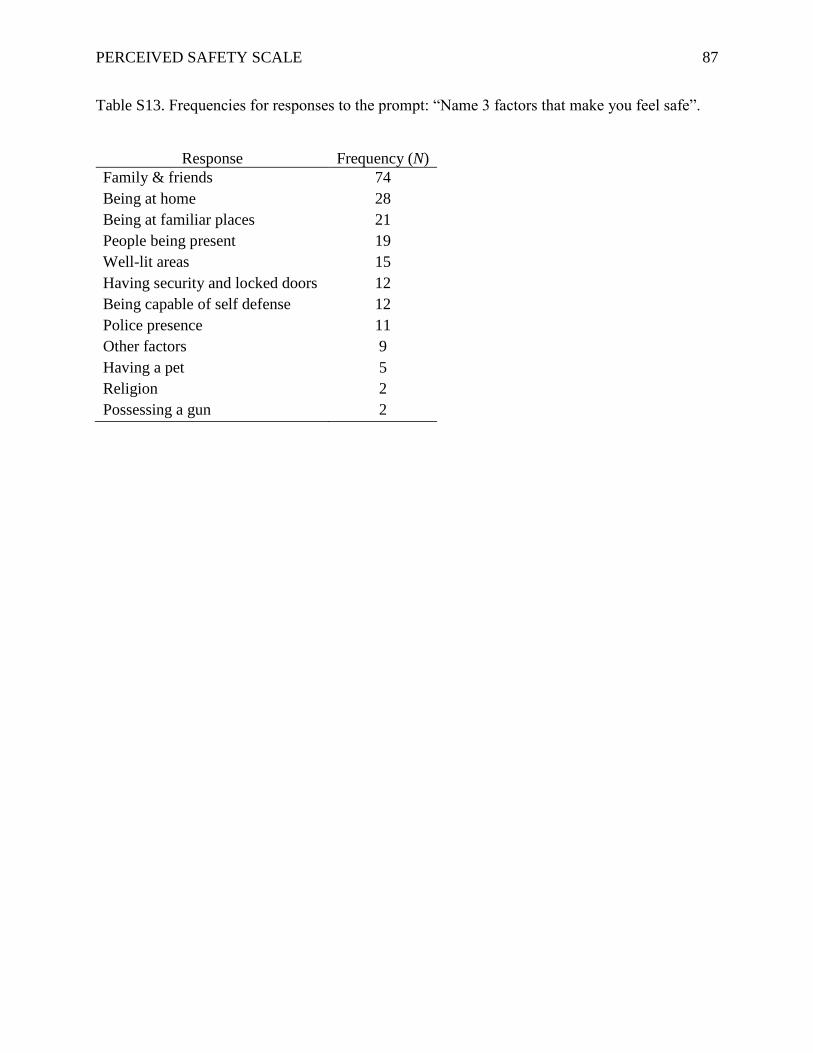
PERCEIVED SAFETY SCALE 87
Table S13. Frequencies for responses to the prompt: “Name 3 factors that make you feel safe”.
Response Frequency (N)
Family & friends 74
Being at home 28
Being at familiar places 21
People being present 19
Well-lit areas 15
Having security and locked doors 12
Being capable of self defense 12
Police presence 11
Other factors 9
Having a pet 5
Religion 2
Possessing a gun 2
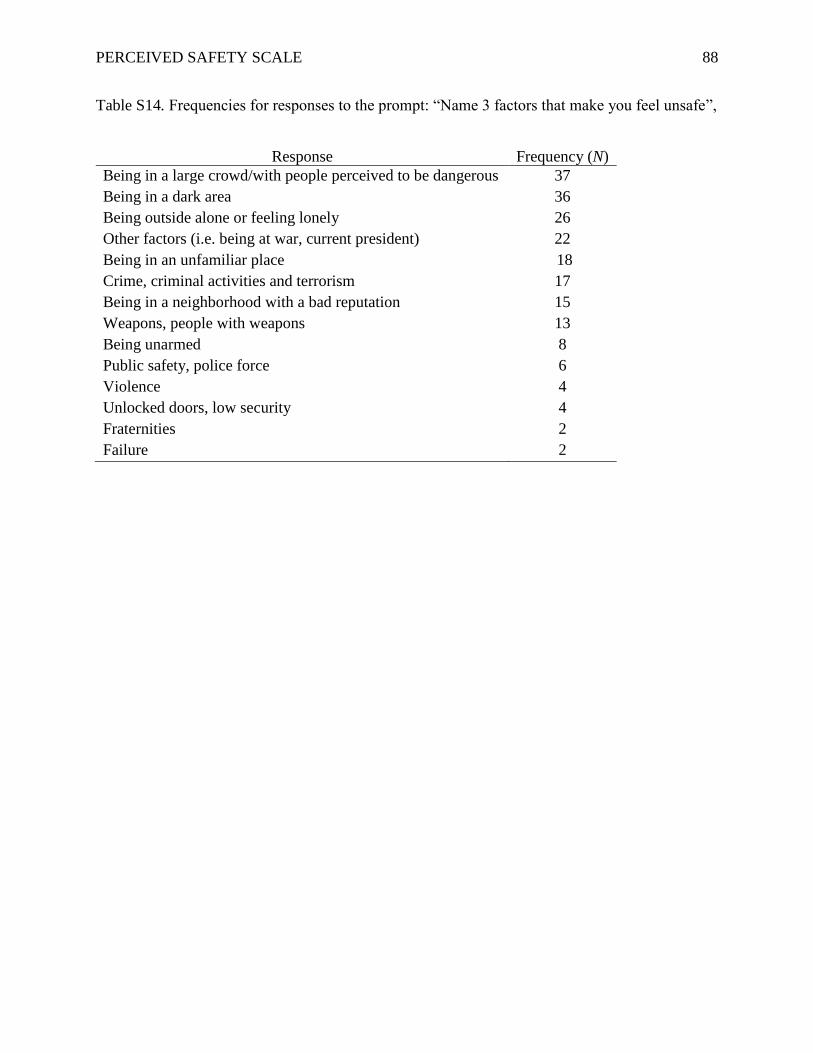
PERCEIVED SAFETY SCALE 88
Table S14. Frequencies for responses to the prompt: “Name 3 factors that make you feel unsafe”,
Response Frequency (N)
Being in a large crowd/with people perceived to be dangerous 37
Being in a dark area 36
Being outside alone or feeling lonely 26
Other factors (i.e. being at war, current president) 22
Being in an unfamiliar place 18
Crime, criminal activities and terrorism 17
Being in a neighborhood with a bad reputation 15
Weapons, people with weapons 13
Being unarmed 8
Public safety, police force 6
Violence 4
Unlocked doors, low security 4
Fraternities 2
Failure 2
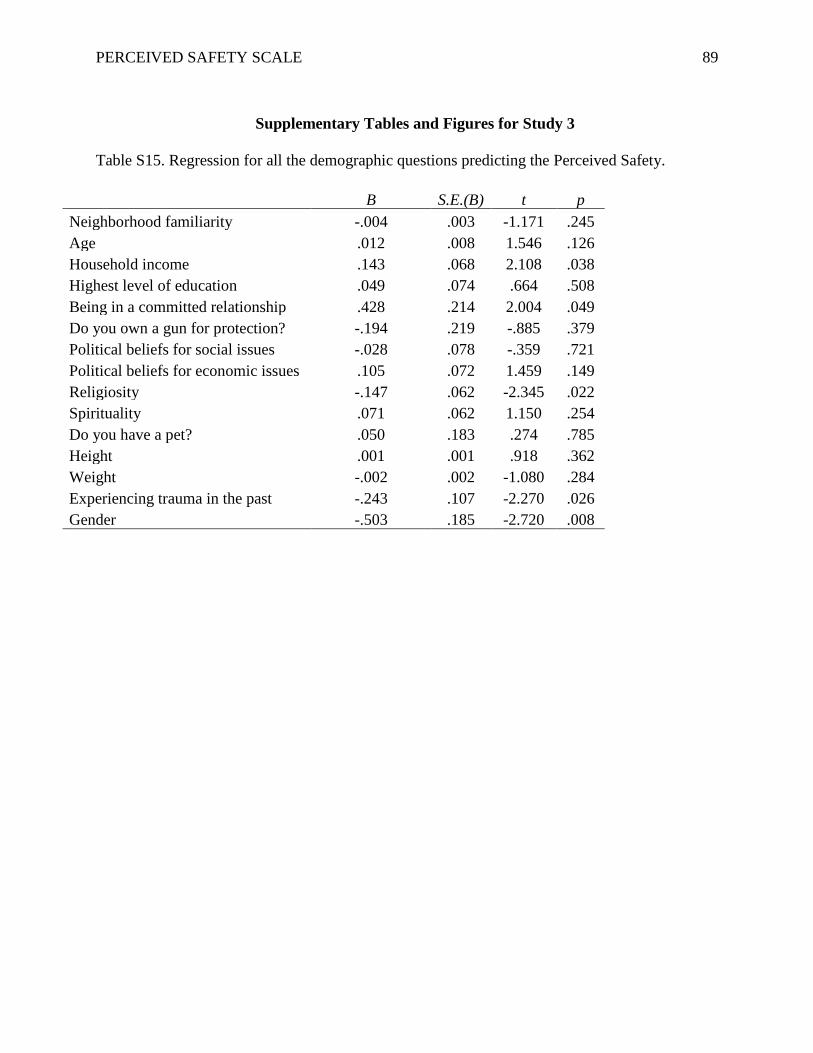
PERCEIVED SAFETY SCALE 89
Supplementary Tables and Figures for Study 3
Table S15. Regression for all the demographic questions predicting the Perceived Safety.
B S.E.(B) t p
Neighborhood familiarity -.004 .003 -1.171 .245
Age .012 .008 1.546 .126
Household income .143 .068 2.108 .038
Highest level of education .049 .074 .664 .508
Being in a committed relationship .428 .214 2.004 .049
Do you own a gun for protection? -.194 .219 -.885 .379
Political beliefs for social issues -.028 .078 -.359 .721
Political beliefs for economic issues .105 .072 1.459 .149
Religiosity -.147 .062 -2.345 .022
Spirituality .071 .062 1.150 .254
Do you have a pet? .050 .183 .274 .785
Height .001 .001 .918 .362
Weight -.002 .002 -1.080 .284
Experiencing trauma in the past -.243 .107 -2.270 .026
Gender -.503 .185 -2.720 .008
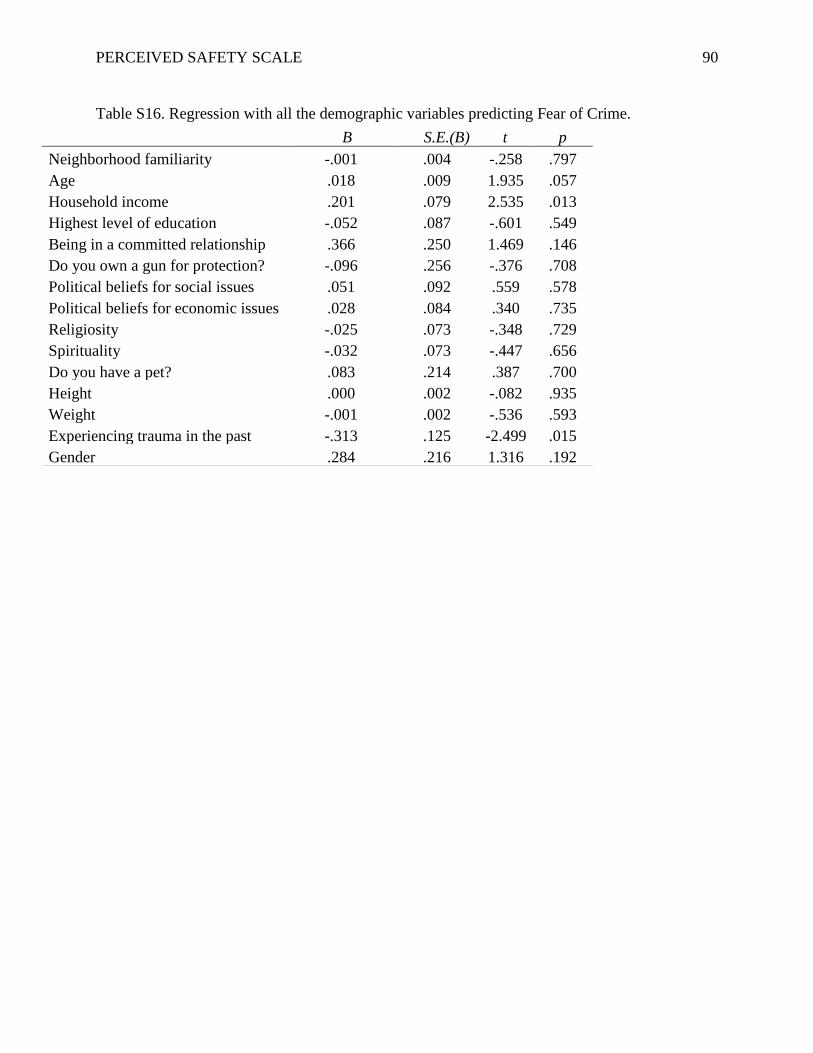
PERCEIVED SAFETY SCALE 90
Table S16. Regression with all the demographic variables predicting Fear of Crime.
B S.E.(B) t p
Neighborhood familiarity -.001 .004 -.258 .797
Age .018 .009 1.935 .057
Household income .201 .079 2.535 .013
Highest level of education -.052 .087 -.601 .549
Being in a committed relationship .366 .250 1.469 .146
Do you own a gun for protection? -.096 .256 -.376 .708
Political beliefs for social issues .051 .092 .559 .578
Political beliefs for economic issues .028 .084 .340 .735
Religiosity -.025 .073 -.348 .729
Spirituality -.032 .073 -.447 .656
Do you have a pet? .083 .214 .387 .700
Height .000 .002 -.082 .935
Weight -.001 .002 -.536 .593
Experiencing trauma in the past -.313 .125 -2.499 .015
Gender .284 .216 1.316 .192
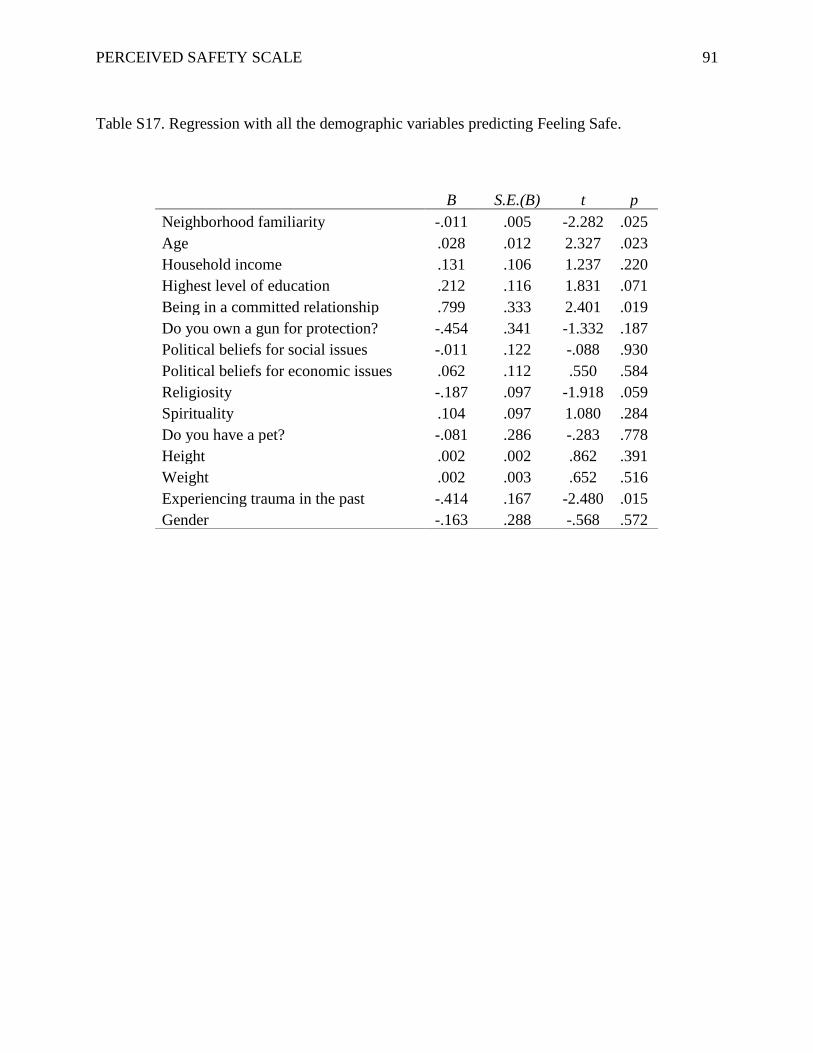
PERCEIVED SAFETY SCALE 91
Table S17. Regression with all the demographic variables predicting Feeling Safe.
B S.E.(B) t p
Neighborhood familiarity -.011 .005 -2.282 .025
Age .028 .012 2.327 .023
Household income .131 .106 1.237 .220
Highest level of education .212 .116 1.831 .071
Being in a committed relationship .799 .333 2.401 .019
Do you own a gun for protection? -.454 .341 -1.332 .187
Political beliefs for social issues -.011 .122 -.088 .930
Political beliefs for economic issues .062 .112 .550 .584
Religiosity -.187 .097 -1.918 .059
Spirituality .104 .097 1.080 .284
Do you have a pet? -.081 .286 -.283 .778
Height .002 .002 .862 .391
Weight .002 .003 .652 .516
Experiencing trauma in the past -.414 .167 -2.480 .015
Gender -.163 .288 -.568 .572
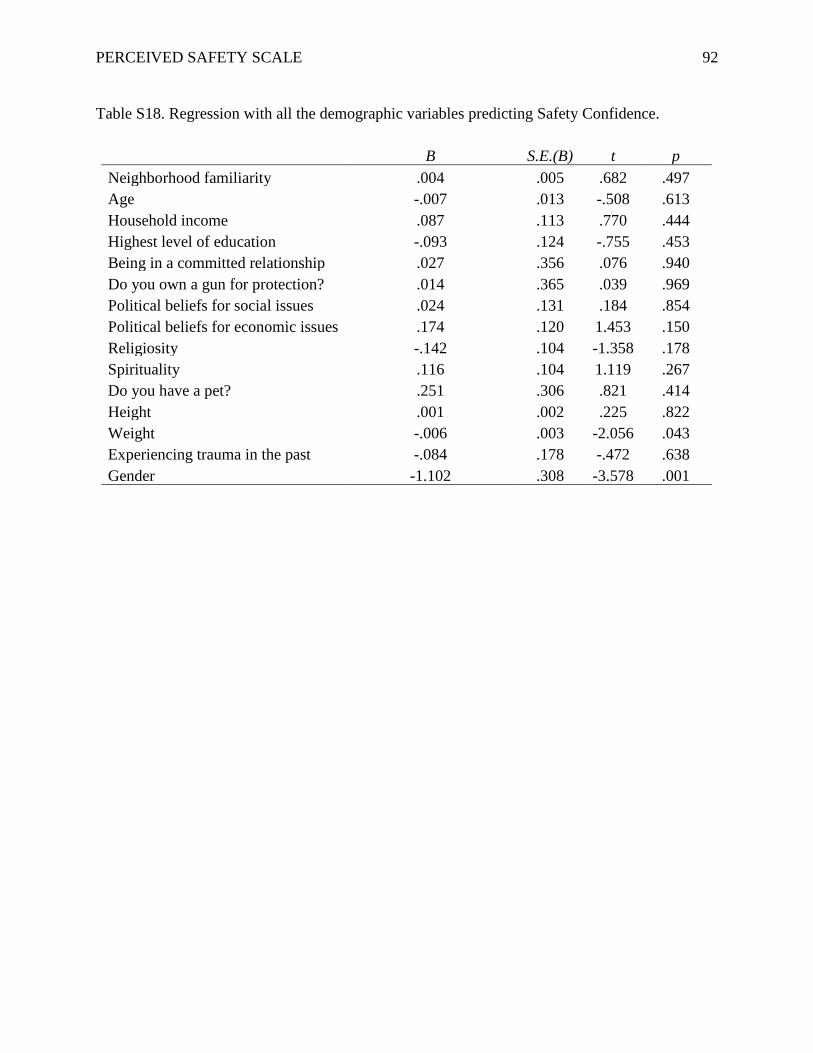
PERCEIVED SAFETY SCALE 92
Table S18. Regression with all the demographic variables predicting Safety Confidence.
B S.E.(B) t p
Neighborhood familiarity .004 .005 .682 .497
Age -.007 .013 -.508 .613
Household income .087 .113 .770 .444
Highest level of education -.093 .124 -.755 .453
Being in a committed relationship .027 .356 .076 .940
Do you own a gun for protection? .014 .365 .039 .969
Political beliefs for social issues .024 .131 .184 .854
Political beliefs for economic issues .174 .120 1.453 .150
Religiosity -.142 .104 -1.358 .178
Spirituality .116 .104 1.119 .267
Do you have a pet? .251 .306 .821 .414
Height .001 .002 .225 .822
Weight -.006 .003 -2.056 .043
Experiencing trauma in the past -.084 .178 -.472 .638
Gender -1.102 .308 -3.578 .001
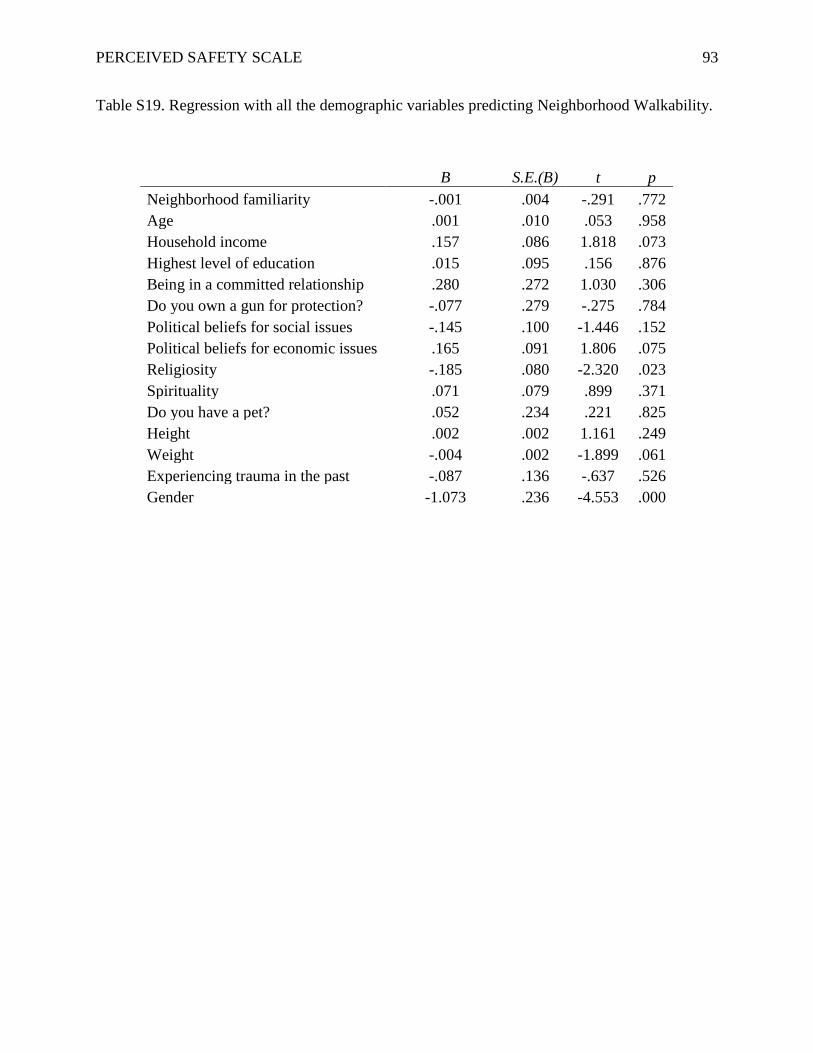
PERCEIVED SAFETY SCALE 93
Table S19. Regression with all the demographic variables predicting Neighborhood Walkability.
B S.E.(B) t p
Neighborhood familiarity -.001 .004 -.291 .772
Age .001 .010 .053 .958
Household income .157 .086 1.818 .073
Highest level of education .015 .095 .156 .876
Being in a committed relationship .280 .272 1.030 .306
Do you own a gun for protection? -.077 .279 -.275 .784
Political beliefs for social issues -.145 .100 -1.446 .152
Political beliefs for economic issues .165 .091 1.806 .075
Religiosity -.185 .080 -2.320 .023
Spirituality .071 .079 .899 .371
Do you have a pet? .052 .234 .221 .825
Height .002 .002 1.161 .249
Weight -.004 .002 -1.899 .061
Experiencing trauma in the past -.087 .136 -.637 .526
Gender -1.073 .236 -4.553 .000
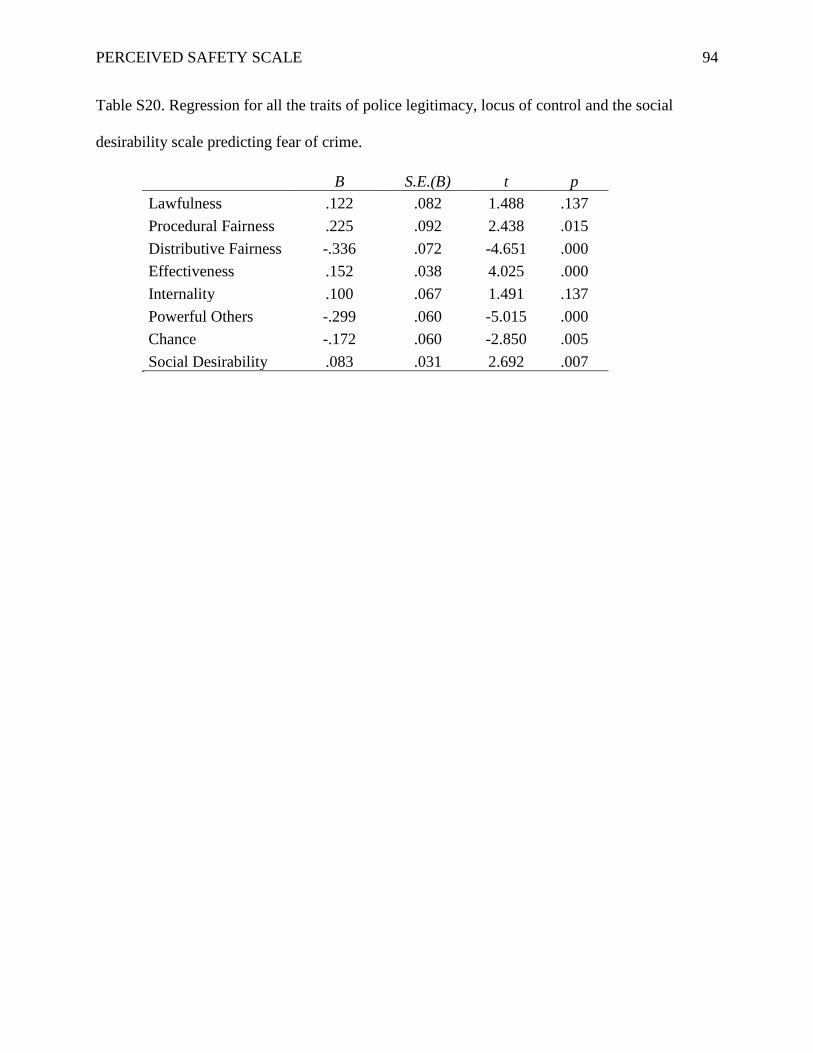
PERCEIVED SAFETY SCALE 94
Table S20. Regression for all the traits of police legitimacy, locus of control and the social
desirability scale predicting fear of crime.
B S.E.(B) t p
Lawfulness .122 .082 1.488 .137
Procedural Fairness .225 .092 2.438 .015
Distributive Fairness -.336 .072 -4.651 .000
Effectiveness .152 .038 4.025 .000
Internality .100 .067 1.491 .137
Powerful Others -.299 .060 -5.015 .000
Chance -.172 .060 -2.850 .005
Social Desirability .083 .031 2.692 .007
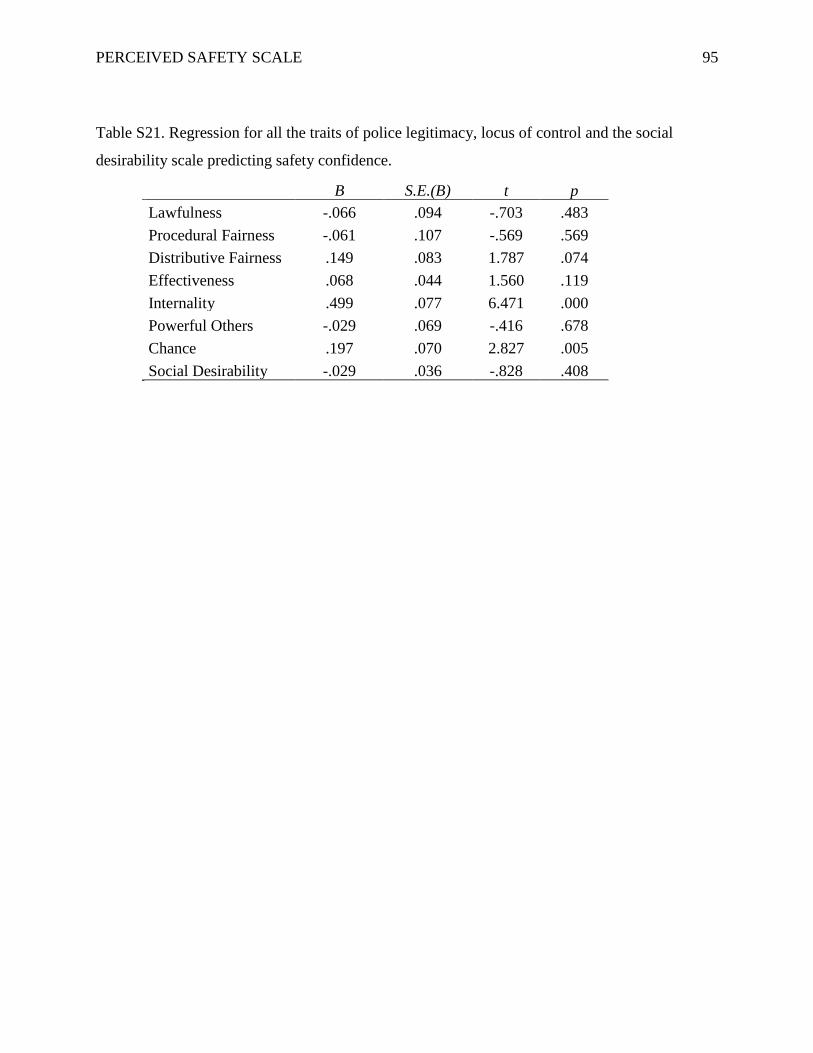
PERCEIVED SAFETY SCALE 95
Table S21. Regression for all the traits of police legitimacy, locus of control and the social
desirability scale predicting safety confidence.
B S.E.(B) t p
Lawfulness -.066 .094 -.703 .483
Procedural Fairness -.061 .107 -.569 .569
Distributive Fairness .149 .083 1.787 .074
Effectiveness .068 .044 1.560 .119
Internality .499 .077 6.471 .000
Powerful Others -.029 .069 -.416 .678
Chance .197 .070 2.827 .005
Social Desirability -.029 .036 -.828 .408
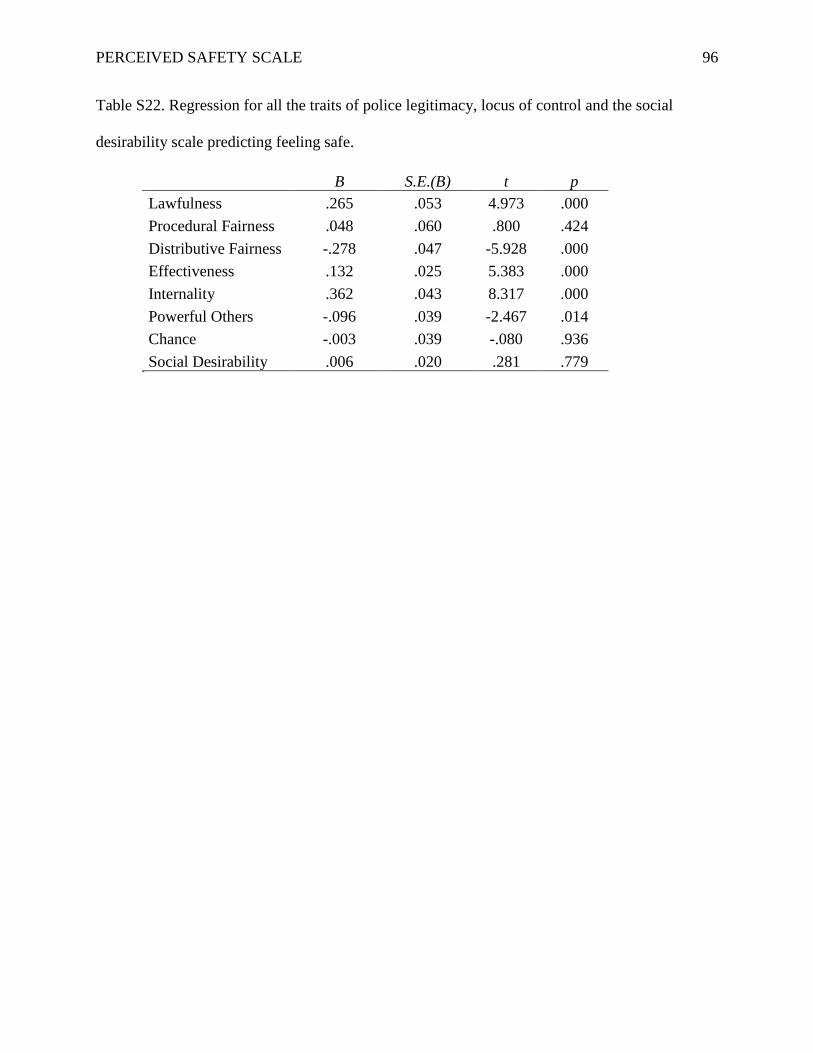
PERCEIVED SAFETY SCALE 96
Table S22. Regression for all the traits of police legitimacy, locus of control and the social
desirability scale predicting feeling safe.
B S.E.(B) t p
Lawfulness .265 .053 4.973 .000
Procedural Fairness .048 .060 .800 .424
Distributive Fairness -.278 .047 -5.928 .000
Effectiveness .132 .025 5.383 .000
Internality .362 .043 8.317 .000
Powerful Others -.096 .039 -2.467 .014
Chance -.003 .039 -.080 .936
Social Desirability .006 .020 .281 .779
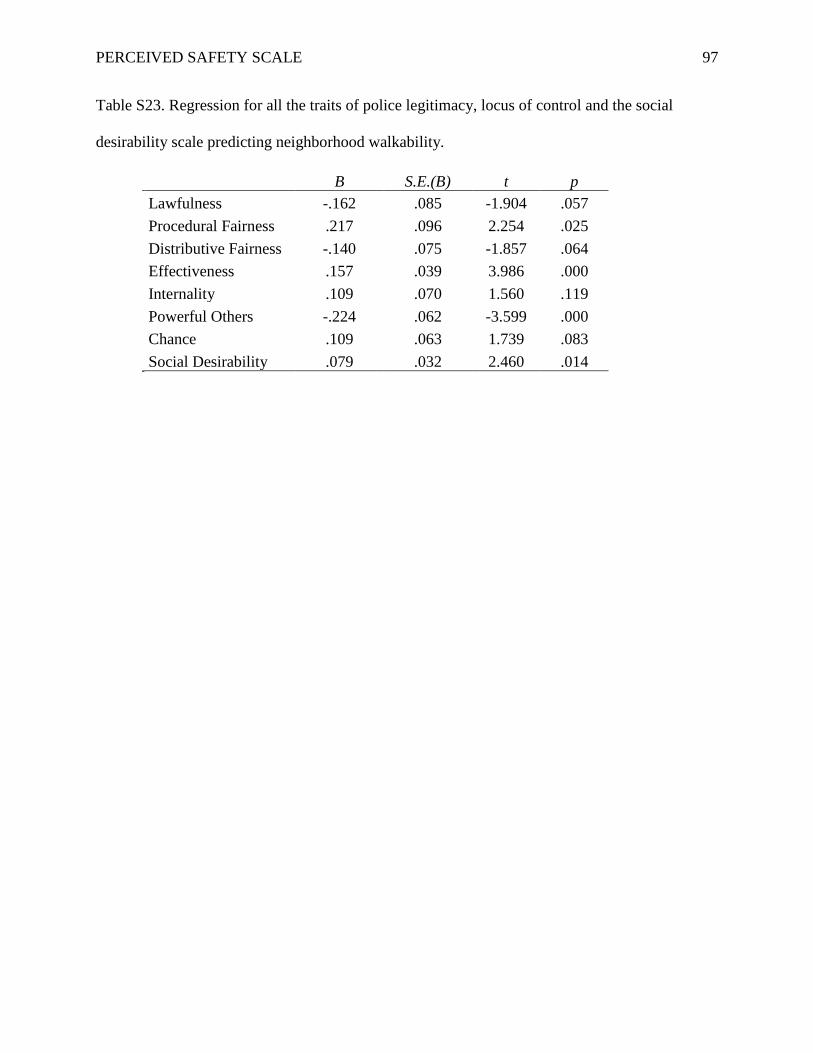
PERCEIVED SAFETY SCALE 97
Table S23. Regression for all the traits of police legitimacy, locus of control and the social
desirability scale predicting neighborhood walkability.
B S.E.(B) t p
Lawfulness -.162 .085 -1.904 .057
Procedural Fairness .217 .096 2.254 .025
Distributive Fairness -.140 .075 -1.857 .064
Effectiveness .157 .039 3.986 .000
Internality .109 .070 1.560 .119
Powerful Others -.224 .062 -3.599 .000
Chance .109 .063 1.739 .083
Social Desirability .079 .032 2.460 .014
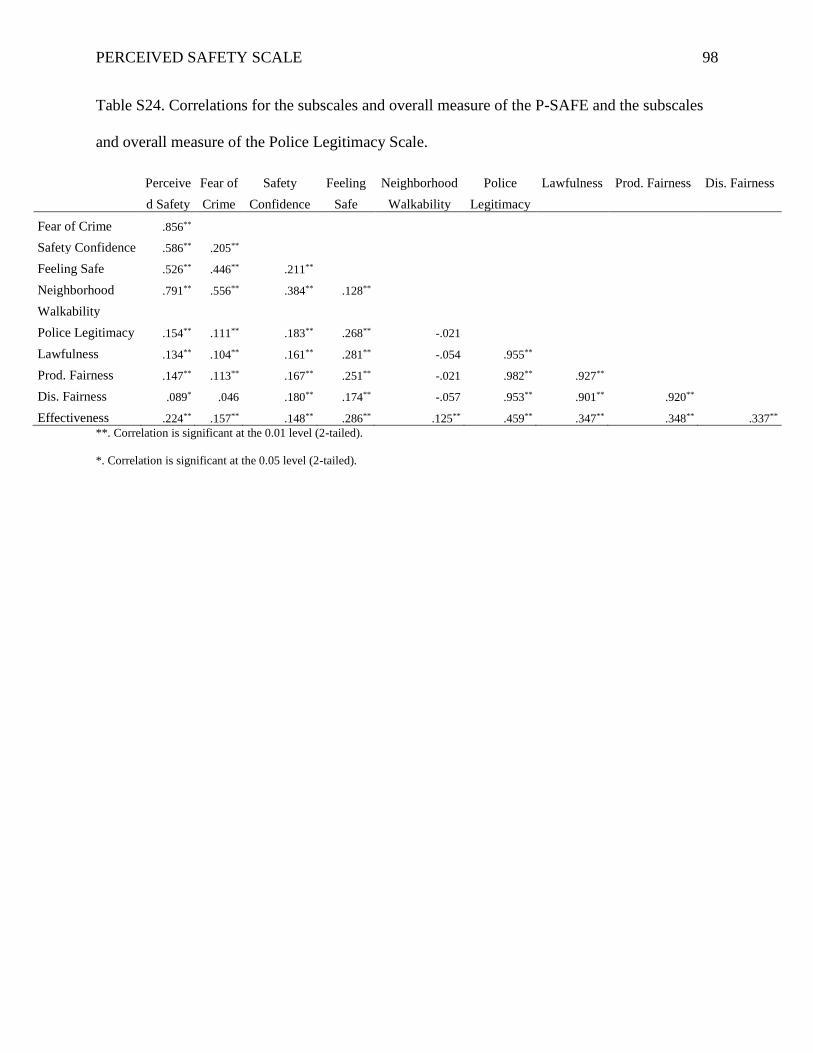
PERCEIVED SAFETY SCALE 98
Table S24. Correlations for the subscales and overall measure of the P-SAFE and the subscales
and overall measure of the Police Legitimacy Scale.
Perceive
d Safety
Fear of
Crime
Safety
Confidence
Feeling
Safe
Neighborhood
Walkability
Police
Legitimacy
Lawfulness Prod. Fairness Dis. Fairness
Fear of Crime .856**
Safety Confidence .586** .205**
Feeling Safe .526** .446** .211**
Neighborhood
Walkability
.791** .556** .384** .128**
Police Legitimacy .154** .111** .183** .268** -.021
Lawfulness .134** .104** .161** .281** -.054 .955**
Prod. Fairness .147** .113** .167** .251** -.021 .982** .927**
Dis. Fairness .089* .046 .180** .174** -.057 .953** .901** .920**
Effectiveness .224** .157** .148** .286** .125** .459** .347** .348** .337**
**. Correlation is significant at the 0.01 level (2-tailed).
*. Correlation is significant at the 0.05 level (2-tailed).
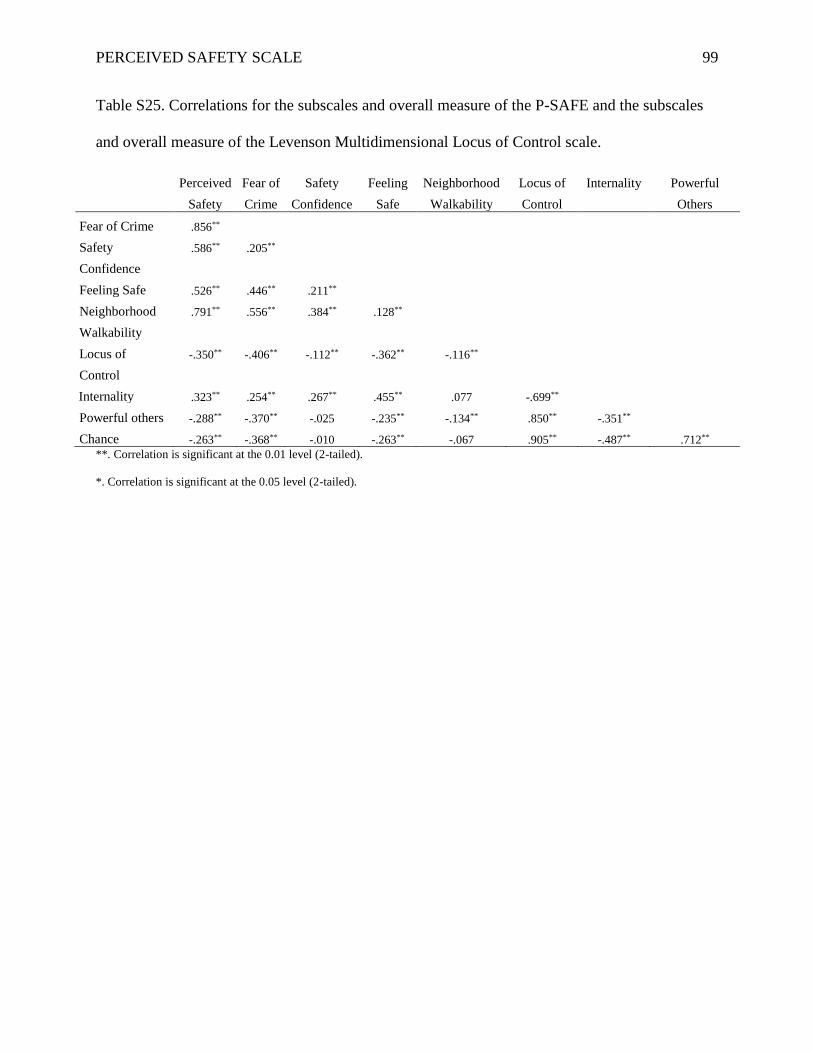
PERCEIVED SAFETY SCALE 99
Table S25. Correlations for the subscales and overall measure of the P-SAFE and the subscales
and overall measure of the Levenson Multidimensional Locus of Control scale.
Perceived
Safety
Fear of
Crime
Safety
Confidence
Feeling
Safe
Neighborhood
Walkability
Locus of
Control
Internality Powerful
Others
Fear of Crime .856**
Safety
Confidence
.586** .205**
Feeling Safe .526** .446** .211**
Neighborhood
Walkability
.791** .556** .384** .128**
Locus of
Control
-.350** -.406** -.112** -.362** -.116**
Internality .323** .254** .267** .455** .077 -.699**
Powerful others -.288** -.370** -.025 -.235** -.134** .850** -.351**
Chance -.263** -.368** -.010 -.263** -.067 .905** -.487** .712**
**. Correlation is significant at the 0.01 level (2-tailed).
*. Correlation is significant at the 0.05 level (2-tailed).