Embed Size (px)
Citation preview
The CRASH scoreThe CRASH scoreThe CRASH score The CRASH score (Chemotherapy Risk (Chemotherapy Risk Assessment Scale for HighAssessment Scale for HighAssessment Scale for HighAssessment Scale for High--Age Patients): Design and Age Patients): Design and ValidationValidation
Martine Martine ExtermannExtermann, , IvetteIvette BolerBoler, Richard Reich, Gary , Richard Reich, Gary Lyman, Richard Brown, Joseph Lyman, Richard Brown, Joseph DeFeliceDeFelice, Richard , Richard Levine, Eric Levine, Eric LubinerLubiner, Pablo Reyes, Frederic Schreiber., Pablo Reyes, Frederic Schreiber.Moffitt Cancer Center, Tampa, FL, Duke University, Moffitt Cancer Center, Tampa, FL, Duke University, Durham, NC, Moffitt Research Network, FL.Durham, NC, Moffitt Research Network, FL.
This study was supported by Grant ACS-RSG-03-151-01-CCE
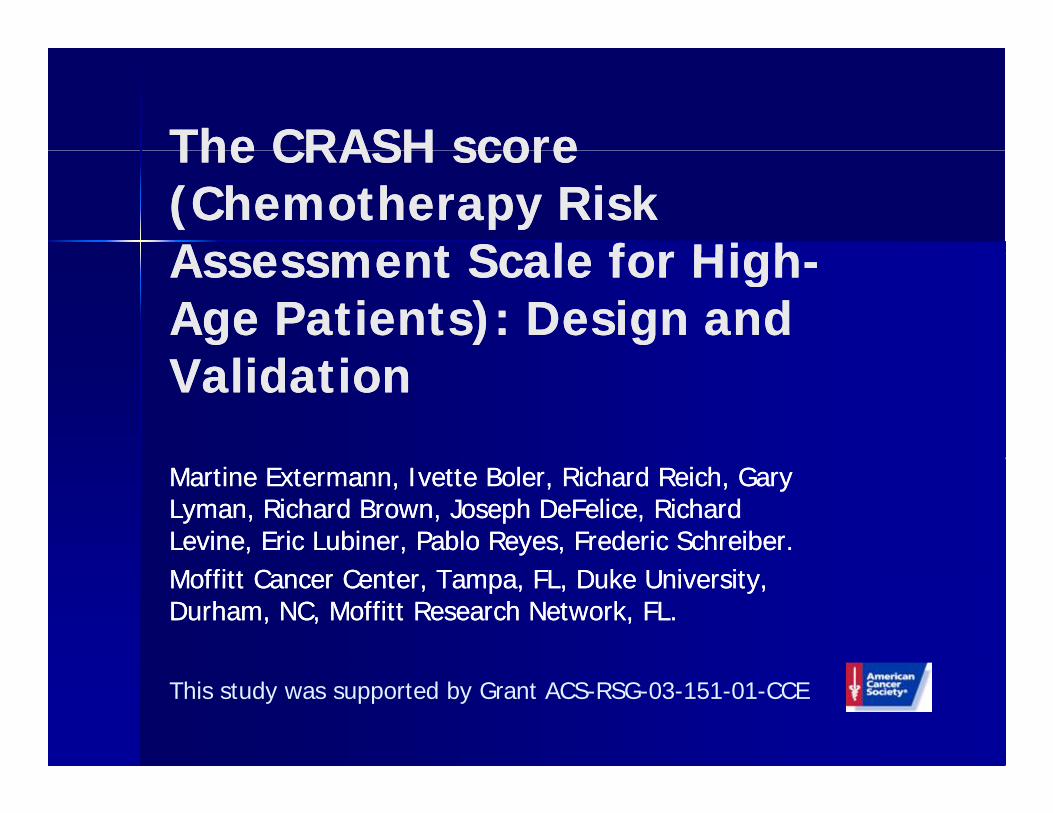
Project frameworkProject frameworkProject frameworkProject framework
Individual risk
h h kChemotherapy toxicity
Patient risk factors
The CRASH score
MAX2 index This project
Extermann et al., EJC 2002, 2004
The MAX2 indexThe MAX2 indexThe MAX2 indexThe MAX2 index
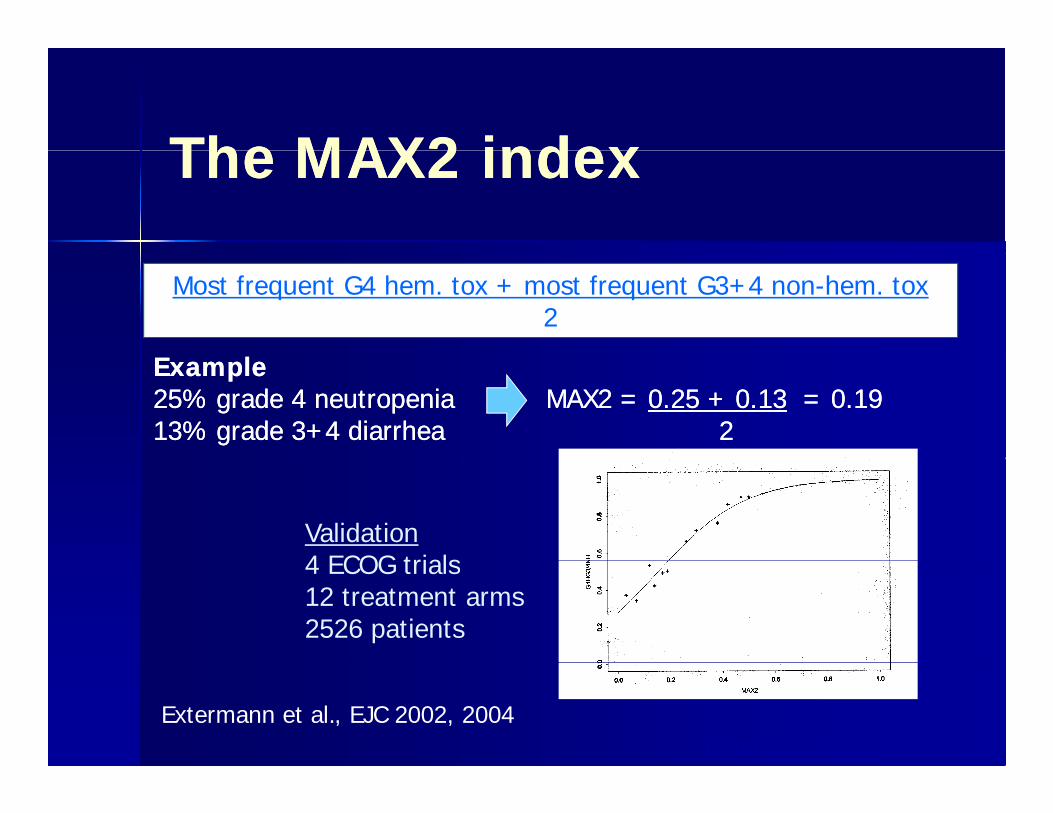
Most frequent G4 hem. tox + most frequent G3+4 non-hem. tox2
ExampleExample2525%% gradegrade 44 neutropenianeutropenia MAXMAX22 == 00..2525 ++ 00..1313 == 00..19191313%% gradegrade 33++44 diarrheadiarrhea 22
Validation4 ECOG trials4 ECOG trials12 treatment arms2526 patients
Extermann et al., EJC 2002Extermann et al., EJC 2002, 2004
MethodsMethodsMethodsMethods
Prospective Prospective multicentricmulticentric studystudy Prospective evaluation of toxicityProspective evaluation of toxicity Prospective evaluation of toxicityProspective evaluation of toxicity Weekly CBCWeekly CBC
R i f b t bli h dR i f b t bli h d Regimen free, but publishedRegimen free, but published Management freeManagement free 24 potential predictors24 potential predictors G4H or G3G4H or G3--4 NH toxicity (CTCAE 3 0)4 NH toxicity (CTCAE 3 0) G4H or G3G4H or G3 4 NH toxicity (CTCAE 3.0)4 NH toxicity (CTCAE 3.0)
Results: ProfileResults: ProfileResults: ProfileResults: Profile
585 eligible, 518 evaluable patients585 eligible, 518 evaluable patients 337 Moffitt 181 affiliates Very similar337 Moffitt 181 affiliates Very similar 337 Moffitt, 181 affiliates. Very similar 337 Moffitt, 181 affiliates. Very similar
baseline characteristics.baseline characteristics. Median age 76 (70Median age 76 (70 92)92) Median age 76 (70Median age 76 (70--92)92) 23 tumor types23 tumor types 121 chemotherapy regimens (!)121 chemotherapy regimens (!)
EndEnd pointspointsEndEnd--pointspoints
G4H G4H 32%32% G3G3--4NH4NH 56%56% G3G3 4NH 4NH 56%56% Combined Combined 64%64%
M di ti t 1M di ti t 1stst t i it 22 dt i it 22 d Median time to 1Median time to 1stst toxicity: 22 daystoxicity: 22 days InterquartileInterquartile: 9: 9--51 days51 days
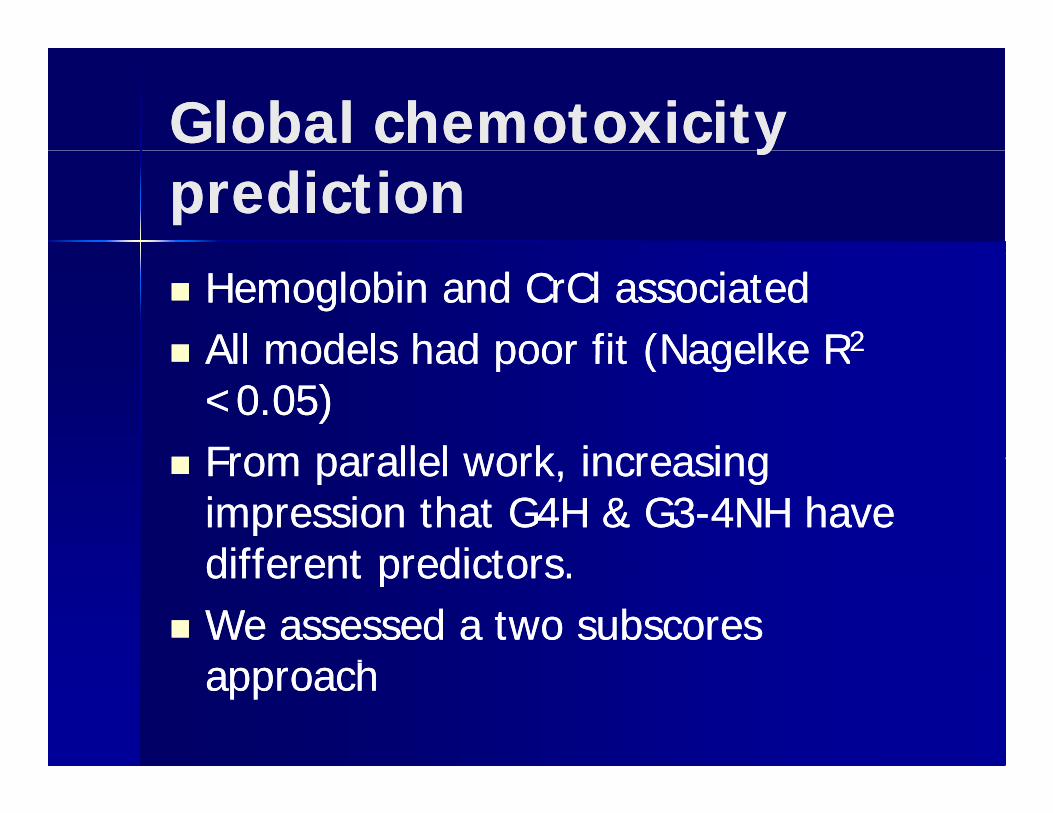
Global chemotoxicity Global chemotoxicity yypredictionprediction Hemoglobin and Hemoglobin and CrClCrCl associatedassociated All models had poor fit (All models had poor fit (NagelkeNagelke RR22 All models had poor fit (All models had poor fit (NagelkeNagelke RR
<0.05)<0.05) From parallel work increasingFrom parallel work increasing From parallel work, increasing From parallel work, increasing
impression that G4H & G3impression that G4H & G3--4NH have 4NH have different predictorsdifferent predictorsdifferent predictors.different predictors.
We assessed a two We assessed a two subscoressubscoreshhapproachapproach
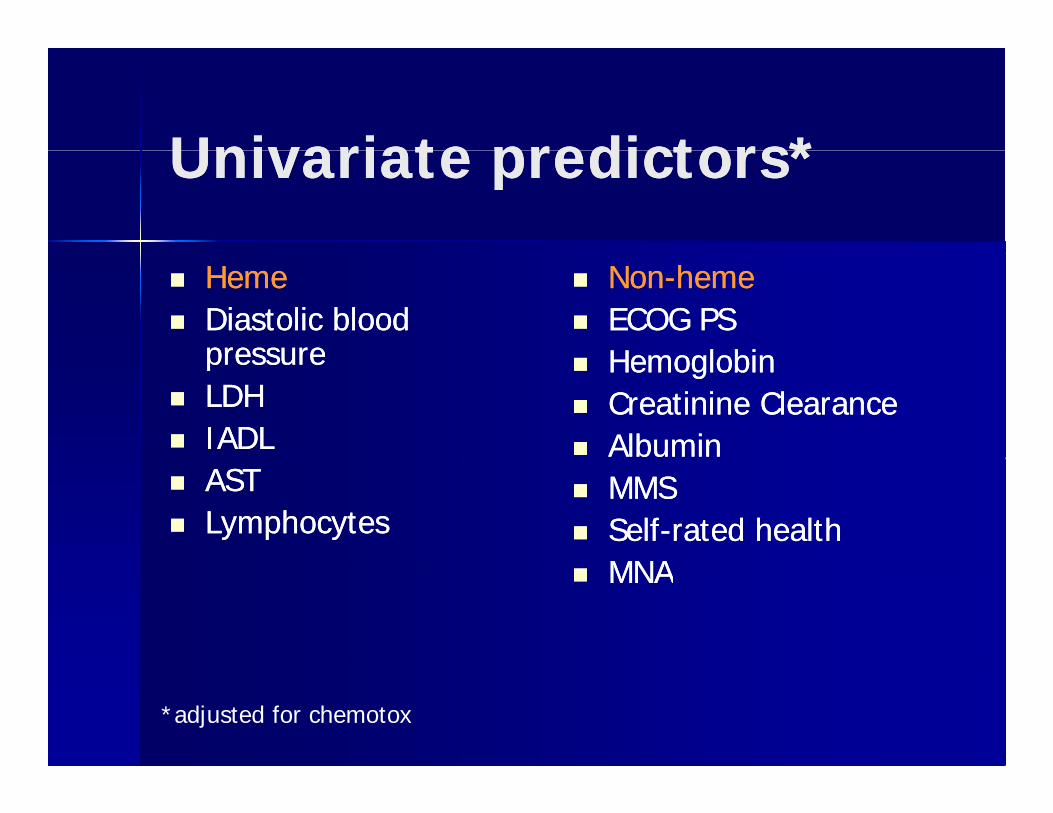
UnivariateUnivariate predictors*predictors*UnivariateUnivariate predictors*predictors*
HemeHeme Diastolic blood Diastolic blood
pressurepressure
NonNon--hemeheme ECOG PSECOG PS
HemoglobinHemoglobinpressurepressure LDHLDH IADLIADL
HemoglobinHemoglobin CreatinineCreatinine ClearanceClearance AlbuminAlbumin
ASTAST LLymphocytesymphocytes
MMSMMS SelfSelf--rated healthrated health
MNAMNA MNAMNA
*adjusted for chemotox
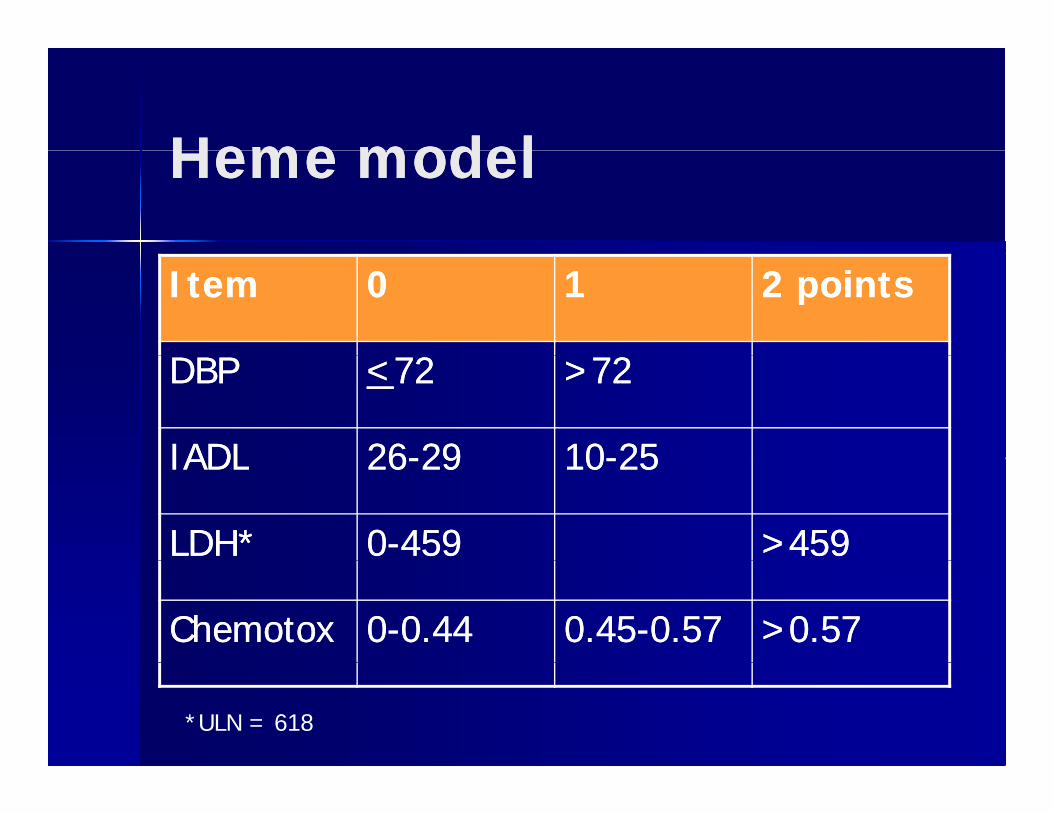
Heme modelHeme modelHeme modelHeme model
ItemItem 00 11 2 points2 points
DBPDBP <<7272 >72>72
IADLIADL 2626--2929 1010--2525IADLIADL 2626--2929 1010--2525
LDH*LDH* 00--459459 >459>459
ChemotoxChemotox 00--0.440.44 0.450.45--0.570.57 >0.57>0.57
*ULN = 618
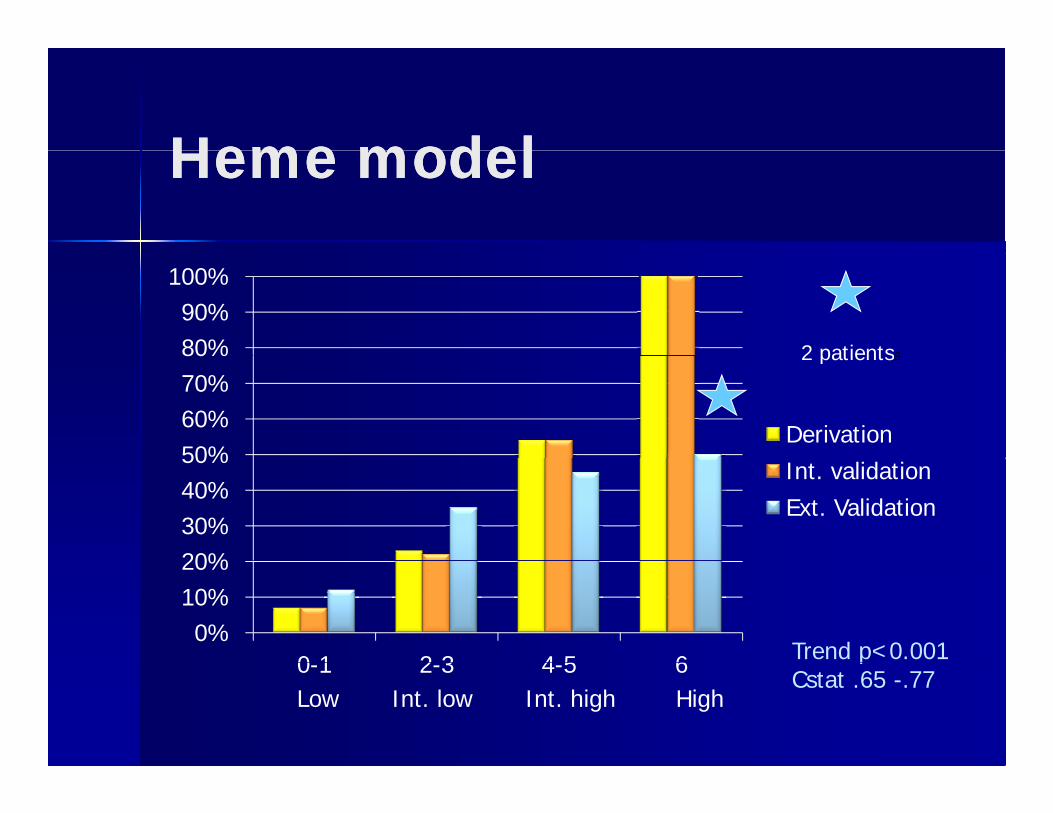
HemeHeme modelmodelHemeHeme modelmodel
80%90%
100%
2 patientss
50%60%70%80%
Derivation
2 patientss
20%30%40%50%
Int. validationExt. Validation
0%10%20%
0 1 2 3 4 5 6 Trend p<0.0010-1 2-3 4-5 6Low Int. low Int. high High
pCstat .65 -.77
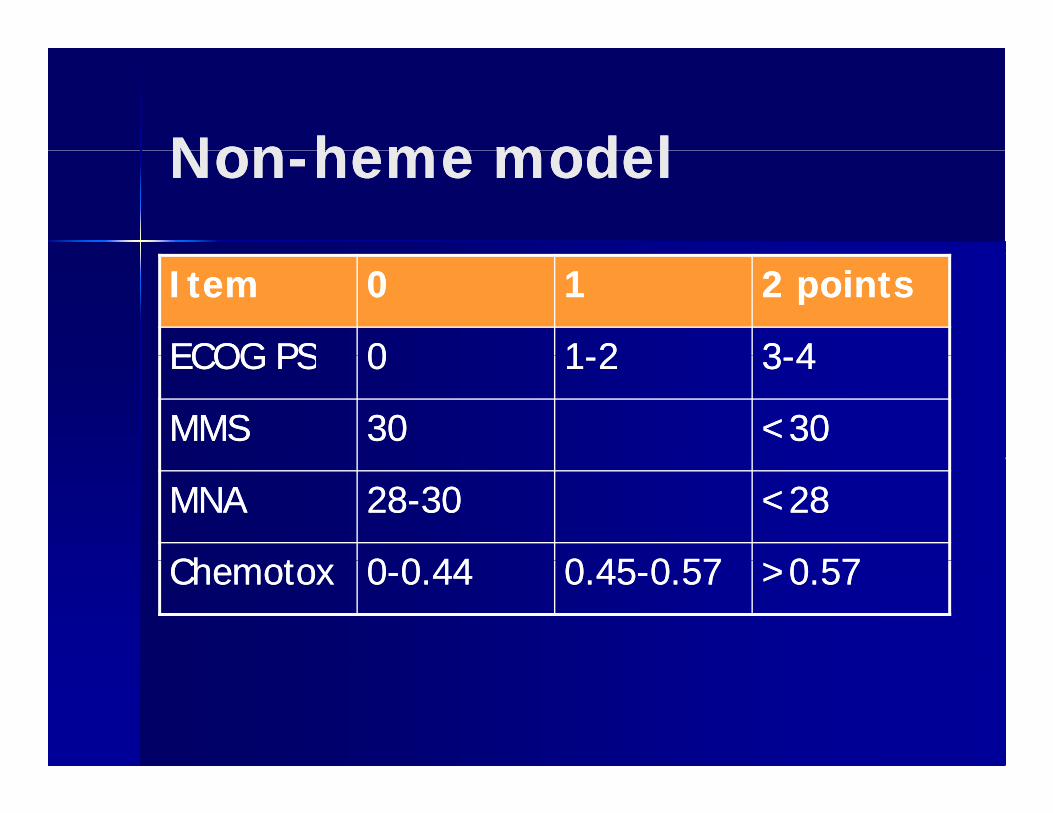
NonNon heme modelheme modelNonNon--heme modelheme model
ItemItem 00 11 2 points2 points
ECOG PSECOG PS 00 11--22 33--44ECOG PSECOG PS 00 11--22 33--44
MMSMMS 3030 <30<30
MNAMNA 2828--3030 <28<28
Ch tCh t 00 0 440 44 0 450 45 0 570 57 0 570 57ChemotoxChemotox 00--0.440.44 0.450.45--0.570.57 >0.57>0.57
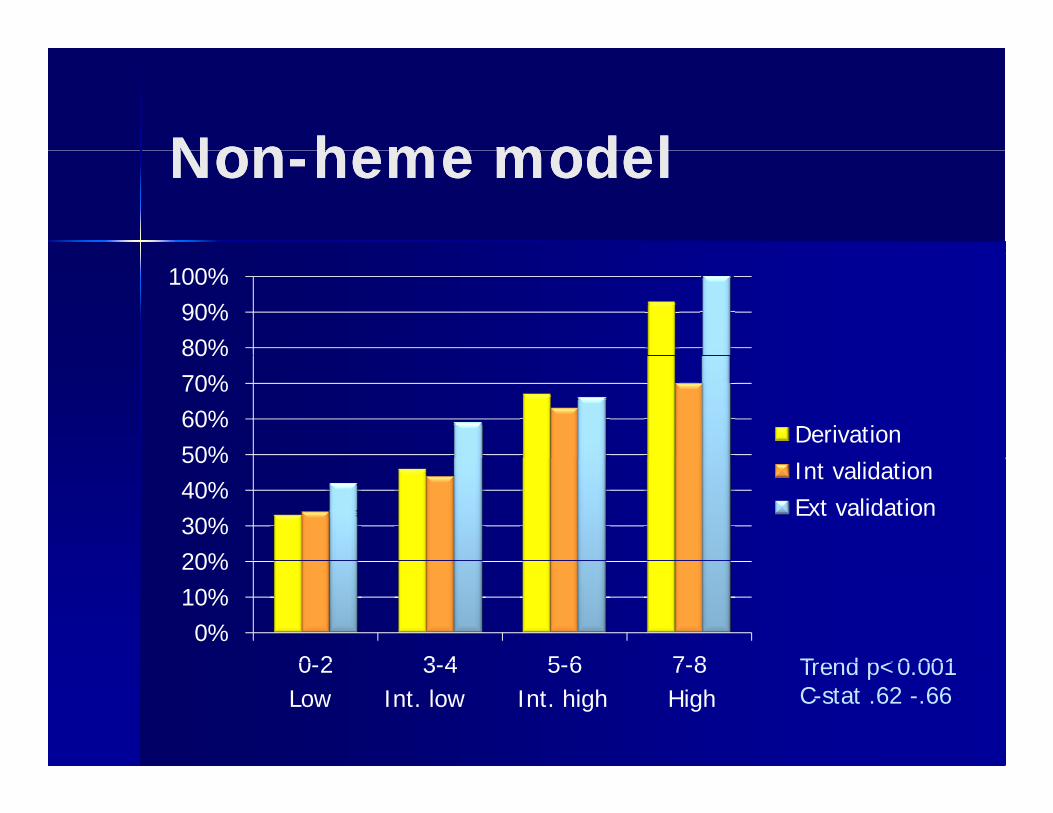
NonNon hemeheme modelmodelNonNon--hemeheme modelmodel
80%90%
100%
50%60%70%80%
Derivation
20%30%40%50%
Int validationExt validation
0%10%20%
0 2 3 4 5 6 7 8 Trend p<0 0010-2 3-4 5-6 7-8Low Int. low Int. high High
Trend p<0.001C-stat .62 -.66
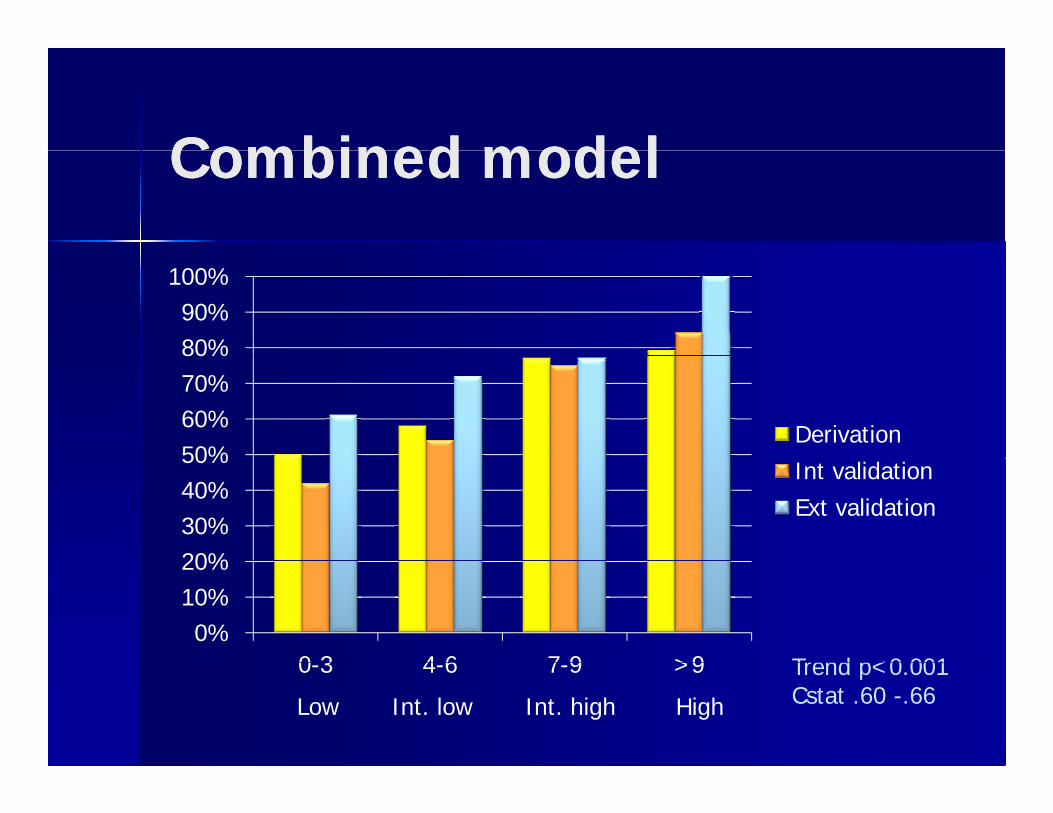
Combined modelCombined modelCombined modelCombined model
80%90%
100%
50%60%70%80%
Derivation
20%30%40%50%
Int validationExt validation
0%10%20%
0 3 4 6 7 9 >9 Trend p<0 0010-3 4-6 7-9 >9
Low Int. low Int. high High
Trend p<0.001Cstat .60 -.66
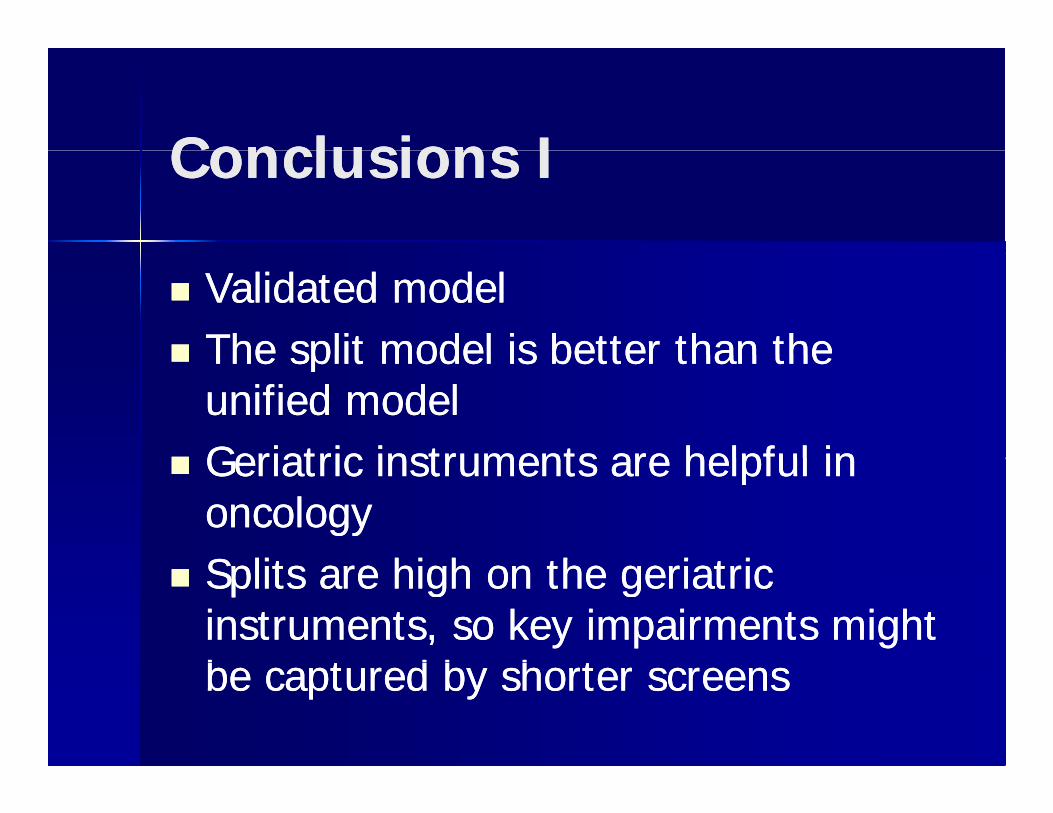
Conclusions IConclusions IConclusions IConclusions I
Validated modelValidated model The split model is better than theThe split model is better than the The split model is better than the The split model is better than the
unified modelunified model Geriatric instruments are helpful inGeriatric instruments are helpful in Geriatric instruments are helpful in Geriatric instruments are helpful in
oncologyoncologyS lit hi h th i t iS lit hi h th i t i Splits are high on the geriatric Splits are high on the geriatric instruments, so key impairments might instruments, so key impairments might b t d b h tb t d b h tbe captured by shorter screensbe captured by shorter screens
Conclusions IIConclusions IIConclusions IIConclusions II
Formal validation should be done for Formal validation should be done for patients under 70. patients under 70. pp
A global approach is sound given the A global approach is sound given the striking number of chemo regimensstriking number of chemo regimensstriking number of chemo regimens striking number of chemo regimens we give to older cancer patients. we give to older cancer patients.
Rating package available:Rating package available: Rating package available:Rating package available: www.moffitt.org/saoptoolswww.moffitt.org/saoptools In press: Cancer 2011In press: Cancer 2011