Embed Size (px)
Citation preview
The Covenant of Mayors: overall analysis and detailed evaluation of city Sustainable Energy Action Plans in the MENA Region
Rivas S., Arnaudova I.,
Gomez Palma A., Bertoldi P.
2018
EUR 29413 EN

This publication is a Science for Policy report by the Joint Research Centre (JRC), the European Commission’s
science and knowledge service. It aims to provide evidence-based scientific support to the European
policymaking process. The scientific output expressed does not imply a policy position of the European
Commission. Neither the European Commission nor any person acting on behalf of the Commission is
responsible for the use that might be made of this publication.
Contact information
Name: Rivas Calvete Silvia
Address: European Commission, Joint Research Centre, Via Enrico Fermi 2749, 21027 Ispra (VA), Italy
Email: [email protected]
Tel.: +39 033278-5368
EU Science Hub
https://ec.europa.eu/jrc
JRC112560
EUR 29413 EN
PDF ISBN 978-92-79-96849-5 ISSN 1831-9424 doi:10.2760/209172
Print ISBN 978-92-79-96850-1 ISSN 1018-5593 doi:10.2760/278608
Luxembourg: Publications Office of the European Union, 2018
© European Union, 2018
The reuse policy of the European Commission is implemented by Commission Decision 2011/833/EU of 12
December 2011 on the reuse of Commission documents (OJ L 330, 14.12.2011, p. 39). Reuse is authorised,
provided the source of the document is acknowledged and its original meaning or message is not distorted. The
European Commission shall not be liable for any consequence stemming from the reuse. For any use or
reproduction of photos or other material that is not owned by the EU, permission must be sought directly from
the copyright holders.
All content © European Union, 2018, except: cover page image, ©Leonid Andronov, #139455659, Source:
stock.adobe.com
How to cite this report: Rivas S., Arnaudova I., Gomez Palma A., Bertoldi P., The Covenant of Mayors: overall
analysis and detailed evaluation of city Sustainable Energy Action Plans in the MENA Region, EUR 29413 EN,
Publications Office of the European Union, Luxembourg, 2018, ISBN 978-92-79-96849-5, doi:10.2760/209172,
JRC112560.
i
Contents
Abstract ............................................................................................................... 1
Acknowledgements ................................................................................................ 2
Executive summary ............................................................................................... 3
1 Introduction ...................................................................................................... 5
1.1 The Covenant of Mayors initiative .................................................................. 5
1.2 Countries of European Neighbourhood Policy - South ....................................... 6
Covenant of Mayors framework : origin ............................................................ 7
Peculiarities of the Covenant of Mayors South framework ................................... 8
1.3 Involvement of CoM South cities .................................................................... 9
1.4 The role of the JRC and the aim of the present report....................................... 9
2 Overall Assessment of the CoM in the MENA region .............................................. 10
2.1 Differentiation of Commitments by Signatories of the Covenant of Mayors ........ 10
2.2 Methodological approach for the assessment ................................................. 10
2.3 Scope of the assessment ............................................................................ 11
2.4 Main Findings and considerations ................................................................. 14
Signatories and commitments ....................................................................... 14
Sustainable Energy Action Plans / Sustainable Energy and Climate Action Plans .. 14
2.4.1.1 Final energy consumptions in baseline emissions inventories ............. 14
2.4.1.2 Greenhouse gas emissions reported by the CoM-South Signatories .... 15
2.4.1.3 Local electricity production from renewable energy sources ............... 17
2.4.1.4 Committed emissions reductions by 2020 and 2030 ......................... 17
Estimated budget reported by CoM-South signatories ....................................... 20
2.4.1.4.1 Monitoring and implementation .............................................. 20
2.4.1.4.2 Performance indicators ......................................................... 20
2.4.1.5 Review of consistency in energy consumption and emissions values
reported ................................................................................................. 21
2.4.1.5.1 Consistency in Population Figures ........................................... 21
2.4.1.5.2 Consistency in Energy Consumption Figures ............................ 21
2.4.1.5.3 Signatory-specific review of energy consumption figures and examples of corrections in treated dataset .............................................. 22
2.4.1.5.4 Discrepancies contained within the SEAP/BEI documents for
emissions ......................................................................................... 25
2.4.1.5.5 Discrepancies between SEAP/BEI documents and the dataset for emissions ......................................................................................... 25
3 Detailed evaluation of Sustainable Energy Action Plans ......................................... 27
3.1 Selection of sustainable Energy Action Plans for detailed evaluation ................. 27
Number of SEAPs per country ....................................................................... 27
Criteria for selecting SEAPs ........................................................................... 28

ii
Selected signatories ..................................................................................... 28
3.2 Results of the evaluation: how cities addressed the ten key principles of the
Covenant of Mayors ......................................................................................... 30
1st Principle: SEAP approval by Municipal Council ............................................. 30
2nd Principle: Commitment to GHG reduction by at least 20% by 2020 ............... 31
3rd Principle: Baseline Emission Inventory ....................................................... 31
4th and 5th Principles: Measures covering key sectors & Long and short-term actions 34
6th Principle: Adaptation of city administrative structure ................................... 35
7th Principle: Mobilisation of civil society ......................................................... 37
8th Principle: Financing ................................................................................ 38
9th Principle: Monitoring and reporting ............................................................ 41
10th Principle: SEAP submission ..................................................................... 41
3.3 Examples of measures From Sustainable Energy Action Plans .......................... 43
Buildings sector ........................................................................................... 43
Transport Sector .......................................................................................... 45
Municipal Lighting ........................................................................................ 46
Other sectors .............................................................................................. 48
Multi-sector ................................................................................................ 50
Other Examples ........................................................................................... 51
3.3.1.1 Cooperation strategy with tourism stakeholders from Boumerdès (Algeria) ................................................................................................. 51
3.3.1.2 Twelve Considerations for the effective implementation of the SEAP in
Morocco ................................................................................................. 52
4 Conclusions .................................................................................................... 54
References ......................................................................................................... 58
List of abbreviations and definitions ....................................................................... 60
List of figures ...................................................................................................... 61
List of tables ....................................................................................................... 62
Annexes ............................................................................................................. 63
1
Abstract
Launched in Europe in 2008, the Covenant of Mayors initiative came into being to
support the efforts of local authorities in tackling climate change. Upon its wide
endorsement in the region, the model was expanded to others, including the Southern
Mediterranean. This report is a part of series of papers that analyse and highlight best
practices in the Covenant Community and reviews Sustainable Energy Action Plans
(SEAPs) from 7 countries – Algeria, Israel, Jordan, Lebanon, Morocco, the Palestinian
Territories and Tunisia. The main findings are organised around the 10 principles of the
Covenant of Mayors of the JRC Guidebook “How to develop a Sustainable Energy Action
Plan (SEAP) in South Mediterranean Cities”. The analysis shows a good compliance with
the mentioned principles and highlights the challenges linked to technical capacities at
the local level, the insufficient financing and the sustainability of the action. The report
concludes with a selection of best practices made from the planned actions and
governance models of the selected SEAPs.

2
Acknowledgements
The authors would like to thank the European Commission Directorate-General for
Neighbourhood and Enlargement Negotiations (DG NEAR).
Relevant contributions have also been received from the responsible of the regional
projects CES-MED and experts form municipalities, regions, agencies and private
companies.
Special thanks to local authorities who make public their engagement in climate action
planning through their participation in the Covenant of Mayors.
Authors
Rivas Silvia (European Commission, Joint Research Centre)
Arnaudova Iliyana (Regional Center for Renewable Energy and Energy Efficiency,
RCREEE)
Gomez Palma Alejandro (Institute for Development, environment and Energy, IDE-E)
Paolo Bertoldi (European Commission, Joint Research Centre)

3
Executive summary
The Covenant of Mayors (CoM) Community1 offers countless possibilities for peer learning
and exchange on key opportunities and challenges in local energy and climate action
planning. Since the start of the CoM initiative, the Joint Research Centre (JRC) of the
European Commission (EC) has not only been in charge of technical support to the
signatories but has also taken the lead in analysing and highlighting best practices in the
Covenant Community. These include: Covenant of Mayors in figures: 8-year assessment
(2017), The Covenant of Mayors: Evaluation of Sustainable Energy Action Plans from
Eastern Partnership and Central Asian countries (2017), The Covenant of Mayors: In-
depth Analysis of Sustainable Energy Actions Plans (2015).
The present report summarizes the findings from the detailed assessment of a subset of
11 Sustainable Energy Action Plans (SEAPs) from the Southern Partnership States (CoM
South countries) in relation to the ten key principles described in the guidebook "How to
develop a SEAP in the South Mediterranean Cities" (Saheb, Kona, Maschio, & Szabo,
2014). The total population of the Southern Partnership States covered by the CoM is
211,783,000 and the population covered by the sample plans equals to 2,824,131
inhabitants.
In addition, a particular attention is given to:
· Identifying SEAP exemplary elements, focusing on the SEAP process. These
elements include, among other things, effective stakeholder involvement and
inclusion, establishment of suitable governance structures, elaboration of an
appropriate monitoring and reporting structure (M & R).
· Extracting good practices, focusing on policy measures and, where relevant, pilot
studies. There is an emphasis on the sectors mandatory for the SEAPs: buildings
(including municipal, residential and commercial buildings), transport and
municipal lighting. Cross-sectorial measures such as awareness raising,
networking and training are not left behind either.
Policy context
In 2018 the Covenant of Mayors (CoM) initiative turns 10 years since its launch which
underpins the growing role of local authorities (LAs) in tackling climate change. While the
initiative started with the goal of supporting European LAs to curb CO2 emissions in their
territories through the development and implementation of sustainable energy action
plans (SEAPs), it is today one of the world’s largest urban climate and energy initiatives
with more ambitious goals, addressing three pillars of action – climate change mitigation,
climate change adaptation and access to energy.
2018 also marks five years since the initiative’s expansion to ten Southern
Neighbourhood Policy countries (ENP-South): Algeria, Egypt, Israel, Jordan2, Lebanon,
Libya3, Morocco, the Palestinian Territories, Syria4 and Tunisia. Moreover, at the last
meeting of the Union for the Mediterranean (UfM) in Barcelona in January 2018, both the
European Union (EU) representatives and the beneficiary countries recognised the crucial
role that the local energy and climate action planning will play for the successful
decarbonisation of the region and the achievement of the Intended Nationally
Determined Contributions (INDCs)5.
Since 2013, the initiative has been implemented through the assistance of the EU-funded
project: “ENPI – cleaner energy-saving Mediterranean cities”
(EuropeAid/132630/C/SER/Multi) while starting this year (2018), it will fall under the “EU
1 Expression used to describe the Community of stakeholders involved in the Covenant of Mayors; i.e. Signatories, Coordinators, Supporters and Associated Partners 2 IAASA Policy Brief, 17 july 2018 on envisioning participatory governance of energy transition in Jordan 3 Activities have been re-launched. 4 Activities have been re-launched. 5 Not all countries have presented their Nationally Determined Contributions.

4
for Climate Action in the European Neighbourhood Instrument ENI Southern
Neighbourhood” (EuropeAid/139067/DH/SER/Multi). While the initial SEAP model
required cities and municipalities to commit to reduce at least 20% of their CO2
emissions, the new Sustainable Energy Access and Climate Action Plan (SEACAP) is to
equally integrate climate change adaptation (through a vulnerability assessment) and
access to energy and shall aim for 40% reductions of CO2 emissions by 2030.
In the context of this evaluation it is important to note that up to 1st February 2018, 22
SEAPs were submitted to Covenant of Mayors team. Out of the 22, 3 were of non-
signatories and 19 of CoM Signatories.
Key conclusions and main findings
The key conclusions of the in-depth assessment are as follows:
Technical expertise and capacity for SEAP development and implementation is
scarce at the local level and more resources dedicated to training of municipal
staff are needed.
The municipal budget is often insufficient to cover the implementation of the
SEAPs and innovative financing mechanisms are sought to complement the
existing finance. Nevertheless, the LAs face further difficulties in planning and
accessing such alternative sources. With no proper financial mechanisms and
instruments, SEAP implementation will be difficult and timely solutions are
needed.
The initiative in this region is to further be strengthened since its sustainability is
at risk. Although the governance structure of all signatories has been adapted, it
is uncertain whether it will last in the absence of technical assistance and without
a dedicated financing. The coming years will also serve as a test on the progress
on SEAP implementation and the monitoring and reporting.
Nevertheless, cities recognize the importance and the benefits of being a
signatory of the initiative. The CoM is seen as a lever for transfer of know-how, a
platform where the signatories can benefit from the experiences and lessons learn
of other municipalities in sustainable local energy planning.
Related and future JRC work
Given that the CoM initiative is still relatively new to the region and no monitoring
reports from the first signatories are yet available, it is suggested for JRC to track and
analyse the first and subsequent monitoring reports of the selected municipalities. Such
an analysis will reveal the factors for successful implementation and will allow drawing
conclusions on the long-term commitment and capacities within the LAs. It is further
recommended to conduct a qualitative analysis based on interviews with the key project
teams (from the CES-MED and/or the subsequent EU for Climate Action in the ENI
Southern Neighbourhood) and the LAs to better understand the challenges linked to SEAP
development.
Quick guide
The presented report is organised in four chapters where Chapter 1 is to introduce the
CoM initiative and the countries subject to this report. Chapter 2 is to present the
selection process of the analysed SEAPs. The results of the evaluation and details about
good practices of local measures and policies are presented in Chapter 3. Chapter 4 will
close the report with drawing lessons and recommendations for the future, and
presenting the key findings.
5
1 Introduction
1.1 The Covenant of Mayors initiative
The Covenant of Mayors initiative was launched in 2008 with the support of the EC to
endorse and support the efforts deployed by local authorities in the implementation of
sustainable energy policies. The two distinct features of the initiative included the
acceptance of a voluntary political commitment by the municipal council and the
preparation of a SEAP and its subsequent monitoring and reporting reports. The specific
carbon reduction target for each signatory of the political commitment was set to 20 %
by 2020.
In 2013 the CoM framework expanded to 10 new countries in the Southern
Mediterranean: Algeria, Egypt, Israel, Jordan, Lebanon, Libya, Morocco, the Palestinian
Territories, Syria and Tunisia. Since then several municipalities successfully prepared and
submitted their SEAPs and it was not until 2015, that the initiative took on new
objectives to step up the initial CO2-reduction commitment (a 40% emission reduction
target by 2030 for signatories in EU countries and 30% emission reduction target by
2030 for the Southern Mediterranean) and to include adaptation to climate change and
access to energy. Hence, starting 2018 the new signatories from the Southern
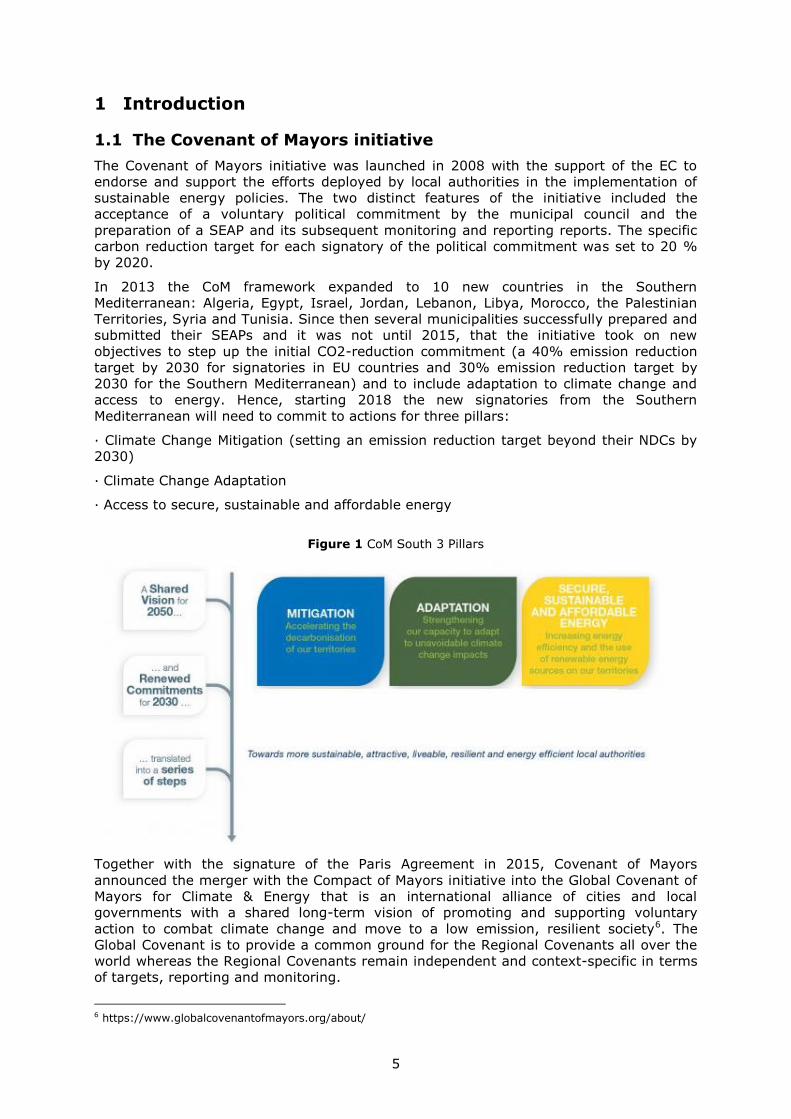
Mediterranean will need to commit to actions for three pillars:
· Climate Change Mitigation (setting an emission reduction target beyond their NDCs by
2030)
· Climate Change Adaptation
· Access to secure, sustainable and affordable energy
Figure 1 CoM South 3 Pillars
Together with the signature of the Paris Agreement in 2015, Covenant of Mayors
announced the merger with the Compact of Mayors initiative into the Global Covenant of
Mayors for Climate & Energy that is an international alliance of cities and local
governments with a shared long-term vision of promoting and supporting voluntary
action to combat climate change and move to a low emission, resilient society6. The
Global Covenant is to provide a common ground for the Regional Covenants all over the
world whereas the Regional Covenants remain independent and context-specific in terms
of targets, reporting and monitoring.
6 https://www.globalcovenantofmayors.org/about/
6
1.2 Countries of European Neighbourhood Policy - South
Challenges
The challenges faced by the Southern Mediterranean region are specific to its geographic
and demographic context. The situation in the Southern Mediterranean states is
described by a need for a sustainable energy development that can match the population
and industry growth while simultaneously satisfying the economic needs and addressing
the energy security of the region. What is more, at present the energy sector is
witnessing fundamental changes and strives to balance out production, consumption and
export revenue in the midst of turbulent economic conditions following political changes.
In addition, climate change adaptation remains a pending priority for the Southern
Mediterranean countries where two third of the total population live in urban areas
concentrated in coastal zones (CES-MED, 2018), the most vulnerable ones to climate
change impacts.
Furthermore, energy access is often challenging in countries in a fragile or crisis situation
where regeneration of livelihoods or creation of new services linked to energy, transport
and water is critical. Countries such as Syria, Libya and Palestine face different levels of
fragility linked to conflicts and they impact neighbouring countries such as Egypt,
Lebanon and Jordan as refugees settle in these countries. In the context of migration, it
is common that countries and communities lack the capacity and the means to recover
and/or meet the energy needs of the population. At the local level, due to the political
context in areas of conflict, data collection, monitoring and reporting as well as SEAP
implementation might be difficult. It was noted that the impact of the existing laws and
regulations was limited due to inconsistent enforcement in the region.
Next, naturally, there are differences and similarities in the challenges for local
authorities in the Middle East and North Africa (MENA) region compared to the European,
ENP East or Sub-Saharan African countries. The MENA cities differ from their neighbours
in the level of decentralisation that is lower to the existing one in Europe. There is
currently no common framework for action that can ensure an integrated approach for
tackling the shared energy and climate challenges. In view of this, the task of the CoM is
even more important in order to provide a framework for local, regional and international
collaboration. From this perspective, the region is also among one of the most promising
ones where challenges can be turned into opportunities.
The increase in energy demand in the South Mediterranean is unavoidable and
necessary, even with energy efficiency and renewable added to the mix, as the actual per
capita energy demand is very low in the South compared to the North Mediterranean
according to the "Observatoire Mediterraneen de l'Energie" (2016). When comparing with
the other regional Covenants, it is observed that the emission levels in the Southern
Mediterranean are higher than the ones from the ENPI East but are still lower compared
to the EU-28 average (Figure 2). The average CO2 emissions/cap/year from the MENA
region (3,867) are 44% lower than the average of the European Union (6,87).
7
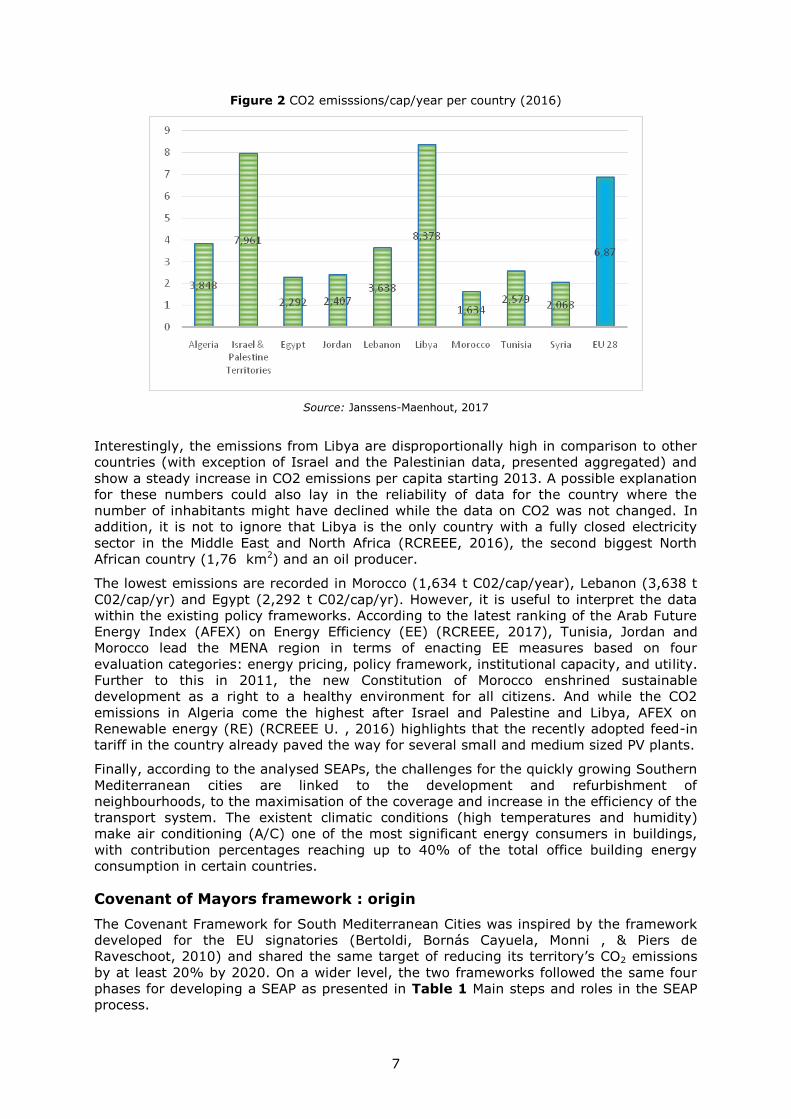
Figure 2 CO2 emisssions/cap/year per country (2016)
Source: Janssens-Maenhout, 2017
Interestingly, the emissions from Libya are disproportionally high in comparison to other
countries (with exception of Israel and the Palestinian data, presented aggregated) and
show a steady increase in CO2 emissions per capita starting 2013. A possible explanation
for these numbers could also lay in the reliability of data for the country where the
number of inhabitants might have declined while the data on CO2 was not changed. In
addition, it is not to ignore that Libya is the only country with a fully closed electricity
sector in the Middle East and North Africa (RCREEE, 2016), the second biggest North
African country (1,76 km2) and an oil producer.
The lowest emissions are recorded in Morocco (1,634 t C02/cap/year), Lebanon (3,638 t
C02/cap/yr) and Egypt (2,292 t C02/cap/yr). However, it is useful to interpret the data
within the existing policy frameworks. According to the latest ranking of the Arab Future
Energy Index (AFEX) on Energy Efficiency (EE) (RCREEE, 2017), Tunisia, Jordan and
Morocco lead the MENA region in terms of enacting EE measures based on four
evaluation categories: energy pricing, policy framework, institutional capacity, and utility.
Further to this in 2011, the new Constitution of Morocco enshrined sustainable
development as a right to a healthy environment for all citizens. And while the CO2
emissions in Algeria come the highest after Israel and Palestine and Libya, AFEX on
Renewable energy (RE) (RCREEE U. , 2016) highlights that the recently adopted feed-in
tariff in the country already paved the way for several small and medium sized PV plants.
Finally, according to the analysed SEAPs, the challenges for the quickly growing Southern
Mediterranean cities are linked to the development and refurbishment of
neighbourhoods, to the maximisation of the coverage and increase in the efficiency of the
transport system. The existent climatic conditions (high temperatures and humidity)
make air conditioning (A/C) one of the most significant energy consumers in buildings,
with contribution percentages reaching up to 40% of the total office building energy
consumption in certain countries.
Covenant of Mayors framework : origin
The Covenant Framework for South Mediterranean Cities was inspired by the framework
developed for the EU signatories (Bertoldi, Bornás Cayuela, Monni , & Piers de
Raveschoot, 2010) and shared the same target of reducing its territory’s CO2 emissions
by at least 20% by 2020. On a wider level, the two frameworks followed the same four
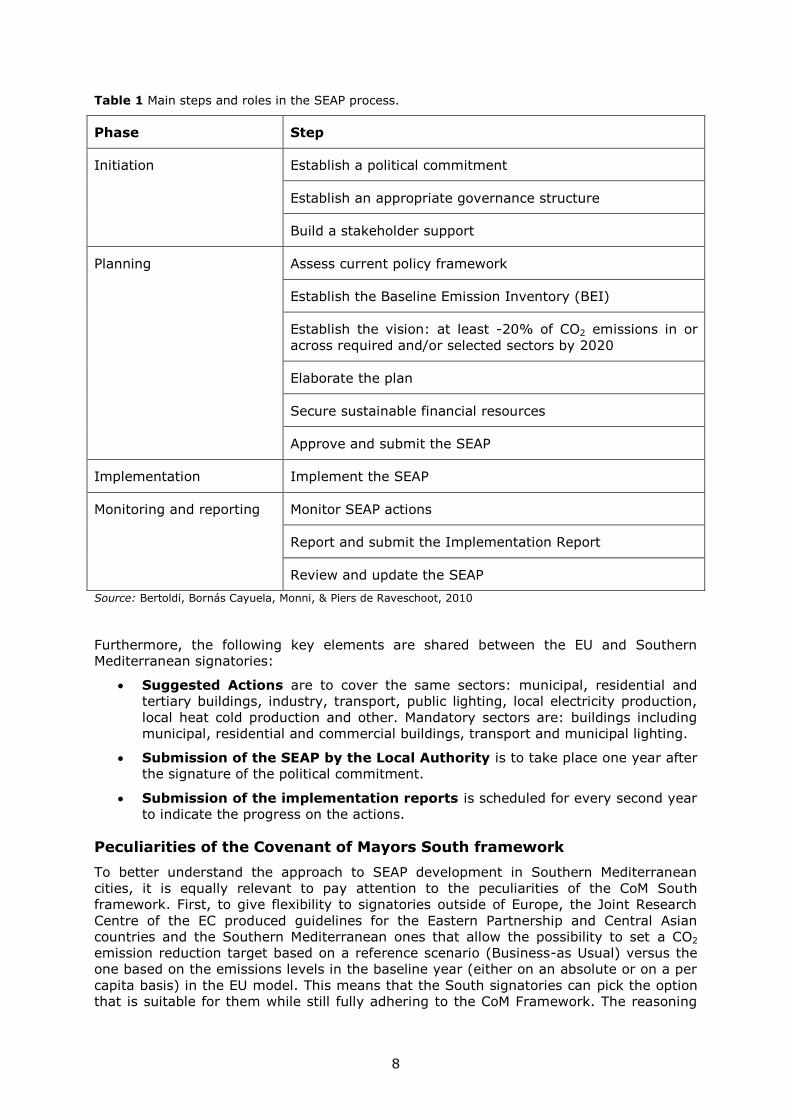
phases for developing a SEAP as presented in Table 1 Main steps and roles in the SEAP
process.
8
Table 1 Main steps and roles in the SEAP process.
Phase Step
Initiation Establish a political commitment
Establish an appropriate governance structure
Build a stakeholder support
Planning Assess current policy framework
Establish the Baseline Emission Inventory (BEI)
Establish the vision: at least -20% of CO2 emissions in or
across required and/or selected sectors by 2020
Elaborate the plan
Secure sustainable financial resources
Approve and submit the SEAP
Implementation Implement the SEAP
Monitoring and reporting Monitor SEAP actions
Report and submit the Implementation Report
Review and update the SEAP
Source: Bertoldi, Bornás Cayuela, Monni, & Piers de Raveschoot, 2010
Furthermore, the following key elements are shared between the EU and Southern
Mediterranean signatories:
Suggested Actions are to cover the same sectors: municipal, residential and
tertiary buildings, industry, transport, public lighting, local electricity production,
local heat cold production and other. Mandatory sectors are: buildings including
municipal, residential and commercial buildings, transport and municipal lighting.
Submission of the SEAP by the Local Authority is to take place one year after
the signature of the political commitment.
Submission of the implementation reports is scheduled for every second year
to indicate the progress on the actions.
Peculiarities of the Covenant of Mayors South framework
To better understand the approach to SEAP development in Southern Mediterranean
cities, it is equally relevant to pay attention to the peculiarities of the CoM South
framework. First, to give flexibility to signatories outside of Europe, the Joint Research
Centre of the EC produced guidelines for the Eastern Partnership and Central Asian
countries and the Southern Mediterranean ones that allow the possibility to set a CO2
emission reduction target based on a reference scenario (Business-as Usual) versus the
one based on the emissions levels in the baseline year (either on an absolute or on a per
capita basis) in the EU model. This means that the South signatories can pick the option
that is suitable for them while still fully adhering to the CoM Framework. The reasoning

9
behind was to allow emerging economies to pursue their RE & EE targets while on track
for delivering the growth and employment to their growing populations. It is, however,
expected that LAs will aim to reduce such an increase “as much as possible through
adequate energy policies and climate protection measures” (Saheb, Kona, Maschio, &
Szabo, 2014).
Second, the CoM South Guidebook highlights the National Coordination Groups (NCG)
created by the Cleaner Energy-Saving Mediterranean Cities (CES-MED) project, particular
to the region, as recommended organisational structures (Saheb, Kona, Maschio, &
Szabo, 2014). The NCGs were formed of key national authorities in each partner country,
presided by the country’s Focal Point, to ensure support of the actions at both levels as
well as alignment with the national programmes and regulations. The alliance of the
NCGs with the cities can be seen as a “de facto a national-local partnership in support of
decentralization and sustainable local planning” (Amin, 2018).
Thirdly, the frequency of the submission of the Monitoring Emission Inventory (MEI) in
the Southern Mediterranean is lower compared to the one in Europe. The MEI of LAs in
the MENA is requested every four years while in Europe the requirement is every second
year. While no particular justification for this was presented in the Guidebook, it might be
plausible to say that this is linked to the complexity of the activity relative to the existing
technical capacities at the local level.
1.3 Involvement of CoM South cities
On 1st February 2018, 22 SEAPs from cities located in the Southern Mediterranean were
submitted. It is important to note that to that date 26 cities/municipalities in total
together with 2 Egyptian Governorates 7 have expressed interest or have been affiliated
to the CoM Movement in the MENA (CES-MED Project Progress, 2017).
The first SEAP was submitted as early as 2012 while 2016 was the year when the
majority of cities submitted their SEAPs. The highest number of signatories come from
Morocco (5), followed by the Palestinian Territories (4) with Algeria, Israel, Lebanon and
Tunisia with 3 each.
1.4 The role of the JRC and the aim of the present report
The EC's Joint Research Centre (JRC) provides scientific, methodological and technical
support to the Covenant of Mayors initiative. The Centre has been charged with
developing the methodologies for all Regional Covenants in collaboration with city
networks, practitioners from local and regional authorities, energy agencies, academia
and project leaders in the spirit of the bottom-up approach of the CoM that aims to
create a city-led and city-sustained initiative. The aim of the present report is to support
the European Commission in drawing lessons and conclusions for future actions not only
in the MENA region but also worldwide. The study can help to improve the way
information about the CoM is designed and communicated and further serve as peer-
learning material for local and regional authorities.
7 Equivalent to regions as per CoM classification

10
2 Overall Assessment of the CoM in the MENA region
2.1 Differentiation of Commitments by Signatories of the
Covenant of Mayors
Given the evolving nature of the Covenant of Mayors movement, it is important to
differentiate different types of commitments by signatories. Under the original model
focused on climate change mitigation, local authorities had to define and submit a target
of at least a 20% reduction of CO2 emissions by 2020, within one year of adhering to the
CoM. The reduction targets were to be based on the results of their BEI and the
projections of expected emissions in the year 2020 based on a “business as usual
scenario”. In addition, a SEAP needed to be formally approved by the local authority and
submitted to the CoM for review and approval. In addition to submitting their SEAP,
signatories need to report specific information and data from their BEI and their SEAP via
the on-line template provided on the restricted area of the CoM portal, including but not
limited to:
— energy consumption by sector (in MWh/year) in the reference year of the BEI;
— emissions by sector (expressed in tCO2-eq/year) in the reference year of the BEI;
— estimated emissions in the year 2020 based on a “business as usual scenario”;
— description of actions to be implemented and their respective quantitative indicators
(costs, energy savings, energy from local and renewable sources, emissions
reductions);
— estimated energy savings by 2020 (expressed in MWh/year);
— estimated energy from renewable sources by 2020 (expressed in MWh/year); and
finally
— estimated total emissions reduction by 2020 (expressed in tCO2-eq/year).
The SEAP is the principal document through which a signatory presents its vision,
targets, and the measures and actions to be implemented. For the actions described in
their SEAP, signatories are expected to report data for different sectors and subsectors of
intervention (e.g. energy efficiency in buildings, equipment and facilities, transportation,
adoption of renewable energy sources, urban planning, among others), as well as the
relevant policy instrument applied and the body responsible for implementation.
Subsequently, signatories are required to submit a monitoring report on implementation
of the SEAP every second year from submission of the SEAP, and to complement it with a
Monitoring Emission Inventory (MEI) at least every fourth year.
Under the new Covenant of Mayors for Climate and Energy model, however, this has
changed. Signatories joining the initiative after October 2015 must also submit a Climate
Change Risk and Vulnerability Assessment and adopt an integrated approach to climate
adaptation into their respective SECAP. Signatories must develop and submit their SECAP
within two years of adhering and the horizon for planning is extended to 2030 for their
adaptation and mitigation measures. The differentiation of commitments and timeframes
for submission is particularly important for the CoM-South signatories given the date of
the current assessment (March to May 2018) and the resulting availability of information
and data from signatories.
2.2 Methodological approach for the assessment
Compared with the total number of CoM signatories considered in previous assessments
conducted by the JRC (e.g. 6 201 signatories considered in the 2017 assessment in Kona
et al., 2017), the total number of CoM-South signatories is limited.. As a result, the same
approach for statistical analysis as previously applied by the JRC cannot be applied,
particularly the identification and removal of outliers based on the Generalised Extreme

11
Studentised Deviate.8 The limited number of CoM-South signatories, however, represents
an opportunity to conduct an in-depth review of available information and data from
signatories, as a group and individually.
The assessment of the CoM initiative in the Southern Mediterranean partner countries
thus involved an extensive review and analysis of the official communication and data
submitted by signatories from these countries. Signatories submit their information via
different documents to the secure portal of the Covenant of Mayors for Climate and
Energy Website (http://mycovenant.eumayors.eu/). The primary sources of signatory
information for the assessment are the following:
Signatory profiles registered online when a signatory joins the CoM;
The SEAP/SECAP documents submitted by signatories, which normally include
results from the BEI;
The filled online templates (based on Excel tables) that serve primarily to
quantify the key data and information from the SEAPs (e.g. final energy
consumption, emissions factors adopted, CO2eq emissions, and a summary table
of key actions with expected energy savings, energy from renewable sources and
target emissions reductions);
Formal documents showing adhesion to the CoM and approval by local
authorities of the SEAP/SECAP; and
Feedback reports prepared by the JRC based on the SEAP/SECAP documents as
well as a review of the filled-out SEAP/SECAP templates.
When possible, review and analysis of signatory metadata was performed using statistical
software on exported data files.9 In addition, the JRC provided a consolidated dataset of
the information provided by signatories via the online reporting templates (dataset 26
March 2018).
As discussed in the next section, there are multiple points where information and data
from a signatory may present minor discrepancies, inconsistencies and/or be incomplete,
given the different sources and types of information and data required, as well as the
process of transferring data/information from SEAP/SECAP/BEI document to the online
templates. The approach taken for the assessment, therefore, included a review of the
existing information for a particular signatory from different sources, identifying points of
discrepancies and inconsistencies, if any, and where possible, correcting for these in the
overall quantitative aggregated analysis of the whole group of CoM-South signatories. In
addition, whenever possible a comparative review and analysis of signatories from the
same country was performed to identify salient points for review and vigilance. This was
especially useful in the case of Morocco – the country with the most signatories at the
time of the assessment. This approach serves a two-fold purpose: (i) to integrate a
treated dataset of CoM-South signatories where corrections have been applied to
generate global descriptive statistics, where possible; and (ii) to identify key points of
vigilance and subsequent recommendations to support signatories and the work of the
JRC and partners moving forward.
2.3 Scope of the assessment
Based on the signatory registration profiles and submitted documents as of 15 March
2018, there are a total of 40 active signatories from seven countries: Algeria, Israel,
Jordan, Lebanon, Morocco, Palestine and Tunisia. Of the 40 active signatories, 19
adhered to the CoM on or before October 2015, with the earliest signatory adhering in
2011. All but two of these signatories (Albasan Al-Kabira, Palestine and Menjez, Lebanon)
have committed to 2020 targets under the original CoM model. Of the 21 signatories that
adhered after October 2015, all but two (Chefchaouen, Morocco and Kab Elias – Wadi El
8 Referenced in Kona et al., 2016 9 For the review and analysis of metadata available, IBM® SPSS® Statistics 23 was used.
12
Delm, Lebanon) have assumed mitigation and adaptation commitments to 2030 under
the more recent CoM model. The deadline for submission by these signatories of their
respective SECAP documents is thus November 2018 or later. The number of signatories
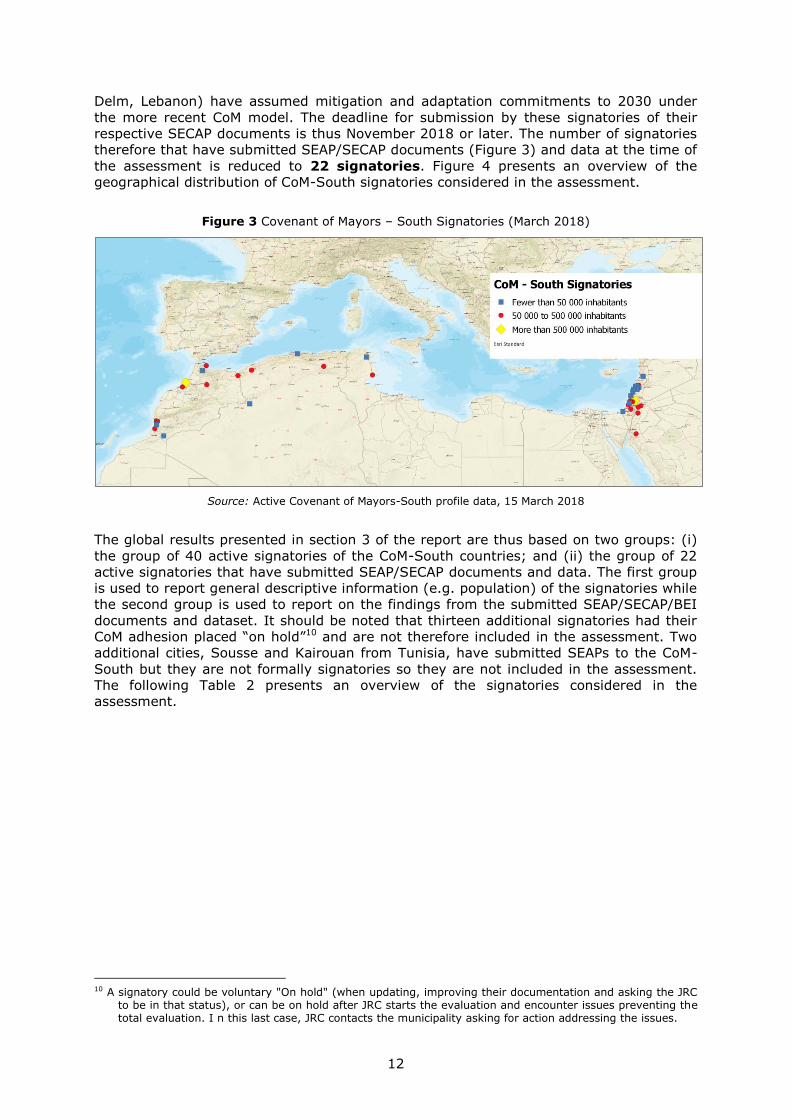
therefore that have submitted SEAP/SECAP documents (Figure 3) and data at the time of
the assessment is reduced to 22 signatories. Figure 4 presents an overview of the
geographical distribution of CoM-South signatories considered in the assessment.
Figure 3 Covenant of Mayors – South Signatories (March 2018)
Source: Active Covenant of Mayors-South profile data, 15 March 2018
The global results presented in section 3 of the report are thus based on two groups: (i)
the group of 40 active signatories of the CoM-South countries; and (ii) the group of 22
active signatories that have submitted SEAP/SECAP documents and data. The first group
is used to report general descriptive information (e.g. population) of the signatories while
the second group is used to report on the findings from the submitted SEAP/SECAP/BEI
documents and dataset. It should be noted that thirteen additional signatories had their
CoM adhesion placed “on hold”10 and are not therefore included in the assessment. Two
additional cities, Sousse and Kairouan from Tunisia, have submitted SEAPs to the CoM-
South but they are not formally signatories so they are not included in the assessment.
The following Table 2 presents an overview of the signatories considered in the
assessment.
10 A signatory could be voluntary "On hold" (when updating, improving their documentation and asking the JRC
to be in that status), or can be on hold after JRC starts the evaluation and encounter issues preventing the total evaluation. I n this last case, JRC contacts the municipality asking for action addressing the issues.

13
Table 2 Overview of CoM-South signatories considered for the assessment
Country Signatory Population Adhesion Commitments Type
Algeria Batna 350 000 Feb 2014 2020 City Sidi Bel Abbes 300 000 Mar 2014 2020 City Boumerdès 42 500 Nov 2014 2020 City
Israel Ramla 75 000 Feb 2014 2020 City Shfar’Am 40 000 Mar 2014 2020 City Rosh Ha’Ayin Apr 2014 2020 City
Four signatories are not included as their registrations were put on hold: Eilat City (SUDEP), Ma’a lot-Tarshiha, Mi’ilya and Netanya.
Jordan Sahab 160000 Jun 2015 2020 City Irbid 1000000 Jan 2018 2030 Adapt City
Karak 130000 Jan 2018 2030 Adapt City Madaba 150000 Dec 2017 2030 Adapt City Aqaba Sp. Econ. Z. 118000 Nov 2017 2030 Adapt City
Lebanon Menjez 800 Sep 2014 2020/2030/Adapt City Khreibi 3200 Nov 2017 2030 Adapt Borough Moukhtara 950 Nov 2017 2030 Adapt Borough Kawkaba 2500 Mar 2017 2030 Adapt Borough Kherbet Rouha 24800 Feb 2017 2030 Adapt Borough Hasbaya 19000 Dec 2016 2030 Adapt Borough Jezzine 10000 Dec 2016 2030 Adapt City Batloun Shouf 3650 Nov 2016 2030 Adapt Borough Kab Elias – Wadi El
Delm 50000 Nov 2016 2020 Borough Baakline 17000 Apr 2014 2020 City Kabrikha 5000 Oct 2015 2020 City Four signatories are not included as their registrations were put on hold: FMHC (CES-MED), Ardeh,
Kousba and Bechmezzine.
Morocco Salé 903 485 May 2011 2020 City Benslimane 58 194 Oct 2014 2020 City
Agadir 450000 Feb 2014 2020 Urban C. Oujda 477100 Mar 2014 2020 City Chefchaouen 43000 Dec 2015 2020 City Tiznit 76000 Jul 2017 2030/Adapt City Fam El Hisn 6353 Aug 2017 2030/Adapt City Figuig 10872 Aug 2017 2030/Adapt City M’diq 56130 Oct 2017 2030/Adapt City Sefrou 79887 Oct 2017 2030/Adapt City Belfaâ 27592 Sep 2017 2030/Adapt City Drarga 70793 Feb 2018 2030/Adapt City Kénitra (SUDEP) is not included as their registratioin was put on hold.
Palestine Abasan Al-Kabira 30 000 Nov 2013 2020/2030/Adapt City Hebron 163 146 Oct 2014 2020 City Nablus 190 000 May 2015 2020 City
Tulkarm 101 000 Feb 2014 2020 City Three signatories are not included as their registration was put on hold: Gaza, Salfeet and
Ramallah.
Tunisia Sfax 320 000 Feb 2014 2020 Town Hammam-Lif 42 518 Dec 2016 2030/Adapt City One signatory is not included as their registration was put on hold: La Marsa.11
Source: Compiled from submitted and registered signatory profiles as of 15 March 2018 (www.mycovenant.eumayors.eu).
11
In Tunisia, Kairouan participated in the EU-funded CES-MED project and although it is not formally a CoM
signatory, it submitted a SEAP to the CoM. Their registration, however, was put on hold so they are not
included in the assessment review and analysis.

14
2.4 Main Findings and considerations
This section presents the main findings from the review and analysis of the active
Covenant of Mayors-South signatories. Section 2.4.1 presents a general description of
the 40 active CoM-South signatories. Section 2.4.2 focuses on the analysis of the active
CoM-South signatories that have submitted SEAP/SECAP documents (22), including an
overview of the final energy consumption (global and by sectors) and of the GHG
emissions for the reference years of the baseline emissions inventories (BEI). For this
group of 22 signatories, the GHG emissions reductions estimated for the respective
target years are also presented.
Signatories and commitments
The 40 active CoM-South signatories represent a total population of 5,650,470
inhabitants (comparable to the population of Denmark), with an average signatory size of
just over 104 thousand inhabitants.12 Using the same classification as previous JRC
reports13, 75% of signatories can be considered urban areas (with a population density of
at least 300 inhabitants per km2 and a minimum population of 5 000 inhabitants), and
25% can be considered rural. Of the seven CoM-South partner countries, Morocco
presents 12 active signatories, Lebanon has 11, followed by Jordan and Palestine with
five each, Algeria and Israel with three signatories each, and Tunisia with one active
signatory. An overview of the 40 active CoM-South signatories (as of March 2018) is
presented in Annex I.
As discussed previously, more than half of the 40 signatories (22) adhered to the CoM-
South on or after October 2015, which accounts for the reduced number of signatories
with submitted SEAP/SECAP documents at the time of the assessment. It is important to
note that half of the signatories (20) have participated (or participate in) one of the
projects funded by the EU to support local authorities: Sustainable Urban Demonstration
Projects-South (SUDEP-South) and Cleaner Energy-Saving Mediterranean Cities (CES-
MED). The relevance of this is discussed further in Section 4 of the report.
Sustainable Energy Action Plans / Sustainable Energy and Climate Action
Plans
This section focuses on the 22 active signatories that have submitted SEAP/SECAP
documents and online templates. Two of the signatories, Karak and Aqaba Special
Economic Zone from Jordan, have already submitted SECAP documents, despite having
adhered to the CoM recently, in January 2018 and November 2017, respectively. The
other 20 signatories have submitted SEAP and BEI documents.
2.4.1.1 Final energy consumptions in baseline emissions inventories
After correcting for inconsistencies in the original dataset, total final energy consumption
reported by the 22 signatories is 23.217 TWh/year. This value represents less than 1%
of the total energy consumption reported by 5403 signatories considered in the JRC 2017
assessment.14 As discussed in Section 2.4.2.5 of the report, this aggregated total takes
into account the treated/corrected dataset for energy consumption that is presented in
Annex III.
The primary sources of energy reported by the CoM-Signatories in their inventories are
automotive fuels, representing a combined percentage of 43.8% (30.7% for diesel and
13.1% for gasoline), followed by electricity (22.4%), natural gas (16.6%), liquid gas
(12.8%), heating oil (2.6%) and solar thermal (1.2%). Energy consumption from other
sources such as coal, other fossil fuels, biomass or non-allocated sources represented
12 This excludes the two largest cities with populations close to 1 million inhabitants and two signatories with
fewer than 1000 inhabitants. 13 Kona et al., 2017 14 Ibid.
15
less than 1% for each source. None of the CoM-South signatories reported energy
consumption from lignite, plant oil, biofuel or geothermal sources (Annex III).
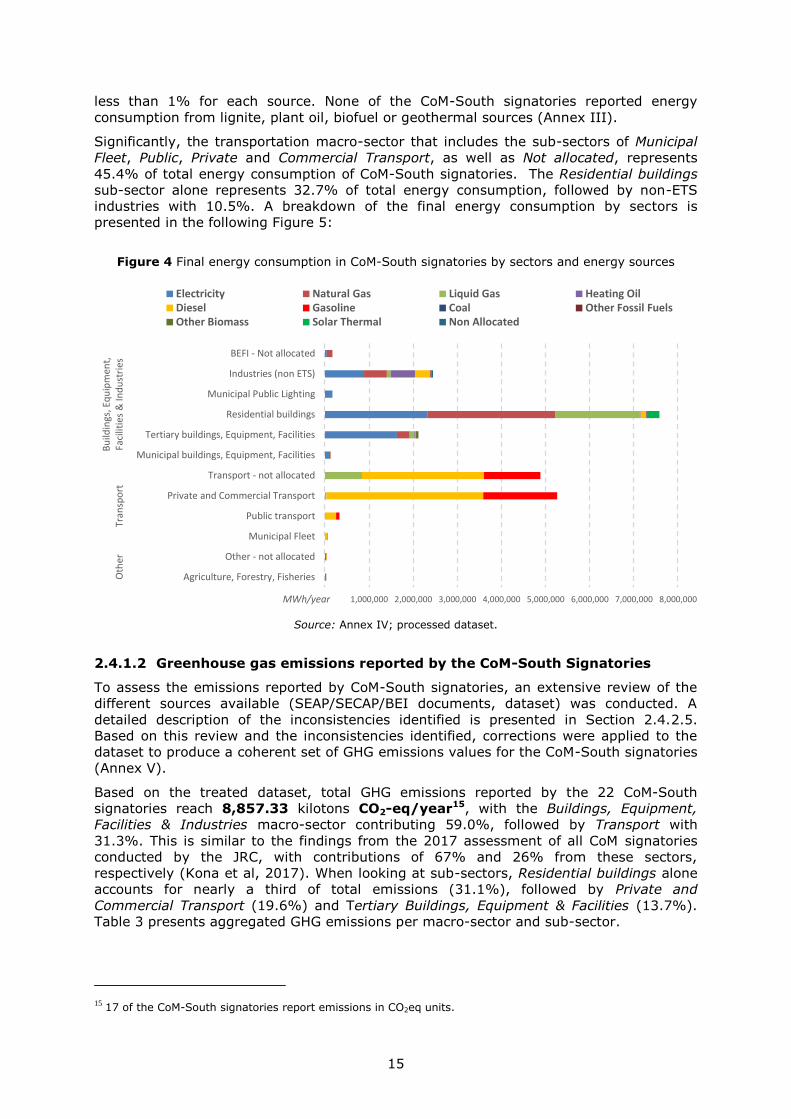
Significantly, the transportation macro-sector that includes the sub-sectors of Municipal
Fleet, Public, Private and Commercial Transport, as well as Not allocated, represents
45.4% of total energy consumption of CoM-South signatories. The Residential buildings
sub-sector alone represents 32.7% of total energy consumption, followed by non-ETS
industries with 10.5%. A breakdown of the final energy consumption by sectors is
presented in the following Figure 5:
Figure 4 Final energy consumption in CoM-South signatories by sectors and energy sources
Source: Annex IV; processed dataset.
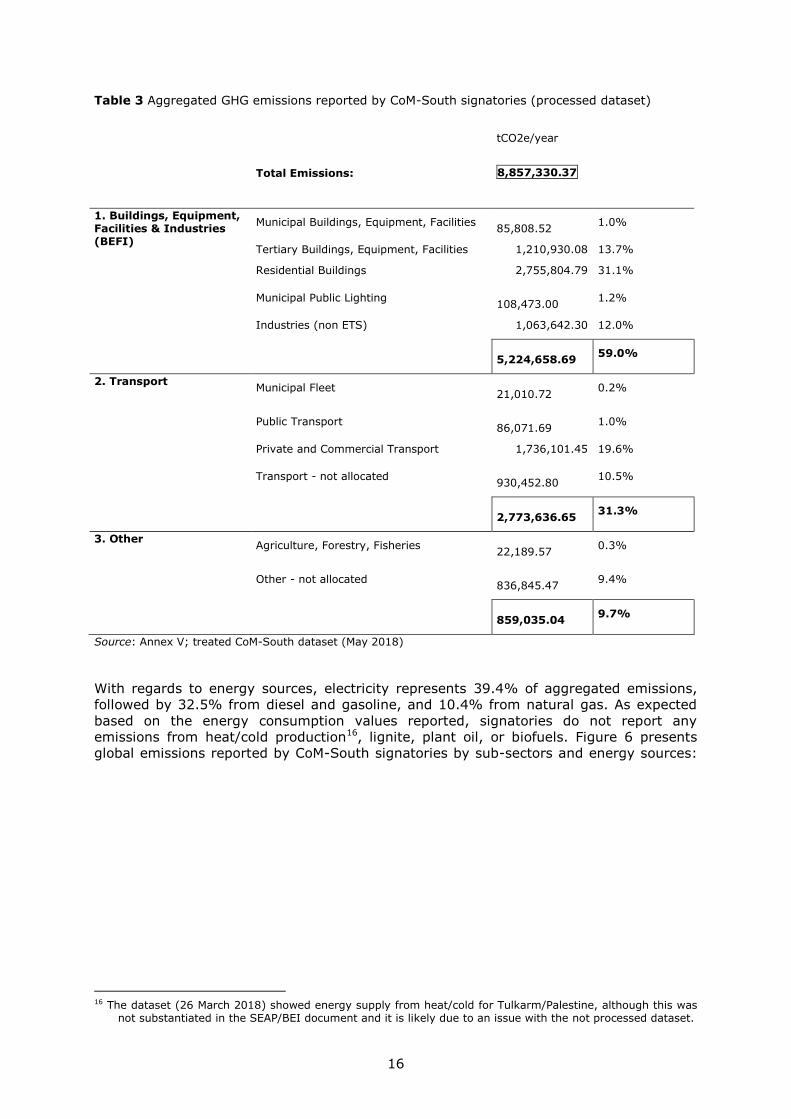
2.4.1.2 Greenhouse gas emissions reported by the CoM-South Signatories
To assess the emissions reported by CoM-South signatories, an extensive review of the
different sources available (SEAP/SECAP/BEI documents, dataset) was conducted. A
detailed description of the inconsistencies identified is presented in Section 2.4.2.5.
Based on this review and the inconsistencies identified, corrections were applied to the
dataset to produce a coherent set of GHG emissions values for the CoM-South signatories
(Annex V).
Based on the treated dataset, total GHG emissions reported by the 22 CoM-South
signatories reach 8,857.33 kilotons CO2-eq/year15, with the Buildings, Equipment,
Facilities & Industries macro-sector contributing 59.0%, followed by Transport with
31.3%. This is similar to the findings from the 2017 assessment of all CoM signatories
conducted by the JRC, with contributions of 67% and 26% from these sectors,
respectively (Kona et al, 2017). When looking at sub-sectors, Residential buildings alone
accounts for nearly a third of total emissions (31.1%), followed by Private and
Commercial Transport (19.6%) and Tertiary Buildings, Equipment & Facilities (13.7%).
Table 3 presents aggregated GHG emissions per macro-sector and sub-sector.
15 17 of the CoM-South signatories report emissions in CO2eq units.
0 1,000,000 2,000,000 3,000,000 4,000,000 5,000,000 6,000,000 7,000,000 8,000,000
Agriculture, Forestry, Fisheries
Other - not allocated
Municipal Fleet
Public transport
Private and Commercial Transport
Transport - not allocated
Municipal buildings, Equipment, Facilities
Tertiary buildings, Equipment, Facilities
Residential buildings
Municipal Public Lighting
Industries (non ETS)
BEFI - Not allocated
Oth
erTr
ansp
ort
Bu
ildin
gs, E
qu
ipm
ent,
Faci
litie
s &
Ind
ust
ries
MWh/year
Electricity Natural Gas Liquid Gas Heating OilDiesel Gasoline Coal Other Fossil FuelsOther Biomass Solar Thermal Non Allocated
16
Table 3 Aggregated GHG emissions reported by CoM-South signatories (processed dataset)
tCO2e/year
Total Emissions:
8,857,330.37
1. Buildings, Equipment, Facilities & Industries (BEFI)
Municipal Buildings, Equipment, Facilities 85,808.52
1.0%
Tertiary Buildings, Equipment, Facilities 1,210,930.08 13.7%
Residential Buildings 2,755,804.79 31.1%
Municipal Public Lighting 108,473.00
1.2%
Industries (non ETS) 1,063,642.30 12.0%
5,224,658.69
59.0%
2. Transport Municipal Fleet
21,010.72
0.2%
Public Transport 86,071.69
1.0%
Private and Commercial Transport 1,736,101.45 19.6%
Transport - not allocated 930,452.80
10.5%
2,773,636.65
31.3%
3. Other Agriculture, Forestry, Fisheries
22,189.57
0.3%
Other - not allocated 836,845.47
9.4%
859,035.04
9.7%
Source: Annex V; treated CoM-South dataset (May 2018)
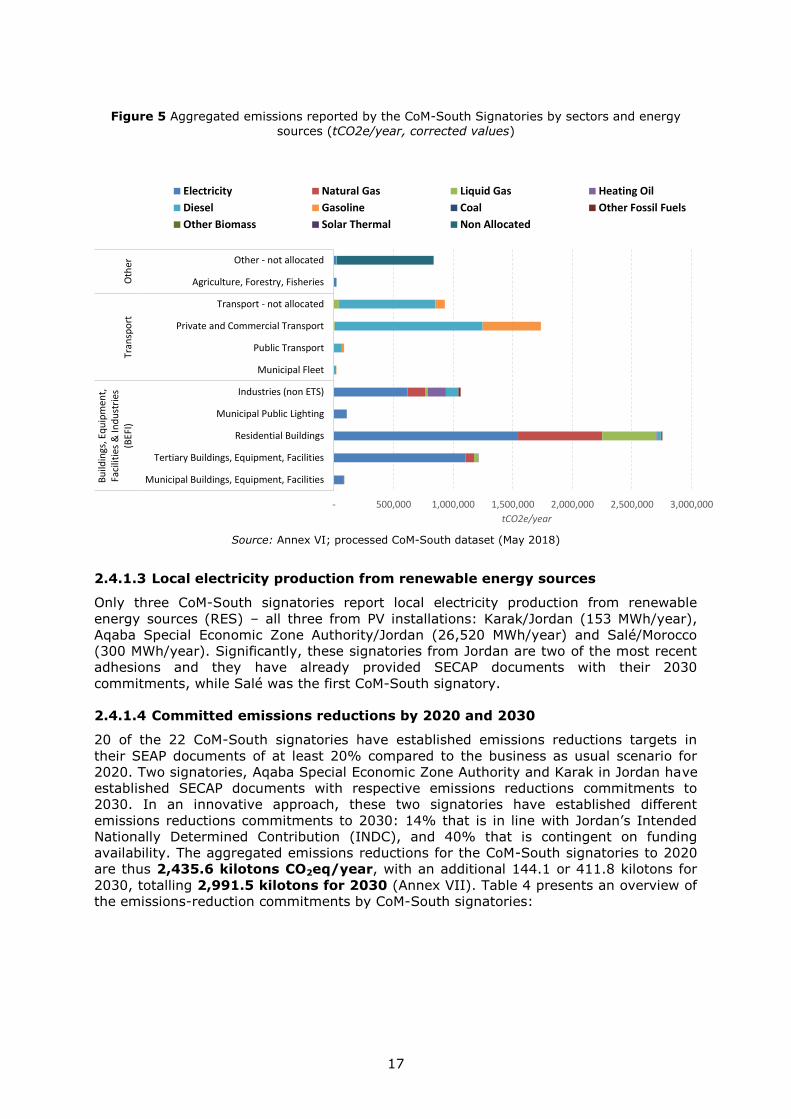
With regards to energy sources, electricity represents 39.4% of aggregated emissions,
followed by 32.5% from diesel and gasoline, and 10.4% from natural gas. As expected
based on the energy consumption values reported, signatories do not report any
emissions from heat/cold production16, lignite, plant oil, or biofuels. Figure 6 presents
global emissions reported by CoM-South signatories by sub-sectors and energy sources:
16 The dataset (26 March 2018) showed energy supply from heat/cold for Tulkarm/Palestine, although this was
not substantiated in the SEAP/BEI document and it is likely due to an issue with the not processed dataset.
17
Figure 5 Aggregated emissions reported by the CoM-South Signatories by sectors and energy
sources (tCO2e/year, corrected values)
Source: Annex VI; processed CoM-South dataset (May 2018)
2.4.1.3 Local electricity production from renewable energy sources
Only three CoM-South signatories report local electricity production from renewable
energy sources (RES) – all three from PV installations: Karak/Jordan (153 MWh/year),
Aqaba Special Economic Zone Authority/Jordan (26,520 MWh/year) and Salé/Morocco
(300 MWh/year). Significantly, these signatories from Jordan are two of the most recent
adhesions and they have already provided SECAP documents with their 2030
commitments, while Salé was the first CoM-South signatory.
2.4.1.4 Committed emissions reductions by 2020 and 2030
20 of the 22 CoM-South signatories have established emissions reductions targets in
their SEAP documents of at least 20% compared to the business as usual scenario for
2020. Two signatories, Aqaba Special Economic Zone Authority and Karak in Jordan have
established SECAP documents with respective emissions reductions commitments to
2030. In an innovative approach, these two signatories have established different
emissions reductions commitments to 2030: 14% that is in line with Jordan’s Intended
Nationally Determined Contribution (INDC), and 40% that is contingent on funding
availability. The aggregated emissions reductions for the CoM-South signatories to 2020
are thus 2,435.6 kilotons CO2eq/year, with an additional 144.1 or 411.8 kilotons for
2030, totalling 2,991.5 kilotons for 2030 (Annex VII). Table 4 presents an overview of
the emissions-reduction commitments by CoM-South signatories:
- 500,000 1,000,000 1,500,000 2,000,000 2,500,000 3,000,000
Municipal Buildings, Equipment, Facilities
Tertiary Buildings, Equipment, Facilities
Residential Buildings
Municipal Public Lighting
Industries (non ETS)
Municipal Fleet
Public Transport
Private and Commercial Transport
Transport - not allocated
Agriculture, Forestry, Fisheries
Other - not allocated
Bu
ildin
gs, E
qu
ipm
ent,
Faci
litie
s &
Ind
ust
ries
(BEF
I)Tr
ansp
ort
Oth
er
tCO2e/year
Electricity Natural Gas Liquid Gas Heating Oil
Diesel Gasoline Coal Other Fossil Fuels
Other Biomass Solar Thermal Non Allocated

18
Table 4 Emissions-reduction commitments by CoM-South signatories
Source: Annex VII; SEAP/SECAP documents
Based on the quantification of actions and measures presented by CoM-South signatories
in their SEAP/SECAP documents, the Buildings, Equipment, Facilities & Industries (BEFI)
macro-sector accounts for half (49.5%) of all of the expected emissions reductions
followed by the Transport sector with 23.8% of expected reductions. Not surprisingly, the
actions focusing on the Residential Buildings sub-sector account for 22.1% of all
expected emissions reductions, followed by the Tertiary Buildings, Equipment & Facilities
sub-sector with 11.3%. It is important to note that although assets controlled directly by
local authorities (i.e. Municipal Buildings, Equipment & Facilities, Municipal Fleet and
Municipal Public Lighting) account for only 2.4% of global emissions, signatories have
committed to actions that will account for 7.8% of their total emissions targets. As
discussed further in Section 4 of this report, this is coherent with a strategy by the local
authorities to “lead by example” in the energy management of their assets.
With regards to expected energy savings, CoM-South signatories report that more than
two thirds (68.6%) of total energy savings will come from measures in the BEFI macro-
sector, followed by energy savings of 30.9% in the Transport sector (Annex VIII).
Significantly, expected energy savings in the Residential Buildings sub-sector account for
40.3%, while savings in the Tertiary Building, Equipment & Facilities sub-sector account
for only 12.9%. Energy savings provided by measures focused on the Industries sub-
sector account for only 10.3% of total savings, which is commensurate with the
economic profiles of CoM-South signatories, as well as more limits on their direct
influence in this sub-sector. The following Table 5 presents an overview of the shares of
estimated GHG emission reductions, by macro-sectors and sub-sectors, as well as
estimated costs (EUR), energy savings targets:
Country Signatory Adhesion CommitmentsSEAP/
SECAP
Emissions
Reduction(tCO2-tCO2eq/yr)
Additional
ReductionsTarget Notes
1 Morocco Salé May-11 2020 SEAP 547,767.2 20.0% on 2020 BAU projection2 Palestine Abasan Al-Kabira Nov-13; Jul- 2020/2030/Adap SEAP 8,511.3 30.0% on 2020 BAU projection3 Tunisia Sfax Feb-14 2020 SEAP 257,129.0 20.0% on 2020 BAU projection4 Israel Rosh Ha'Ayin Apr-14 2020 SEAP 73,963.7 20.0% on 2020 BAU projection5 Israel Ramla Feb-14 2020 SEAP 231,954.3 20.0% on 2020 BAU projection6 Morocco Agadir Feb-14 2020 SEAP 234,116.0 20.8% on 2020 BAU projection7 Israel Shefa-Amer Mar-14 2020 SEAP 27,966.7 20.0% on 2020 BAU projection8 Morocco Oujda Mar-14 2020 SEAP 155,956.0 20.3% on 2020 BAU projection9 Algeria Batna Feb-14 2020 SEAP 347,422.0 20.3% on 2020 BAU projection
10 Lebanon Menjez Sep-14 2020 SEAP 375.0 25.0% on 2020 BAU projection11 Lebanon Baakline Apr-14 2020 SEAP 8,139.0 25.0% on 2020 BAU projection12 Palestine Hebron Oct-14 2020 SEAP 113,040.0 20.0% on 2020 BAU projection13 Algeria Sidi Bel Abbes Mar-14 2020 SEAP 170,753.0 20.1% on 2020 BAU projection
14 Morocco Benslimane Oct-14 2020 SEAP 20,278.0 20.0% on 2020 BAU projection15 Palestine Nablus May-15 2020 SEAP 100,171.0 20.0% on 2020 BAU projection16 Jordan Sahab Jun-15 2020 SEAP 18,411.0 53,791.0 5%/14% on 2020/2030 BAU projections17 Algeria Boumerdès Nov-14 2020 SEAP 36,075.0 20.1% on 2020 BAU projection18 Morocco Chefchaouen Dec-15 2020 SEAP 18,863.4 21.0% on 2020 BAU projection19 Palestine Tulkarm Feb-14 2020 SEAP 47,419.0 20.0% on 2020 BAU projection20 Lebanon Kab Elias – Wadi El Delm Nov-16 2020 SEAP 17,272.0 26.0% on 2020 BAU projection
2,435,582.6
21 Jordan Aqaba Special Economic Nov-17 2030 Adapt SECAP 85,122.9 243,208.2 14%/40% to 2030, INDC and contingent
22 Jordan Karak Jan-18 2030 Adapt SECAP 59,009.8 168,599.3 14%/40% to 2030, INDC and contingent
144,132.6 411,807.5
2,579,715.2 2,991,522.7
19
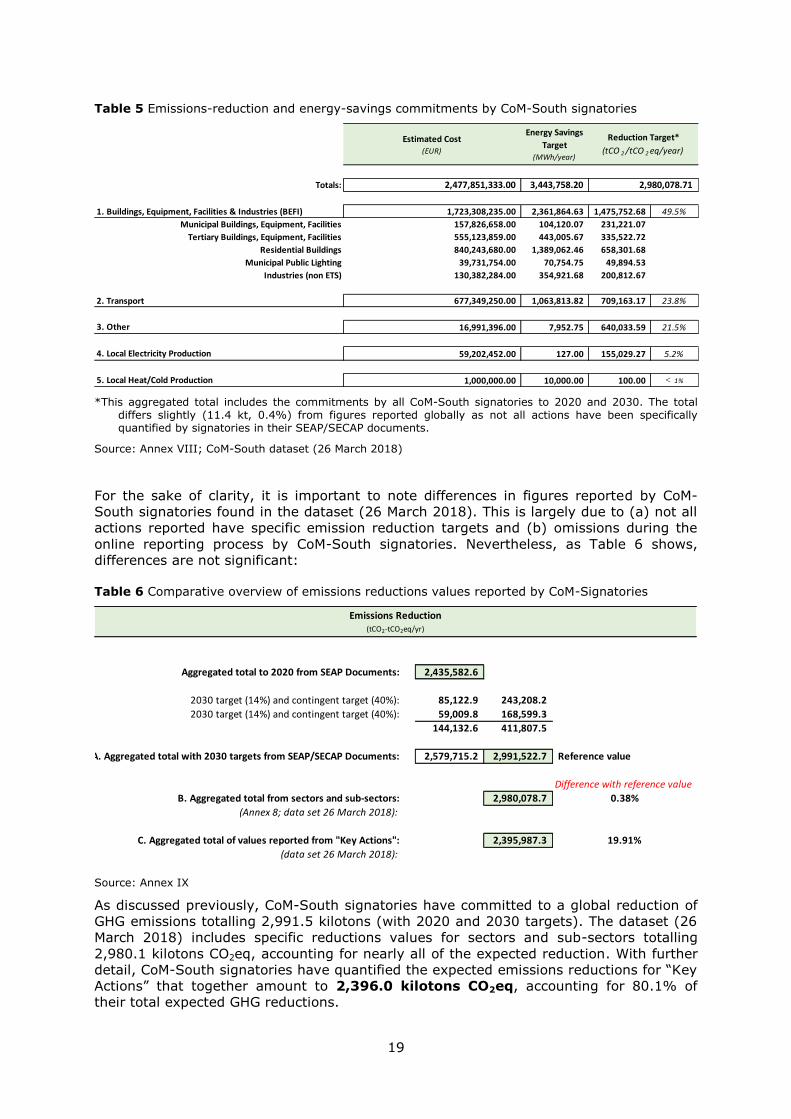
Table 5 Emissions-reduction and energy-savings commitments by CoM-South signatories
*This aggregated total includes the commitments by all CoM-South signatories to 2020 and 2030. The total differs slightly (11.4 kt, 0.4%) from figures reported globally as not all actions have been specifically quantified by signatories in their SEAP/SECAP documents.
Source: Annex VIII; CoM-South dataset (26 March 2018)
For the sake of clarity, it is important to note differences in figures reported by CoM-
South signatories found in the dataset (26 March 2018). This is largely due to (a) not all
actions reported have specific emission reduction targets and (b) omissions during the
online reporting process by CoM-South signatories. Nevertheless, as Table 6 shows,
differences are not significant:
Table 6 Comparative overview of emissions reductions values reported by CoM-Signatories
Source: Annex IX
As discussed previously, CoM-South signatories have committed to a global reduction of
GHG emissions totalling 2,991.5 kilotons (with 2020 and 2030 targets). The dataset (26
March 2018) includes specific reductions values for sectors and sub-sectors totalling
2,980.1 kilotons CO2eq, accounting for nearly all of the expected reduction. With further
detail, CoM-South signatories have quantified the expected emissions reductions for “Key
Actions” that together amount to 2,396.0 kilotons CO2eq, accounting for 80.1% of
their total expected GHG reductions.
Estimated Cost(EUR)
Energy Savings
Target(MWh/year)
Totals: 2,477,851,333.00 3,443,758.20
1. Buildings, Equipment, Facilities & Industries (BEFI) 1,723,308,235.00 2,361,864.63 1,475,752.68 49.5%
Municipal Buildings, Equipment, Facilities 157,826,658.00 104,120.07 231,221.07
Tertiary Buildings, Equipment, Facilities 555,123,859.00 443,005.67 335,522.72
Residential Buildings 840,243,680.00 1,389,062.46 658,301.68
Municipal Public Lighting 39,731,754.00 70,754.75 49,894.53
Industries (non ETS) 130,382,284.00 354,921.68 200,812.67
2. Transport 677,349,250.00 1,063,813.82 709,163.17 23.8%
3. Other 16,991,396.00 7,952.75 640,033.59 21.5%
4. Local Electricity Production 59,202,452.00 127.00 155,029.27 5.2%
5. Local Heat/Cold Production 1,000,000.00 10,000.00 100.00 < 1%
Reduction Target*
(tCO 2 /tCO 2 eq/year)
2,980,078.71
Aggregated total to 2020 from SEAP Documents: 2,435,582.6
2030 target (14%) and contingent target (40%): 85,122.9 243,208.2
2030 target (14%) and contingent target (40%): 59,009.8 168,599.3
144,132.6 411,807.5
A. Aggregated total with 2030 targets from SEAP/SECAP Documents: 2,579,715.2 2,991,522.7 Reference value
Difference with reference value
B. Aggregated total from sectors and sub-sectors: 2,980,078.7 0.38%
(Annex 8; data set 26 March 2018):
C. Aggregated total of values reported from "Key Actions": 2,395,987.3 19.91%
(data set 26 March 2018):
Emissions Reduction(tCO2-tCO2eq/yr)
20
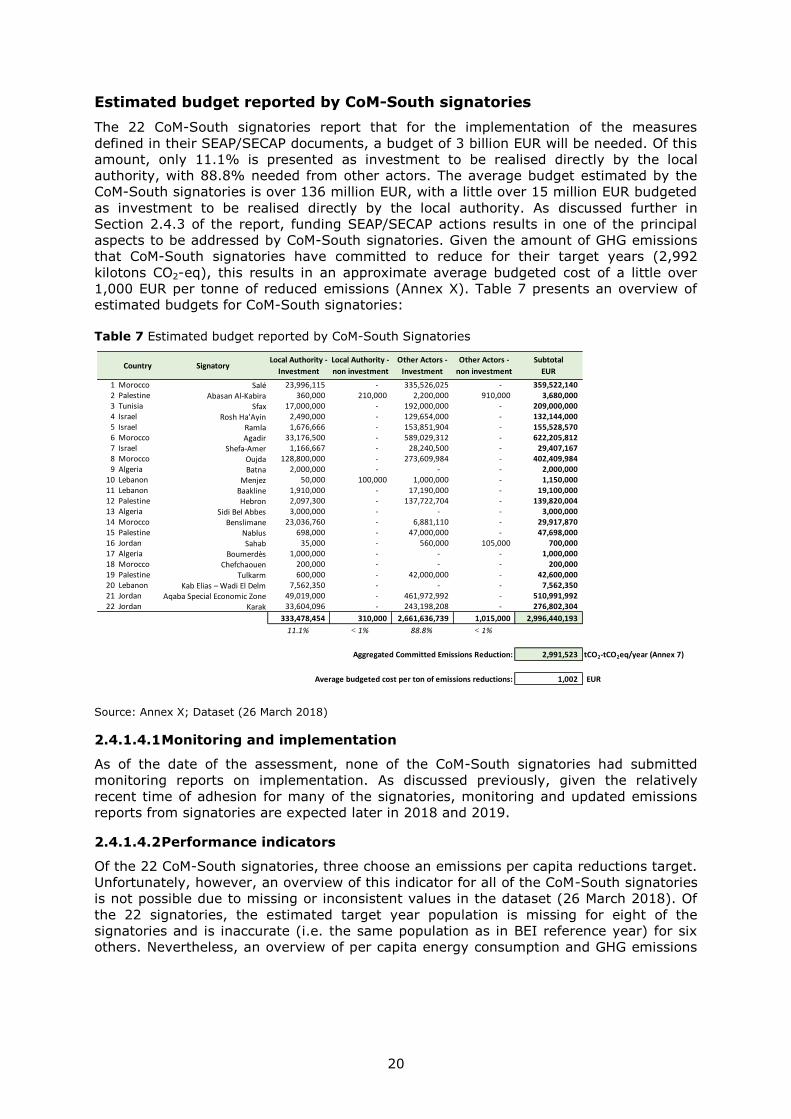
Estimated budget reported by CoM-South signatories
The 22 CoM-South signatories report that for the implementation of the measures
defined in their SEAP/SECAP documents, a budget of 3 billion EUR will be needed. Of this
amount, only 11.1% is presented as investment to be realised directly by the local
authority, with 88.8% needed from other actors. The average budget estimated by the
CoM-South signatories is over 136 million EUR, with a little over 15 million EUR budgeted
as investment to be realised directly by the local authority. As discussed further in
Section 2.4.3 of the report, funding SEAP/SECAP actions results in one of the principal
aspects to be addressed by CoM-South signatories. Given the amount of GHG emissions
that CoM-South signatories have committed to reduce for their target years (2,992
kilotons CO2-eq), this results in an approximate average budgeted cost of a little over
1,000 EUR per tonne of reduced emissions (Annex X). Table 7 presents an overview of
estimated budgets for CoM-South signatories:
Table 7 Estimated budget reported by CoM-South Signatories
Source: Annex X; Dataset (26 March 2018)
2.4.1.4.1 Monitoring and implementation
As of the date of the assessment, none of the CoM-South signatories had submitted
monitoring reports on implementation. As discussed previously, given the relatively
recent time of adhesion for many of the signatories, monitoring and updated emissions
reports from signatories are expected later in 2018 and 2019.
2.4.1.4.2 Performance indicators
Of the 22 CoM-South signatories, three choose an emissions per capita reductions target.
Unfortunately, however, an overview of this indicator for all of the CoM-South signatories
is not possible due to missing or inconsistent values in the dataset (26 March 2018). Of
the 22 signatories, the estimated target year population is missing for eight of the
signatories and is inaccurate (i.e. the same population as in BEI reference year) for six
others. Nevertheless, an overview of per capita energy consumption and GHG emissions
Country SignatoryLocal Authority -
Investment
Local Authority -
non investment
Other Actors -
Investment
Other Actors -
non investment
Subtotal
EUR
1 Morocco Salé 23,996,115 - 335,526,025 - 359,522,140 2 Palestine Abasan Al-Kabira 360,000 210,000 2,200,000 910,000 3,680,000 3 Tunisia Sfax 17,000,000 - 192,000,000 - 209,000,000 4 Israel Rosh Ha'Ayin 2,490,000 - 129,654,000 - 132,144,000 5 Israel Ramla 1,676,666 - 153,851,904 - 155,528,570 6 Morocco Agadir 33,176,500 - 589,029,312 - 622,205,812 7 Israel Shefa-Amer 1,166,667 - 28,240,500 - 29,407,167 8 Morocco Oujda 128,800,000 - 273,609,984 - 402,409,984 9 Algeria Batna 2,000,000 - - - 2,000,000
10 Lebanon Menjez 50,000 100,000 1,000,000 - 1,150,000 11 Lebanon Baakline 1,910,000 - 17,190,000 - 19,100,000 12 Palestine Hebron 2,097,300 - 137,722,704 - 139,820,004 13 Algeria Sidi Bel Abbes 3,000,000 - - - 3,000,000 14 Morocco Benslimane 23,036,760 - 6,881,110 - 29,917,870 15 Palestine Nablus 698,000 - 47,000,000 - 47,698,000 16 Jordan Sahab 35,000 - 560,000 105,000 700,000 17 Algeria Boumerdès 1,000,000 - - - 1,000,000 18 Morocco Chefchaouen 200,000 - - - 200,000 19 Palestine Tulkarm 600,000 - 42,000,000 - 42,600,000 20 Lebanon Kab Elias – Wadi El Delm 7,562,350 - - - 7,562,350 21 Jordan Aqaba Special Economic Zone 49,019,000 - 461,972,992 - 510,991,992 22 Jordan Karak 33,604,096 - 243,198,208 - 276,802,304
333,478,454 310,000 2,661,636,739 1,015,000 2,996,440,193
11.1% < 1% 88.8% < 1%
Aggregated Committed Emissions Reduction: 2,991,523 tCO2-tCO2eq/year (Annex 7)
Average budgeted cost per ton of emissions reductions: 1,002 EUR
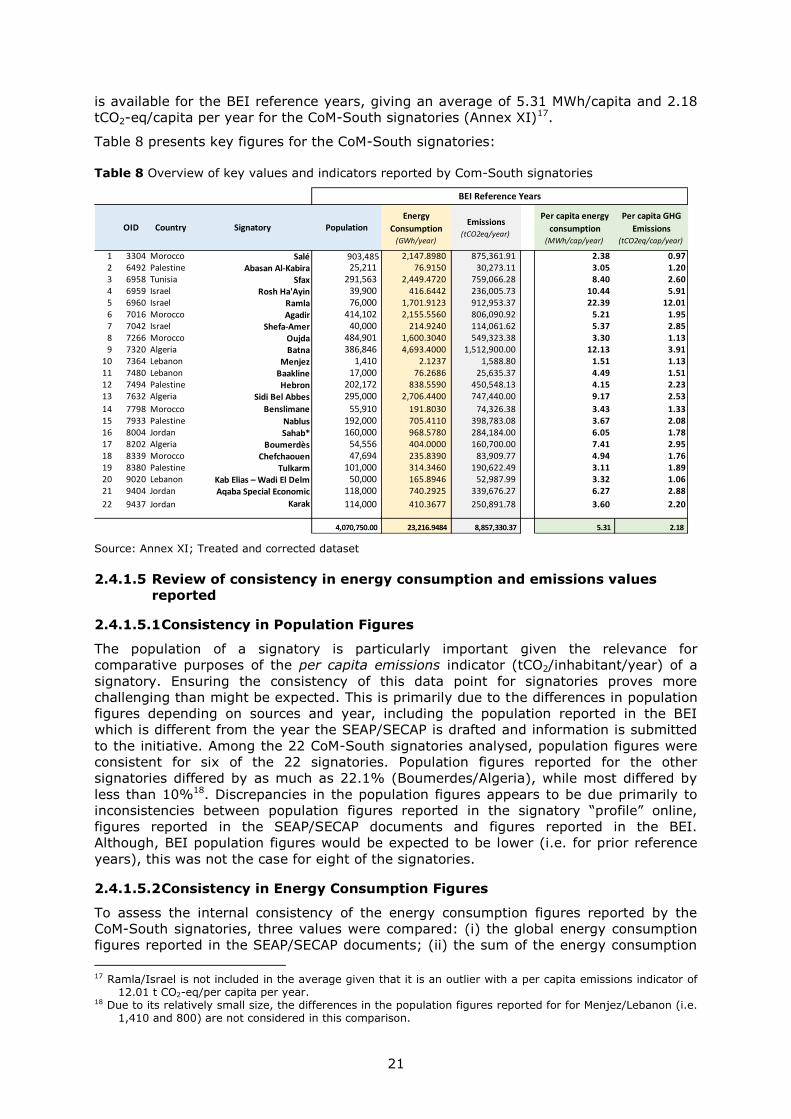
21
is available for the BEI reference years, giving an average of 5.31 MWh/capita and 2.18
tCO2-eq/capita per year for the CoM-South signatories (Annex XI)17.
Table 8 presents key figures for the CoM-South signatories:
Table 8 Overview of key values and indicators reported by Com-South signatories
Source: Annex XI; Treated and corrected dataset
2.4.1.5 Review of consistency in energy consumption and emissions values
reported
2.4.1.5.1 Consistency in Population Figures
The population of a signatory is particularly important given the relevance for
comparative purposes of the per capita emissions indicator (tCO2/inhabitant/year) of a
signatory. Ensuring the consistency of this data point for signatories proves more
challenging than might be expected. This is primarily due to the differences in population
figures depending on sources and year, including the population reported in the BEI
which is different from the year the SEAP/SECAP is drafted and information is submitted
to the initiative. Among the 22 CoM-South signatories analysed, population figures were
consistent for six of the 22 signatories. Population figures reported for the other
signatories differed by as much as 22.1% (Boumerdes/Algeria), while most differed by
less than 10%18. Discrepancies in the population figures appears to be due primarily to
inconsistencies between population figures reported in the signatory “profile” online,
figures reported in the SEAP/SECAP documents and figures reported in the BEI.
Although, BEI population figures would be expected to be lower (i.e. for prior reference
years), this was not the case for eight of the signatories.
2.4.1.5.2 Consistency in Energy Consumption Figures
To assess the internal consistency of the energy consumption figures reported by the
CoM-South signatories, three values were compared: (i) the global energy consumption
figures reported in the SEAP/SECAP documents; (ii) the sum of the energy consumption
17 Ramla/Israel is not included in the average given that it is an outlier with a per capita emissions indicator of
12.01 t CO2-eq/per capita per year. 18 Due to its relatively small size, the differences in the population figures reported for for Menjez/Lebanon (i.e.
1,410 and 800) are not considered in this comparison.
OID Country Signatory PopulationEnergy
Consumption(GWh/year)
Emissions(tCO2eq/year)
Per capita energy
consumption(MWh/cap/year)
Per capita GHG
Emissions(tCO2eq/cap/year)
1 3304 Morocco Salé 903,485 2,147.8980 875,361.91 2.38 0.972 6492 Palestine Abasan Al-Kabira 25,211 76.9150 30,273.11 3.05 1.203 6958 Tunisia Sfax 291,563 2,449.4720 759,066.28 8.40 2.604 6959 Israel Rosh Ha'Ayin 39,900 416.6442 236,005.73 10.44 5.915 6960 Israel Ramla 76,000 1,701.9123 912,953.37 22.39 12.016 7016 Morocco Agadir 414,102 2,155.5560 806,090.92 5.21 1.957 7042 Israel Shefa-Amer 40,000 214.9240 114,061.62 5.37 2.858 7266 Morocco Oujda 484,901 1,600.3040 549,323.38 3.30 1.139 7320 Algeria Batna 386,846 4,693.4000 1,512,900.00 12.13 3.91
10 7364 Lebanon Menjez 1,410 2.1237 1,588.80 1.51 1.1311 7480 Lebanon Baakline 17,000 76.2686 25,635.37 4.49 1.5112 7494 Palestine Hebron 202,172 838.5590 450,548.13 4.15 2.2313 7632 Algeria Sidi Bel Abbes 295,000 2,706.4400 747,440.00 9.17 2.53
14 7798 Morocco Benslimane 55,910 191.8030 74,326.38 3.43 1.3315 7933 Palestine Nablus 192,000 705.4110 398,783.08 3.67 2.0816 8004 Jordan Sahab* 160,000 968.5780 284,184.00 6.05 1.7817 8202 Algeria Boumerdès 54,556 404.0000 160,700.00 7.41 2.9518 8339 Morocco Chefchaouen 47,694 235.8390 83,909.77 4.94 1.7619 8380 Palestine Tulkarm 101,000 314.3460 190,622.49 3.11 1.8920 9020 Lebanon Kab Elias – Wadi El Delm 50,000 165.8946 52,987.99 3.32 1.0621 9404 Jordan Aqaba Special Economic 118,000 740.2925 339,676.27 6.27 2.88
22 9437 Jordan Karak 114,000 410.3677 250,891.78 3.60 2.20
4,070,750.00 23,216.9484 8,857,330.37 5.31 2.18
BEI Reference Years

22
figures reported for individual sectors and subsectors in the SEAP/SECAP documents; and
(iii) the data reported in the online table formats for which the primary source was the 26
March 2018 dataset. The results of the comparative review of these values for CoM-
South signatories are presented in Annex XII and can be summarised as follows:
Minor inconsistencies were found in specific SEAP/SECAP documents with regards
to the global energy consumption values compared with the sum of individual
sectors and subsectors (in the same documents) for five of the signatories:
Salé/Morocco (difference of 7.7%), Sfax/Tunisia (0.1%), Menjez/Lebanon
(10.6%), and Boumerdès/Algeria (0.2%)19. In all five cases, global energy
consumption figures reported were higher than the sum of values for individual
sectors and subsectors.
Taken as a group, the inconsistencies become insignificant: the difference in the
total energy consumption figures is 168.1 GWh/year with a total of 22,526
GWh/year reported in global figures for all 22 CoM-South signatories, compared
with 22,357.9 GWh/year calculated as the sum of figures for individual
sectors/subsectors. Globally, the discrepancy represents less than 1% of total
energy consumptions figures for all 22 CoM-South signatories. Nevertheless, in
cases where the difference is greater than 5% for an individual signatory, the
discrepancies should be addressed by the signatories.
Comparing energy consumption figures for individual sectors/subsectors in the
SEAP/SECAP documents with those reported in the online templates (i.e. 26 March
2018 dataset), discrepancies were identified for the following signatories:
Batna/Algeria (0.4%), Menjez/Lebanon (14.2%), Sidi Bel Abbes/Algeria (24.5%),
Boumerdès/Algeria (1.0%) and Sahab/Jordan (3,757.5%).
2.4.1.5.3 Signatory-specific review of energy consumption figures and examples
of corrections in treated dataset
Jordan
Sahab: Energy consumption values reported in the dataset for this signatory
(OID 8004) differ significantly from the values reported in the SEAP/BEI document
submitted. The sum of values reported in the dataset represent only 2.6% of the
values total values reported in the SEAP/BEI document. This is likely due to the
negative values recorded in the Sahab/Jordan dataset and to an overall issue with
the inputting of the data into the CoM online format. There are also values
reported for “Industry (ETS)” although this is not present in the SEAP/BEI
document. It would be useful to have the signatory re-input their values online
and to ensure coherence with the SEAP/BEI document. Given the large
discrepancy in energy consumption figures for Sahab/Jordan, a comparative
review of values from the SEAP/BEI documents and the dataset (26 March 2018)
is presented in Annexe XIII.
Another issue in the energy consumption values reported by this signatory is the
lack of specific values for assets controlled directly by the municipality, besides
public lighting, such as municipal buildings, water management installations and
the municipal vehicle fleet. These values, which according to the SEAP/BEI
document are 1,811 MWh/year, appear to be included in the tertiary and
transport sector values. In order to include the correct energy consumption values
of Sahab/Jordan in the global assessment, the values reported in the SEAP/BEI
documents are used in the treated dataset (Annex III).
19 Differences smaller than 0.01% are not considered as significant.
23
Algeria
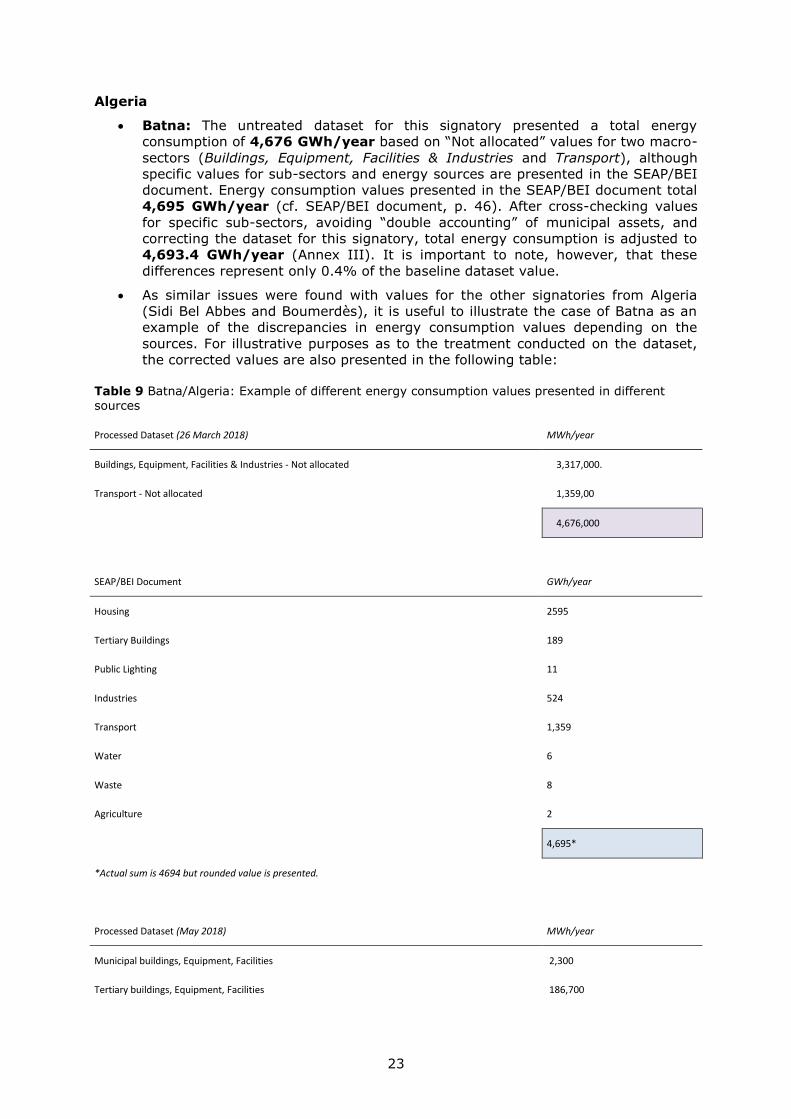
Batna: The untreated dataset for this signatory presented a total energy
consumption of 4,676 GWh/year based on “Not allocated” values for two macro-
sectors (Buildings, Equipment, Facilities & Industries and Transport), although
specific values for sub-sectors and energy sources are presented in the SEAP/BEI
document. Energy consumption values presented in the SEAP/BEI document total
4,695 GWh/year (cf. SEAP/BEI document, p. 46). After cross-checking values
for specific sub-sectors, avoiding “double accounting” of municipal assets, and
correcting the dataset for this signatory, total energy consumption is adjusted to
4,693.4 GWh/year (Annex III). It is important to note, however, that these
differences represent only 0.4% of the baseline dataset value.
As similar issues were found with values for the other signatories from Algeria
(Sidi Bel Abbes and Boumerdès), it is useful to illustrate the case of Batna as an
example of the discrepancies in energy consumption values depending on the
sources. For illustrative purposes as to the treatment conducted on the dataset,
the corrected values are also presented in the following table:
Table 9 Batna/Algeria: Example of different energy consumption values presented in different sources
Processed Dataset (26 March 2018) MWh/year
Buildings, Equipment, Facilities & Industries - Not allocated 3,317,000.
Transport - Not allocated 1,359,00
4,676,000
SEAP/BEI Document GWh/year
Housing 2595
Tertiary Buildings 189
Public Lighting 11
Industries 524
Transport 1,359
Water 6
Waste 8
Agriculture 2
4,695*
*Actual sum is 4694 but rounded value is presented.
Processed Dataset (May 2018) MWh/year
Municipal buildings, Equipment, Facilities 2,300
Tertiary buildings, Equipment, Facilities 186,700

24
Residential buildings 2,594,000
Processed Dataset (26 March 2018) MWh/year
Municipal Public Lighting 11,400
Industries (non ETS) 524,000
Industries (ETS) -
BEFI - Not allocated -
Municipal Fleet 2,600
Public transport -
Private and Commercial Transport -
Transport - not allocated 1,356,400.
Agriculture, Forestry, Fisheries 2,000
Other - not allocated 14,000
4,693,400
Sidi Bel Abbes: In the untreated dataset, the global energy consumption for this
signatory is 2,671 GWh/year based on values included for only two sub-sectors:
Buildings, Equipment, Facilities & Industries – Not allocated and Transport – Not
allocated (Annex XIV). A comparison with the SEAP/BEI document shows that
energy consumption values are available for specific sub-sectors. In the SEAP/BEI
document, a significant inconsistency appears in the values presented for the
Transport sector in the energy consumption summary table (p. 45): a total of 774
GWh/year is presented instead of 1,461.4 GWh/year. This discrepancy also
appears in the summary energy consumption graph (p. 44). In the treated
dataset, energy consumption values are included for specific sub-sectors, taking
care to avoid double accounting of values for municipal assets (e.g. municipal
fleet and public lighting). The total energy consumption value for this signatory
after treatment/correction is 2,706.44 GWh/year, representing a difference of
only 1.3% with the untreated values.
Boumerdès: Energy consumption values were only presented for three
subsectors in the original dataset, although specific values (e.g. municipal
buildings, municipal fleet) are provided in the SEAP/BEI document. A minor yet
relevant aspect illustrated by this signatory relates to the precision of presented
values (i.e. decimal places and rounding of values). Without sufficient precision,
values may appear to be inconsistent by as much as 2 GWh/year due to rounding
issues, as is the case with the summary table presented in the SEAP/BEI
document (p. 44). These issues have been corrected in the treated dataset for
this signatory with total energy consumption of 404 GWh/year.
25
Lebanon
Menjez: A close review of the SEAP/BEI document found that there are
inconsistencies in the figures reported for energy consumption for tertiary
buildings (p. 25) and for the residential buildings sector (p.26). The summary
table presenting BEI results (p. 33) shows inconsistencies in the figures presented
and the total energy consumption figure of 2,016 MWh/year is not
substantiated.
The 358.7 MWh/year of consumption from local electricity production (p. 35) was
not included in the dataset. Energy consumptions from diesel (clearly shown in
the SEAP/BEI document) were included in the “electricity” value in the dataset.
After correcting for these issues in the treated dataset (Annex III), total energy
consumption for Menjez is 2.1237 GWh/year.
2.4.1.5.4 Discrepancies contained within the SEAP/BEI documents for emissions
A review of emissions values reported by CoM-Signatories was conducted based on the
SEAP/BEI documents (global values and cross-checking with the sum of sub-sector
values). Based on this review, inconsistencies were found with four of the CoM-South
signatories, representing an aggregated total difference of 0.7% (60,075 tCO2) for all
four signatories (see Annex XVI)20:
Salé/Morocco: In the SEAP/BEI document for this signatory, a global
emissions value of 875,361.891 tCO2 is reported (cf. SEAP/BEI document, p.
30) while the sum of values for subsectors equals 820,823.126 tCO2,
representing a difference of 6.6% with respect to the lower figure (i.e. sum of
subsectors).
Ramla/Israel: In the emissions summary table in the SEAP/BEI document
(Table 1, p. 13), total emissions are reported as 912,953.07 t CO2 while the
sum of the values for subsectors in the same table is 907,895.37 tCO2,
representing a difference of 0.6% (5,057.7 tCO2).
Menjez/Lebanon: In the Executive Summary of the SEAP/BEI document (p.
2), total emissions are reported as 1,180 tCO2-eq while in the descriptive
emissions tables (pp. 34-36), the emissions values reported for sub-sectors
amount to 1,589.3 t CO2, representing a difference of 29.7% (471.3 t CO2eq).
Boumerdès/Algeria: A minor inconsistency was identified between the
global emissions value reported in the SEAP/BEI document and the sum of
values for individual sub-sectors, 159,000 t CO2 compared with 157,000 tCO2,
representing a difference of only 1.3%.
2.4.1.5.5 Discrepancies between SEAP/BEI documents and the dataset for
emissions
Significant differences were identified for all but five21 of the CoM-South signatories when
comparing the emissions values reported in their SEAP/BEI documents and the dataset
(26 March 2018) produced from the online reporting templates. Overall, a difference of
1,206.56 kilotons CO2/CO2eq was identified between the emissions values in the dataset
and the reported values in the SEAP/BEI documents, representing a global difference of
13.6%. Whilst 7,649.97 kt CO2/CO2eq of emissions are reported in the dataset, the
SEAP/BEI documents report a total of 8,856.52 kt CO2/CO2eq (see Annex XVII).
20 Cases where the rounding of figures resulted in minor differences (i.e. smaller than 0.5% as in the case of
Sidi Bel Abbes/Algeria) are not presented. 21 Differences equal to or less than 0.1% are not considered significant.
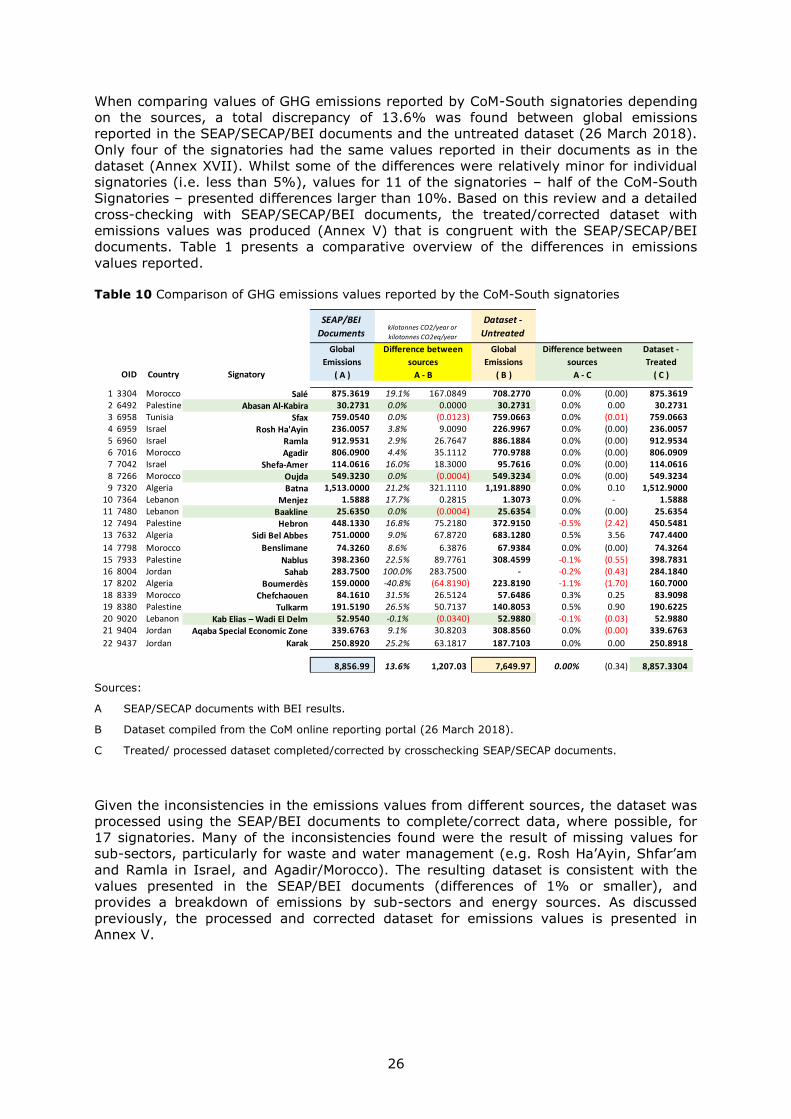
26
When comparing values of GHG emissions reported by CoM-South signatories depending
on the sources, a total discrepancy of 13.6% was found between global emissions
reported in the SEAP/SECAP/BEI documents and the untreated dataset (26 March 2018).
Only four of the signatories had the same values reported in their documents as in the
dataset (Annex XVII). Whilst some of the differences were relatively minor for individual
signatories (i.e. less than 5%), values for 11 of the signatories – half of the CoM-South
Signatories – presented differences larger than 10%. Based on this review and a detailed
cross-checking with SEAP/SECAP/BEI documents, the treated/corrected dataset with
emissions values was produced (Annex V) that is congruent with the SEAP/SECAP/BEI
documents. Table 1 presents a comparative overview of the differences in emissions
values reported.
Table 10 Comparison of GHG emissions values reported by the CoM-South signatories
Sources:
A SEAP/SECAP documents with BEI results.
B Dataset compiled from the CoM online reporting portal (26 March 2018).
C Treated/ processed dataset completed/corrected by crosschecking SEAP/SECAP documents.
Given the inconsistencies in the emissions values from different sources, the dataset was
processed using the SEAP/BEI documents to complete/correct data, where possible, for
17 signatories. Many of the inconsistencies found were the result of missing values for
sub-sectors, particularly for waste and water management (e.g. Rosh Ha’Ayin, Shfar’am
and Ramla in Israel, and Agadir/Morocco). The resulting dataset is consistent with the
values presented in the SEAP/BEI documents (differences of 1% or smaller), and
provides a breakdown of emissions by sub-sectors and energy sources. As discussed
previously, the processed and corrected dataset for emissions values is presented in
Annex V.
SEAP/BEI
Documents
Dataset -
Untreated
OID Country Signatory
Global
Emissions
( A )
Global
Emissions
( B )
Dataset -
Treated
( C )
1 3304 Morocco Salé 875.3619 19.1% 167.0849 708.2770 0.0% (0.00) 875.3619 2 6492 Palestine Abasan Al-Kabira 30.2731 0.0% 0.0000 30.2731 0.0% 0.00 30.2731 3 6958 Tunisia Sfax 759.0540 0.0% (0.0123) 759.0663 0.0% (0.01) 759.0663 4 6959 Israel Rosh Ha'Ayin 236.0057 3.8% 9.0090 226.9967 0.0% (0.00) 236.0057 5 6960 Israel Ramla 912.9531 2.9% 26.7647 886.1884 0.0% (0.00) 912.9534 6 7016 Morocco Agadir 806.0900 4.4% 35.1112 770.9788 0.0% (0.00) 806.0909 7 7042 Israel Shefa-Amer 114.0616 16.0% 18.3000 95.7616 0.0% (0.00) 114.0616 8 7266 Morocco Oujda 549.3230 0.0% (0.0004) 549.3234 0.0% (0.00) 549.3234 9 7320 Algeria Batna 1,513.0000 21.2% 321.1110 1,191.8890 0.0% 0.10 1,512.9000
10 7364 Lebanon Menjez 1.5888 17.7% 0.2815 1.3073 0.0% - 1.5888 11 7480 Lebanon Baakline 25.6350 0.0% (0.0004) 25.6354 0.0% (0.00) 25.6354 12 7494 Palestine Hebron 448.1330 16.8% 75.2180 372.9150 -0.5% (2.42) 450.5481 13 7632 Algeria Sidi Bel Abbes 751.0000 9.0% 67.8720 683.1280 0.5% 3.56 747.4400
14 7798 Morocco Benslimane 74.3260 8.6% 6.3876 67.9384 0.0% (0.00) 74.3264 15 7933 Palestine Nablus 398.2360 22.5% 89.7761 308.4599 -0.1% (0.55) 398.7831 16 8004 Jordan Sahab 283.7500 100.0% 283.7500 - -0.2% (0.43) 284.1840 17 8202 Algeria Boumerdès 159.0000 -40.8% (64.8190) 223.8190 -1.1% (1.70) 160.7000 18 8339 Morocco Chefchaouen 84.1610 31.5% 26.5124 57.6486 0.3% 0.25 83.9098 19 8380 Palestine Tulkarm 191.5190 26.5% 50.7137 140.8053 0.5% 0.90 190.6225 20 9020 Lebanon Kab Elias – Wadi El Delm 52.9540 -0.1% (0.0340) 52.9880 -0.1% (0.03) 52.9880 21 9404 Jordan Aqaba Special Economic Zone 339.6763 9.1% 30.8203 308.8560 0.0% (0.00) 339.6763
22 9437 Jordan Karak 250.8920 25.2% 63.1817 187.7103 0.0% 0.00 250.8918
8,856.99 13.6% 1,207.03 7,649.97 0.00% (0.34) 8,857.3304
Difference between
sources
A - B
kilotonnes CO2/year or
kilotonnes CO2eq/year
Difference between
sources
A - C
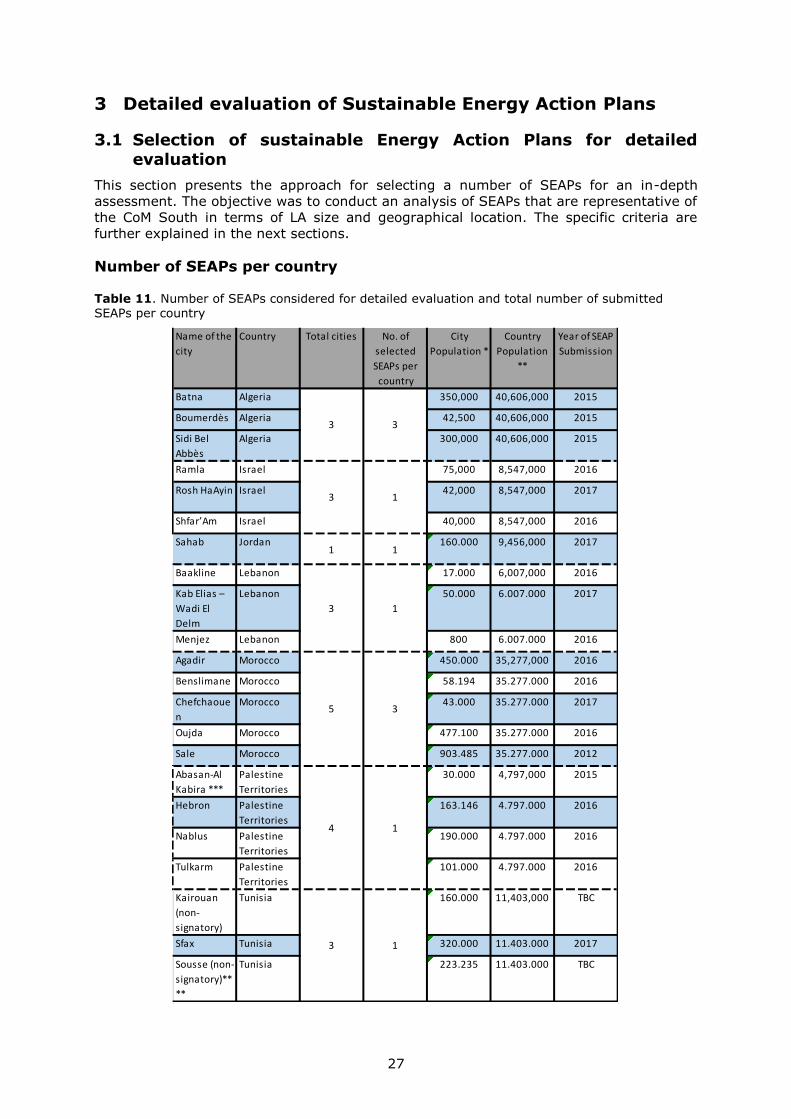
27
3 Detailed evaluation of Sustainable Energy Action Plans
3.1 Selection of sustainable Energy Action Plans for detailed
evaluation
This section presents the approach for selecting a number of SEAPs for an in-depth
assessment. The objective was to conduct an analysis of SEAPs that are representative of
the CoM South in terms of LA size and geographical location. The specific criteria are
further explained in the next sections.
Number of SEAPs per country
Table 11. Number of SEAPs considered for detailed evaluation and total number of submitted SEAPs per country
Name of the
city
Country Total cities No. of
selected
SEAPs per
country
City
Population *
Country
Population
**
Year of SEAP
Submission
Batna Algeria 350,000 40,606,000 2015
Boumerdès Algeria 42,500 40,606,000 2015
Sidi Bel
Abbès
Algeria 300,000 40,606,000 2015
Ramla Israel 75,000 8,547,000 2016
Rosh HaAyin Israel 42,000 8,547,000 2017
Shfar’Am Israel 40,000 8,547,000 2016
Sahab Jordan1 1
160.000 9,456,000 2017
Baakline Lebanon 17.000 6,007,000 2016
Kab Elias –
Wadi El
Delm
Lebanon 50.000 6.007.000 2017
Menjez Lebanon 800 6.007.000 2016
Agadir Morocco 450.000 35,277,000 2016
Benslimane Morocco 58.194 35.277.000 2016
Chefchaoue
n
Morocco 43.000 35.277.000 2017
Oujda Morocco 477.100 35.277.000 2016
Sale Morocco 903.485 35.277.000 2012
Abasan-Al
Kabira ***
Palestine
Territories
30.000 4,797,000 2015
Hebron Palestine
Territories
163.146 4.797.000 2016
Nablus Palestine
Territories
190.000 4.797.000 2016
Tulkarm Palestine
Territories
101.000 4.797.000 2016
Kairouan
(non-
signatory)
Tunisia 160.000 11,403,000 TBC
Sfax Tunisia 320.000 11.403.000 2017
Sousse (non-
signatory)**
**
Tunisia 223.235 11.403.000 TBC
4 1
3 1
3 1
5 3
3 3
3 1

28
As mentioned before, 22 SEAPs were available for an in-depth analysis (refer to Table
11). The primary objective for the selection was to pick at least one signatory per
country. In addition, countries were rated in terms of their total population reflecting
opportunities for the achievement of a higher impact of the initiative. Hence, the total
size of the potential Covenant Community in the Southern Region was calculated on the
basis of the total population of the 7 countries where signatories were available 22
With this in mind, countries were divided in 2 sub-groups: countries with a population
share of the total above 30% (Algeria, Morocco) and countries with a share less than
30% (Israel, Jordan, Lebanon, Palestine Territories, Tunisia). Since Algeria and Morocco
have the highest population share in the CoM South Community it was decided to
analyse 3 SEAPs from each country in order to keep the proportions visualised in the pie
chart “Country Share of the CoM South Community”. One LA per country will be analysed
for the rest of the countries.
Figure 6 Country Population Share of the CoM South Community
Criteria for selecting SEAPs
As mentioned in the In-depth Analysis of Sustainable Energy Actions Plans (Silvia Rivas,
2015), most of the Covenant of Mayors signatories (89 %) are small- and medium-sized
towns. For this to be reflected, the team took into consideration the size of the
signatories in each country. A secondary factor was the typology of the signatory i.e.
city/borough/urban community.
Criteria for selection: size of the LAs and the typology of the LA.
The details for the individual selection are presented below.
Selected signatories
Based on the criteria previously described, 11 signatories were selected and listed in
table below.
22 At the time of the evaluation no SEAP from Egypt was available and the total population of the country was
not included in the calculations.
Algeria 36%
Israel 7% Jordan
8% Lebanon
5%
Morocco 30%
Palestine Territories
4%
Tunisia 10%
Country Population Share of the CoM South Community

29
Table 12 List of the 11 Signatories selected for a detailed evaluation of their SEAP
The selection of each signatory is described as follows:
Algeria: Based on the suggested methodology, 3 signatories were to be selected from
the country which was the exact number of available action plans at the Covenant
Directory. Hence, SEAPs from Batna, Boumerdès (a coastal city) and Sidi Bel Abbès were
reviewed.
Israel: With a country share of the CoM South Community of 7%, one SEAP from Israel
was selected - Rosh Ha’Ayin. On one hand, as explained above, a priority was given to
smaller cities since they comprise the largest part of the CoM Community. In population
comparative terms Rosh Ha’Ayin (42 000) was in between Ramla (75 000) and Shfar’Am
(40 000) and after a brief analysis Rosh Ha’Ayin was selected over Shfar’Am due to its
participation in twinning programs and its more developed industrial sector. These
features were found particularly promising for the present in-depth analysis.
Jordan: Similarly to Algeria, no further selection criteria needed to be attributed for the
city of Sahab having the only submitted and approved SEAP at the time of this
assessment.
Lebanon: In the case of Lebanon, the selected cities were Kab Elias – Wadi El Delm. The
selected population size (50 000) corresponded best to the needs of the assessment and
also presented a case to review a borough. Nevertheless, best cases from Baakline (17
000) was considered in order to highlight a (unique) case from a city with significantly
lower populations.
Morocco: Morocco was the country with the highest number of signatories and
submitted SEAPs. Agadir was selected because of its signatory typology as an urban
community and as a key tourist and fishery centre of Morocco. Second, Chefchaouen was
selected for an in-depth evaluation based on its efforts in the climate change sector.
Country Name of City Type of
Signatory Population
Year of SEAP
submission
Algeria
Batna City 350 000 2015
Boumerdès City 42 500 2015
Sidi Bel Abbès City 300 000 2015
Israel Rosh Ha’Ayin City 42 000 2017
Jordan Sahab City 160 000 2017
Lebanon Kab Elias – Wadi El Delm Borough 50 000 2017
Morocco
Agadir Urban
Community 450 000 2016
Chefchaouen City 43 000 2017
Sale City 903 485 2012
Palestine Territories
Hebron City 163 146 2016
Tunisia Sfax Town 320 000 2017
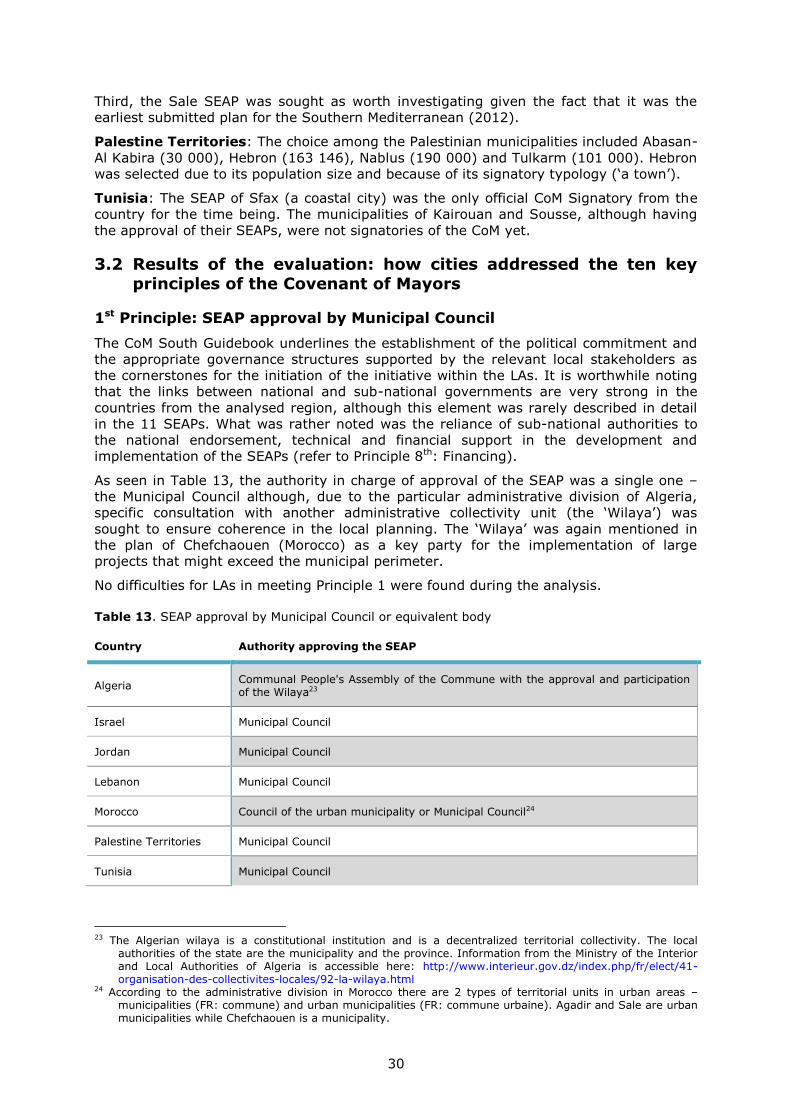
30
Third, the Sale SEAP was sought as worth investigating given the fact that it was the
earliest submitted plan for the Southern Mediterranean (2012).
Palestine Territories: The choice among the Palestinian municipalities included Abasan-
Al Kabira (30 000), Hebron (163 146), Nablus (190 000) and Tulkarm (101 000). Hebron
was selected due to its population size and because of its signatory typology (‘a town’).
Tunisia: The SEAP of Sfax (a coastal city) was the only official CoM Signatory from the
country for the time being. The municipalities of Kairouan and Sousse, although having
the approval of their SEAPs, were not signatories of the CoM yet.
3.2 Results of the evaluation: how cities addressed the ten key
principles of the Covenant of Mayors
1st Principle: SEAP approval by Municipal Council
The CoM South Guidebook underlines the establishment of the political commitment and
the appropriate governance structures supported by the relevant local stakeholders as
the cornerstones for the initiation of the initiative within the LAs. It is worthwhile noting
that the links between national and sub-national governments are very strong in the
countries from the analysed region, although this element was rarely described in detail
in the 11 SEAPs. What was rather noted was the reliance of sub-national authorities to
the national endorsement, technical and financial support in the development and
implementation of the SEAPs (refer to Principle 8th: Financing).
As seen in Table 13, the authority in charge of approval of the SEAP was a single one –
the Municipal Council although, due to the particular administrative division of Algeria,
specific consultation with another administrative collectivity unit (the ‘Wilaya’) was
sought to ensure coherence in the local planning. The ‘Wilaya’ was again mentioned in
the plan of Chefchaouen (Morocco) as a key party for the implementation of large
projects that might exceed the municipal perimeter.
No difficulties for LAs in meeting Principle 1 were found during the analysis.
Table 13. SEAP approval by Municipal Council or equivalent body
Country Authority approving the SEAP
Algeria Communal People's Assembly of the Commune with the approval and participation of the Wilaya23
Israel Municipal Council
Jordan Municipal Council
Lebanon Municipal Council
Morocco Council of the urban municipality or Municipal Council24
Palestine Territories Municipal Council
Tunisia Municipal Council
23 The Algerian wilaya is a constitutional institution and is a decentralized territorial collectivity. The local
authorities of the state are the municipality and the province. Information from the Ministry of the Interior and Local Authorities of Algeria is accessible here: http://www.interieur.gov.dz/index.php/fr/elect/41-organisation-des-collectivites-locales/92-la-wilaya.html
24 According to the administrative division in Morocco there are 2 types of territorial units in urban areas – municipalities (FR: commune) and urban municipalities (FR: commune urbaine). Agadir and Sale are urban municipalities while Chefchaouen is a municipality.

31
2nd Principle: Commitment to GHG reduction by at least 20% by 2020
In principle and in accordance with the CoM South Guidelines, the LAs subject to the
present analysis all committed to the required target of 20 % reduction by 2020.
However, in their actual SEAPs, the authorities often suggested higher numbers reflecting
their ambition to further decrease the CO2 emissions. At times the Feedback reports to
the cities noted that the CO2 reductions were ambitious and the LAs needed to make
sure they were realistic. Figure 8 below presents the reduction percentages included in
the SEAPs where Chefchaouen is planning the highest reductions of - 45 %.
Figure 7 Percentage of CO2 Reduction Ambition per City
No difficulty was found in the compliance with Principle 2. However, the first monitoring
report will verify the feasibility of the targets within the set timeframe. It is
recommended that the estimations are accurate and realistic.
3rd Principle: Baseline Emission Inventory
The signatories from CoM South countries can choose between two approaches when
developing their BEI:
- The (standard) Intergovernmental Panel on Climate Change (IPCC) approach: It
covers all the CO₂ emissions that occur due to energy consumption within the
territory of the local authority, either directly due to fuel combustion within the
local authority or indirectly via fuel combustion associated with electricity and
heat/ cold usage within their area and accounts CO₂ as the most important
greenhouse gas whereas CH4 and N2O emissions are not calculated.
- The Life Cycle Assessment (LCA) approach: It takes into consideration the overall
life cycle of the energy carrier and includes emissions of the supply chain along
with the final combustion. Given the fact that emissions from exploitation,
transport and processing are included, this approach traces emissions also outside
of the location of the LA.
Furthermore, thanks to the flexibility of the initiative signatories are allowed to set their
reduction types differently (in absolute or per capita terms) and measure the reduction of
emissions in different units (tons CO2 equivalent or tons CO2). As mentioned in section
1.3.2, one of the peculiarities of the CoM South framework is the possibility to set the
goals based on a BAU scenario. However, in the case of Rosh Ha’Ayin the use of the
national coefficient for Israel (k=1.27) for the selected baseline year (2011) under the
BAU was not considered appropriate to cover the foreseen magnitude of population
increase. Instead, two alternative scenarios were studied:
20.3 20.0 20.0 20.0 20.0 26.0 20.8
45.0
20.0 20.0 20.0
Percentage of CO2 Reduction Ambition per City

32
• Development of a no-actions scenario, as a modified BAU scenario, in an effort to
estimate the municipality’s consumptions in 2020, in case that no measure to curtail the
energy consumption growth is taken.
• Setting per capita reduction targets.
The present study shows that the majority of signatories chose to use absolute reduction
targets with two Moroccan municipalities looking at per capita reduction type. In addition,
the IPCC factor as a coefficient to quantify the emission per unit of activity was the most
often used one. Finally, 8 cities used CO₂ equivalent as a reporting unit and 3 chose to go
for tonnes CO₂ (See table 14).
Table 14 Data on reduction types, emission factors and reporting units
Name of the city Country Reduction
Type
Emission
factor
Reporting
Unit
Batna Algeria Absolute IPCC CO2 equivalent
Boumerdès Algeria Absolute IPCC CO2 equivalent
Sidi Bel Abbès Algeria Absolute IPCC CO2 equivalent
Rosh HaAyin Israel Absolute
IPCC (LEF is
used for
electricity)
CO2 equivalent
Sahab Jordan Absolute LCA tonnes CO2
Kab Elias – Wadi
El Delm Lebanon Absolute IPCC tonnes CO2
Agadir Morocco Absolute IPCC CO2 equivalent
Chefchaouen Morocco Per Capita IPCC CO2 equivalent
Sale Morocco Per Capita IPCC tonnes CO2
Hebron Palestine
Territories Absolute IPCC CO2 equivalent
Sfax Tunisia Absolute IPCC CO2 equivalent
As seen from Table 15, data for building the BEI for the key sectors was provided by the
majority of the signatories. In addition, they further submitted data on the voluntary
sectors of public lighting, agriculture, forestry, fisheries.
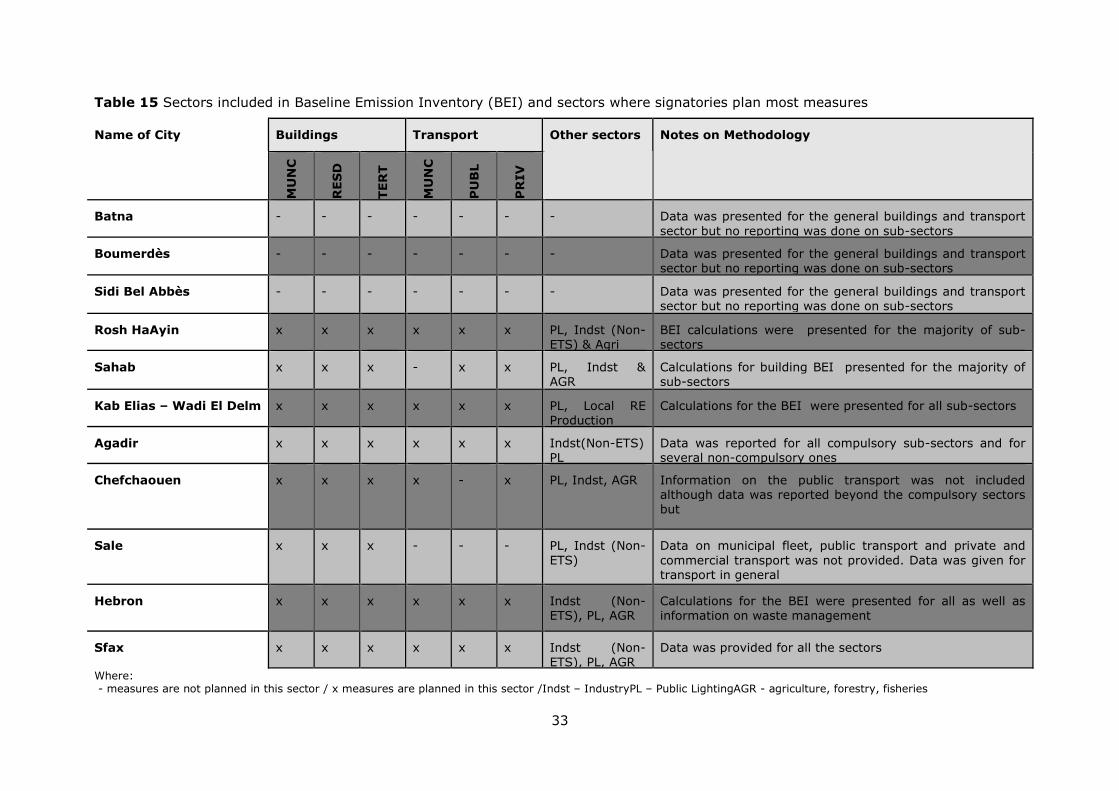
33
Table 15 Sectors included in Baseline Emission Inventory (BEI) and sectors where signatories plan most measures
Name of City Buildings Transport Other sectors Notes on Methodology
MU
NC
RES
D
TER
T
MU
NC
PU
BL
PR
IV
Batna - - - - - - - Data was presented for the general buildings and transport
sector but no reporting was done on sub-sectors
Boumerdès - - - - - - - Data was presented for the general buildings and transport sector but no reporting was done on sub-sectors
Sidi Bel Abbès - - - - - - - Data was presented for the general buildings and transport sector but no reporting was done on sub-sectors
Rosh HaAyin x x x
x x x PL, Indst (Non-ETS) & Agri
BEI calculations were presented for the majority of sub-sectors
Sahab x x x - x x PL, Indst &
AGR
Calculations for building BEI presented for the majority of
sub-sectors
Kab Elias – Wadi El Delm x x x x x x PL, Local RE Production
Calculations for the BEI were presented for all sub-sectors
Agadir x x x x x x Indst(Non-ETS) PL
Data was reported for all compulsory sub-sectors and for several non-compulsory ones
Chefchaouen x x x x - x PL, Indst, AGR Information on the public transport was not included although data was reported beyond the compulsory sectors but
Sale x x x - - - PL, Indst (Non-
ETS)
Data on municipal fleet, public transport and private and
commercial transport was not provided. Data was given for transport in general
Hebron x x x x x x Indst (Non-ETS), PL, AGR
Calculations for the BEI were presented for all as well as information on waste management
Sfax x x x x x x Indst (Non-ETS), PL, AGR
Data was provided for all the sectors
Where: - measures are not planned in this sector / x measures are planned in this sector /Indst – IndustryPL – Public LightingAGR - agriculture, forestry, fisheries
34
The main difficulties came from estimating the emissions from the transport sector and
the tertiary buildings. In addition, most of the SEAPs included non-compulsory sectors
and also, included actions on water and waste water management.
Overall, signatories did not seem to face significant difficulties in relation to the baseline
emission inventory. However, the uniform format developed by the CES-MED project and
used for majority of the SEAP hints that even if certain calculations were hindering the
SEAP development, they were resolved with assistance outside of the municipality – with
the external experts of the team.
4th and 5th Principles: Measures covering key sectors & Long and short-term actions
Principles four and five look at the measures and actions under the SEAPs. In any
Regional CoM, the local authority should identify and prioritise the required and/or most
effective sectors in which to implement emission reduction actions. The local authority is
also meant to establish a long-term vision with clear objectives for each sector.
All plans under the study presented short and long-term actions and measures. Annex I
of this report presents a selection of best practices while a snapshot of some general
findings is presented below.
Residential and commercial buildings
The suggested actions and measures in the MENA region covered a wide range of sectors
(buildings, transport, public lighting, industry, agriculture) and cross-sectorial measures
as well. In the feedback reports, the JRC recommended for LAs to focus on residential
and tertiary buildings which were often highly emitting in the urban environment and
were to be targeted in the SEAPs. This recommendation is also linked to the urge for
municipalities in the South to work on the development and refurbishment of various
buildings, included the residential, the tertiary and the municipal. Examples were
provided for commercial buildings and facilities. Kab Elias (Lebanon) planned to
undertake promotion of solar water heaters in commercial buildings in order to reduce
electricity consumed from the grid and take advantage of the high solar potential the
southern cities have.
Municipal buildings and street lighting
The studied SEAPs presented a wide range of solutions for municipal buildings and street
lighting. Photovoltaics (PV) on building rooftops for lighting and heating (Sfax, Rosh
Ha’Ayin) were often present and considered as a “low hanging fruit”. In addition, LED
lighting solutions were seen as the natural solution for increasing EE and the phase out of
the of old light bulbs. As highlighted in the case study of Rosh Ha'Ayin (Israel) on
“Refurbishment of municipal buildings” (Section 3.5- Examples of measures from
Sustainable Energy Action Plans) initiatives driven by the municipalities can turn them
into an exemplary role model and attract public attention and interest on available
solutions.
Tourism
What is characteristic for municipalities with a developed touristic sector is variation in
the energy consumption and GHG emissions as a result of population flows (Sahab,
Agadir, Bourmedes). The analysed municipalities often spoke of their heritage areas and
archaeological sites. Bourmedes specifically look at working on information and
awareness rising of the stakeholders in the sector where the awareness of the staff of the
hotel industry was seen as an essential action to mobilize tourists and disseminate
messages in favour of EE and RE. Chefchaouen on its turn suggested an action linked to
an integration of energy efficiency measures in the rehabilitation of one of the city’s
museums.
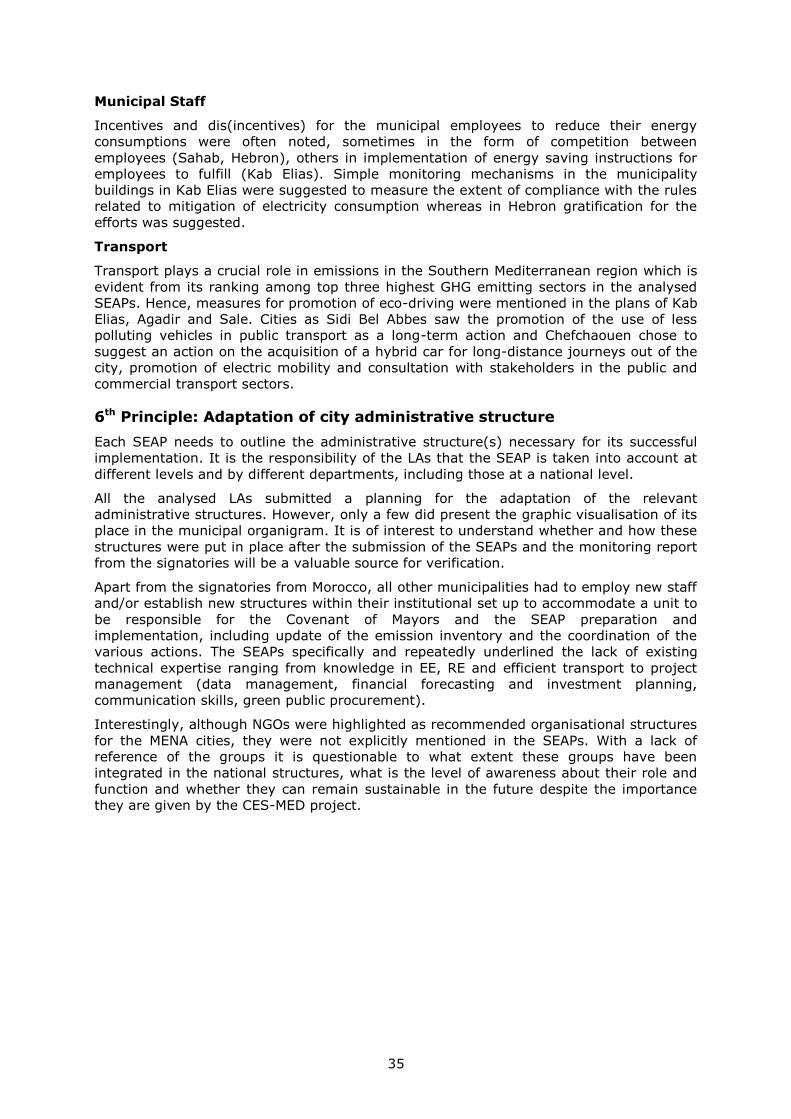
35
Municipal Staff
Incentives and dis(incentives) for the municipal employees to reduce their energy
consumptions were often noted, sometimes in the form of competition between
employees (Sahab, Hebron), others in implementation of energy saving instructions for
employees to fulfill (Kab Elias). Simple monitoring mechanisms in the municipality
buildings in Kab Elias were suggested to measure the extent of compliance with the rules
related to mitigation of electricity consumption whereas in Hebron gratification for the
efforts was suggested.
Transport
Transport plays a crucial role in emissions in the Southern Mediterranean region which is
evident from its ranking among top three highest GHG emitting sectors in the analysed
SEAPs. Hence, measures for promotion of eco-driving were mentioned in the plans of Kab
Elias, Agadir and Sale. Cities as Sidi Bel Abbes saw the promotion of the use of less
polluting vehicles in public transport as a long-term action and Chefchaouen chose to
suggest an action on the acquisition of a hybrid car for long-distance journeys out of the
city, promotion of electric mobility and consultation with stakeholders in the public and
commercial transport sectors.
6th Principle: Adaptation of city administrative structure
Each SEAP needs to outline the administrative structure(s) necessary for its successful
implementation. It is the responsibility of the LAs that the SEAP is taken into account at
different levels and by different departments, including those at a national level.
All the analysed LAs submitted a planning for the adaptation of the relevant
administrative structures. However, only a few did present the graphic visualisation of its
place in the municipal organigram. It is of interest to understand whether and how these
structures were put in place after the submission of the SEAPs and the monitoring report
from the signatories will be a valuable source for verification.
Apart from the signatories from Morocco, all other municipalities had to employ new staff
and/or establish new structures within their institutional set up to accommodate a unit to
be responsible for the Covenant of Mayors and the SEAP preparation and
implementation, including update of the emission inventory and the coordination of the
various actions. The SEAPs specifically and repeatedly underlined the lack of existing
technical expertise ranging from knowledge in EE, RE and efficient transport to project
management (data management, financial forecasting and investment planning,
communication skills, green public procurement).
Interestingly, although NGOs were highlighted as recommended organisational structures
for the MENA cities, they were not explicitly mentioned in the SEAPs. With a lack of
reference of the groups it is questionable to what extent these groups have been
integrated in the national structures, what is the level of awareness about their role and
function and whether they can remain sustainable in the future despite the importance
they are given by the CES-MED project.
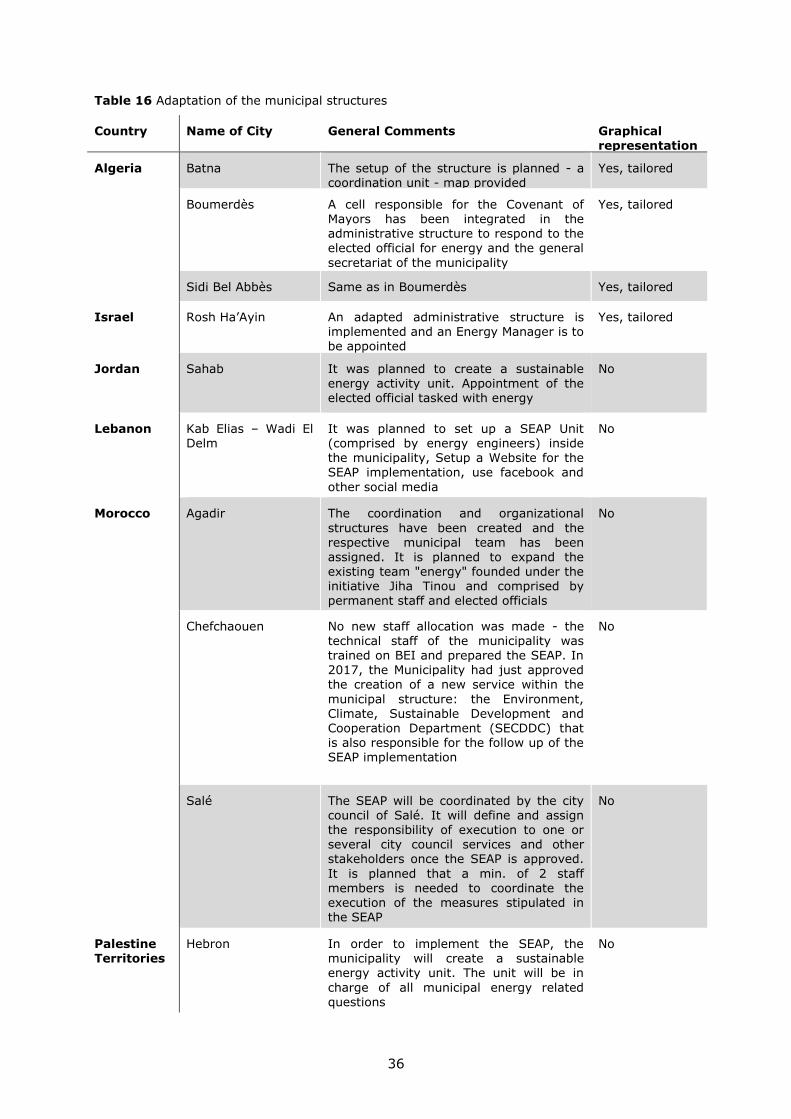
36
Table 16 Adaptation of the municipal structures
Country Name of City General Comments Graphical representationn
Algeria Batna The setup of the structure is planned - a coordination unit - map provided
Yes, tailored
Boumerdès A cell responsible for the Covenant of Mayors has been integrated in the administrative structure to respond to the elected official for energy and the general
secretariat of the municipality
Yes, tailored
Sidi Bel Abbès Same as in Boumerdès Yes, tailored
Israel Rosh Ha’Ayin An adapted administrative structure is implemented and an Energy Manager is to be appointed
Yes, tailored
Jordan Sahab It was planned to create a sustainable
energy activity unit. Appointment of the elected official tasked with energy
No
Lebanon Kab Elias – Wadi El Delm
It was planned to set up a SEAP Unit (comprised by energy engineers) inside the municipality, Setup a Website for the SEAP implementation, use facebook and
other social media
No
Morocco Agadir The coordination and organizational
structures have been created and the respective municipal team has been assigned. It is planned to expand the existing team "energy" founded under the initiative Jiha Tinou and comprised by permanent staff and elected officials
No
Chefchaouen No new staff allocation was made - the technical staff of the municipality was trained on BEI and prepared the SEAP. In 2017, the Municipality had just approved the creation of a new service within the
municipal structure: the Environment, Climate, Sustainable Development and Cooperation Department (SECDDC) that is also responsible for the follow up of the SEAP implementation
No
Salé The SEAP will be coordinated by the city council of Salé. It will define and assign the responsibility of execution to one or several city council services and other stakeholders once the SEAP is approved.
It is planned that a min. of 2 staff members is needed to coordinate the execution of the measures stipulated in the SEAP
No
Palestine Territories
Hebron In order to implement the SEAP, the municipality will create a sustainable energy activity unit. The unit will be in
charge of all municipal energy related questions
No
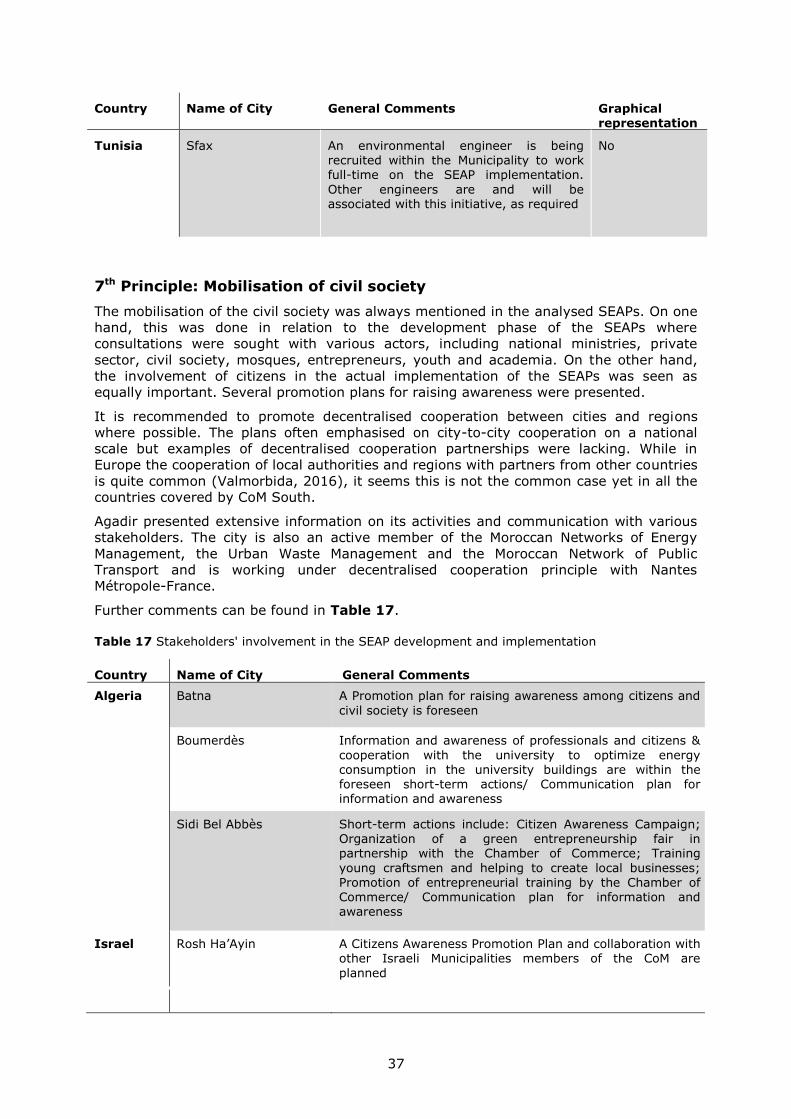
37
Country Name of City General Comments Graphical
representationn
Tunisia Sfax An environmental engineer is being recruited within the Municipality to work full-time on the SEAP implementation.
Other engineers are and will be associated with this initiative, as required
No
7th Principle: Mobilisation of civil society
The mobilisation of the civil society was always mentioned in the analysed SEAPs. On one
hand, this was done in relation to the development phase of the SEAPs where
consultations were sought with various actors, including national ministries, private
sector, civil society, mosques, entrepreneurs, youth and academia. On the other hand,
the involvement of citizens in the actual implementation of the SEAPs was seen as
equally important. Several promotion plans for raising awareness were presented.
It is recommended to promote decentralised cooperation between cities and regions
where possible. The plans often emphasised on city-to-city cooperation on a national
scale but examples of decentralised cooperation partnerships were lacking. While in
Europe the cooperation of local authorities and regions with partners from other countries
is quite common (Valmorbida, 2016), it seems this is not the common case yet in all the
countries covered by CoM South.
Agadir presented extensive information on its activities and communication with various
stakeholders. The city is also an active member of the Moroccan Networks of Energy
Management, the Urban Waste Management and the Moroccan Network of Public
Transport and is working under decentralised cooperation principle with Nantes
Métropole-France.
Further comments can be found in Table 17.
Table 17 Stakeholders' involvement in the SEAP development and implementation
Country Name of City General Comments
Algeria Batna A Promotion plan for raising awareness among citizens and
civil society is foreseen
Boumerdès Information and awareness of professionals and citizens &
cooperation with the university to optimize energy consumption in the university buildings are within the foreseen short-term actions/ Communication plan for information and awareness
Sidi Bel Abbès Short-term actions include: Citizen Awareness Campaign; Organization of a green entrepreneurship fair in partnership with the Chamber of Commerce; Training
young craftsmen and helping to create local businesses;
Promotion of entrepreneurial training by the Chamber of Commerce/ Communication plan for information and awareness
Israel Rosh Ha’Ayin A Citizens Awareness Promotion Plan and collaboration with other Israeli Municipalities members of the CoM are
planned
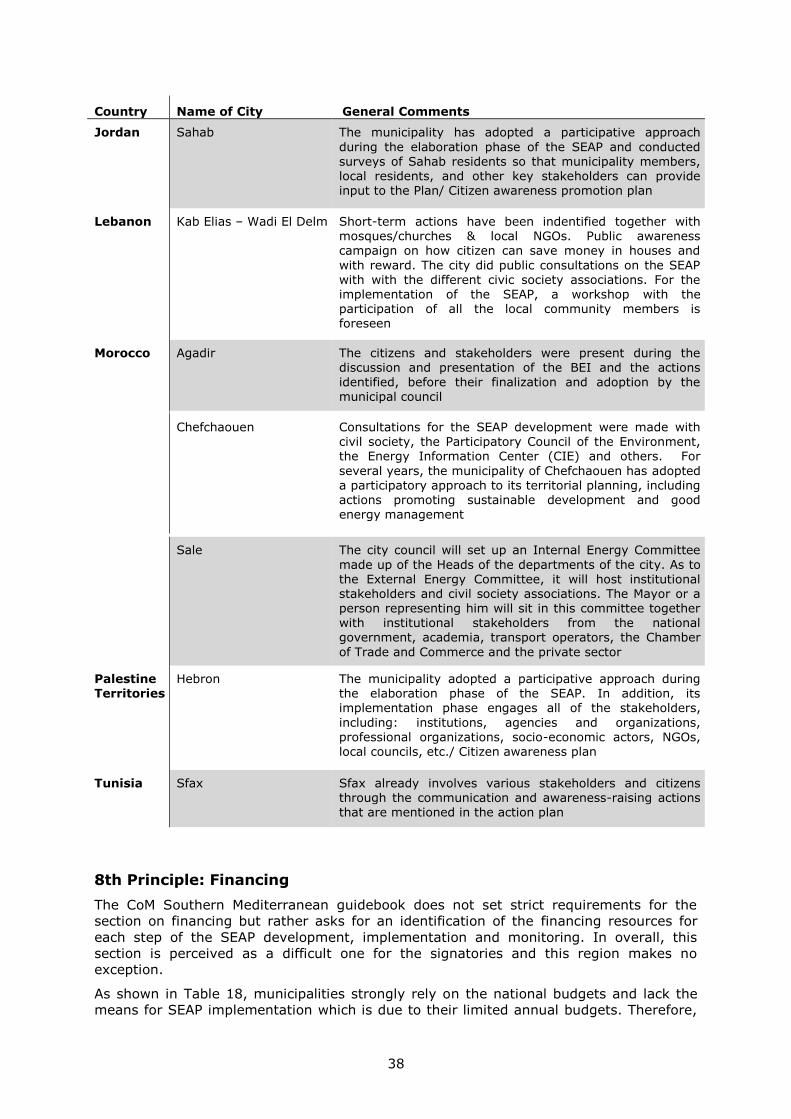
38
Country Name of City General Comments
Jordan Sahab The municipality has adopted a participative approach
during the elaboration phase of the SEAP and conducted surveys of Sahab residents so that municipality members, local residents, and other key stakeholders can provide input to the Plan/ Citizen awareness promotion plan
Lebanon Kab Elias – Wadi El Delm Short-term actions have been indentified together with mosques/churches & local NGOs. Public awareness campaign on how citizen can save money in houses and
with reward. The city did public consultations on the SEAP with with the different civic society associations. For the implementation of the SEAP, a workshop with the participation of all the local community members is foreseen
Morocco Agadir The citizens and stakeholders were present during the discussion and presentation of the BEI and the actions
identified, before their finalization and adoption by the municipal council
Chefchaouen Consultations for the SEAP development were made with civil society, the Participatory Council of the Environment, the Energy Information Center (CIE) and others. For
several years, the municipality of Chefchaouen has adopted a participatory approach to its territorial planning, including actions promoting sustainable development and good energy management
Sale The city council will set up an Internal Energy Committee
made up of the Heads of the departments of the city. As to the External Energy Committee, it will host institutional stakeholders and civil society associations. The Mayor or a person representing him will sit in this committee together
with institutional stakeholders from the national government, academia, transport operators, the Chamber
of Trade and Commerce and the private sector
Palestine Territories
Hebron The municipality adopted a participative approach during the elaboration phase of the SEAP. In addition, its implementation phase engages all of the stakeholders,
including: institutions, agencies and organizations, professional organizations, socio-economic actors, NGOs, local councils, etc./ Citizen awareness plan
Tunisia Sfax Sfax already involves various stakeholders and citizens through the communication and awareness-raising actions that are mentioned in the action plan
8th Principle: Financing
The CoM Southern Mediterranean guidebook does not set strict requirements for the
section on financing but rather asks for an identification of the financing resources for
each step of the SEAP development, implementation and monitoring. In overall, this
section is perceived as a difficult one for the signatories and this region makes no
exception.
As shown in Table 18, municipalities strongly rely on the national budgets and lack the
means for SEAP implementation which is due to their limited annual budgets. Therefore,

39
they seek a complementary funding at the national and international level. Unfortunately,
the financing topic was not developed to a satisfactory detail in any of the mentioned
plans. Satisfactory here is defined as either:
Proposing a specific strategy or tool for liaising with parties interested in financing
the SEAP
Mapping municipality-specific opportunities for financing SEAPs (i.e organization of
events and specific meetings)
Using the communication and/or promotion activities to attract external funding
and financing.
Little reference was made to existing or planned initiatives where synergies could be
sought. An interesting example came from Morocco where specific links were planned
with Jiha 'Tinou, the territorial strategy of the Moroccan Agency for Development of
Renewable Energy and Energy Efficiency (in Fr: "L'Agence nationale pour le
développement des énergies renouvelables et de l'efficacité énergétique").
It is further noted that certain sections of the financing part of the various SEAPs were
identical to each other, especially on the call for innovative financing mechanisms where
the justification for their need was always the same. The conclusion is that due to the
external support in the preparation of the plans, certain sections were repeated without
further contextual analysis and/or reflection.
Table 18 Main financial resources for implementing SEAPs
Country Name of City General Comments
Algeria Batna National and international resources are
necessary for the SEAP implementation. It is
recommended to look for innovative financing
mechanisms needed for the implementation of
RE and EE actions and measures
Boumerdès Apart from the main fund for financing EE
energy in Algeria (the fund for the
management of energy), other national funds
on environment and pollution, local governance
and development of the different regions have
been identified. It is further suggested to work
on innovative financing mechanisms mixing
loans, grants, third-party financing,
cooperative solutions, funds and others
Sidi Bel Abbès Will use CES-Med synthesis of the existing
funds at national level and for which the
municipalities are eligible. Confirms the need
for innovative finance
Israel Rosh Ha’Ayin Rosh Ha’Ayin relies on EU Funding schemes,
the Israeli Government and the Ministries of
Finance and Environment
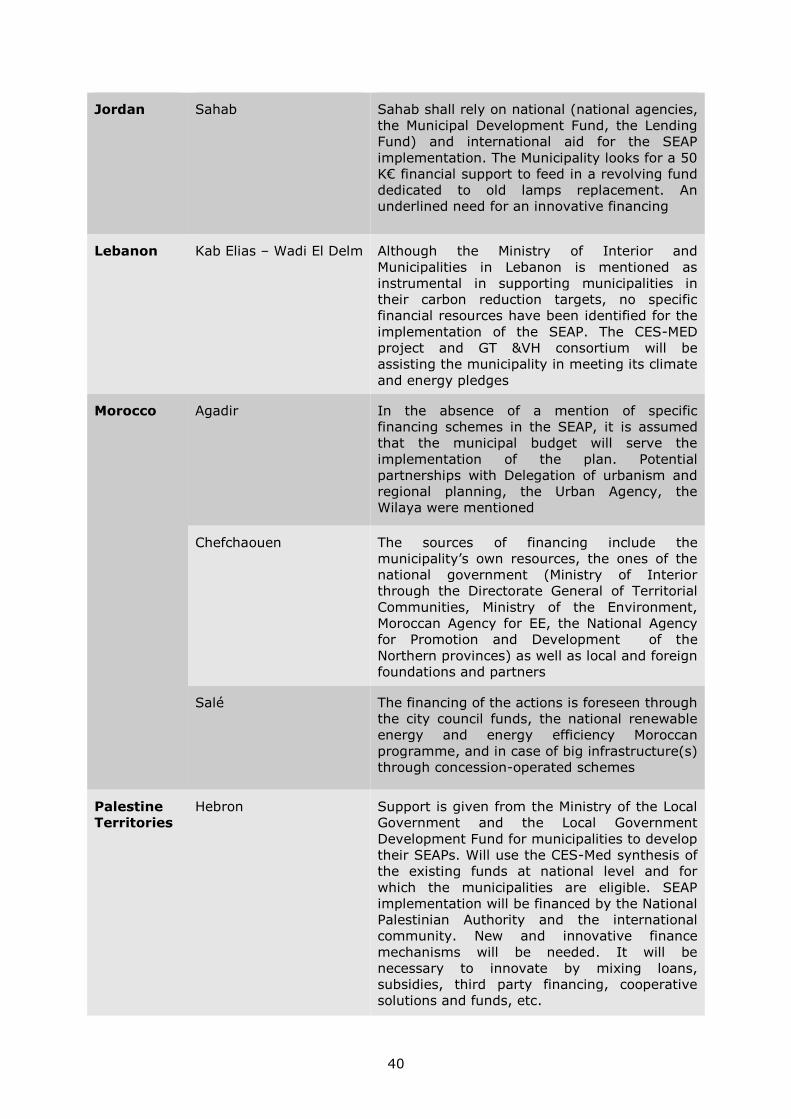
40
Jordan Sahab Sahab shall rely on national (national agencies,
the Municipal Development Fund, the Lending
Fund) and international aid for the SEAP
implementation. The Municipality looks for a 50
K€ financial support to feed in a revolving fund
dedicated to old lamps replacement. An
underlined need for an innovative financing
Lebanon Kab Elias – Wadi El Delm Although the Ministry of Interior and
Municipalities in Lebanon is mentioned as
instrumental in supporting municipalities in
their carbon reduction targets, no specific
financial resources have been identified for the
implementation of the SEAP. The CES-MED
project and GT &VH consortium will be
assisting the municipality in meeting its climate
and energy pledges
Morocco Agadir In the absence of a mention of specific
financing schemes in the SEAP, it is assumed
that the municipal budget will serve the
implementation of the plan. Potential
partnerships with Delegation of urbanism and
regional planning, the Urban Agency, the
Wilaya were mentioned
Chefchaouen The sources of financing include the
municipality’s own resources, the ones of the
national government (Ministry of Interior
through the Directorate General of Territorial
Communities, Ministry of the Environment,
Moroccan Agency for EE, the National Agency
for Promotion and Development of the
Northern provinces) as well as local and foreign
foundations and partners
Salé The financing of the actions is foreseen through
the city council funds, the national renewable
energy and energy efficiency Moroccan
programme, and in case of big infrastructure(s)
through concession-operated schemes
Palestine
Territories
Hebron Support is given from the Ministry of the Local
Government and the Local Government
Development Fund for municipalities to develop
their SEAPs. Will use the CES-Med synthesis of
the existing funds at national level and for
which the municipalities are eligible. SEAP
implementation will be financed by the National
Palestinian Authority and the international
community. New and innovative finance
mechanisms will be needed. It will be
necessary to innovate by mixing loans,
subsidies, third party financing, cooperative
solutions and funds, etc.
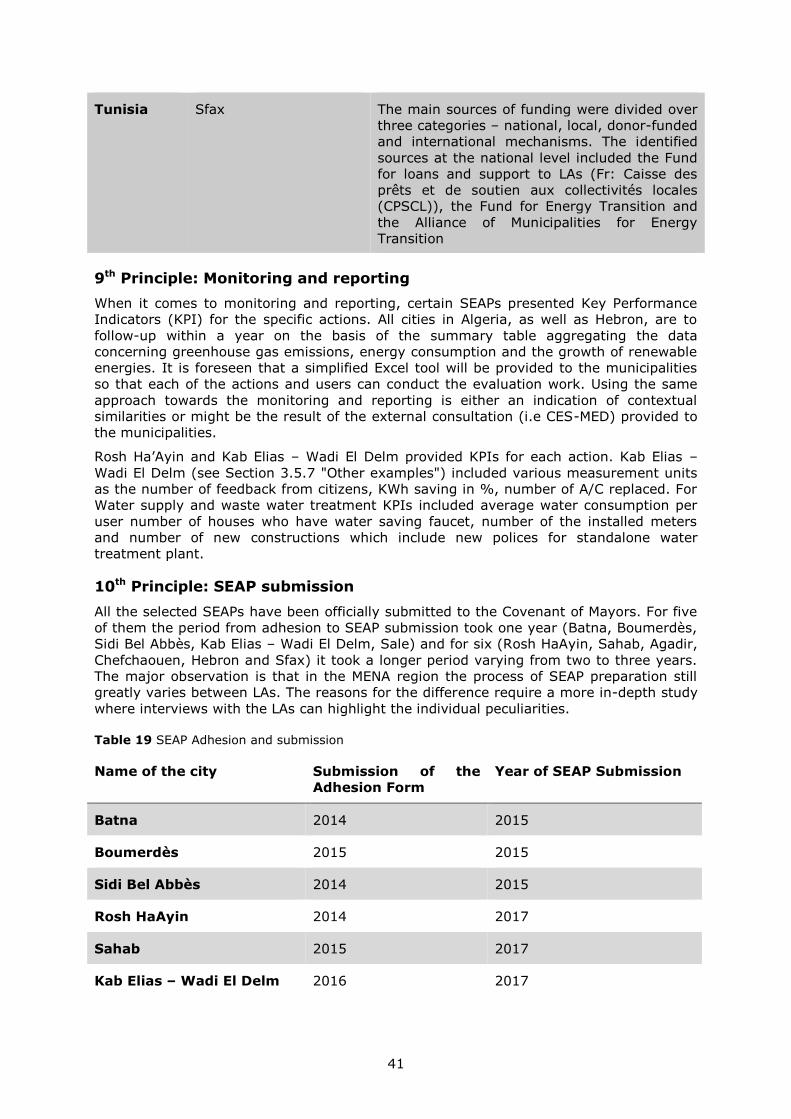
41
Tunisia Sfax The main sources of funding were divided over
three categories – national, local, donor-funded
and international mechanisms. The identified
sources at the national level included the Fund
for loans and support to LAs (Fr: Caisse des
prêts et de soutien aux collectivités locales
(CPSCL)), the Fund for Energy Transition and
the Alliance of Municipalities for Energy
Transition
9th Principle: Monitoring and reporting
When it comes to monitoring and reporting, certain SEAPs presented Key Performance
Indicators (KPI) for the specific actions. All cities in Algeria, as well as Hebron, are to
follow-up within a year on the basis of the summary table aggregating the data
concerning greenhouse gas emissions, energy consumption and the growth of renewable
energies. It is foreseen that a simplified Excel tool will be provided to the municipalities
so that each of the actions and users can conduct the evaluation work. Using the same
approach towards the monitoring and reporting is either an indication of contextual
similarities or might be the result of the external consultation (i.e CES-MED) provided to
the municipalities.
Rosh Ha’Ayin and Kab Elias – Wadi El Delm provided KPIs for each action. Kab Elias –
Wadi El Delm (see Section 3.5.7 "Other examples") included various measurement units
as the number of feedback from citizens, KWh saving in %, number of A/C replaced. For
Water supply and waste water treatment KPIs included average water consumption per
user number of houses who have water saving faucet, number of the installed meters
and number of new constructions which include new polices for standalone water
treatment plant.
10th Principle: SEAP submission
All the selected SEAPs have been officially submitted to the Covenant of Mayors. For five
of them the period from adhesion to SEAP submission took one year (Batna, Boumerdès,
Sidi Bel Abbès, Kab Elias – Wadi El Delm, Sale) and for six (Rosh HaAyin, Sahab, Agadir,
Chefchaouen, Hebron and Sfax) it took a longer period varying from two to three years.
The major observation is that in the MENA region the process of SEAP preparation still
greatly varies between LAs. The reasons for the difference require a more in-depth study
where interviews with the LAs can highlight the individual peculiarities.
Table 19 SEAP Adhesion and submission
Name of the city Submission of the
Adhesion Form
Year of SEAP Submission
Batna 2014 2015
Boumerdès 2015 2015
Sidi Bel Abbès 2014 2015
Rosh HaAyin 2014 2017
Sahab 2015 2017
Kab Elias – Wadi El Delm 2016 2017
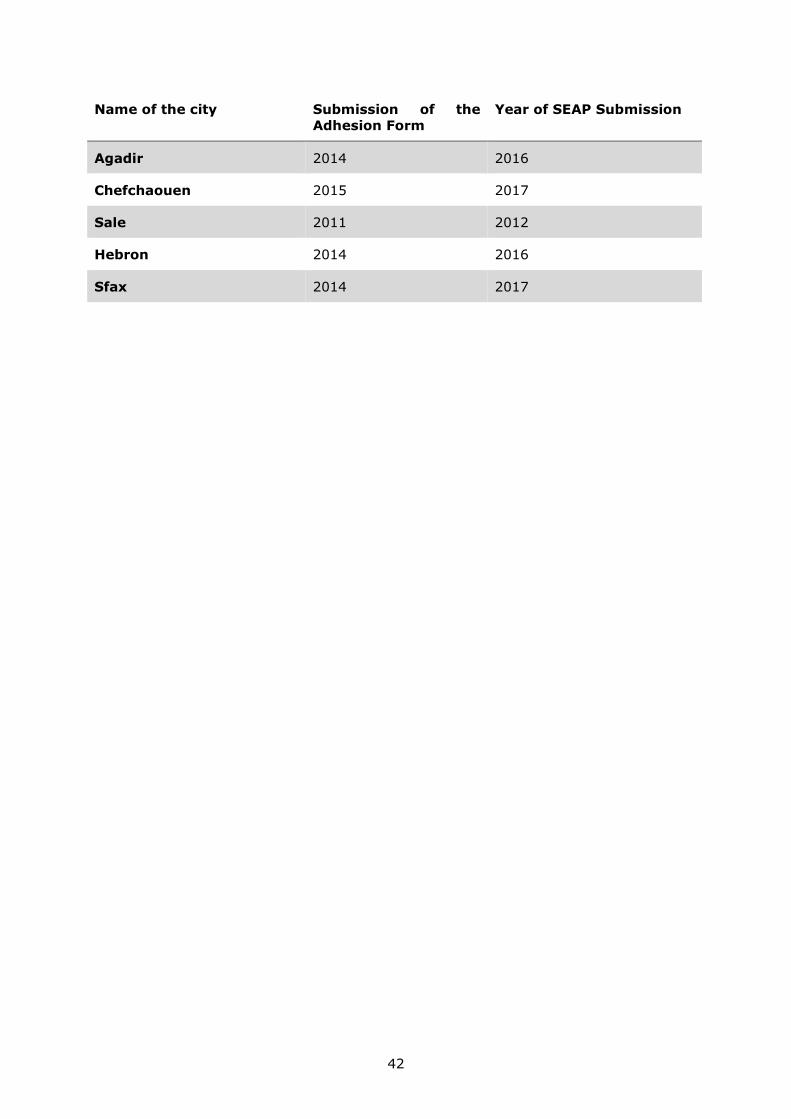
42
Name of the city Submission of the
Adhesion Form
Year of SEAP Submission
Agadir 2014 2016
Chefchaouen 2015 2017
Sale 2011 2012
Hebron 2014 2016
Sfax 2014 2017
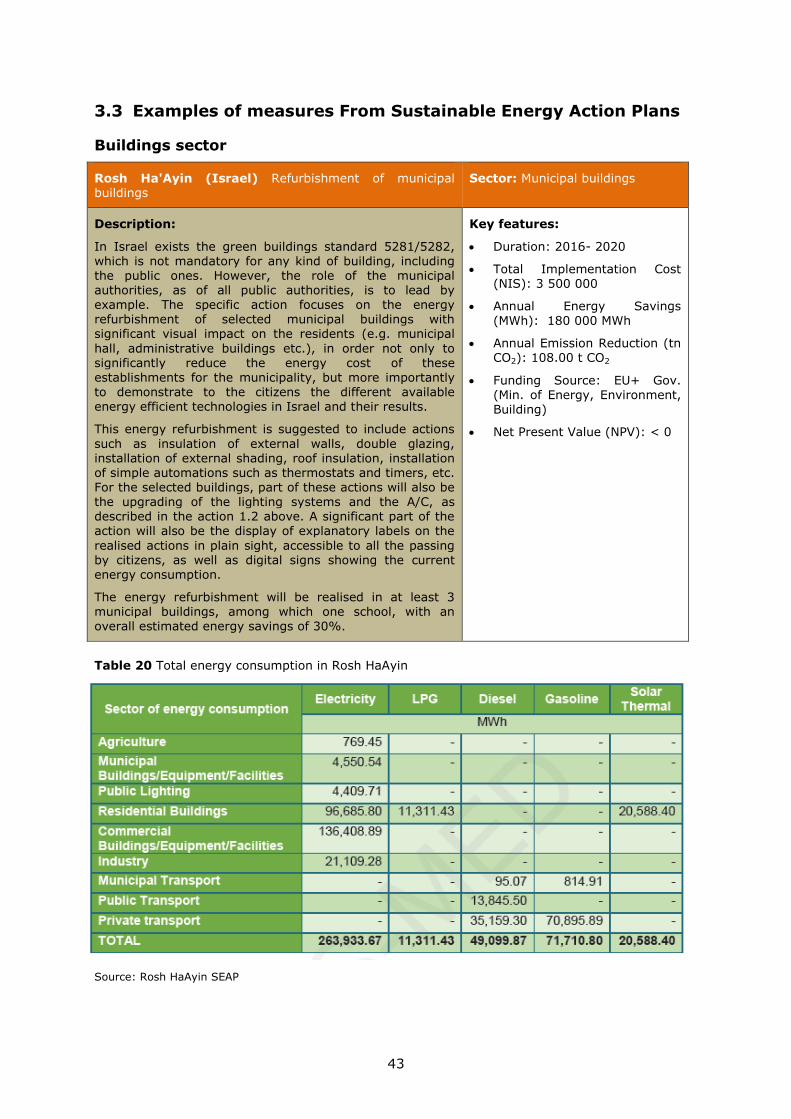
43
3.3 Examples of measures From Sustainable Energy Action Plans
Buildings sector
Rosh Ha'Ayin (Israel) Refurbishment of municipal buildings
Sector: Municipal buildings
Description:
In Israel exists the green buildings standard 5281/5282, which is not mandatory for any kind of building, including the public ones. However, the role of the municipal authorities, as of all public authorities, is to lead by example. The specific action focuses on the energy refurbishment of selected municipal buildings with significant visual impact on the residents (e.g. municipal
hall, administrative buildings etc.), in order not only to significantly reduce the energy cost of these
establishments for the municipality, but more importantly to demonstrate to the citizens the different available energy efficient technologies in Israel and their results.
This energy refurbishment is suggested to include actions
such as insulation of external walls, double glazing, installation of external shading, roof insulation, installation of simple automations such as thermostats and timers, etc. For the selected buildings, part of these actions will also be the upgrading of the lighting systems and the A/C, as described in the action 1.2 above. A significant part of the action will also be the display of explanatory labels on the
realised actions in plain sight, accessible to all the passing by citizens, as well as digital signs showing the current energy consumption.
The energy refurbishment will be realised in at least 3 municipal buildings, among which one school, with an
overall estimated energy savings of 30%.
Key features:
Duration: 2016- 2020
Total Implementation Cost (NIS): 3 500 000
Annual Energy Savings (MWh): 180 000 MWh
Annual Emission Reduction (tn CO2): 108.00 t CO2
Funding Source: EU+ Gov. (Min. of Energy, Environment, Building)
Net Present Value (NPV): < 0
Table 20 Total energy consumption in Rosh HaAyin
Source: Rosh HaAyin SEAP

44
Batna (Algeria) Pilot operation on two existing mosquees Sector: Municipal buildings
Description:
There are 78 Mosques in the Batna Region and they are
significant energy consumers for the regions given that the invoices are paid by the municipality. Mosques are further seen as ideal structures for implementing energy control experimentation projects (more efficient heating and lighting), renewable energies (such as photovoltaic panels) and awareness on these topics. Not only can
religious dignitaries and associations be influential to the citizens but the municipality of Batna has to mobilize and sensitize the mosques, their dignitaries and religious associations in the promotion of sustainable energy in order to optimize the impacts of proposed measures in the field of energy recovery.
Implementation Plan:
Identification of the 2 pilot establishments
Renovation and equipment for energy efficiency on pilot mosques
Installation of solar water heaters in pilot mosques
Equipment of the pilot mosques of photovoltaic panels to ensure lighting
Establishment of an awareness program for the
religious (dignitaries, associations)
Start: 2016
Duration: 4 years
Cost: 188.000 €
Status of the action: New
Points of contact at LAs level: Sustainable Energy Focal Point, Town Planning service, Religious Service
Annual savings expected for the budget of the Municipality: 5000 € / year
Return on investment (avec 50% support) – 15 years
Electricity savings (MWh/year): 278
Renewable energy production: MWh/year 32 MWH/year
CO2 reduction in t CO2 / year by 2020: 80
Baakline (Lebanon) Increase the initiatives for solar
water heater for low-income homes
Sector: Residential buildings
Description:
The municipality could play a good role in increasing the replacement of electrical water heater with solar heaters. This is accomplished through updating their internal laws to offer $200, deduction from the local taxes for each replacement of electrical water by solar water heaters. Following this programme has its advantages.
The municipality of Baakline has issued a local decision No.70 to exempt the local citizen for five years from water fees if they install Photovoltaic solar system ($ 700) and for one year if they install solar water heater which counts for $ 140. The incentives will be increased from only $200 which the Banque du Liban (BDL) offers to $340 which the municipality could propose. The replacement program will
enhance the smooth implementation of solar water heaters in the city. The program can be enhanced with the support
of local banks which can offer short loans offer. The municipality council can search for finance through local or
international donors and payment can be deducted from the local taxes for the citizen with defined legal part with the
internal laws. This brings the cost down by $500 for Water Solar Heater and the remaining amount can be supported by the bank with an almost zero interest, for two years. The monthly payment would be $20 to $30 per month and this amount is affordable for low income homes.
The estimated cost for this action will be in range of € 200,000. The programme could cover around 1000 houses with most low income.
Solar Water Heaters in
Lebanon. Picture: Phoenix Energy

45
Transport Sector
Sahab (Jordan) Designing a Sustainable Urban Mobility
Plan
Sector: Transport
Description:
Ideally, a city is committed to reduce energy consumption and GHG emission would design and implement a sustainable urban mobility plan (SUMP), which could entail the following:
- Integrating transport and city planning policies, while prioritizing public transportation and active modes of mobility for people and low emission modes for goods.
- Supporting the development and improvement of integrated public transport systems to make them more attractive to local inhabitants.
- Developing incentives as well as regulation measures in order to control the use of private motor vehicles and to make other modes a more attractive choice.
- Developing communication and participation strategies involving the public, with the aim of facilitating behavioural changes.
- Promoting active modes of transport, especially walking and cycling, in particular by providing safer conditions for the users.
- Implementing a common methodology to estimate GHG emissions, report on them and monitor all other benefits deriving from the development of sustainable urban mobility.
- Long-term transformation of the transport system will also require additional investment:
- To improve roads quality in the city.
-To implement a more efficient management of the overall traffic, while promoting more collective
transports.
- To promote the replacement of fleet and switch to more efficient vehicles.
Agadir (Morocco) Developing a continuous urban
cycling network of 75 km
Sector: Transport
Description:
According to the SEAP of Agadir, transportation (of people and goods) alone accounts for more than 36% of the municipality’s greenhouse gas emissions. In this
sense, the recent adoption of an Urban Travel Plan (UTP) for Greater Agadir is positive and several actions targeting the sector have been presented in the SEAP.
One particular measure consists of developing a cycling network at the scale of the most important urban centers for short-distance travel. It meets the dual objective of creating, in each of the identified
perimeters, a continuous cycle network accompanied by measures to protect cyclists. In order to facilitate the lane redevelopment, the work will be synchronized with
that of the buses with a high level of service (BHLS) since the alignment coincides (2016-2017), next will be concentrated on the urban centers (2018-2019). Finally, it will be necessary to link the perimeters between them
(2020-2022). At the end of these three phases, the cycle network will accumulate 74 linear km.
Objective: Build 74 km of cycle lanes
Project Lead: Urban Community of Agadir, Greater Agadir Agglomeration Group
Partner (s) of the project: Ministry of Equipment and Transport
Financing: Urban Community of Agadir, Ministry of the Interior
Costs of implementation
Feasibility study: 400 000 MAD
Works: 76 215 000 MAD on the basis of a cost 1.1 MMAD / km for the development of bicycle lanes
Implementation indicator: Number of km of bike lanes developed
Calendar
• 2016-2017: Detailed feasibility study concerning the adjustments to be applied in each perimeter and along each axis;
• 2018-2019: Implementation of recommendations and of work in 5 urban areas, i.e. 19 km of cycle network
46
Municipal Lighting
Agadir (Morocco) Modernisation of public lighting
management in the urban community of Agadir
Sector: Municipal lighting
Description:
Taking into consideration that public lighting is the first item on the bill of the urban agglomeration of Agadir (nearly 35 million annual dirhams), the Commune has for several years now been implementing actions to improve
the efficiency of its network while expanding and improving its service for the users. This planned action will consist in the following steps:
(1) a complete diagnosis of the network (including a review of the current management mode, an inventory of the network components, and the costs
associated with the maintenance and the operation of
the network);
(2) establishment of a sustainable and computerized management system;
(3) development of future management mode accompanied by a Performance Contract Energy (CPE); and
(4) the priority planning of renewal and modernization of public lighting by 5 and 10 years.
Start: 2016
Duration: 4 years
Cost: 188.000 €
Status of the action: New
Points of contact at LAs level:
Sustainable Energy Focal Point, Town Planning service, Religious Service
Annual savings expected for the budget of the Municipality: 5000 € / year
Return on investment (avec 50% support) – 15 years
Electricity savings MWh/year: 278 MWH/an
Renewable energy production: MWh/an 32 MWH/year
CO2 reduction in t CO2/ year by
2020: 80
47
Sahab (Jordan) Installing motion sensors for lighting
consumption reduction
Sector: Lighting in municipal
buildings
Description:
To help reducing energy consumption at the municipality building, it is possible to install motion sensors in offices to turn the lights off during the un-occupied periods. This will reduce the lighting consumption by around 20% in key areas, with an overall cost of less than JOD 7,555 and a return on investment of two years, as cost saving will
reach JOD 3,652 / year. On the other hand, it is worth mentioning that the saving achieved from implementing lighting retrofitting for municipality buildings has reached 30.8 MWh per year, which represents a saving of 10.9% of the total electrical municipality building consumptions that can be added to the other energy savings.
Key features:
Measure Target:
Reducing the energy consumption in the municipal buildings by 5.0%
Energy Saving (kWh/year)
14,100
Period of
implementation (Years)
5 Years
Cost of energy
unit reduction (€/kWh)
0.6870
Total Investment Cost (€)
9,686
Investment Cost (€/Year) [2017-2021]
1,937
Description the mechanism of monitoring and evaluation :
Periodic verification and monitoring for the desired energy
saving by special committees
CO2 reduction t CO2/year
- Reference Year 2.014
- Target Year 2.030
- Percentage of net reduction on the territory
0
-Reduction as related to BAU scenario
7900 tCO2 eq/year
- Per capita
calculated reduction
0.104
TCO2 equivalent
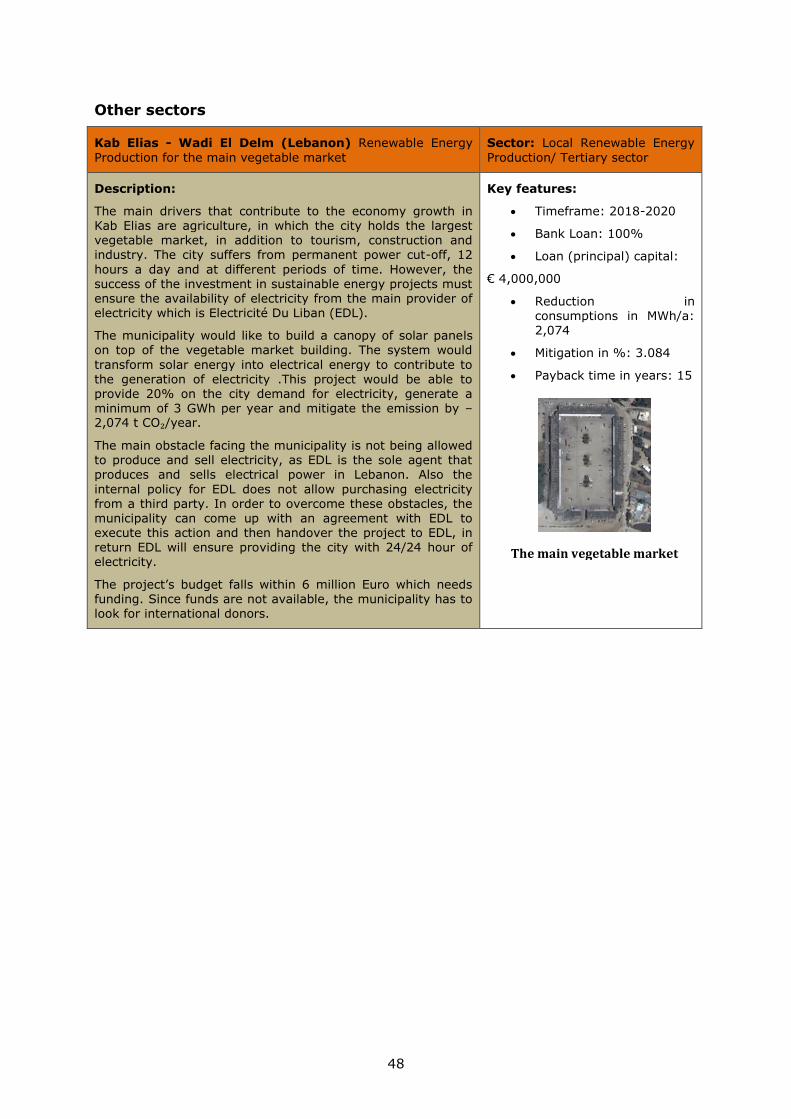
48
Other sectors
Kab Elias - Wadi El Delm (Lebanon) Renewable Energy
Production for the main vegetable market
Sector: Local Renewable Energy
Production/ Tertiary sector
Description:
The main drivers that contribute to the economy growth in Kab Elias are agriculture, in which the city holds the largest vegetable market, in addition to tourism, construction and industry. The city suffers from permanent power cut-off, 12
hours a day and at different periods of time. However, the success of the investment in sustainable energy projects must ensure the availability of electricity from the main provider of electricity which is Electricité Du Liban (EDL).
The municipality would like to build a canopy of solar panels on top of the vegetable market building. The system would
transform solar energy into electrical energy to contribute to
the generation of electricity .This project would be able to provide 20% on the city demand for electricity, generate a minimum of 3 GWh per year and mitigate the emission by – 2,074 t CO₂/year.
The main obstacle facing the municipality is not being allowed to produce and sell electricity, as EDL is the sole agent that produces and sells electrical power in Lebanon. Also the
internal policy for EDL does not allow purchasing electricity from a third party. In order to overcome these obstacles, the municipality can come up with an agreement with EDL to execute this action and then handover the project to EDL, in return EDL will ensure providing the city with 24/24 hour of electricity.
The project’s budget falls within 6 million Euro which needs funding. Since funds are not available, the municipality has to look for international donors.
Key features:
Timeframe: 2018-2020
Bank Loan: 100%
Loan (principal) capital:
€ 4,000,000
Reduction in consumptions in MWh/a: 2,074
Mitigation in %: 3.084
Payback time in years: 15
The main vegetable market

49
Hebron (Palestinian Territories) Restructuration of Water
Distribution
Sector: Water supply and
sewerage
Description:
Water delivery is particularly complex in Hebron, as the city has no direct access to water (no wells, no natural springs) and has to buy all its water from Israel. The city faces difficulties due to the allocation of quantities. The Municipality is allowed to distribute 20.000 cubic meters per day. However, it is estimated this capacity should be 40.000 m3 to take into
account leakages on the network to ensure more or less final delivery of 100 litres/capita.
Parallel to the water shortage, a black market of water tends to develop. The Municipality alone consumes 1,012 MWh/year for water distribution, representing a cost of 134K€.
The water delivery system needs to be restructured. The new model must be based on big reservoirs placed on the heights
of the city, using gravity to distribute water to all buildings. Energy consumption of both Municipality and residents would be then reduced. Hebron geography allows such a set up.
Ideally, the pumping station attached to the two or three reservoirs that would be installed must be surrounded with solar PV, to cover, at least part of, the electricity needs of the
pumping stations.
Necessary actions:
• Draw the detailed remits of a detailed feasibility study
• Identify appropriate expert team to run the study
• Monitor progress and analyse the study outcome
• Negotiate funding to implement the study recommendations
Key features:
Start Date: 2016
End Date: 2026
Project lifetime: 10 years
Estimated cost: 150.000 €
Energy savings MWh/y:
Impossible to assess at this stage as most of the saving will come from the establishment of a distribution process per gravity. One can estimate a 15%
gain in electricity consumption for pumping. This would mean
saving around 152MWh/year
50
Multi-sector
Sfax (Tunisia) Development of the Taparura site Sector: buildings, public lighting,
transport, local production of electricity and heat, and soil management at the level of urban planning
Description:
The Taparura project in Sfax aims at the rehabilitation of
an old industrial zone, the development of an urban extension and the construction an eco-neighbourhood on the north coast of the city. This project foresees the construction of residential housing, a shopping centre, a zone dedicated to services, entertainment and recreation as well as community facilities.
The project was initiated in 1985 with the creation of the
Society of Studies and Development of the North Coast of the City of Sfax and the rehabilitation and extension of the Taparura site have been launched in 2006.
The construction work is still under development. A technical assistance team with funding from the French Agency for Development and the European Investment
Bank is looking at the environmental aspects of the project. Its goal is to improve the urban plan to allow alignment with the environmental objectives of the donors and the Tunisian laws on the protection of the environment.
Beyond compliance with environmental standards, the project has the ambition to create a real eco-city that
responds to climate change adaptation objectives, efficiency and mitigation of greenhouse gas (GHG) emissions and finally, to achieve a reduction in local pollution.
Key features:
Investment Costs: The cost of
the rehabilitation and decontamination work in the area was amounted to 140.5 million dinars (86.86 million euros)
Indicative Calendar:
Construction will not begin (or
soon) before 2020. The development of the area should take place between 2020 and 2030 or even 2035

51
Other Examples
3.3.1.1 Cooperation strategy with tourism stakeholders from Boumerdès
(Algeria)
Boumerdès (Algeria) Priority Action for a Cooperation strategy with tourism stakeholders
Description:
The municipality is planning to set up a platform for discussion with tourism stakeholders to integrate them into the SEAP implementation. Even though the sector is not included in the baseline emission inventory, the municipality identifies as essential to convince private sector companies and actors in the tourism sector to engage in sustainable energy generation and
reduction of greenhouse gas emissions. It is foreseen that contributions can be made specifically through the tertiary sector, transport and waste.
Graph of GHG emissions by sector and energy in Boumerdès (2014). Boumerdès SEAP.
• Information and awareness of tourism stakeholders: Awareness of the staff of the hotel industry is an essential action to mobilize tourists (summer tourists in particular) and disseminate messages in favor of energy efficiency and renewable energy. For this, the municipality must set up a platform for discussion with tourism stakeholders to engage the dynamics (and reach out to 500 actors). A mini-customer guide for saving energy for the guest rooms (lighting, heating, air conditioning) may be offered to hotel managers.
• Development of an "environment / energy / cleanliness" label: for institutions who promote responsible tourism practices the following can be introduced:
o Reduction of energy consumption following the completion of an energy audit, provision of bicycles for tourists, etc. The Communal People's Assembly (CAP) will try to convince 10 hotels of Boumerdès to get involved in the process by 2020 and reach the goal of 5000 m2 tourist buildings working with the label.
o Waste management project related to tourists (sorting), etc. The CAP will attempt to convince 10 Boumerdès hotels to get involved in the process by 2020 and to reach the target of 50 tons of sorted waste for the concerned establishments.
o - Awareness campaign for raising tourists' awareness of energy and climate issues: hotels are a key instrument of the CAP and must participate in the communication effort undertaken by the municipality to make sustainable energy a shared for all people enjoying the seaside resort.

52
3.3.1.2 Twelve Considerations for the effective implementation of the SEAP in
Morocco
(taken from the SEAP of Chefchaouen)
General
1. Importance of the commitment of prefectures and regions: In the context of
the process of advanced regionalization (and the promulgation in July 2015 of the three
laws relating to municipalities, prefectures and regions), it is recommended that a
process of multidimensional engagement is initiated between the region, the province /
prefecture and the municipality, especially in order to promote financial support to the
region for the actions carried out by the municipality.
2. Certain administrative instruments (such as communal decrees, granting of
derogations, transfer or reassignment of State land, etc.) established and
managed at the level of municipalities, prefectures, provinces and regions /
wilayas, may be linked to the requirement to use EE and RE technologies.
Similarly, public procurement of public buildings (renovations and new construction),
vehicular fleets, public lighting and other public works should systematically refer to
energy criteria and standards. Clauses (or options) to favor local suppliers can further
promote the use of local expertise and stimulate local development.
3. Integration of the SEAP in the next mid-term evaluation of the municipal
action plan in 2019 It is recommended that a next generation of SEAPs is integrated,
from the territorial diagnosis phase, into the mid-term evaluation and update process
municipal action plan, to ensure the political carrying of energy actions and to increase
their chances of public funding. Such a specification of skills and competences should be
based on a consultation process with technicians, engineers and professionals already
working in this field.
For international cooperation partners
4. The structuring of an investment project requires a certain number of obligatory
stages: (a) the identification and formulation of the project; (b) technical, legal and
institutional assistance as well as prior consultations to evaluate the prefeasibility of the
project and to decide on the nature of the legal arrangement envisaged; (c) feasibility
studies, financial engineering and preparation of tenders and (d) implementation of the
project / financial transaction. Generally, international Financial Institutions (IFIs) only
come into play from step (c), sometimes from step (b). The previous steps are generally
accompanied by the state or donors / bilateral cooperation agencies. It is recommended
to coordinate in an optimal manner during the "pre-investment" phase between
IFIs, the State and donors to facilitate the optimal preparation of projects, according
to the due diligence criteria expected by the IFI and taking into account priorities and
interests from the community.
5. The use of bank credit through the Municipal Equipment Fund is the main, if not the
only, possibility for a municipality to access a concessional loan. However, interest rates
remain high depending on the nature of the project or the level of solvency of a
municipality. No distinction is made between the nature of projects submitted for
funding. It is conceivable and recommended for the Municipal Equipment Fund MEF to
provide the means to grant credits at reduced / subsidized interest rates to favor
projects with "high added value on climate or energy".
6. For support to small and medium-sized municipalities and / or for the financing of
small investment projects and structuring actions without immediate return on
investment (eg municipal energy accounting, demonstrative RE production facilities, Info
Energy Center, etc.), the financing is often difficult: considered too small by the IFIs, the
required investments exceed however the financial possibilities of a small or average
commune. It is conceivable that the State, with the support of international cooperation,
could establish a support fund for sustainable territorial energy development to
support the financing of small projects "with high added value on climate or education".

53
For Moroccan public institutions
7. In recent years, Morocco has sought to ensure the quality, sustainability and access to
relevant training in RE and EE. An important step was the recent creation of the
Vocational Training Institute of RE and EE (Fr: Instituts de Formation aux Métiers des
Energies Renouvelables et de l'Efficacité Energétique) with branches in Oujda, Tangier
and Ouarzazate. In this context, the qualification requirements related to the
profession of "specialized technician" in technologies such as CES, PV systems
(sizing, installation, maintenance and repair, and replacement / recycling) or
energy auditing, must be specified, taking into account international best practices
and the specific Moroccan context.
8. Beyond the strict financing of "projects", it is recommended that the State institutions
(with the support of the IFIs and donors) put in place a real national support system
for the control of projects and sustainable environmental management at the
level of local governments, allowing to finance the national governance process
required to adequately support local initiatives and policies.
9. It is recommended to set up a platform (e.g. under a form of a commission) at
national level to collect, on a regular and systematic basis, information on funds
and funding mechanisms that can be mobilized in support of local energy management.
10. This information should be next directly addressed to the main beneficiaries, in
particular municipalities, through communication and information tools in the
form of electronic platforms, guides or other instruments for presenting (and updating
regularly) available support mechanisms and access procedures to these platforms. Such
communication efforts should ideally include the international and regional financial
mechanisms and instruments already presented in this report. In addition, the Energy
Information Centers, which could be established in different cities of Morocco, particularly
in other municipalities of the Tangier-Tetouan-Al Hoceima Region and the provinces of
Tata and Midelt, could provide information to the general public and strategic business
sectors.
11. It is conceivable that the body responsible for the future coordination of the CoM
process in Morocco, in coordination with the Ministry of Energy, Mines and Sustainable
Development and the Directorate General of Local Government - Ministry of the Interior,
could play a key role in (a) supporting the Moroccan State in the development of a
national financial support mechanism for energy and climate actions; (b) the
collection, update, systematization, comparative analysis and dissemination of
information on available financial instruments; and (c) the awareness raising and
dissemination of information thus collected in different forms.
12. Beyond these attributes, which are essentially related to the coordination and
provision of information to the targeted beneficiary groups, this same body could offer
technical assistance to municipal project holders on their project files, facilitating
the reinforcement of their capacities to carry out the necessary steps to the financial
development of their projects.
54
4 Conclusions
“Innovative municipalities can serve as
laboratories to develop and test the
solutions to climate change.”25
IPCC Chair, Opening statement
Cities and Climate Change Science Conference
5 March 2018, Edmonton, Canada
As discussed in the introductory section of the report, cities and local governments have
an important role in addressing climate change and its impacts on local populations. As
reflected in the 2030 Agenda for Sustainable Development adopted by the United Nations
Assembly in September 2015 and the Paris Agreement on Climate Change signed in April
2016, the transition towards sustainable energy management is at the forefront of policy
agendas. The seventh of the 17 Sustainable Development Goals calls on governments to
“Ensure access to affordable, reliable, sustainable and modern energy for all”. Countries
will be reviewing progress on this goal in July 2018 at the UN High Level Political Forum.
In this context, the continued development and expansion of the Covenant of Mayors
initiative – including across the Southern Mediterranean countries – is timely.
This section presents summary conclusions emanating from the assessment of the
information and data of the CoM-South signatories. It sets forth certain considerations
aimed at informing the continued development and expansion of the CoM in the southern
Mediterranean countries. It also aims to inform the continued support provided by the
JRC and its international and national partners to local authorities engaging with the
CoM-South initiative.
Regarding the pertinence of the CoM-South initiative
There is increasing uptake of the CoM-South initiative across southern
Mediterranean countries. As reflected by the increasing number of recent
adhesions by local authorities in 2017 and 2018, particularly in Lebanon and
Morocco, and Northern Africa more broadly. This clearly demonstrates the
relevance for local authorities of the initiative.
The increasing numbers of participating local authorities in the CoM-
South countries represent an opportunity for the CoM-South initiative –
through the JRC and its partners – to facilitate “South-South” exchanges between
signatories and to leverage the technical assistance provided to local authorities.
At the same time, the relatively limited number of CoM-South signatories
(40 active signatories at the time of the assessment) also provides an
opportunity to focus on the challenges faced by CoM-South signatories to
date, in order to improve access for potential new signatories and to ensure the
continued engagement of active signatories.
Regarding the facility of access to the CoM-South initiative
Based on the high proportion of active CoM-South signatories that participate in
EU-funded projects (e.g. CES-MED, SUDEP-South), it is clear that this additional
support remains important for local authorities to adhere and to fulfil their
obligations/commitments. As demonstrated by the SEAP/SECAP/BEI documents of
active CoM-South signatories, external funding and technical assistance were
necessary for the BEI and/or the SEAP/SECAP documents.
As explained further, the development of the BEI constitutes the first of three
main challenges for a local authority to fulfil their commitments and remain
actively engaged. The challenge represented by the BEI for a local authority in the
25 CitiesIPCC, 2018
55
southern Mediterranean countries has to do with (a) the source of funding for the
BEI as they are – up to now – always contracted out to a specialised contractor;
(b) the technical “know-how” and familiarity required for the BEI, particularly with
regards to energy data sources, collection, treatment and analysis; and (c) the
degree of ownership of the BEI and its results as a process, beyond a mere set of
tables and figures in a document.
The second challenge for a local authority is to ensure that the SEAP/SECAP
document is a pertinent part of its municipal planning and of the execution of
actions and measures. This relates back to the issue of ownership of the
SEAP/SECAP documents. Beyond the formal approval of the SEAP/SECAP by the
appropriate local governing body (e.g. municipal council), the challenge remains
for the elected officials and staff of the local authorities to leverage the drafting of
the SEAP/SECAP document to ensure the adoptions of a “municipal energy policy”.
The third main challenge for a local authority relates to securing the funding
necessary to implement the measures and actions developed and planned for by
the SEAP/SECAP documents. With nearly 90% of funding needed from “Other
actors” to ensure implementation of the SEAP/SECAP, this is clearly where the
whole process will face its biggest challenge – particularly for CoM-South
signatories that may not have the public funding and grants available (e.g. for
“green projects”) that are available to local authorities in Europe.
The JRC and its partners – particularly national counterparts – could develop and
distribute technical reference materials to local authorities, such as a «Reference
Guide for BEI of local authorities in ((country)) » that would include key
emissions (national emission factor for electricity) and conversion factors to be
used in BEI. The need for this is clearly shown, for example, by Morocco and
Lebanon with increasing numbers of signatories. This becomes especially relevant
for CoM-South signatories for which local energy data may be limited or non-
existent. In these cases, suggested “best methods” for estimating local values
from national references would be very helpful to local authorities.
Regarding the development and reporting of the SEAP/SECAP/BEI
It is important to ensure that the SEAP/SECAP documents are primarily “policy”
documents, which have technical annexes. The SEAP/SECAP/BEI documents
submitted by the signatories are of high quality documents. The density of
information they contain and the sheer length of the documents (+170 pages in
some cases) may limit their relevance/use as actual policy documents to guide
implementation. One possible way to address this is to have the main body of the
SEAP/SECAP present summary results of the BEI while focusing on the municipal
energy policy to be implemented, the main measures to be taken and the degree
of funding needed. Technical annexes with the details of the BEI and operational
aspects can increase a reader’s “access” to the main messages of the
SEAP/SECAP while highlighting the key challenges to be addressed.
Cross-checking within SEAP/SECAP documents is important to ensure coherence
of key data points and values. This is particularly true of data points that are
necessary for key performance indicators, such as:
- Clearly differentiating population figures for (a) BEI reference year; (b)
SEAP/SECAP year; and (c) estimated target year population. These data
points are vital for comparative per capita indicators.
- Ensuring consistency and coherence of energy consumption values (e.g.
MWh/year) for individual sub-sectors and aggregated totals.
- Ensuring consistency and coherence of GHG emissions values reported for
the baseline year for individual sub-sectors and aggregated totals, as well
as for the target year. This also pertains to reported values of expected
energy savings and emissions reductions.
56
Signatories should be invited to cross-check and confirm key values of their
SEAP/SECAP before recording these on the online CoM-South reporting platform.
Regarding technical aspects of the signatory reporting process and CoM-South
data management
As shown by this assessment, accurate reporting using the online templates
remains a challenge for CoM-South signatories. This could partly be addressed by
developing a “Coding Guide” or “Guide de Codage” to accompany the online
data input fields. This “Coding Guide” would assist local authorities while also
increasing the quality of the data management aspect for the CoM-South (e.g.
JRC). For local authorities, a coding guide would help illustrate the exact values
that are expected in any given field and for all variables. This guide would also
increase the quality of constructed responses and facilitate the post-input coding
of constructed responses to be done on the dataset by the CoM-South.
Clearer guidelines should be provided regarding the reporting of energy
consumption and emissions values for municipality-controlled assets. As it
currently stands, the Buildings, Equipment, Facilities and Industries macro-sector
is very broad and this has been shown to cause imprecisions/confusion with
regards to posts such as waste management, wastewater management and the
municipal fleet. One possibility is to separate out ALL of the municipal assets into
one category (e.g. “macro-sector”) to increase transparency and accountability.
Regarding the support mechanisms of the EU for local authorities
To continue supporting the adhesion of local authorities to the CoM-South
initiative, it would be relevant for EU assistance to focus on (at least) the following
aspects:
a) Funding support to local authorities for capacity-building and technical assistance
targeted at allowing local authorities to develop their own BEI for and by
themselves, as opposed to having the BEI conducted by contractors for local
authorities.
b) Funding support for “model” actions that can provide a “quick win” for the local
authority in the execution of the SEAP/SECAP immediately upon its approval. This
funding support could be modest – approximately 40 000 to 50 000 EUR for a
“demonstration project” (1 or 2 projects per local authority). The expedited
execution of these actions would allow the local authority to mobilise further to
ensure funding for other actions described in their SEAP/SECAP.
c) The most important assistance, however, that the EU could provide local
authorities for their energy transition would be for the EU to insist with national
counterparts on the need for a mechanism sine qua non of public funding for
municipal energy actions (e.g. “a green fund for municipalities”), and for technical
assistance provided by public institutions.
Regarding the detailed evaluation of 11 cities
The in depth analysed SEAPs show a good compliance with the key commitments of the
Covenant of Mayors. They confirm that the challenges faced by the Southern
Mediterranean region are linked to decoupling economic growth and development from
carbon emissions. They also show that there is not only a political will in the region to
reduce CO2 emissions but also a level of ambition that can potentially be spread across
countries. An enabling factor for meeting the energy and climate pledges of LAs is the
support of their respective national governments in terms of political backing, human
resources and funding.
The signatories made full use of the flexibility of the initiative through the use of different
type of reporting units, baseline calculation approaches, reduction types and timeframe
of actions. ‘No size fits all’ proves to be the backbone of the success of CoM in the MENA.
57
The reviewed SEAPs serve as an example for effective stakeholder involvement and
inclusion. The different levels of government actively participated in the consultations
with a recorded participation from civil society, technical networks, academia and private
sector. It is conceivable that cities and regions initiate and strengthen decentralized
cooperation that may develop skills and enhance capacities of the involved parties.
An important characteristic of the Southern Mediterranean cities is the increased
pressure on sub national expenditure due to the surge of refugees as identified in section
1. The flow of refugees affects urban planning through the increase in the demand of
public services and the presence of refugee settlements. Although reflected in the
contextual analysis of the SEAPs, no specific measures or actions have been directed to
this issue. One way to ensure that the topic gets a greater attention in the next SEAPs
would be to communicate its relevance in relation to local urban planning during
upcoming workshops in the region. If for the moment no best practices can be extracted
from the MENA, it would be useful to highlight stories from the other newly launched
Regional Covenants.
Although a number of the analysed SEAPS mention their heritage areas and
archaeological sites, these are few suggested actions in this area. As above, a solution
would be to raise attention to the matter when organising capacity building activities in
the region.
Key points
The four central conclusions of the report are as follows:
K.1. The absence of sufficient technical skills and expertise in the fields of energy
efficiency, renewable energies, efficient transport and others at the local level is a
challenge in the Southern Mediterranean cities. Furthermore, project management skills
(data management, financial forecasting and investment planning, communication skills,
green public procurement, etc.) are needed at the LA level. In addition, although the LAs
submitted a planning for the adaptation of their relevant administrative structures (which
often included recruitment of new staff), the success of this adaptation will only be
confirmed during the monitoring phase.
K.2. The LAs strong reliance on national budgets is characteristic to the region. Despite
an increased interest in innovative financing, there is a lack of actual suggestions and
solutions. While most of the actors agree on the need of new models, no suggestions for
similar projects are made within the SEAPs. With no proper financial mechanisms and
instruments, SEAP implementation will be difficult. Conclusion 1 and 2 are closely linked
and appeal for capacity building in project financing and funding at the various
governance levels.
K.3. As mentioned under CoM key principles 3, 6, 8 and 9, sections under the various
SEAPs were identical to each other despite the fact they were to address different
countries and cities. This was attributed to the intervention of external consultants in the
preparation of the plans. It further questions whether the spread of the initiative (the
preparation of new plans) and its sustainability within the existing signatories with limited
financial and technical capacities are sustainable.
It is recommended to conduct a qualitative analysis based on in-depth interviews with
the key project team (from the CES-MED and/or the subsequent EU for Climate Action in
the ENI Southern Neighbourhood) and the LAs to better understand the challenges linked
to SEAP development.
K.4. The signatories demonstrated their commitment to participate in the initiative and
its utility for the share of know-how between municipalities of the same and different
countries. Such comments remain encouraging for the continuation of the work with the
region.
58
References
ADB. (2013). Tajikistan: Building Climate Resilience in the Pyanj River Basin. Retrieved
from Asian Development Bank: http://www.adb.org/sites/default/files/linked-
documents/45354-002-taj-oth-03.pdf
Amin, N. (2018). A leap forward to sustainable Energy Cities: Milestones. Sofia: Cleaner
Energy Saving Mediterranean Cities
Bedsworth, L., & Hanak, E. (2013). Climate policy at the local level: Insights from
California. Global Environmental Change, 23, 664-677
Bertoldi, P., Bornás Cayuela, D., Monni , S., & Piers de Raveschoot, R. (2010). How to
develop a Sustainable Energy Action Plan. Luxembourg: Publications Office of the
European Union
Cerutti A.K., A. Iancu, G. Janssens-Maenhout, G. Melica, F.Paina, & Bertoldi, P. (2013).
JRC Scientific Report : Covenant of Mayors in figures 5 – Years Assessment. JRC
Gabrielaitiene, I., Melica, G., Paina, F., Zancanella, P., Panev, S., & Bertoldi, P. (2014).
How to develop a Sustainable Energy Action Plan (SEAP) in the Eastern Partnership and
Central Asian Cities ─ Guidebook, EUR 26820 EN. Luxembourg: Publications Office of the
European Union
Janssens-Maenhout, G., Meijide-Orive, A., Guizzardi, D., Pagliari, V., & Iancu, A. (2012).
An approach with a Business-as-Usual scenario projection to 2020 for the Covenant of
Mayors from the Eastern Partnership. Luxembourg: Publications Office of the European
Union
Kona, A., Bertoldi, P., Melica, G., Rivas Calvete, S., Zancanella, P., Gabrielaitiene, I., et
al. (2013). Technical Annex to the Guidebook "How to develop a sustainable Energy
Action Plan" - Some examples on how to estimate the impacts of SEAP actions/measures
in 2020
Kona, A., Melica, G., Koffi, B., Iancu, A., Zancanella, P., Rivas Calvete, S., et al. (2016).
Covenant of Mayors: Greenhouse Gas Emissions Achievement and Projections.
Luxembourg: Publications Office of the Europea
Kona, A., Melica, G., Rivas Calvete, S., Zancanella, P., Iancu, A., Gabrielaitiene, I., et al.
(2015). The Covenant of Mayors in Figures and Performance Indicators: 6-year
assessment. Luxembourg: Publications Office of the European Union
LDC Environment Centre, U. (2012). PROJECT: Suppressed demand in Africa. Retrieved
from Climate and Development Knowledge Network: http://cdkn.org/wp-
content/uploads/2012/07/Technical-Paper_Taking-Action-on-Suppressed-
Demand_Final.pdf
Melica G., Zancanella P., Kona A., Rivas Calvete S., & P., B. (2014). The role of regions
and provinces to support the participation of small local authorities in the Covenant of
Mayors. IAEE International Conference. Rome
RCREEE. (2017). Arab Future Energy Index- Energy Efficiency
RCREEE, U. (2016). Arab Future Energy Index - Renewable Energy.
Rivas, S., Melica, G., Kona, A., Zancanella, P., Serrenho, T., Iancu, A., et al. (2015). The
Covenant of Mayors: In-depth analysis of Sustainable Energy Action Plans. Luxembourg:
Publications Office of the European Union
Saheb, Y., Kona, A., Maschio, I., & Szabo, S. (2014). How to develop a Sustainable
Energy Action Plan (SEAP) in the in South Mediterranean Cities ─ Guidebook, EUR 27016
EN. Luxembourg: Publications Office of the European Union
Silvia Rivas, G. M.-M. (2015). The Covenant of Mayors: In-depth Analysis of Sustainable
Energy Actions Plans. JRC

59
Janssens-Maenhout, G. C. (2017). Fossil CO2 and GHG emissions of all world countries.
Luxemburg: Publications Office of the European Union, EUR 28766 EN, ISBN 978-92-79-
73207-2, doi:10.2760/709792
Valmorbida, A. (2016). Decentralised Cooperation: an added value for Eastern
Partnerhisp Countries. European Association for Local Democracy

60
List of abbreviations and definitions
BEI Baseline Emission Inventory
BHLS Buses with a high level of service
CAP Communal People's Assembly
CoM Covenant of Mayors
EDL Electricité Du Liban
EC European Commission
EU European Union
IPCC Intergovernmental Panel on Climate Change
JRC Joint Research Centre
KPI Key Performance Indicators
LCA Life Cycle Assessment
LED Light-Emitting Diode
LA Local Authority
MENA Middle East and North Africa
M & R Monitoring and Reporting
MEI Monitoring Emission Inventory
MEF Municipal Equipment Fund
PV Photovoltaics
ENP- South Southern European Neighbourhood Policy
SEAP Sustainable Energy Action Plan
SUMP Sustainable Urban Mobility Plan
UfM Union for the for the Mediterranean
UTP Urban Travel Plan

61
List of figures
Figure 1 CoM South 3 Pillars .................................................................................. 5
Figure 2 CO2 emisssions/cap/year per country (2016) .............................................. 7
Figure 3 Covenant of Mayors – South Signatories (March 2018) ................................12
Figure 4 Final energy consumption in CoM-South signatories by sectors and energy
sources ...............................................................................................................15
Figure 5 Aggregated emissions reported by the CoM-South Signatories by sectors and
energy sources (tCO2e/year, corrected values) ........................................................17
Figure 6 Country Population Share of the CoM South Community ..............................28
Figure 7 Percentage of CO2 Reduction Ambition per City ..........................................31
62
List of tables
Table 1 Main steps and roles in the SEAP process. .................................................... 8
Table 2 Overview of CoM-South signatories considered for the assessment .................13
Table 3 Aggregated GHG emissions reported by CoM-South signatories (processed
dataset) ..............................................................................................................16
Table 4 Emissions-reduction commitments by CoM-South signatories ........................18
Table 5 Emissions-reduction and energy-savings commitments by CoM-South signatories
..........................................................................................................................19
Table 6 Comparative overview of emissions reductions values reported by CoM-
Signatories ..........................................................................................................19
Table 7 Estimated budget reported by CoM-South Signatories ...................................20
Table 8 Overview of key values and indicators reported by Com-South signatories ......21
Table 9 Batna/Algeria: Example of different energy consumption values presented in
different sources ..................................................................................................23
Table 10 Comparison of GHG emissions values reported by the CoM-South signatories 26
Table 11. Number of SEAPs considered for detailed evaluation and total number of
submitted SEAPs per country .................................................................................27
Table 12 List of the 11 Signatories selected for a detailed evaluation of their SEAP ......29
Table 13. SEAP approval by Municipal Council or equivalent body ..............................30
Table 14 Data on reduction types, emission factors and reporting units......................32
Table 16 Adaptation of the municipal structures ......................................................36
Table 17 Stakeholders' involvement in the SEAP development and implementation .....37
Table 18 Main financial resources for implementing SEAPs .......................................39
Table 19 SEAP Adhesion and submission ................................................................41
Table 20 Total energy consumption in Rosh HaAyin .................................................43
63
Annexes
I. Overview of active CoM-South signatories (40) included in the assessment
(March 2018)
II. Overview of 22 active CoM-South signatories with submitted SEAP/SECAP/BEI
documents (March 2018)`
III. Energy consumption values reported in the CoM-South dataset - Treated
IV. Final energy consumption in CoM-South signatories by sectors and energy
sources
V. Emissions values reported in the CoM-South dataset - Treated
VI. Aggregated emissions reported by the CoM-South Signatories by sectors and
energy sources
VII. Emissions reduction commitments of CoM-South Signatories
VIII. Implementation estimates - Sectors and Subsectors
IX. Emissions reduction commitments of CoM-South Signatories
X. Estimated budget reported by CoM-South signatories
XI. Overview of key values and indicators reported by Com-South signatories
XII. Comparison of energy consumption values reported by CoM-South Signatories
XIII. Sahab/Jordan: Review of energy consumption and emissions values reported
XIV. Energy consumptions values reported in the CoM-South dataset (not treated)
XV. Emissions values reported in the CoM-South dataset - Not treated
XVI. Comparison of GHG emissions values reported in SEAP/SECAP/BEI documents
XVII. Comparison of GHG emissions values reported by the CoM-South signatories
XVIII. Preparation of Community Awareness Promotional Plan (CAPP) template by
Hebron (Palestine)
XIX. Key performance and indicators for the SEAP Actions by Kab Elias – Wadi El
Delm (Lebanon)
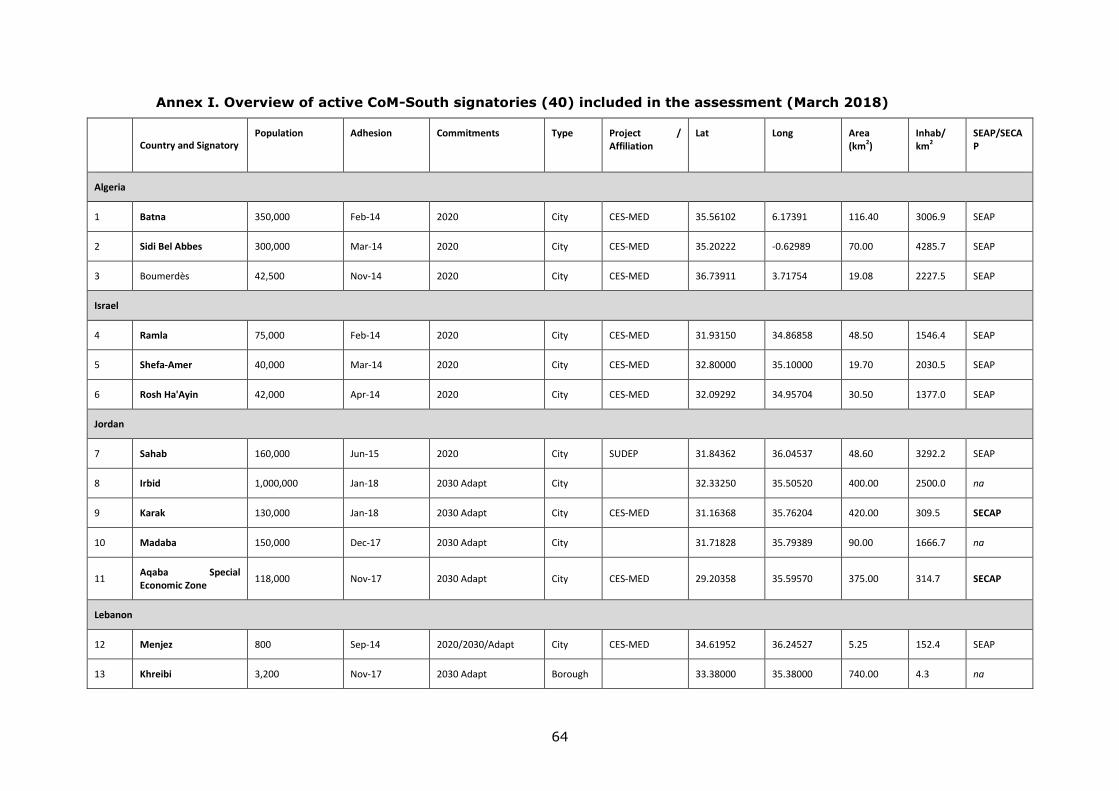
64
Annex I. Overview of active CoM-South signatories (40) included in the assessment (March 2018)
Country and Signatory
Population Adhesion Commitments Type Project / Affiliation
Lat Long Area (km2)
Inhab/ km2
SEAP/SECAP
Algeria
1 Batna 350,000 Feb-14 2020 City CES-MED 35.56102 6.17391 116.40 3006.9 SEAP
2 Sidi Bel Abbes 300,000 Mar-14 2020 City CES-MED 35.20222 -0.62989 70.00 4285.7 SEAP
3 Boumerdès 42,500 Nov-14 2020 City CES-MED 36.73911 3.71754 19.08 2227.5 SEAP
Israel
4 Ramla 75,000 Feb-14 2020 City CES-MED 31.93150 34.86858 48.50 1546.4 SEAP
5 Shefa-Amer 40,000 Mar-14 2020 City CES-MED 32.80000 35.10000 19.70 2030.5 SEAP
6 Rosh Ha'Ayin 42,000 Apr-14 2020 City CES-MED 32.09292 34.95704 30.50 1377.0 SEAP
Jordan
7 Sahab 160,000 Jun-15 2020 City SUDEP 31.84362 36.04537 48.60 3292.2 SEAP
8 Irbid 1,000,000 Jan-18 2030 Adapt City
32.33250 35.50520 400.00 2500.0 na
9 Karak 130,000 Jan-18 2030 Adapt City CES-MED 31.16368 35.76204 420.00 309.5 SECAP
10 Madaba 150,000 Dec-17 2030 Adapt City
31.71828 35.79389 90.00 1666.7 na
11 Aqaba Special Economic Zone
118,000 Nov-17 2030 Adapt City CES-MED 29.20358 35.59570 375.00 314.7 SECAP
Lebanon
12 Menjez 800 Sep-14 2020/2030/Adapt City CES-MED 34.61952 36.24527 5.25 152.4 SEAP
13 Khreibi 3,200 Nov-17 2030 Adapt Borough
33.38000 35.38000 740.00 4.3 na
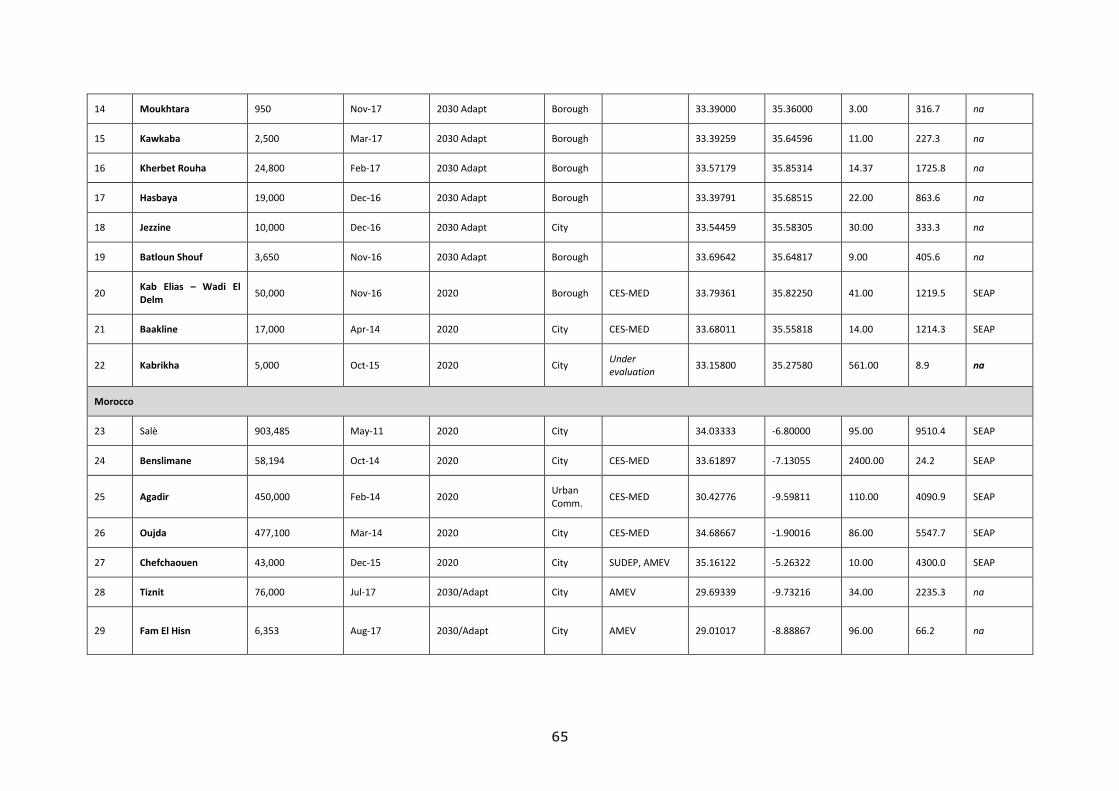
65
14 Moukhtara 950 Nov-17 2030 Adapt Borough
33.39000 35.36000 3.00 316.7 na
15 Kawkaba 2,500 Mar-17 2030 Adapt Borough
33.39259 35.64596 11.00 227.3 na
16 Kherbet Rouha 24,800 Feb-17 2030 Adapt Borough
33.57179 35.85314 14.37 1725.8 na
17 Hasbaya 19,000 Dec-16 2030 Adapt Borough
33.39791 35.68515 22.00 863.6 na
18 Jezzine 10,000 Dec-16 2030 Adapt City
33.54459 35.58305 30.00 333.3 na
19 Batloun Shouf 3,650 Nov-16 2030 Adapt Borough
33.69642 35.64817 9.00 405.6 na
20 Kab Elias – Wadi El Delm
50,000 Nov-16 2020 Borough CES-MED 33.79361 35.82250 41.00 1219.5 SEAP
21 Baakline 17,000 Apr-14 2020 City CES-MED 33.68011 35.55818 14.00 1214.3 SEAP
22 Kabrikha 5,000 Oct-15 2020 City Under evaluation
33.15800 35.27580 561.00 8.9 na
Morocco
23 Salè 903,485 May-11 2020 City
34.03333 -6.80000 95.00 9510.4 SEAP
24 Benslimane 58,194 Oct-14 2020 City CES-MED 33.61897 -7.13055 2400.00 24.2 SEAP
25 Agadir 450,000 Feb-14 2020 Urban Comm.
CES-MED 30.42776 -9.59811 110.00 4090.9 SEAP
26 Oujda 477,100 Mar-14 2020 City CES-MED 34.68667 -1.90016 86.00 5547.7 SEAP
27 Chefchaouen 43,000 Dec-15 2020 City SUDEP, AMEV 35.16122 -5.26322 10.00 4300.0 SEAP
28 Tiznit 76,000 Jul-17 2030/Adapt City AMEV 29.69339 -9.73216 34.00 2235.3 na
29 Fam El Hisn 6,353 Aug-17 2030/Adapt City AMEV 29.01017 -8.88867 96.00 66.2 na

66
30 Figuig 10,872 Aug-17 2030/Adapt City AMEV 32.03250 -0.79380 36.00 302.0 na
31 M’diq 56,130 Oct-17 2030/Adapt City AMEV 35.62270 -4.88620 70.00 801.9 na
32 Sefrou 79,887 Oct-17 2030/Adapt City AMEV 33.82895 -4.84016 133.43 598.7 na
33 Belfaa 27,592 Sep-17 2030/Adapt City AMEV 30.05824 -9.56179 259.00 106.5 na
34 Drarga 70,793 Feb-18 2030/Adapt City AMEV 30.38179 -9.47560 111.00 637.8 na
Palestine
35 Abasan Al-Kabira 30,000 Nov-13 2020/2030/Adapt City
31.32000 34.35000 18.00 1666.7 SEAP
36 Hebron 163,146 Oct-14 2020 City CES-MED 31.53276 35.09949 74.10 2201.6 SEAP
37 Nablus 190,000 May-15 2020 City CES-MED 32.22504 35.26097 29.00 6551.7 SEAP
38 Tulkarm 101,000 Feb-14 2020 City CES-MED 32.31170 35.02720 13790.00 7.3 SEAP
Tunisia
39 Sfax 320,000 Feb-14 2020 Town CES-MED 34.74785 10.76616 56.00 5714.3 SEAP
40 Hammam-Lif 42,518 Dec-16 2030/Adapt City
36.44000 10.19000 9.36 4542.5 na
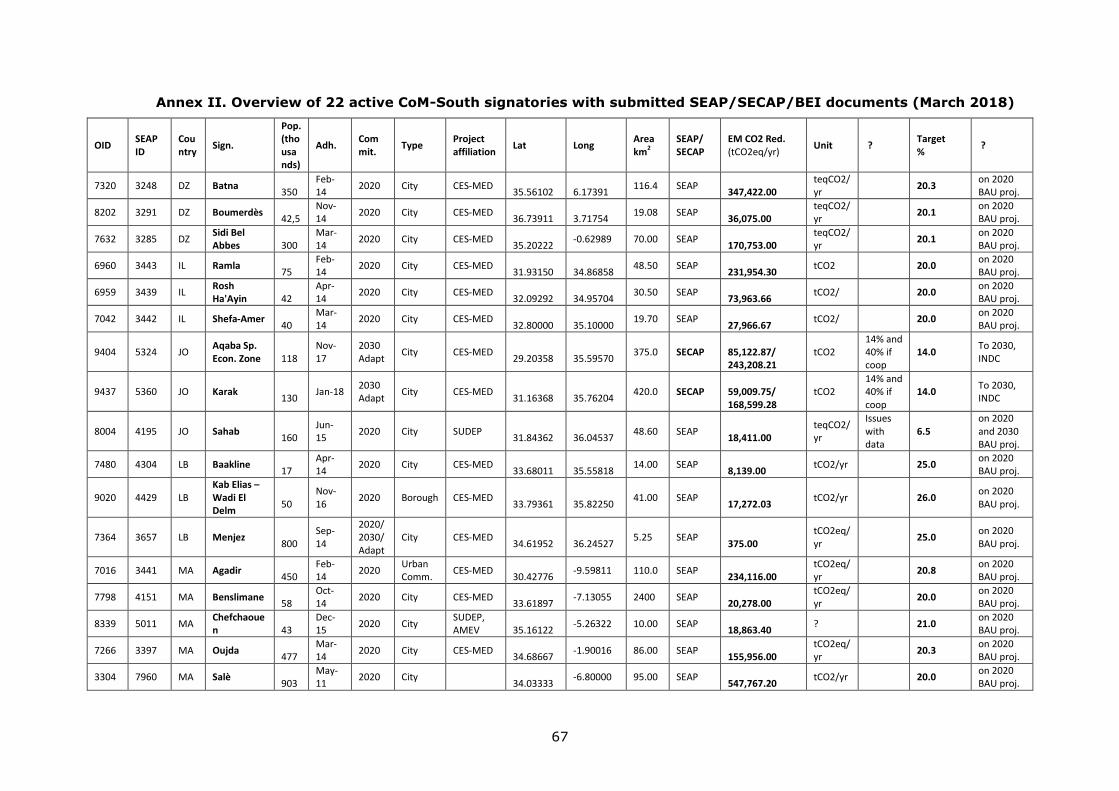
67
Annex II. Overview of 22 active CoM-South signatories with submitted SEAP/SECAP/BEI documents (March 2018)
OID SEAP ID
Country
Sign.
Pop. (thousands)
Adh. Commit.
Type Project affiliation
Lat Long Area km2
SEAP/ SECAP
EM CO2 Red. (tCO2eq/yr)
Unit ? Target %
?
7320 3248 DZ Batna 350
Feb-14
2020 City CES-MED 35.56102
6.17391
116.4 SEAP 347,422.00
teqCO2/yr
20.3 on 2020 BAU proj.
8202 3291 DZ Boumerdès 42,5
Nov-14
2020 City CES-MED 36.73911
3.71754
19.08 SEAP 36,075.00
teqCO2/yr
20.1 on 2020 BAU proj.
7632 3285 DZ Sidi Bel Abbes
300
Mar-14
2020 City CES-MED 35.20222
-0.62989 70.00 SEAP 170,753.00
teqCO2/yr
20.1 on 2020 BAU proj.
6960 3443 IL Ramla 75
Feb-14
2020 City CES-MED 31.93150
34.86858
48.50 SEAP 231,954.30
tCO2
20.0 on 2020 BAU proj.
6959 3439 IL Rosh Ha'Ayin
42
Apr-14
2020 City CES-MED 32.09292
34.95704
30.50 SEAP 73,963.66
tCO2/
20.0 on 2020 BAU proj.
7042 3442 IL Shefa-Amer 40
Mar-14
2020 City CES-MED 32.80000
35.10000
19.70 SEAP 27,966.67
tCO2/
20.0 on 2020 BAU proj.
9404 5324 JO Aqaba Sp. Econ. Zone
118
Nov-17
2030 Adapt
City CES-MED 29.20358
35.59570
375.0 SECAP 85,122.87/ 243,208.21
tCO2 14% and 40% if coop
14.0 To 2030, INDC
9437 5360 JO Karak 130
Jan-18 2030 Adapt
City CES-MED 31.16368
35.76204
420.0 SECAP 59,009.75/ 168,599.28
tCO2 14% and 40% if coop
14.0 To 2030, INDC
8004 4195 JO Sahab 160
Jun-15
2020 City SUDEP 31.84362
36.04537
48.60 SEAP 18,411.00
teqCO2/yr
Issues with data
6.5 on 2020 and 2030 BAU proj.
7480 4304 LB Baakline 17
Apr-14
2020 City CES-MED 33.68011
35.55818
14.00 SEAP 8,139.00
tCO2/yr
25.0 on 2020 BAU proj.
9020 4429 LB Kab Elias – Wadi El Delm
50
Nov-16
2020 Borough CES-MED 33.79361
35.82250
41.00 SEAP 17,272.03
tCO2/yr
26.0 on 2020 BAU proj.
7364 3657 LB Menjez 800
Sep-14
2020/2030/Adapt
City CES-MED 34.61952
36.24527
5.25 SEAP 375.00
tCO2eq/yr
25.0 on 2020 BAU proj.
7016 3441 MA Agadir 450
Feb-14
2020 Urban Comm.
CES-MED 30.42776
-9.59811 110.0 SEAP 234,116.00
tCO2eq/yr
20.8 on 2020 BAU proj.
7798 4151 MA Benslimane 58
Oct-14
2020 City CES-MED 33.61897
-7.13055 2400 SEAP 20,278.00
tCO2eq/yr
20.0 on 2020 BAU proj.
8339 5011 MA Chefchaouen
43
Dec-15
2020 City SUDEP, AMEV
35.16122
-5.26322 10.00 SEAP 18,863.40
?
21.0 on 2020 BAU proj.
7266 3397 MA Oujda 477
Mar-14
2020 City CES-MED 34.68667
-1.90016 86.00 SEAP 155,956.00
tCO2eq/yr
20.3 on 2020 BAU proj.
3304 7960 MA Salè 903
May-11
2020 City
34.03333
-6.80000 95.00 SEAP 547,767.20
tCO2/yr
20.0 on 2020 BAU proj.

68
6492 1880 PS Abasan Al-Kabira
30
Nov-13
2020/2030/Adapt
City
31.32000
34.35000
18.00 SEAP (08/2015)
8,511.32
tCO2eq/yr
30.0 compared to BAU 2020
8380 3859 PS Hebron 163
Oct-14
2020 City CES-MED 31.53276
35.09949
74.10 SEAP 113,040.00
tCO2eq/yr
20.0 compared to BAU 2021
7933 3858 PS Nablus 190
May-15
2020 City CES-MED 32.22504
35.26097
29.00 SEAP 100,171.00
tCO2eq/yr
20.0 compared to BAU 2022
8380 3729 PS Tulkarm 101
Feb-14
2020 City CES-MED 32.31170
35.02720
246.0 SEAP 47,419.00
tCO2eq/yr
20.0 compared to BAU 2023
6958 4824 TN Sfax 320
Feb-14
2020 Town CES-MED 34.74785
10.76616
56.00 SEAP 257,129.00
tCO2
20.0 on 2020 BAU proj.
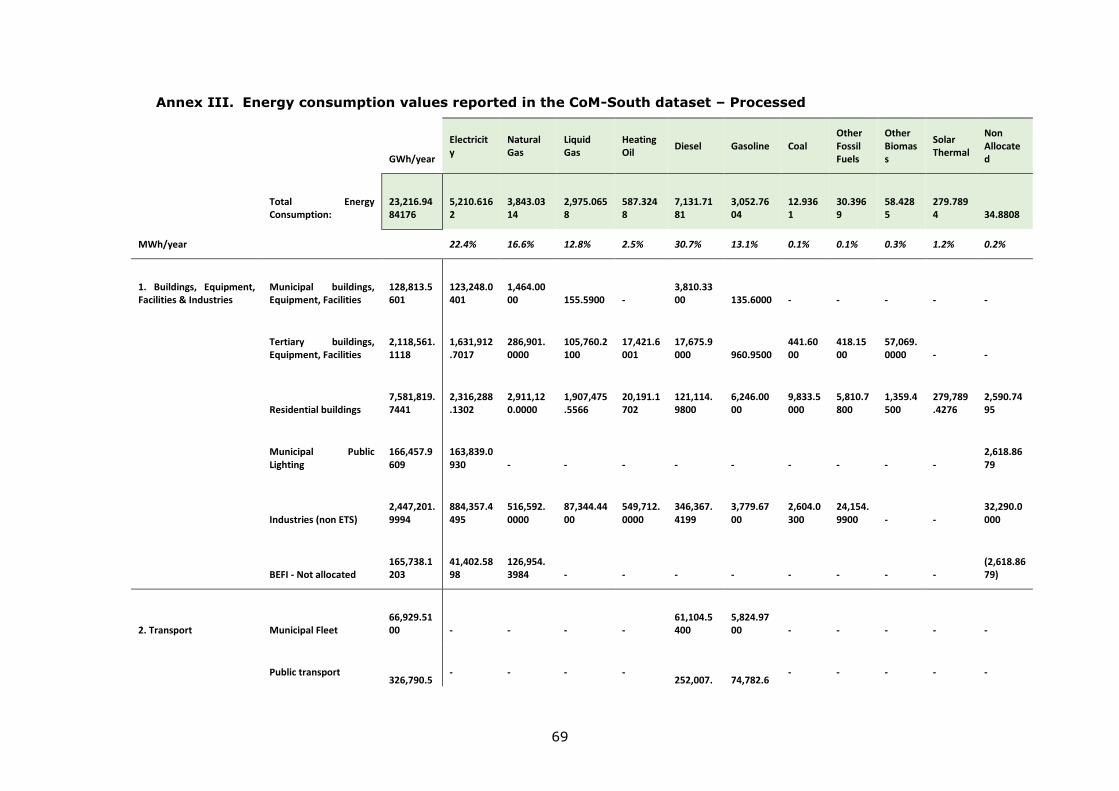
69
Annex III. Energy consumption values reported in the CoM-South dataset – Processed
GWh/year
Electricity
Natural Gas
Liquid Gas
Heating Oil
Diesel Gasoline Coal Other Fossil Fuels
Other Biomass
Solar Thermal
Non Allocated
Total Energy Consumption:
23,216.9484176
5,210.6162
3,843.0314
2,975.0658
587.3248
7,131.7181
3,052.7604
12.9361
30.3969
58.4285
279.7894
34.8808
MWh/year
22.4% 16.6% 12.8% 2.5% 30.7% 13.1% 0.1% 0.1% 0.3% 1.2% 0.2%
1. Buildings, Equipment, Facilities & Industries
Municipal buildings, Equipment, Facilities
128,813.5601
123,248.0401
1,464.0000
155.5900
-
3,810.3300
135.6000
-
-
-
-
-
Tertiary buildings, Equipment, Facilities
2,118,561.1118
1,631,912.7017
286,901.0000
105,760.2100
17,421.6001
17,675.9000
960.9500
441.6000
418.1500
57,069.0000
-
-
Residential buildings
7,581,819.7441
2,316,288.1302
2,911,120.0000
1,907,475.5566
20,191.1702
121,114.9800
6,246.0000
9,833.5000
5,810.7800
1,359.4500
279,789.4276
2,590.7495
Municipal Public Lighting
166,457.9609
163,839.0930
-
-
-
-
-
-
-
-
-
2,618.8679
Industries (non ETS)
2,447,201.9994
884,357.4495
516,592.0000
87,344.4400
549,712.0000
346,367.4199
3,779.6700
2,604.0300
24,154.9900
-
-
32,290.0000
BEFI - Not allocated
165,738.1203
41,402.5898
126,954.3984
-
-
-
-
-
-
-
-
(2,618.8679)
2. Transport Municipal Fleet
66,929.5100
-
-
-
-
61,104.5400
5,824.9700
-
-
-
-
-
Public transport 326,790.5
-
-
-
-
252,007. 74,782.6
-
-
-
-
-
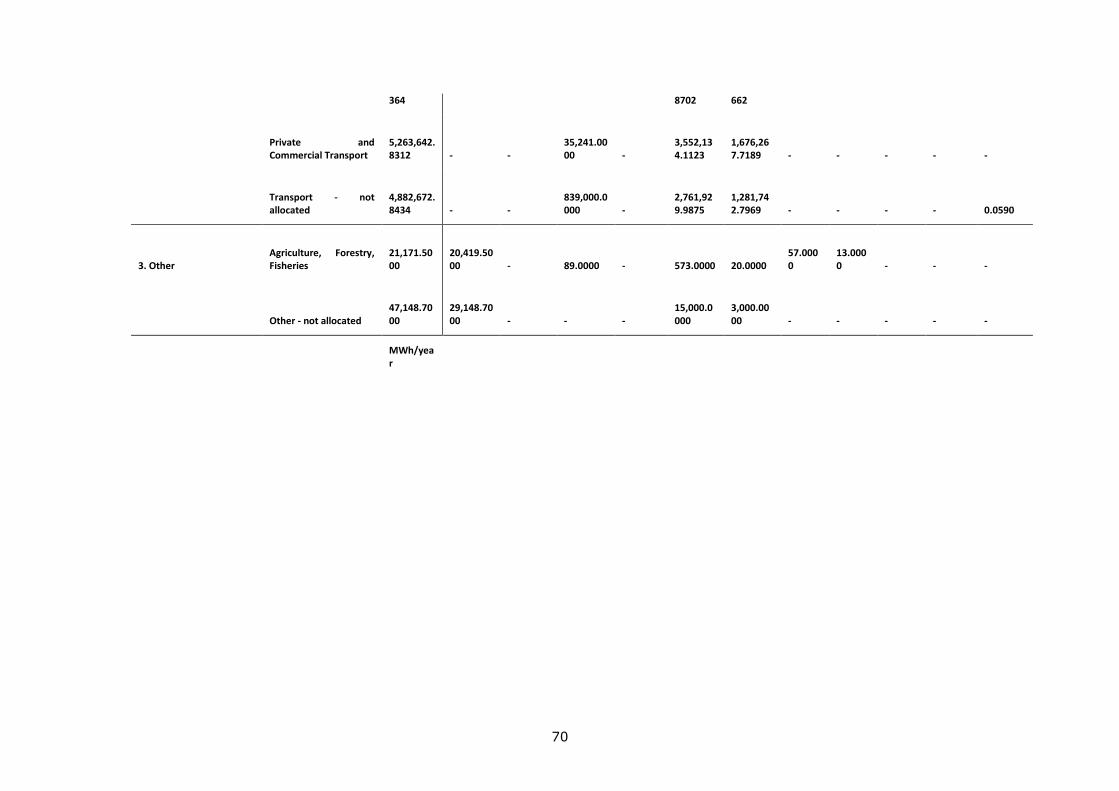
70
364 8702 662
Private and Commercial Transport
5,263,642.8312
-
-
35,241.0000
-
3,552,134.1123
1,676,267.7189
-
-
-
-
-
Transport - not allocated
4,882,672.8434
-
-
839,000.0000
-
2,761,929.9875
1,281,742.7969
-
-
-
-
0.0590
3. Other Agriculture, Forestry, Fisheries
21,171.5000
20,419.5000
-
89.0000
-
573.0000
20.0000
57.0000
13.0000
-
-
-
Other - not allocated
47,148.7000
29,148.7000
-
-
-
15,000.0000
3,000.0000
-
-
-
-
-
MWh/year

71
Annex IV. Final energy consumption in CoM-South signatories by sectors and energy sources
Electricity Natural Gas
Liquid Gas Heating Oil
Diesel Gasoline Coal Other Fossil Fuels
Other Biomass
Solar Thermal
Non Allocated
Other Agriculture, Forestry, Fisheries
20,419.50
-
89.00
-
573.00
20.00
57.00
13.00
-
-
-
Other - not allocated 29,148.70
-
-
-
15,000.00
3,000.00
-
-
-
-
-
Transport Municipal Fleet -
-
-
-
61,104.54
5,824.97
-
-
-
-
-
Public transport -
-
-
-
252,007.87
74,782.67
-
-
-
-
-
Private and Commercial Transport
-
-
35,241.00
-
3,552,134.11
1,676,267.72
-
-
-
-
-
Transport - not allocated -
-
839,000.00
-
2,761,929.99
1,281,742.80
-
-
-
-
0.06
Buildings, Equipment, Facilities & Industries
Municipal buildings, Equipment, Facilities
123,248.04
1,464.00
155.59
-
3,810.33
135.60
-
-
-
-
-
Tertiary buildings, Equipment, Facilities
1,631,912.70
286,901.00
105,760.21
17,421.6001
17,675.90
960.95
441.60
418.15
57,069.00
-
-
Residential buildings
2,316,288.13
2,911,120.00
1,907,475.56
20,191.1702
121,114.98
6,246.00
9,833.50
5,810.78
1,359.45
279,789.43
2,590.75
Municipal Public Lighting 163,839.09
-
-
-
-
-
-
-
-
-
2,618.87
Industries (non ETS) 884,357.45
516,592.00
87,344.44
549,712.0
346,367.42
3,779.67
2,604.03
24,154.9
-
-
32,290.00

72
000 9
BEFI - Not allocated 41,402.59
126,954.40
-
-
-
-
-
-
-
-
(2,618.87)
5,210,616.2043
3,843,031.40
2,975,065.7966
587,324.7703
7,131,718.1399
3,052,760.37
12,936.13
30,396.92
58,428.45
279,789.43
34,880.81
0 1,000,000 2,000,000 3,000,000 4,000,000 5,000,000 6,000,000 7,000,000 8,000,000
Agriculture, Forestry, Fisheries
Other - not allocated
Municipal Fleet
Public transport
Private and Commercial Transport
Transport - not allocated
Municipal buildings, Equipment, Facilities
Tertiary buildings, Equipment, Facilities
Residential buildings
Municipal Public Lighting
Industries (non ETS)
BEFI - Not allocated
Oth
er
Tran
spo
rtB
uild
ings
, Eq
uip
men
t,Fa
cilit
ies
& In
du
stri
es
MWh/year
Final energy consumption in CoM-South signatories by sectors and energy sources
Electricity Natural Gas Liquid Gas Heating Oil Diesel Gasoline Coal Other Fossil Fuels Other Biomass Solar Thermal Non Allocated
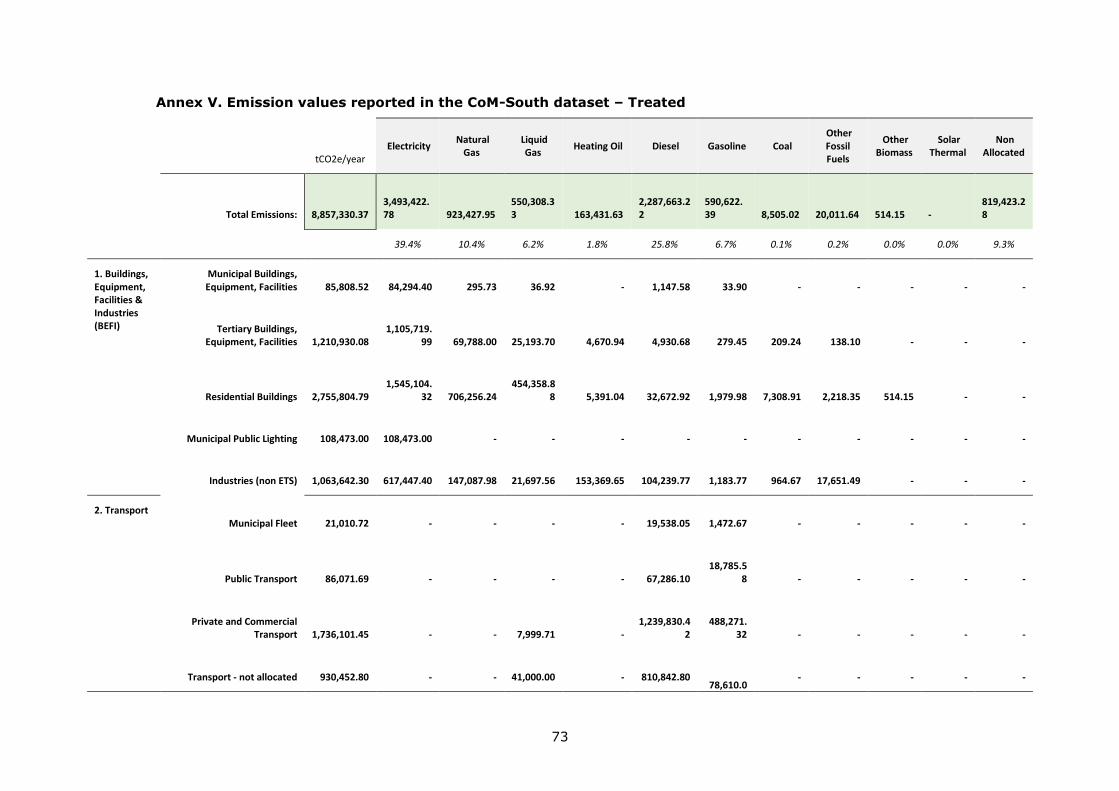
73
Annex V. Emission values reported in the CoM-South dataset – Treated
tCO2e/year Electricity
Natural Gas
Liquid Gas
Heating Oil Diesel Gasoline Coal Other Fossil Fuels
Other Biomass
Solar Thermal
Non Allocated
Total Emissions: 8,857,330.37
3,493,422.78
923,427.95
550,308.33 163,431.63
2,287,663.22
590,622.39
8,505.02
20,011.64
514.15
-
819,423.28
39.4% 10.4% 6.2% 1.8% 25.8% 6.7% 0.1% 0.2% 0.0% 0.0% 9.3%
1. Buildings, Equipment, Facilities & Industries (BEFI)
Municipal Buildings, Equipment, Facilities
85,808.52
84,294.40
295.73
36.92 -
1,147.58
33.90
-
-
-
-
-
Tertiary Buildings, Equipment, Facilities
1,210,930.08
1,105,719.
99
69,788.00
25,193.70 4,670.94
4,930.68
279.45
209.24
138.10
-
-
-
Residential Buildings
2,755,804.79
1,545,104.
32
706,256.24
454,358.8
8 5,391.04
32,672.92
1,979.98
7,308.91
2,218.35
514.15
-
-
Municipal Public Lighting
108,473.00
108,473.00
-
- -
-
-
-
-
-
-
-
Industries (non ETS)
1,063,642.30
617,447.40
147,087.98
21,697.56 153,369.65
104,239.77
1,183.77
964.67
17,651.49
-
-
-
2. Transport Municipal Fleet
21,010.72
-
-
- -
19,538.05
1,472.67
-
-
-
-
-
Public Transport
86,071.69
-
-
- -
67,286.10
18,785.5
8
-
-
-
-
-
Private and Commercial Transport
1,736,101.45
-
-
7,999.71 -
1,239,830.4
2
488,271.
32
-
-
-
-
-
Transport - not allocated
930,452.80
-
-
41,000.00 -
810,842.80 78,610.0
-
-
-
-
-
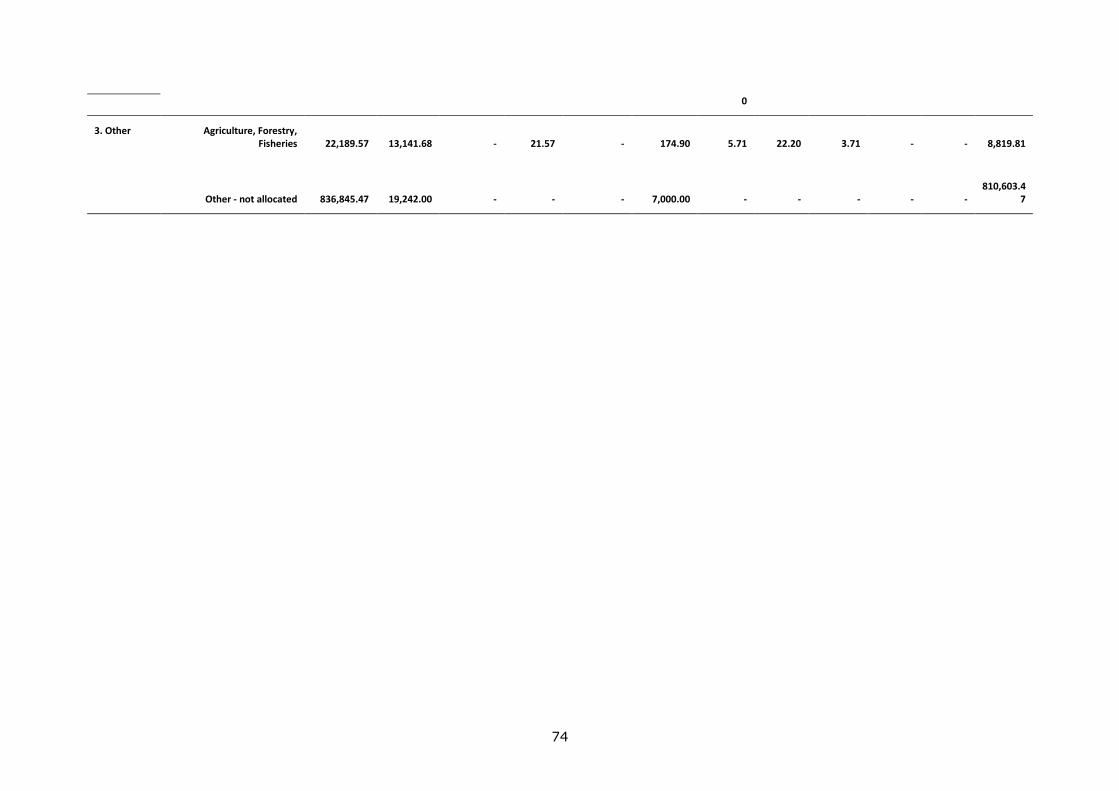
74
0
3. Other Agriculture, Forestry, Fisheries
22,189.57
13,141.68
-
21.57 -
174.90
5.71
22.20
3.71
-
-
8,819.81
Other - not allocated
836,845.47
19,242.00
-
- -
7,000.00
-
-
-
-
-
810,603.4
7

75
Annex VI. Aggregated emissions reported by the CoM-South Signatories by sectors and energy sources
(tCO2e/year, corrected values)
Electricity Natural Gas Liquid Gas
Heating Oil
Diesel Gasoline Coal Other Fossil Fuels
Other Biomass
Solar Thermal
Non Allocated
Buildings, Equipment, Facilities & Industries (BEFI)
Municipal Buildings, Equipment, Facilities
84,294.40
295.73
36.92
-
1,147.58
33.90
-
-
-
- -
Tertiary Buildings, Equipment, Facilities
1,105,719.99
69,788.00
25,193.70
4,670.94
4,930.68
279.45
209.24
138.10
-
- -
Residential Buildings
1,545,104.32
706,256.24
454,358.88
5,391.04
32,672.92
1,979.98
7,308.91
2,218.35
514.15
- -
Municipal Public Lighting 108,473.00
-
-
-
-
-
-
-
-
- -
Industries (non ETS) 617,447.40
147,087.98
21,697.56
153,369.65
104,239.77
1,183.77
964.67
17,651.49
-
- -
Transport Municipal Fleet
-
-
-
-
19,538.05
1,472.67
-
-
-
- -
Public Transport -
-
-
-
67,286.10
18,785.58
-
-
-
- -
Private and Commercial Transport -
-
7,999.71
-
1,239,830.42
488,271.32
-
-
-
- -
Transport - not allocated -
-
41,000.00
-
810,842.80
78,610.00
-
-
-
- -
Other Agriculture, Forestry, Fisheries
13,141.68
-
21.57
-
174.90
5.71
22.20
3.71
-
- 8,819.81

76
Other - not allocated 19,242.00
-
-
-
7,000.00
-
-
-
-
- 810,603.47
- 500,000.00 1,000,000.00 1,500,000.00 2,000,000.00 2,500,000.00 3,000,000.00
Municipal Buildings, Equipment, Facilities
Tertiary Buildings, Equipment, Facilities
Residential Buildings
Municipal Public Lighting
Industries (non ETS)
Municipal Fleet
Public Transport
Private and Commercial Transport
Transport - not allocated
Agriculture, Forestry, Fisheries
Other - not allocated
Bu
ildin
gs, E
qu
ipm
ent,
Faci
litie
s &
Ind
ust
ries
(BEF
I)Tr
ansp
ort
Oth
er
tCO2e/year
Global emissions reported by the CoM-South Signatories by sectors and energy sources (tCO2e/year, corrected values)
Electricity Natural Gas Liquid Gas Heating Oil Diesel Gasoline

77
Annex VII. Emissions reduction commitments of CoM-South Signatories
Country Signatory Adhesion Commitments SEAP/ SECAP
Emissions Reduction (tCO2-tCO2eq/yr)
Additional Reductions
Target Notes
1 Morocco Salé May-11 2020 SEAP 547,767.2
20.0% on 2020 BAU projection
2 Palestine Abasan Al-Kabira Nov-13; Jul-16 2020/2030/Adapt SEAP 8,511.3
30.0% on 2020 BAU projection
3 Tunisia Sfax Feb-14 2020 SEAP 257,129.0
20.0% on 2020 BAU projection
4 Israel Rosh Ha'Ayin Apr-14 2020 SEAP 73,963.7
20.0% on 2020 BAU projection
5 Israel Ramla Feb-14 2020 SEAP 231,954.3
20.0% on 2020 BAU projection
6 Morocco Agadir Feb-14 2020 SEAP 234,116.0
20.8% on 2020 BAU projection
7 Israel Shefa-Amer Mar-14 2020 SEAP 27,966.7
20.0% on 2020 BAU projection
8 Morocco Oujda Mar-14 2020 SEAP 155,956.0
20.3% on 2020 BAU projection
9 Algeria Batna Feb-14 2020 SEAP 347,422.0
20.3% on 2020 BAU projection
10 Lebanon Menjez Sep-14 2020 SEAP 375.0
25.0% on 2020 BAU projection
11 Lebanon Baakline Apr-14 2020 SEAP 8,139.0
25.0% on 2020 BAU projection
12 Palestine Hebron Oct-14 2020 SEAP 113,040.0
20.0% on 2020 BAU projection
13 Algeria Sidi Bel Abbes Mar-14 2020 SEAP 170,753.0
20.1% on 2020 BAU projection
14 Morocco Benslimane Oct-14 2020 SEAP 20,278.0
20.0% on 2020 BAU projection
15 Palestine Nablus May-15 2020 SEAP 100,171.0
20.0% on 2020 BAU projection
16 Jordan Sahab Jun-15 2020 SEAP 18,411.0 53,791.0 5%/14% on 2020/2030 BAU projections
17 Algeria Boumerdès Nov-14 2020 SEAP 36,075.0
20.1% on 2020 BAU projection
18 Morocco Chefchaouen Dec-15 2020 SEAP 18,863.4
21.0% on 2020 BAU projection

78
19 Palestine Tulkarm Feb-14 2020 SEAP 47,419.0
20.0% on 2020 BAU projection
20 Lebanon Kab Elias – Wadi El Delm Nov-16 2020 SEAP 17,272.0 26.0% on 2020 BAU projection
2,435,582.6
21 Jordan Aqaba Special Economic Zone Nov-17 2030 Adapt SECAP 85,122.9 243,208.2 14%/40% to 2030, INDC and contingent
22 Jordan Karak Jan-18 2030 Adapt SECAP 59,009.8 168,599.3 14%/40% to 2030, INDC and contingent
144,132.6 411,807.5
2,579,715.2 2,991,522.7

79
Annex VIII. Implementation estimates by Sectors and Subsectors
Estimated Cost (EUR)
Energy Savings Target
(MWh/year)
Reduction Target* (tCO2/tCO2eq/year)
Totals: 2,477,851,333.00 3,443,758.20 2,980,078.71
1. Buildings, Equipment, Facilities & Industries (BEFI) 1,723,308,235.00 2,361,864.63 1,475,752.68 49.5%
Municipal Buildings, Equipment, Facilities 157,826,658.00 104,120.07 231,221.07
Tertiary Buildings, Equipment, Facilities 555,123,859.00 443,005.67 335,522.72
Residential Buildings 840,243,680.00 1,389,062.46 658,301.68
Municipal Public Lighting 39,731,754.00 70,754.75 49,894.53
Industries (non ETS) 130,382,284.00 354,921.68 200,812.67
2. Transport 677,349,250.00 1,063,813.82 709,163.17 23.8%
3. Other 16,991,396.00 7,952.75 640,033.59 21.5%
4. Local Electricity Production 59,202,452.00 127.00 155,029.27 5.2%
5. Local Heat/Cold Production 1,000,000.00 10,000.00 100.00 < 1%
80
* This aggregated total includes the commitments by all CoM-South signatories to 2020 and 2030. The total differs slightly (11.4 kt) from figures reported globally as not all actions have been specifically quantified by signatories in their SEAP/SECAP documents.

81
Annex IX. Emissions reduction commitments of CoM-South Signatories
Emissions Reduction
(tCO2-tCO2eq/yr)
Aggregated total to 2020 from SEAP Documents:
2,435,582.6
2030 target (14%) and contingent target (40%):
85,122.9 243,208.2 2030 target (14%) and contingent target (40%):
59,009.8 168,599.3
144,132.6 411,807.5
A. Aggregated total with 2030 targets from SEAP/SECAP Documents:
2,579,715.2 2,991,522.7 Reference value
Difference with reference value
B. Aggregated total from sectors and sub-sectors:
2,980,078.7 0.38%
(Annex VIII; data set 26 March 2018):
C. Aggregated total of values reported from "Key Actions":
2,395,987.3 19.91%
(data set 26 March 2018):

82
Annex X. Estimated budget reported by CoM-South signatories
Country Signatory Local Authority -
Investment Local Authority – non investment
Other Actors – Investment
Other Actors – non investment
Subtotal EUR
1 Morocco Salé 23,996,115 - 335,526,025 - 359,522,140 2 Palestine Abasan Al-Kabira 360,000 210,000 2,200,000 910,000 3,680,000 3 Tunisia Sfax 17,000,000 - 192,000,000 - 209,000,000 4 Israel Rosh Ha'Ayin 2,490,000 - 129,654,000 - 132,144,000 5 Israel Ramla 1,676,666 - 153,851,904 - 155,528,570 6 Morocco Agadir 33,176,500 - 589,029,312 - 622,205,812 7 Israel Shefa-Amer 1,166,667 - 28,240,500 - 29,407,167 8 Morocco Oujda 128,800,000 - 273,609,984 - 402,409,984 9 Algeria Batna 2,000,000 - - - 2,000,000 10 Lebanon Menjez 50,000 100,000 1,000,000 - 1,150,000 11 Lebanon Baakline 1,910,000 - 17,190,000 - 19,100,000 12 Palestine Hebron 2,097,300 - 137,722,704 - 139,820,004 13 Algeria Sidi Bel Abbes 3,000,000 - - - 3,000,000 14 Morocco Benslimane 23,036,760 - 6,881,110 - 29,917,870 15 Palestine Nablus 698,000 - 47,000,000 - 47,698,000 16 Jordan Sahab 35,000 - 560,000 105,000 700,000 17 Algeria Boumerdès 1,000,000 - - - 1,000,000 18 Morocco Chefchaouen 200,000 - - - 200,000 19 Palestine Tulkarm 600,000 - 42,000,000 - 42,600,000 20 Lebanon Kab Elias – Wadi El Delm 7,562,350 - - - 7,562,350
21 Jordan Aqaba Special Economic
Zone 49,019,000 - 461,972,992 - 510,991,992 22 Jordan Karak 33,604,096 - 243,198,208 - 276,802,304
333,478,454 310,000 2,661,636,739 1,015,000 2,996,440,193
11.1% < 1% 88.8% < 1%
Aggregated Committed Emissions Reduction: 2,991,523
tCO2-tCO2eq/year (Annex VII)
Average budgeted cost per ton of emissions reductions: 1,002 EUR

83
Annex XI. Overview of key values and indicators reported by CoM-South signatories
BEI Reference Years
OID Country Signatory Population Energy Consumption (GWh/year)
Emissions (tCO2eq/year)
Per capita energy consumption (MWh/cap/year)
Per capita GHG Emissions (tCO2eq/cap/yea))
3304 Morocco Salé 903,485 2,147.8980 875,361.91 2.38 0.97
6492 Palestine Abasan Al-Kabira 25,211 76.9150 30,273.11 3.05 1.20
6958 Tunisia Sfax 291,563 2,449.4720 759,066.28 8.40 2.60
6959 Israel Rosh Ha'Ayin 39,900 416.6442 236,005.73 10.44 5.91
6960 Israel Ramla 76,000 1,701.9123 912,953.37 22.39 12.01
7016 Morocco Agadir 414,102 2,155.5560 806,090.92 5.21 1.95
7042 Israel Shefa-Amer 40,000 214.9240 114,061.62 5.37 2.85
7266 Morocco Oujda 484,901 1,600.3040 549,323.38 3.30 1.13
7320 Algeria Batna 386,846 4,693.4000 1,512,900.00 12.13 3.91
7364 Lebanon Menjez 1,410 2.1237 1,588.80 1.51 1.13
7480 Lebanon Baakline 17,000 76.2686 25,635.37 4.49 1.51
7494 Palestine Hebron 202,172 838.5590 450,548.13 4.15 2.23
7632 Algeria Sidi Bel Abbes 295,000 2,706.4400 747,440.00 9.17 2.53
7798 Morocco Benslimane 55,910 191.8030 74,326.38 3.43 1.33
7933 Palestine Nablus 192,000 705.4110 398,783.08 3.67 2.08
8004 Jordan Sahab* 160,000 968.5780 284,184.00 6.05 1.78
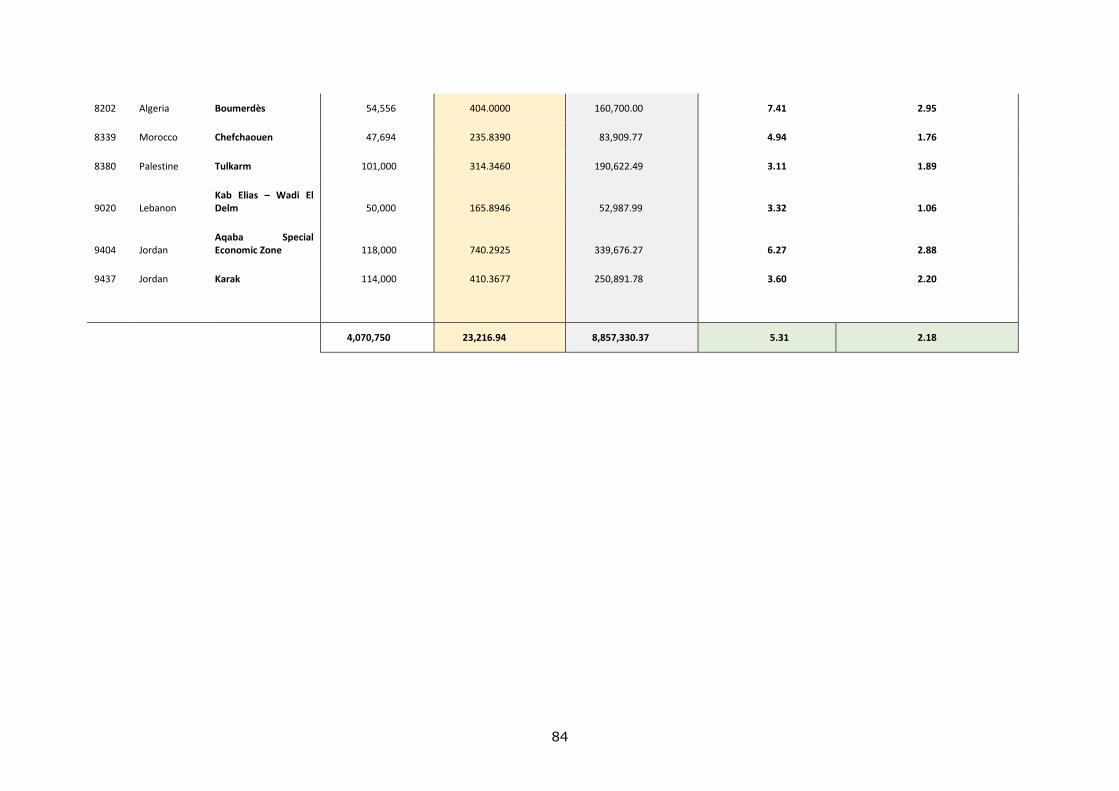
84
8202 Algeria Boumerdès 54,556 404.0000 160,700.00 7.41 2.95
8339 Morocco Chefchaouen 47,694 235.8390 83,909.77 4.94 1.76
8380 Palestine Tulkarm 101,000 314.3460 190,622.49 3.11 1.89
9020 Lebanon Kab Elias – Wadi El Delm 50,000 165.8946 52,987.99 3.32 1.06
9404 Jordan Aqaba Special Economic Zone 118,000 740.2925 339,676.27 6.27 2.88
9437 Jordan Karak 114,000 410.3677 250,891.78 3.60 2.20
4,070,750 23,216.94 8,857,330.37 5.31 2.18

85
Annex XII. Comparison of energy consumption values reported by CoM-South Signatories
Energy consumption values reported in SEAP/SECAP documents (GWh/year)
OID Country Signatory
Total consumpt
ion ( A )
Difference
between figures
A - B
Sum of sectors ( B )
Mpal Bldgs, Equip, Facil
Res Bldgs
Tertiary Mpal Public
Lighting
Industries (non
ETS)
Mpal Fleet
Transp - Not
allocated
Water Waste
Agric, Forestry
, Fisherie
s
Others
1 3304 Morocco Salé
2147.89 165.74 7.7% 1982.16 0.69 678.3
2 42.87 26.00 0.00 0.00 1234.
29 -
-
-
-
2 6492 Palestine Abasan Al-
Kabira 76.914 0.00 0.0% 76.91 0.48 39.54 4.28 0.72 5.35 0.00 26.54 -
-
-
-
3 6958 Tunisia Sfax
2449.47 3.09 0.1% 2446.38 10.10 416.9
9 126.41 9.63 689.34 0.00 1193.
92 -
-
-
-
4 6959 Israel Rosh Ha'Ayin
416.64 0.00 0.0% 416.64 4.55 128.5
9 136.41 4.41 21.11 0.00 120.8
1 -
-
0.77
-
5 6960 Israel Ramla
1701.91 0.00 0.0% 1701.91 9.14 368.4
8 343.74 5.39 279.40 0.00 688.8
6 -
-
6.90
-
6 7016 Morocco Agadir
2155.55 0.00 0.0% 2155.56 10.61 425.5
3 280.23 21.98 262.79 0.00 1154.
43 -
-
-
7 7042 Israel Shefa-Amer
214.92 0.00 0.0% 214.92 1.96 95.17 31.21 1.88 4.51 0.00 80.17 -
-
0.03
-
8 7266 Morocco Oujda
1600.30 0.00 0.0% 1600.31 18.62 446.4
4 104.78 21.85 106.61 0.00 902.0
1 -
-
-
9 7320 Algeria Batna
4694.0 -0.40 0.0% 4694.40 2.30 2595.
00 186.70 11.40 524.00 2.60 1356.
40 6.00
8.00
2.00
-
10 7364 Lebanon Menjez
2.37 0.25 10.6% 2.12 0.07 0.50 0.30 0.09 0.00 0.00 0.81 -
-
-
0.36
11 7480 Lebanon Baakline
76.26 0.00 0.0% 76.27 0.45 35.38 6.35 1.87 0.00 0.00 32.22 -
-
-
-
12 7494 Palestine Hebron
838.55 0.00 0.0% 838.56 2.27 275.9
0 81.28 5.86 135.61 0.00 334.8
5 1.01
1.43
0.35
-
13 7632 Algeria Sidi Bel
Abbes 2017.00 0.00 0.0% 2017.00
859.00 199.00 14.00 136.00 0.00
774.00
20.00
7.00
8.00
-
14 7798 Morocco Benslimane
191.80 0.00 0.0% 191.80 0.93 43.61 15.97 3.04 35.01 0.00 93.24 -
-
-
-
15 7933 Palestine Nablus
705.41 0.00 0.0% 705.41 11.10 237.2
4 81.06 6.78 59.08 0.00 278.3
4 30.22
1.43
0.15
-
16 8004 Jordan Sahab*
968.58 0.00 0.0% 968.58
71.63 25.74 0.32 120.81 0.00 748.8
3 0.79
-
0.46
-
17 8202 Algeria Boumerdès
402.00 -1.00 -0.2% 403.00
204.00 56.00 5.00 48.00 0.00 83.00
2.00
3.00
2.00
-
18 8339 Morocco Chefchaouen
235.83 0.00 0.0% 235.84 0.32 49.03 22.97 1.90 0.88 0.00 160.7
4
-
19 8380 Palestine Tulkarm
314.34700 0.00 0.0% 314.35 2.93
139.00 19.26 4.46 18.72 0.00
125.38
4.23
-
0.38
-
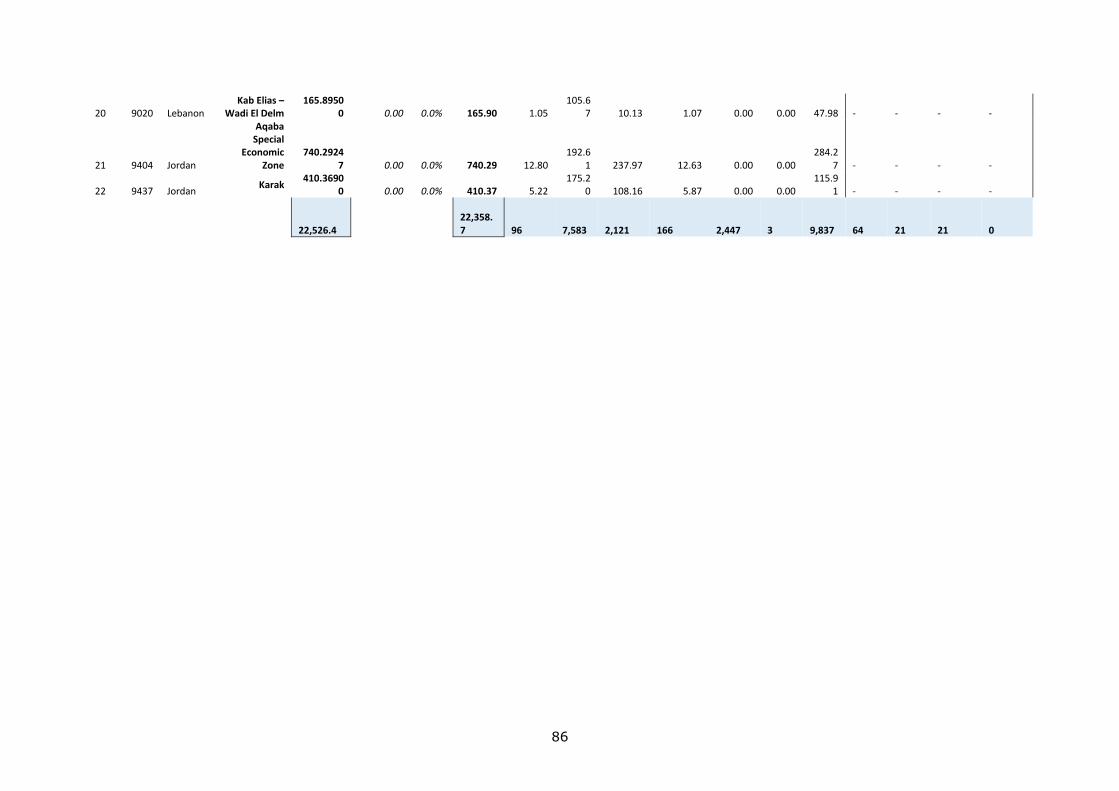
86
20 9020 Lebanon Kab Elias –
Wadi El Delm 165.8950
0 0.00 0.0% 165.90 1.05 105.6
7 10.13 1.07 0.00 0.00 47.98 -
-
-
-
21 9404 Jordan
Aqaba Special
Economic Zone
740.29247 0.00 0.0% 740.29 12.80
192.61 237.97 12.63 0.00 0.00
284.27
-
-
-
-
22 9437 Jordan Karak
410.36900 0.00 0.0% 410.37 5.22
175.20 108.16 5.87 0.00 0.00
115.91
-
-
-
-
22,526.4
22,358.7
96
7,583
2,121
166
2,447
3
9,837
64
21
21
0
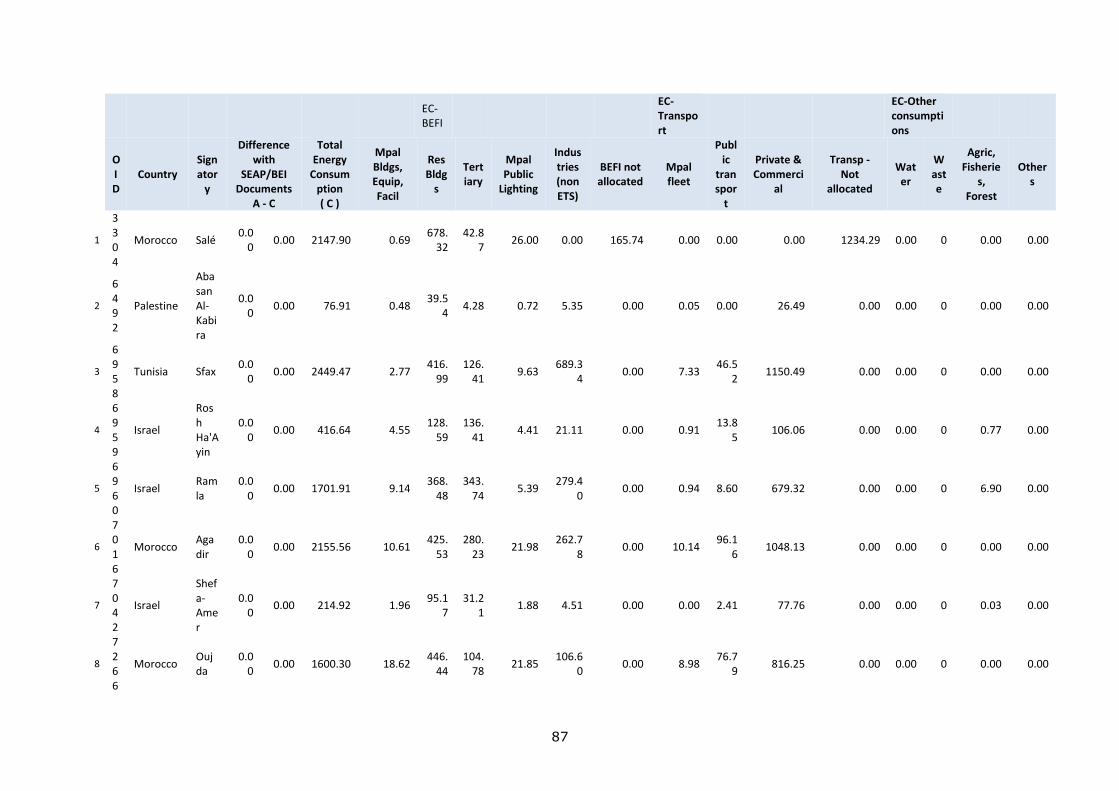
87
EC-BEFI
EC-Transport
EC-Other consumptions
OID
Country Signator
y
Difference with
SEAP/BEI Documents
A - C
Total Energy
Consumption ( C )
Mpal Bldgs, Equip, Facil
Res Bldg
s
Tertiary
Mpal Public
Lighting
Industries (non ETS)
BEFI not allocated
Mpal fleet
Public
transpor
t
Private & Commerci
al
Transp - Not
allocated
Water
Waste
Agric, Fisherie
s, Forest
Others
1
3304
Morocco Salé 0.0
0 0.00 2147.90 0.69
678.32
42.87
26.00 0.00 165.74 0.00 0.00 0.00 1234.29 0.00 0 0.00 0.00
2
6492
Palestine
Abasan Al-Kabira
0.00
0.00 76.91 0.48 39.5
4 4.28 0.72 5.35 0.00 0.05 0.00 26.49 0.00 0.00 0 0.00 0.00
3
6958
Tunisia Sfax 0.0
0 0.00 2449.47 2.77
416.99
126.41
9.63 689.3
4 0.00 7.33
46.52
1150.49 0.00 0.00 0 0.00 0.00
4
6959
Israel
Rosh Ha'Ayin
0.00
0.00 416.64 4.55 128.
59 136.
41 4.41 21.11 0.00 0.91
13.85
106.06 0.00 0.00 0 0.77 0.00
5
6960
Israel Ramla
0.00
0.00 1701.91 9.14 368.
48 343.
74 5.39
279.40
0.00 0.94 8.60 679.32 0.00 0.00 0 6.90 0.00
6
7016
Morocco Agadir
0.00
0.00 2155.56 10.61 425.
53 280.
23 21.98
262.78
0.00 10.14 96.1
6 1048.13 0.00 0.00 0 0.00 0.00
7
7042
Israel
Shefa-Amer
0.00
0.00 214.92 1.96 95.1
7 31.2
1 1.88 4.51 0.00 0.00 2.41 77.76 0.00 0.00 0 0.03 0.00
8
7266
Morocco Oujda
0.00
0.00 1600.30 18.62 446.
44 104.
78 21.85
106.60
0.00 8.98 76.7
9 816.25 0.00 0.00 0 0.00 0.00
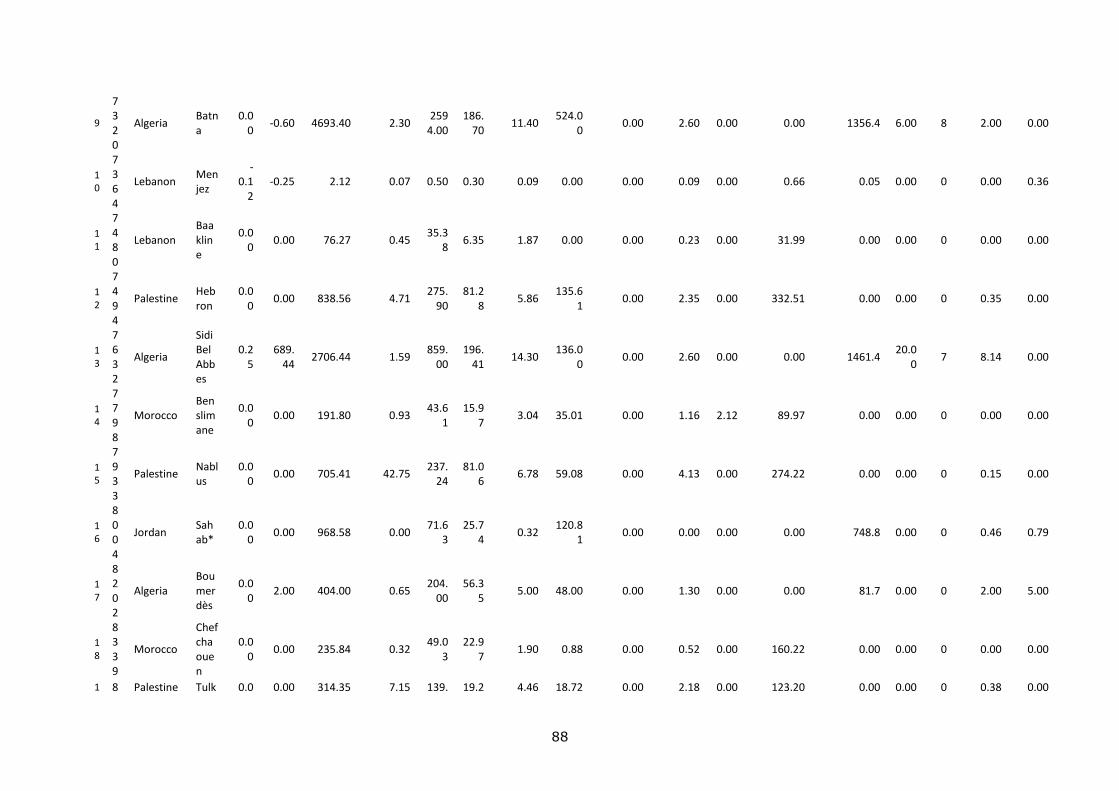
88
9
7320
Algeria Batna
0.00
-0.60 4693.40 2.30 259
4.00 186.
70 11.40
524.00
0.00 2.60 0.00 0.00 1356.4 6.00 8 2.00 0.00
10
7364
Lebanon Menjez
-0.1
2 -0.25 2.12 0.07 0.50 0.30 0.09 0.00 0.00 0.09 0.00 0.66 0.05 0.00 0 0.00 0.36
11
7480
Lebanon Baakline
0.00
0.00 76.27 0.45 35.3
8 6.35 1.87 0.00 0.00 0.23 0.00 31.99 0.00 0.00 0 0.00 0.00
12
7494
Palestine Hebron
0.00
0.00 838.56 4.71 275.
90 81.2
8 5.86
135.61
0.00 2.35 0.00 332.51 0.00 0.00 0 0.35 0.00
13
7632
Algeria
Sidi Bel Abbes
0.25
689.44
2706.44 1.59 859.
00 196.
41 14.30
136.00
0.00 2.60 0.00 0.00 1461.4 20.0
0 7 8.14 0.00
14
7798
Morocco Benslimane
0.00
0.00 191.80 0.93 43.6
1 15.9
7 3.04 35.01 0.00 1.16 2.12 89.97 0.00 0.00 0 0.00 0.00
15
7933
Palestine Nablus
0.00
0.00 705.41 42.75 237.
24 81.0
6 6.78 59.08 0.00 4.13 0.00 274.22 0.00 0.00 0 0.15 0.00
16
8004
Jordan Sahab*
0.00
0.00 968.58 0.00 71.6
3 25.7
4 0.32
120.81
0.00 0.00 0.00 0.00 748.8 0.00 0 0.46 0.79
17
8202
Algeria Boumerdès
0.00
2.00 404.00 0.65 204.
00 56.3
5 5.00 48.00 0.00 1.30 0.00 0.00 81.7 0.00 0 2.00 5.00
18
8339
Morocco
Chefchaouen
0.00
0.00 235.84 0.32 49.0
3 22.9
7 1.90 0.88 0.00 0.52 0.00 160.22 0.00 0.00 0 0.00 0.00
1 8 Palestine Tulk 0.0 0.00 314.35 7.15 139. 19.2 4.46 18.72 0.00 2.18 0.00 123.20 0.00 0.00 0 0.38 0.00
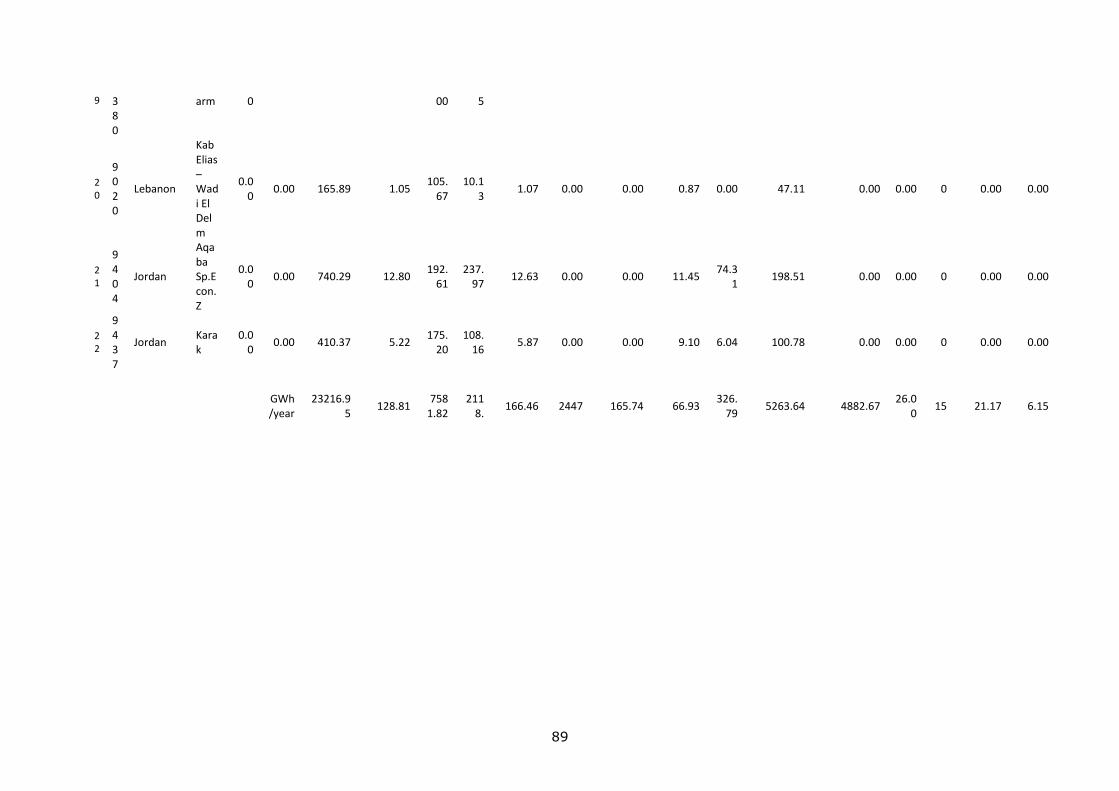
89
9 380
arm 0 00 5
20
9020
Lebanon
Kab Elias – Wadi El Delm
0.00
0.00 165.89 1.05 105.
67 10.1
3 1.07 0.00 0.00 0.87 0.00 47.11 0.00 0.00 0 0.00 0.00
21
9404
Jordan
Aqaba Sp.Econ. Z
0.00
0.00 740.29 12.80 192.
61 237.
97 12.63 0.00 0.00 11.45
74.31
198.51 0.00 0.00 0 0.00 0.00
22
9437
Jordan Karak
0.00
0.00 410.37 5.22 175.
20 108.
16 5.87 0.00 0.00 9.10 6.04 100.78 0.00 0.00 0 0.00 0.00
GWh/year
23216.95
128.81 758
1.82 211
8. 166.46 2447 165.74 66.93
326.79
5263.64 4882.67 26.0
0 15 21.17 6.15
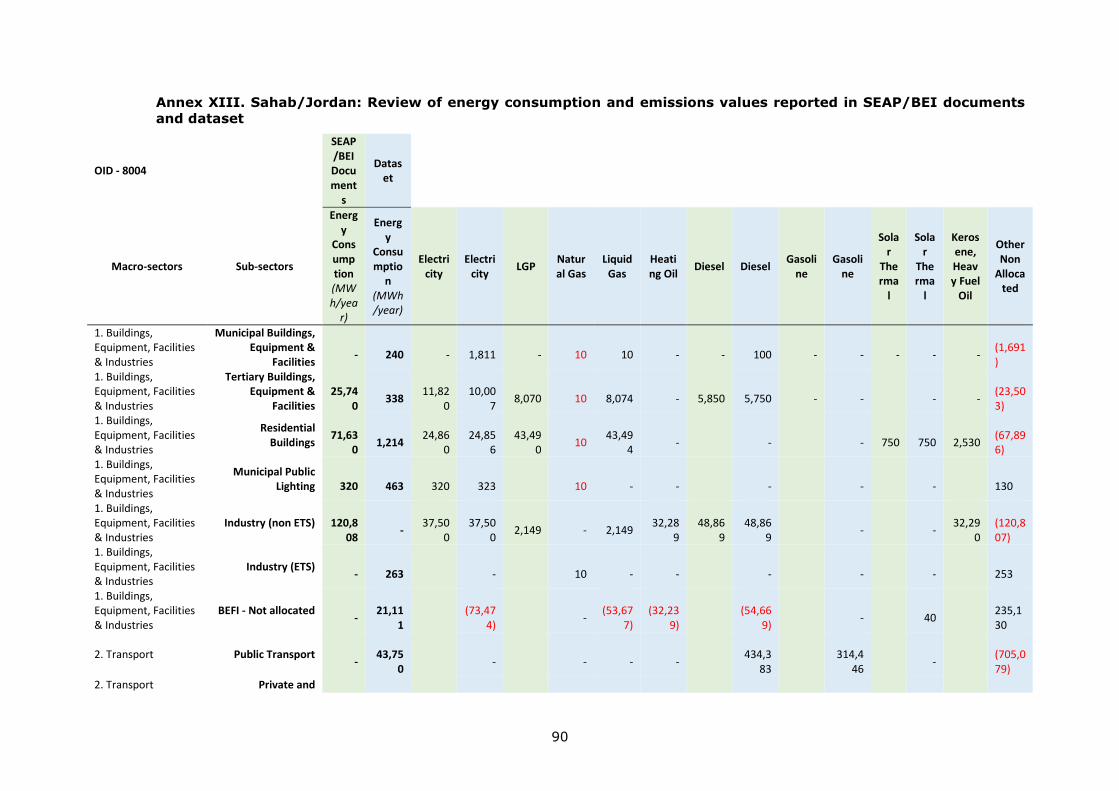
90
Annex XIII. Sahab/Jordan: Review of energy consumption and emissions values reported in SEAP/BEI documents
and dataset
OID - 8004
SEAP/BEI Document
s
Dataset
Macro-sectors Sub-sectors
Energy
Consump tion (MWh/yea
r)
Energy
Consumptio
n (MWh/year)
Electricity
Electricity
LGP Natural Gas
Liquid Gas
Heating Oil
Diesel Diesel Gasoli
ne Gasoli
ne
Solar
Therma
l
Solar
Therma
l
Kerosene, Heavy Fuel
Oil
Other Non
Allocated
1. Buildings, Equipment, Facilities & Industries
Municipal Buildings, Equipment &
Facilities
-
240
-
1,811
-
10
10
-
-
100
-
-
-
-
-
(1,691)
1. Buildings, Equipment, Facilities & Industries
Tertiary Buildings, Equipment &
Facilities
25,74
0
338
11,82
0
10,00
7
8,070
10
8,074
-
5,850
5,750
-
-
-
-
(23,503)
1. Buildings, Equipment, Facilities & Industries
Residential Buildings
71,63
0
1,214
24,86
0
24,85
6
43,49
0
10
43,49
4
-
-
-
750
750
2,530
(67,896)
1. Buildings, Equipment, Facilities & Industries
Municipal Public Lighting
320
463
320
323
10
-
-
-
-
-
130
1. Buildings, Equipment, Facilities & Industries
Industry (non ETS)
120,808
-
37,50
0
37,50
0
2,149
-
2,149
32,28
9
48,86
9
48,86
9
-
-
32,29
0
(120,807)
1. Buildings, Equipment, Facilities & Industries
Industry (ETS)
-
263
-
10
-
-
-
-
-
253
1. Buildings, Equipment, Facilities & Industries
BEFI - Not allocated
-
21,11
1
(73,47
4)
-
(53,67
7)
(32,23
9)
(54,66
9)
-
40
235,130
2. Transport Public Transport
-
43,75
0
-
-
-
-
434,3
83
314,4
46
-
(705,079)
2. Transport Private and

91
Commercial Transport
- - - - - - - - - -
2. Transport Transport - Not
allocated
748,8
30
(42,87
0)
-
-
-
-
434,3
80
(433,9
48)
314,4
50
(314,1
31)
-
705,209
3. Other Agriculture,
Forestry & Fisheries
460
600
460
460
-
-
-
-
-
-
140
3. Other Other - Not
allocated
790
-
790
-
-
-
-
-
-
-
-
968,5
78
25,10
9
75,75
0
1,483
53,70
9
50
50
50
489,0
99
485
314,4
50
315
750
790
34,82
0
21,88
6

92
Annex XIV. Energy consumptions values reported in the CoM-South dataset (not treated)
GWh/year
Electric.
Heat/Cold
Natural Gas
Liquid Gas
Heating Oil
Diesel Gasoline Lignite Coal Other Fossil Fuels
Plant Oil
Bio-Fuel
Other Bioma
ss
Solar Therm
al
Geothermal
Non Allocat
ed
Total Energy Consumption:
22,222.2807
5,095.6492
-
3,843.0814
2,929.3668
587.3748
6,581.6914
2,735.6254
-
12.93613
30.3969
-
-
58.428450
279.8294276
-
67.9008
MWh/year
1. Buildings, Equipment, Facilities & Industries (BEFI)
Municipal buildings,
Equipment, Facilities
124,513.5
601
120,556.2401
-
1,474.0
000
165.590
0
-
3,873.1300
135.6000
-
-
-
-
-
-
-
-
(1,691.0
000)
Tertiary buildings,
Equipment, Facilities
1,653,699
.1118
1,481,747.401
7
-
3,911.0
000
97,764.2
100
17,421.
6001
17,468.200
0
960.9500
-
441.600
0
418.150
0
-
-
57,069.000
0
-
-
(23,503.
0000)
Residential buildings
3,854,403
.7441
1,894,497.930
2
-
16,130.
0000
1,567,47
9.5566
20,191.
1702
120,901.18
00
6,246.0000
-
9,833.50
00
5,810.7
800
-
-
1,359.
4500
279,789.4276
-
(67,835.
2505)
Municipal Public Lighting
135,900.9
609
133,142.0930
-
10.0000
-
-
-
-
-
-
-
-
-
-
-
-
2,748.8
679
Industries (non ETS)
1,618,393
.9994
708,357.4495
-
101,592
.0000
61,344.4
400
582,001.0000
255,367.41
99
3,779.6700
-
2,604.03
00
24,154.
9900
-
-
-
-
-
(120,807.0000)
Industries (ETS)
263.0000
-
-
10.0000
-
-
-
-
-
-
-
-
-
-
-
-
253.000
0
BEFI - Not allocated
5,033,849
.1203
748,928.5898
-
3,719,9
54.3984
328,323.
0000
(32,239.0000
)
(9,623.000
0)
-
-
-
-
-
-
-
40.000
0
-
278,465
.1321
2. Transport
Municipal Fleet
60,429.51
00
-
-
-
-
-
54,604.540
0
5,824.9700
-
-
-
-
-
-
-
-
-
Public transport
371,199.3
364
-
-
-
-
-
686,390.87
389,887.466
2
-
-
-
-
-
-
-
-
(705,079.0000)
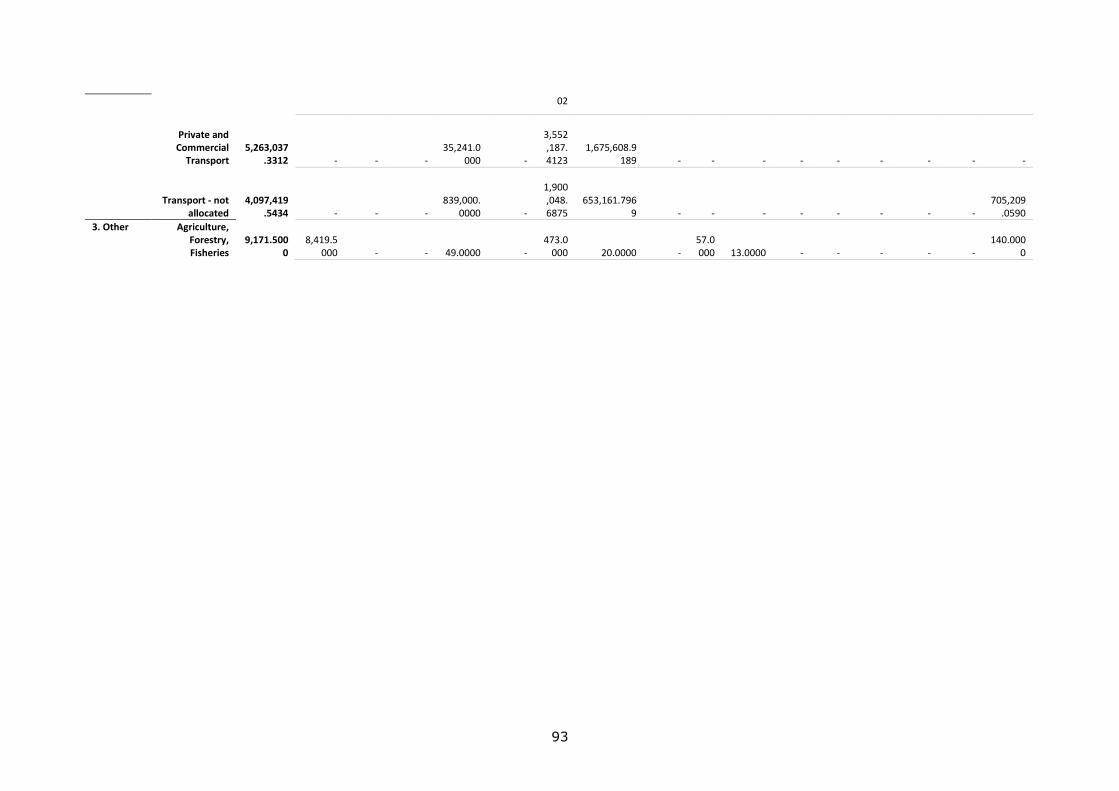
93
02
Private and Commercial
Transport
5,263,037
.3312
-
-
-
35,241.0
000
-
3,552,187.4123
1,675,608.9
189
-
-
-
-
-
-
-
-
-
Transport - not allocated
4,097,419
.5434
-
-
-
839,000.
0000
-
1,900,048.6875
653,161.796
9
-
-
-
-
-
-
-
-
705,209
.0590
3. Other Agriculture, Forestry, Fisheries
9,171.500
0
8,419.5
000
-
-
49.0000
-
473.0
000
20.0000
-
57.0000
13.0000
-
-
-
-
-
140.000
0
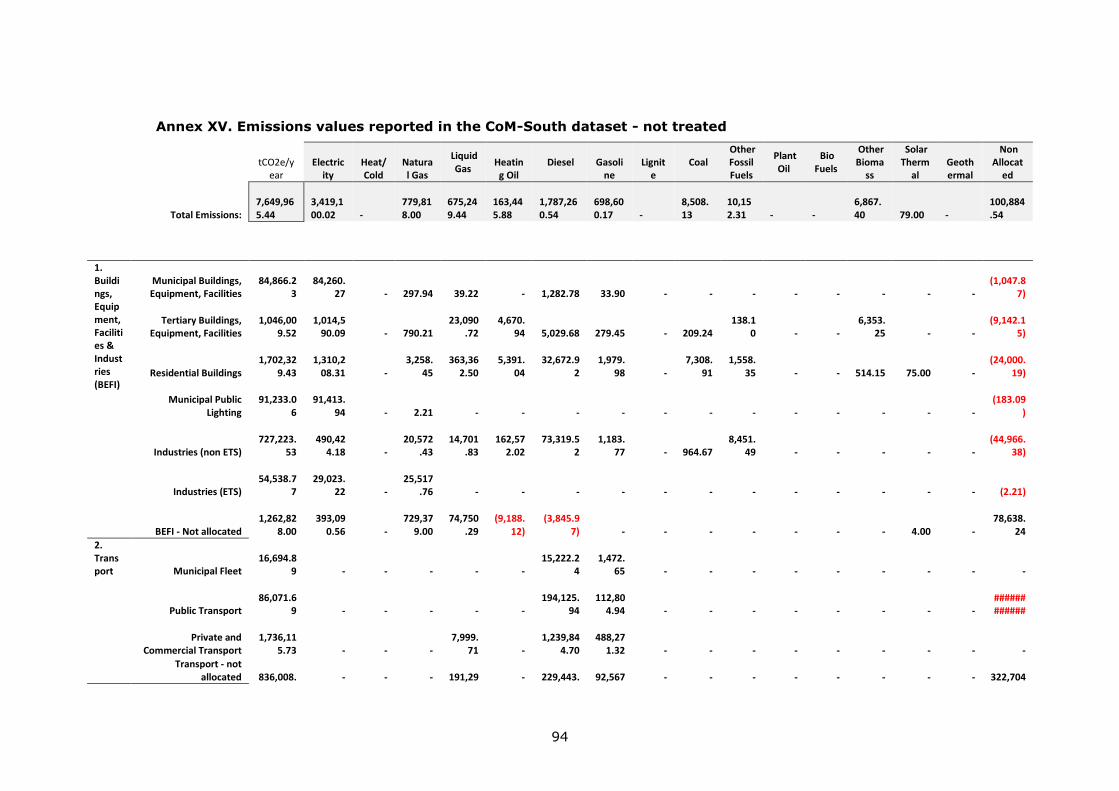
94
Annex XV. Emissions values reported in the CoM-South dataset - not treated
tCO2e/year
Electric
ity
Heat/Cold
Natural Gas
Liquid Gas
Heating Oil
Diesel
Gasoline
Lignit
e Coal
Other Fossil Fuels
Plant Oil
Bio Fuels
Other Bioma
ss
Solar Therm
al
Geothermal
Non Allocat
ed
Total Emissions:
7,649,965.44
3,419,100.02
-
779,818.00
675,249.44
163,445.88
1,787,260.54
698,600.17
-
8,508.13
10,152.31
-
-
6,867.40
79.00
-
100,884.54
1. Buildings, Equipment, Facilities & Industries (BEFI)
Municipal Buildings, Equipment, Facilities
84,866.2
3
84,260.
27
-
297.94
39.22
-
1,282.78
33.90
-
-
-
-
-
-
-
-
(1,047.8
7)
Tertiary Buildings, Equipment, Facilities
1,046,00
9.52
1,014,5
90.09
-
790.21
23,090
.72
4,670.
94
5,029.68
279.45
-
209.24
138.1
0
-
-
6,353.
25
-
-
(9,142.1
5)
Residential Buildings
1,702,32
9.43
1,310,2
08.31
-
3,258.
45
363,36
2.50
5,391.
04
32,672.9
2
1,979.
98
-
7,308.
91
1,558.
35
-
-
514.15
75.00
-
(24,000.
19)
Municipal Public Lighting
91,233.0
6
91,413.
94
-
2.21
-
-
-
-
-
-
-
-
-
-
-
-
(183.09
)
Industries (non ETS)
727,223.
53
490,42
4.18
-
20,572
.43
14,701
.83
162,57
2.02
73,319.5
2
1,183.
77
-
964.67
8,451.
49
-
-
-
-
-
(44,966.
38)
Industries (ETS)
54,538.7
7
29,023.
22
-
25,517
.76
-
-
-
-
-
-
-
-
-
-
-
-
(2.21)
BEFI - Not allocated
1,262,82
8.00
393,09
0.56
-
729,37
9.00
74,750
.29
(9,188.
12)
(3,845.9
7)
-
-
-
-
-
-
-
4.00
-
78,638.
24
2. Transport Municipal Fleet
16,694.8
9
-
-
-
-
-
15,222.2
4
1,472.
65
-
-
-
-
-
-
-
-
-
Public Transport
86,071.6
9
-
-
-
-
-
194,125.
94
112,80
4.94
-
-
-
-
-
-
-
- ############
Private and Commercial Transport
1,736,11
5.73
-
-
-
7,999.
71
-
1,239,84
4.70
488,27
1.32
-
-
-
-
-
-
-
-
-
Transport - not allocated
836,008.
-
-
-
191,29
-
229,443.
92,567
-
-
-
-
-
-
-
-
322,704
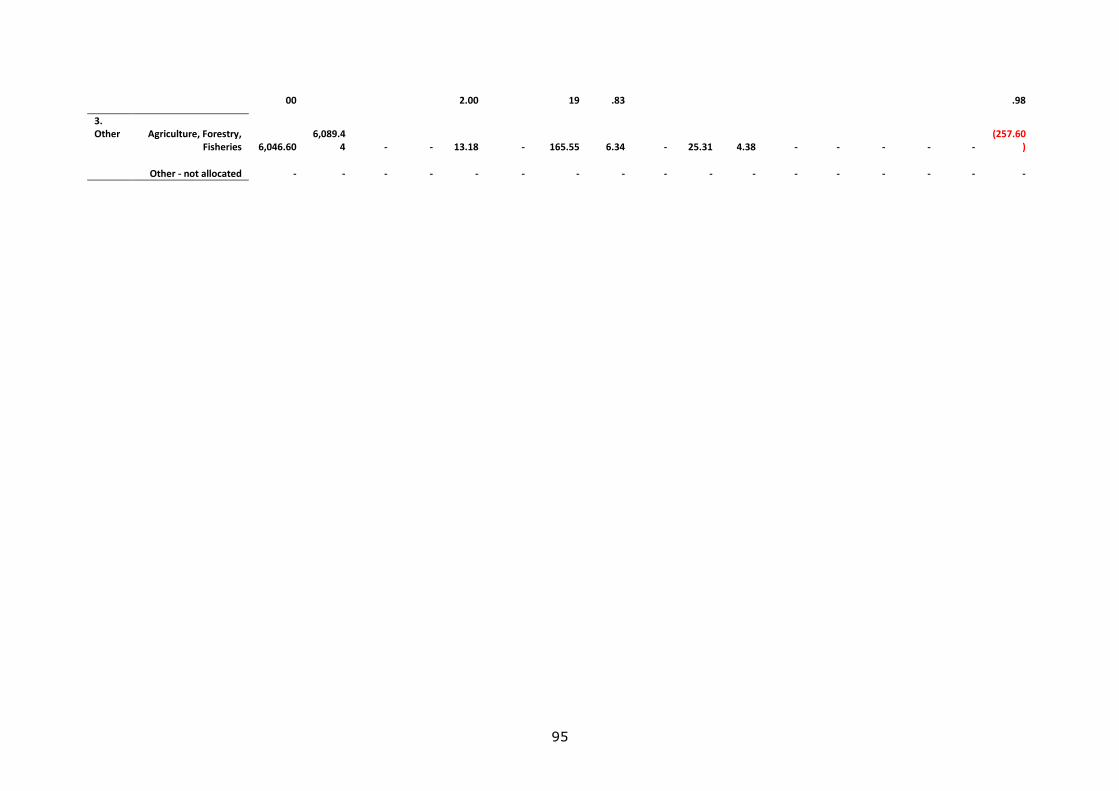
95
00 2.00 19 .83 .98
3. Other Agriculture, Forestry,
Fisheries
6,046.60
6,089.4
4
-
-
13.18
-
165.55
6.34
-
25.31
4.38
-
-
-
-
-
(257.60
)
Other - not allocated
-
-
-
-
-
-
-
-
-
-
-
-
-
-
-
-
-
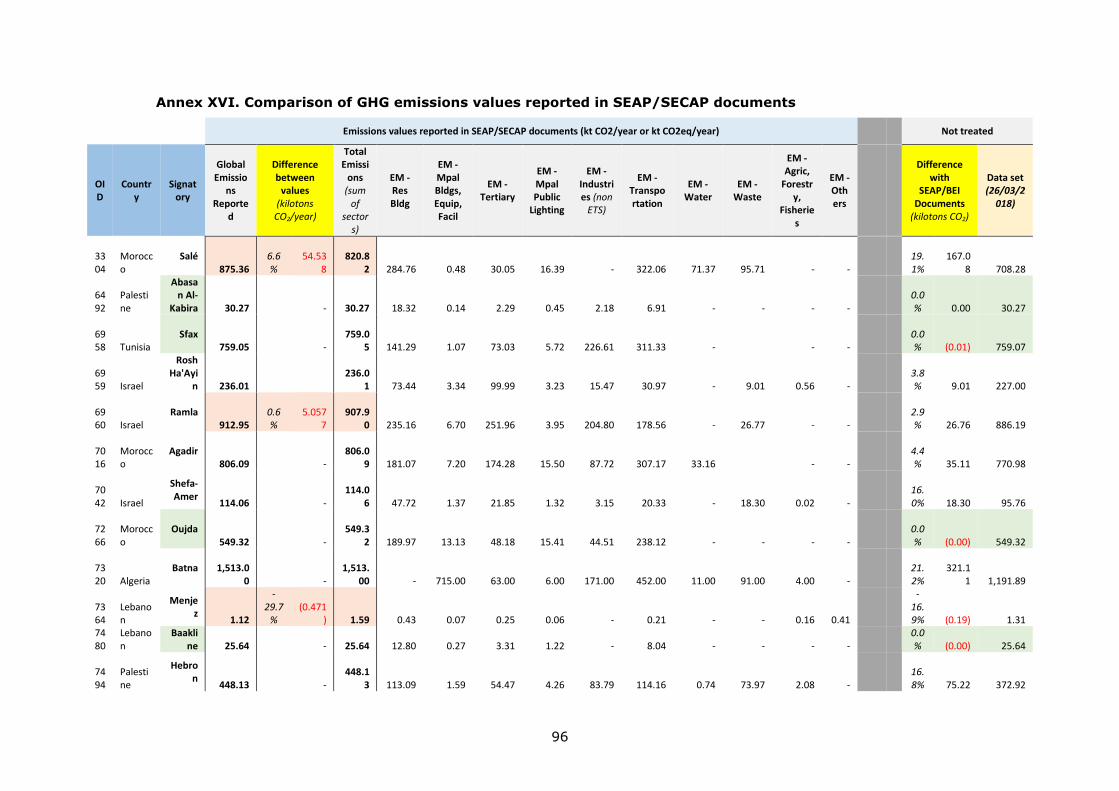
96
Annex XVI. Comparison of GHG emissions values reported in SEAP/SECAP documents
Emissions values reported in SEAP/SECAP documents (kt CO2/year or kt CO2eq/year)
Not treated
OID
Country
Signatory
Global Emissio
ns Reporte
d
Difference between
values (kilotons
CO2/year)
Total Emissi
ons (sum
of sector
s)
EM - Res Bldg
EM - Mpal Bldgs, Equip, Facil
EM - Tertiary
EM - Mpal Public
Lighting
EM - Industries (non
ETS)
EM - Transportation
EM - Water
EM - Waste
EM - Agric,
Forestry,
Fisheries
EM - Others
Difference with
SEAP/BEI Documents
(kilotons CO2)
Data set (26/03/2
018)
3304
Morocco
Salé 875.36
6.6%
54.53
8
820.8
2
284.76
0.48
30.05
16.39
-
322.06
71.37
95.71
-
- 19.1%
167.0
8
708.28
6492
Palestine
Abasan Al-
Kabira
30.27
-
30.27
18.32
0.14
2.29
0.45
2.18
6.91
-
-
-
- 0.0%
0.00
30.27
6958 Tunisia
Sfax 759.05
-
759.0
5
141.29
1.07
73.03
5.72
226.61
311.33
-
-
-
0.0%
(0.01)
759.07
6959 Israel
Rosh Ha'Ayi
n
236.01
236.0
1
73.44
3.34
99.99
3.23
15.47
30.97
-
9.01
0.56
- 3.8%
9.01
227.00
6960 Israel
Ramla 912.95
0.6%
5.057
7
907.9
0
235.16
6.70
251.96
3.95
204.80
178.56
-
26.77
-
- 2.9%
26.76
886.19
7016
Morocco
Agadir 806.09
-
806.0
9
181.07
7.20
174.28
15.50
87.72
307.17
33.16
-
-
4.4%
35.11
770.98
7042 Israel
Shefa-Amer
114.06
-
114.0
6
47.72
1.37
21.85
1.32
3.15
20.33
-
18.30
0.02
- 16.0%
18.30
95.76
7266
Morocco
Oujda 549.32
-
549.3
2
189.97
13.13
48.18
15.41
44.51
238.12
-
-
-
- 0.0%
(0.00)
549.32
7320 Algeria
Batna
1,513.00
-
1,513.
00
-
715.00
63.00
6.00
171.00
452.00
11.00
91.00
4.00
- 21.2%
321.1
1
1,191.89
7364
Lebanon
Menjez
1.12
-29.7
%
(0.471
)
1.59
0.43
0.07
0.25
0.06
-
0.21
-
-
0.16
0.41
-16.9%
(0.19)
1.31
7480
Lebanon
Baakline
25.64
-
25.64
12.80
0.27
3.31
1.22
-
8.04
-
-
-
-
0.0%
(0.00)
25.64
7494
Palestine
Hebron
448.13
-
448.1
3
113.09
1.59
54.47
4.26
83.79
114.16
0.74
73.97
2.08
- 16.8%
75.22
372.92
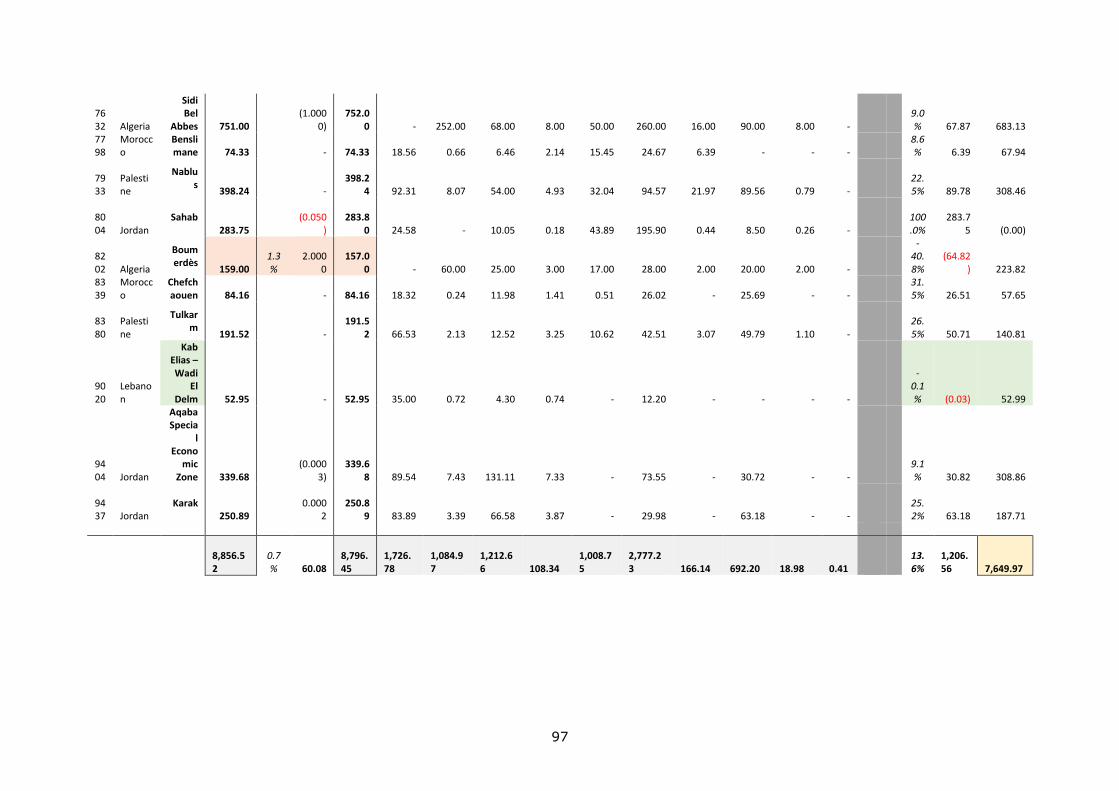
97
7632 Algeria
Sidi Bel
Abbes
751.00
(1.000
0)
752.0
0
-
252.00
68.00
8.00
50.00
260.00
16.00
90.00
8.00
- 9.0%
67.87
683.13
7798
Morocco
Benslimane
74.33
-
74.33
18.56
0.66
6.46
2.14
15.45
24.67
6.39
-
-
-
8.6%
6.39
67.94
7933
Palestine
Nablus
398.24
-
398.2
4
92.31
8.07
54.00
4.93
32.04
94.57
21.97
89.56
0.79
- 22.5%
89.78
308.46
8004 Jordan
Sahab 283.75
(0.050
)
283.8
0
24.58
-
10.05
0.18
43.89
195.90
0.44
8.50
0.26
- 100.0%
283.7
5
(0.00)
8202 Algeria
Boumerdès
159.00
1.3%
2.000
0
157.0
0
-
60.00
25.00
3.00
17.00
28.00
2.00
20.00
2.00
-
-40.8%
(64.82
)
223.82 8339
Morocco
Chefchaouen
84.16
-
84.16
18.32
0.24
11.98
1.41
0.51
26.02
-
25.69
-
-
31.5%
26.51
57.65
8380
Palestine
Tulkarm
191.52
-
191.5
2
66.53
2.13
12.52
3.25
10.62
42.51
3.07
49.79
1.10
- 26.5%
50.71
140.81
9020
Lebanon
Kab Elias – Wadi
El Delm
52.95
-
52.95
35.00
0.72
4.30
0.74
-
12.20
-
-
-
-
-0.1%
(0.03)
52.99
9404 Jordan
Aqaba Specia
l Econo
mic Zone
339.68
(0.000
3)
339.6
8
89.54
7.43
131.11
7.33
-
73.55
-
30.72
-
- 9.1%
30.82
308.86
9437 Jordan
Karak 250.89
0.000
2
250.8
9
83.89
3.39
66.58
3.87
-
29.98
-
63.18
-
- 25.2%
63.18
187.71
8,856.52
0.7% 60.08
8,796.45
1,726.78
1,084.97
1,212.66
108.34
1,008.75
2,777.23
166.14
692.20
18.98
0.41
13.6%
1,206.56
7,649.97
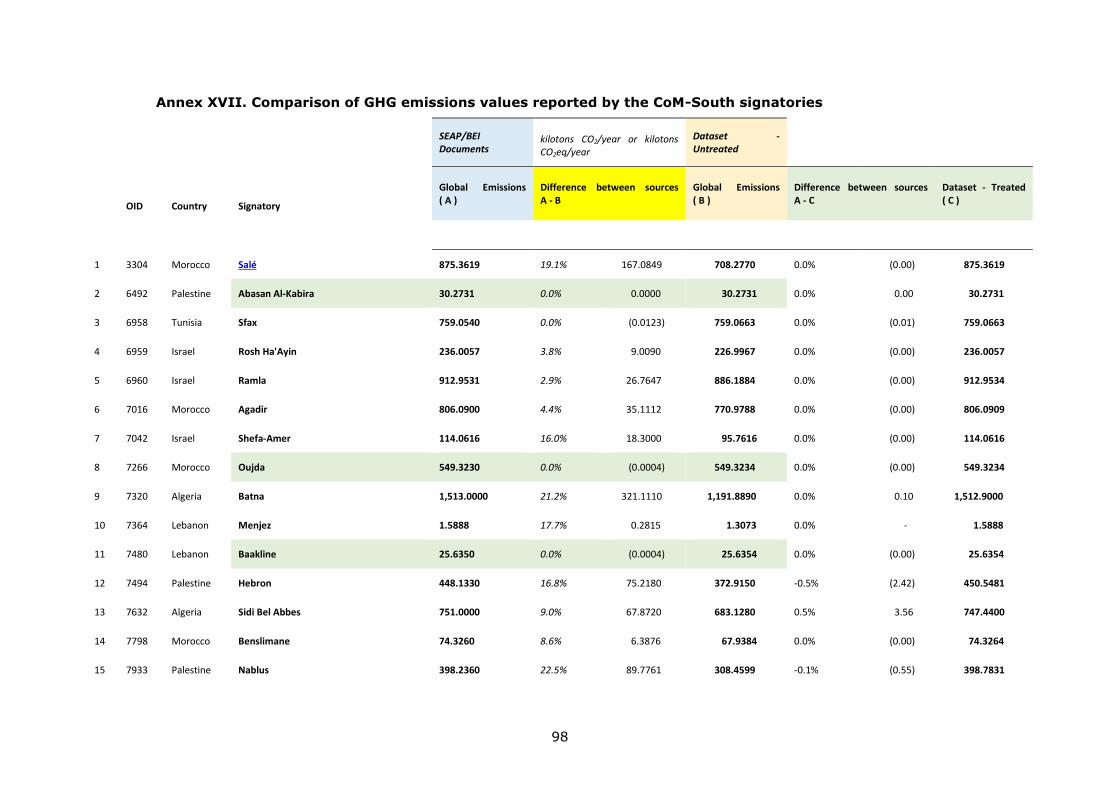
98
Annex XVII. Comparison of GHG emissions values reported by the CoM-South signatories
SEAP/BEI Documents
kilotons CO2/year or kilotons CO2eq/year
Dataset - Untreated
OID Country Signatory
Global Emissions ( A )
Difference between sources A - B
Global Emissions ( B )
Difference between sources A - C
Dataset - Treated ( C )
1 3304 Morocco Salé 875.3619 19.1% 167.0849 708.2770 0.0% (0.00) 875.3619
2 6492 Palestine Abasan Al-Kabira 30.2731 0.0% 0.0000 30.2731 0.0% 0.00 30.2731
3 6958 Tunisia Sfax 759.0540 0.0% (0.0123) 759.0663 0.0% (0.01) 759.0663
4 6959 Israel Rosh Ha'Ayin 236.0057 3.8% 9.0090 226.9967 0.0% (0.00) 236.0057
5 6960 Israel Ramla 912.9531 2.9% 26.7647 886.1884 0.0% (0.00) 912.9534
6 7016 Morocco Agadir 806.0900 4.4% 35.1112 770.9788 0.0% (0.00) 806.0909
7 7042 Israel Shefa-Amer 114.0616 16.0% 18.3000 95.7616 0.0% (0.00) 114.0616
8 7266 Morocco Oujda 549.3230 0.0% (0.0004) 549.3234 0.0% (0.00) 549.3234
9 7320 Algeria Batna 1,513.0000 21.2% 321.1110 1,191.8890 0.0% 0.10 1,512.9000
10 7364 Lebanon Menjez 1.5888 17.7% 0.2815 1.3073 0.0% - 1.5888
11 7480 Lebanon Baakline 25.6350 0.0% (0.0004) 25.6354 0.0% (0.00) 25.6354
12 7494 Palestine Hebron 448.1330 16.8% 75.2180 372.9150 -0.5% (2.42) 450.5481
13 7632 Algeria Sidi Bel Abbes 751.0000 9.0% 67.8720 683.1280 0.5% 3.56 747.4400
14 7798 Morocco Benslimane 74.3260 8.6% 6.3876 67.9384 0.0% (0.00) 74.3264
15 7933 Palestine Nablus 398.2360 22.5% 89.7761 308.4599 -0.1% (0.55) 398.7831

99
16 8004 Jordan Sahab 283.7500 100.0% 283.7500 - -0.2% (0.43) 284.1840
17 8202 Algeria Boumerdès 159.0000 -40.8% (64.8190) 223.8190 -1.1% (1.70) 160.7000
18 8339 Morocco Chefchaouen 84.1610 31.5% 26.5124 57.6486 0.3% 0.25 83.9098
19 8380 Palestine Tulkarm 191.5190 26.5% 50.7137 140.8053 0.5% 0.90 190.6225
20 9020 Lebanon Kab Elias – Wadi El Delm 52.9540 -0.1% (0.0340) 52.9880 -0.1% (0.03) 52.9880
21 9404 Jordan Aqaba Special Economic Zone 339.6763 9.1% 30.8203 308.8560 0.0% (0.00) 339.6763
22 9437 Jordan Karak 250.8920 25.2% 63.1817 187.7103 0.0% 0.00 250.8918
8,856.99 13.6% 1,207.03 7,649.97 0.00% (0.34) 8,857.3304
Sources:
A SEAP/SECAP documents with BEI results.
B Dataset compiled from the CoM online reporting portal (26 March 2018).
C Treated dataset completed/corrected by crosschecking SEAP/SECAP documents.

100
Annex XVIII. Preparation of Community Awareness Promotional Plan
(CAPP) by Hebron (Palestine): Situation analysis
Aim
The questions in the attached templates cover various areas of actions and
levels of awareness linked to behavioural change. They have been used to
conduct a quick investigation on the awareness situation and level of perception
of the citizens in the city concerning renewable energy and energy saving.
The exercise of filling the templates has identified and assessed the conditions
in the municipalities prior to preparing a CAPP and to answer a number of
questions, including:
1) Who are the target audience of a CAPP?
2) What are the priority issues to be addressed by the CAPP (that also could be
identified by the SEAP as priority actions)?
3) What is the level of awareness of key energy problems? And what are the
first issues to raise awareness about?
4) What are previous awareness raising actions, so that the CAPP can build on
them?
5) What is the situation as related to public consultation, based on which a
public consultation is to be designed?
The exercise of filling the templates helped pointing out how raising awareness
can be utilized as a tool for improved energy policy to facilitate implementation
of its actions; it has allowed initiating discussions in the Communication
Workshop and helped identifying appropriate campaigns and actions.
Specific objectives
(i) Provide the necessary information about the current conditions and the
situation regarding awareness on energy saving and renewable energy,
(ii) Help to identify the most appropriate a) awareness raising campaigns
that would accompany the SEAP vision/strategy and b) the awareness raising
actions that would accompany the priority actions determined in the SEAP.
Steps to follow
(i) The SEAP team of the municipality has filled the templates based on their
understanding and perception of the city’s inhabitants. They were free to seek
the opinion of a limited number of persons for help in filling in the answers.
(ii) The filled templates were discussed in the “CES-MED Communication
Workshops”, which were led by the CES-MED Communication Expert and
attended by the SEAP consultant and the SEAP municipal team. In parallel, the
vision/strategy of the city and the proposed pilot actions in the SEAP were
reviewed as part of the workshop exercise.
The outcome guided the selection of the most appropriate awareness raising
campaigns and actions of the SEAPs including the ones related to priority
projects.

101
Results
Identification of the target audience and the importance they give to
Sustainable Energy (audience targeted by the awareness raising campaigns and
actions)
Women/ Men Age group Very important Important Not Important
Youth X
Middle Age X
Seniors X
Other: school kids under 18 X
Identification of priority issues to be addressed by a sustainable energy action
and their level of importance
Issue Level of importance
Very important Important Not Important
High price of energy X
Availability/lack of energy X
Availability of transport X
Waste management X
Clean environment X
Other
Identification of level of awareness (energy problems) and education of energy
related issues
Very aware
(through media or
research)
Aware but not
convinced
Not aware
Impact on environment X
Cost of energy X
Waste of energy X
Climate change X
Ways to reduce energy
consumption
X
Existence of renewable
energy
X
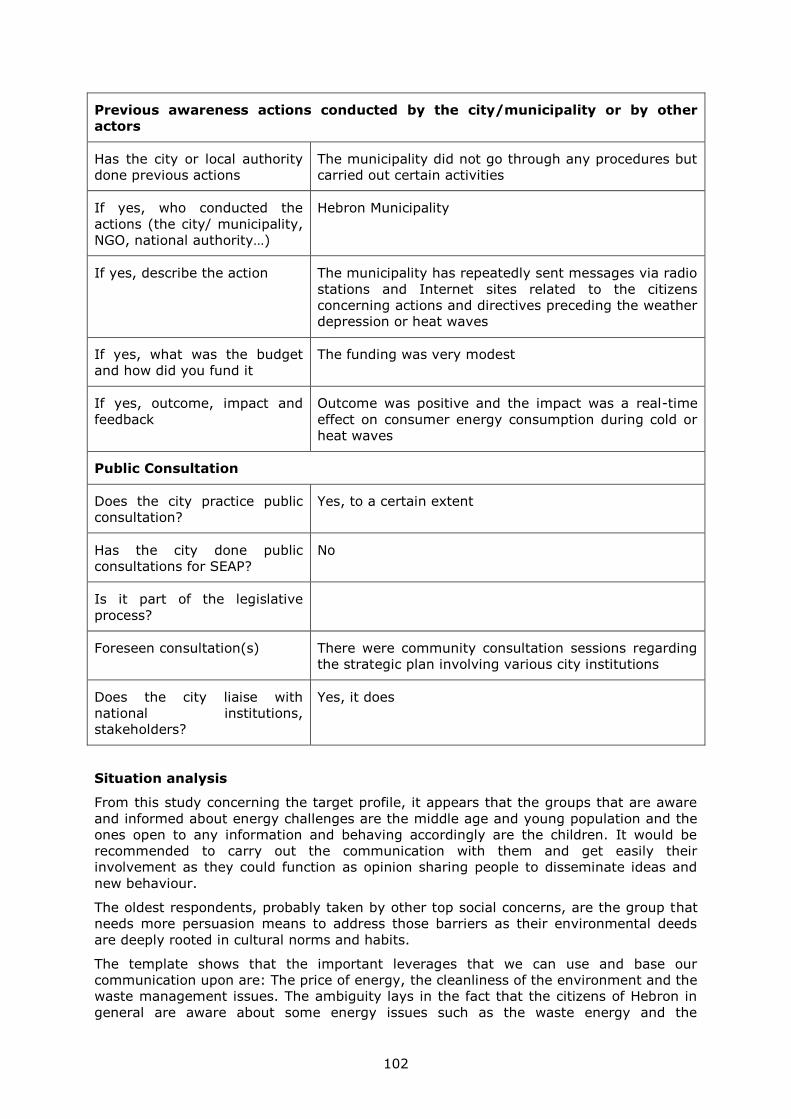
102
Previous awareness actions conducted by the city/municipality or by other
actors
Has the city or local authority
done previous actions
The municipality did not go through any procedures but
carried out certain activities
If yes, who conducted the
actions (the city/ municipality,
NGO, national authority…)
Hebron Municipality
If yes, describe the action The municipality has repeatedly sent messages via radio
stations and Internet sites related to the citizens
concerning actions and directives preceding the weather
depression or heat waves
If yes, what was the budget
and how did you fund it
The funding was very modest
If yes, outcome, impact and
feedback
Outcome was positive and the impact was a real-time
effect on consumer energy consumption during cold or
heat waves
Public Consultation
Does the city practice public
consultation?
Yes, to a certain extent
Has the city done public
consultations for SEAP?
No
Is it part of the legislative
process?
Foreseen consultation(s) There were community consultation sessions regarding
the strategic plan involving various city institutions
Does the city liaise with
national institutions,
stakeholders?
Yes, it does
Situation analysis
From this study concerning the target profile, it appears that the groups that are aware
and informed about energy challenges are the middle age and young population and the
ones open to any information and behaving accordingly are the children. It would be
recommended to carry out the communication with them and get easily their
involvement as they could function as opinion sharing people to disseminate ideas and
new behaviour.
The oldest respondents, probably taken by other top social concerns, are the group that
needs more persuasion means to address those barriers as their environmental deeds
are deeply rooted in cultural norms and habits.
The template shows that the important leverages that we can use and base our
communication upon are: The price of energy, the cleanliness of the environment and the
waste management issues. The ambiguity lays in the fact that the citizens of Hebron in
general are aware about some energy issues such as the waste energy and the

103
availability of energy efficient products but do not feel convinced about their link to cost
of energy and the impact that overconsumption may have on the environment. Evenly,
they don’t seem to be aware of the climate change issue.
Nevertheless, the municipality of Hebron has conducted awareness raising actions and
campaigns that are related to sustainable energy towards the civil society, punctually,
before the heat wave. Despite the modest funding of these actions, it was able to assess
their positive and immediate impact on alerting the population about energy consumption
and the importance of energy saving.
The means of communication, and the tools that were used were messages via radio
stations and Internet sites related to the citizens.
Finally, regarding public consultations, the municipality does liaise with the citizens to a
certain extent; there has been a community consultation session conducted regarding
the strategic plan with the city institutions.

104
Annex XIX. Key performance and indicators for the SEAP Actions by Kab Elias – Wadi El Delm (Lebanon): sections on municipal
buildings, equipment/facilities; Water supply and waste water treatment; Solid Waste Management
Action No. Actions Key Performance Indicators Measurement Units
Municipal buildings, equipment/facilities
1 SEAP Unit
• Develop SEAP unit in the Municipality
• Appointing SEAP manager in the municipality
• The number of buildings and facilities
covered by this work
• Formal announcement by the
municipality council for developing the SEAP
• Number of year for the contract with the SAEP manager
• The percentage of municipality facilities supervised by the SEAP manager
2 Setup a Website or/and other social media • Develop a Website or page on the original municipality web site for the SEAP of the
municipality
• Launching the Website or a page on the existing web site
3 Announce on the local media like local TV channel on the SEAP
• Publish the announcement on local TV
channel • Number of Feedback from citizens
4 Energy Saving Instructions • Publish the energy saving instructions in
the municipality building
• Energy consumptions measures in KWh and saving in %
5 Monitoring Mechanism • Install the monitoring mechanism • KWh saving in %
6 Awareness and Training Campaign • Conduct training for the municipality staff • Number of campaigns
• Number of attendances
7 Start replacing the FCL lamps with LED lamps
• Number of lamps replaced with LED lamps • Number of lamps replaced with LED
• Amount of watt reduced
8 Replace the Water pumping driver with VFD
driver for Central heating system • Implementation of VFD driver • Successfully operated
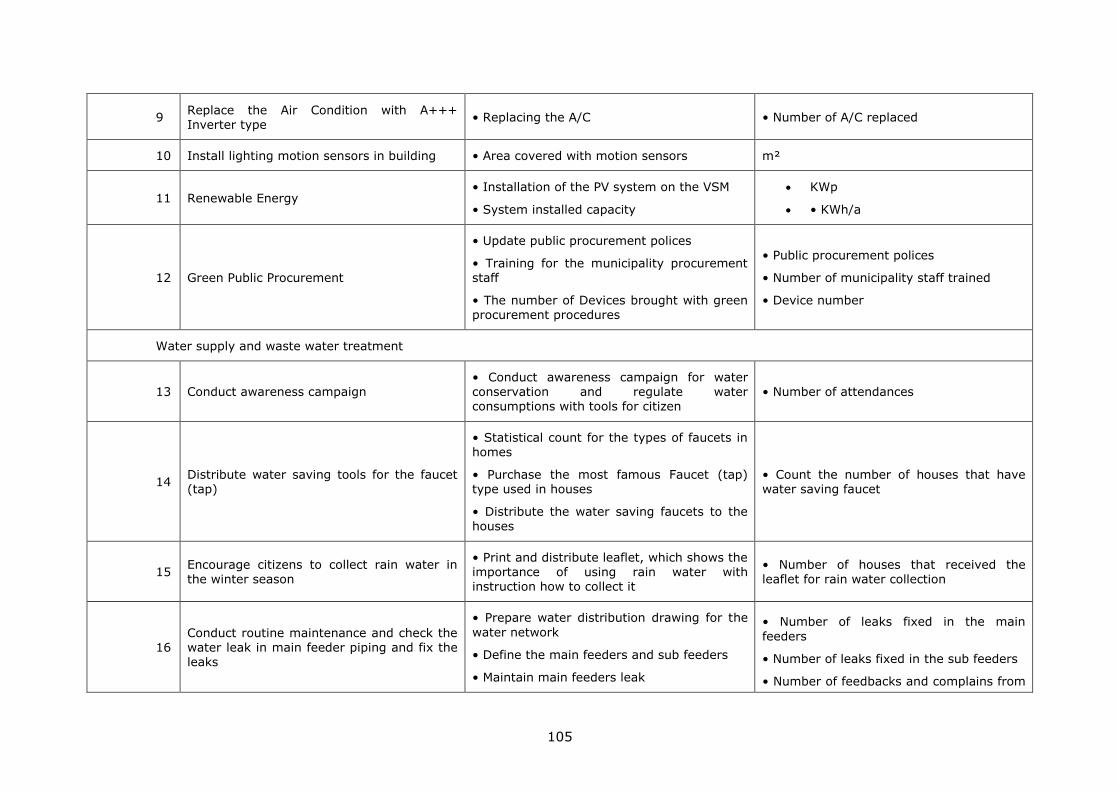
105
9 Replace the Air Condition with A+++ Inverter type
• Replacing the A/C • Number of A/C replaced
10 Install lighting motion sensors in building • Area covered with motion sensors m²
11 Renewable Energy • Installation of the PV system on the VSM
• System installed capacity
KWp
• KWh/a
12 Green Public Procurement
• Update public procurement polices
• Training for the municipality procurement staff
• The number of Devices brought with green procurement procedures
• Public procurement polices
• Number of municipality staff trained
• Device number
Water supply and waste water treatment
13 Conduct awareness campaign • Conduct awareness campaign for water conservation and regulate water consumptions with tools for citizen
• Number of attendances
14 Distribute water saving tools for the faucet (tap)
• Statistical count for the types of faucets in homes
• Purchase the most famous Faucet (tap) type used in houses
• Distribute the water saving faucets to the
houses
• Count the number of houses that have water saving faucet
15 Encourage citizens to collect rain water in the winter season
• Print and distribute leaflet, which shows the importance of using rain water with instruction how to collect it
• Number of houses that received the leaflet for rain water collection
16 Conduct routine maintenance and check the water leak in main feeder piping and fix the leaks
• Prepare water distribution drawing for the
water network
• Define the main feeders and sub feeders
• Maintain main feeders leak
• Number of leaks fixed in the main
feeders
• Number of leaks fixed in the sub feeders
• Number of feedbacks and complains from
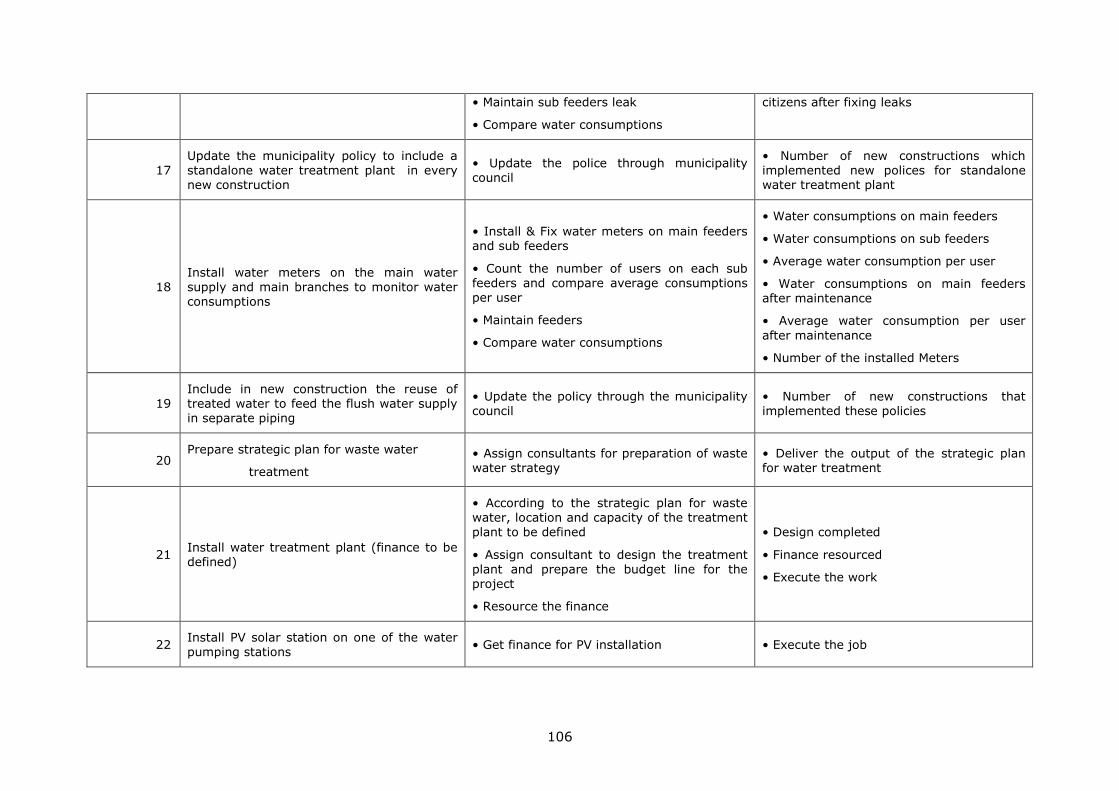
106
• Maintain sub feeders leak
• Compare water consumptions
citizens after fixing leaks
17 Update the municipality policy to include a standalone water treatment plant in every new construction
• Update the police through municipality council
• Number of new constructions which implemented new polices for standalone water treatment plant
18 Install water meters on the main water supply and main branches to monitor water consumptions
• Install & Fix water meters on main feeders and sub feeders
• Count the number of users on each sub feeders and compare average consumptions per user
• Maintain feeders
• Compare water consumptions
• Water consumptions on main feeders
• Water consumptions on sub feeders
• Average water consumption per user
• Water consumptions on main feeders after maintenance
• Average water consumption per user
after maintenance
• Number of the installed Meters
19 Include in new construction the reuse of treated water to feed the flush water supply in separate piping
• Update the policy through the municipality council
• Number of new constructions that implemented these policies
20 Prepare strategic plan for waste water
treatment
• Assign consultants for preparation of waste water strategy
• Deliver the output of the strategic plan for water treatment
21 Install water treatment plant (finance to be defined)
• According to the strategic plan for waste water, location and capacity of the treatment
plant to be defined
• Assign consultant to design the treatment plant and prepare the budget line for the project
• Resource the finance
• Design completed
• Finance resourced
• Execute the work
22 Install PV solar station on one of the water pumping stations
• Get finance for PV installation • Execute the job

107
Solid waste Management
23 Ensuring capacity development and enhancing public awareness
• Conduct workshop for municipality staff and NGO’s for solid waste management
• Number of staff attended the workshop
24 Preparation of marketing materials for the
sorting process
• Design the leaflet and the marketing
materials for solid waste sorting • Print the marketing materials
25
Dividing the city into different sectors and selecting volunteers for each sector willing to support the municipality plan in sorting the solid wastes
• Sectors defined
• Volunteers selected
• Number of sectors & volunteers
• Feedbacks & Complains
26
Conducting seminars to volunteer groups training them on methods of sorting solid wastes. The volunteers, supported with instructional leaflets, will then work out the steps in educating the citizens on the proper
way for sorting
• Conduct training seminars with the help of specialists
• Design objective and instructional leaflets
• Number of attendances
• Print the leaflets
27 Distributing different coloured dustbins with clear sign on each one, which indicate the type of garbage (organic or nonorganic)
• Purchase & Distribute the coloured dustbins
• Define to the citizens - the organic &
nonorganic garbage
• Number of signed & coloured dustbins
28 Developing and implementing plans for sorting solid waste at source
• Apply Plans • Feedbacks from the volunteers & solid waste workers
29
Developing waste strategy plan with waste management plan in order to overcome the high cost in collection and transportation, and look for a solution to the landfill either by converting it to sanitary landfill or utilising another one near the city
• Assign consultants for preparation & developing such strategy
• Deliver the output of the strategic plan
30 Implementing waste power generation from solid waste to feed energy to the future solid waste plant
• Electric generation from solid wastes • Capacity of generated power
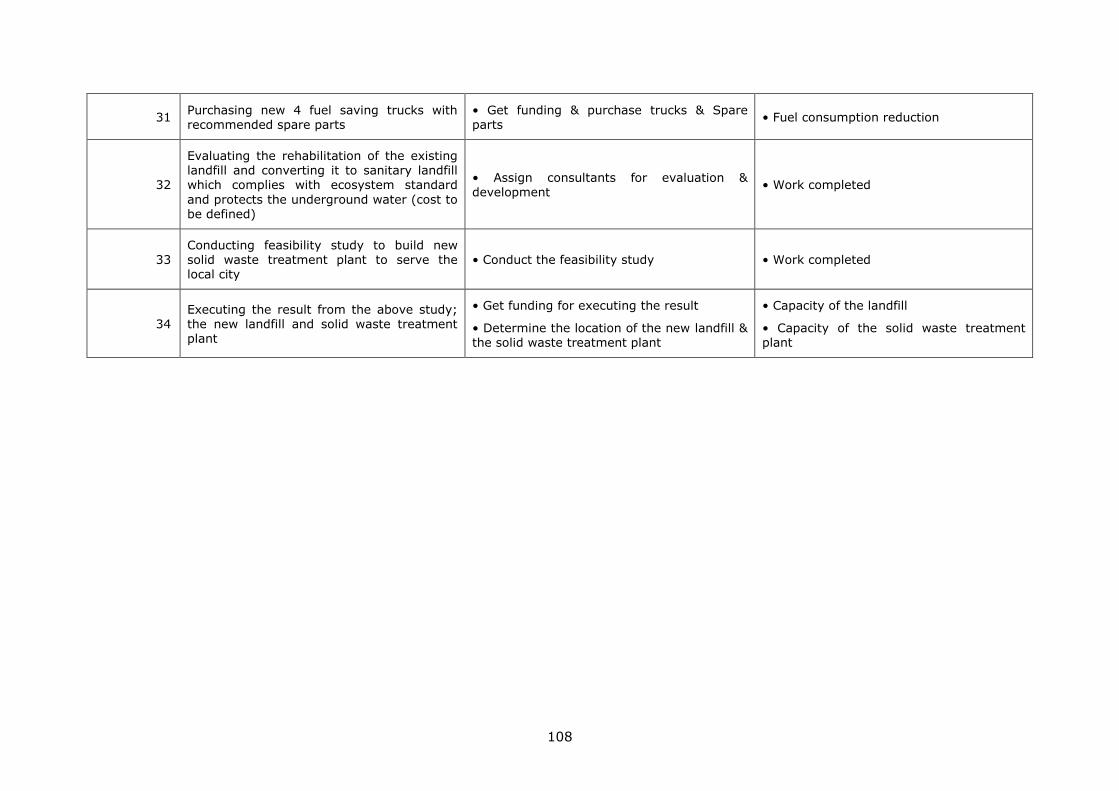
108
31 Purchasing new 4 fuel saving trucks with recommended spare parts
• Get funding & purchase trucks & Spare parts
• Fuel consumption reduction
32
Evaluating the rehabilitation of the existing landfill and converting it to sanitary landfill which complies with ecosystem standard
and protects the underground water (cost to be defined)
• Assign consultants for evaluation & development
• Work completed
33 Conducting feasibility study to build new solid waste treatment plant to serve the local city
• Conduct the feasibility study • Work completed
34 Executing the result from the above study; the new landfill and solid waste treatment plant
• Get funding for executing the result
• Determine the location of the new landfill & the solid waste treatment plant
• Capacity of the landfill
• Capacity of the solid waste treatment plant

GETTING IN TOUCH WITH THE EU
In person
All over the European Union there are hundreds of Europe Direct information centres. You can find the address of the centre nearest you at: https://europa.eu/european-union/contact_en
On the phone or by email
Europe Direct is a service that answers your questions about the European Union. You can contact this service:
- by freephone: 00 800 6 7 8 9 10 11 (certain operators may charge for these calls),
- at the following standard number: +32 22999696, or
- by electronic mail via: https://europa.eu/european-union/contact_en
FINDING INFORMATION ABOUT THE EU
Online
Information about the European Union in all the official languages of the EU is available on the Europa website at: https://europa.eu/european-union/index_en
EU publications You can download or order free and priced EU publications from EU Bookshop at:
https://publications.europa.eu/en/publications. Multiple copies of free publications may be obtained by
contacting Europe Direct or your local information centre (see https://europa.eu/european-
union/contact_en).

KJ-N
A-2
9413-E
N-N
doi:10.2760/209172
ISBN 978-92-79-96849-5