Embed Size (px)
Citation preview
THE COUNCIL OF THE CITY OF NEW YORK
Hon. Melissa Mark-Viverito
Speaker of the Council
Hon. Corey Johnson
Chair, Committee on Health
Report of the Finance Division on the Fiscal 2018 Preliminary Budget and the
Fiscal 2017 Preliminary Mayor’s Management Report for the
New York City Health + Hospitals
March 29, 2017
Finance Division
Latonia McKinney, Director Paul Scimone, Deputy Director Regina Poreda Ryan, Deputy Director Jeanette Merrill, Financial Analyst Nathan Toth, Deputy Director Crilhien R. Francisco, Unit Head
Finance Division Briefing Paper New York City Health + Hospitals
Page i
Table of Contents
New York City Health + Hospitals Overview .............................................................................................. 1
Report Overview ............................................................................................................................................... 1
NYC Health + Hospital Fiscal 2017 Adopted Financial Plan ................................................................. 2
H+H’s Accounting Method ............................................................................................................................ 3
Projected Operating Deficit (Fiscal 2017 through Fiscal 2020) .................................................... 3
Revenues Highlights ........................................................................................................................................ 3
Expense Highlights .......................................................................................................................................... 4
Fiscal 2018 Highlights ......................................................................................................................................... 5
New York State Budget Actions ....................................................................................................................... 6
New York City Health + Hospitals Transformation Plan ....................................................................... 8
Revenue-Generating Initiatives .................................................................................................................. 8
Expense-Reducing Initiatives ................................................................................................................... 11
Fiscal 2017 Preliminary Mayor’s Management Report ....................................................................... 13
H+H Capital Budget Summary ...................................................................................................................... 15
Preliminary Capital Plan Highlights ....................................................................................................... 15
Preliminary Ten-Year Capital Strategy ................................................................................................. 16
Appendix A: Budget Actions in the November and the Preliminary Plans .................................. 18
Appendix B: Fiscal 2018 Preliminary Plan Other Revenue by Funding Source ........................ 19
Finance Division Briefing Paper New York City Health + Hospitals
Page 1
New York City Health + Hospitals Overview
New York City Health and Hospitals (H+H), formerly the New York City Health and Hospitals Corporation, constitutes the largest municipal hospital and healthcare system in the United States. The H+H system, comprised of 11 hospital centers with nearly 5,000 beds; five long-term care facilities with nearly 3,000 beds; and more than 70 community-based healthcare centers and extension clinics, employs more than 42,000 people and serves more than 1.2 million New Yorkers annually. H+H also operates a certified home health agency and a managed care plan, MetroPlus.
H+H remains the City’s single largest provider of healthcare to Medicaid patients, as well as the single largest provider of medical services to uninsured New Yorkers. In 2014, approximately half of the uninsured hospital stays and emergency department visits in the City occurred in the H+H system—a disproportionate share relative to every other health system in the City. In addition to medical and behavioral health services, H+H provides trauma care, burn care, high-risk neonatal and obstetric care, and other specialized services—all provided to New York City residents regardless of their ability to pay.
H+H conducts mental health evaluations for family courts in the Bronx, Brooklyn, Queens, and Manhattan and provides emergency medical care and inpatient health services to inmates in New York City correctional facilities. In July 2015, the de Blasio Administration transitioned Correctional Health Services in the City’s jail system from Corizon Health, a for-profit company that contracted with the NYC Department of Health and Mental Hygiene to NYC Health + Hospitals.
Dr. Ram Raju served as President and CEO of NYC Health + Hospitals until Stanley Brezenoff succeeded him as interim President and CEO on December 1, 2016.
Report Overview
A financial agreement reached with the City in 1992 authorizes H+H to develop—and the H+H Board of Directors and the City to approve—a consolidated annual expense and revenue budget. Per the agreement, H+H may develop non-city funding sources for new programs and retain any surpluses during a fiscal year. The agreement also provides for a lump sum payment of City Tax Levy (CTL) to H+H, indemnifying the system against changes to the City's budget during the course of a fiscal year. The City’s budget does not include H+H’s annual expense and revenue budget; it only includes the City’s lump sum payment to H+H. The City’s Capital Budget, however, includes all H+H capital projects.
This report reviews Health +Hospitals’ Fiscal 2017 Adopted Budget and Fiscal 2018 expense budget highlights. The report then reviews relevant New York State budget actions and the Fiscal 2017 Preliminary Mayor's Management Report. Finally, the appendices outline the Budget Actions in the November and Preliminary Plans and H+H’s proposed capital budget, including an analysis of the significant changes proposed to the City’s $64 billion Capital Plan for Fiscal 2017-2020.
Finance Division Briefing Paper New York City Health + Hospitals
Page 2
NYC Health + Hospital Fiscal 2017 Adopted Financial Plan
NYC Health + Hospitals Cash Basis
($ in millions) Projected Projected Projected Projected 2017 2018 2019 2020
OPERATING REVENUES
Third Party Revenue Medicaid 2,118 2,153 2,180 2,210 Medicare 981 988 988 988 Other Managed Care 353 353 353 353 Supplemental Medicaid 2,620 1,714 1,422 1,430
Disproportionate Share Hospital (DSH) 1,275 1,118 930 952 Other Supplemental Payments 1,344 596 492 477
Subtotal: Third Party Revenue 6,071 5,208 4,943 4,980 Other Revenue City Services 344 814 835 838 Grants and Other 611 497 497 498
Subtotal: Other Revenue 955 1,311 1,332 1,336 TOTAL OPERATING REVENUES 7,026 6,519 6,275 6,316
OPERATING EXPENSES
Personal Services 2,963 2,949 2,984 3,013 Fringe Benefits 1,509 1,475 1,543 1,634 Affiliations 1,096 1,105 1,120 1,126 Other Than Personal Services 2,566 2,290 2,277 2,309 TOTAL OPERATING EXPENSES 8,133 7,819 7,924 8,082
TOTAL OPERATING INCOME/(LOSS) (1,107) (1,299) (1,649) (1,765)
Revenue-Generating Initiatives Medicaid Waiver Programs 449 520 520 400 Federal and State Charity Care 18 181 369 361 Health Insurance Initiatives 194 202 210 241 Development Opportunities - - - 100 Subtotal: Revenue-Generating Initiatives 661 903 1,099 1,101 Expense-Reducing Initiatives Supply Chain and Care Management Initiatives 63 87 121 154 Restructuring and Personnel Initiatives 55 317 448 544 Subtotal: Expense-Reducing Initiatives 118 404 569 698 TOTAL: TRANSFORMATION PLAN 779 1,307 1,668 1,799
INCOME/(LOSS) AFTER GAP-CLOSING INITIATIVES (327) 7 20 34
OPENING CASH BALANCE 444 116 124 143
CLOSING CASH BALANCE 116 124 143 177
Finance Division Briefing Paper New York City Health + Hospitals
Page 3
H+H’s Accounting Method
H+H operates on a cash basis, recognizing revenues and reporting expenses as they occur, rather than employing the financial projections common to other City agencies. H+H generally prefers the cash basis accounting method because it allows the health system to recognize income when H+H actually receives the money. H+H, therefore, does not recognize invoiced income as an asset until the payment is in hand. The system applies the same approach to debts, only recognizing incurred expenses once they are paid. This accounting method provides a real-time assessment of the agency’s current cash flow.
Projected Operating Deficit (Fiscal 2017 through Fiscal 2020)
According to its Fiscal 2017 Adopted Financial Plan, the H+H anticipates a Fiscal 2017 operating loss of $1.1 billion. These substantial deficits are a function of H+H’s declining revenue that falls short of supporting the system’s growing needs. The baseline budget forecast assumes H+H will continue to receive City subsidies and grants totaling approximately $1.3 billion annually for each of the forecast years; however, given the declining patient care revenue and increased spending, projections still suggest H+H will experience a $1.8 billion deficit by the year 2020.
H+H attributes the growing deficit to the rapid projected decline in safety-net funding and the persistent decline in hospital utilization. Specifically, federal and state policy changes could reduce safety-net funding to H+H by approximately $800 million, or 36 percent, decreasing from $2.2 billion in Fiscal 2016 to $1.4 billion in Fiscal 2020—despite H+H caring for an increasing share of uninsured patients citywide. Regarding hospital utilization, H+H reports that operational and market factors have emptied hospital beds, leading to decreased patient revenues without a corresponding reduction in operating expenses.
H+H continues to implement corrective actions intended to mitigate the deficit, including cost containment initiatives and organizational restructuring. These revenue-generating and expense-reducing initiatives are described in the New York City Health + Hospitals Transformation Plan section of the report on page 6.
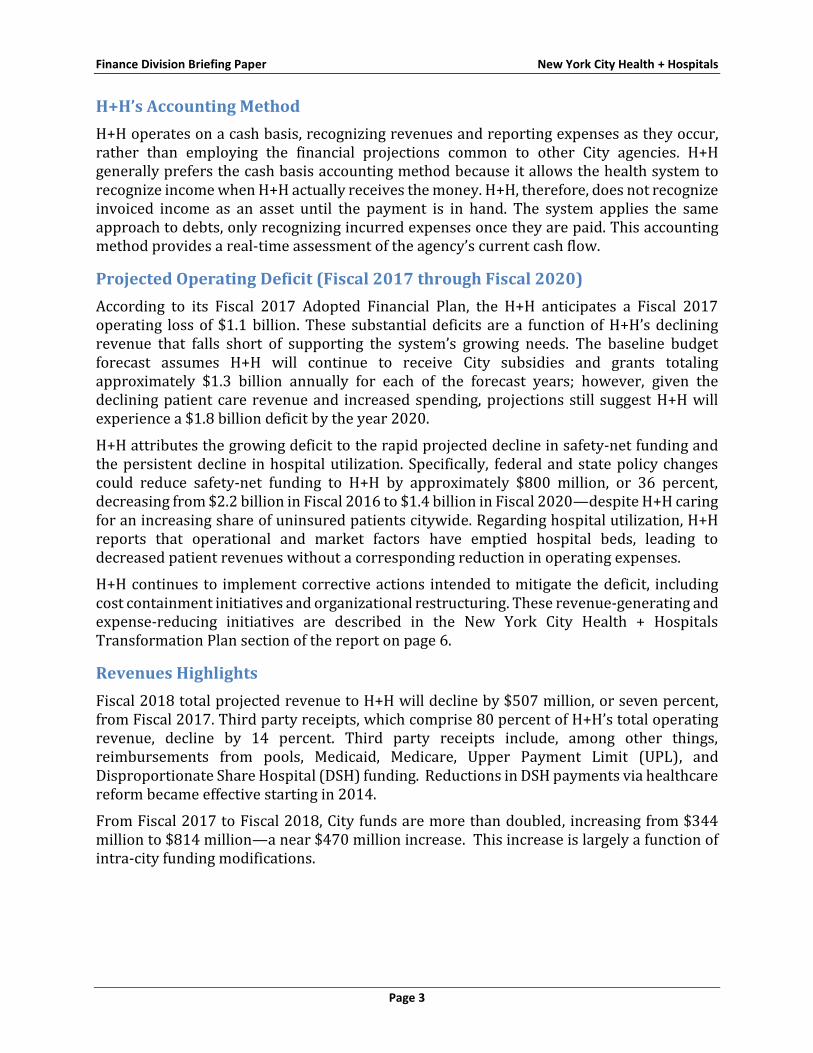
Revenues Highlights
Fiscal 2018 total projected revenue to H+H will decline by $507 million, or seven percent, from Fiscal 2017. Third party receipts, which comprise 80 percent of H+H’s total operating revenue, decline by 14 percent. Third party receipts include, among other things, reimbursements from pools, Medicaid, Medicare, Upper Payment Limit (UPL), and Disproportionate Share Hospital (DSH) funding. Reductions in DSH payments via healthcare reform became effective starting in 2014.
From Fiscal 2017 to Fiscal 2018, City funds are more than doubled, increasing from $344 million to $814 million—a near $470 million increase. This increase is largely a function of intra-city funding modifications.
Finance Division Briefing Paper New York City Health + Hospitals
Page 4
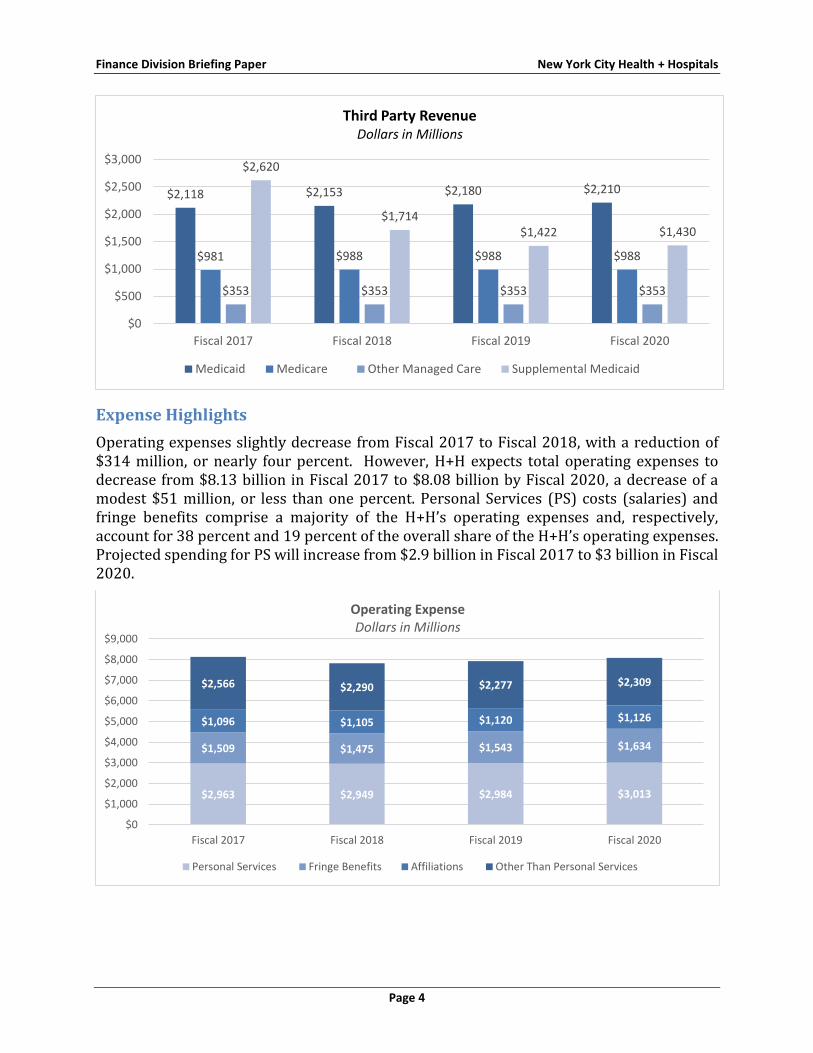
Expense Highlights
Operating expenses slightly decrease from Fiscal 2017 to Fiscal 2018, with a reduction of $314 million, or nearly four percent. However, H+H expects total operating expenses to decrease from $8.13 billion in Fiscal 2017 to $8.08 billion by Fiscal 2020, a decrease of a modest $51 million, or less than one percent. Personal Services (PS) costs (salaries) and fringe benefits comprise a majority of the H+H’s operating expenses and, respectively, account for 38 percent and 19 percent of the overall share of the H+H’s operating expenses. Projected spending for PS will increase from $2.9 billion in Fiscal 2017 to $3 billion in Fiscal 2020.
$2,118 $2,153 $2,180 $2,210
$981 $988 $988 $988
$353 $353 $353 $353
$2,620
$1,714$1,422 $1,430
$0
$500
$1,000
$1,500
$2,000
$2,500
$3,000
Fiscal 2017 Fiscal 2018 Fiscal 2019 Fiscal 2020
Third Party RevenueDollars in Millions
Medicaid Medicare Other Managed Care Supplemental Medicaid
$2,963 $2,949 $2,984 $3,013
$1,509 $1,475 $1,543 $1,634
$1,096 $1,105 $1,120 $1,126
$2,566 $2,290 $2,277 $2,309
$0
$1,000
$2,000
$3,000
$4,000
$5,000
$6,000
$7,000
$8,000
$9,000
Fiscal 2017 Fiscal 2018 Fiscal 2019 Fiscal 2020
Operating ExpenseDollars in Millions
Personal Services Fringe Benefits Affiliations Other Than Personal Services
Finance Division Briefing Paper New York City Health + Hospitals
Page 5
Fiscal 2018 Highlights
H+H did not provide a Fiscal 2018 cash-based Preliminary Financial Plan; therefore, this report can only detail the outside revenue reported by the hospital system—not the cash-based operating revenues or operating expenses.
H+H reports $8.9 million in outside revenue in Fiscal 2018, including a total of $830.2 million in City and intracity dollars in the upcoming fiscal year. The total includes the $626 million City subsidy. H+H also reports $19.2 million in new expense funding and other adjustments in Fiscal 2017, resulting in $423 million from outside revenue sources for the current fiscal year. City and intracity funding comprise the majority of this revenue, but the federal government also provides funds related to Homeland Security and Hurricane Sandy.
New expense funding supports Correctional Health Services (CHS)—a division of H+H.
New Needs
Correctional Health Services Compliance. The Fiscal 2018 Preliminary Plan includes $1.5 million in Fiscal 2017 and $2.9 million in Fiscal 2018 and in the outyears to cover costs associated with compliance reporting and patient relations for CHS.
Department of Correction (DOC) Employee Health Services. The Plan includes $849,000 in Fiscal 2017 and $3 million in Fiscal 2018 to implement in-jail Employee Health Services for DOC officers. Funding totals $2.6 million in the outyears.
Other Adjustments
Article 6 Adjustments. The Fiscal 2018 Preliminary Plan includes $2.5 million in City funding transfers in Fiscal 2017. The transfers realize $516,000 in State public health revenue related to HIV testing and $2 million in revenue related to chronic disease and tobacco reduction.
Baseline Technical Adjustment. The Plan includes a technical adjustment that removes one-time funding totaling $100 million in Fiscal 2020 from baselined Fiscal 2021 funding. The Fiscal 2020 reflects the Development Opportunities item in the H+H Transformation Plan.
Ending the Epidemic. The Plan includes $241,000 in City Council discretionary funding in Fiscal 2017 to support the Ending the Epidemic (ETE), a statewide plan to decrease new HIV infections in New York to 750 cases annually by the year 2020. ETE identifies diagnosed and undiagnosed HIV-positive individuals and connects them to healthcare and medication, including pre-Exposure Prophylaxis (PrEP) and Post-Exposure Prophylaxis (PEP). H+H participants include Elmhurst Hospital, Harlem Hospital, and Metropolitan Hospital.
Finance Division Briefing Paper New York City Health + Hospitals
Page 6
New York State Budget Actions
Fiscal 2017-2018 State Executive Budget
The Fiscal 2017-2018 State Executive Budget, released January 18, 2017, adheres to the Medicaid spending cap, a provision that ties Medicaid growth to the 10-year rolling average of the Medical Consumer Price Index—currently estimated at 3.2 percent. Proposals to keep overall Medicaid spending within capped levels include price ceilings for certain high-cost prescription drugs reimbursed under the Medicaid program and monthly premiums and higher copays for certain beneficiaries of the Essential Plan program. H+H’s budget does not reflect any of the Governor’s budget proposals.
Medicaid Waiver The Federal Centers for Medicare & Medicaid Services (CMS) and the State reached an agreement authorizing up to $8 billion in new federal funding, over several years, to transform New York’s healthcare system and ensure access to quality care for all Medicaid beneficiaries. This funding, provided through an amendment to the State’s Partnership Plan 1115 Medicaid waiver, is divided among the Interim Access Assurance Fund (IAAF), the Delivery System Reform Incentive Payment (DSRIP) Program, Health Homes, and various other Medicaid redesign initiatives.
In the first three years, $3.3 billion has been awarded under the waiver. This includes $2.1 billion to 25 Performing Provider Systems (PPS) statewide so that these consortiums of regional providers can implement approved DSRIP program transformation projects; $401 million for Health Homes and other reform initiatives; and $500 million for financially distressed safety net hospitals whose viability is critical to achieving ongoing reforms. The 1115 waiver will run through March 31, 2021.
OneCity Health, the Health + Hospitals-sponsored PPS, comprises hundreds of healthcare providers, community-based organizations, and health systems and constitutes the largest PPS in New York City. PPS earn funding only by meeting predefined milestones in clinical management, population health, and system transformation, in addition to the reduction in avoidable hospital use. To date, OneCity Health has received $1.2 billion in PPS funding; however, the State has undervalued the OneCity Health DSRIP award.
Supplemental Medicaid Payments The City funds approximately half of all supplemental Medicaid payments that H+H receives, including Upper Payment Limit (UPL) payments and Disproportionate Share Hospital (DSH) payments. The City’s annual combined DSH and UPL payments to H+H increased from $65 million in 2003 to $1.1 billion in 2015, and total DSH and UPL payments increased from three percent of H+H’s total Medicaid revenue in 2003 to 33 percent in 2015.
UPL payments serve as increases in the Medicaid reimbursement rates for providers who serve a large number of Medicaid patients. The City determines its UPL payments through the rates it is willing to pay and able to negotiate with the federal government. DHS payments constitute block subsidies for hospitals that report high rates of Medicaid patients and uninsured patients. The federal government determines the total DSH funds it will provide to the State and the State determines the value of these subsidies for each hospital.
Finance Division Briefing Paper New York City Health + Hospitals
Page 7
The Obama Administration, operating under the assumption that the Affordable Care Act would dramatically reduce the number of uninsured individuals, had planned to reduce DSH payments to states on October 1, 2017—contributing to the aforementioned reduction in H+H supplemental Medicaid receipts. However, H+H serves approximately 425,000 uninsured patients annually, many of whom prove ineligible for health insurance due to their immigration status. The proposed DSH cuts, therefore, would only serve to exacerbate the deficit.
Federal Concerns The repeal or diminishment of the Affordable Care Act (ACA) would result in substantial financial losses for New York City and New York State, including the loss of hundreds of millions of dollars in federal subsidies to H+H. Regarding the human toll, the repeal of the ACA would adversely affect an estimated 1.6 million NYC residents, including 1.1 million Medicaid patients, 400,000 Essential Health Plan enrollees, and 100,000 Qualified Health Plan enrollees. Essential Health Plan enrollees have incomes 138-200 percent below the federal poverty line (FPL) and Qualified Health Plan members have incomes 200-250 percent below the FPL.
Regarding the H+H patient population, the repeal of the ACA would affect approximately 200,000 insured H+H patients and approximately 425,000 uninsured H+H patients. Specifically, the repeal would adversely affect about 120,000 Medicaid members, about 75,000 Essential Health Plan members, and about 9,000 Qualified Health Plan members. Significantly, Medicaid and the Essential and Qualified Health Plans generate more than $500 million for H+H.
State Advocacy In addition to advocating for increased DSH funding to H+H and increased DSRIP funding to OneCity Health, New York City has called on the State to amend its eligibility criteria and distribution formula regarding safety net hospitals. The State’s current Indigent Care Pool funding formula stipulates that a hospital cannot receive significantly more or less funding than it received, on average, in 2010 through 2012, regardless of the amount of free care the hospital now provides—essentially eliminating the need-based calculation.
Under this formula, hospitals that serve a greater share of poor patients tend to receive less funding, proportionally, than the institutions serving wealthier communities—subverting the intent of an indigent care program. For example, the City-owned Kings County Hospital Center in East Flatbush, Brooklyn provided $111 million worth of medical care to the uninsured in 2015—the most of any hospital in the State—but received just $15 million from the Indigent Care Pool.
The City has also called on the state to include H+H in Vital Access Provider (VAP) funding. The State’s VAP Program provides operating assistance to financially distressed hospitals and other healthcare facilities. However, the State did not include H+H in the VAP funding stream, even though the healthcare system serves indigent populations and has demonstrated financial hardship.
Finance Division Briefing Paper New York City Health + Hospitals
Page 8
New York City Health + Hospitals Transformation Plan
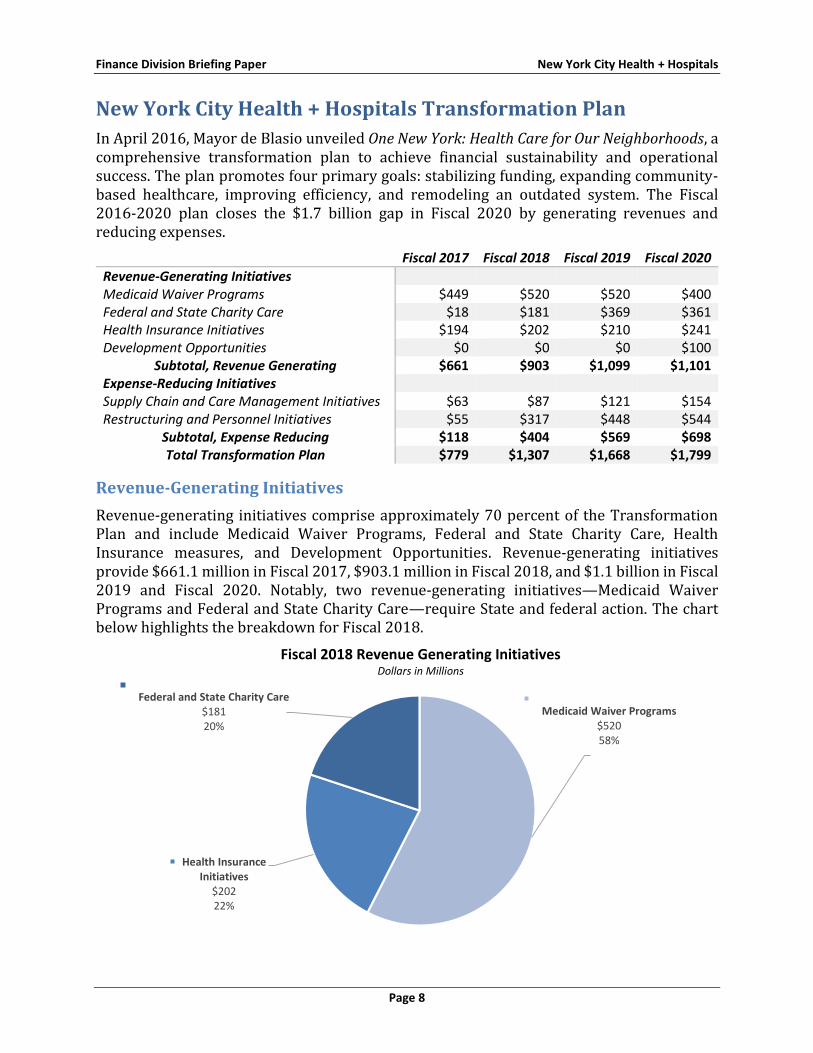
In April 2016, Mayor de Blasio unveiled One New York: Health Care for Our Neighborhoods, a comprehensive transformation plan to achieve financial sustainability and operational success. The plan promotes four primary goals: stabilizing funding, expanding community-based healthcare, improving efficiency, and remodeling an outdated system. The Fiscal 2016-2020 plan closes the $1.7 billion gap in Fiscal 2020 by generating revenues and reducing expenses.
Fiscal 2017 Fiscal 2018 Fiscal 2019 Fiscal 2020
Revenue-Generating Initiatives Medicaid Waiver Programs $449 $520 $520 $400 Federal and State Charity Care $18 $181 $369 $361 Health Insurance Initiatives $194 $202 $210 $241 Development Opportunities $0 $0 $0 $100
Subtotal, Revenue Generating $661 $903 $1,099 $1,101 Expense-Reducing Initiatives Supply Chain and Care Management Initiatives $63 $87 $121 $154 Restructuring and Personnel Initiatives $55 $317 $448 $544
Subtotal, Expense Reducing $118 $404 $569 $698 Total Transformation Plan $779 $1,307 $1,668 $1,799
Revenue-Generating Initiatives
Revenue-generating initiatives comprise approximately 70 percent of the Transformation Plan and include Medicaid Waiver Programs, Federal and State Charity Care, Health Insurance measures, and Development Opportunities. Revenue-generating initiatives provide $661.1 million in Fiscal 2017, $903.1 million in Fiscal 2018, and $1.1 billion in Fiscal 2019 and Fiscal 2020. Notably, two revenue-generating initiatives—Medicaid Waiver Programs and Federal and State Charity Care—require State and federal action. The chart below highlights the breakdown for Fiscal 2018.
Medicaid Waiver Programs$520 58%
Health Insurance Initiatives
$202 22%
Federal and State Charity Care$181 20%
Fiscal 2018 Revenue Generating Initiatives Dollars in Millions
Finance Division Briefing Paper New York City Health + Hospitals
Page 9
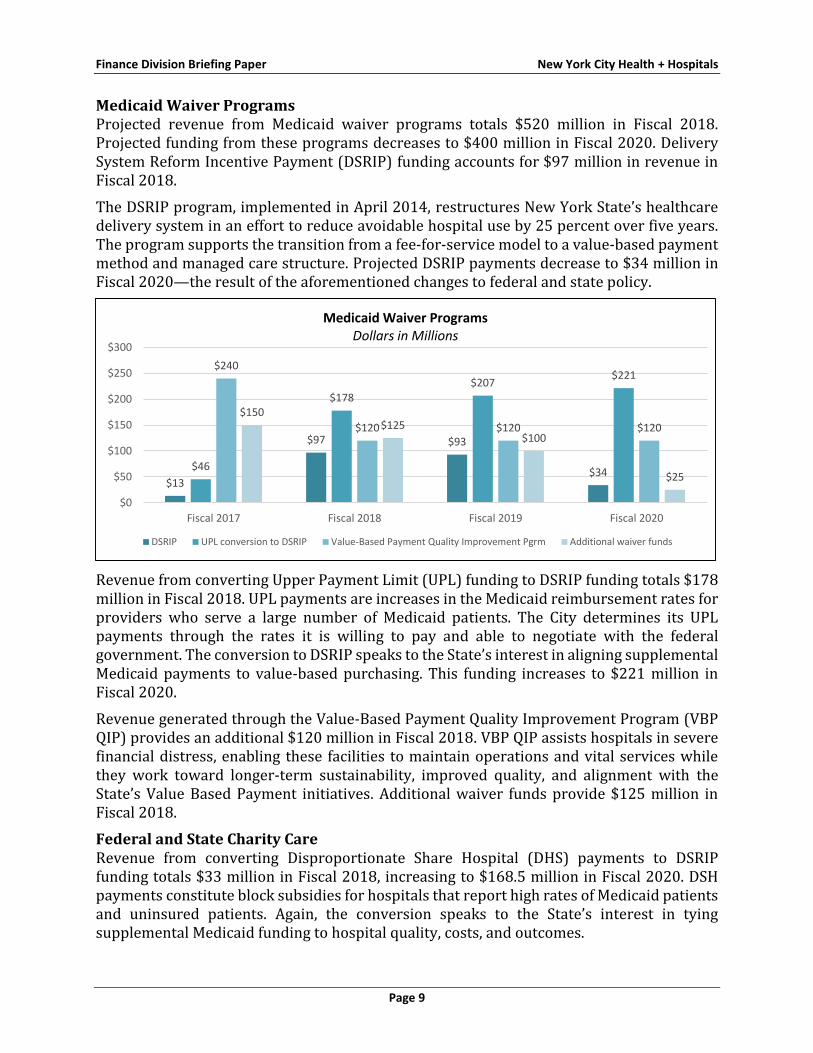
Medicaid Waiver Programs Projected revenue from Medicaid waiver programs totals $520 million in Fiscal 2018. Projected funding from these programs decreases to $400 million in Fiscal 2020. Delivery System Reform Incentive Payment (DSRIP) funding accounts for $97 million in revenue in Fiscal 2018.
The DSRIP program, implemented in April 2014, restructures New York State’s healthcare delivery system in an effort to reduce avoidable hospital use by 25 percent over five years. The program supports the transition from a fee-for-service model to a value-based payment method and managed care structure. Projected DSRIP payments decrease to $34 million in Fiscal 2020—the result of the aforementioned changes to federal and state policy.
Revenue from converting Upper Payment Limit (UPL) funding to DSRIP funding totals $178 million in Fiscal 2018. UPL payments are increases in the Medicaid reimbursement rates for providers who serve a large number of Medicaid patients. The City determines its UPL payments through the rates it is willing to pay and able to negotiate with the federal government. The conversion to DSRIP speaks to the State’s interest in aligning supplemental Medicaid payments to value-based purchasing. This funding increases to $221 million in Fiscal 2020.
Revenue generated through the Value-Based Payment Quality Improvement Program (VBP QIP) provides an additional $120 million in Fiscal 2018. VBP QIP assists hospitals in severe financial distress, enabling these facilities to maintain operations and vital services while they work toward longer-term sustainability, improved quality, and alignment with the State’s Value Based Payment initiatives. Additional waiver funds provide $125 million in Fiscal 2018.
Federal and State Charity Care Revenue from converting Disproportionate Share Hospital (DHS) payments to DSRIP funding totals $33 million in Fiscal 2018, increasing to $168.5 million in Fiscal 2020. DSH payments constitute block subsidies for hospitals that report high rates of Medicaid patients and uninsured patients. Again, the conversion speaks to the State’s interest in tying supplemental Medicaid funding to hospital quality, costs, and outcomes.
$13
$97 $93
$34$46
$178$207
$221$240
$120 $120 $120
$150$125
$100
$25
$0
$50
$100
$150
$200
$250
$300
Fiscal 2017 Fiscal 2018 Fiscal 2019 Fiscal 2020
Medicaid Waiver ProgramsDollars in Millions
DSRIP UPL conversion to DSRIP Value-Based Payment Quality Improvement Pgrm Additional waiver funds
Finance Division Briefing Paper New York City Health + Hospitals
Page 10
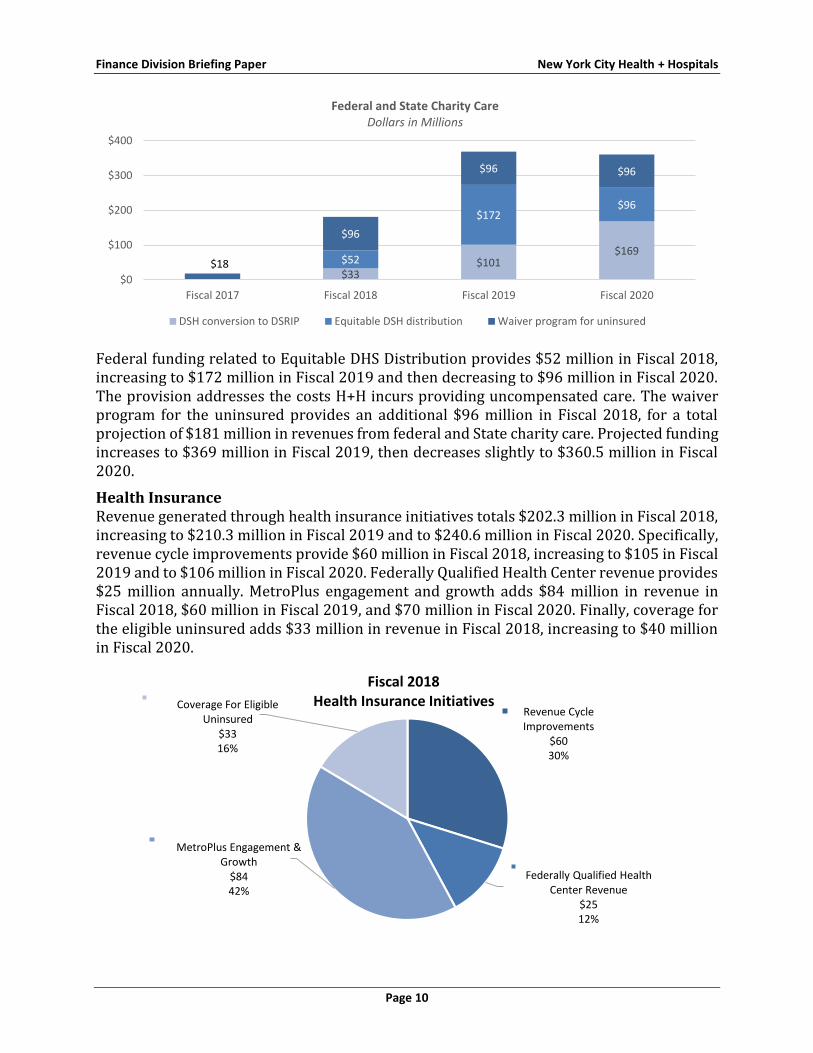
Federal funding related to Equitable DHS Distribution provides $52 million in Fiscal 2018, increasing to $172 million in Fiscal 2019 and then decreasing to $96 million in Fiscal 2020. The provision addresses the costs H+H incurs providing uncompensated care. The waiver program for the uninsured provides an additional $96 million in Fiscal 2018, for a total projection of $181 million in revenues from federal and State charity care. Projected funding increases to $369 million in Fiscal 2019, then decreases slightly to $360.5 million in Fiscal 2020.
Health Insurance Revenue generated through health insurance initiatives totals $202.3 million in Fiscal 2018, increasing to $210.3 million in Fiscal 2019 and to $240.6 million in Fiscal 2020. Specifically, revenue cycle improvements provide $60 million in Fiscal 2018, increasing to $105 in Fiscal 2019 and to $106 million in Fiscal 2020. Federally Qualified Health Center revenue provides $25 million annually. MetroPlus engagement and growth adds $84 million in revenue in Fiscal 2018, $60 million in Fiscal 2019, and $70 million in Fiscal 2020. Finally, coverage for the eligible uninsured adds $33 million in revenue in Fiscal 2018, increasing to $40 million in Fiscal 2020.
$33$101
$169$52
$172$96
$18
$96
$96 $96
$0
$100
$200
$300
$400
Fiscal 2017 Fiscal 2018 Fiscal 2019 Fiscal 2020
Federal and State Charity CareDollars in Millions
DSH conversion to DSRIP Equitable DSH distribution Waiver program for uninsured
Revenue Cycle Improvements
$6030%
Federally Qualified Health Center Revenue
$2512%
MetroPlus Engagement & Growth
$8442%
Coverage For Eligible Uninsured
$3316%
Fiscal 2018Health Insurance Initiatives
Finance Division Briefing Paper New York City Health + Hospitals
Page 11
Development Opportunities Health + Hospitals anticipates $100 million in savings in Fiscal 2020 as the result of development opportunities on City-owned H+H properties. The City would recoup the savings and pass the funding along to H+H via the budget.
Expense-Reducing Initiatives
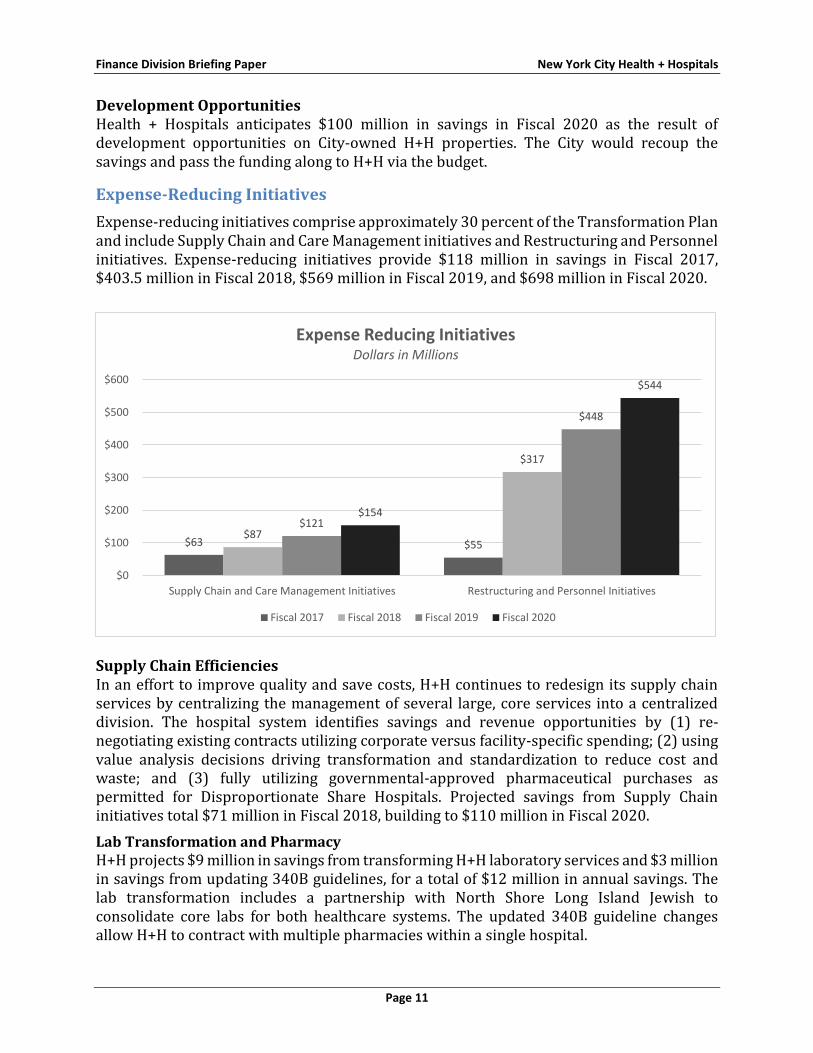
Expense-reducing initiatives comprise approximately 30 percent of the Transformation Plan and include Supply Chain and Care Management initiatives and Restructuring and Personnel initiatives. Expense-reducing initiatives provide $118 million in savings in Fiscal 2017, $403.5 million in Fiscal 2018, $569 million in Fiscal 2019, and $698 million in Fiscal 2020.
Supply Chain Efficiencies In an effort to improve quality and save costs, H+H continues to redesign its supply chain services by centralizing the management of several large, core services into a centralized division. The hospital system identifies savings and revenue opportunities by (1) re-negotiating existing contracts utilizing corporate versus facility-specific spending; (2) using value analysis decisions driving transformation and standardization to reduce cost and waste; and (3) fully utilizing governmental-approved pharmaceutical purchases as permitted for Disproportionate Share Hospitals. Projected savings from Supply Chain initiatives total $71 million in Fiscal 2018, building to $110 million in Fiscal 2020.
Lab Transformation and Pharmacy H+H projects $9 million in savings from transforming H+H laboratory services and $3 million in savings from updating 340B guidelines, for a total of $12 million in annual savings. The lab transformation includes a partnership with North Shore Long Island Jewish to consolidate core labs for both healthcare systems. The updated 340B guideline changes allow H+H to contract with multiple pharmacies within a single hospital.
$63 $55 $87
$317
$121
$448
$154
$544
$0
$100
$200
$300
$400
$500
$600
Supply Chain and Care Management Initiatives Restructuring and Personnel Initiatives
Expense Reducing InitiativesDollars in Millions
Fiscal 2017 Fiscal 2018 Fiscal 2019 Fiscal 2020

Finance Division Briefing Paper New York City Health + Hospitals
Page 12
Restructuring & Personnel The restructuring of healthcare services generates the greatest savings in the Plan, providing $216.5 million in Fiscal 2018, $348 million in Fiscal 2019, and $444 million in Fiscal 2020. A reduction in global Full-Time Equivalent (FTE) staff provides an additional $100 million in annual savings in Fiscal 2018-2020.
Finance Division Briefing Paper New York City Health + Hospitals
Page 13
Fiscal 2017 Preliminary Mayor’s Management Report
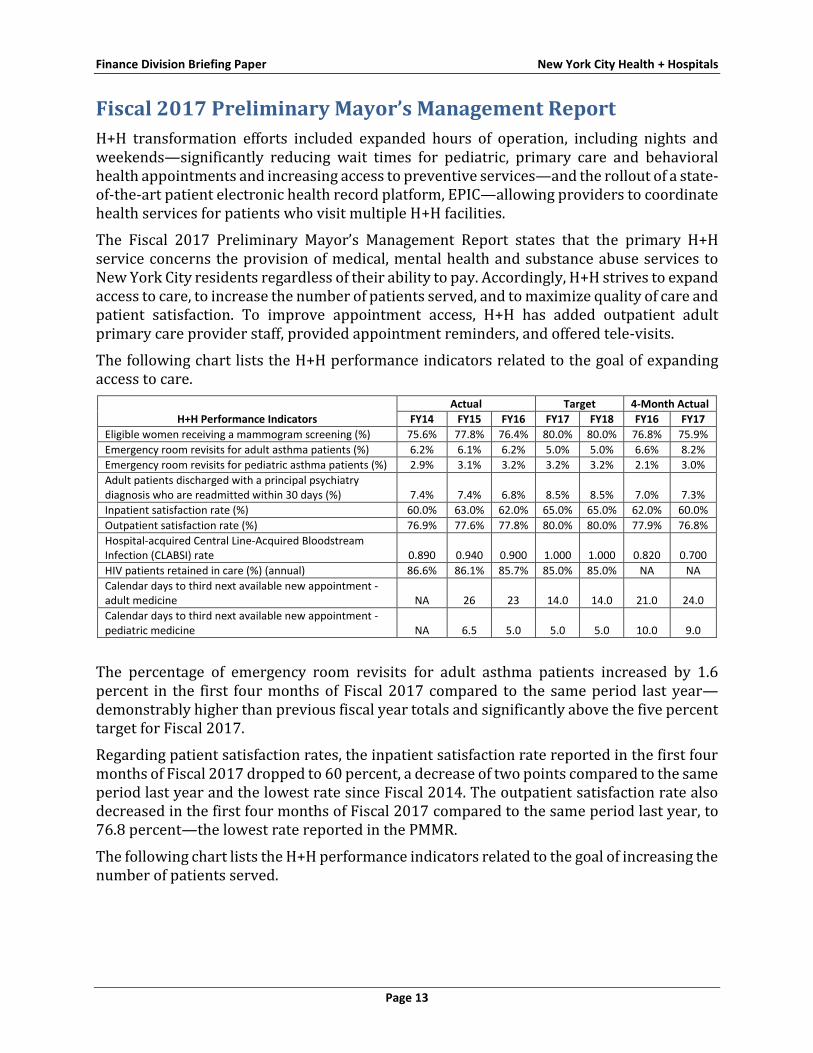
H+H transformation efforts included expanded hours of operation, including nights and weekends—significantly reducing wait times for pediatric, primary care and behavioral health appointments and increasing access to preventive services—and the rollout of a state-of-the-art patient electronic health record platform, EPIC—allowing providers to coordinate health services for patients who visit multiple H+H facilities.
The Fiscal 2017 Preliminary Mayor’s Management Report states that the primary H+H service concerns the provision of medical, mental health and substance abuse services to New York City residents regardless of their ability to pay. Accordingly, H+H strives to expand access to care, to increase the number of patients served, and to maximize quality of care and patient satisfaction. To improve appointment access, H+H has added outpatient adult primary care provider staff, provided appointment reminders, and offered tele-visits.
The following chart lists the H+H performance indicators related to the goal of expanding access to care.
H+H Performance Indicators
Actual Target 4-Month Actual
FY14 FY15 FY16 FY17 FY18 FY16 FY17
Eligible women receiving a mammogram screening (%) 75.6% 77.8% 76.4% 80.0% 80.0% 76.8% 75.9%
Emergency room revisits for adult asthma patients (%) 6.2% 6.1% 6.2% 5.0% 5.0% 6.6% 8.2%
Emergency room revisits for pediatric asthma patients (%) 2.9% 3.1% 3.2% 3.2% 3.2% 2.1% 3.0%
Adult patients discharged with a principal psychiatry diagnosis who are readmitted within 30 days (%) 7.4% 7.4% 6.8% 8.5% 8.5% 7.0% 7.3%
Inpatient satisfaction rate (%) 60.0% 63.0% 62.0% 65.0% 65.0% 62.0% 60.0%
Outpatient satisfaction rate (%) 76.9% 77.6% 77.8% 80.0% 80.0% 77.9% 76.8%
Hospital-acquired Central Line-Acquired Bloodstream Infection (CLABSI) rate 0.890 0.940 0.900 1.000 1.000 0.820 0.700
HIV patients retained in care (%) (annual) 86.6% 86.1% 85.7% 85.0% 85.0% NA NA
Calendar days to third next available new appointment - adult medicine NA 26 23 14.0 14.0 21.0 24.0
Calendar days to third next available new appointment - pediatric medicine NA 6.5 5.0 5.0 5.0 10.0 9.0
The percentage of emergency room revisits for adult asthma patients increased by 1.6 percent in the first four months of Fiscal 2017 compared to the same period last year— demonstrably higher than previous fiscal year totals and significantly above the five percent target for Fiscal 2017.
Regarding patient satisfaction rates, the inpatient satisfaction rate reported in the first four months of Fiscal 2017 dropped to 60 percent, a decrease of two points compared to the same period last year and the lowest rate since Fiscal 2014. The outpatient satisfaction rate also decreased in the first four months of Fiscal 2017 compared to the same period last year, to 76.8 percent—the lowest rate reported in the PMMR.
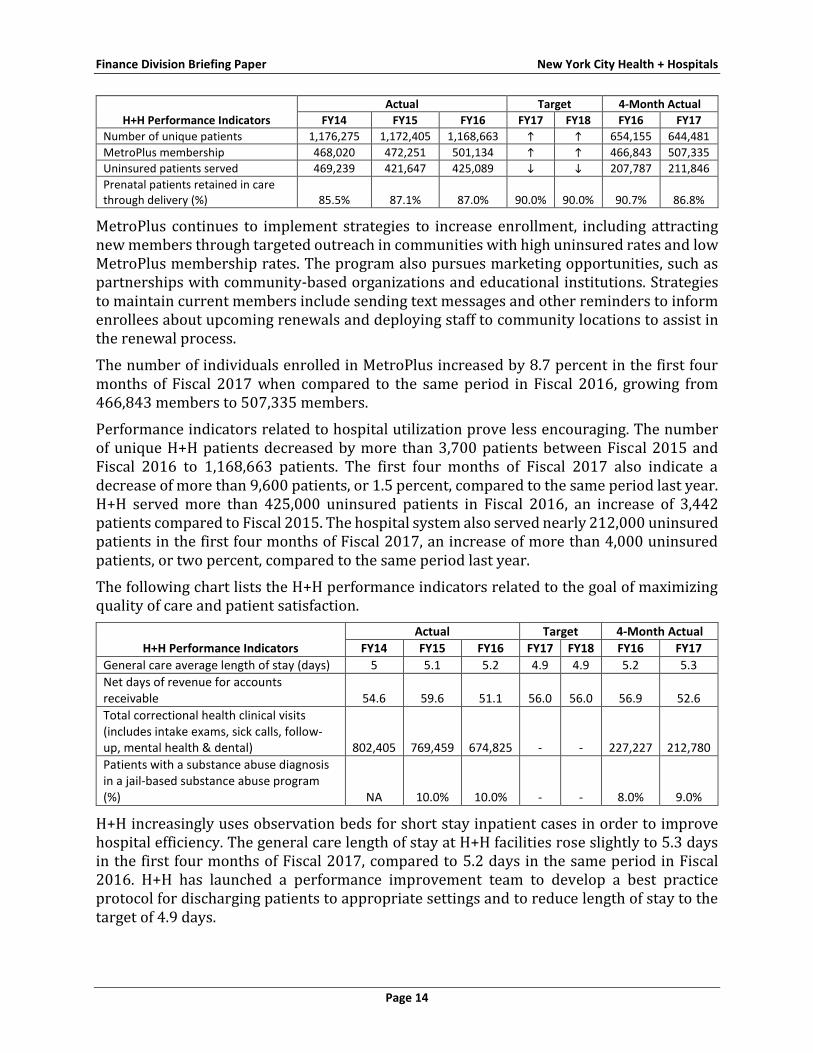
The following chart lists the H+H performance indicators related to the goal of increasing the number of patients served.
Finance Division Briefing Paper New York City Health + Hospitals
Page 14
H+H Performance Indicators
Actual Target 4-Month Actual
FY14 FY15 FY16 FY17 FY18 FY16 FY17
Number of unique patients 1,176,275 1,172,405 1,168,663 654,155 644,481
MetroPlus membership 468,020 472,251 501,134 466,843 507,335
Uninsured patients served 469,239 421,647 425,089 207,787 211,846
Prenatal patients retained in care through delivery (%) 85.5% 87.1% 87.0% 90.0% 90.0% 90.7% 86.8%
MetroPlus continues to implement strategies to increase enrollment, including attracting new members through targeted outreach in communities with high uninsured rates and low MetroPlus membership rates. The program also pursues marketing opportunities, such as partnerships with community-based organizations and educational institutions. Strategies to maintain current members include sending text messages and other reminders to inform enrollees about upcoming renewals and deploying staff to community locations to assist in the renewal process.
The number of individuals enrolled in MetroPlus increased by 8.7 percent in the first four months of Fiscal 2017 when compared to the same period in Fiscal 2016, growing from 466,843 members to 507,335 members.
Performance indicators related to hospital utilization prove less encouraging. The number of unique H+H patients decreased by more than 3,700 patients between Fiscal 2015 and Fiscal 2016 to 1,168,663 patients. The first four months of Fiscal 2017 also indicate a decrease of more than 9,600 patients, or 1.5 percent, compared to the same period last year. H+H served more than 425,000 uninsured patients in Fiscal 2016, an increase of 3,442 patients compared to Fiscal 2015. The hospital system also served nearly 212,000 uninsured patients in the first four months of Fiscal 2017, an increase of more than 4,000 uninsured patients, or two percent, compared to the same period last year.
The following chart lists the H+H performance indicators related to the goal of maximizing quality of care and patient satisfaction.
H+H Performance Indicators
Actual Target 4-Month Actual
FY14 FY15 FY16 FY17 FY18 FY16 FY17
General care average length of stay (days) 5 5.1 5.2 4.9 4.9 5.2 5.3
Net days of revenue for accounts receivable 54.6 59.6 51.1 56.0 56.0 56.9 52.6
Total correctional health clinical visits (includes intake exams, sick calls, follow-up, mental health & dental) 802,405 769,459 674,825 - - 227,227 212,780
Patients with a substance abuse diagnosis in a jail-based substance abuse program (%) NA 10.0% 10.0% - - 8.0% 9.0%
H+H increasingly uses observation beds for short stay inpatient cases in order to improve hospital efficiency. The general care length of stay at H+H facilities rose slightly to 5.3 days in the first four months of Fiscal 2017, compared to 5.2 days in the same period in Fiscal 2016. H+H has launched a performance improvement team to develop a best practice protocol for discharging patients to appropriate settings and to reduce length of stay to the target of 4.9 days.
Finance Division Briefing Paper New York City Health + Hospitals
Page 15
The total number of correctional health clinical visits, including intake exams, sick calls, follow-up visits, mental health appointments & dental visits, decreased by more than six percent in the first four months of Fiscal 2017 compared to the same period last year, decreasing by more than 14,400 visits to 212,780 visits.
H+H Capital Budget Summary
The Fiscal 2017 Preliminary Capital Commitment Plan allocates $2.32 billion in Fiscal 2017-2020 to New York City Health + Hospitals (including City and Non-City funds). This funding represents approximately four percent of the City’s total $64 billion Plan for Fiscal 2017-2020. Health + Hospitals’ Preliminary Commitment Plan for Fiscal 2017-2020 is $21.6 million more than the $2.30 billion scheduled in the Fiscal 2017 Adopted Capital Commitment Plan, a one percent increase.
DOHMH 2017-2020 Capital Commitment Plan: Adopted and Preliminary Budget Dollars in Thousands
FY17 FY18 FY19 FY20 Total
Adopted Plan Total Capital Plan $839,757 $591,225 $486,428 $385,129 $2,302,539
Preliminary Plan Total Capital Plan $867,862 $592,643 $486,429 $377,180 $2,324,114
Change Level $28,105 $1,418 $1 ($7,949) $21,575
Percent Change 3.35% 0.24% 0% 2.06% 0.94%
The majority of capital projects span multiple fiscal years; therefore, it remains common practice for an agency to roll unspent capital funds into future fiscal years. Hence, the Department may roll a significant portion of its Fiscal 2017 Capital Plan into Fiscal 2018, increasing the size of the Fiscal 2017-2021 Capital Plan. Since adoption last June, the citywide total Capital Commitment Plan for Fiscal 2017 has increased from $19.2 billion in the Adopted Capital Commitment Plan to $20 billion in the Preliminary Capital Commitment Plan, an increase of $785 million, or four percent.
The City funds approximately 44 percent of Health + Hospitals’ capital plan, contributing $1 billion of the total $2.3 billion plan.
Preliminary Capital Plan Highlights
The H+H capital program replaces or renovates aging facilities and equipment in an effort to modernize system operations, improve market share, and increase patient safety, comfort, and satisfaction. The capital program also strives to achieve operational efficiencies and satisfy regulatory requirements and/or correct code deficiencies.
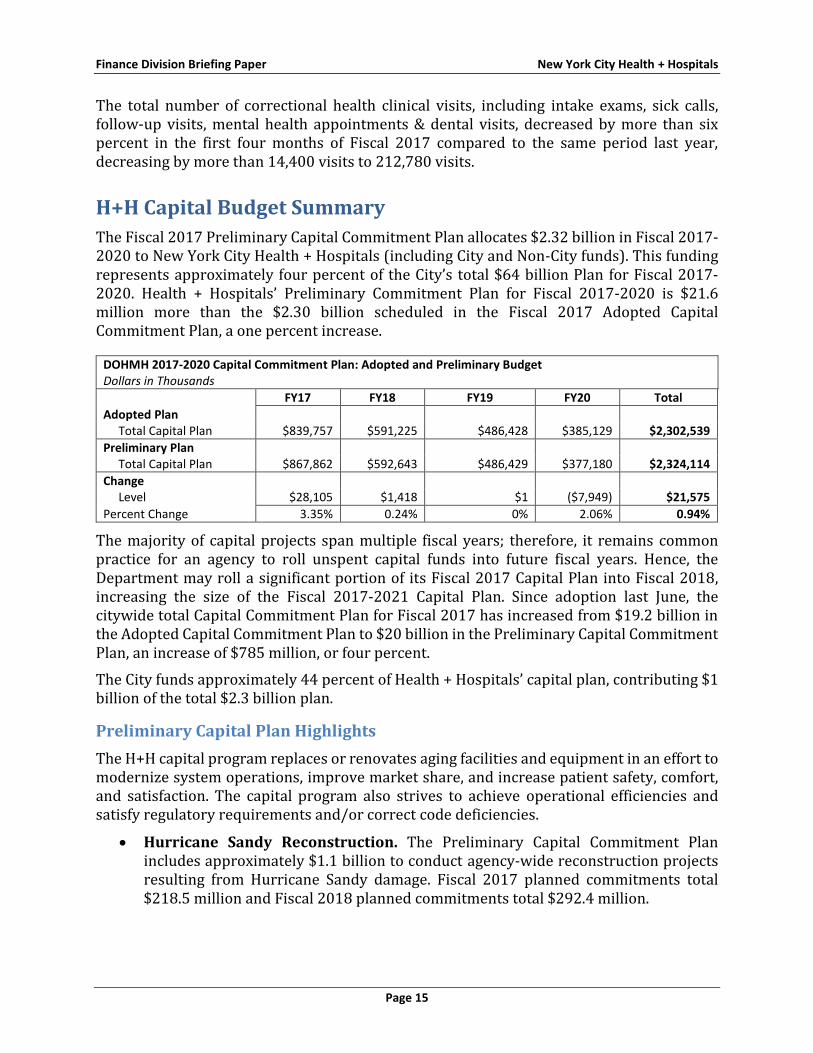
Hurricane Sandy Reconstruction. The Preliminary Capital Commitment Plan includes approximately $1.1 billion to conduct agency-wide reconstruction projects resulting from Hurricane Sandy damage. Fiscal 2017 planned commitments total $218.5 million and Fiscal 2018 planned commitments total $292.4 million.
Finance Division Briefing Paper New York City Health + Hospitals
Page 16
Integrated Clinical Information System (ICIS). The Plan includes $194.1 million to update the H+H Electronic Medical Record system to ICIS, including $69.2 million in Fiscal 2017 and $83.4 million in Fiscal 2018.
FDNY/EMS Ambulances. The Plan commits $136.4 million to the procurement and outfitting of Fire Department/Emergency Medical Services ambulances, including $57.9 million in Fiscal 2017 and $55.3 million in Fiscal 2018.
Preliminary Ten-Year Capital Strategy
Health + Hospitals operates 11 acute care hospitals, six Diagnostic and Treatment Centers, four long-term care facilities, a certified home healthcare agency, and more than 70 community health clinics throughout the five boroughs. A combination of City General Obligation bonds and Transitional Finance Authority (TFA) bonds fund H+H’s capital plan.
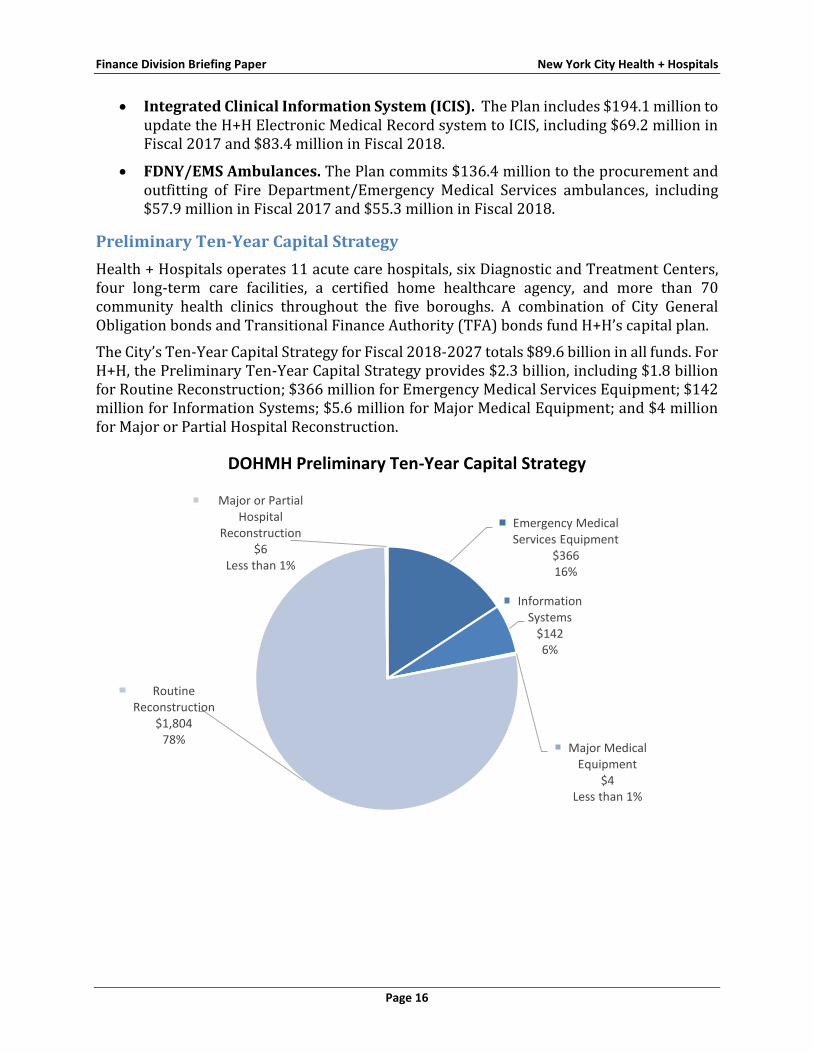
The City’s Ten-Year Capital Strategy for Fiscal 2018-2027 totals $89.6 billion in all funds. For H+H, the Preliminary Ten-Year Capital Strategy provides $2.3 billion, including $1.8 billion for Routine Reconstruction; $366 million for Emergency Medical Services Equipment; $142 million for Information Systems; $5.6 million for Major Medical Equipment; and $4 million for Major or Partial Hospital Reconstruction.
DOHMH Preliminary Ten-Year Capital Strategy
Emergency Medical Services Equipment
$366 16%
Information Systems
$142 6%
Major Medical Equipment
$4 Less than 1%
Routine Reconstruction
$1,804 78%
Major or Partial Hospital
Reconstruction$6
Less than 1%
Finance Division Briefing Paper New York City Health + Hospitals
Page 17
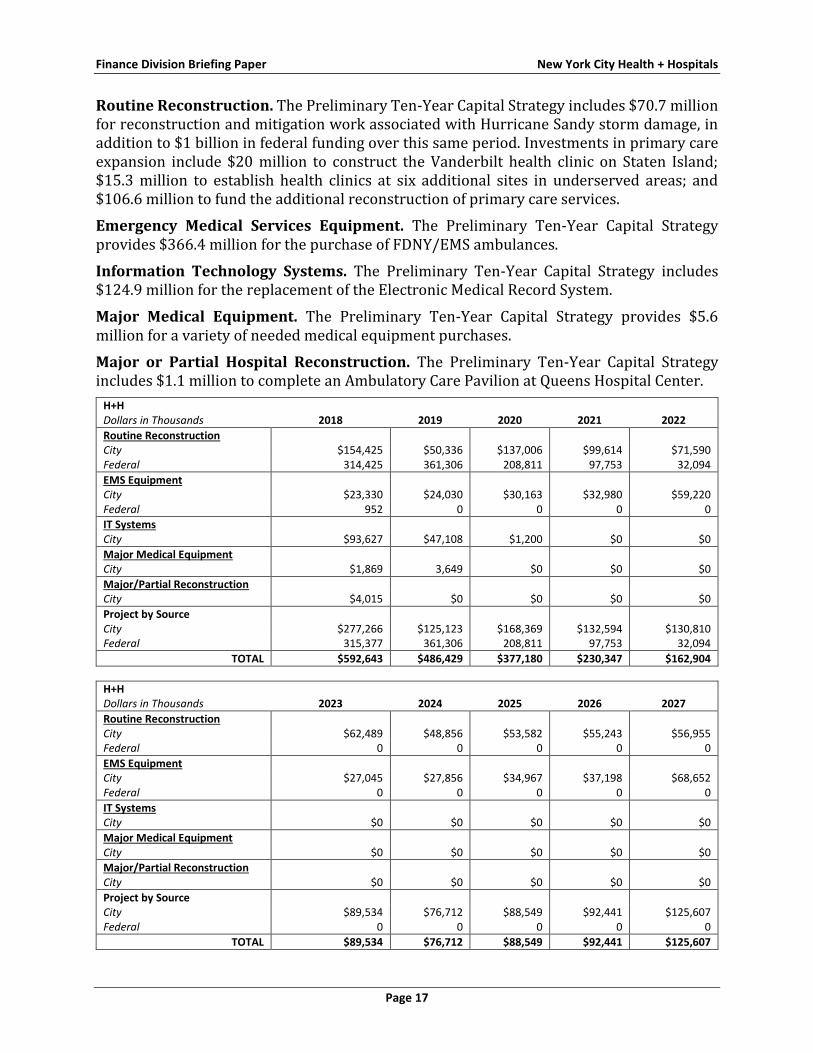
Routine Reconstruction. The Preliminary Ten-Year Capital Strategy includes $70.7 million for reconstruction and mitigation work associated with Hurricane Sandy storm damage, in addition to $1 billion in federal funding over this same period. Investments in primary care expansion include $20 million to construct the Vanderbilt health clinic on Staten Island; $15.3 million to establish health clinics at six additional sites in underserved areas; and $106.6 million to fund the additional reconstruction of primary care services.
Emergency Medical Services Equipment. The Preliminary Ten-Year Capital Strategy provides $366.4 million for the purchase of FDNY/EMS ambulances.
Information Technology Systems. The Preliminary Ten-Year Capital Strategy includes $124.9 million for the replacement of the Electronic Medical Record System.
Major Medical Equipment. The Preliminary Ten-Year Capital Strategy provides $5.6 million for a variety of needed medical equipment purchases.
Major or Partial Hospital Reconstruction. The Preliminary Ten-Year Capital Strategy includes $1.1 million to complete an Ambulatory Care Pavilion at Queens Hospital Center.
H+H Dollars in Thousands 2018 2019 2020 2021 2022
Routine Reconstruction
City $154,425 $50,336 $137,006 $99,614 $71,590 Federal 314,425 361,306 208,811 97,753 32,094
EMS Equipment
City $23,330 $24,030 $30,163 $32,980 $59,220 Federal 952 0 0 0 0
IT Systems
City $93,627 $47,108 $1,200 $0 $0
Major Medical Equipment
City $1,869 3,649 $0 $0 $0
Major/Partial Reconstruction
City $4,015 $0 $0 $0 $0
Project by Source
City $277,266 $125,123 $168,369 $132,594 $130,810 Federal 315,377 361,306 208,811 97,753 32,094
TOTAL $592,643 $486,429 $377,180 $230,347 $162,904
H+H Dollars in Thousands 2023 2024 2025 2026 2027
Routine Reconstruction
City $62,489 $48,856 $53,582 $55,243 $56,955 Federal 0 0 0 0 0
EMS Equipment
City $27,045 $27,856 $34,967 $37,198 $68,652 Federal 0 0 0 0 0
IT Systems
City $0 $0 $0 $0 $0
Major Medical Equipment
City $0 $0 $0 $0 $0
Major/Partial Reconstruction
City $0 $0 $0 $0 $0
Project by Source
City $89,534 $76,712 $88,549 $92,441 $125,607 Federal 0 0 0 0 0
TOTAL $89,534 $76,712 $88,549 $92,441 $125,607
Finance Division Briefing Paper New York City Health + Hospitals
Page 18
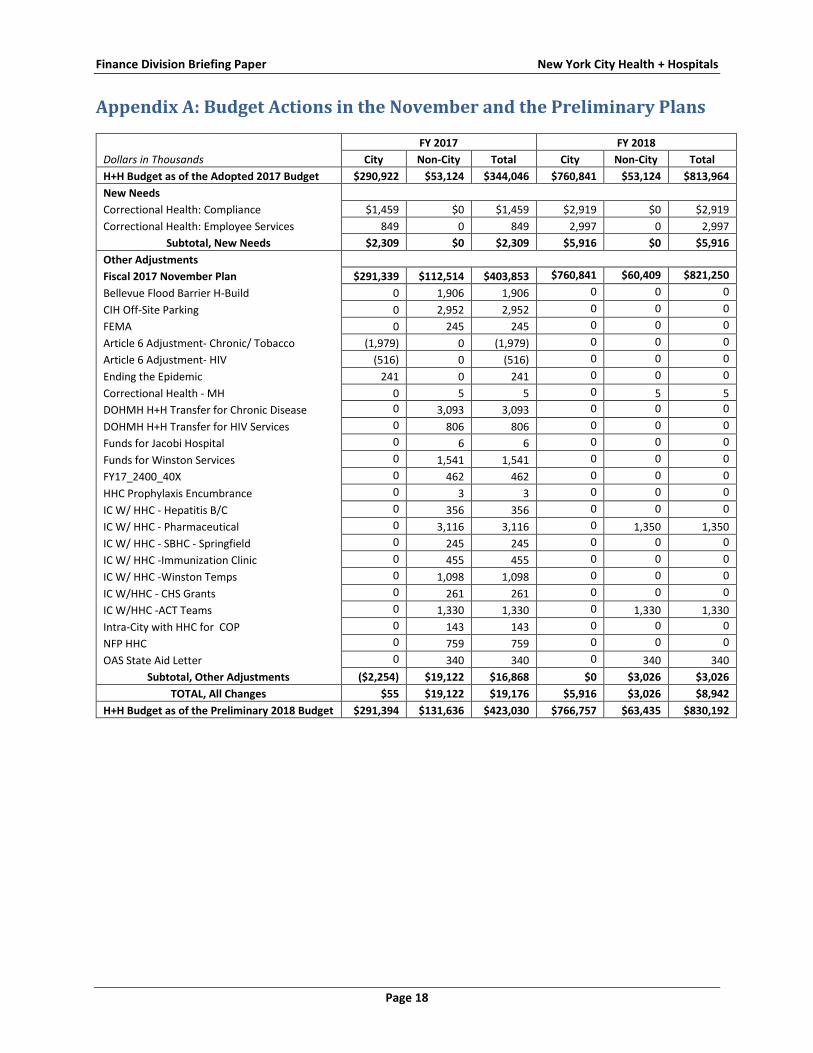
Appendix A: Budget Actions in the November and the Preliminary Plans
Dollars in Thousands
FY 2017 FY 2018
City Non-City Total City Non-City Total
H+H Budget as of the Adopted 2017 Budget $290,922 $53,124 $344,046 $760,841 $53,124 $813,964
New Needs
Correctional Health: Compliance $1,459 $0 $1,459 $2,919 $0 $2,919
Correctional Health: Employee Services 849 0 849 2,997 0 2,997
Subtotal, New Needs $2,309 $0 $2,309 $5,916 $0 $5,916
Other Adjustments
Fiscal 2017 November Plan $291,339 $112,514 $403,853 $760,841 $60,409 $821,250
Bellevue Flood Barrier H-Build 0 1,906 1,906 0 0 0
CIH Off-Site Parking 0 2,952 2,952 0 0 0
FEMA 0 245 245 0 0 0
Article 6 Adjustment- Chronic/ Tobacco (1,979) 0 (1,979) 0 0 0
Article 6 Adjustment- HIV (516) 0 (516) 0 0 0
Ending the Epidemic 241 0 241 0 0 0
Correctional Health - MH 0 5 5 0 5 5
DOHMH H+H Transfer for Chronic Disease 0 3,093 3,093 0 0 0
DOHMH H+H Transfer for HIV Services 0 806 806 0 0 0
Funds for Jacobi Hospital 0 6 6 0 0 0
Funds for Winston Services 0 1,541 1,541 0 0 0
FY17_2400_40X 0 462 462 0 0 0
HHC Prophylaxis Encumbrance 0 3 3 0 0 0
IC W/ HHC - Hepatitis B/C 0 356 356 0 0 0
IC W/ HHC - Pharmaceutical 0 3,116 3,116 0 1,350 1,350
IC W/ HHC - SBHC - Springfield 0 245 245 0 0 0
IC W/ HHC -Immunization Clinic 0 455 455 0 0 0
IC W/ HHC -Winston Temps 0 1,098 1,098 0 0 0
IC W/HHC - CHS Grants 0 261 261 0 0 0
IC W/HHC -ACT Teams 0 1,330 1,330 0 1,330 1,330
Intra-City with HHC for COP 0 143 143 0 0 0
NFP HHC 0 759 759 0 0 0
OAS State Aid Letter 0 340 340 0 340 340
Subtotal, Other Adjustments ($2,254) $19,122 $16,868 $0 $3,026 $3,026
TOTAL, All Changes $55 $19,122 $19,176 $5,916 $3,026 $8,942
H+H Budget as of the Preliminary 2018 Budget $291,394 $131,636 $423,030 $766,757 $63,435 $830,192
Finance Division Briefing Paper New York City Health + Hospitals
Page 19
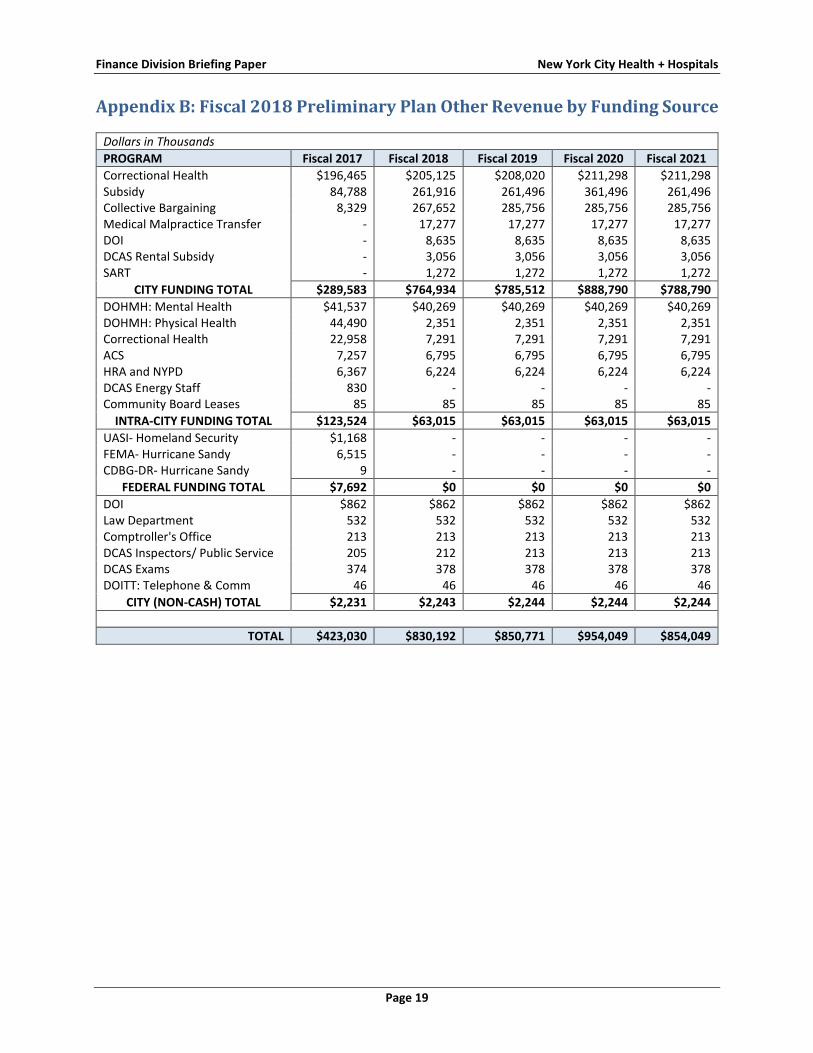
Appendix B: Fiscal 2018 Preliminary Plan Other Revenue by Funding Source
Dollars in Thousands
PROGRAM Fiscal 2017 Fiscal 2018 Fiscal 2019 Fiscal 2020 Fiscal 2021
Correctional Health $196,465 $205,125 $208,020 $211,298 $211,298 Subsidy 84,788 261,916 261,496 361,496 261,496 Collective Bargaining 8,329 267,652 285,756 285,756 285,756 Medical Malpractice Transfer - 17,277 17,277 17,277 17,277 DOI - 8,635 8,635 8,635 8,635 DCAS Rental Subsidy - 3,056 3,056 3,056 3,056 SART - 1,272 1,272 1,272 1,272
CITY FUNDING TOTAL $289,583 $764,934 $785,512 $888,790 $788,790
DOHMH: Mental Health $41,537 $40,269 $40,269 $40,269 $40,269 DOHMH: Physical Health 44,490 2,351 2,351 2,351 2,351 Correctional Health 22,958 7,291 7,291 7,291 7,291 ACS 7,257 6,795 6,795 6,795 6,795 HRA and NYPD 6,367 6,224 6,224 6,224 6,224 DCAS Energy Staff 830 - - - - Community Board Leases 85 85 85 85 85
INTRA-CITY FUNDING TOTAL $123,524 $63,015 $63,015 $63,015 $63,015
UASI- Homeland Security $1,168 - - - - FEMA- Hurricane Sandy 6,515 - - - - CDBG-DR- Hurricane Sandy 9 - - - -
FEDERAL FUNDING TOTAL $7,692 $0 $0 $0 $0
DOI $862 $862 $862 $862 $862 Law Department 532 532 532 532 532 Comptroller's Office 213 213 213 213 213 DCAS Inspectors/ Public Service 205 212 213 213 213 DCAS Exams 374 378 378 378 378 DOITT: Telephone & Comm 46 46 46 46 46
CITY (NON-CASH) TOTAL $2,231 $2,243 $2,244 $2,244 $2,244
TOTAL $423,030 $830,192 $850,771 $954,049 $854,049