Embed Size (px)
Citation preview
Journal of Financial Economics 00 (2002) 000-000
The costs of shared ownership: Evidence from international joint ventures
Mihir A. Desai,a,* C. Fritz Foley,b
James R. Hines Jr.b
aHarvard Business School, Boston, MA 02163, USA
bUniversity of Michigan Business School, Ann Arbor, MI 48109, USA
(Received 26 July 2002; accepted 8 July 2003)
Abstract
This paper analyzes the determinants of partial ownership of the foreign affiliates of U.S. multinational firms and, in particular, the marked decline in the use of joint ventures over the last 20 years. The evidence indicates that whole ownership is most common when firms coordinate integrated production activities across different locations, transfer technology, and benefit from worldwide tax planning. Because operations and ownership levels are jointly determined, it is helpful to use the liberalization of ownership restrictions by host countries and the imposition of joint venture tax penalties in the U.S. Tax Reform Act of 1986 as instruments for ownership levels to identify these effects. Firms responded to these regulatory and tax changes by using wholly owned affiliates instead of joint ventures and expanding intrafirm trade and technology transfer. The implied complementarity of whole ownership and intrafirm trade suggests that the reduced costs of engaging in integrated global operations contributed substantially to the sharply declining propensity of American firms to organize their foreign operations as joint ventures over the last two decades. Estimates imply that as much as one-fifth to three-fifths of the decline in the use of joint ventures by multinational firms is attributable to the increased importance of intrafirm transactions. The forces of globalization appear to have diminished, rather than accelerated, the use of shared ownership.
JEL classification: F23; L23; G32; H87 Keywords: Organizational Form, Joint Ventures, Intrafirm Transactions, Taxation, Multinational Firms
This paper is a revised version of a paper circulated with the title “International Joint Ventures and
the Boundaries of the Firm.” The statistical analysis of firm-level data on U.S. multinational companies was conducted at the International Investment Division, Bureau of Economic Analysis, U.S. Department of Commerce under arrangements that maintain legal confidentiality requirements. The views expressed are those of the authors and do not reflect official positions of the U.S. Department of Commerce. The authors thank Ray Fisman, Bill Schwert, Bernard Yeung, the International Investment Division staff, various seminar participants, and two anonymous referees for helpful comments on earlier drafts, and the Lois and Bruce Zenkel Research Fund at the University of Michigan and the Division of Research at Harvard Business School for financial support.
*Corresponding author contact information: Mihir A. Desai, Morgan 363, Harvard Business
School, Boston MA 02163 E-mail: [email protected]
0304-405X/02/ $ see front matter © 2002 Published by Elsevier Science B.V. All rights reserved
1. Introduction
The appropriate ownership of productive enterprise is a central issue in economic theory
and a practical question for multinational firms establishing new foreign affiliates. Multinational
firms frequently have the option to own 100%, majority, or minority shares of newly created
foreign entities. In addition, they could participate in foreign markets by exporting from home
countries or by permitting foreign companies to produce under licensing agreements. These
alternatives imply varying levels of control and commitment and allow firms to tailor the
organization of foreign operations to market circumstances. A variety of ownership forms
entailing less than 100% parent ownership, and the accompanying coordination of interests
between more than one firm, is loosely grouped in the academic and popular literature and
known as alliances.
The rapid pace of globalization suggests to many observers that international alliances are
essential to the success and survival of multinational enterprises.1 This viewpoint has not,
however, been subjected to sharp statistical tests based on actual practice, in part because of the
difficulty of identifying the determinants of such a heterogeneous group of activities as those
encompassed by alliances. The purpose of this paper is to identify the factors associated with
one class of such activity, situations in which American multinational firms share ownership of
foreign affiliates. The comprehensive U.S. data described in section 3, and analyzed in section 4,
offer clues to the magnitudes of the costs and benefits associated with partial ownership, as
revealed by the behavior of American companies in creating new foreign affiliates. The analysis
also answers the question of whether the joint venture form of international alliance is an
increasingly important feature of international business and indicates the way in which
ownership decisions have responded to the changing nature of globalization over the last two
decades.
A comprehensive review of all U.S. overseas affiliate activity from 1982 to 1997
indicates that American multinational firms are decreasingly likely to establish their foreign
affiliates as joint ventures. Over the same period, these companies have increased the extent to
which they exchange goods and intangible assets between parent companies and their own
1 Ohmae (1989, p. 143), for example, suggests that “[g]lobalization mandates alliances, makes them absolutely essential to strategy.”
2
foreign affiliates. The decline in the use of shared ownership is consistent with an increased
appetite for control by multinational parents that must manage an increasingly integrated
network of affiliates abroad.
The analysis in the paper suggests that this increased appetite for control by multinational
parents reflects growing differences between the costs of running overseas operations as joint
ventures and the costs of administering foreign activities as wholly owned operations. At least
three sources of the rising coordination costs of shared ownership can be identified. First, tax-
efficient structuring of worldwide operations is made more difficult by tensions between joint
venture partners concerned with local profits and multinational parents concerned with global
profits. Second, the ability to transfer intellectual property is limited by fear of its appropriation
by local partners. Third, the desire to structure worldwide production in a decentralized way
with greater intrafirm trade creates the room for more conflict with local partners who have
competing goals. Because multinational firms rely increasingly on cost savings and market
opportunities created by worldwide tax planning, technology transfer, and production
decentralization, they face growing incentives to avoid sharing ownership of their foreign
affiliates. Multinational affiliates that instead rely on local markets for inputs or for sales are the
least likely to be affected by these trends.
The cross-sectional evidence that whole ownership of affiliates is associated with close
coordination of parent and affiliate activity does not prove that ownership is a function of
coordination costs, because both ownership and operational decisions could be joint responses to
other unmeasured factors. One way to isolate the effect of intrafirm transactions on ownership
would be to identify exogenous changes in the costs of intrafirm transactions and trace their
effects on ownership decisions. Given the difficulty of obtaining appropriate instruments for
changes in coordination costs, however, estimating the effect of ownership levels on intrafirm
trade is more practical. This yields a useful result, because the symmetry conditions of producer
theory imply that the effect of ownership on intrafirm trade equals the effect of intrafirm trade on
ownership.
The empirical work exploits two types of changes in government policy that affected the
relative costs of sharing ownership - the liberalization of ownership restrictions by certain host
countries and the U.S. Tax Reform Act of 1986 (TRA86) - to identify the extent of linkage

3
between ownership decisions and coordinated activity between parents and affiliates. Affiliates
of American firms operating in countries that liberalize their restrictions on foreign ownership
subsequently sell more to related parties after liberalization. American firms whose joint
ventures would be subject to tax penalties after 1986 likewise engage in greater related party
transactions after the reform. These patterns are consistent with complementarity between
intrafirm transactions and majority and 100% ownership, and they suggest that the increased
desire to coordinate parent and affiliate trade, technology transfers, and tax planning that is
evident over the last 20 years contributed to the growth of control over worldwide operations.
Estimates imply that between one-fifth and three-fifths of the decline in the use of partial
ownership by multinational firms is attributable to the increased importance of intrafirm
transactions. The forces of globalization appear to have diminished instead of accelerated the
use of shared ownership.
Section 2 of the paper reviews the theoretical and empirical literature on international
joint ventures. Section 3 describes recent patterns of joint venture activity. Section 4 analyzes
the determinants of the ownership fractions of the foreign affiliates of American multinational
corporations. Section 5 is the conclusion.
2. Theory and practice of international joint ventures
The factors that influence a multinational parent’s preferences for full or shared
ownership of affiliates have been extensively discussed. The considerations receiving the most
theoretical and empirical attention stem from work on transactions costs and contract theory.
The transactions cost approach to the organization of firms, developed by Williamson (1975),
Klein, Crawford, and Alchian (1978), and others, stresses that agents who develop a specific
asset confront the possibility of opportunistic behavior by their trading partners. Building on this
work, Oxley (1997) and Anand and Khanna (2000) also identify the hazard of intangible asset
appropriability in arm’s-length relationships and various forms of alliances. These inefficiencies
are thought to be mitigated when activities are organized under common ownership. Based on
similar premises as the transactions cost approach, the property rights approach, developed by
Grossman and Hart (1986), Hart and Moore (1990), and others, formalizes the notion of asset
specificity and focuses on the way in which ex ante investment incentives differ across
4
ownership structures.2 In this framework, joint ownership is generally suboptimal because of the
sharing of residual control rights.
The moral hazard problems that arise in cooperative efforts have attracted considerable
attention since the Holmstrom (1982) finding that efficient sharing rules do not exist for certain
types of partnerships. Subsequent work identifies circumstances in which efficient sharing rules
could exist, including those with repeated play, unlimited liability, and those in which risk-averse
agents use stochastic sharing rules.3 In the important case in which assets are jointly used, joint
ownership could be an efficient arrangement. Aghion and Tirole (1994) find that “split”
property rights can encourage innovation in settings with incomplete information. Similarly, the
existence of potential spillovers means that parent firms could benefit from coordinated research
and development (R&D) activity in spite of the associated moral hazard problems.4 The moral
hazard created by partnership arrangements can facilitate certain types of market transactions.
Crampton, Gibbons and Klemperer (1987) note that, in environments with incomplete
information, joint ownership of an asset could be consistent with efficient resource allocation.5
Similarly, Rey and Tirole (1999) demonstrate that joint ventures can alleviate biased decision
making but can also be associated with complexities arising from divergent objectives. Baker,
Gibbons, and Murphy (2002a) develop a relational-adaptation theory of the firm that is employed
in Baker, Gibbons, and Murphy (2002b) to understand the efficiency of joint ventures as an
organizational form in static and relational settings. In static settings, joint ventures are found to
be efficient organizational forms relative to looser alliances when spillovers are large. In
relational settings, joint ventures are found to be efficient organizational forms relative to mutual
divestiture of assets when spillovers are small.
Empirical work on the use of joint ventures by multinational companies suggests that
firms select ownership levels that economize on transaction costs.6 As outlined by Stopford and
Wells (1972), Beamish and Banks (1987), Contractor and Lorange (1988), Gomes-Casseres
2 For a careful treatment of the differences between the transactions cost approach and the property rights approach, see Whinston (2002). 3 See, for example, Legros and Matthews (1993). 4 See Bhattacharya, Glazer and Sappington (1992); Kaimen, Muller and Zang (1992); and Gandal and Scotchmer (1993) for examples. 5 Hart and Moore (1998) and other recent work on non-profit cooperative ownership structures considers joint ownership through cooperatives but typically in a not-for-profit setting. 6 This evidence is reviewed in Caves (1996).

5
(1989), and Asiedu and Esfahani (2001), joint ventures balance the benefits of combining
complementary assets with costs that include managerial conflicts and shirking. Gatignon and
Anderson (1988) present evidence that parents seek higher levels of ownership in affiliates that
make greater use of proprietary assets. In a study of technology transfers to Indian firms,
Ramachandran (1993) finds that subsidiaries that are 100% owned by foreign multinationals
receive greater technology transfers than do Indian-owned firms or subsidiaries that are partially
owned by foreign multinationals. In contrast, Hennart (1991) argues that the cost of using
market transactions to purchase other firms’ intermediate inputs makes joint ventures particularly
attractive.
Multinational parents also select ownership levels with eyes to facilitating the
coordination of pricing and production decisions. Unlike other types of firms, multinational
firms have units that are simultaneously active in multiple countries. As a result, these firms
have the ability to adjust prices used for intrafirm transfers to allocate taxable income among
jurisdictions and reduce the associated tax liabilities. Horst (1971) and Kant (1990) model the
optimal transfer prices that multinational firms should charge in cross-border transactions. Kant
(1990) points out a limitation of joint ventures by indicating that significant conflicts of interest
can arise in setting transfer prices between whole and partially owned affiliates because
multinational parents have incentives to shift profits away from affiliates owned jointly with
other investors. Sole ownership also provides multinational firms the control needed to integrate
worldwide operations. Franko (1971) reports limited use of joint ventures by multinational firms
with the ability to shift production between locations, presumably as a result of excessive
compensation demanded by potential joint venture partners fearing that multinational parents
would shift production away from them first during an economic downturn.
There is good reason to suspect that coordination problems associated with managing a
worldwide production process have become more prevalent over the last two decades. Feenstra
and Hanson (1996a, 1996b) and Feenstra (1998) point out that the integration of world markets
has been accompanied by a disintegration of the production process in which different stages of
making a finished good take place in different places. Hanson, Mataloni, and Slaughter (2001)
find evidence that parents export a small but growing volume of intermediate goods to affiliates
for further processing and that affiliates play increasingly important roles as distributors and
regional exporters. Zeile (1997) indicates that an increasing percentage of U.S. multinational
6
parent company trade takes place with affiliated parties. Given that multinationals are
transferring more goods inside the firm, there could be increasing benefits to 100% ownership of
affiliates. Moran (2001) presents numerous case studies that suggest such benefits exist for
affiliates that are tightly integrated into the parent system.
Resource-constrained firms have the potential to learn from their local partners without
incurring prohibitive expenses. Stopford and Haberich (1978) present data suggesting that
smaller British multinationals made greater use of joint ventures when entering markets outside
of the Commonwealth. Blömstrom and Zejan (1991) find evidence that parents were more likely
to choose partial as opposed to 100% ownership when diversifying, although Ghemawat, Porter,
and Rawlinson (1985) suggest the opposite in their study of international coalitions. Kogut
(1991) characterizes joint ventures as “real options” that provide firms with information they can
use in forming subsequent plans, which could include acquiring their partners or dissolving their
joint ventures. Similarly, Balakrishnan and Koza (1993) view joint ventures as intermediate
forms between markets and hierarchies that permit firms to overcome informational asymmetries
at low cost.
An additional common motivation for finding a local partner is the need to curry favor
with host governments. As recently as two decades ago, many host country governments
attempted to restrict foreign ownership of domestic firms. Franko (1989), Gomes-Casseres
(1990), and Contractor (1990) argue that sole ownership is generally preferred by multinational
parents but occasionally conceded in bargains with host governments.7 Henisz (2000) and
Gatignon and Anderson (1988) present evidence that multinational parents entering countries
with higher political risk are more likely to use joint ownership because local firms are well
positioned to interact with local government.
Older surveys commonly report a rising use of joint ventures by multinational firms.
Anderson (1990) and Geringer and Hebert (1991) claim that American firms rely to an ever-
greater extent on international joint ventures and will continue to do so. Curhan, Davidson, and
Suri (1977), using survey data collected through the Harvard Multinational Project, document a
dramatic rise in the use of international joint ventures by American firms between 1951 and
7 Moran (2001) argues that host governments should not require local participation as multinationals respond by reducing their level of technology transfer. Moran argues that the consequent lost backward linkages offset any beneficial aspects of such policies.

7
1975. Hladik (1985) extends Curhan, Davidson, and Suri’s data through 1984 and projects
continued growth of international joint ventures by U.S. firms. In contrast, Desai and Hines
(1999) draw attention to the reduced usage of minority ownership after passage of the U.S. Tax
Reform Act of 1986 and identify patterns in the data suggesting that the tax penalties introduced
in 1986 are at least partly responsible for the decline.
3. Data and Descriptive Statistics
The empirical work presented in Section 4 is based on the most comprehensive available
data on the activities of American multinational firms. The Bureau of Economic Analysis (BEA)
annual survey of U.S. direct investment abroad from 1982 through 1997 provides a panel of data
on the financial and operating characteristics of U.S. firms operating abroad.8 Table 1 displays
basic information on the incidence and size of affiliates by level of parent ownership in the three
benchmark survey years (1982, 1989, and 1994) for which the most extensive data are available
and in the most recent year in the panel, 1997. In the most recent benchmark year and in 1997,
approximately 80% of all affiliates are organized as wholly owned affiliates, with minority and
majority ownership each comprising approximately 10% of the sample.9 The dynamics of
multinational ownership over the sample period are clear, as the prevalence of minority-owned
affiliates declines from 17.9% of affiliates in 1982 to 10.6%, while the prevalence of wholly
owned affiliates increases from 72.3% of affiliates to 80.4%. Little evidence exists that
minority-owned affiliates are smaller than majority-owned affiliates. In fact, the median sales,
assets, and employment of minority-owned affiliates are very similar to, and often slightly larger
than, the median sales, assets, and employment of wholly owned affiliates. In 1997, median
sales for minority-owned affiliates was $46.7 million, while the median sales for majority-owned
affiliates was $44.9 million, and the median sales for wholly owned affiliates was $41.1 million.
[Insert Table 1 near here.]
8 Coverage and methods of the BEA survey are described in Desai, Foley, and Hines (2002). The most extensive data are available for 1982, 1989, and 1994, when BEA conducted benchmark surveys. In these years, all affiliates with sales, assets, or net income in excess of $3 million in absolute value and their parents were required to report data to BEA. For 1983–1988, data on affiliates with sales, assets, or net income greater than $10 million were collected, and this cutoff rose to $15 million for 1990–1993 and $20 million for 1995–1997. 9 Wholly owned affiliates are those owned 100% by an American parent. Majority-owned affiliates are foreign affiliates in which the largest ownership claim by a U.S. parent exceeds 50% and is less than 100%. Minority-owned affiliates are those in which the largest ownership claim by a U.S. parent is at least 10% but not more than 50%.
8
Panel B of Table 1 displays entry and exit rates of affiliates over the 1982–1989 and
1989–1994 periods. The entry rate is calculated as the ratio of the number of affiliates appearing
for the first time during the period that did not appear in the beginning year to the number of
affiliates appearing in the beginning year. The exit rate is computed by taking the ratio of the
number of affiliates leaving the sample during the period to the number of affiliates appearing in
the beginning year. The entry and exit rates are large, suggesting a large amount of turnover
among affiliates in the sample. These entry and exit rates also indicate that turnover is
associated with a shift toward higher levels of ownership. For minority-owned affiliates, the
entry rate is significantly less than the exit rate in the 1982–1989 period. For wholly owned
affiliates, the entry rate exceeds the exit rate in both periods.
These declines in the propensity to have partial ownership could represent responses to
the reduction in ownership restrictions during the sample period or the changing geographic
concentration of multinational activity. Figs. 1 and 2 consider the dynamics of ownership over
the sample period for countries sorted by a measure of the barriers to acquiring majority stakes
and by host country per capita income quartiles.10 Fig. 1 demonstrates that the declining use of
minority-ownership positions is uniform across all quartiles of ownership restrictions as
measured by Shatz (2000). In countries in the two highest quartiles of receptivity to controlling
acquisition by foreigners, partial ownership is employed only by 14% of affiliates in 1997.
While affiliates in the most liberal quartile are increasingly wholly owned, affiliates in less
liberal quartiles are increasingly majority owned. Given that the majority of U.S. multinational
activity is in the two most liberal quartiles and that these two quartiles were characterized by
minimal restrictions during the entire sample period, the declining overall incidence of shared
ownership cannot be exclusively attributed to ownership restriction liberalizations.
[Insert Fig. 1 and Fig. 2 near here.]
Fig. 2 indicates that affiliates in developing countries are the most likely to be only
partially owned by their American parents. In the richest countries, partially owned affiliates
represent only 15.5% of all affiliates in 1997, having fallen from 24.4% in 1982. Among the
poorest countries, whole ownership characterizes less than half of all affiliates throughout the
10 Income quartiles are constructed by taking the average value of GNP per capita in 1995 dollars over the 1982 to 1997 period. The quartiles measuring barriers to acquisition are constructed using the rating system developed and documented in Shatz (2000).

9
sample period. Nonetheless, the mode of partial ownership has shifted considerably over the
sample period, with majority ownership becoming more common than minority ownership in the
poorest countries.
As depicted in Fig. 3, the use of alternative organizational forms differs across industries.
In 1994, minority-owned affiliates account for more than 15% of affiliates in the petroleum, food
manufacturing, chemical manufacturing, and transportation equipment manufacturing industries,
while they make up less than 10% of affiliates in the industrial machinery manufacturing,
electronic manufacturing, wholesale trade, and financial services industry groups. In fact, nearly
88% of wholesale trade affiliates are wholly owned, suggesting that the activities of such
affiliates are incompatible with partial ownership. The dynamics of organizational form
decisions across time also yield insight into those industries in which propensities toward
ownership modes are most fixed. While ownership fractions are relatively unchanging in
wholesale trade, services, and other industries, a variety of subgroups within manufacturing
(particularly transportation equipment and electronics) have shifted toward whole ownership.
[Insert Fig. 3 near here.]
Associated with the approximately 20 thousand affiliates reporting in each benchmark
year are about 2,500 U.S. parents. To consider the distribution of the use of partial ownership
among parents, Fig. 4 focuses on controlled groups with five or more foreign affiliates,
classifying them by percent of affiliates that are wholly owned. The 1997 figures indicate that
38% of the parent companies wholly own their affiliates, and only 2% fail to own all of at least
one affiliate. The dynamics over time illustrate that the preference for whole ownership among
larger multinationals is becoming much more pronounced. One indicator is the fraction of parent
companies for which 80% or more of their foreign affiliates are wholly owned. In 1982, 48% of
parents exhibited such a high degree of whole ownership of their foreign affiliates, while by
1997 that figure had risen to 65%.
[Insert Fig. 4 near here.]
This quest for greater control is mirrored in the histogram of ownership levels conditional
on partial ownership in the three benchmark years, as presented in Fig. 5. While Fig. 4
emphasizes the shift toward whole ownership, Fig. 5 illustrates that affiliates that are not 100%
owned are increasingly likely to be majority owned. Common sense, along with much of the
10
scholarly literature, suggests that joint ventures are typically 50% owned by each of two partners,
but Fig. 5 shows that only 41% of all affiliates that are partially owned by American firms have
between 40% and 60% American parent ownership in 1997.
[Insert Fig. 5 near here.]
Figs. 6 and 7 present descriptive evidence that levels of parent ownership are lower for
affiliates with higher fractions of their total sales in host countries, for those that purchase small
fractions of their inputs from the United States, and for those that have fewer transactions with
other members of their controlled groups. Fig. 6 displays the mean share of goods sold locally
by majority-owned and wholly owned affiliates.11 In 1997, majority-owned affiliates sold 7.0
percentage point higher fractions of their output to local markets than did wholly owned
affiliates. This pattern suggests that parents are more interested in finding a local partner when
access to local distribution is more important. Panel B displays the mean value of the ratio of
goods purchased from the United States to an affiliate’s overall sales. Although minority-owned
affiliates purchase about 2% of the value of their sales from the United States over the sample
period, this figure is about 8% for majority-owned affiliates and 10% for wholly owned
affiliates. This pattern suggests that a parent uses a local partner when its affiliate obtains fewer
inputs from the United States and is therefore more reliant on the local market for inputs. The
tendency of majority- and wholly owned affiliates to rely on imports from the United States has
accelerated during the sample period, while the same is not true for minority-owned affiliates.
[Insert Fig. 6 and Fig. 7 near here.]
Fig. 7 illustrates the variation, by level of ownership, in the extent of exchange within
controlled groups. The evidence consistently suggests that parents engaging in extensive trade
with their affiliates own greater fractions of affiliate equity than do parents with little trade with
affiliates and that this trend has accelerated over the sample period. Panel A indicates that
affiliates that sell higher fractions of their output to their parents, or to other affiliates in the same
controlled group, tend to be more closely held by parents. In 1997, wholly owned affiliates sold
an average of 28.7% of their output to affiliated parties, while affiliates whose parents owned a
11 A breakout of local sales is not available for minority-owned affiliates. As a consequence, the analysis that follows uses exports by the affiliate to the United States as a proxy for the extent to which an affiliate serves the local market. This variable is available for all affiliates. Desai, Foley, and Hines (2002), a working paper version of

11
majority of the equity sold only 17.1% of their output to affiliated parties.12 Panels B and C
characterize reliance on trade with the United States by depicting imports from, and exports to,
the U.S. parent, as a fraction of affiliate sales. In 1994, mean ratios of imports from the U.S.
parent to total sales were 1.0% for minority-owned affiliates, 8.4% for majority-owned affiliates,
and 9.4% for wholly owned affiliates. Similarly, minority-owned affiliates exported 2.0% of
sales to their parents, but majority-owned affiliates exported 6.9%, and wholly owned affiliates
7.6%, of sales to their parents. The consistent evidence that related-party exchanges take place
more frequently under whole ownership suggests that the degree to which affiliates are
embedded within a worldwide production process influences the desirability of partial
ownership. This evidence is also consistent with the theory that firms find it difficult to convince
potential joint venture partners that extensive transactions with other members of the parent
system are likely to take place on fair terms. In addition, the dynamics displayed in Figs. 6 and 7
suggest that these tensions could have increased in relative terms over the sample period.
4. The Determinants of ownership decisions
In order to analyze the factors that influence ownership decisions, this section considers
the role of coordination costs that arise from tax planning opportunities, technology transfers,
and intrafirm transactions. Subsequently, two instruments are used to identify the relationship
between changes in organizational form and rising levels of intrafirm transactions.
4.1. Coordination costs and tax planning
The presence of multiple owners in a joint venture suggests that the activities of joint
ventures cannot be tailored to meet the needs of only one of the owners. This cost is potentially
large for U.S. parents that would otherwise engage in sophisticated international tax avoidance,
because doing so frequently entails a large number of transactions between parent companies and
foreign affiliates designed to reallocate taxable income across jurisdictions. An extensive
literature analyzes patterns of reported profitability and intrafirm trade by American
multinational firms, finding that trade between members of controlled groups appears to be
this paper, analyzes the local share of affiliate sales in greater detail to reach conclusions similar to those presented here. 12 A breakout of sales to related parties is also not available for minority-owned affiliates.
12
structured in ways that reduce total tax liabilities.13 Very little is known, however, about the
extent to which minority ownership could impede a firm’s ability to reduce tax liabilities in this
way.
Table 2 analyzes the determinants of affiliate return on assets, or net income divided by
assets. The regressions reported in Table 2 are performed on a sample including minority-
owned, majority-owned, and wholly owned affiliates, and all are weighted by assets.14 As
controls, all specifications also include a measure of affiliate leverage, the log of affiliate sales,
the log of host country gross domestic product (GDP), and the log of host country GDP per
capita. The regression reported in Column 1 indicates that reported profitability is a decreasing
function of tax rates. The –0.0779 coefficient on the country tax rate implies that 10% higher tax
rates reduce profitability by 7.8%. This finding is consistent with those of the transfer pricing
literature, and it persists with the inclusion of year fixed effects and a fixed effect for each
country/industry pair (industries are defined at the three-digit level).
[Insert Table 2 near here.]
Columns 3 and 4 interact dummy variables for partial ownership with the country tax rate
to distinguish the effect of taxes on the reported profitability of partially owned affiliates from
the effect on that of wholly owned affiliates. The results suggest that the reported profitability of
partially owned affiliates is considerably less sensitive to local tax rates than is the reported
profitability of wholly owned affiliates. The coefficient on the country tax rate in the regression
reported in Column 3 is –0.099, while the coefficient on the country tax rate interacted with the
partial ownership dummy is 0.13, indicating that the sensitivity to tax rates disappears when
affiliates are partially owned. Similar results appear when country/industry and year fixed
effects are introduced, in the regression reported in Column 4.
Given that partially owned affiliates include both majority- and minority-owned
affiliates, it is useful to distinguish between these types of ownership in a similar regression
13 See, for example, Grubert and Mutti (1991); Harris, Morck, Slemrod and Yeung (1993); Klassen, Lang and Wolfson (1993); Hines and Rice (1994); Collins, Kemsley, and Lang (1998); Clausing (2001); and Desai, Foley, and Hines (2003); this literature is critically reviewed in Hines (1999). 14 Specifically, the sample includes all majority-owned affiliates in all years and all minority-owned affiliates in benchmark years. Minority-owned affiliates are excluded from the sample in nonbenchmark years because they do not report a measure of leverage. The use of analytic weights reduces the importance of outliers created by scaling net income by assets and is equivalent to multiplying all terms in the specification by assets.

13
framework. The regressions reported in Columns 5 and 6 indicate that the reduced sensitivity of
net income to local taxes is most robust for majority-owned affiliates. These results suggest that
shared ownership comes at the cost of considerably reduced ability to fine-tune affiliate
operations to minimize taxes of the parent’s controlled group.15 The finding that transfer pricing
appears to be constrained in the presence of partial ownership also illuminates the coincident
interests of local owners and governments in constraining aggressive transfer pricing by U.S.
multinationals and provides an intriguing alternative possible justification for ownership
restrictions.
4.2. Coordination costs and transfers of intangible assets
The use of proprietary technology and other intangible assets can be one of the most
difficult operational aspects over which joint venture partners must agree. It is difficult to attach
values to such assets, and parent companies that own them face challenges in retaining control of
them if they are used by joint ventures in which the parent company has only a partial ownership
stake. As a result, parent companies could be reluctant to license their intangible properties to
joint ventures, despite the high-tech nature of many international joint ventures. In addition,
parents could choose to own whole or majority stakes in foreign operations that are designed to
exploit intangible property developed in the United States. While the coordination problems that
arise in transferring intangible assets to jointly held foreign affiliates are similar to those that
arise in trading tangible goods, they are likely to be more severe with intangible assets, and
therefore the use of intangible assets is particularly likely to reflect incentives created by
ownership.
Table 3 explores the impact of these incentives by analyzing the determinants of royalty
payments to American parent companies. Foreign affiliates using intangible property developed
by their parent companies are required by law to remit royalties equal to the market value of the
technologies used. While some evidence exists that royalty rates are sensitive to tax-planning
opportunities (and not surprisingly, given the inherent vagueness of the market value criterion), it
is believed that firms generally comply with the requirement to pay royalties when intangible
15 The analysis presented in Table 2 was also conducted in a manner that allows standard errors to be clustered at the country level. None of the tax variables or the interactions of tax variables and ownership categories loses its significance as a result of this clustering. The regressions reported in Table 2 were also re-run adding fixed effects for each parent-year combination. The results are similar to those for the regressions reported in Table 2.
14
capital is used by foreign affiliates.16 Consequently, royalty payments can be used as indicators
of the transfer of intangibles.17
[Insert Table 3 near here.]
Column 1 of Table 3 reports the results of regressions in which the dependent variable
equals the product of one hundred and the log of one plus the ratio of affiliate royalty payments
to total affiliate sales.18 The positive and significant coefficient on the dummy variable for
majority or 100% ownership indicates that these majority- or wholly owned affiliates receive
more intangible property from parent companies than do minority-owned affiliates. As with all
other specifications presented in Table 3, this regression includes the host country tax rate, the
log of affiliate sales, the log of host country GDP, and the log of host country GDP per capita as
controls (though their estimated coefficients are not reported in Table 3). In the specification
reported in Column 2, which includes country/industry and year fixed effects, the coefficient on
the majority or whole ownership dummy increases substantially and remains statistically
significant.
A high degree of ownership should facilitate the transfer of intangibles in industries that
conduct significant amounts of research and development. Accordingly, Column 3 of Table 3
adds a measure of the affiliate’s industry R&D intensiveness and this variable interacted with the
ownership dummy. The positive and significant coefficients on the industry R&D/sales ratio and
its interaction with the majority or whole ownership dummy, and the reduced size of the
coefficient on the dummy alone, indicate that firms transfer more intangibles to affiliates in R&D
intensive industries and that the importance of majority or whole ownership is most pronounced
in R&D intensive industries. The results in Column 4 indicate that the interaction term remains
significant when country/industry and year fixed effects are included.
The specifications reported in Columns 5-8 repeat the analysis, adding a dummy variable
for 100% ownership. The specifications presented in Columns 5 and 6 indicate that wholly
16 See, for example, Hines (1995) and Grubert (1998). 17 The sample used in the analysis of these payments includes all affiliates in the three benchmark years 1982, 1989, and 1994. 18 Logit specifications in which the dependent variable equals one if an affiliate pays a nonzero royalty to its American parent company, and zero otherwise, produce results that are similar to those reported in Table 3. The regressions reported in Table 3 were re-run adding host country-specific time trends and parent/year fixed effects, with results that are similar to those reported in Table 3.

15
owned affiliates pay greater royalties than do other majority-owned affiliates, though the results
presented in Columns 7 and 8 indicate insignificant differences between the interaction of whole
ownership and R&D intensiveness and the interaction of majority ownership and R&D
intensiveness. Taken together, this evidence is consistent with reluctance on the part of parent
firms to establish joint ventures with minority ownership in situations in which it would be
valuable to exploit intangible capital developed by the parent and, should a joint venture be
established, to permit the joint venture to use intangible capital owned by the parent company.
4.3 Organizational form at entry
The leading theories of joint ventures carry implications for the impact of observable
variables on the choice of whether to form a new venture with 100%, majority, or minority
parent ownership. Some of these implications bear on the characteristics of countries in which
affiliates are located, while others bear on the characteristics of firms that undertake the ventures.
Regulatory and tax policies of host countries have clear potential to influence the
desirability of forming new ventures as wholly owned and partially owned affiliates. While the
role of regulatory policies that implicitly or explicitly limit ownership percentages is self-
evident, the impact of local tax policy is somewhat subtler. Differences between foreign tax
rates and the U.S. tax rate introduce tax-planning opportunities that are most readily exploited by
wholly owned affiliates. The capital structures, payout policies, and transfer pricing practices of
wholly owned affiliates can be tailored to reduce the combination of foreign and U.S. tax
liabilities. Foreign partners could have their own objectives that differ from those associated
with avoiding U.S. tax liabilities. In cases in which the foreign tax rate just equals the U.S. tax
rate, the availability of foreign tax credits removes any U.S. tax liabilities on income earned by
affiliates, and U.S. tax considerations become unimportant in planning the operations of
affiliates. Consequently, significant differences between foreign tax rates and the U.S. tax rate
are likely to encourage firms to establish their affiliates as wholly owned ventures.
Firms without extensive experience in foreign markets are often hypothesized to benefit
the most from participation in international joint ventures, because valuable information could be
obtained from foreign partners. The empirical implication of this relationship is that companies
with operations in large numbers of foreign countries should be the least likely to form new
ventures with partial ownership. Firms establishing affiliates in industries outside their core line

16
of business stand to benefit from the experience and information of foreign partners and are
therefore more likely to create partially owned affiliates. Firms in research-intensive industries
can use foreign affiliates to exploit intangible assets developed with R&D activity in home
countries. The proprietary nature of these intangible assets complicates any transactions with
outside parties and therefore makes the use of wholly owned foreign affiliates particularly
attractive.
The production and trade patterns of foreign affiliates influence the desirability of 100%
parent ownership, though the empirical identification of such effects is problematic given the
potential endogeneity of trade patterns to ownership. Theories of collaboration in local sales
markets suggest that firms are more likely to establish joint ventures with foreign partners when
these partners can provide information about, and access to, local distribution channels. As a
result, affiliates selling high fractions of their output locally are the most likely to be established
as joint ventures. By contrast, affiliates that trade extensively with their U.S. parents, or with
other related parties, are unlikely to be other than 100% owned by the parent company. Such
affiliates stand to learn little of value about foreign markets from potential foreign partners and
benefit from the ability to adjust transfer prices and other aspects of their trade with related
parties.
Table 4 presents the results of estimating the determinants of ownership levels of new
affiliates. The sample is limited to observations of the first appearances of any affiliate
subsequent to 1982. The dependent variable analyzed in specifications reported in Columns 1
and 2 is a dummy equal to one if the new affiliate is wholly owned and zero if the affiliate is
partially owned. Column 1 presents the result from a logit specification that does not include
fixed effects while Column 2 presents the results from a conditional logit that includes a fixed
effect for each country/industry pair and year fixed effects. These specifications and all others in
Table 4 include the log of affiliate sales, the log of host country GDP, and the log of host country
GDP per capita as controls. The positive estimated coefficients on ownership restrictions in the
first two specifications indicate that wholly owned affiliates are more likely to be established in
countries whose governments do not restrict foreign ownership of local businesses.19 The
coefficient is considerably smaller and only marginally significant in the specification including

17
fixed effects, but the impact of restrictions is then identified only by changes that are not
common to all countries. The sample size in the regression reported in Column 2 is considerably
smaller than that in the regression reported in Column 1, because estimating a conditional logit
with country/industry fixed effects requires removing observations when there is a single
American affiliate in a three-digit industry in a host country.
[Insert Table 4 near here.]
Large differences between host country tax rates and the U.S. tax rate create planning
opportunities that are best exploited with wholly owned affiliates. It is therefore surprising to
find an estimated negative coefficient on the absolute value of tax-rate differences in the
regression reported in Column 1. Given that omitted country attributes have the potential to
influence this coefficient, it is useful to consider the specification in Column 2 that includes
country/industry fixed effects. Here, tax effects are identified by changes in the U.S. and foreign
tax rates through time, controlling for general time trends, and the results indicate that greater tax
rate differences between foreign countries and the United States are associated with higher
likelihood of establishing wholly owned affiliates.
The “number of other countries operated in by parent” variable serves as a proxy for
parent experience, and it equals the number of countries in which the parent operated in the year
before the entry of the affiliate, not including the affiliate’s country. Estimated coefficients on
this variable are negative and significant in Columns 1 and 2, indicating that firms with extensive
foreign experience are more likely than others to establish new ventures with less than 100%
parent company ownership. Although proxies for parent experience are inherently imprecise,
this pattern is inconsistent with the hypothesis that firms undertake joint ventures to substitute
the expertise of foreign partners for their own incomplete knowledge of foreign business activity.
The results can be interpreted instead as suggesting that implementing shared ownership requires
significant expertise, at least on the part of the American parent.
The propensity to share ownership in the context of diversifying moves can similarly
shed light on the use of shared ownership to compensate for incomplete knowledge. Affiliates in
the same three-digit standard industrial classification codes as their parent companies are less
19 Ownership restrictions are coded as a dummy variable equal to one if both the “acquisition score” and the “sector score” are above 3 for a particular country in a particular year, as classified in Shatz (2000).

18
likely than others to be wholly owned by their parent companies, as indicated by the negative
estimated coefficient on the “same industry as parent dummy” variable. Although the coefficient
on this variable is significant in Column 1, it loses significance when country/industry and year
fixed effects are included. This variable is also an imprecise proxy for diversification because
parent firms are classified according to their primary industry, and the variable therefore does not
capture if the parent has some limited experience in the affiliate’s industry. Nevertheless, the
pattern of coefficients is inconsistent with the findings of Blömstrom and Zejan (1991) and
theories suggesting that shared ownership facilitates knowledge transfers, because
nondiversifying firms would stand to benefit least from organizing foreign affiliates as joint
ventures.
As an indicator of the extent to which parent firms have developed intangible assets that
could be transferred to affiliates, the specifications also include the R&D to sales ratio of each
affiliate’s parent in the year of entry.20 The positive and significant estimated coefficient on this
variable confirms that companies operating in research-intensive industries are the most likely to
establish wholly owned ventures, presumably in response to the higher risks of technology
appropriation they could face under partial ownership.
Estimated coefficients on ratios of affiliate exports to the United States to affiliate sales,
and ratios of affiliate imports from the United States to affiliate sales, are positive and
significant. Affiliates that sell most of their output to the local market, and those that buy fewer
goods from the United States, are the most likely to be established as joint ventures. This finding
is consistent with the hypothesis that joint venture partners can provide valuable information and
guidance about distributing output and sourcing inputs in host country markets.
While the specifications in Columns 1 and 2 consider the distinction between whole and
partial ownership, the remaining specifications in Table 4 emphasize the distinction between
whole and majority ownership and between majority and minority ownership. The specifications
reported in Columns 3-6 repeat this analysis using a dependent variable that equals one if a new
affiliate is wholly owned, and zero if a new affiliate is majority owned. Minority-owned
affiliates are excluded, thereby reducing the sample sizes. Restricting the sample in this way
20 Computing this measure requires using COMPUSTAT data in the years 1983–1988 and information from BEA survey forms in other years.
19
provides insights on which factors compel the use of whole ownership relative to other levels of
ownership in which parents obtain the control associated with majority ownership. The
dependent variable in the regressions reported in Columns 7 and 8 equals one if a new affiliate is
majority, but not wholly, owned, and equals zero if it is minority owned. Because the analysis
presented in Columns 7 and 8 excludes wholly owned affiliates, the sample size is much smaller
than the sample size used in the other regressions presented in Table 4. Restricting the sample as
in the regressions reported in Columns 7 and 8 focuses attention on the determinants of demand
for the kind of control associated with majority ownership, conditional on sharing ownership.
Ownership restrictions have positive and significant estimated effects on whole
ownership in the specifications reported in Columns 3 and 5, but they become insignificant once
fixed effects are included in Columns 4 and 6; a similar pattern appears in Columns 7 and 8.
Estimated coefficients on differences between the U.S. tax rate and host country tax rates exhibit
the same patterns in Columns 3-6 that they do in Columns 1 and 2, though with reduced
statistical significance, while the tax coefficients are insignificant in Columns 7 and 8.
Estimated coefficients on the proxy for parent experience are consistently negative across
the specifications in Columns 3-8, though they are insignificant in the fixed effects regressions
reported in Columns 4 and 6. One interpretation of the finding that the effects of parent
experience are stronger for the decision to retain majority control conditional on sharing
ownership is that managing minority-owned affiliates requires particularly significant expertise.
Estimated coefficients on the dummy variable indicating that a newly formed affiliate is in the
same industry as the parent are negative and significant in Columns 3-6, suggesting that the
demand for whole ownership is strongest when affiliates are in industries that differ from their
parents. The insignificant estimated coefficients on this variable in the regressions reported in
Columns 7 and 8 imply that being in the same industry does not influence the choice between
majority and partial ownership. Estimated coefficients on the parent R&D to sales ratio is
positive in the specifications reported in Columns 3-8 (though insignificant in the fixed effects
regressions reported in Columns 4 and 6, and only marginally significant in the results reported
in Column 8), suggesting that research-intensive companies tend to choose higher levels of
affiliate ownership.
20
Imports from the United States are positively associated with whole ownership in the
regressions reported in Columns 3 and 4, and positively associated with majority ownership in
the regressions reported in Columns 7 and 8. These results are similar to those reported in
Columns 1 and 2. Exports from affiliates to the United States have insignificant effects on whole
ownership in the regressions reported in Columns 3 and 4, though they are positively associated
with majority ownership in the regressions reported in Columns 7 and 8.
Opportunities for trade with related parties have the potential to influence the
attractiveness of whole ownership of affiliates. Columns 5 and 6 present estimated coefficients
from regressions that analyze how an affiliate’s sales to related parties, and purchases from the
parent company, are associated with whole (versus majority) ownership. The results indicate
that affiliates that sell more of their output to their parent companies, or to other related affiliates,
are more likely than others to be wholly owned by their parents. Similarly, affiliates that rely
heavily on imports from parents are also more likely to be wholly owned.
Taken together, the export and import results presented in Table 4 suggest that affiliates
that are embedded within worldwide production processes are not as amenable to partial
ownership as are other affiliates.21 One possible interpretation of these results is that the costs of
coordination with local partners are much larger for those affiliates engaging in intrafirm trade.
These costs could stem from anticipated disputes over the selection of suppliers, setting prices
for inputs and sales, and other conflicts of interest between affiliate partners and U.S.
multinational enterprises. It is noteworthy that these potentially contentious activities have
increased over the last two decades. Fig. 8 plots the share of a parent’s overall exports and
imports that are sent to, or received from, their foreign affiliates. In 1982, U.S. parents relied on
their foreign affiliates as a destination for 30.6% of their exports, and that figure rose to 45.8%
by 1997. Fig. 9 illustrates that the ratio of aggregate royalty payments to sales of foreign
affiliates rose from 0.4% to 1.0% between 1982 and 1994. That trend is consistent across all
industries with the exception of industrial machinery and equipment manufacturing. To explore
21 The regressions reported in Table 4 were re-run adding parent sales as an independent variable, country-specific time trends, and parent/year fixed effects, with results similar to those appearing in Table 4. In specifications with country-specific time trends, results on the effect of ownership restrictions and tax considerations are identified only by heterogeneous reactions to policy changes and are not very stable. Fortunately, the results presented in Columns 1-5 of Table 5 and Columns 1-5 of Table 6 identify these same effects by exploiting the heterogeneous reaction of different kinds of affiliates to policy changes. These results are robust to the inclusion of country-specific time trends.

21
the relationship between these aggregate phenomena - the heightened proclivity to trade
internally, transfer knowledge internally, and take advantage of tax arbitrage opportunities - and
the declining propensity to share ownership, the following section considers two exogenous
changes in the relative costs of sharing ownership.
[Insert Fig. 8 and Fig. 9 near here.]
4.4 Two instruments
The link between the pattern of increased levels of activities that require coordination and
the declining use of shared ownership can be identified through exogenous shifts either in the
ability to undertake coordinated activity or in the relative costs of using different ownership
forms. The theory of the firm implies that the effect of coordination costs on ownership levels
should equal the effect of ownership costs on levels of coordinated activities, so both methods
should yield the same result.22 The analysis that follows uses two changes in the costs of partial
ownership to identify causal linkages between the reduced willingness to share ownership and
the greater incidence of activities that are associated with higher coordination costs.
Specifically, the regressions reported in Tables 5, 6, and 7 analyze the impact of two dramatic
policy shifts: the liberalization of host country ownership restrictions during the 1980s and 1990s
and the “10-50 basket” provisions of the U.S. Tax Reform Act of 1986. Both policy shifts
encouraged greater majority and whole ownership, the former by permitting it, the latter by
penalizing minority ownership after 1986.
Table 5 reports estimated coefficients from regressions that capture the effect of changes
in local ownership restrictions. These complex restrictions are reviewed and summarized by
Shatz (2000), who considers restrictions on the acquisition of majority ownership of local
enterprises and limitations on the creation of greenfield majority-owned enterprises in certain
sectors by multinational firms for 54 countries from 1985 to 1996.23 These detailed data identify
16 significant liberalizations. Ownership responses to liberalization then represent the first stage
22 See Desai, Foley and Hines (2002) for a theoretical elaboration. 23 Specifically, a country is defined to have liberalized ownership restrictions when both the "acquisition score" and the "sector score" are at least 3 (on a scale from 1 to 5). The countries experiencing a liberalization during this period are Argentina (1990), Australia (1987), Colombia (1992), Ecuador (1991), Finland (1990), Honduras (1993), Japan (1993), Malaysia (1987), Mexico (1990), Norway (1995), Peru (1992), Philippines (1992), Portugal (1987), Sweden (1992), Trinidad and Tobago (1994), and Venezuela (1990).

22
in identifying the link between greater intrafirm trade and increased internalization through
whole ownership.24
[Insert Table 5 near here.]
The first five Columns of Table 5 present estimated regression coefficients from
specifications in which the dependent variable is the share of all sales by wholly owned affiliates
in each country/industry pair.25 The sample is restricted to country/industry pairs in countries
that experience ownership liberalizations between 1985 and 1996, and all specifications include
the log of host- country GDP and the log of host country GDP per capita as controls.26 In
Column 1, the estimated 0.0757 coefficient on the post-liberalization dummy variable reflects the
impact of increased adoption of whole ownership subsequent to liberalizations: sales by wholly
owned affiliates account for 7.6% more of total sales after liberalizations. The inclusion of
country/industry fixed effects in Column 2 restricts the estimated effects of liberalizations to
those arising from changes over time; the estimated magnitude of the impact of liberalizations
falls to 2.34% but remains significant. Columns 3, 4, and 5 consider the differential reaction of
industries based on the intensity of R&D activity in that industry by introducing a dummy
variable that equals one if an affiliate is in a three-digit industry with an above-median
R&D/sales ratio.27 The coefficients reported in Columns 3 indicate that affiliates in R&D–
24 To address the possible serial correlation in the error terms that could arise in this setting, the OLS regressions reported in Table 6 were also performed with standard errors that were clustered at the country-industry level. Clustering of the standard errors reduces the significance level of some of the coefficients. In Column 2, the post liberalization dummy is only significant at the 10% level. In Column 3, the post-liberalization dummy becomes insignificant, and the high R&D intensity dummy becomes significant at only the 10% level. In Columns 4 and 5, the coefficient on the interaction of the post-liberalization dummy and the high R&D intensity dummy is significant at the 5% level. In Column 6, the coefficient on the share of sales through wholly owned affiliates is also significant at the 5% level. All other coefficients of interest retain their statistical significance. F-tests that allow for clustering are significant at the 10% level for the specification in Column 4 and at the 5% level for the specification in Column 5, suggesting that predicted values are valid instruments. 25 The dependent variable in the regressions reported in Table 5 is constructed at the country/industry/year level. Specifically, the numerator of the dependent variable is the sum of sales by all wholly owned U.S. affiliates in a three-digit industry in a country and year (the sample includes all years 1982–1997), and the denominator is the sum of sales by all U.S. affiliates in that industry, country, and year. Because wholly, majority-, and minority-owned affiliates are similar in size, this measure of ownership is similar to the share of affiliates that are wholly owned. 26 Specifically, the sample in Columns 1-5 is based on all reporting affiliates. However, because only majority-owned foreign affiliates report sales to related parties, the dependent variable in Columns 6-9 is based on information from these affiliates. 27 R&D/sales ratios in each three-digit industry are calculated as the unweighted means of parent company domestic R&D/sales ratios for all parents in that industry. These industry R&D/sales ratios are attributed to each affiliate in a three-digit industry, and the sample median R&D/sales ratio calculated based on the population of affiliates in any given sample. An affiliate’s high R&D intensity dummy variable equals one if this attributed R&D/sales ratio exceeds the sample median and equals zero otherwise.
23
intensive industries responded most aggressively to the liberalization of ownership restrictions.
This finding is consistent with the greater importance of whole ownership to such industries.
This result is robust to the inclusion of country/industry fixed effects, as shown in Column 4, and
to the inclusion of a country/industry fixed effects and year fixed effects, as indicated in Column
5.28
The link between changed ownership patterns and changed trade patterns is the focus of
the regressions reported in Columns 6-9 of Table 5, in which the dependent variable measures
the fraction of sales to related parties, and is again constructed at the country/industry/year level.
The numerator of the dependent variable in these regressions is the sum of sales to related parties
(parent companies and related foreign and domestic affiliates) by U.S. affiliates in a three-digit
industry in a country and year (the sample includes all years 1982–1997), while the denominator
is the sum of sales by all U.S. affiliates in that industry, country, and year. The 0.0350 estimated
coefficient on the share of affiliate sales made through wholly owned affiliates in Column 6
offers a simple correlation between the degree of intrafirm trade and internalization through
ownership. The inclusion of country/industry fixed effects in the regression reported in Column
7 restricts identification of the effect of ownership to temporal changes, and the coefficient
estimate becomes insignificant.
Columns 8 and 9 of Table 5 present instrumental variables (IV) estimates of the effect of
whole ownership on intrafirm trade. The post-liberalization dummy and the post-liberalization
dummy interacted with the high R&D intensity dummy are used as instruments for ownership
(measured as share of sales through wholly owned affiliates) in the first-stage equation. The
second-stage estimates reported in Column 8 come from an IV procedure that uses predicted
values from the equation reported in Column 4 as the first stage to identify the impact of whole
ownership on sales to related parties. The estimated effect of whole ownership on the fraction of
sales to related parties is positive and significant. The second-stage estimates reported in
Column 9 come from a specification that adds year fixed effects to the country/industry fixed
effects, thereby identifying ownership effects by differences in the timing of reforms and by
28 The effect of liberalizations for high R&D intensity industries equals the sum of the coefficient on the post-liberalization dummy variable in Column 5 of Table 5 (-0.0190) and the coefficient on the interaction of the post-liberalization dummy variable and the high R&D intensity dummy variable (0.0475), which is positive and significantly different from zero. The regressions reported in Table 5 were re-run adding country-specific time trends, with similar results.

24
heterogeneous reactions to the lifting of ownership restrictions. The equation reported in
Column 5 is the first stage in the IV equation the second stage of which is reported in Column 9.
This IV result implies that policy changes that make it easier to own 100% of local affiliates are
accompanied by greater reliance on intrafirm trade. The 0.65 coefficient reported in Column 9 is
much larger than the corresponding coefficient reported in Column 6, suggesting that the
presence of correlated omitted variables reduces the estimated impact of ownership on related
party trade in ordinary least squares (OLS) regressions. This coefficient implies that 10% greater
sales through wholly owned affiliates increases affiliate sales to related parties by 6.5%.
While employing the heterogeneity provided by the R&D intensity of the industry is
useful in disentangling the effects of ownership liberalizations from other possibly
contemporaneous reforms, the use of a reform in U.S. tax laws allows identification from an
event that is not in any way correlated with reforms in the host countries. Table 6 reports
estimated coefficients from regressions in which tax penalties imposed by TRA86 are used to
identify parent-level incentives to form joint ventures.29 TRA86 required firms to segregate
foreign source income associated with minority ownership positions from other foreign source
income in calculating foreign tax credit limits. As a result, TRA86 penalizes minority ownership
disproportionately for those parents facing high average worldwide foreign tax rates.30 The
specifications presented in Columns 1-5 of Table 6 estimate the impact of parent company tax
positions prior to TRA86 on subsequent use of joint ventures. The sample consists of
parent/year observations for all years. The numerator of the dependent variable in the
regressions reported in Columns 1-5 is sales by a parent company’s wholly owned affiliates, and
the denominator is sales by all of its affiliates.31 The positive coefficients on the interaction of
29 To address the possible serial correlation problems, standard errors for the OLS regressions in Table 6 were also calculated allowing for clustering at the parent level. In Column 3, the coefficient on the “post-TRA86 dummy” is significant at the 5% level. The procedure reduces the significance of the coefficient on the “high average tax rate dummy” in Column 3 and the coefficient on this variable interacted with the “post-TRA86 dummy” in the specifications presented in Columns 4 and 5. These coefficients are no longer significant. All other coefficients maintain their significance. F-tests that allow for clustering are not significant for the specification in Column 4 but are significant at the 1% level for the specification in Column 5. Thus, there is evidence that predicted values from the specification in Column 5 are valid even when using clustered standard errors. 30 Such parents would be most likely to be faced with excess foreign tax credits subsequent to TRA86. The attractiveness of minority ownership should fall for such parents, as they would no longer be able to apply foreign tax credits generated from other activities to offset U.S. taxes due on income earned by minority-owned affiliates. Desai and Hines (1999) elaborate on this point. 31 The sample in Columns 1-5 is based on all reporting affiliates. However, because only majority-owned foreign affiliates report sales to related parties, the dependent variable in Columns 6-9 is based on information from these affiliates. Sample sizes are smaller in Columns 3-5 than in Columns 1-2 because of incomplete reporting of foreign
25
the post-TRA86 dummy and the high average foreign tax rate dummy in Columns 3, 4, and 5
indicate that parents facing the greatest relative tax costs associated with joint venture activity
are those that increased the use of whole ownership most aggressively. The 0.0233 estimated
coefficient in the regression reported in Column 5 indicates that the fraction of total sales
represented by wholly owned affiliates after TRA86 increased 2.3% more among parent
companies that are likely to have had excess foreign tax credits.
[Insert Table 6 near here.]
The link between changes in ownership patterns and changes in trade patterns of parent
companies is the focus of the regressions reported in Columns 6-9 of Table 6, in which the
dependent variable is again constructed at the parent company level by year. The numerator of
this dependent variable is sales by a parent company’s affiliates to related parties, and the
denominator is total sales by the parent company’s affiliates. The positive and significant
coefficient on the share of sales through wholly owned affiliates in Column 6 indicates that the
correlation between the extent of related party transactions and the use of whole ownership
remains positive when examined at the parent level. Although this coefficient remains positive
in the specification reported in Column 7 that includes parent fixed effects, it is not statistically
significant.
Columns 8 and 9 present estimated coefficients from IV specifications in which tax
interactions after 1986 serve as instruments for the extent to which affiliates are wholly owned.
Equation 8 is a second-stage equation that regresses the share of sales to related parties on the
predicted share of sales through wholly owned affiliates, with the prediction based on the first-
stage specification reported in Column 4. The results indicate a positive and significant effect of
whole ownership on related party sales. When year effects are included, as in Column 9, the
regression uses the predicted share of sales through wholly owned affiliates produced by the
specification reported in Column 5. Year effects prevent the use of the post-TRA86 dummy as
an instrument, so differences in the predicted value of the share of sales through wholly owned
affiliates come from differences in pre-1986 tax situations. The estimated 1.9082 coefficient on
the share of sales through wholly owned affiliates suggests that the effects of greater use of
tax rates. Similarly, sample sizes are smaller in Columns 6-9 than in Columns 1-5 because of incomplete reporting of related–party sales.
26
whole ownership are even larger than those indicated by the results in Table 5. Specifically, the
coefficient implies that 10% greater sales through wholly owned affiliates increases affiliate
sales to related parties by 19.1%.
While Tables 5 and 6 consider the effects of whole ownership on intrafirm trade, Table 7
presents estimated coefficients from IV specifications of the impact of whole ownership on
intrafirm royalty payments. These specifications can be used to measure the persistence of the
patterns appearing in Table 3 when employing instruments for whole ownership and for
validating the results obtained in the IV analysis of Tables 5 and 6. The first four columns of
Table 7 repeat the method and specifications of the regressions reported in Table 5, in which
liberalizations are used as instruments for ownership, while Columns 5-8 of Table 7 repeat the
method and specifications of the regressions reported in Table 6, in which tax incentives are used
as instruments for ownership. The dependent variables in Table 7 are defined similarly to the
dependent variable in Table 3 (the product of one hundred and the log of one plus the ratio of
affiliate royalty payments to total affiliate sales) but are constructed differently in Columns 1-4
and 5-8, to be consistent with the independent variables. Thus, the dependent variable in
Columns 1-4 is defined at the country/industry/year level and is based on the ratio of aggregate
affiliate royalty payments to parents by all U.S. affiliates in a three-digit industry and country to
aggregate affiliate sales in that industry and country. The dependent variable in Columns 5-8 is
defined for parent/years and is based on the ratio of total affiliate royalty payments to parents to
total sales by affiliates.
[Insert Table 7 near here.]
The results indicate that whole ownership is positively associated with technology
transfer as measured by royalty payments to parents and that IV analysis strengthens the OLS
results. The positive estimated coefficients on the share of sales through wholly owned affiliates
in the specifications reported in Columns 1 and 2 have the same sign as, and are of similar
magnitude to, the estimates reported in Table 3. The IV specifications of these equations, using
ownership liberalizations as in Table 5, are reported in Columns 3 and 4 of Table 7. Column 4
of Table 5 reports the first-stage equation that is used to predict the share of sales through wholly
owned affiliates to estimate the second-stage equation reported in Column 3 of Table 7.
Similarly, Column 5 of Table 5 reports the first-stage equation that is used to predict the share of

27
sales through wholly owned affiliates to estimate the second-stage equation reported in Column
4 of Table 7. The estimated effects of whole ownership on royalty payments to parents is
positive and significant in the IV equations reported in Columns 3 and 4 of Table 7 and are
almost ten times larger in magnitude than the corresponding OLS estimates reported in Columns
1 and 2.
A similar pattern appears in the estimates based on parent observations and reported in
Columns 5-8 of Table 7. The OLS specifications of the royalty payment equation are reported in
Columns 5 and 6. The effect of whole ownership is positive and significant in the specification
reported in Column 5 but falls in magnitude and is statistically insignificant in the specification
reported in Column 6. Columns 7 and 8 report estimates from the second stages of IV
specifications of the royalty payment equation, using the Tax Reform Act of 1986 as an
instrument as in Table 6. Column 4 of Table 6 reports the first-stage equation that is used to
predict the share of sales through wholly owned affiliates to estimate the second-stage equation
reported in Column 7 of Table 7. Similarly, Column 5 of Table 6 reports the first-stage equation
that is used to predict the share of sales through wholly owned affiliates to estimate the second-
stage equation reported in Column 8 of Table 7. The estimates imply that whole ownership has
positive and significant effects on royalty payments to parents, with magnitudes that are more
than ten times the sizes estimated using OLS. Hence, the patterns reported in Table 3, that
royalty payments to parents increase with whole ownership, continue to appear and are
strengthened when actual ownership is replaced by predicted ownership.
The results presented in Tables 5, 6, and 7 could be confounded by censorship if firms
that could otherwise have established joint ventures react to policy changes by forging
contractual alliances with local firms. This potential problem is unlikely to overturn the findings
in the IV specifications, as there is little reason to believe that certain firms systematically
substitute the use of minority ownership for arm’s-length contracts around the time of ownership
restriction liberalizations or TRA86. However, Table 8 attempts to address this concern more
directly by analyzing the relationship between the share of sales through wholly owned affiliates
and measures of the extent to which parent firms engage in related-party, as opposed to arm’s-

28
length, transactions.32 Conducting analysis at the parent level is advantageous because firms that
use arm’s-length contractual relations to tap into international markets usually own at least one
affiliate. Therefore these firms are in the parent sample and report both trade with, and royalty
payments from, unrelated parties.
[Insert Table 8 near here.]
The dependent variable in the first three Columns of Table 8 is measured at the
parent/year level; its numerator is the sum of parent exports to affiliates and imports from
affiliates, while its denominator is total parent exports and imports. The estimates reported in
Columns 1-3 reveal a positive relationship between whole ownership of affiliates and the extent
to which a parent company trades with related parties. The coefficient on the share of affiliate
sales through wholly owned affiliates is positive and significant even once parent fixed effects
and year fixed effects are included. It is not the case that parent companies that increase their
use of whole ownership also increase their trade with arm’s-length subcontractors.
The dependent variable in Columns 4-6 is the share of a parent’s royalty receipts from
affiliates; its numerator is total royalties paid by affiliates to the parent company, and its
denominator is total royalties received by the parent from abroad. These data are available from
1987 to 1997, so the sample consists of parent/year observations over this period. If firms that
focus their foreign operations among wholly owned affiliates also increase the extent of licensing
with unrelated foreigners, a negative correlation would exist between the share of royalties
received from related parties and the share of affiliate sales that take place through wholly owned
affiliates. If anything, the results in Columns 4-6 suggest that this correlation is positive,
although its magnitude is not robust to the inclusion of parent fixed effects. Hence, no available
evidence indicates that parent companies deciding to use fewer joint ventures react by
substituting greater licensing of technology to unrelated parties.
Firms have incentives to select ownership levels and intrafirm trading patterns that
correspond to profit maximizing combinations. Assuming that observed behavior is in fact
generated by profit maximization, it follows from the analysis reviewed in Section 3 and the
model presented in Desai, Foley, and Hines (2002) that the impact of ownership on trade is
32 To address the possible serial correlation problems here, standard errors for the OLS regressions in Table 8 were also calculated allowing for clustering at the parent level. All coefficients maintain their significance.

29
identical to the effect of trade on ownership. Consequently, the IV trade results reported in
Tables 5, 6, and 7 are consistent with the OLS ownership results reported in Tables 2 and 3.
Hence, the pattern that affiliates that trade with related parties are more likely to be wholly
owned is unlikely to be the byproduct of correlated omitted variables. The opposite appears to
be the case, because all of the IV results in Tables 5, 6, and 7 indicate much stronger effects of
100% ownership than do their OLS counterparts. If anything, omitted variables tend to make
simple OLS regressions understate the effect of ownership on intrafirm trade, and intrafirm trade
on ownership.
4.5 Implications
The declining tendency of American firms to establish new foreign affiliates as joint
ventures coincides with an increasing use of transactions designed to avoid taxes, transfer
intellectual property, and decentralize production processes. It is possible to apply the results
presented in Tables 5 and 6 to obtain a rough estimate of the extent to which the rising
attractiveness of intrafirm trade could account for falling propensities to use joint ventures. This
calculation starts by interpreting the greater attractiveness of intrafirm trade as a fall in the real
cost of intrafirm trade relative to the real cost of arm’s-length trade. In theory, a falling cost of
intrafirm trade should increase whole ownership of affiliates by an amount equal to the extent to
which a falling cost of whole ownership increases intrafirm trade.33 Hence, the estimated effect
of ownership on trade, drawn from the results reported in Tables 5 and 6, can be used to infer the
impact of changing trade costs on desired ownership of affiliates.
Given the simultaneity of intrafirm trade and ownership of affiliates, some caution is
necessary in using actual trade data to infer the extent to which intrafirm trade has become less
expensive over time. Fortunately, the BEA data can be used to construct a balanced panel of
affiliates that appear in the data in 1982, survive until 1997, and are always 100% owned by their
American parent companies. The fraction of sales by these affiliates to related parties rises by an
average of 4.3% over the sample period and is clearly unaffected by changes in ownership.34
Applying a 0.5 elasticity of intrafirm trade with respect to its price, it follows that the cost (net of
33 This symmetry is implied by profit maximization. Desai, Foley, and Hines (2002) provide some of the analytical details. 34 For the balanced panel of wholly owned affiliates, the share of sales to related parties increases from 27.0% in 1982 to 31.3% in 1997.

30
benefits) of intrafirm trade fell by approximately 8.6% relative to the cost of trade with unrelated
parties between 1982 and 1997.35
This 8.6% decline in the cost of intrafirm trade encourages whole ownership of affiliates
if intrafirm trade and whole ownership are complementary, which they appear to be. The
estimated effect (reported in Table 6) that 1% greater use of wholly owned affiliates increases
sales to related parties by 1.9% can be interpreted to mean that policies that reduce the (relative)
cost of whole ownership sufficiently to induce 1% greater whole ownership also encourage 1.9%
greater sales to related parties. It follows that the effect of costs of whole ownership on sales to
related parties equals the product of 1.9 and the price elasticity of whole ownership with respect
to its cost. Estimates of the own-price elasticity of whole ownership can be drawn from the
literature. Desai and Hines (1999) estimate the elasticity of minority ownership with respect to
its tax price to be -1.4. Because minority-owned affiliates represent 25% of their sample, this
corresponds to a whole ownership elasticity of -0.47 [-0.47 = -1.4(0.25/0.75)].36 Hence, 1%
lower costs of whole ownership encourage 0.89% [0.89 = 1.9(0.47)] greater sales to related
parties.
The theory of cost minimization implies that the effect of costs of whole ownership on
levels of intrafirm trade equals the effect of costs of intrafirm trade on levels of whole
ownership. Consequently, 1% lower costs of intrafirm trade should encourage 0.89% greater
whole ownership of affiliates. Because the costs of intrafirm trade fell by 8.6% over the sample
period, it follows that the declining cost of intrafirm trade accounts for a 7.7% [7.7 = 0.89(8.6)]
rise in the use of whole ownership over the 1982–1997 period. If, instead of the 1.9 coefficient
drawn from the regression reported in Column 9 of Table 6, one were to use the 0.65 coefficient
reported in Column 9 of Table 5, the corresponding predicted rise in whole ownership of
affiliates is only 2.6%. Between 1982 and 1997, the share of all affiliate sales made through
wholly owned affiliates grew by 13.2%.37 Hence, the fraction that can be accounted for by
observable trends in intrafirm trade ranges from roughly one-fifth (= 2.6/13.2) to three-fifths (=
35 The choice of a 0.5 trade elasticity is dictated both by analytic convenience and by a consensus in the empirical literature (reviewed by Sawyer and Sprinkle, 1996) that aggregate import elasticities for American firms are roughly 0.5. 36 This calculation assumes that affiliates that are not minority owned are wholly owned. This is a reasonable assumption given the distribution of affiliate ownership levels displayed in Table 1. 37 On a sales weighted basis, the share of sales to related parties was approximately 21.9% in 1982 and 26.7% in 1997, and the share of sales through wholly owned affiliates was approximately 62.0% in 1982 and 75.1% in 1997.

31
7.7/13.2) of the total actual change. This is a substantial share, especially given the other factors,
such as ownership restriction liberalizations, that account for some of the changes.
5. Conclusion
International joint ventures offer multinational firms the opportunity to make profitable
use of market-specific capabilities of joint venture partners, could facilitate cooperation with
foreign governments, and offer the prospect of generating knowledge that could be valuable in
future business operations. These advantages could be offset by the costs implicit in split
ownership of the same assets and the resulting inability to exploit fully certain fixed assets
developed by parent firms, as well as any opportunities to coordinate worldwide operations
through financial and other exchanges.
The evidence indicates that American multinational firms were decreasingly likely to
establish their foreign affiliates as joint ventures over the 1982–1997 period. In part, this trend
reflects changing U.S. tax policies and legal requirements in foreign countries. However, the
evidence provided in the paper suggests that the decline in the use of partial ownership is linked
to the rise in the extent to which U.S. multinationals exchange goods and ideas inside the
boundaries of the firm. The evidence indicates that, in settings characterized by close
coordination between foreign affiliates and American parent companies, firms are much less
likely than in other settings to establish new ventures with minority parent ownership.
Specifically, international production coordination, tax planning, and the use of intangible
property appear to be much more easily executed with majority- or wholly owned foreign
affiliates and firms seem to establish their foreign affiliates cognizant of this difference. This
conclusion is strengthened by evidence that regulatory and tax changes that encourage whole
ownership of affiliates are accompanied by greater trade between affiliates and related parties.
Estimates of the share of the decline in the use of partial ownership attributable to increases in
related party transactions range from one-fifth to three-fifths.
The reduced significance of distance and nationality that accompanies globalization
creates opportunities but also strong competitive pressures for multinational enterprises. While
opportunities to trade and communicate between continents more reliably and quickly, and at
reduced cost, enhance the attractiveness of international alliances, they likewise increase the
return to coordinating operations within multinational firms. The impact of globalization on
international joint venture activity depends, therefore, on the relative strength of these two
32
forces. The evidence indicates that American multinational firms respond to recent
developments by reducing their joint venture activity and expanding their boundaries to
internalize more transactions.
33
References Aghion, P., Tirole, J., 1994. The management of innovation. Quarterly Journal of
Economics 109, 1185-1209. Anand, B., Khanna, T., 2000. The structure of licensing contracts. Journal of Industrial
Economics 48, 103-135. Anderson, E., 1990. Two firms, one frontier: on assessing joint venture performance.
Sloan Management Review 31, 19-30. Asiedu, E., Esfahani, H.S., 2001. Ownership structure in foreign direct investment
projects. Review of Economics and Statistics 83, 647-662. Baker, G., Gibbons, R., Murphy, K.J., 2002a. Relational contracts and the theory of the
firm. Quarterly Journal of Economics 117, 39-84. Baker, G., Gibbons, R., Murphy, K.J., 2002b. Relational contracts in strategic alliances.
Unpublished working paper, Harvard University. Balakrishnan, S., Koza, M.P., 1993. Information asymmetry, adverse selection, and joint-
ventures: theory and evidence. Journal of Economic Behavior and Organization 20, 99-117.
Beamish, P. W., Banks, J.C., 1987. Equity joint ventures and the theory of the
multinational enterprise. Journal of International Business Studies 18, 1-16. Bhattacharya, S., Glazer J., Sappington, D.E.M., 1992. Licensing and the sharing of
knowledge in research joint ventures. Journal of Economic Theory 56, 43-69. Blomström, M., Zejan, M., 1991. Why do multinational firms seek out joint ventures?
Journal of International Development 3, 53-63. Caves, R.E., 1996. Multinational Enterprise and Economic Analysis (2nd ed.). Cambridge
University Press, Cambridge, U.K. Clausing, K.A., 2001. The impact of transfer pricing on intrafirm trade. In: J.R. Hines, Jr.
(Ed.), International Taxation and Multinational Activity. The University of Chicago Press, Chicago, pp. 173-194.
Collins, J., Kemsley, D., Lang, M., 1998. Cross-jurisdictional income shifting and
earnings valuation. Journal of Accounting Research 36, 209-230. Contractor, F.J., 1990. Ownership patterns of U.S. joint ventures abroad and the
liberalization of foreign government regulations in the 1980s: evidence from the benchmark surveys. Journal of International Business Studies 21, 55-73.

34
Contractor, F.J., Lorange, P., 1988. Cooperative Strategies in International Business.
Lexington Books, Lexington, MA. Crampton, P., Gibbons, R. Klemperer, P., 1987. Dissolving a partnership efficiently.
Econometrica 55, 615-632. Curhan, J.P., Davidson, W.H., Suri, R., 1977. Tracing the Multinationals. Ballinger,
Cambridge, MA. Desai, M.A., Foley, C.F., Hines, J.R., Jr., 2002. International joint ventures and the
boundaries of the firm. Unpublished working paper 9115. National Bureau of Economic Research. Cambridge, MA.
Desai, M.A., Foley, C.F., Hines, J.R., Jr., 2003. Chains of ownership, regional tax
competition, and foreign direct investment. In: Herrmann, H., Lipsey, R. (Eds.), Foreign Direct Investment in the Real and Financial Sector of Industrial Countries. Springer-Verlag, Berlin. pp. 61-98.
Desai, M.A., Hines, J.R., Jr., 1999. Basket cases: tax incentives and international joint
venture participation by american multinational firms. Journal of Public Economics 71, 379-402.
Feenstra, R.C., 1998. Integration of trade and disintegration of production in the global
economy. Journal of Economic Perspectives 12, 31-50. Feenstra, R.C., Hanson, G.H., 1996a. Globalization, outsourcing, and wage inequality.
American Economic Review 86, 240-245. Feenstra, R.C., Hanson, G.H., 1996b. Foreign investment, outsourcing and relative
wages. In: Feenstra, R.C., Grossman G.M., Irwin, D.A. (Eds.), Political Economy of Trade Policy: Essays in Honor of Jagdish Bhagwati. MIT Press, Cambridge, MA. pp. 89-127.
Franko, L.G., 1971. Joint Venture Survival in Multinational Corporations. Praeger, New
York. Franko, L.G., 1989. Use of minority and 50-50 joint ventures by United States
multinationals during the 1970s: the interaction of host country policies and corporate strategies. Journal of International Business Studies 20, 19-40.
Gandal, N., Scotchmer, S., 1993. Coordinating research through research joint ventures.
Journal of Public Economics 51, 173-194. Gatignon, H., Anderson, E., 1988. The multinational corporation's degree of control over
foreign subsidiaries: an empirical test of a transaction cost explanation. Journal of

35
Law, Economics and Organization 4, 305-36. Geringer, J.M., Herbert, L., 1991. Measuring performance of international joint ventures.
Journal of International Business Studies 22, 249-263. Ghemawat, P., Porter, M.E., and Rawlinson, R.A., 1985. Patterns of international
coalition activity. In Porter, M. (Ed.), Competition in Global Industries. Harvard Business School Publishing, Boston, MA. pp. 345-365.
Gomes-Casseres, B., 1989. Ownership structures of foreign subsidies: theory and
evidence. Journal of Economic Behavior and Organization 11, 1-25. Gomes-Casseres, B., 1990. Firm ownership preferences and host government restrictions:
an integrated approach. Journal of Economic Behavior and Organization 21, 1-22. Grossman, S.J., Hart, O.D., 1986. The costs and benefits of ownership: a theory of
vertical and lateral integration. Journal of Political Economy 55, 279-306. Grubert, H., 1998. Taxes and the division of foreign operating income among royalties,
interest, dividends and earnings. Journal of Public Economics 68, 269-290. Grubert, H., Mutti, J., 1991. Taxes, tariffs and transfer pricing in multinational corporate
decision making. Review of Economics and Statistics 73, 285-293. Hanson, G.H., Mataloni, R.J., Jr., Slaughter, M.J., 2001. Expansion Strategies of U.S.
Multinational Firms. Unpublished working paper 8433, National Bureau of Economic Research. Cambridge, MA.
Harris, D., Morck, R., Slemrod, J., Yeung, B., 1993. Income shifting in U.S.
multinational corporations. In: Giovannini, A., Hubbard, R.G., Slemrod, J. (Eds.), Studies in International Taxation. The University of Chicago Press, Chicago, IL. pp. 277-307.
Hart, O., Moore, J., 1990. Property rights and the nature of the firm. Journal of Political
Economy 98, 1119-1158. Hart, O., Moore, J., 1998. Cooperatives vs. outside ownership. Unpublished working
paper 6421, National Bureau of Economic Research. Cambridge, MA. Henisz, W.J., 2000. The institutional environment for multinational investment. Journal
of Law, Economics, and Organization 16, 334-364. Hennart, J-F., 1991. The transaction costs theory of joint ventures: an empirical study of
japanese subsidiaries in the United States. Management Science 37, 483-497. Hines, J.R., Jr., 1995. Taxes, technology transfer, and the R&D activities of multinational
36
firms. In: Feldstein, M., Hines, J.R., Jr., Hubbard, R.G. (Eds.), The Effects of Taxation on Multinational Corporations. The University of Chicago Press, Chicago IL. pp. 225-252.
Hines, J.R., Jr., 1999. Lessons from behavorial responses to international taxation.
National Tax Journal 52, 305-322. Hines, J.R., Jr., Rice, E.M., 1994. Fiscal paradise: foreign tax havens and American
business. Quarterly Journal of Economics 109, 149-182. Hladik, K.J., 1985. International Joint Ventures: An Economic Analysis of U.S. Foreign
Business Partnerships. Lexington Books, Lexington MA. Holmstrom, B., 1982. Moral hazard in teams. Bell Journal of Economics 13, 324-340. Horst, T., 1971. The theory of the multinational firm: optimal behavior under different
tariff and tax rates. Journal of Political Economy 79, 1059-1072. Kamien, M.I., Muller, E., Zang, I., 1992. Research joint ventures and R&D cartels.
American Economic Review 82, 1293-1306.
Kant, C., 1990. Multinational firms and government revenues. Journal of Public Economics 42, 135-147.
Klassen, K., Lang, M., Wolfson, M., 1993. Geographic income shifting by multinational
corporations in response to tax rate changes. Journal of Accounting Research 31, 141-173.
Klein, B., Crawford, R., Alchian, A.A., 1978. Vertical integration, appropriable rents, and
the competitive contracting process. Journal of Law and Economics 21, 297-326. Kogut, B., 1991. Joint ventures and the option to expand and acquire. Management
Science 37, 19-33. Legros, P., Matthews, S.A., 1993. Efficient and nearly efficient partnerships. Review of
Economic Studies 68, 599-611. Moran, T.H., 2001. Parental Supervision: The New Paradigm for Foreign Direct
Investment and Development. Institute for International Economics, Washington, D.C.
Ohmae, K., 1989. The global logic of strategic alliances. Harvard Business Review 67,
143-152. Oxley, J.E., 1997. Appropriability hazards and governance in strategic alliances: a
transaction cost approach. Journal of Law, Economics and Organization 13, 387-
37
409. Ramachandran, V., 1993. Technology transfer, firm ownership, and investment in human
capital. Review of Economics and Statistics 75, 664-670. Rey, P., Tirole, J., 1999. Divergence of objectives and the governance of joint ventures.
Unpublished working paper. Institut d’Economie Industrielle, University of Toulouse.
Sawyer, W.C., Sprinkle, R.L., 1996. The demand for imports and exports in the U.S.: a
survey. Journal of Economics and Finance, 20, 147-178. Shatz, H., 2000. The location of U.S. multinational affiliates. Ph.D. dissertation. Harvard
University. Stopford, J.M., Haberich, K., 1978. Ownership and control of foreign operations. In:
Ghertman, M., Leontiades, J. (Eds.), European Research in International Business. North-Holland, Amsterdam. pp. 141-167.
Stopford, J.M., Wells, L.T., 1972. Managing the Multinational Enterprise. Basic Books,
New York. Whinston, M.D., 2002. On the transaction cost determinants of vertical integration.
Unpublished working paper, Northwestern University. Williamson, O., 1975. Markets and Hierarchies: Analysis and Antitrust Implications. The
Free Press, New York. Zeile, W.J., 1997. U.S. intrafirm trade in goods. Survey of Current Business. February,
23-38.
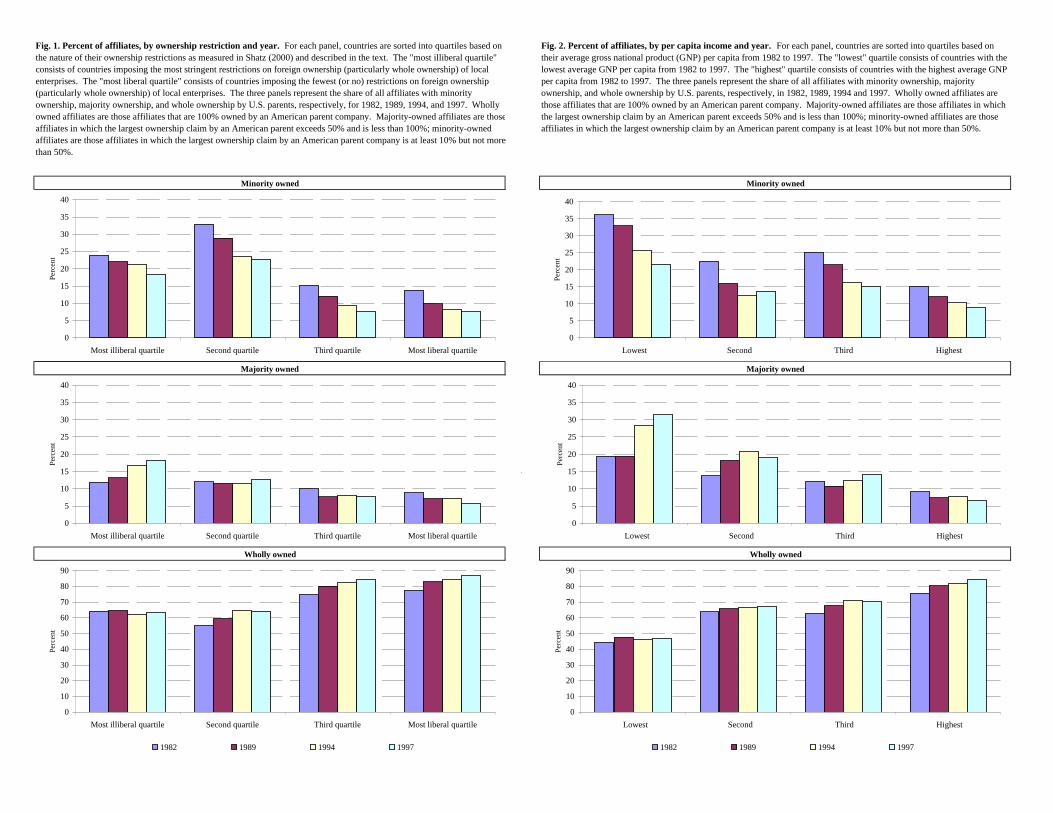
Minority owned Minority owned
Majority owned Majority owned
Wholly owned Wholly owned
Fig. 1. Percent of affiliates, by ownership restriction and year. For each panel, countries are sorted into quartiles based on the nature of their ownership restrictions as measured in Shatz (2000) and described in the text. The "most illiberal quartile" consists of countries imposing the most stringent restrictions on foreign ownership (particularly whole ownership) of local enterprises. The "most liberal quartile" consists of countries imposing the fewest (or no) restrictions on foreign ownership (particularly whole ownership) of local enterprises. The three panels represent the share of all affiliates with minority ownership, majority ownership, and whole ownership by U.S. parents, respectively, for 1982, 1989, 1994, and 1997. Wholly owned affiliates are those affiliates that are 100% owned by an American parent company. Majority-owned affiliates are thoseaffiliates in which the largest ownership claim by an American parent exceeds 50% and is less than 100%; minority-owned affiliates are those affiliates in which the largest ownership claim by an American parent company is at least 10% but not more than 50%.
Fig. 2. Percent of affiliates, by per capita income and year. For each panel, countries are sorted into quartiles based on their average gross national product (GNP) per capita from 1982 to 1997. The "lowest" quartile consists of countries with the lowest average GNP per capita from 1982 to 1997. The "highest" quartile consists of countries with the highest average GNP per capita from 1982 to 1997. The three panels represent the share of all affiliates with minority ownership, majority ownership, and whole ownership by U.S. parents, respectively, in 1982, 1989, 1994 and 1997. Wholly owned affiliates are those affiliates that are 100% owned by an American parent company. Majority-owned affiliates are those affiliates in which the largest ownership claim by an American parent exceeds 50% and is less than 100%; minority-owned affiliates are those affiliates in which the largest ownership claim by an American parent company is at least 10% but not more than 50%.
0
5
10
15
20
25
30
35
40
Most illiberal quartile Second quartile Third quartile Most liberal quartile
Perc
ent
0
5
10
15
20
25
30
35
40
Most illiberal quartile Second quartile Third quartile Most liberal quartile
Perc
ent
0
10
20
30
40
50
60
70
80
90
Most illiberal quartile Second quartile Third quartile Most liberal quartile
Perc
ent
1982 1989 1994 1997
0
5
10
15
20
25
30
35
40
Lowest Second Third Highest
Perc
ent
0
5
10
15
20
25
30
35
40
Lowest Second Third Highest
Perc
ent
0
10
20
30
40
50
60
70
80
90
Lowest Second Third Highest
Perc
ent
1982 1989 1994 1997
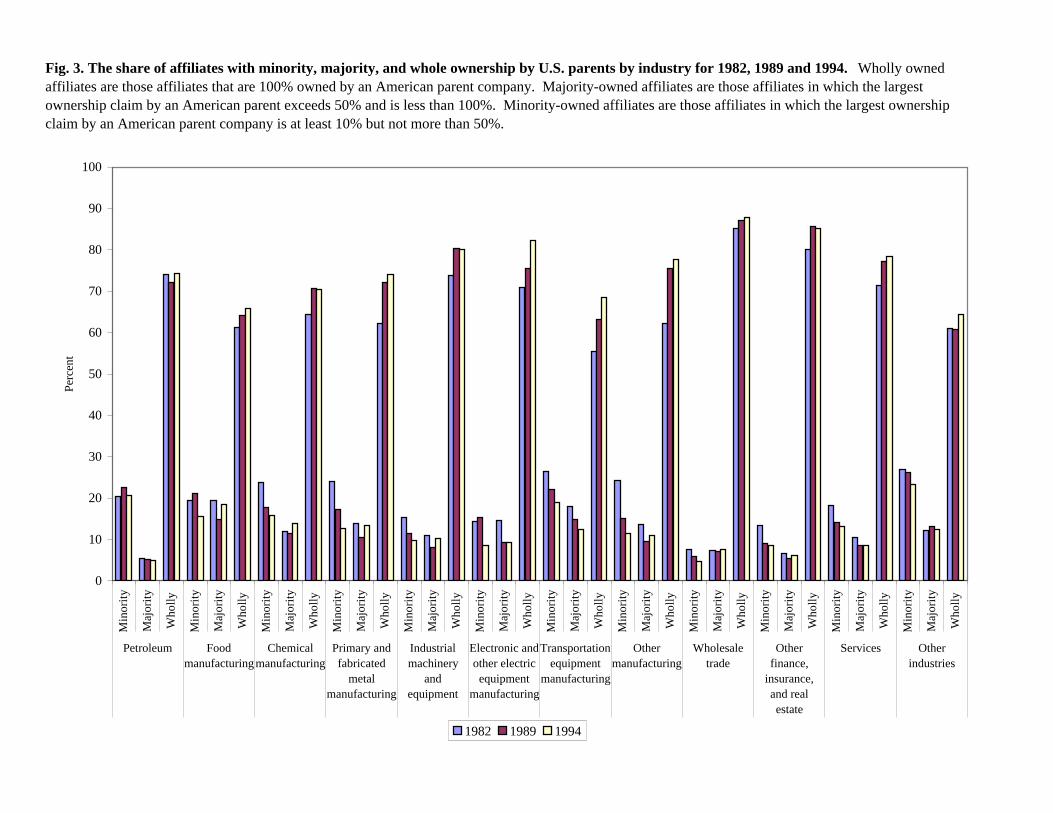
Fig. 3. The share of affiliates with minority, majority, and whole ownership by U.S. parents by industry for 1982, 1989 and 1994. Wholly owned affiliates are those affiliates that are 100% owned by an American parent company. Majority-owned affiliates are those affiliates in which the largest ownership claim by an American parent exceeds 50% and is less than 100%. Minority-owned affiliates are those affiliates in which the largest ownership claim by an American parent company is at least 10% but not more than 50%.
0
10
20
30
40
50
60
70
80
90
100
Min
ority
Maj
ority
Who
lly
Min
ority
Maj
ority
Who
lly
Min
ority
Maj
ority
Who
lly
Min
ority
Maj
ority
Who
lly
Min
ority
Maj
ority
Who
lly
Min
ority
Maj
ority
Who
lly
Min
ority
Maj
ority
Who
lly
Min
ority
Maj
ority
Who
lly
Min
ority
Maj
ority
Who
lly
Min
ority
Maj
ority
Who
lly
Min
ority
Maj
ority
Who
lly
Min
ority
Maj
ority
Who
lly
Petroleum Foodmanufacturing
Chemicalmanufacturing
Primary andfabricated
metalmanufacturing
Industrialmachinery
andequipment
Electronic andother electric
equipmentmanufacturing
Transportationequipment
manufacturing
Othermanufacturing
Wholesaletrade
Otherfinance,
insurance,and realestate
Services Otherindustries
Perc
ent
1982 1989 1994
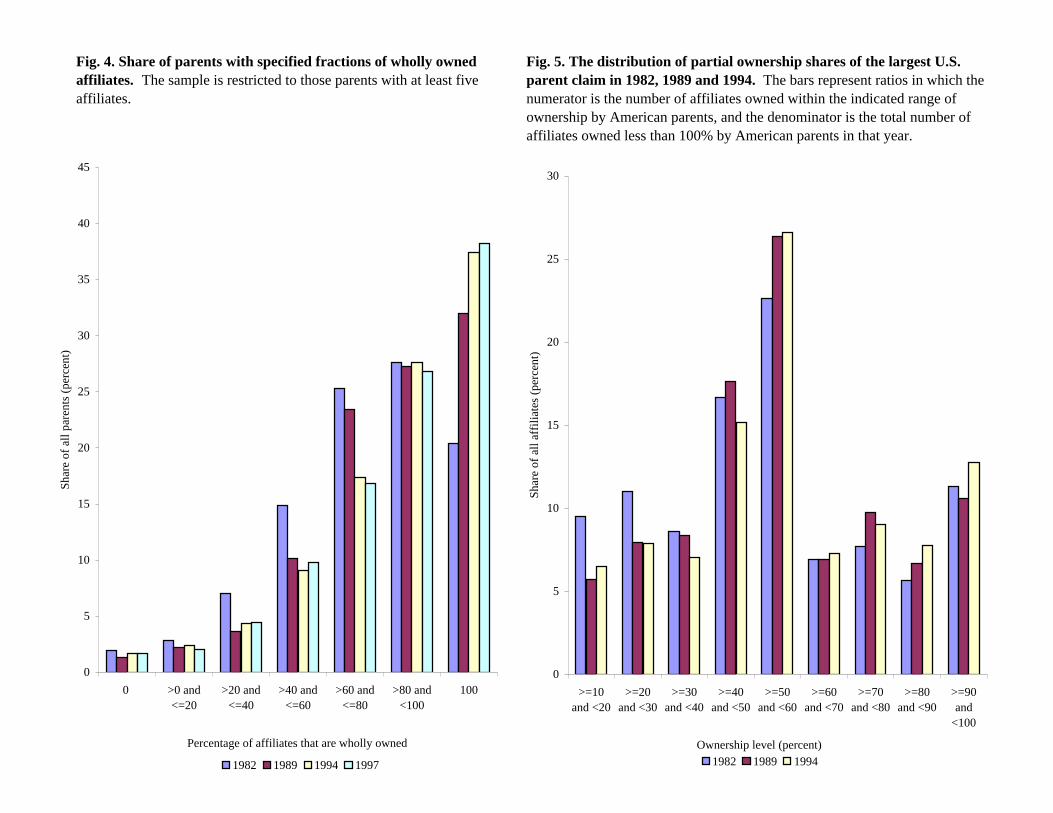
Fig. 4. Share of parents with specified fractions of wholly owned affiliates. The sample is restricted to those parents with at least five affiliates.
Fig. 5. The distribution of partial ownership shares of the largest U.S. parent claim in 1982, 1989 and 1994. The bars represent ratios in which the numerator is the number of affiliates owned within the indicated range of ownership by American parents, and the denominator is the total number of affiliates owned less than 100% by American parents in that year.
0
5
10
15
20
25
30
>=10and <20
>=20and <30
>=30and <40
>=40and <50
>=50and <60
>=60and <70
>=70and <80
>=80and <90
>=90and
<100
Ownership level (percent)
Shar
e of
all
affil
iate
s (pe
rcen
t)
1982 1989 1994
0
5
10
15
20
25
30
35
40
45
0 >0 and<=20
>20 and<=40
>40 and<=60
>60 and<=80
>80 and<100
100
Percentage of affiliates that are wholly owned
Shar
e of
all
pare
nts (
perc
ent)
1982 1989 1994 1997

Panel A: Average ratio of local sales to total sales Panel A: Average share of total sales made to related parties
Panel B: Average ratio of goods imported from U.S. parent to total sales
Panel B: Average ratio of goods imported from United States to total sales
Panel C: Average ratio of goods exported to U.S. parent to total sales
Fig. 6. Sources of inputs and destination of sales by organizational form. Panel A displays, by ownership form, the ratio of local sales to total sales for affiliates for 1982, 1989, 1994, and 1997. Panel B displays, by ownership form, the ratio of imports from the United States to total sales for affiliates for 1982, 1989, 1994, and 1997. Wholly owned affiliates are those affiliates that are 100% owned by an American parent company. Majority-owned affiliates are those affiliates in which the largest ownership claim by an American parent exceeds 50% and is less than 100%; minority-owned affiliates are those affiliates in which the largest ownership claim by an American parent company is at least 10% but not more than 50%. Data on the destination of affiliate sales are unavailable for minority-owned affiliates.
Fig. 7. The scope of intrafirm transactions by organizational form. Panel A displays, by ownership form, the ratio of sales to related parties to total sales for affiliates for 1982, 1989, 1994, and 1997. Panel B displays, by ownership form, the ratio of imports from the U.S parent to total sales for affiliates for 1982, 1989, 1994, and 1997. Panel C displays, by ownership form, the ratio of exports to the U.S. parent to total sales for affiliates for 1982, 1989, 1994, and 1997. Wholly owned affiliates are those affiliates that are 100% owned by an American parent company. Majority-owned affiliates are those affiliates in which the largest ownership claim by an American parent exceeds 50% and is less than 100%; minority-owned affiliates are those affiliates in which the largest ownership claim by an American parent company is at least 10% but not more than 50%. Data on the destination of affiliate sales are unavailable for minority-owned affiliates, and data on the share of intrafirm trade are not available for minority-owned affiliates in 1997.
45
50
55
60
65
70
75
80
Wholly owned affiliates Majority-owned affiliates Minority-owned affiliates
Perc
ent
0
2
4
6
8
10
12
Wholly owned affiliates Majority-owned affiliates Minority-owned affiliates
Perc
ent
1982 1989 1994 1997
0
5
10
15
20
25
30
35
Wholly owned affiliates Majority-owned affiliates Minority-owned affiliates
Perc
ent
0
2
4
6
8
10
12
Wholly owned affiliates Majority-owned affiliates Minority-owned affiliates
Perc
ent
0
2
4
6
8
10
12
Wholly owned affiliates Majority-owned affiliates Minority-owned affiliates
Perc
ent
1982 1989 1994 1997
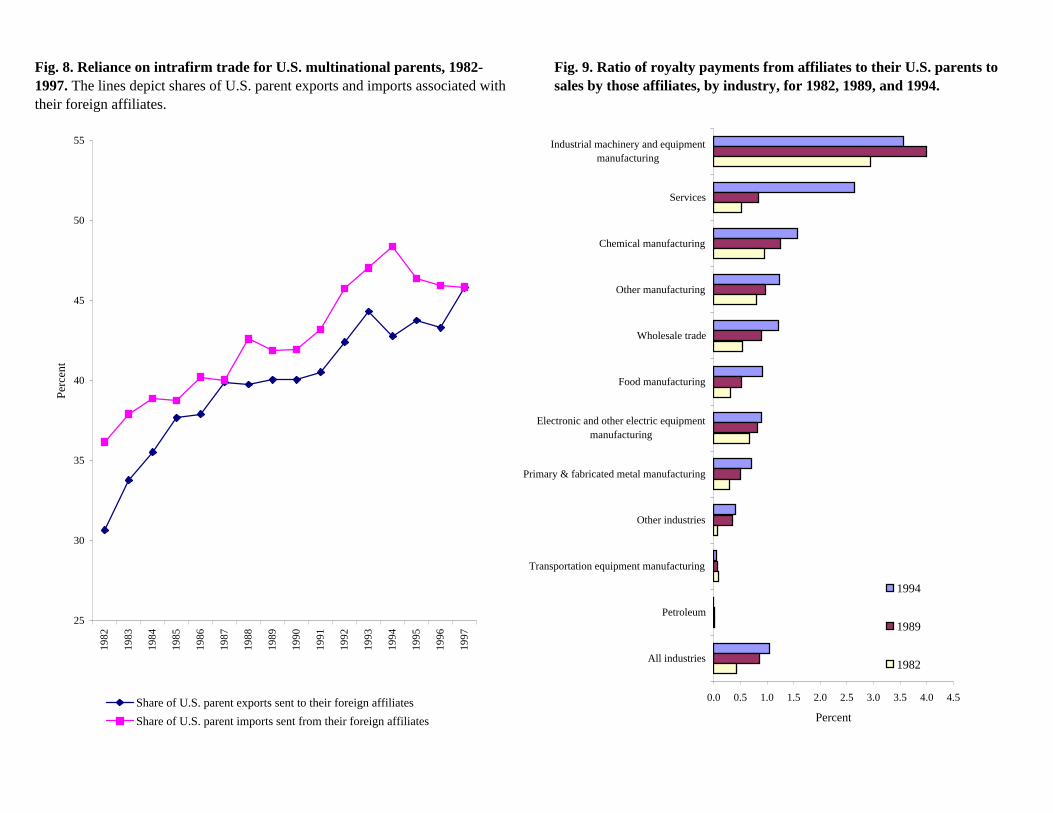
Fig. 8. Reliance on intrafirm trade for U.S. multinational parents, 1982-1997. The lines depict shares of U.S. parent exports and imports associated with their foreign affiliates.
Fig. 9. Ratio of royalty payments from affiliates to their U.S. parents to sales by those affiliates, by industry, for 1982, 1989, and 1994.
25
30
35
40
45
50
55
1982
1983
1984
1985
1986
1987
1988
1989
1990
1991
1992
1993
1994
1995
1996
1997
Perc
ent
Share of U.S. parent exports sent to their foreign affiliatesShare of U.S. parent imports sent from their foreign affiliates
0.0 0.5 1.0 1.5 2.0 2.5 3.0 3.5 4.0 4.5
Industrial machinery and equipmentmanufacturing
Services
Chemical manufacturing
Other manufacturing
Wholesale trade
Food manufacturing
Electronic and other electric equipmentmanufacturing
Primary & fabricated metal manufacturing
Other industries
Transportation equipment manufacturing
Petroleum
All industries
Percent
1994
1989
1982
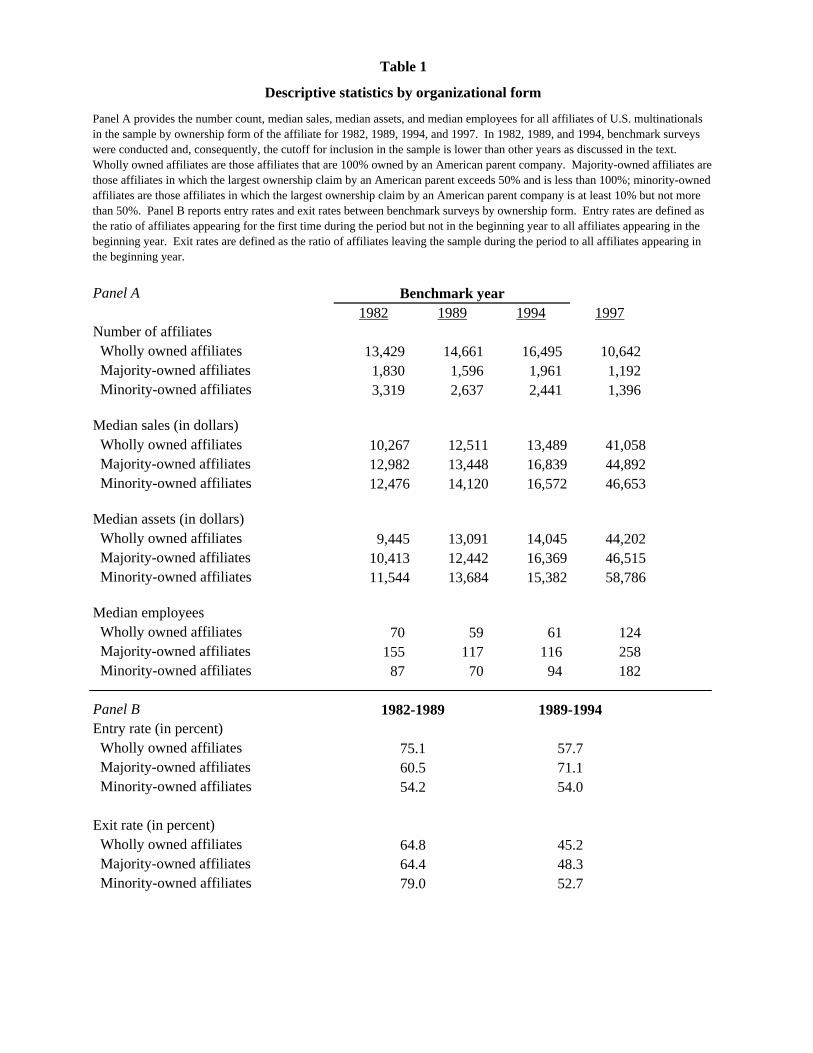
Panel A1982 1989 1994 1997
Number of affiliates Wholly owned affiliates 13,429 14,661 16,495 10,642 Majority-owned affiliates 1,830 1,596 1,961 1,192 Minority-owned affiliates 3,319 2,637 2,441 1,396
Median sales (in dollars) Wholly owned affiliates 10,267 12,511 13,489 41,058 Majority-owned affiliates 12,982 13,448 16,839 44,892 Minority-owned affiliates 12,476 14,120 16,572 46,653
Median assets (in dollars) Wholly owned affiliates 9,445 13,091 14,045 44,202 Majority-owned affiliates 10,413 12,442 16,369 46,515 Minority-owned affiliates 11,544 13,684 15,382 58,786
Median employees Wholly owned affiliates 70 59 61 124 Majority-owned affiliates 155 117 116 258 Minority-owned affiliates 87 70 94 182
Panel BEntry rate (in percent) Wholly owned affiliates Majority-owned affiliates Minority-owned affiliates
Exit rate (in percent) Wholly owned affiliates Majority-owned affiliates Minority-owned affiliates
Table 1
Descriptive statistics by organizational form
75.1 57.7
Benchmark year
1982-1989 1989-1994
Panel A provides the number count, median sales, median assets, and median employees for all affiliates of U.S. multinationals in the sample by ownership form of the affiliate for 1982, 1989, 1994, and 1997. In 1982, 1989, and 1994, benchmark surveys were conducted and, consequently, the cutoff for inclusion in the sample is lower than other years as discussed in the text. Wholly owned affiliates are those affiliates that are 100% owned by an American parent company. Majority-owned affiliates are those affiliates in which the largest ownership claim by an American parent exceeds 50% and is less than 100%; minority-owned affiliates are those affiliates in which the largest ownership claim by an American parent company is at least 10% but not more than 50%. Panel B reports entry rates and exit rates between benchmark surveys by ownership form. Entry rates are defined as the ratio of affiliates appearing for the first time during the period but not in the beginning year to all affiliates appearing in the beginning year. Exit rates are defined as the ratio of affiliates leaving the sample during the period to all affiliates appearing in the beginning year.
60.5 71.154.2 54.0
79.0 52.7
64.8 45.264.4 48.3

(1) (2) (3) (4) (5) (6)
Constant 0.4649 *** 0.0146 0.4751 *** -0.0983 0.4644 *** -0.0783(0.0412) (1.0269) (0.0406) (1.0321) (0.0407) (1.0312)
-0.0779 *** -0.0831 ** -0.0988 *** -0.1016 *** -0.0986 *** -0.1009 ***
(0.0180) (0.0337) (0.0197) (0.0352) (0.0197) (0.0350)
-0.0748 *** -0.0609 ***
(0.0123) (0.0157)
0.1304 *** 0.1247 ***
(0.0329) (0.0409)
-0.0750 *** -0.0727 ***
(0.0142) (0.0155)
0.1187 *** 0.1498 ***
(0.0377) (0.0388)
-0.0698 *** 0.0285(0.0199) (0.0384)
0.1658 *** -0.0804(0.0527) (0.0970)
Country/industry fixed effects? No Yes No Yes No YesYear fixed effects? No Yes No Yes No Yes
Number of observations 121,212 121,212 121,207 121,207 121,207 121,207
R2 0.1640 0.4361 0.1762 0.4382 0.1775 0.4390
*** Significant at the 1% level.** Significant at the 5% level.
Minority ownership dummy
Organizational form, profitability, and coordination of tax activityTable 2
Dependent Variable: Net Income/Assets
Minority ownership dummy interacted with country tax rate
The dependent variable is the ratio of net income to assets of an affiliate, and the sample covers the 1982-1997 period. The specifications in Columns 1, 3, and 5 are ordinary least squares and the specifications in Columns 2, 4, and 6 include country/industry and year fixed effects. The analysis uses analytic weights equal to assets to transform the specifications in a way that is equivalent to multiplying through by assets. "Country tax rate" is the median country tax rate as calculated in the text. The subsequent terms are ownership dummies and their interactions with "Country tax rate." Majority and minority ownership dummies equal one for any affiliate majority or minority owned by the U.S. parent. Partial ownership dummies equal one for any affiliate not wholly owned by the U.S. parent. Coefficients for additional controls for affilialte leverage, affiliate sales, country gross domestic product (GDP), and country GDP/capita have been suppressed. Heteroskedasticity-consistent standard errors are presented in parentheses.
Partial ownership dummy
Country tax rate
Partial ownership dummy interacted with country tax rate
Majority ownership dummy
Majority ownership dummy interacted with country tax rate
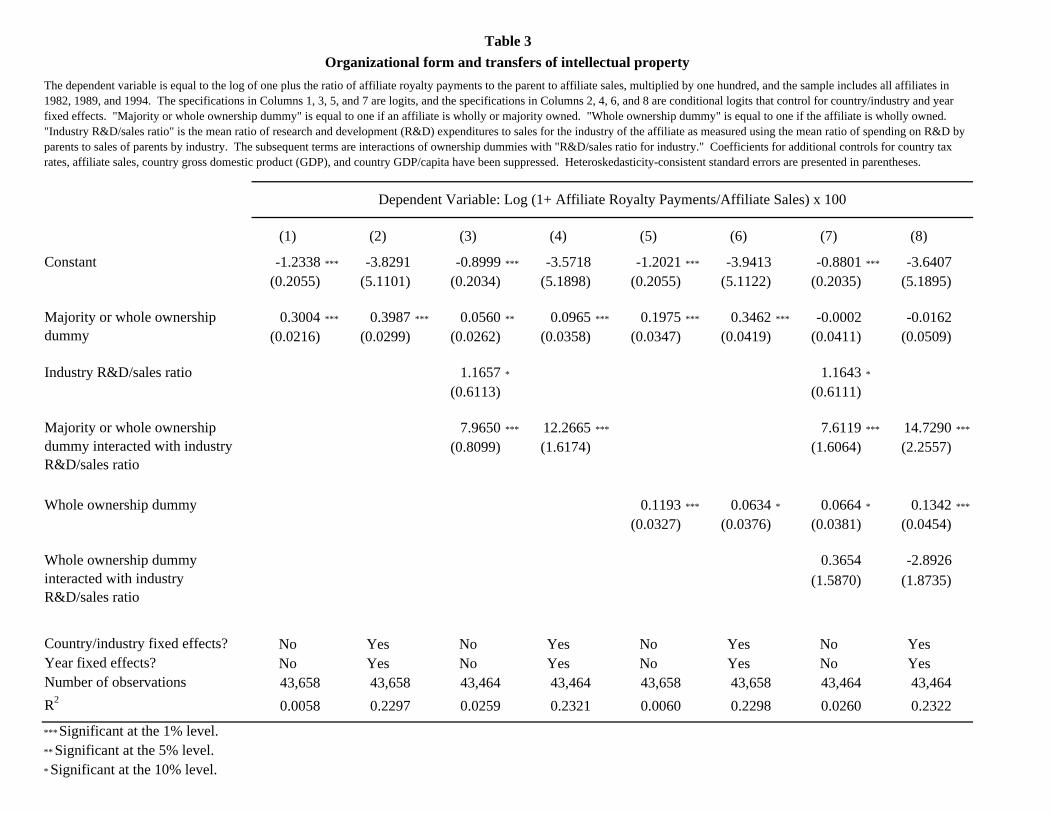
(1) (2) (3) (4) (5) (6) (7) (8)
Constant -1.2338 *** -3.8291 -0.8999 *** -3.5718 -1.2021 *** -3.9413 -0.8801 *** -3.6407(0.2055) (5.1101) (0.2034) (5.1898) (0.2055) (5.1122) (0.2035) (5.1895)
0.3004 *** 0.3987 *** 0.0560 ** 0.0965 *** 0.1975 *** 0.3462 *** -0.0002 -0.0162(0.0216) (0.0299) (0.0262) (0.0358) (0.0347) (0.0419) (0.0411) (0.0509)
1.1657 * 1.1643 *
(0.6113) (0.6111)
7.9650 *** 12.2665 *** 7.6119 *** 14.7290 ***
(0.8099) (1.6174) (1.6064) (2.2557)
0.1193 *** 0.0634 * 0.0664 * 0.1342 ***
(0.0327) (0.0376) (0.0381) (0.0454)
0.3654 -2.8926(1.5870) (1.8735)
Country/industry fixed effects? No Yes No Yes No Yes No YesYear fixed effects? No Yes No Yes No Yes No YesNumber of observations 43,658 43,658 43,464 43,464 43,658 43,658 43,464 43,464R2 0.0058 0.2297 0.0259 0.2321 0.0060 0.2298 0.0260 0.2322
Organizational form and transfers of intellectual propertyTable 3
Dependent Variable: Log (1+ Affiliate Royalty Payments/Affiliate Sales) x 100
The dependent variable is equal to the log of one plus the ratio of affiliate royalty payments to the parent to affiliate sales, multiplied by one hundred, and the sample includes all affiliates in 1982, 1989, and 1994. The specifications in Columns 1, 3, 5, and 7 are logits, and the specifications in Columns 2, 4, 6, and 8 are conditional logits that control for country/industry and year fixed effects. "Majority or whole ownership dummy" is equal to one if an affiliate is wholly or majority owned. "Whole ownership dummy" is equal to one if the affiliate is wholly owned. "Industry R&D/sales ratio" is the mean ratio of research and development (R&D) expenditures to sales for the industry of the affiliate as measured using the mean ratio of spending on R&D by parents to sales of parents by industry. The subsequent terms are interactions of ownership dummies with "R&D/sales ratio for industry." Coefficients for additional controls for country tax rates, affiliate sales, country gross domestic product (GDP), and country GDP/capita have been suppressed. Heteroskedasticity-consistent standard errors are presented in parentheses.
Whole ownership dummy interacted with industry R&D/sales ratio
*** Significant at the 1% level.
* Significant at the 10% level.
Majority or whole ownership dummy
** Significant at the 5% level.
Industry R&D/sales ratio
Whole ownership dummy
Majority or whole ownership dummy interacted with industry R&D/sales ratio

Dependent variable:
(1) (2) (3) (4) (5) (6) (7) (8)
Constant 3.3883 *** 2.7673 *** 2.5945 *** 1.4242(0.5293) (0.7691) (0.7642) (0.8820)
0.5779 *** 0.2384 * 0.1980 ** 0.1157 0.2188 ** 0.1476 0.6740 *** 0.2439(0.0577) (0.1305) (0.0874) (0.2019) (0.0865) (0.1995) (0.1007) (0.2863)
-1.0541 *** 2.1184 ** -1.1845 *** 2.5367 * -1.2498 *** 2.3036 0.4880 -1.9679(0.2627) (0.9921) (0.3695) (1.4129) (0.3675) (1.4056) (0.4291) (2.2616)
-0.0181 *** -0.0135 *** -0.0044 ** -0.0008 -0.0043 ** -0.0005 -0.0173 *** -0.0151 ***
(0.0012) (0.0018) (0.0020) (0.0030) (0.0020) (0.0029) (0.0021) (0.0040)
Same industry as parent dummy -0.3032 *** -0.0519 -0.2644 *** -0.1848 ** -0.2488 *** -0.1779 ** -0.0704 0.1642(0.0435) (0.0618) (0.0605) (0.0862) (0.0603) (0.0856) (0.0759) (0.1368)
Parent R&D/sales ratio 2.9507 *** 1.5694 ** 1.7673 *** 0.8252 1.6811 *** 0.7348 3.1923 *** 2.7909 *
(0.4561) (0.6934) (0.6220) (0.9684) (0.6189) (0.9636) (0.8614) (1.6700)
0.5584 *** 0.4231 ** -0.0002 -0.3314 1.3581 *** 1.1070 **
(0.1602) (0.2067) (0.1856) (0.2532) (0.3181) (0.4637)
1.4851 *** 1.4218 *** 0.6610 *** 0.6079 *** 1.6841 *** 2.1936 ***
(0.1425) (0.1807) (0.1713) (0.2229) (0.2763) (0.4479)
0.3295 *** 0.2458 *
(0.0974) (0.1280)
0.6647 *** 0.5233 ***
(0.1582) (0.1887)
Country/industry fixed effects? No Yes No Yes No Yes No YesYear fixed effects? No Yes No Yes No Yes No Yes
Number of observations 14,697 10,800 12,504 6,997 12,613 7,086 3,638 1,747
Log likelihood -7,584 -3,915 -4,291 -2,013 -4,323 -2,037 -2,320 -665
** Significant at the 5% level.* Significant at the 10% level.
Ownership restrictions dummy
Absolute value of difference of median country tax rates from U.S. statutory rate
Number of other countries operated in by parent
*** Significant at the 1% level.
Ratio of goods exported to U.S. to total sales
Ratio of goods imported from U.S. to total sales
Ratio of related party sales to total sales
Ratio of imports from parent to total sales
Table 4
Determinants of ownership at entry
Dummy for whole ownership versus partial ownership
Dummy for other majority ownership versus minority
ownership
Dummy for whole ownership versus other majority ownership
The dependent variable in the specifications in Columns 1 and 2 is equal to one if the affiliate is wholly owned and equal to zero if the affiliate is majority owned or minority owned. The sample includes the first appearences of all affiliates from 1983 to 1997. The dependent variable in the specifications in Columns 3, 4, 5, and 6 is equal to one if the affiliate is wholly owned and equal to zero if the affiliate is majority owned. The dependent variable in the specifications in Columns 7 and 8 is equal to one if the affiliate is majority owned but not wholly owned and equal to zero if the affiliate is minority owned. The specifications in Columns 1, 3, 5, and 7 are logits, and the specifications in Columns 2, 4, 6, and 8 are conditional logits that control for country/industry and year fixed effects. "Ownership restrictions dummy" equals one if the two measures of restrictions on foreign ownership as measured by Shatz (2000) are above 3 on a scale of 1 to 5 and is zero otherwise. "Absolute value of difference of median country tax rates from U.S. statutory rate" is the absolute value of the difference between the median tax ratefaced by an affiliate in a country and the U.S. statutory rate in a given year. "Number of other countries operated in by parent" for an affiliate is the number of other countries in which the affiliate's parent has an affiliate. "Same industry as parent dummy" equals one if the affiliate is in the same industry as the parent and zero otherwise. "Parent R&D/sales ratio" is the ratio of R&D expenditures to sales for the firm in a particular year as measured using Bureau of Economic Analysis or COMPUSTAT data. "Ratio of goods exported to U.S. to total sales" is the ratio of affiliate exports to the U.S. to total affiliate sales. "Ratio of goods imported from U.S. to total sales" is the ratio of affiliate imports from the United States to total affiliate sales. "Ratio of related party sales to total sales" is the ratio of sales to related parties to total affiliate sales. "Ratio of imports from parent to total sales" is the ratio of imports from the U.S. parent to total affiliate sales. Coefficients for additional controls for country affiliate sales, country gross domestic product (GDP), and country GDP/capita have been suppressed. Standard errors are presented in parentheses.

(1) (2) (3) (4) (5) (6) (7) (8) (9)
Constant 1.5338 *** -1.5302 1.5268 *** -1.5765 2.1918 Constant 0.5521 *** -1.6928 -0.7949 -3.3982 **
(0.0895) (0.9947) (0.0894) (0.9963) (1.5617) (0.0630) (0.5851) (0.7225) (1.5365)
0.0757 *** 0.0234 *** 0.0240 ** -0.0042 -0.0190 0.0350 *** 0.0044 0.5825 *** 0.6485 ***
(0.0082) (0.0084) (0.0118) (0.0110) (0.0127) (0.0073) (0.0092) (0.1754) (0.2234)
-0.0460 *** -0.0047 * 0.0874 0.0346 0.1575 **
(0.0112) (0.0027) (0.0393) (0.0477) (0.0755)
0.0971 *** 0.0480 *** 0.0475 *** -0.0358 *** -0.0497 -0.0440 -0.1127 *
(0.0157) (0.0124) (0.0124) (0.0047) (0.0491) (0.0565) (0.0670)
-0.0747 *** 0.0805 -0.0751 *** 0.0810 -0.0922(0.0037) (0.0634) (0.0037) (0.0635) (0.0834)
0.1125 *** 0.0075 0.1171 *** 0.0115 0.0903(0.0066) (0.0754) (0.0066) (0.0754) (0.0787)
No No Yes Yes
No Yes No Yes Yes No Yes Yes YesYear fixed effects? No No No No Yes Year fixed effects? No No No Yes
Number of observations 11,053 11,053 10,953 10,953 10,953 Number of observations 9,724 9,724 9,655 9,655R2 0.0526 0.7052 0.0569 0.7046 0.7054 R2 0.0148 0.7171
Post-liberalization dummy Share of sales through wholly owned affiliates
Log of host country GDP
Post-liberalization dummy interacted with high R&D intensity dummy
High R&D intensity dummy
Log of host country GDP per capita
Table 5Trade and ownership: Effects of liberalizations
Share of affiliate sales through wholly owned affiliates Share of affiliate sales to related parties
The dependent variable in the left panel is the share of all affiliate sales within a country/industry pair that are sold through wholly owned affiliates. The sample is restricted to those countries experiencing a liberalization of ownership restrictions between 1986 and 1995 as described in the text. The equations reported in Columns 1-5 are estimated by ordinarly least squares (OLS); the specifications in Columns 2 and 4 include country/industry fixed effects; and the specification in Column 5 includes country/industry fixed effects and year fixed effects. "Post-liberalization dummy" equals one for the year of and the years following a liberalization of ownership restrictions and equals zero otherwise. "High R&D intensity dummy" equals one if the industry of the affiliate has an research and development (R&D)/Sales ratio above the sample median and equals zero otherwise. "Post-liberalization dummy interacted with high R&D intensity dummy" is the product of "Post-liberalization dummy" and "High R&D intensity dummy." "Log of host country GDP" is the logarithm of the gross domestic product (GDP) of the country of an affiliate converted to international dollars using purchasing power parity rates as measured by the World Bank. "Log of host country GDP per capita" is the logarithm of the GDP per capita of the country of anaffiliate converted to international dollars using purchasing power parity rates as measured by the World Bank. The dependent variable in the right panel is the ratio of sales to related parties to total sales within a country/industry pair. "Share of sales through wholly owned affiliates" is the share of all sales within a country/industry pair that is sold through wholly owned affiliates. The equations reported in Columns 6 and 7 are estimated by OLS; the specifications in Columns 7 and 8 include country/industry fixed effects; and the specification in Column 9 includes country/industry fixed effects and year fixed effects. The specification in Column 8 instruments for "share of sales through wholly owned affiliates" using predicted values from the specification in Column 4 and the specification in Column 9 instruments for "share of sales through wholly owned affiliates" using predicted values from the specification in Column 5. Standard errors are presented in parentheses, and the standard errors in the non-instrumental variables specifications are heteroskedasticity-consistent.
Dependent variable: Dependent variable:
** Significant at the 5% level.* Significant at the 10% level.
Country/industry fixed effects?
Country/industry fixed effects?
Log of host country GDP per capita
IV with predicted ownership?
Log of host country GDP
*** Significant at the 1% level.

(1) (2) (3) (4) (5) (6) (7) (8) (9)
Constant 0.7395 *** 0.7555 *** 0.7574 *** 0.7576 *** 0.7698 *** Constant 0.1138 *** 0.1430 *** -0.1212 -1.4263 **
(0.0046) (0.0030) (0.0092) (0.0028) (0.0106) (0.0043) (0.0067) (0.1113) (0.6107)
0.0436 *** 0.0209 *** 0.0399 *** 0.0027 0.0461 *** 0.0102 0.3398 ** 1.9082 ***
(0.0054) (0.0037) (0.0116) (0.0081) (0.0051) (0.0081) (0.1370) (0.7357)
-0.0238 **
(0.0106)
0.0145 0.0237 *** 0.0233 **
(0.0133) (0.0091) (0.0091)
No No Yes Yes
Parent fixed effects? No Yes No Yes Yes Parent fixed effects? No Yes Yes Yes
Year fixed effects? No No No No Yes Year fixed effects? No No No Yes
No. of Obs. 21,918 21,918 16,715 16,715 16,715 No. of Obs. 20,714 20,714 15,851 15,851R2 0.0031 0.7763 0.0055 0.7460 0.7471 R2 0.0038 0.7124
IV with predicted ownership?
*** Significant at the 1% level.** Significant at the 5% level.
Post-TRA86 dummy
High average tax rate dummy
Post-TRA86 dummy interacted with high average foreign tax rate dummy
Share of sales through wholly owned affiliates
Table 6Trade and ownership: Effects of the Tax Reform Act of 1986
Share of affiliate sales to related partiesShare of affiliate sales through wholly owned affiliates
The dependent variable in the left panel is the share of all affiliate sales within a parent system that are sold through wholly owned affiliates. The equations reported in Columns 1-5 are estimated by ordinary least squares (OLS); the specifications in Columns 2 and 4 include parent fixed-effects; and the specification in Column 5 includes parent fixed effects and year fixed effects. "post-TRA86 dummy" equals one for years after 1986 and equals zero otherwise. "high average tax rate dummy" equals one if the average foreign tax rate faced by affiliates of a parent before 1986 exceeds 35%. "Post-TRA86 dummy interacted with high average foreign tax rate dummy" is the product of "Post-TRA86 dummy" and "High average foreign tax rate dummy." The dependent variable in the right panel is the ratio of sales to related parties to total sales within a parent system. "Share of sales through wholly owned affiliates" is the share of all sales within a parent system that is sold through wholly owned affiliates. The equations reported in Columns 6 and 7 are estimated by OLS; the specifications in Columns 7 and 8 include parent fixed effects; and the specification in Column 9 includes parent fixed effects and year fixedeffects. The specification in Column 8 instruments for "Share of sales through wholly owned affiliates" using predicted values from the specification in Column 4 and the specification in Column 9 instruments for "Share of sales through wholly owned affiliates" using predicted values from the specification in Column 5. Standard errors are presented in parentheses, and the standard errors in the non-instrumental variables specifications are heteroskedasticity-consistent. The sample includes annual data aggregated at the parent level over the 1982-1997 period.
Dependent variable: Dependent variable:

(1) (2) (3) (4) (5) (6) (7) (8)Constant -4.0022 *** -31.7235 *** -21.0853 *** -26.5091 *** Constant 0.2395 *** 0.4726 *** -2.9787 *** -2.8629 *
(0.3815) (3.8135) (6.1242) (8.4373) (0.0186) (0.0419) (0.7175) (1.6967)
0.4467 *** 0.3324 *** 4.2215 *** 3.1352 ** 0.3716 *** 0.0690 4.4920 *** 4.3138 **
(0.0393) (0.0540) (1.3027) (1.3730) (0.0260) (0.0529) (0.9311) (2.1527)
0.0818 *** 1.8794 *** 1.3295 *** 1.5750 ***
(0.0180) (0.2595) (0.3825) (0.4385)
-0.0358 *** -1.8447 *** -1.7179 *** -1.7439 ***
(0.0308) (0.3333) (0.4272) (0.4211)
No No Yes Yes No No Yes Yes
No Yes Yes Yes Parent fixed effects? No Yes Yes YesYear fixed effects? No No No Yes Year fixed effects? No No No Yes
Number of observations 11,053 11,053 10,953 10,953 Number of observations 21,918 21,918 16,715 16,715R2 0.0270 0.5779 R2 0.0061 0.6992
*** Significant at the 1% level.
Country/industry/year observations Parent/year observations
IV with predicted ownership from Table 5?
IV with predicted ownership from Table 6?
Log of host country GDP
Log of host country GDP per capita
* Significant at the 10% level.
Country/industry fixed effects?
Table 7Intrafirm royalty payments and ownership: Effects of liberalizations and the Tax Reform Act of 1986
Dependent variable: Log (1+ Affiliate royalty payments/Affiliate sales) x 100
Share of sales through wholly owned affiliates
Share of sales through wholly owned affiliates
The dependent variable is equal to the log of one plus the ratio of affiliate royalty payments to the parent to affiliate sales, multiplied by one hundred, and the sample covers the 1982-1997 period. The data used in the specifications presented in Columns 1-4 are at the country/industry/year level. The data used in the specifications presented in Columns 5-8 are at the parent/year level. The specifications reported in Columns 1, 2, 5, and 6 are estimated by ordinary least squares; the specifications in Columns 2 and 3 include country/industry fixed effects; the specification in Column 4 includes country/industry fixed effects and year fixed effects; the specifications in Columns 6 and 7 include parent fixed effects; and the specification in Column 8 includes parent fixed effects and year fixed effects. The specification in Column 3 instruments for "share of sales through wholly owned affiliates" using predicted values from the specification in Column 4 of Table 5 and the specification in Column 4 instruments for "share of sales using predicted values from the specification in Column 5 of Table 5. The specification in Column 7 instruments for "share of sales through wholly owned affiliates" using predicted values from the specification in Column 4 of Table 6 and the specification in Column 8 instruments for "share of sales through wholly owned affiliates" using predicted values from the specification in Column 5 of Table 6. "Log of host country GDP" is the logarithm of the gross domestic product (GDP) of the country of an affiliate converted to international dollars using purchasing power parity rates as measured by the World Bank. "Log of host country GDP per capita" is the logarithm of the GDP per capita of the country of aaffiliate converted to international dollars using purchasing power parity rates as measured by the World Bank. Standard errors are presented in parentheses, and the standard errors in the non-instrumental variables specifications are heteroskedasticity-consistent.
** Significant at the 5% level.

(1) (2) (3) (4) (5) (6)
Constant 0.2943 *** 0.3728 *** 0.3609 *** 0.6715 *** 0.7600 *** 0.7391 ***
(0.0066) (0.0085) (0.0105) (0.0164) (0.0189) (0.0212)
0.1540 *** 0.0531 *** 0.0477 *** 0.1169 *** 0.0068 0.0126(0.0079) (0.0109) (0.0109) (0.0189) (0.0235) (0.0235)
Parent fixed effects? No Yes Yes No Yes YesYear effects? No No Yes No No Yes
Number of observations 15,913 15,913 15,913 5,641 5,641 5,641R2 0.0224 0.7259 0.7270 0.0077 0.8447 0.8465
*** Significant at the 1% level.
Table 8
Share of sales through wholly owned affiliates
Dependent variable: Share of parent trade with related parties Share of royalties from related parties
Do firms substitute arm's-length contracts for reduced minority ownership?The dependent variable in the left panel is the share of all trade (exports plus imports) within a parent system that is conducted with affiliated parties, and the sample used to create this panel covers the 1982-1997 period. The dependent variable in the right panel is the share of all royalties received by a parent that are received from affiliated parties, and the sample used to create this panel covers the 1987-1997 period. Specifications presented are ordinary least squares. The specifications in Columns 2, 3, 5, and 6 include parent fixed effects. The specifications in Columns 3 and 6 also include year effects. "Share of sales through wholly owned affiliates" is the share of all sales within a parent system that is sold through wholly owned affiliates. Heteroskedasticity-consistent standard errors are presented in parentheses.