Embed Size (px)
Citation preview
The Costs of Patronage:Evidence from the British Empire
By Guo Xu∗
I combine newly digitized personnel and public finance data fromthe British colonial administration 1854-1966 to study how patron-age affects the promotion and incentives of governors. Governorsare more likely to be promoted to higher salaried colonies whenconnected to their superior during the period of patronage. Onceallocated, they provide more tax exemptions, raise less revenue,and invest less. The promotion and performance gaps disappearafter the abolition of patronage appointments. Patronage thereforedistorts the allocation of public sector positions and reduces theincentives of favored bureaucrats to perform.JEL: O1, M51, D73
State capacity is fundamental to development and growth.1 Bureaucrats area key element of state capacity: they embody the human capital of the stateand are responsible for the delivery of public services and the implementation ofpolicies. Understanding how to promote and incentivize bureaucrats is central toimproving organizational performance.2
Throughout history, patronage has been the dominant method for the appoint-ment to public office (Grindle, 2012).3 From chiefdoms to royal courts, patronageplayed a key role in the allocation of positions. Discretionary appointments ofbureaucrats remain widespread even in developed countries today. In the U.S.alone, more than 8,000 senior federal positions are still allocated “at the pleasureof the President.”4 Discretionary appointments are also pervasive outside of thepublic sector. The appointment of CEOs or board members based on family tiesand social networks, for example, is common practice (Bertrand, 2009).
∗ Haas School of Business, University of California, Berkeley, CA 94720 (e-mail: [email protected]).I thank Oriana Bandiera, Marianne Bertrand, Tim Besley, Michael Best, Michael Burda, Robin Burgess,Ernesto Dal Bo, Jeremiah Dittmar, Dave Donaldson, Esther Duflo, James Fenske, Thiemo Fetzer, FredFinan, Leander Heldring, Ruixue Jia, Henrik Kleven, Matt Lowe, Darryl Lundy, Sam Marden, Luis Mar-tinez, Raul Sanchez de la Sierra, Sandra Sequeira, Daniel Sturm, Noam Yuchtman and three anonymousreferees for their valuable comments. I thank Huseyin Aydin, Michael Devine, Roisin Hannon, ElenaHoltkotte, Jonas Jessen, Mouchen Liu and Bethany Nelson for excellent research assistance. Financialsupport from STICERD and the IGC is gratefully acknowledged. The author declares that he has norelevant or material financial interests that relate to the research described in this paper.
1See for example Besley and Persson (2009), Besley and Persson (2010), and Acemoglu, Garcia-Jimenoand Robinson (2015).
2See Gibbons and Roberts (2012) and Lazear and Oyer (2012).3“Patronage” refers to the discretionary appointment of individuals to governmental or political
positions (Webster’s II New College Dictionary 1995).4This count is derived from the list published after each Presidential election in the “United States
Government Policy and Supporting Positions”, commonly known as the “Plum Book” (GAO-13-299R,March 1 2013).
1
2 THE AMERICAN ECONOMIC REVIEW MONTH YEAR
In theory, the impact of patronage on organizational performance is ambiguous.Discretion over appointments can improve incentives through monitoring if prin-cipals hold private information over appointees or if loyalty limits agency prob-lems. Patronage, however, can also be detrimental for organizational performanceif favoritism disincentivizes subordinates (Aghion and Tirole, 1997; Prendergastand Topel, 1996). Despite the importance of patronage in shaping the allocationof bureaucrats, evidence on how patronage affects promotion incentives remainsscarce due to data limitations and the lack of variation in appointment rules.
This paper studies how patronage affected the promotion and incentives ofsocially connected senior bureaucrats within a public organization that spannedthe globe: the Colonial Office of the British Empire. At its peak, the ColonialOffice administered close to a fifth of the world’s land mass through its colonialgovernors. These governors were leaders of the colonies and were appointed atthe discretion of their political minister, the Secretary of State for the Colonies. Idigitized over 3,000 volumes of historical personnel and public finance reports toconstruct a unique individual-level dataset covering the universe of 456 colonialgovernors across 70 colonies from the birth of the Colonial Office in 1854 toits dissolution in 1966. This is the first time these historical sources have beenassembled into a single dataset.
My setting provides two sources of variation to identify the impact of patron-age. First, the turnover of Secretaries of State induced by the electoral cycle inLondon generated shocks in social connections among serving governors. Thesewithin-governor shocks enable me to examine how changes in connections affectedthe allocation and performance of the same governor, thus holding constant time-invariant unobserved characteristics. Second, the long study period captures vari-ation in the extent of discretion the Secretary of State could exercise in allocatinggovernorships. In the early period (1854-1930), governors were exclusively ap-pointed at the discretion of the Secretary of State. After 1930, the Warren FisherReform placed the appointment of governors under the oversight of an indepen-dent civil service appointment board. Hailed as the “Magna Carta of the ColonialOffice”, this civil service reform limited the extent to which discretionary appoint-ments could be made (Kirk-Greene, 2000; Banton, 2008). Combining both sourcesof variation allows me to study the impact of social connections on promotionsand performance before and after the removal of patronage.
To measure social connections, I leverage genealogical and biographical datato construct predetermined proxies of connectedness between the Secretaries ofState and governors that is defined by shared ancestry, membership of groupslike the aristocracy or the attendance of the same elite school or university. Tomeasure performance, I exploit the fact that governors were sufficiently impor-tant to control policies that could credibly affect measurable aggregate outcomes.Heading up entire colonies, governors wielded substantial executive and legislativepower. Under the revenue imperative - whereby colonies had to “pay their way”by raising funds for public service provision - revenue generation was a central

VOL. VOL NO. ISSUE THE COSTS OF PATRONAGE 3
measure of performance and state capacity (Jeffries, 1938; Besley and Persson,2009). Building on the literature on leaders and CEOs, the focus on colonialgovernors allows me to map top bureaucrats to aggregate economic outcomes(Bertrand and Schoar, 2003; Jones and Olken, 2005).
My empirical analysis yields two of results. First, exploiting within-governorvariation in connections to the Secretary of State induced by the ministerialturnover in London, I find that the same governor receives a 10% higher salarywhen connected during the period of patronage. As wages are typically fixedacross positions, this increase is driven by the promotion to higher salaried gov-ernorships. These governorships are also in larger and richer colonies, suggestingthat the salary difference reflects the assignment to more desirable jobs. Thepreferential promotion of connected governors disappears after the removal ofpatronage in the 1930 Warren Fisher Reform.
Second, exploiting governor-colony variation in connections to the Secretaryof State, the same governor generates 4% less annual revenue in the same posi-tion when connected during the period of patronage. This decline is driven bylower customs revenue and coincides with lower investments. I use coded dataon colonial tax laws to show that connected governors provide more trade taxexemptions. Text mining of newspapers and UK parliamentary debates providesevidence consistent with lower performance. When connected, governors are morelikely to be associated with higher levels of reported social unrest, more likely tobe mentioned with negative sentiments in the UK parliamentary debates and lesslikely to receive public awards. These performance differences disappear after theabolition of patronage.
Taken together, the results suggest that patronage not only distorts the al-location of public sector positions, but also reduces the incentives of favoredbureaucrats to perform. My results therefore underpin a long tradition of intel-lectual thought that views the transition away from a patronage-based system ofadministration to a rule-based civil service as the emergence of the modern state(Northcote and Trevelyan, 1854; Weber, 1922).
The study of the organization of the state is rapidly expanding as state ca-pacity is increasingly seen as a key driver of economic performance (Besley andPersson, 2009; Finan, Olken and Pande, 2015). My paper contributes to thisgrowing literature by studying a global bureaucracy - the British Empire - andhow the method of appointment of their leaders can affect colony-level perfor-mance. My paper differs from the existing literature as I focus on civil serviceleaders that have bearing on macroeconomic fiscal outcomes. In contrast to thelarger body of literature on the selection of public servants (Brollo, Forquesatoand Gozzi, 2017; Dal Bo, Finan and Rossi, 2013; Dal Bo et al., 2017; Deserranno,2018; Teso, Colonnelli and Prem, 2017; Weaver, 2018), my empirical strategyholds selection constant, thus allowing me to add to the emerging literature onthe incentives within the public sector. By providing evidence from civil ser-vice leaders, I complement the literature on promotion incentives among frontline

4 THE AMERICAN ECONOMIC REVIEW MONTH YEAR
providers (Banerjee et al., 2012; Khan, Khwaja and Olken, 2018). In contrast toIyer and Mani (2012) and Jia (2017), the abolition of patronage also enables meto study the impact of social connections under two different allocation regimes.5
I. Empirical context and data
A. Background and natural experiment
The organization under study is the Colonial Office. The Colonial Office wasfounded in 18546 and tasked with administering overseas possessions.7 At thepeak of British colonialism, this bureaucracy spanned the globe, covering nearlya fifth of the world’s land mass (Figure 1).
Figure 1. Territories administered by the Colonial Office - 1905
Note: British territories administered by the Colonial Office in 1905.
Two institutional settings of the Colonial Office provide variation that enableme to study the impact of patronage on the allocation and performance of socially
5In contrast to the role of connections in firms (Fisman, 2001; Bandiera, Barankay and Rasul, 2009,2010; Kramarz and Thesmar, 2013), less is known about connections in public organizations. Theseorganizations, characterized by low exit rates and the absence of performance pay, differ from firms insubstantive ways (Dewatripont, Jewitt and Tirole, 1999). More broadly, I add to the growing literature onthe incentives and selection of public servants (Khan, Khwaja and Olken, 2015; Persson and Zhuravskaya,2016; Rasul and Rogger, 2017).
6From 1800-1853, the Colonial Office was merged with the War and Colonial Department. In 1907,the Dominions Division was created to oversee the relations with the self-governing territories of Canada,Australia, New Zealand, South Africa, Newfoundland and the Irish Free State. In 1966, the ColonialOffice merged with the Foreign Office.
7Studying patronage in the Colonial Office, my analysis excludes all territories not under controlof the Secretary of State for the Colonies. These comprise territories administered by the India Office(modern day India, Bangladesh, Burma and Pakistan) as well as territories whose oversight were devolved(e.g. due to independence or transfer to another department like the Dominions Division). See AppendixTable B1 for the full list.

VOL. VOL NO. ISSUE THE COSTS OF PATRONAGE 5
connected bureaucrats. The first source of variation is the ministerial turnover.The Colonial Office was headed by the Secretary of State for the Colonies. Apolitical position, the Secretary of State was appointed by the monarch on adviceof the Prime Minister. Changes in the Secretary of State are driven by twomargins: Cabinet reshuffles at the discretion of the Prime Minister, and changesof Prime Ministers through elections. The average duration of a Secretary ofState appointment between 1854-1966 is around 3 years. The temporal changesin Secretaries of State with varying connectedness to the serving governors is thefirst source of variation I exploit.
The second source of variation is the change in the appointment regime. TheSecretary of State enjoyed discretion over the appointment of governors who weretasked with administering their assigned colonies between 1854-1930.8 Through-out the paper and following the historical term, I refer to this period of dis-cretionary appointment as patronage. Governorships were explicitly held to be“proper objects for the exercise of patronage by the Secretary of State for theColonies.” Patronage was frequently employed, “overtly as connections or moreobliquely through the recognition of shared politics, professional camaraderie, orthe obligations of friendship and family” (Laidlaw, 2005).9 Such connections ex-tended well beyond the direct family to cover large kinship networks (Bourne,1986), and patronage lasted well into the 20th century (Jeffries, 1938). Whilepatronage appointments were progressively eliminated from the domestic CrownCivil Services and de jure replaced by competitive examinations following theseminal Northcote-Trevelyan Report of 1854, the “principle of patronage stead-fastly continued until 1930” for senior appointments (Kirk-Greene, 2000). Onlyafter 1930 were patronage appointments of governors replaced by a formal systemof open recruitment. Named after the first Head of Home Civil Service WarrenFisher, the abolition of patronage appointments for governors has been hailed asthe “Magna Carta of the Colonial Service.“
The relationship between a colony and London was centered around the Sec-retary of State and the subordinate governor. As an appointed representative ofthe Crown for a fixed period of 6 years, a governor would directly report to theSecretary of State. With their duties codified in the Colonial Rules and Regula-tions, governors were bureaucrats in the classic sense. Their powers were formallydelineated under the “general powers of an officer appointed to conduct colonialgovernment.” The main duties were (Regulations of 1862): (i) Control over pub-lic finance (III.16), (ii) Legislate (I.23) (iii) Confer civil service appointments incolonies (III.20) (iv) Security (III. 26), (v) Grant pardon (III.5) and approve mar-riages (I.18). Overall, the aim was to “direct [...] attention to [...] the Aboriginal
8The title of the administrator of a colony is the governor, or lieutenant-governor, commander-in-chief,captain-general, governor-in-chief or governor-general. As their administrative functions were comparable(Banton, 2008), I refer to all these as governors for expositional simplicity.
9In the simplest theoretical formulation, the Secretary of State is altruistic towards connected sub-ordinates or favors them in expectation of reciprocity (See Online Appendix for a discussion of theconceptual framework).

6 THE AMERICAN ECONOMIC REVIEW MONTH YEAR
advancement in civilisation” (III. 25).At the same time, however, they effectively acted, as famously noted by gov-
ernor Frederick Lugard, as the “man on the spot”. Despite the subordinateposition, governors enjoyed substantial discretion in their administration of thecolonies. Governors in the most unchecked colonies exercised all executive powersand could enact laws directly by proclamation. With colonies spread across theglobe, “the distance between the centre and the periphery required a policy oftrust” (Banton, 2008). In effect, high monitoring costs rendered “any attempt toconduct the details of the administration from this country [UK] [...] absolutelyimpracticable”. The autonomy of the governor created widely different policiesand practices across the dependencies. The delegation of power from London tothe colonies enabled governors to develop “real” authority.
This tension between devolving real authority to the governor to promote initia-tive and the loss of control for the Secretary of State reflects the classic delegationproblem (Aghion and Tirole, 1997). Governors balanced the demands of the localelites against the directives from the Secretary of State while maximizing theirown rents from the public office (Gardner, 2012). As Banton (2008) summarizes,“in distant Crown Colonies the Home Government can only supervise - they can-not judge except on the governor’s local information. Their original act is sendinga good governor, and their check is dismissing him.” With the appointment anddismissal subject to the discretion of the Secretary of State, however, patronage islikely to have had a large impact on the allocation and incentives of the governors.
B. Data sources and digitization
I undertook a large-scale data digitization exercise to construct an individual-level personnel dataset of the Colonial Office. My analysis combines newly digi-tized data from four sources: the Colonial Office List 1860-1966, the Colonial BlueBooks 1821-1949, biographical data from DeBrett’s and the UK Who-is-Who, andgenealogical data from the online database The Peerage. The sample period is1854-1966, tracing the entire period of the Colonial Office from its establishmentto its dissolution. The Appendix Section B provides a detailed documentation.Colonial Lists. The first source of data on the postings, backgrounds, and
salaries of governors is derived from the Colonial Office Lists. These files havebeen systematically compiled by the Colonial Office to document changes in theadministrative structure and personnel of each colony under the British Empirefrom 1860-1966. I digitized the entire set of Colonial Office Lists. This allows meto match governors at any given point in time to the appointed colony and thecorresponding salary. For the period before these lists were available, I derive thesame information from the Blue Books (see below).Blue Books. The main source of colonial statistics is drawn from the Colonial
Blue Books 1821-1949. The Blue Books were annually compiled administrativestatistics providing detailed information about public finance (revenue and ex-penditures), demographics (population size, births and deaths), trade and socio-

VOL. VOL NO. ISSUE THE COSTS OF PATRONAGE 7
economic statistics such as education (e.g. number of schools) and prices. Thekey advantage of the Blue Books is the comparability across colonies and time.Statistics from the Blue Books were collected through standardized forms, whichgovernors were required to submit on an annual basis (See Figure A1). I con-ducted archival work to digitize the full set of 3,905 volumes from holdings at theUK National Archives, the Commonwealth Library and the library of the RoyalCommonwealth Society to construct comparable public finance statistics acrosscolonies and time. For the later periods, I use colony-specific statistical yearbooksto extend the series up to the dissolution of the colonies around 1966. The finaldataset contains 70 colonies (See Appendix Table B1 for list).
Genealogical data. I obtained biographical information about the Secretariesof State and governors from the DeBrett’s database and the UK Who-is-Who. Forgovernors that were not listed in these data sources, information was drawn fromthe Colonial Lists and secondary sources. Finally, I drew upon genealogical datato create a comprehensive family network of the British elite. I use family treedata from The Peerage (www.thepeerage.com). The data provides a genealogicalsurvey of the peerage of Britain as well as the royal families of Europe, includingthe family trees of the British elite. This enables me to create a measure ofconnectedness between the Secretary of State and his subordinate governors. Theconstruction of the measure of connectedness is described in Section I.C.
Table 1 reports descriptive statistics for a wide set of governor and colony-level characteristics. About 9% of the governors are aristocrats and members ofthe peerage (Panel A).10 The vast majority of governors (84%) served as civilservants before their first governorship. 44% of governors pursued a militarycareer before first serving as a governor. 9% of governors held political positionsprior to joining the Colonial Office. 18% (15%) of the governors graduated fromOxford (Cambridge). Governors are senior: the average age at entry is 49 years.Governors serve on average 8 years and in 1.8 colonies before retiring. In termsof colony-level characteristics (Panel B), average public revenue and expenditureincrease over time. Trade taxes comprise nearly half of all revenue across theentire sample period. Governor salaries likewise increase over time, exhibitingsubstantial variation. While salaries vary both within and across governorships,76% of the variation is explained by differences in colony size, as measured bytotal revenue and population (Appendix Table B4).
As Table 1 also shows, a special feature of the data is the unbalancednessof the panel. The spatial and temporal spread of the British Empire imposesnatural constraints on the sample size. The unbalanced nature of the panel istherefore driven by the entry and exit of colonies administered by the ColonialOffice. While the main within-governor analysis is unaffected by this feature, asystematic composition change may affect the interpretation of the reform effects.This issue will be taken up in the discussion of the results (Section II.B).
10Peerage is defined as encompassing the hereditary titles of Duke, Marquess, Earl, Viscount andBaron.

8 THE AMERICAN ECONOMIC REVIEW MONTH YEAR
Table 1—Descriptive characteristics of governors and British colonies
Panel A (1) (2) (3) (4) (5) (6)
Governor characteristics Pooled years By yearMean SD 1860 1900 1930 1960
Peerage 0.085 0.280 0.047 0.153 0.027 0.000
Civil servant 0.846 0.361 0.809 0.923 0.837 1.000
Military 0.440 0.497 0.416 0.411 0.323 0.200Politician 0.087 0.283 0.166 0.128 0.027 0.000
Eton 0.109 0.312 0.125 0.066 0.068 0.111
Oxford 0.178 0.383 0.136 0.147 0.303 0.100Cambridge 0.150 0.358 0.103 0.194 0.242 0.600
Age at entry 48.652 8.990 41.600 46.077 50.800 48.900
Years served 8.313 6.649 5.5 4.897 4.081 2.700Colonies served 1.793 1.263 1.667 1.564 1.324 1.300
Observations 456 (330) 42 (22) 39 (30) 37 (29) 10 (9)
Panel B (7) (8) (9) (10) (11) (12)
Colony characteristics Pooled years By yearMean SD 1860 1900 1930 1960
(log) Total revenue 12.309 2.185 10.850 12.638 13.135 15.961
- Share customs revenue 0.477 0.219 0.566 0.457 0.431 0.575
(log) Total expenditure 12.333 2.166 10.879 12.551 13.236 15.964(log) Population 11.689 1.995 10.823 12.037 12.071 13.052
(log) Governorship salary 7.929 0.795 7.739 7.961 8.079 8.877
Area tropics 0.652 0.423 0.564 0.591 0.720 0.742(log) Distance from London 8.386 0.551 8.337 8.453 8.328 8.243
Observations 3,510 (2,708) - - - -
Number of colonies 70 (60) 42 (31) 39 (30) 37 (29) 10 (3)
Note: Panel A reports descriptive governor characteristics for all years, and 1860, 1900, 1930 and1960. Peerage is a dummy that is 1 if the governor is a Duke, Marquess, Earl, Viscount or Baron.Civil servant/military/politician are dummies that are 1 if the governor served as a civil servant/in themilitary/as a politician before assuming the first governorship. Eton/Oxford/Cambridge are dummiesthat are 1 if the governor was educated in the named institutions. Age at entry is the age of the governorat time of first governorship. Year served is the total number of years served as governor in the ColonialOffice. Colonies served is the number of governorships held. Panel B reports descriptive colony-levelstatistics. Total revenue and expenditures are in nominal terms. Share of customs revenue is the shareof external (trade) taxes over total revenue. Population is the total count derived from the census and(linearly) interpolated between the years. Governor salary is the total annual compensation. Area tropicsis the share of the colony within the tropics. Distance from London is the distance from London to thenearest port in the colony. Number in parentheses denotes the minimum number of observations acrossall variables.
VOL. VOL NO. ISSUE THE COSTS OF PATRONAGE 9
C. Measuring connectedness
This study requires a valid measure of social ties between the Secretary ofState and the governors. This measure must meet two criteria. First, it mustcapture objective ties. This is a challenge as social connections are difficult toobserve directly. Second, the measure of social ties must address the issue ofendogenous network formation. If high ability governors are more likely to bothbe promoted and establish social ties with their superior, the resulting estimateswould mistakenly attribute unobserved ability differences to the effect of con-nectedness in explaining promotion patterns. To meet both criteria, I combineseveral pre-determined measures to proxy for unobserved social ties: shared an-cestry, membership in the aristocracy, and having attended the same elite schoolor university. These are group traits that historians have shown to be impor-tant predictors of homophily and patronage networks in the 19th century Britishcolonial service (Kirk-Greene, 2000). More generally, these are measures thathave been shown to affect economic outcomes in a variety of settings (Ashraf andBandiera, 2017).
Shared ancestry. I use exogenous family networks to proxy for unobservedsocial ties. By measuring connectedness through relatedness by blood, I derivea network measure that is both predetermined and objectively measurable us-ing family trees. The use of family networks as a measure of connectedness isparticularly suitable in my context. As a large share of Secretaries of State andgovernors originate from the British elite, their ancestry is well documented inexisting genealogical datasets. Furthermore, the role of family ties in securingjobs has been well documented in the literature (Laidlaw, 2005).
The main source of genealogical data comes from the online database The Peer-age, which maps the ancestry of over a million individuals across Europe’s elite.I first extract the data to create a large dataset of dyadic relationships. I thenrestrict the relationships to blood-relations and identify the 456 governors and 37Secretaries of State by matching them against their full name and date of birth.Given their elite status, 94% of the Secretaries of State are reliably matched inthe genealogical data. Reflecting the less elite circles from which the subordi-nate governors are recruited, only 34% are matched in the data. As the familytrees of nearly all Secretaries of States are fully mapped out, I assume that themissing governors are unconnected to their superior. Since I am exploiting within-governor variation, this assumption does not introduce selectivity issues. For theremaining individuals, I apply Dijkstra’s shortest path algorithm to calculate thedegrees of separation between any governor and his superior Secretary of State.I define a Secretary of State and governor to have shared ancestors if both areconnected in the family tree and if the degree of separation is sufficiently close.
There is a trade-off in choosing the cut-off that defines “closeness.” A low degreeof separation increases the likelihood of an actual social tie. At the same time,a close cut-off will reduce the number of Secretary of States and governors thatare classified as kins. As the empirical strategy requires observing governors both

10 THE AMERICAN ECONOMIC REVIEW MONTH YEAR
connected and unconnected, a lower degree of separation reduces the numberof “switchers” (Appendix Figure A3). To obtain sufficient variation in sharedancestry, I hence use the cut-off of 16 degrees of separation. This maximizes theswitcher sample and corresponds to 25% of the governors sharing ancestry withtheir superior. The results do not critically hinge on this choice of the cut-offpoint.11
Membership in the aristocracy and common schooling. I complementthe measure of shared ancestry with three additional measures. First, I define“both aristocrats” to be a dummy that is 1 if both the governor and Secretaryof State are members of the British peerage, holding hereditary aristocratic titles(e.g. Baron, Duke). Second, I construct a dummy “Both Eton” that is 1 ifthe governor and Secretary of State both attended Eton, an elite school whichnearly half of the Secretaries of State attended. Finally, I use a dummy “BothOxbridge” that is 1 if both the governor and Secretary of State attended Oxfordor both attended Cambridge. As Secretaries of State are on average older thantheir subordinates, there is little contemporaneous overlap and common schoolingcan hence be interpreted as an alumni network.
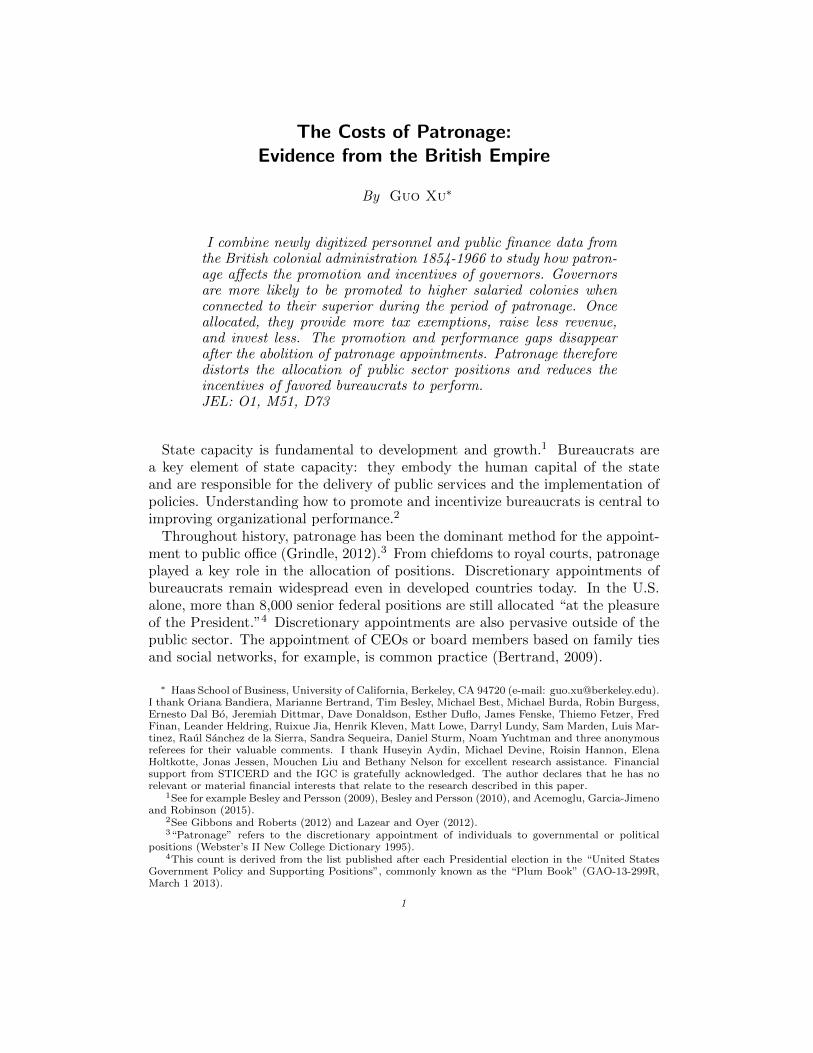
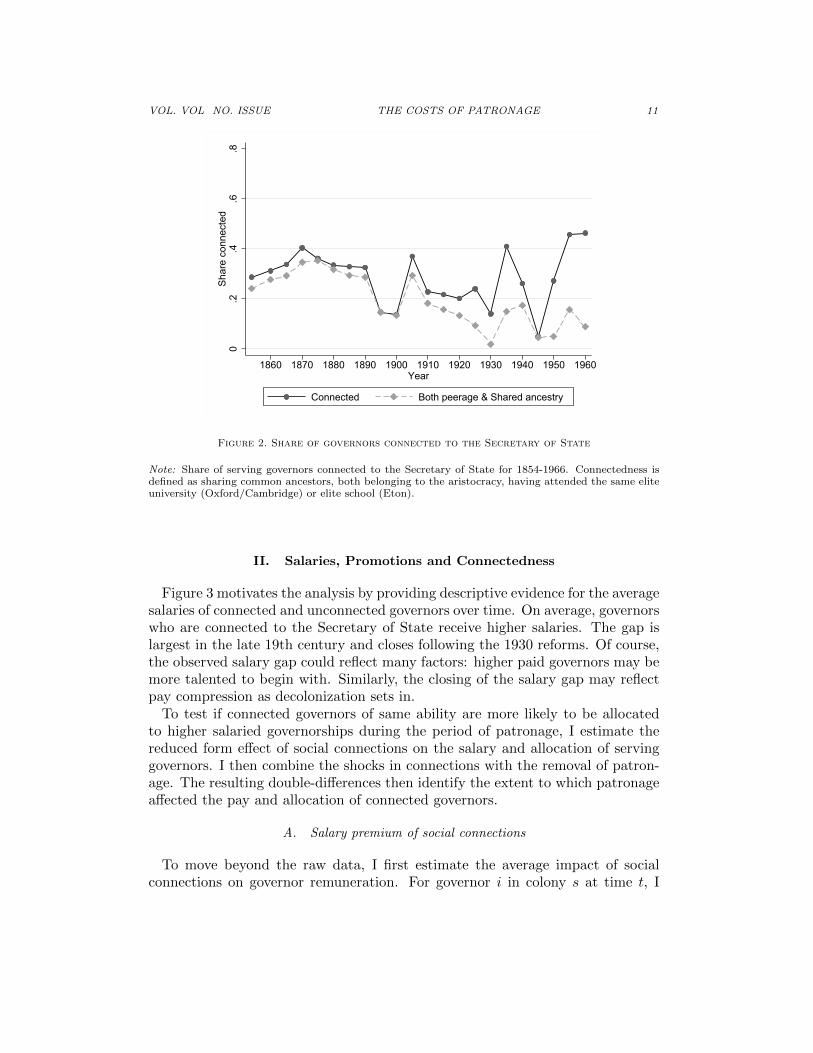
These proxies of social ties do not go without objections. In terms of sharedancestry, being connected per se, especially if with a large degree of separation,need not always imply the presence of social ties.12 Indeed, neither the inten-sity nor the direction of the actual social tie between two relatives is observed.Similarly, belonging to the aristocracy does not imply that two individuals havenecessarily established social ties. All these measures of connectedness are, ineffect, proxies for social ties that are not directly observed. For the purpose ofthe identification strategy and the interpretation of my reduced form estimates,I only require that two connected individuals are more likely to share social ties- either directly or indirectly through their membership in the same kinship oralumni network - than two unconnected individuals.13 Although the actual socialties are never observed, all four measures of connectedness are, consistent withthe assumption, positively correlated (Appendix Table B2). In my analysis, Icombine all measures into a single measure of connectedness. Figure 2 shows thevariation in the share of connected governors over time. The overall share of con-nectedness remains relatively constant as the decline in family ties is graduallyoffset by a rise in schooling ties.
11The main results are robust to cut-offs between 13 to 17, corresponding to the peak of the switchersample.
12Compared to the population, 16 degrees of separation by blood is still relatively close (8th cousins).When drawing 1,000 random pairs from the full Peerage dataset, only 10% of the links are closer than16 degrees of separation (Appendix Figure A2). Henn et al. (2012) provide an upper bound of 590,0008th cousins for a given individual. With the UK population in the 1851 Census estimated at 27,368,800,this corresponds to 2.1% of the British population.
13This is the standard assumption in models of network formation, see Breza (2016).
VOL. VOL NO. ISSUE THE COSTS OF PATRONAGE 11
0.2
.4.6
.8Sh
are
conn
ecte
d
1860 1870 1880 1890 1900 1910 1920 1930 1940 1950 1960Year
Connected Both peerage & Shared ancestry
Figure 2. Share of governors connected to the Secretary of State
Note: Share of serving governors connected to the Secretary of State for 1854-1966. Connectedness isdefined as sharing common ancestors, both belonging to the aristocracy, having attended the same eliteuniversity (Oxford/Cambridge) or elite school (Eton).
II. Salaries, Promotions and Connectedness
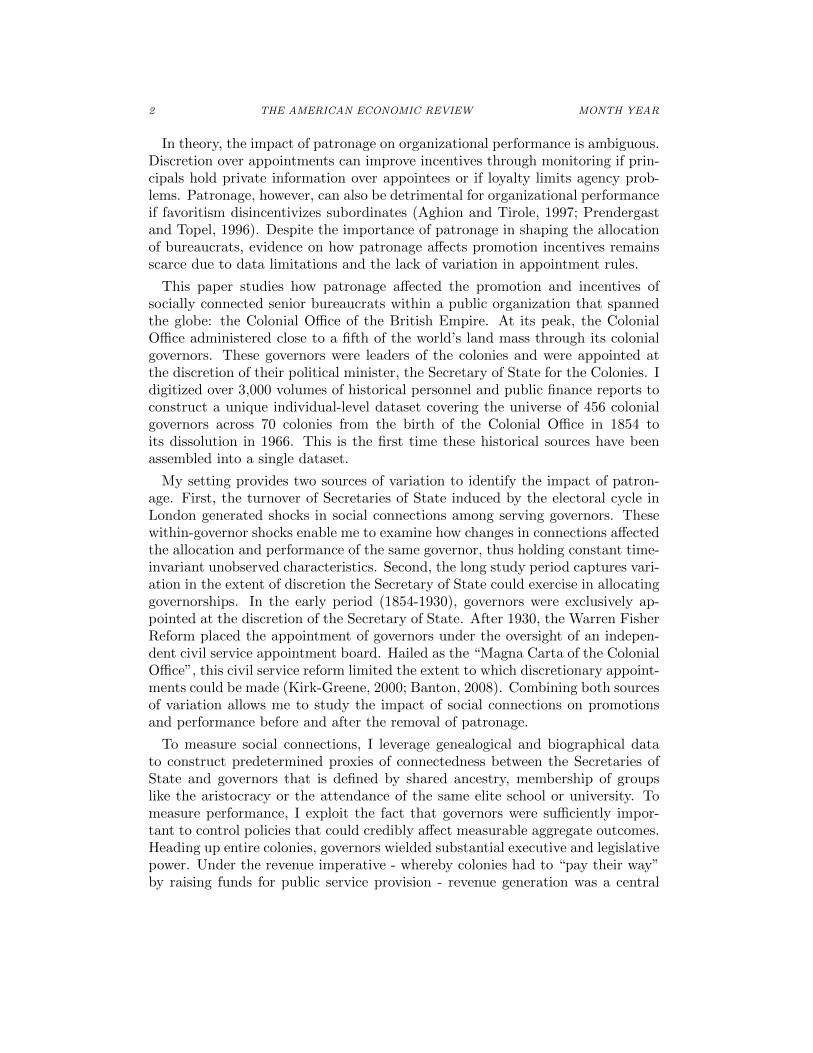
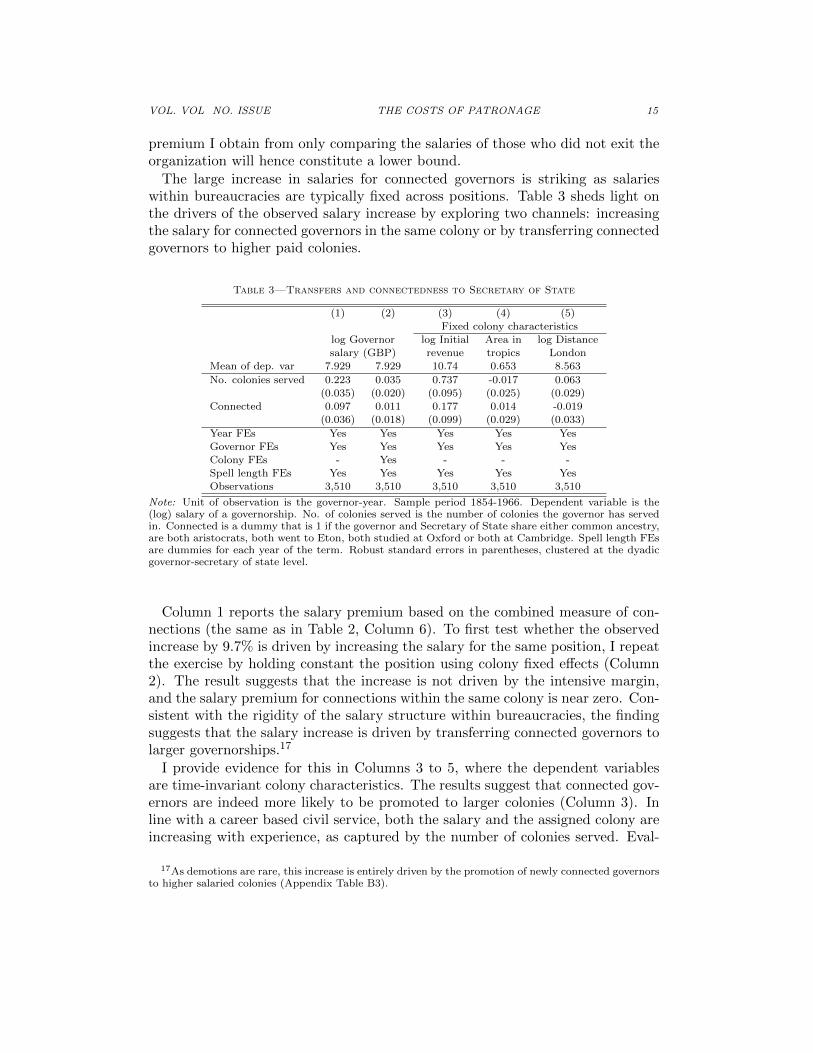
Figure 3 motivates the analysis by providing descriptive evidence for the averagesalaries of connected and unconnected governors over time. On average, governorswho are connected to the Secretary of State receive higher salaries. The gap islargest in the late 19th century and closes following the 1930 reforms. Of course,the observed salary gap could reflect many factors: higher paid governors may bemore talented to begin with. Similarly, the closing of the salary gap may reflectpay compression as decolonization sets in.
To test if connected governors of same ability are more likely to be allocatedto higher salaried governorships during the period of patronage, I estimate thereduced form effect of social connections on the salary and allocation of servinggovernors. I then combine the shocks in connections with the removal of patron-age. The resulting double-differences then identify the extent to which patronageaffected the pay and allocation of connected governors.
A. Salary premium of social connections
To move beyond the raw data, I first estimate the average impact of socialconnections on governor remuneration. For governor i in colony s at time t, I

12 THE AMERICAN ECONOMIC REVIEW MONTH YEAR
2000
3000
4000
5000
6000
7000
Aver
age
sala
ry (G
BP)
1850 1860 1870 1880 1890 1900 1910 1920 1930 1940 1950 1960Decade
Connected Unconnected
Figure 3. Average salary connected vs. unconnected over time
Note: Average annual governor salary (GBP) for connected and unconnected governors over time.
estimate following specification:
logwist = β × cit + θi + x′itγ + τt + εist(1)
where wist is the governor’s salary and the dummy cit = {0, 1} denotes the con-nectedness to the Secretary of State in office. The connectedness between thegovernor and his superior is measured by the shared ancestry, the membership inthe British aristocracy, or having attended the same elite secondary school (Eton)or university (both Oxford/both Cambridge).
The turnover of Secretaries of State in London generates variation in socialconnections to serving governors. To exploit this source of variation, I introducegovernor fixed effects θi. These absorb all unobserved governor-specific hetero-geneity that is correlated with connectedness, for example that higher abilitygovernors receive higher salaries and are more likely to be connected. The iden-tification is therefore driven by governors who change their connections duringtheir career. Table B6 provides balancing statistics for these “switchers.” Interms of descriptive statistics, the “switchers” are between those who are alwaysconnected and never connected (Appendix Table B7).
Around 21% of the 456 governors experience a change in connections over theircareer, corresponding to 28% of the full sample in the governor-year panel. Gov-ernors are as likely to be connected early on in their careers and appointments aslater. There is also no statistically discernible difference in the likelihood of trans-

VOL. VOL NO. ISSUE THE COSTS OF PATRONAGE 13
fer to another governorship and retirement from the Colonial Office. Throughoutthe subsequent analysis, I include the remaining governors to remove noise andto obtain more precise estimates.
With the governor fixed effects holding constant time-invariant confounders, theremaining identification threat is that “within-governor” shocks in connectionsare correlated with other time-varying governor-specific characteristics. As TableB6 shows, however, this variation is uncorrelated with time-varying individual-specific observables. While concerns over unobserved time-varying governor-specific characteristics may still remain, there are few obvious candidates. Thereason is that the measure of connectedness is pre-determined and driven by thetemporal turnover of Secretaries of State which, in turn, generates cross-sectionalvariation in connectedness to all serving governors. So although the unobservedlobbying activities of an exceptionally powerful governor may, for example, in-duce the appointment of a connected Secretary paying higher salaries, the entryof the new Secretary will generate shocks to connections to all other serving gov-ernors. This implies that lobbying as an omitted variable will only pose a threatif all governors who became connected at a given time engaged in lobbying. Thiscase, however, is captured by the inclusion of year fixed effects τt that absorbsunobserved temporal shocks common to all serving governors. The ministerialturnover occurs through elections unrelated to colony outcomes.14
Nonetheless, I include xit as a vector of time-varying characteristics: these com-prise the total number of colonies served and a full set of dummies for each yearof tenure in the current governorship. Finally, εist is the error term, which is clus-tered at the governor-secretary level, corresponding to the level of the identifyingsource of variation. The results, however, are robust to alternative clusteringstrategies (Appendix Table B11).
The results are presented in Table 2 and suggest that connected governors re-ceive substantially higher salaries. Columns 1 to 4 include each separate measureof connectedness, showing that the same governor, at times connected to the Sec-retary of State, receives higher salaries based on all four measures. In terms ofthe point estimate, the salary premium is largest when both are members of theBritish aristocracy and comparable for the shared ancestry and having attendedthe same elite school and university. These four measures of connectedness arepositively correlated, suggesting that connected individuals are more likely toshare similar biographies and socio-economic backgrounds (Appendix Table B2).When including all four measures of social connectedness (Column 5), the pointestimates are smaller and noisier. Given the noisiness of the estimates, however,I cannot statistically reject the equality of all point estimates. To increase thepower, Column 6 combines all measures into a single measure of connectednessthat is 1 if the governor and Secretary of State are connected based on at least
14The only predictor of turnover are elections (Appendix Table B5). The results are robust to usingonly variation in connections induced by elections (Appendix Table B10, Column 3).

14 THE AMERICAN ECONOMIC REVIEW MONTH YEAR
Table 2—Governor salary and connectedness to Secretary of State
(1) (2) (3) (4) (5) (6)
log Governor salary in GBP
Mean of dep. var 7.929 7.929 7.929 7.929 7.929 7.929
No. colonies served 0.221 0.222 0.223 0.222 0.224 0.223
(0.035) (0.035) (0.035) (0.035) (0.035) (0.035)Shared Ancestors 0.103 0.093
(0.047) (0.046)Both Aristocrats 0.215 0.176
(0.124) (0.121)
Both Eton 0.133 0.118(0.077) (0.081)
Both Oxbridge 0.072 0.073
(0.047) (0.045)Connected 0.097
(0.036)
Year FEs Yes Yes Yes Yes Yes Yes
Governor FEs Yes Yes Yes Yes Yes YesSpell length FEs Yes Yes Yes Yes Yes Yes
Observations 3,510 3,510 3,510 3,510 3,510 3,510
Note: Unit of observation is the governor-year. Sample period 1854-1966. Dependent variable is the(log) salary in GBP paid to a governorship in a given year. No. of colonies served is the number ofcolonies the governor has served in up to the given year. Connected is a dummy that is 1 if the governorand Secretary of State share either common ancestry, are both aristocrats, both went to Eton, or bothstudied at Oxford or both at Cambridge. Spell length FEs are dummies for each year of the term. Robuststandard errors in parentheses, clustered at the dyadic governor-secretary of state level.
one of the four dimensions.15 The combined estimate shows a salary premium of9.7%.16
While the within-governor analysis alleviates concerns over unobserved fixedgovernor-specific confounders, these estimates are invariably conditional on gov-ernors not exiting from the Colonial Office. A potential selection bias may thenarise if the changes in connections are associated with exit. Assuringly, however,there is no statistically significant association between the within-governor shocksin connections and exit (Appendix Table B6). Similarly, the career duration ofconnected governors is comparable to those of unconnected governors (AppendixFigure A4). Since the main focus of this paper is to understand how social con-nections shape the allocation of jobs within the organization, exit would implya salary of zero. Given the seniority of the governors (the median age at exit is58), almost all governors retire after their last governorship. The estimate of the
15The main margin of connectedness is on a single dimension. 74% (94%) are connected on one (two) ofthe four dimensions. The results are robust when dropping one of the four dimensions in turn (AppendixTable B12).
16An alternative interpretation is that the shock in connections does not only reflect changes in thedyadic connection to the direct superior but to the entire cabinet, reflecting an in-group vs. out-groupeffect and not a personal tie. To provide evidence against this, Appendix Table B10, Column 1 runsa horse-race between the connectedness to the Secretary of State and the Prime Minister. The resultsshow that the salary premium is only driven by the connectedness to the direct superior. The premiumfor connections does not vary by the party in office (Column 4).
VOL. VOL NO. ISSUE THE COSTS OF PATRONAGE 15
premium I obtain from only comparing the salaries of those who did not exit theorganization will hence constitute a lower bound.
The large increase in salaries for connected governors is striking as salarieswithin bureaucracies are typically fixed across positions. Table 3 sheds light onthe drivers of the observed salary increase by exploring two channels: increasingthe salary for connected governors in the same colony or by transferring connectedgovernors to higher paid colonies.
Table 3—Transfers and connectedness to Secretary of State
(1) (2) (3) (4) (5)
Fixed colony characteristicslog Governor log Initial Area in log Distance
salary (GBP) revenue tropics London
Mean of dep. var 7.929 7.929 10.74 0.653 8.563
No. colonies served 0.223 0.035 0.737 -0.017 0.063
(0.035) (0.020) (0.095) (0.025) (0.029)Connected 0.097 0.011 0.177 0.014 -0.019
(0.036) (0.018) (0.099) (0.029) (0.033)
Year FEs Yes Yes Yes Yes Yes
Governor FEs Yes Yes Yes Yes YesColony FEs - Yes - - -
Spell length FEs Yes Yes Yes Yes Yes
Observations 3,510 3,510 3,510 3,510 3,510
Note: Unit of observation is the governor-year. Sample period 1854-1966. Dependent variable is the(log) salary of a governorship. No. of colonies served is the number of colonies the governor has servedin. Connected is a dummy that is 1 if the governor and Secretary of State share either common ancestry,are both aristocrats, both went to Eton, both studied at Oxford or both at Cambridge. Spell length FEsare dummies for each year of the term. Robust standard errors in parentheses, clustered at the dyadicgovernor-secretary of state level.
Column 1 reports the salary premium based on the combined measure of con-nections (the same as in Table 2, Column 6). To first test whether the observedincrease by 9.7% is driven by increasing the salary for the same position, I repeatthe exercise by holding constant the position using colony fixed effects (Column2). The result suggests that the increase is not driven by the intensive margin,and the salary premium for connections within the same colony is near zero. Con-sistent with the rigidity of the salary structure within bureaucracies, the findingsuggests that the salary increase is driven by transferring connected governors tolarger governorships.17
I provide evidence for this in Columns 3 to 5, where the dependent variablesare time-invariant colony characteristics. The results suggest that connected gov-ernors are indeed more likely to be promoted to larger colonies (Column 3). Inline with a career based civil service, both the salary and the assigned colony areincreasing with experience, as captured by the number of colonies served. Eval-
17As demotions are rare, this increase is entirely driven by the promotion of newly connected governorsto higher salaried colonies (Appendix Table B3).

16 THE AMERICAN ECONOMIC REVIEW MONTH YEAR
uating the coefficients, the premium of connections corresponds to almost a halfof the gain from serving in one additional colony (Column 1). The reallocationchannel through which Secretaries of States increase their connected subordinates’salaries stands in stark contrast to the private sector, where discretionary salaryhikes within the same position are common (Kramarz and Thesmar, 2013). Dis-cretion in promotions could hence undermine the ability of fixed wage schedulesto limit favoritism.
Although all governors exercise comparable administrative duties across dif-ferent colonies, one concern for the interpretation is that differences in salariesmay reflect compensating differentials (Dal Bo, Finan and Rossi, 2013). Whileexpenses in the colonies were typically covered by the Crown, thus alleviatingconcerns over differences in local price levels, salary differences could still arisedue to amenity differences across colonies. Governors are then, for example, com-pensated with a higher salary for serving in colonies with a greater disease burdenor further away from London. In Columns 4 and 5, I test if the higher paid andlarger colonies are also more likely to be in tropical regions or further away fromLondon. The results show that this is not the case, providing evidence againstcompensating differentials. Higher paid governorships thus are more likely toindeed reflect more desirable jobs.18
B. The removal of patronage - Warren Fisher Reform 1930
The results demonstrate the centrality of social connections in shaping the allo-cation of governors during a period in which securing senior positions throughconnections was the norm. Although the practice of patronage appointmentwas gradually eliminated from the domestic civil service following the seminalNorthcote-Trevelyan report of 1854, civil service reforms within the Colonial Of-fice had lagged behind. While competitive examinations were introduced for thelower-tier colonial administrative service as early as the 1850s, the right to ap-point senior governors by patronage remained a legal privilege until the reform of1930.
Implementing the Warren Fisher report “On the System of Appointment inthe Colonial Office and Colonial Services” published in the same year, the Colo-nial Office saw sweeping changes in the system of appointment. As the reportnoted, the “system is open to criticism first and foremost as being at any ratein theory, a system of patronage”, where the “[Secretary of State] has the solepower, through his private secretary, over the selection of candidates.”19 Thereport hence recommended that the “existing arrangement should be replaced bya system of recruitment at once more authoritative and more independent.”
More specifically, the reform replaced the role of the private secretary of ap-pointments, who acted under the direct control of the Secretary of State, with
18If anything, colonies with higher settler mortality pay lower wages. Given the incomplete data onsettler mortality, however, I only report the cross-colony correlations in Appendix Table B4.
19Warren Fisher Committee Report on System of Recruitment (1930, CAOG 13/317), page 21.

VOL. VOL NO. ISSUE THE COSTS OF PATRONAGE 17
the Colonial Service Appointments Board. This board consisted of a Chairmanand two members nominated by the independent UK civil service commission.Although the final selection was submitted to the Secretary of State, upon whoseauthority appointments would ultimately be made, the board imposed consider-able constraints on the extent of discretion by overseeing the machinery of re-cruitment and appointments. The Warren Fisher Reform, therefore, replaced the“century-old patronage system by a public process of application and interviewunder the auspices of an independent and formal selection board” (Kirk-Greene,2000). The reform led to the creation of a personnel department by separating therecruitment functions from the direct influence of the Secretary of State. In effect,these reforms led to the professionalization of the colonial bureaucracy. Hailedas the “Magna Carta of the Colonial Service”, the 1930 reform was a definingmoment of the Colonial Office (Kirk-Greene, 2000).
The reform provides a natural experiment to study the extent to which theremoval of patronage appointments limited favoritism among Secretaries of States.I test for a differential effect of social connections after the reform by estimatingthe difference-in-differences:
logwist = β0 × cit + β1 × cit × 1[t ≥ 1930] + x′itγ + θi + τt + εist(2)
where wist is the wage and cit = {0, 1} is the dummy for connectedness. Thisspecification now allows the gap between the connected and unconnected gover-nor to vary before and after the reform. Since the Warren Fisher Reform formallyabolished patronage, I expect the promotion gap to be smaller after the reform.The remaining variables are defined as before, with the only difference being thatthe vector xit now also allows for the impact of a large set of observable character-istics to vary after the reform. This mitigates concerns that the reform also hadimpacts on dimensions other than social connections. These time-interacted char-acteristics include the number of colonies served, as well as the previous careerbackground of the governor (civil servant, military, politician).
The results in Table 4 show that the promotion gap disappears after the 1930reform. While connected governors receive 12.7% higher salaries before 1930, thesalary gap is statistically indistinguishable from zero after the reform (Column 2).This is an important result as the introduction of a formalized appointment boardchanges the allocation and promotion patterns of governorships: the preferentialtreatment of connected governors, as evidenced in the positive salary difference,disappears after the reform limited the extent of discretion the Secretary of Statecould exercise. This suggests that the Warren Fisher Reform was effective inreducing the impact of connections on shaping the allocation of public leadershippositions.

18 THE AMERICAN ECONOMIC REVIEW MONTH YEAR
Table 4—Warren Fisher 1930 - Removal of Patronage
(1) (2) (3) (4) (5) (6)
Governor salaryMean of dep. var 7.929 7.929 7.929 7.929 7.929 7.986
Connected 0.097 0.127 0.205 0.129 0.091 0.172
(0.036) (0.043) (0.059) (0.043) (0.041) (0.045)
Reform dummy × Connected -0.123 -0.222 -0.119 -0.138 -0.205(0.056) (0.079) (0.058) (0.078) (0.056)
Connected + Reform dummy - 0.004 -0.017 0.009 -0.046 -0.033× Connected (0.040) (0.041) (0.048) (0.068) (0.038)
Year FEs Yes Yes Yes Yes Yes YesGovernor FEs Yes Yes Yes Yes Yes Yes
Spell length FEs Yes Yes Yes Yes Yes Yes
Time-varying controls Yes Yes Yes Yes Yes YesConnected × Trend (centered 1930) - - Yes - - -
Connected × Governor characteristics - - - Yes - -
Connected × Colony characteristics - - - - Yes -Sample Full sample Pre/post
Observations 3,510 3,510 3,510 3,510 3,510 2,429
Note: Unit of observation is the governor-year. Sample period 1854-1966. Dependent variable is the (log)salary of a governorship. Connected is a dummy that is 1 if the governor and Secretary of State shareeither common ancestry, are both aristocrats, both went to Eton, or both studied at Oxford or both atCambridge. Reform dummy is a dummy that is 1 after 1930. Time-varying controls comprise the numberof colonies the governor has served in. Governor characteristics are: dummies for previous career trackprior to first governorship (civil servants, military, politician) and number of colonies served. Connected× Trend interacts the connected dummy with a linear time trend centered around 1930. Connected ×Governor characteristics interacts all governor characteristics (centered around sample mean) with theconnectedness dummy. Fixed colony characteristics are: (log) initial revenue of the colony, area (%) ofcolony in the tropics, (log) distance to London and the first year the colony was administered by theColonial Office. Connected × Colony characteristics interacts all time-invariant colony characteristics(centered around sample mean) with the connectedness dummy. Spell length FEs are dummies for eachyear of the term. Columns 1-5 present results for the full sample. Column 6 constrains the sample toonly colonies observed both before and after 1930. Robust standard errors in parentheses, clustered atthe dyadic governor-secretary of state level.
A caveat of this design is that time-varying unobservables may still confound theimpact of the reform. The reform, for example, nearly coincided with the GreatDepression. Similarly, reforms such as the unification of the Colonial Adminis-trative Service happening concurrently may have also affected the allocation ofgovernors. Given the double-difference design, however, the set of potential tem-poral confounders is reduced as any confounder would also need to differentiallyaffect connected and unconnected governors. To address related concerns that thereform may capture the gradually declining role of connections, Column 3 allowsthe impact of social connections to trend linearly. To ensure that the results arenot driven by composition shifts in the pool of governors, Column 4 allows theimpact of connections to vary by a host of observable governor characteristics.The results are nearly unchanged.
A related concern is that the composition of colonies may have changed afterthe reform: as colonies enter and exit from the British colonial administration,a concern is that the mitigated effect of connections post-reform is not driven

VOL. VOL NO. ISSUE THE COSTS OF PATRONAGE 19
by the reform itself but by the fact that the only colonies remaining after 1930were those where connections have no discernible treatment effect. To accountfor differential treatment effects driven by such a composition change, Column 5allows the impact of connections to vary by initial colony-characteristics such asthe revenue size, the area in the tropics, landlockedness, age and the distance toLondon. In addition, Column 6 constrains the sample to only colonies that existedboth before and after the reform. Once again, the results remain comparable bothin terms of point estimates and statistical significance.
To further alleviate empirical concerns, Appendix Table B13 (Panel A) providesa set of additional robustness checks. The results are robust to dropping the WorldWar II years (Column 2), the Great Depression (Column 3) and interacting theimpact of connectedness with the British GDP growth rate to account for businesscycle effects (Column 4).
-.4-.2
0.2
.4.6
Log
sala
ry g
ap c
onne
cted
vs.
unc
onne
cted
1905 1910 1915 1920 1925 1930 1935 1940 1945 1950 1955Year
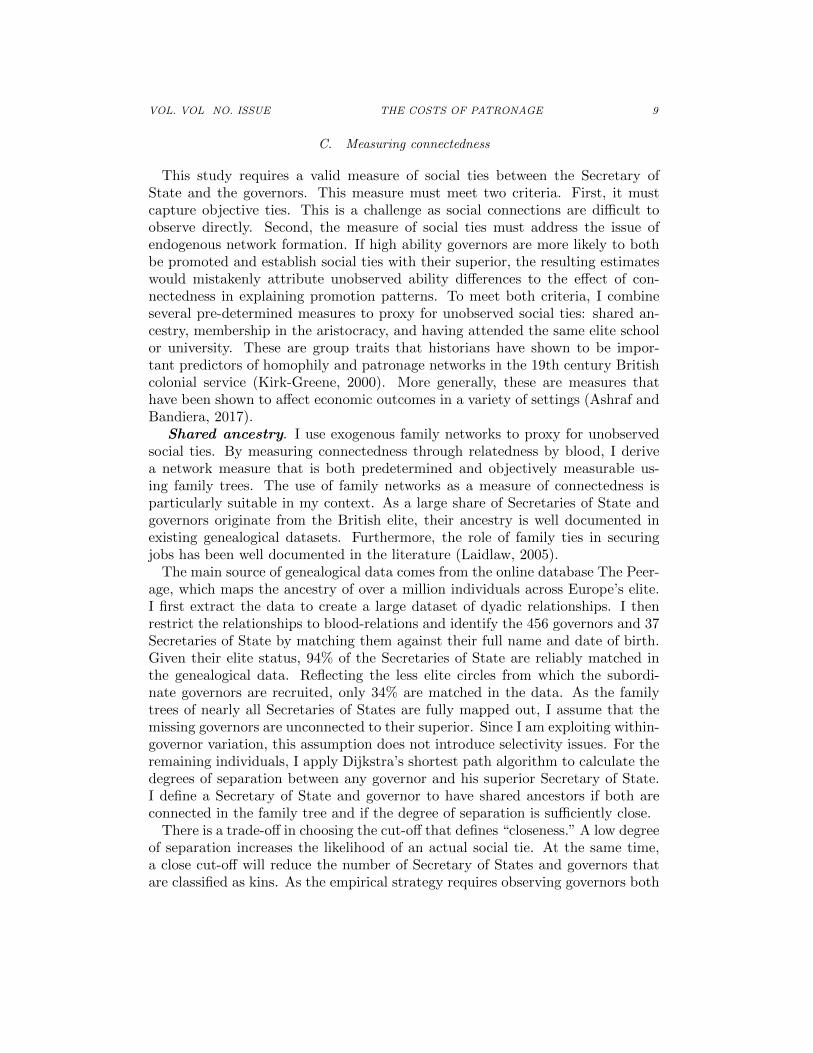
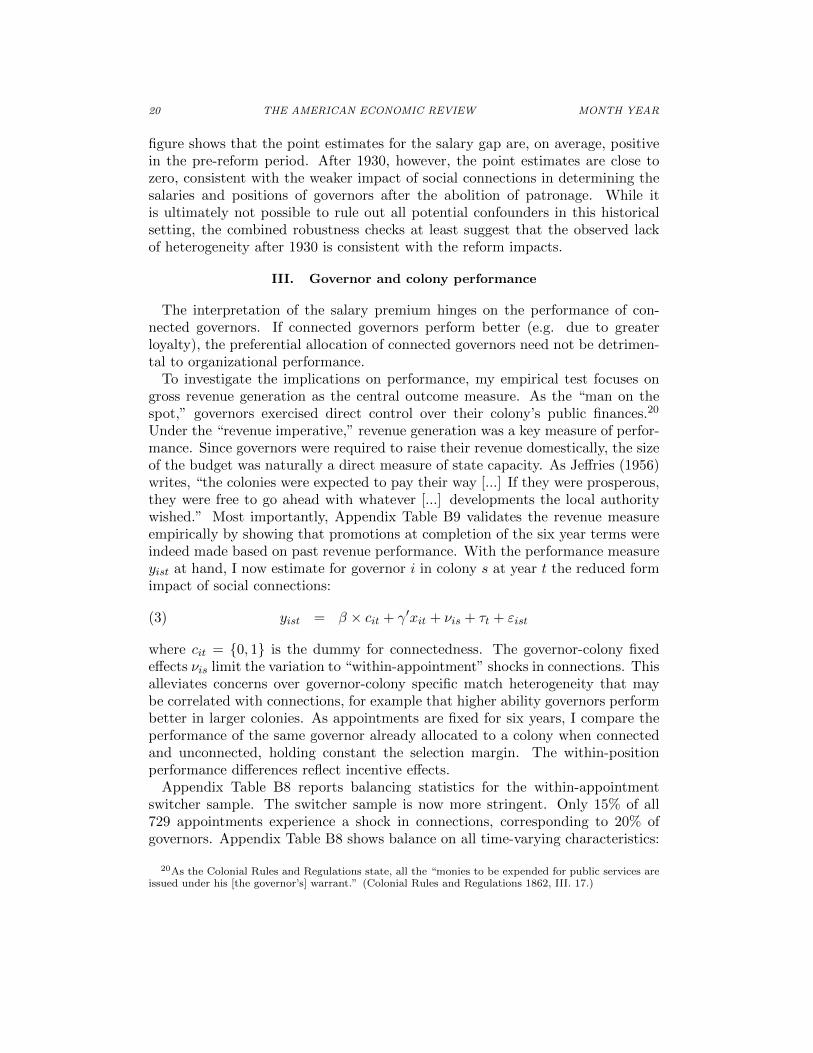
Figure 4. Salary gap and the removal of patronage (Warren Fisher Reform 1930)
Note: Difference in (log) salaries for connected and unconnected governors around the Warren FisherReform 1930 (solid vertical line). The salary gaps are estimated with an extension of specification (3),where connectedness is allowed to vary by five year bins. Reporting 90% confidence intervals.
Finally, Figure 4 provides visual evidence by plotting the salary gap for socialconnections around the reform. The focus around a narrow window ensures thatthe environment such as the number of colonies remains roughly constant overtime. The gap is estimated using an augmented version of (2) where the effectof social connections is allowed to vary by year bins. I choose five year bins toensure that each cell includes enough switchers to identify the coefficient. The
20 THE AMERICAN ECONOMIC REVIEW MONTH YEAR
figure shows that the point estimates for the salary gap are, on average, positivein the pre-reform period. After 1930, however, the point estimates are close tozero, consistent with the weaker impact of social connections in determining thesalaries and positions of governors after the abolition of patronage. While itis ultimately not possible to rule out all potential confounders in this historicalsetting, the combined robustness checks at least suggest that the observed lackof heterogeneity after 1930 is consistent with the reform impacts.
III. Governor and colony performance
The interpretation of the salary premium hinges on the performance of con-nected governors. If connected governors perform better (e.g. due to greaterloyalty), the preferential allocation of connected governors need not be detrimen-tal to organizational performance.
To investigate the implications on performance, my empirical test focuses ongross revenue generation as the central outcome measure. As the “man on thespot,” governors exercised direct control over their colony’s public finances.20
Under the “revenue imperative,” revenue generation was a key measure of perfor-mance. Since governors were required to raise their revenue domestically, the sizeof the budget was naturally a direct measure of state capacity. As Jeffries (1956)writes, “the colonies were expected to pay their way [...] If they were prosperous,they were free to go ahead with whatever [...] developments the local authoritywished.” Most importantly, Appendix Table B9 validates the revenue measureempirically by showing that promotions at completion of the six year terms wereindeed made based on past revenue performance. With the performance measureyist at hand, I now estimate for governor i in colony s at year t the reduced formimpact of social connections:
yist = β × cit + γ′xit + νis + τt + εist(3)
where cit = {0, 1} is the dummy for connectedness. The governor-colony fixedeffects νis limit the variation to “within-appointment” shocks in connections. Thisalleviates concerns over governor-colony specific match heterogeneity that maybe correlated with connections, for example that higher ability governors performbetter in larger colonies. As appointments are fixed for six years, I compare theperformance of the same governor already allocated to a colony when connectedand unconnected, holding constant the selection margin. The within-positionperformance differences reflect incentive effects.
Appendix Table B8 reports balancing statistics for the within-appointmentswitcher sample. The switcher sample is now more stringent. Only 15% of all729 appointments experience a shock in connections, corresponding to 20% ofgovernors. Appendix Table B8 shows balance on all time-varying characteristics:
20As the Colonial Rules and Regulations state, all the “monies to be expended for public services areissued under his [the governor’s] warrant.” (Colonial Rules and Regulations 1862, III. 17.)

VOL. VOL NO. ISSUE THE COSTS OF PATRONAGE 21
governors are as likely to experience a shock earlier on in their appointment aslater on. The probability of exit does not significantly vary by connectedness. Fi-nally, the inclusion of year fixed effects τt absorbs shocks common to all colonies.The errors εist are clustered at the governor-secretary level.21 As before, I esti-mate the regression using the full sample to obtain more precise estimates.
Table 5—Fiscal performance and connectedness to Secretary of State
Panel A: Revenue (1) (2) (3) (4)
Colony-level Public FinancePublic revenue
Overall Trade Internal
Mean of dep. var 12.31 12.31 11.47 11.59
Connected -0.040 -0.055 -0.053 -0.043
(0.017) (0.021) (0.026) (0.032)Connected × 0.061
Reform dummy (0.033)
Connected + Connected × - 0.005 - -
Reform dummy (0.026)Year FEs Yes Yes Yes Yes
Governor-Colony FEs Yes Yes Yes Yes
Spell length FEs Yes Yes Yes YesTime-varying controls Yes Yes Yes Yes
Observations 3,510 3,510 2,670 2,657
Panel B: Expenditure (5) (6) (7) (8)
Public expenditure
Overall Tax WorksMean of dep. var 12.33 12.37 9.015 10.32
Connected -0.029 -0.042 -0.089 -0.107(0.019) (0.023) (0.053) (0.062)
Connected × 0.053Reform dummy (0.034)
Connected + Connected × - 0.010 - -Reform dummy (0.025)
Year FEs Yes Yes Yes Yes
Governor-Colony FEs Yes Yes Yes YesSpell length FEs Yes Yes Yes Yes
Time-varying controls Yes Yes Yes YesObservations 3,510 3,510 1,742 2,588
Note: Unit of observation is the governor-year. Sample period 1854-1966. The dependent variable inPanel A is the (log) total revenue (Column 1-2), trade (customs) revenue (Column 3) and internal rev-enue (Column 4). Panel B reports the overall expenditure (Column 5-6), expenditures for tax/revenueservices (Column 7) and public works (Column 8). Columns 2 and 6 interact connectedness with areform dummy that is 1 after 1930. Connected is a dummy that is 1 if the governor is connected to theSecretary of State. Time-varying controls comprise the number of colonies the governor has served in.Spell length FEs are dummies for each year of the term. Standard errors in parentheses, clustered at thedyadic governor-secretary of state level.
Table 5 reports the performance results. Under patronage, governors performworse when connected to their superior. The same governor in the same colony
21Again, the results are robust to alternative clustering strategies. See Appendix Table B11.

22 THE AMERICAN ECONOMIC REVIEW MONTH YEAR
generates 4% lower annual revenue in years connected compared to years un-connected to the Secretary of State (Panel A, Column 1). Consistent with themitigating effect of the Warren Fisher reform on the salary gap, the negativeperformance gap vanishes after the abolition of patronage in 1930 (Column 2).22
Patronage hence impacts the revenue performance of colonies run by connectedgovernors, suggesting that the incentives of leaders can affect macroeconomicoutcomes.23
The remaining columns provide the breakdown of the aggregate revenue to shedlight on the nature of the observed fiscal reduction. For data quality reasons, thisanalysis is confined to a subsample: changing accounting standards often pre-vented the construction of comparable time-series. The main results, however,also apply to this subsample, thus alleviating concerns of sample selection. Ibreak down revenue by external and internal sources: external sources comprisetrade/customs taxes, while internal sources are primarily licenses and direct tax-ation (e.g. land revenue, hut/income taxes). Trade taxes are collected at entrypoints (e.g. a customs house at ports), while the collection of internal revenueis more decentralized. The decrease in revenue generation is primarily driven bya reduction in customs revenue, which make up the bulk of the colonial revenue(Table 1). The point estimate for internal revenue is negative but insignificant(Columns 3 to 4).
Turning to the expenditure side (Table 5, Panel B), the lower revenue gen-eration coincides with a decline in overall expenditure for connected governors,though the point estimate is statistically insignificant (Column 5). Once brokendown by reform period, however, the expenditure gap is statistically significant(Column 6). This suggests that the negative gap is once again driven by thepatronage period. The decline in public spending can be interpreted in two ways:first since colonies were self-financed under the Crown’s “revenue imperative”, thedecrease in revenue will necessarily translate into a decrease in public spending.Second, since spending public funds requires active effort, lower expenditures canalso be interpreted as a measure of performance. To that end, I also disaggregateexpenditures to study spending for revenue collection services and public works(Panel B, Columns 7 to 8). Observing differential spending on revenue collectionand infrastructure investments may provide further evidence for the underlyingmechanism that drives the decrease in revenue generation. As most of the ex-penditures are determined by the size of the bureaucracy fixed by the Crown,I focus on “extraordinary” spendings over which governors have purchase. Thedecrease in public investments in revenue collection is substantial: the point es-timate suggests a significant decrease by about 8.9%. For public works, there
22The reform effects are robust to the robustness checks conducted for the salary results (AppendixTable B13).
23While informative of relative performance differences, this empirical design does not shed light onwhether the connected (unconnected) governor is under-performing (over-performing). If the removalof patronage increased the overall revenue performance within the Colonial Office, the performance gapwould even underestimate the overall effect.

VOL. VOL NO. ISSUE THE COSTS OF PATRONAGE 23
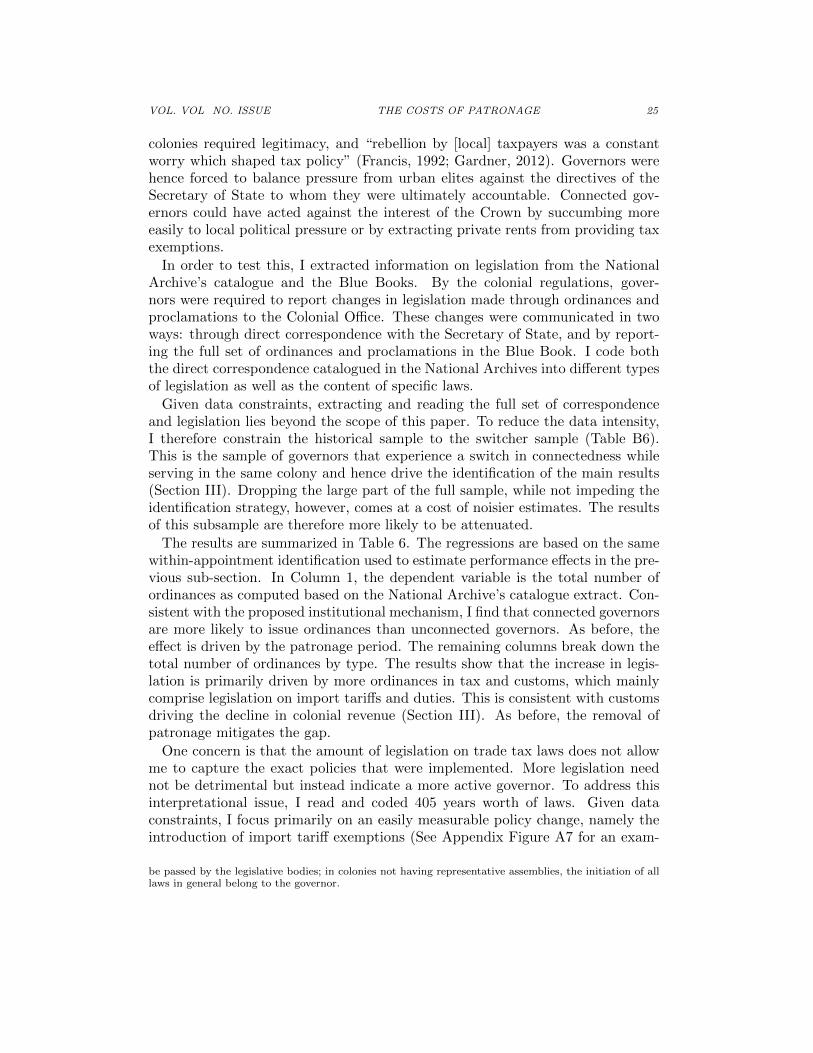
is a significant decrease by 10.7%. Connected governors, hence, decrease theirrevenue generation. Faced with a smaller budget, this translates into lower in-vestments in fiscal capacity and public works.24 Finally, Figure 5 summarizes theresults in an event study: shocks to connections have a contemporaneous impactbut also affect fiscal performance in subsequent years. In contrast, there is noevidence for anticipatory effects, with no impacts in periods preceding the shockto connections.
-.2-.1
0.1
.2lo
g di
ffere
nce
conn
ecte
d vs
. unc
onne
cted
-2 -1 0 1 2Leads and lags
Revenue Expenditure
Figure 5. Performance gap and connectedness - Event study
Note: Difference in (log) revenue/expenditure for connected and unconnected governors with leads andlags. 0 marks the year the governor becomes connected. Reporting 90% confidence intervals.
Three empirical patterns corroborate the interpretation of incentive effects.First, the sign of the incentive effect depends on whether connections and per-formance are complements or substitutes for promotions (Jia, Kudamatsu andSeim, 2015). Consistent with the negative performance gap, connections and per-formance are substitutes in the Colonial Office (Appendix Table B9).25 Second,the negative performance effect is largest among governors who are likely to facethe same connected Secretary of State at time of promotion. As Secretaries ofStates change, on average, every three years, a connected governor in the firsttwo years is unlikely to face the same Secretary of State by the end of the term.
24These results are robust when splitting the connected measures by family and alumni ties (AppendixB14).
25This difference also reconciles my results with Jia, Kudamatsu and Seim (2015) and Jia (2017) whofind a complementary role of connections and performance for promotions of Chinese governors.

24 THE AMERICAN ECONOMIC REVIEW MONTH YEAR
Indeed, the negative gap is only statistically significant in the later years of theterm (Appendix Figure A6). Finally, gaining a connection and losing a connec-tion has a symmetric effect (Appendix Table B15), consistent with connectionssubstituting for performance.26
One threat to the interpretation of the results is selective exit. In the absenceof a perfect compliance with the fixed six year term limit, the results could bespuriously driven by selective attrition: if connected governors, for example, aremore likely to be kept in their appointment when subsequent revenue performanceis low, the negative results may be driven by the fact that unconnected governorsnever stay in the colony when revenue grows. Three pieces of evidence, however,suggest that selective noncompliance with the six year term is unlikely to be amajor concern: first, as Table B8 shows, the probability of exit does not varywith connections.27 Second, the results do not change significantly when drop-ping those who are immediately moved after experiencing a shock to connections(Appendix Table B15).
Finally, for the observed negative performance effects to be spuriously drivenby the early termination of appointments requires that connected governors aremore likely to be moved when future revenue is high. To assess if such a data gen-erating process could have produced this spurious pattern, Appendix Table B16conducts a bounding exercise by filling in six year terms for early exits and usingdifferent assumptions for the counterfactual fiscal performance: (log) linearly ex-trapolating the trend and assuming that growth would have been 2% (4%) abovetrend. Consistent with the uncorrelatedness between shocks to connections andthe probability of early exit, the coefficients remain nearly unchanged.
A. Tax policy and exemptions
The revenue decline by 4% is striking. Indeed, there are many channels throughwhich connected governors may have impacted fiscal performance: connected gov-ernors could have exerted lower effort in monitoring, thereby increasing tax eva-sion. Similarly, connected governors could have also engaged in more corruptionby diverting revenue. Given the covert nature of such activities, however, it isinherently difficult to test specific channels.
To provide evidence for one observable channel, I examine whether the reductionis driven by actual changes in tax policy. As the Colonial Rules and Regulationstate, governors not only controlled public finances but enjoyed substantial dis-cretion to legislate on tax-related matters (Banton, 2008).28 Raising taxes in the
26Connectedness can also affect the ability of governors to communicate and coordinate effectivelywith the Secretary of State, which might increase performance. The negative incentive effects thereforeconstitute lower bounds.
27There is also no statistically significant difference in the survival curves for governors when connectedand unconnected (Appendix Figure A5).
28The colonial regulations of 1862 on the duties of the governor, for example, state: “The moneysto be expended for the public service are issued under his Warrant, as the law may in each particularcase direct; [The governor] has the power of granting or withholding his assent to any Bills which may
VOL. VOL NO. ISSUE THE COSTS OF PATRONAGE 25
colonies required legitimacy, and “rebellion by [local] taxpayers was a constantworry which shaped tax policy” (Francis, 1992; Gardner, 2012). Governors werehence forced to balance pressure from urban elites against the directives of theSecretary of State to whom they were ultimately accountable. Connected gov-ernors could have acted against the interest of the Crown by succumbing moreeasily to local political pressure or by extracting private rents from providing taxexemptions.
In order to test this, I extracted information on legislation from the NationalArchive’s catalogue and the Blue Books. By the colonial regulations, gover-nors were required to report changes in legislation made through ordinances andproclamations to the Colonial Office. These changes were communicated in twoways: through direct correspondence with the Secretary of State, and by report-ing the full set of ordinances and proclamations in the Blue Book. I code boththe direct correspondence catalogued in the National Archives into different typesof legislation as well as the content of specific laws.
Given data constraints, extracting and reading the full set of correspondenceand legislation lies beyond the scope of this paper. To reduce the data intensity,I therefore constrain the historical sample to the switcher sample (Table B6).This is the sample of governors that experience a switch in connectedness whileserving in the same colony and hence drive the identification of the main results(Section III). Dropping the large part of the full sample, while not impeding theidentification strategy, however, comes at a cost of noisier estimates. The resultsof this subsample are therefore more likely to be attenuated.
The results are summarized in Table 6. The regressions are based on the samewithin-appointment identification used to estimate performance effects in the pre-vious sub-section. In Column 1, the dependent variable is the total number ofordinances as computed based on the National Archive’s catalogue extract. Con-sistent with the proposed institutional mechanism, I find that connected governorsare more likely to issue ordinances than unconnected governors. As before, theeffect is driven by the patronage period. The remaining columns break down thetotal number of ordinances by type. The results show that the increase in legis-lation is primarily driven by more ordinances in tax and customs, which mainlycomprise legislation on import tariffs and duties. This is consistent with customsdriving the decline in colonial revenue (Section III). As before, the removal ofpatronage mitigates the gap.
One concern is that the amount of legislation on trade tax laws does not allowme to capture the exact policies that were implemented. More legislation neednot be detrimental but instead indicate a more active governor. To address thisinterpretational issue, I read and coded 405 years worth of laws. Given dataconstraints, I focus primarily on an easily measurable policy change, namely theintroduction of import tariff exemptions (See Appendix Figure A7 for an exam-
be passed by the legislative bodies; in colonies not having representative assemblies, the initiation of alllaws in general belong to the governor.

26 THE AMERICAN ECONOMIC REVIEW MONTH YEAR
ple). There are several reasons why this is particularly suitable. First of all,tariff exemptions are more systematically recorded and unambiguously reducetrade revenue. Identifying changes in exemptions is hence substantially easierthan computing the average tariff rates for all goods. Customs laws are also moreharmonized than tax laws, making it easier to compare policies across colonies.Additionally, import customs revenue is economically significant as it makes upmore than 50% of the revenue throughout the study period. Finally, importtaxes had a disproportionate impact on the settler elite as it was “mainly leviedon luxury items such as spirits, beer, wine, tobacco, fire-arms, gunpowder andmanufactured cloth” (Davis and Huttenback, 1986). Trade taxes thus have beena particularly contested margin of colonial tax policy, as perhaps famously knownin the Boston Tea Party rebellions against the Townshend import duties.29 The
Table 6—Tax ordinances, exemptions and connectedness to Secretary of State
(1) (2) (3) (4) (5) (6)
Legislation Broken down by ordinance typeordinances Direct tax Customs Exemptions Social Works
Mean of dep. var 0.020 0.0105 0.0140 0.226 0.012 0.00698
Connected 0.085 0.048 0.068 0.202 0.004 -0.011
(0.037) (0.031) (0.031) (0.063) (0.027) (0.019)Connected -0.083 -0.051 -0.066 -0.369 -0.003 0.013
× Reform dummy (0.037) (0.032) (0.031) (0.137) (0.029) (0.019)
Connected + Connected × 0.001 -0.003 0.002 -0.167 0.001 0.002
Reform dummy (0.005) (0.004) (0.004) (0.125) (0.005) (0.003)Year FE Yes Yes Yes Yes Yes Yes
Governor-Colony FEs Yes Yes Yes Yes Yes Yes
Spell length FEs Yes Yes Yes Yes Yes YesTime-varying controls Yes Yes Yes Yes Yes Yes
Data source National Archives Blue Book N. Arch.
Observations 573 573 573 405 573 573
Note: Unit of observation is the governor-year. The sample is restricted to the “switchers” of servinggovernors who experience a change in connections within the position. In Column 1, the dependentvariable is the number of ordinances issued, as recorded by the National Archive catalogue. Columns2-6 provide more detailed breakdowns. This is broken down by topic of the ordinances: tax related(Column 2), customs related (Column 3), social services (education, health, welfare) (Column 5) publicworks related (Column 6). Column 4 is a dummy that is 1 if an exemption was added to the importtariff schedule. Connected is a dummy that is 1 if the governor is connected to the Secretary of State.Reform dummy is a dummy that is 1 after 1930. Time-varying controls comprise the number of coloniesthe governor has served in. Spell length FEs are dummies for each year of the term. Robust standarderrors in parentheses, clustered at the dyadic governor-secretary of state level.
result is summarized in Column 4, where the dependent variable is a dummythat is 1 if the governor introduced a customs exemption in a given year and 0otherwise. Connected governors are more likely to legislate import exemptionsduring the period of patronage but not thereafter. Finally, connected governors
29Despite all efforts, the sample is smaller as it was not possible to obtain the tax legislation forall years. The results documented using the full sample, however, also apply to the smaller sample,alleviating concerns over selectivity.
VOL. VOL NO. ISSUE THE COSTS OF PATRONAGE 27
have no statistically discernible bearing on other legislation, such social programsencompassing education, health and welfare (Column 5) or public works (Column6), consistent with the fiscal channel uncovered.
B. Additional performance measures
Revenue generation may not be an adequate measure of governor performance.Lower revenue generation, for example, could indicate that connected governorsare less extractive. Under multitasking, connected governors may have also di-rected their efforts to other dimensions of performance which revenue does notcapture.
My analysis does not take a stance on whether revenue generation is detri-mental for the colonies. The focus instead lies on the principal-agent relationshipbetween governors and their superior. Since revenue generation was one of the de-clared duties of the governors, deviations from this objective can be interpreted aslower performance. To alleviate remaining concerns over the interpretation of therevenue measure, I corroborate the findings using additional performance proxies.In particular, I use newspaper reports of social unrests, sentiment analysis of par-liamentary debates and individual-level public awards to proxy for performance.To keep the exposition concise, I only briefly describe the outcome measures andrefer to the Appendix Section B.B3 for a detailed description.
I examine social unrest as an additional colony-level outcome. Uneven taxa-tion of the natives and dismal colony conditions have been associated with unrest,with the infamous Sierra Leonian Hut Tax riots of 1898 and the Jamaican MorantBay rebellion of 1865 as prominent examples. I use the reports of riots in UKnewspapers to proxy for social unrest. This has several advantages. First, itenables the measurement of conflict in a consistent way as colonial conflict datais largely absent. Second, while reported unrests may not capture all unrests inthe colony, the visibility of colony conditions in London explicitly captures theprincipal-agent relationship: bad news about a colony in the domestic press islikely to reflect poorly on the Secretary of State. Following the same logic, I text-mine parliamentary debates in London. As Secretaries of State were themselvesaccountable to the parliament, observing a large number of discussions over agiven colony and its associated sentiment can be seen as an alternative perfor-mance measure. For this purpose, I extracted all parliamentary debates between1855-1966 during which a given colony was mentioned. For each of the mentions,I compute the sentiment using standard text mining procedures.30 The algorithmassigns sentiment scores to text passages, where a negative score indicates a morenegative sentiment. Finally, for awards as an individual-level performance mea-sure, I focus on the highest awards, the Knight Grand Cross for the Order of St.Michaels and the Order of Bath (GCMG/GCB). These awards were introduced
30The sentiment analysis is implemented using R’s qdap polarity. See Appendix B.B3 for a detaileddescription.

28 THE AMERICAN ECONOMIC REVIEW MONTH YEAR
by the Crown in 1818 as part of an honors system to recognize the outstandingperformance of public servants in the colonies. The recommendation is made bythe Secretary of State, but the final approval is made by the Crown. Table 7
Table 7—Alternative performance measures and connectedness
(1) (2) (3) (4)
Social Parliamentary debates Highestunrest Mentioned Sentiment award
Mean of dep. var 0.049 0.724 0.097 0.021
Connected 0.038 0.029 -0.045 -0.031
(0.022) (0.028) (0.024) (0.015)Connected -0.037 -0.040 0.039 -0.007
× Reform dummy (0.022) (0.031) (0.029) (0.028)
Connected + Connected × 0.001 -0.010 -0.006 -0.037
Reform dummy (0.002) (0.015) (0.016) (0.024)Year FE Yes Yes Yes Yes
Governor-Colony FEs Yes Yes Yes Yes
Spell length FEs Yes Yes Yes YesTime-varying controls Yes Yes Yes Yes
Data source News Hansard Who’s Who
Observations 3,510 3,510 2,481 3,510
Note: Unit of observation is the governor/state-year. Sample period 1854-1966. Dependent variables area dummy for reported unrests in London newspapers (Column 1), whether a colony has been mentionedin the parliamentary debates (Column 2), the mean sentiment in the debates (Column 3) and a dummyfor being awarded a GCMG/GCB, the highest distinction class (Column 4). Connected is a dummy thatis 1 if the governor is connected to the Secretary of State. Reform dummy is a dummy that is 1 after1930. Robust standard errors in parentheses, clustered at the dyadic governor-secretary of state level.
summarizes the results using alternative measures of performance. To be consis-tent, I use the same double-differences specification as in (3). In column 1, thedependent variable is a dummy that is 1 if a social unrest was reported in the UKnewspapers. The estimate suggests that colonies of connected governors are 3.8%points more likely to have social unrest reported during the period of patronage.As before, this gap vanishes after the removal of patronage. Columns 2 to 3 re-port evidence from parliamentary debates. On average, colonies with connectedgovernors are mentioned more than those with unconnected governors in a givenyear, though the estimate is not statistically significant (Column 2). The asso-ciated sentiment, however, is significantly less likely to be positive (Column 3).Consistent with previous results, this negative sentiment gap vanishes after theremoval of patronage. Finally, the dependent variable in Column 4 is a dummythat is 1 if the governor received the Knight Grand Cross. The estimate suggeststhat connected governors are 3.1% points less likely to receive the highest award.Compared to the mean of the dependent variable (2%), the decrease is econom-ically large. These findings, combined with the fiscal performance results, thusprovide a coherent picture consistent with the lower performance of connectedgovernors.
VOL. VOL NO. ISSUE THE COSTS OF PATRONAGE 29
IV. Conclusion
For much of human history, bureaucrats have been allocated based on dis-cretionary appointments. It was through the seminal thinking of Weber (1922)and landmark contributions like Northcote-Trevelyan (1854) and Warren Fisher(1930) that this practice has been curtailed and modern professional bureaucraciesdeveloped. Despite numerous civil service reforms, the use of patronage in ap-pointing civil servants remains widespread today. Whether or not discretionaryappointments undermine government effectiveness and state capacity, however,remains an open question and theory is ambiguous about this issue.
My paper contributes to answering this question. I undertook a large-scaledigitization of colonial records to construct a unique dataset that matches per-sonnel records with public finance data of all British territories administered bythe Colonial Office from its birth in 1854 to its dissolution in 1966. Two sourcesof variation are critical for my analysis. The first source of variation stems fromobserving how connected governors and colonies are linked to the Secretary ofState in London. The second source of variation is the Warren Fisher Reformof 1930 which removed the full discretion of the Secretary of State to appointgovernors. Combining changes in connections to the Secretary of State with theintroduction of the Warren Fisher Reform enables me to study whether differ-ences in the promotion and performance of socially connected bureaucrats varywith the extent of discretionary appointments.
My data and empirical setup is particularly relevant as governors were admin-istrative leaders of the colonies. I am hence able to examine whether or notpatronage had costs by affecting the revenue performance of these territories dur-ing the colonial period. This paper therefore goes beyond the existing body ofliterature that focuses on lower level bureaucrats and front-line providers who areunlikely to have discernible effects on macroeconomic outcomes.
Two key findings emerge from my analysis. First, I find that governors whenconnected to the Secretary of State enjoy higher salaries through the promotion tohigher paid and larger colonies. This salary premium only appears in the periodbefore the discretionary power of the Secretary of State in appointing governorswas curtailed. Second, even when examining the same governor in the sameposition, I find that the colony’s revenue performance declines in years duringwhich the governor is connected to the Secretary of State. This is consistent withthe interpretation that patronage exerts a negative effect on the performanceof socially connected governors. Consistent with the previous result, the fiscalperformance gap disappears after the removal of patronage. While the studyprovides evidence on how favoritism in promotions can affect the incentives ofgovernors, a limitation is that the research design is not able to shine light onselection effects. Future work could therefore focus on exploring the combinationof incentive, selection and match effects to expand our knowledge about the fullcosts of patronage.
30 THE AMERICAN ECONOMIC REVIEW MONTH YEAR
REFERENCES
Acemoglu, Daron, Camilo Garcia-Jimeno, and James A. Robinson.2015. “State Capacity and Economic Development: A Network Approach.”American Economic Review, 105(8): 2364–2409.
Acemoglu, Daron, Simon Johnson, and James A. Robinson. 2001. “TheColonial Origins of Comparative Development: An Empirical Investigation.”American Economic Review, 91(5): 1369–1401.
Aghion, Philippe, and Jean Tirole. 1997. “Formal and Real Authority inOrganizations.” Journal of Political Economy, 105(1): 1–29.
Ashraf, Nava, and Oriana Bandiera. 2017. “Social Incentives in Organiza-tions.” In preparation for the Annual Review of Economics.
Bandiera, Oriana, Iwan Barankay, and Imran Rasul. 2009. “Social Con-nections and Incentives in the Workplace: Evidence From Personnel Data.”Econometrica, 77(4): 1047–1094.
Bandiera, Oriana, Iwan Barankay, and Imran Rasul. 2010. “Social Incen-tives in the Workplace.” Review of Economic Studies, 77(2): 417–458.
Banerjee, Abhijit, Raghabendra Chattopadhyay, Esther Duflo, DanielKeniston, and Nina Singh. 2012. “Improving Police Performance in Ra-jasthan, India: Experimental Evidence on Incentives, Managerial Autonomyand Training.” NBER Working Papers 17912.
Banton, Mandy. 2008. Administering the Empire, 1801-1968: A Guide to theRecords of the Colonial Office in the National Archives of the UK. Universityof London, Institute of Historical Research.
Bertrand, Marianne. 2009. “CEOs.” Annual Review of Economics, 1(1): 121–150.
Bertrand, Marianne, and Antoinette Schoar. 2003. “Managing with Style:The Effect of Managers on Firm Policies.” The Quarterly Journal of Economics,118(4): 1169–1208.
Besley, Timothy, and Torsten Persson. 2009. “The Origins of State Ca-pacity: Property Rights, Taxation, and Politics.” American Economic Review,99(4): 1218–44.
Besley, Timothy, and Torsten Persson. 2010. “State Capacity, Conflict, andDevelopment.” Econometrica, 78(1): 1–34.
Bourne, John M. 1986. Patronage and Society in Nineteenth-century England.Edward Arnold.
VOL. VOL NO. ISSUE THE COSTS OF PATRONAGE 31
Breza, Emily. 2016. “Field Experiments, Social Networks, and Development.”Oxford Handbook on the Economics of Networks.
Brollo, Fernanda, Pedro Forquesato, and Juan-Carlos Gozzi. 2017. “Tothe Victor Belongs the Spoils? Party Membership and Public Sector Employ-ment in Brazil.” Mimeo.
Dal Bo, Ernesto, Frederico Finan, and Martin A. Rossi. 2013. “Strength-ening State Capabilities: The Role of Financial Incentives in the Call to PublicService.” The Quarterly Journal of Economics, 128(3): 1169–1218.
Dal Bo, Ernesto, Frederico Finan, Olle Folke, Torsten Persson, andJohanna Rickne. 2017. “Who becomes a politician?” The Quarterly Journalof Economics, 132(4): 1877–1914.
Davis, Lance E., and Robert Huttenback. 1986. Mammon and the Pursuit ofEmpire: The Political Economy of British Imperialism, 1860-1912. CambridgeUniversity Press.
Deserranno, Erika. 2018. “Financial Incentives as Signals: Experimental Ev-idence from the Recruitment of Village Promoters in Uganda .” ForthcomingAmerican Economic Journal: Applied Economics.
Dewatripont, Mathias, Ian Jewitt, and Jean Tirole. 1999. “The Economicsof Career Concerns, Part II: Application to Missions and Accountability ofGovernment Agencies.” Review of Economic Studies, 66(1): 199–217.
Dijkstra, Edsger W. 1959. “A note on two problems in connexion with graphs.”Numerische Mathematik, 1(1): 269–271.
Finan, Frederico, Benjamin A. Olken, and Rohini Pande. 2015. “ThePersonnel Economics of the State.” NBER Working Paper 21825.
Fisman, Raymond. 2001. “Estimating the Value of Political Connections.”American Economic Review, 91(4): 1095–1102.
Francis, Mark. 1992. Governors and Settlers: Images of Authority in the BritishColonies, 1820-60. Canterbury University Press.
Gardner, Leigh. 2012. “Taxing Colonial Africa: The Political Economy ofBritish Imperialism.” Oxford University Press.
Gibbons, Robert, and John Roberts. 2012. The Handbook of OrganizationalEconomics. . 1 ed., Princeton University Press.
Grindle, Merilee. 2012. Jobs for the Boys: Patronage and the State in Com-parative Perspective. Harvard University Press.
32 THE AMERICAN ECONOMIC REVIEW MONTH YEAR
Henn, Brenna, Lawrence Hon, Michael Macpherson, Nick Eriksson,Serge Saxonov, Itsik Pe’er, and Joanna Mountain. 2012. “Cryptic Dis-tant Relatives Are Common in Both Isolated and Cosmopolitan Genetic Sam-ples.” PLoS One, 7(4).
Iyer, Lakshmi, and Anandi Mani. 2012. “Traveling Agents: Political Changeand Bureaucratic Turnover in India.” The Review of Economics and Statistics,94(3): 723–739.
Jeffries, Charles. 1938. The Colonial Empire and its Civil Service. CambridgeUniversity Press.
Jia, Ruixue. 2017. “Pollution for Promotion.” mimeo.
Jia, Ruixue, Masayuki Kudamatsu, and David Seim. 2015. “Political Se-lection in China: The Complementary Roles of Connections and Performance.”Journal of the European Economic Association, 13(4): 631–668.
Jones, Benjamin F., and Benjamin A. Olken. 2005. “Do Leaders Matter?National Leadership and Growth Since World War II.” The Quarterly Journalof Economics, 120(3): 835–864.
Khan, Adnan Q., Asim I. Khwaja, and Benjamin A. Olken. 2015. “TaxFarming Redux: Experimental Evidence on Performance Pay for Tax Collec-tors.” The Quarterly Journal of Economics.
Khan, Adnan Q., Asim I. Khwaja, and Benjamin A. Olken. 2018.“Making Moves Matter: Experimental Evidence on Incentivizing Bureaucratsthrough Performance-Based Postings.” NBER Working Paper 24383.
Kirk-Greene, Anthony. 2000. Britain’s Imperial Administrators, 1858-1966.Palgrave Macmillan.
Kramarz, Francis, and David Thesmar. 2013. “Social Networks in theBoardroom.” Journal of the European Economic Association, 11(4): 780–807.
Laidlaw, Zoe. 2005. Colonial Connections 1815-1845: Patronage, the Informa-tion Revolution and Colonial Government. Studies in Imperialism, ManchesterUniversity Press.
Lazear, Edward P., and Paul Oyer. 2012. “Personnel Economics.” InThe Handbook of Organizational Economics. , ed. Robert Gibbons and JohnRoberts. Princeton University Press.
Northcote, Stafford H., and Charles E. Trevelyan. 1854. Report on theOrganization of the Permanent Civil Service. HMS.
Persson, Petra, and Ekaterina Zhuravskaya. 2016. “The Limits of CareerConcerns in Federalism: Evidence from China.” Journal of the European Eco-nomic Association, 14(2): 338–374.

VOL. VOL NO. ISSUE THE COSTS OF PATRONAGE 33
Prendergast, Canice, and Robert H. Topel. 1996. “Favoritism in Organi-zations.” Journal of Political Economy, 104(5): 958–78.
Rasul, Imran, and Daniel Rogger. 2017. “Management of Bureaucrats andPublic Service Delivery: Evidence from the Nigerian Civil Service.” The Eco-nomic Journal, 1–34.
Teso, Edoardo, Emanuele Colonnelli, and Mounu Prem. 2017. “Patronagein the Allocation of Public Sector Jobs.” mimeo.
Weaver, Jeff. 2018. “Jobs for Sale: Bribery and Misallocation in Hiring.” Mimeo.
Weber, Max. 1922. Wirtschaft und Gesellschaft. Mohr Verlag.