Embed Size (px)
Citation preview
The Costs of College Attendance:
Examining Variation and Consistency in Institutional Living Cost
Allowances*
Robert Kelchen
Assistant Professor, Department of Education Leadership, Management and Policy
Seton Hall University
Sara Goldrick-Rab
Professor, Department of Policy, Organizational, and Leadership Studies
Founding Director, Wisconsin HOPE Lab
Temple University
Braden Hosch
Assistant Vice President, Office of Institutional Research, Planning and Effectiveness
Stony Brook University
December 2016
This is an Accepted Manuscript of an article published by Taylor & Francis in The Journal of
Higher Education on March 9, 2017, available at
http://www.tandfonline.com/doi/full/10.1080/00221546.2016.1272092
Keywords: Cost of attendance, living expenses, financial aid
Abstract: Discussions of college costs often focus on tuition and fees but living cost allowances
for room, board and other expenses account for more than half of the total cost of attending
college. The allowances, developed by colleges and universities, also affect student eligibility for
federal financial aid and the accuracy of accountability systems. This paper examines
institutional variation in living cost allowances and assesses the consistency of allowances by
comparing them to living cost estimates specific to the college’s region. Results across multiple
specifications indicate that nearly half of all colleges provide living allowances at least 20%
above or below estimated county-level living expenses.
*The authors thank participants in a September 2014 Lumina Foundation convening on living
costs for useful feedback. The Great Lakes Higher Education Guaranty Corporation, through a
gift to the Wisconsin HOPE Lab, provided financial support for this work.
RUNNING HEAD: THE COSTS OF COLLEGE ATTENDANCE
The high price of attending college is a significant concern for many American families,
and both perceived and real difficulty paying for college impedes college attainment, especially
for low and moderate-income students (e.g., Castleman & Long, 2016; Goldrick-Rab, 2016;
Goldrick-Rab, Kelchen, Harris, & Benson, 2016). Policymakers across the country are working
to reduce the price of college attendance with state-subsidized tuition and financial aid (e.g.,
Tennessee Promise, 2015; The White House, 2015). They are also trying to help families more
accurately understand and prepare for the price they will have to pay for college degrees (e.g.,
U.S. Department of Education, n.d.).
Success in these efforts partly depends on institutional behavior in setting college prices.
The federal government requires every college and university to state a sticker price, known as
the institution’s “Cost of Attendance” (COA). Tuition and fees are the most often discussed
aspect of the price of higher education, but they constitute less than half of the COA across
sectors of higher education, including just 30 percent at public community colleges and 40
percent at public 4-year colleges and universities (authors’ calculations using data from the
Integrated Postsecondary Education Data System). The remaining COA, according to federal
law, includes the cost of books, supplies, and a living cost allowance designed to cover room,
board, and other expenses such as transportation, entertainment, and cleaning supplies (Federal
Student Aid, 2014a). All students pay this price, even when living off-campus or with family.
Since there is no single “true” price of college, the COA is an estimate and the living cost
allowance drives much of that estimate. The method for producing that allowance is not
standardized and given that devolution of responsibility, institutions employ different practices to
RUNNING HEAD: THE COSTS OF COLLEGE ATTENDANCE
determine the COA. It is possible for this variation to contribute to inequities in where students
attend and complete college by affecting perceived affordability, actual financial need, and
student debt. While there are many studies on trends in tuition and fees and how these vary
across institutions and regions (e.g. Archibald & Feldman, 2011; Reynolds, 2014) and several
studies of the costs associated with textbooks (Cousteau, 2013; U.S. Government Accountability
Office, 2013), we are not aware of any rigorous research examining how living cost allowances
vary across colleges and universities. Moreover, there is very little available information on how
consistent or inconsistent institutional estimates of the cost of living are with other measures
available for their geographic area. This is, we believe, the first paper to examine the contours of
this unstructured part of the American higher education financing system.
While in theory colleges and universities should seek to list a precise and consistent
price, including an appropriate living cost estimate, there are many reasons why there might be
variation and inconsistencies in practice within the same geographic area. For example, although
financial aid offices may wish to conduct research to construct accurate estimates, they are often
burdened with large student caseloads and meeting federal regulatory requirements (e.g.,
Goldrick-Rab, 2016; McKinney & Roberts, 2012). This means that living allowance estimates
may be based on a convenience sample of students or may not be updated in response to changes
in local housing prices. Colleges in the same geographic area may have different living
allowances due to specific student populations or special missions that necessitate particular
living circumstances, or constrained local housing conditions.
RUNNING HEAD: THE COSTS OF COLLEGE ATTENDANCE
Another explanation for variation in living allowances is that institutions may adjust their
prices in response to specific incentives. Tuition and fees are difficult to adjust due to their
visibility and because public institutions in most states share tuition-setting authority with
coordinating boards and/or politicians, making tuition more difficult to manipulate (Carlson,
2013). A college that wishes to appear less expensive (for example because of state or federal
accountability systems or public scrutiny) can instead reduce its living cost allowance. Media
stories suggest that some institutions may have gamed accountability systems in this manner
(Newman, 2014). Alternatively, since financial aid eligibility is usually capped by the cost of
attendance, a lower living cost allowance is a way to limit the size of loans that students can
borrow and the amount of unmet financial need they appear to have. For-profit colleges and
universities and community colleges, both of which serve large numbers of economically
disadvantaged students, face incentives to reduce their exposure to federal student loans in order
to lessen the risk of facing sanctions due to high default rates (Federal Student Aid, 2014b).
Colleges may face incentives to increase their living allowances. For-profit colleges are
required to receive at least 10% of total revenue from non-federal sources (through the ‘90/10
rule’), and thus may wish to increase the price beyond what students can borrow in federal loans.
The former chairman of Corinthian Colleges, once one of the largest for-profit college chains,
openly admitted increasing the COA to make sure students took out enough private loans to
satisfy the 90/10 rule (Massimino, 2011). However, colleges must balance this concern against
pressures to keep default rates at acceptable levels. A new pressure comes from a 2015 decision
allowing college athletes to receive scholarships that include an allowance for miscellaneous
RUNNING HEAD: THE COSTS OF COLLEGE ATTENDANCE
expenses such as transportation and laundry. This has led some colleges with athletics programs
in major conferences to increase their COA as a recruitment strategy (New, 2015).
Students and families assess their ability to pay for college and plan for how to pay for it
using the COA, or the derivative net price (defined as the COA less any grant aid received). As
students often rule out colleges based on the sticker price (College Board and Art & Science
Group, 2012; Rowan-Kenyon, Bell, & Perna, 2008), the introduction of misinformation (driven
by inaccurate living costs) may reduce the likelihood of appropriate matches between students
and schools. Moreover—and more importantly—since the list price constrains the amount of
federal, state, and institutional financial aid a student can receive, consistency in pricing is a key
aspect of college affordability. If a school understates the actual living costs in an area, students
may receive less financial aid than needed to cover expenses, and face difficulties in paying for
college (Goldrick-Rab, 2016). In turn, this could affect graduation rates, which are often a metric
for how public institutions are assessed (Dougherty & Natow, 2015).
In what follows, we examine trends in reported living cost allowances by year,
institutional sector, and reporting status (academic year versus individual program reporters).
Then, we consider the amount of variation in reported living cost allowances among colleges by
urbanicity. Finally, we examine the extent to which institutional living cost allowances are
consistent with living cost estimates derived from county-level expenditure data. Heterogeneity
in these estimates according to assumptions about students’ housing situations is also examined.
The paper concludes with a discussion of the implications of the findings for the perceived and
actual affordability of American higher education.
RUNNING HEAD: THE COSTS OF COLLEGE ATTENDANCE
Debates and Research on Undergraduate Living Costs
The federal definition of what college costs has included living costs ever since the
federal financial aid system began in 1965. Monthly subsistence payments for living costs were
made to veterans in the original G.I Bill and continue today, in recognition that it is difficult to
make ends meet while also spending time in class and studying (Goldrick-Rab, Schudde, &
Stampen, 2014). In the 1940s, when veterans reported that the subsistence payments were
inadequate, the government responded by increasing them (Mettler, 2005). Yet disagreements
persist about whether or not living costs should be included as part of the costs of attending a
particular college or university. While at least some living expenses would be incurred regardless
of whether a student is enrolled in postsecondary education (Dynarski, 2000; Jackson & Pogue,
1983), the main contention is whether students should have access to federal, state, and
institutional grant or loan aid to help cover those costs (Mitchell, 2014; Sheehy, 2013).
A central tension in this discussion is the extent to which living costs reflect actual local
costs and the extent to which they are due to “personal lifestyle choices” that are nonessential for
ensuring degree completion. What adjustments should be made for the specific circumstances
of undergraduate life—for example, the need to devote as much time as possible to schooling
rather than work or commuting? Is a “ramen diet, ” in which students frequently eat inexpensive
(and unhealthy) ramen noodles in an effort to save money an acceptable part of student life (e.g.,
Wilkinson, 2014), or should the healthy eating behaviors encouraged among younger students
apply to undergraduates as well? Discussion of these conflicts are scattered throughout literature
RUNNING HEAD: THE COSTS OF COLLEGE ATTENDANCE
on college affordability, but are rarely directly examined or discussed (Goldrick-Rab, 2016;
Goldrick-Rab & Kendall, 2014).
What is clearer is that unanticipated financial challenges can derail college plans,
particularly for undergraduates from low- and moderate-income families (Broton, Frank, &
Goldrick-Rab, 2014; Goldrick-Rab, 2016; Ziskin, Fischer, Torres, Pellicciotti, & Player-Sanders,
2014). When students run out of money from financial aid before the end of the academic term,
they have to make difficult choices about whether they can continue their schooling (Ware,
Weissman, & McDermott, 2013). When a car breaks down or a child needs medicine, they have
to choose whether to continue allocating their limited resources towards their college education.
The adequacy of living cost allowances, therefore, may matter most to students with fewer
resources, who are also at greater risk of not completing college.
The responsibility for estimating living costs, and in this way controlling access to
federal, state, institutional, and private financial aid dollars, is devolved to institutions. This
authority most often resides with financial aid administrators, who typically report to directors of
enrollment management and/or provosts. Federal rules provide flexibility in how financial aid
administrators determine the COA, and allow for practices ranging from the use of student
surveys and conversations with local landlords (Federal Student Aid, 2014a). While they receive
some additional guidance through a handbook compiled by their professional organization, the
National Association of Student Financial Aid Administrators (2014), these “frontline workers”
exercise much authority and bureaucratic discretion in determining COA. While this can enhance
effectiveness, for example by ensuring that local contexts and needs are considered, it also
RUNNING HEAD: THE COSTS OF COLLEGE ATTENDANCE
creates the potential for harmful forms of inequity (Fording, Soss, & Schram, 2007; Soss,
Fording, & Schram, 2011). It is important, therefore, to know how living cost allowances trend
over time, how much variation there is across colleges and universities, and how consistent
institutional estimates are, especially within college markets.
Guides and Principles for Cost of Attendance Estimation
The Federal Student Aid Handbook for 2014-2015, which is published by the U.S.
Department of Education to guide financial aid administrators, simply states, “There are a variety
of methods to arrive at average costs for your students: periodic surveys of your student
population, assessing local housing costs or other pertinent data, or otherwise use reasonable
methods you may devise which generate accurate average costs for various student cohorts”
(Federal Student Aid, 2014a, p. 3-35). While the aim is clearly for the aid administrator to utilize
a representative sample of the student body, the technical and financial capacities of the financial
aid office often dictate actual practice.
NASFAA has a monograph titled “Developing the Cost of Attendance” to help financial
aid administrators create reasonable student budgets with a “modest but adequate” standard of
living for students while taking regional variations in living expenses into account (NASFAA,
2014, p. 2). The NASFAA guidance states that an aid administrator should be consistent across
student populations and must document the process of developing a standard COA, along with
documentation of any adjustments to COA made on a case-by-case basis using professional
judgment. There is a clear attempt to ensure that the estimates apply to the average student:
RUNNING HEAD: THE COSTS OF COLLEGE ATTENDANCE
“The COA should reflect typical expenses encountered by students in general, and
research is usually conducted using a representative sample of the entire student body. As
a general rule, COAs are developed separately for groups of students facing similar types
of expenditures. This recognizes the diversity of the student population, reduces possible
anomalies in COAs, and assists the financial aid administrator by reducing the number of
students for whom exceptional expenses must be documented (p. 3).”
The guidance for the housing portion of COA is “based on reasonable expenses for the student”
(NASFAA, 2014, p. 6). It is up to financial aid administrators at individual campuses to
determine whether housing costs should be based on living alone or with roommates. In
addition, the allowance for meals “should provide for reasonable costs essential to provide a
nutritionally adequate diet for the student” (NASFAA, 2014, p. 6).
The U.S. Department of Education does not have any rules for how living costs are
determined, leaving control of those methods to individual institutions. NASFAA (2014)
recommends the use of state or regional living cost surveys, data from the Bureau of Labor
Statistics, and information from professional financial aid associations, but does not specify
particular surveys or data sets.1 NASFAA (2014, p. 3) states the administrator “can decide
whether the information is sufficient to construct reasonable costs of attendance or if the
institution must conduct new research or a survey.” NASFAA suggests numerous ways to
compile data, including student surveys and interviews, budget logs, and conversations with off-
campus partners such as landlords and social service agencies. NASFAA’s reference list also
RUNNING HEAD: THE COSTS OF COLLEGE ATTENDANCE
includes information for two studies of student expense budgets published in the 1970s
(Bowman, 1975; 1976).
Thus, guidance given to aid administrators prioritizes the reports of students who
participate in surveys over standardized information. It further recommends the validation of
student-reported information by unnamed local sources. It also conflates necessary expenditures
with reported costs. If students are under-resourced and thus eliminating key expenses, for
example by reducing food intake, surveys of expenditures will under-estimate actual costs. If
they are living in unnecessarily luxurious circumstances, expenditures will be over-stated. The
collection of both accurate cost and accurate expenditure information is notoriously difficult and
error-prone (Zhen, Taylor, Muth, & Leitbag, 2009) and female, higher-achieving, and higher-
income students are more likely to respond to surveys (Laguilles, Williams, & Saunders, 2011;
Porter & Whitcomb, 2005), which could mean that the sample results do not generalize to the
full student body. Yet financial aid administrators are not required to possess any special training
or engage consultants for this work that is added to their already demanding workloads.
Living cost allowances vary according to where students reside during school. More
specifically, institutions report to the federal government the allowances for room and board
based on whether a student lives on-campus or off-campus away from their family, and may also
report a separate allowance if the student resides with his or her parents.2 Students with unusual
circumstances may also receive what is known as a professional judgment, in which the financial
aid administrator can adjust living allowances at the request of the student if circumstances
warrant. The potential range of costs incurred by students in seemingly similar off-campus living
RUNNING HEAD: THE COSTS OF COLLEGE ATTENDANCE
situations receives little attention. This may generate additional variation across colleges as the
range of available housing options expands, particularly where driven by the privatization of the
student housing market (e.g., Eligon, 2013).
Financial aid administrators receive little guidance regarding whether they should assume
students living off-campus live with roommates in an effort to lower costs. Prior to December
2014, the official guidance provided by NASFAA made no mention of roommates. However,
NASFAA (2014, p. 6) added language stating that aid administrators “often assume that a single
student will share costs if he or she lives off-campus, but may have separate allowances for
married students or students with dependents because the opportunity to share with another
student is reduced.” This raises the possibility that colleges in similar geographic areas may have
different living allowances either due to assumptions made by financial aid administrators or due
to different characteristics of their student bodies.
Another potential concern with institutional living allowance estimates is that they are
sometimes made at the system level instead of the institutional level, implicitly assuming that
living costs are the same for colleges located hundreds of miles away from each other. For
example, all community colleges in Indiana and Kentucky and each of the Pennsylvania State
University campuses (including their World Campus) had the same estimated room and board
allowance for off-campus students in 2013-14. Some of the largest for-profit chains, such as ITT
Technical Institute, and the University of Phoenix, also had the same allowances across all of
their campuses regardless of local living costs. This approach can result in some campuses of a
RUNNING HEAD: THE COSTS OF COLLEGE ATTENDANCE
particular college having higher allowances than necessary, while others end up with insufficient
allowances.
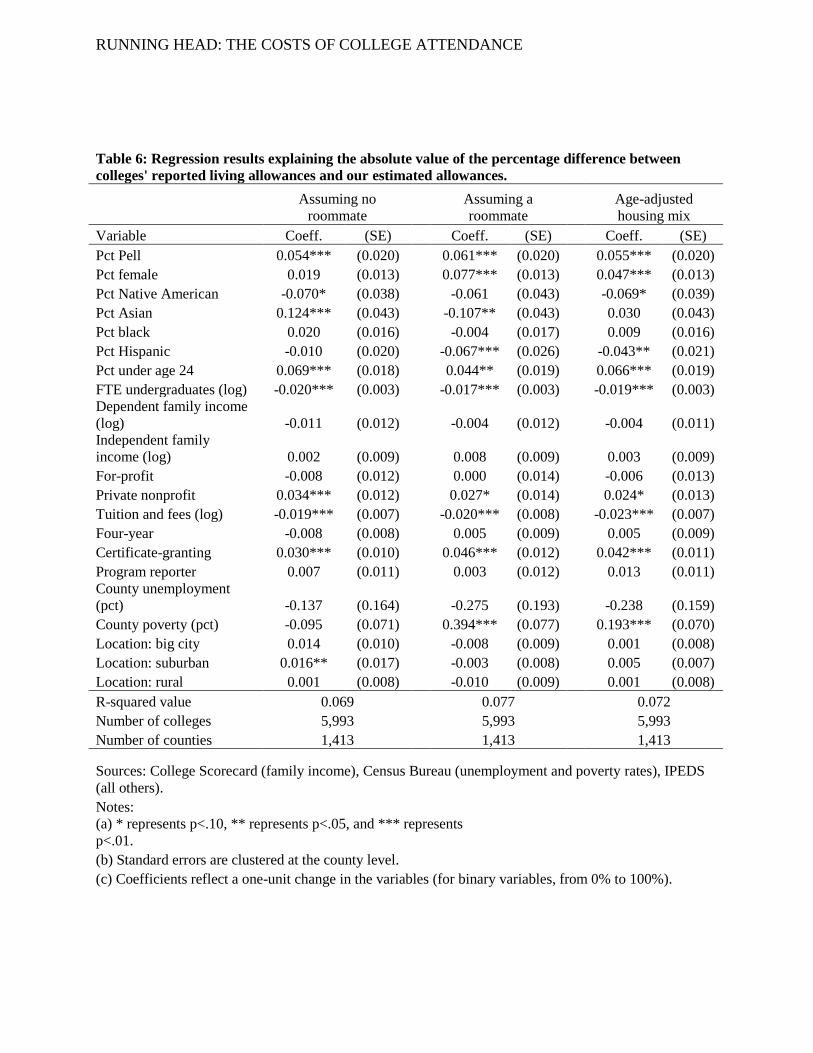
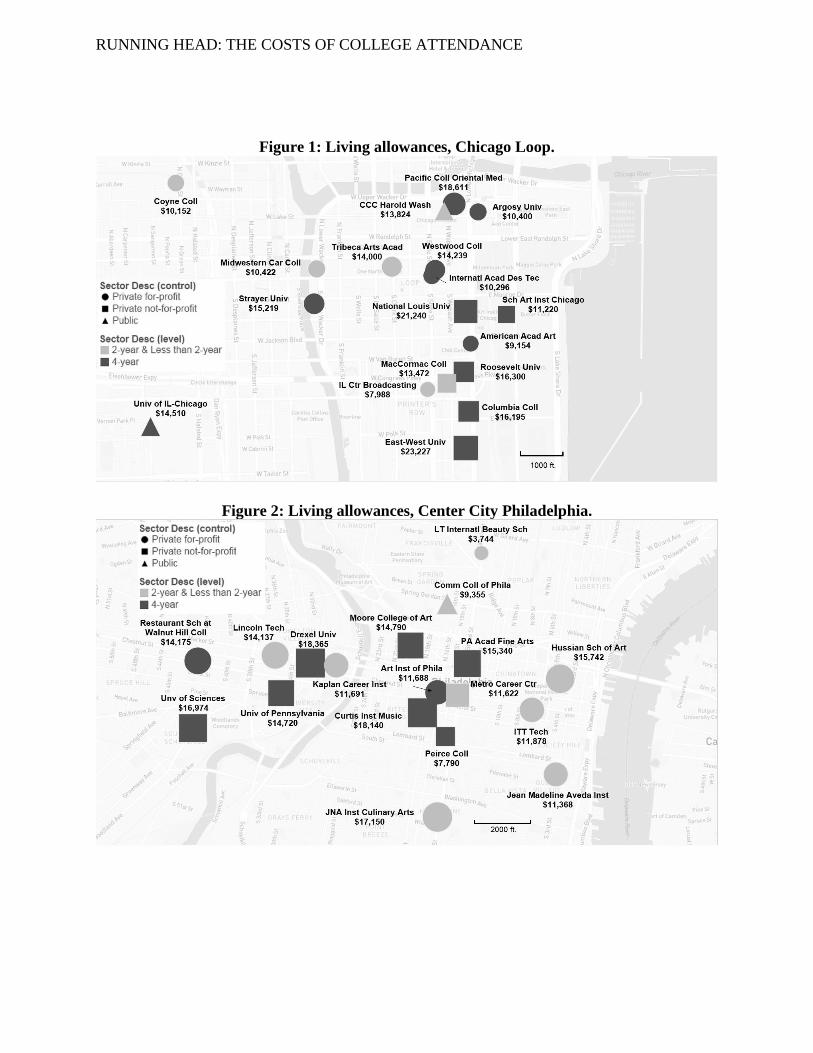
The result of colleges’ autonomy in setting off-campus living allowances can be seen in
Figures 1 and 2, which shows the variation in living allowances within small portions of two
urban counties in the 2013-14 academic year. Figure 1 shows reported living allowances for the
Loop portion of Chicago, where all of the colleges are within approximately three miles of each
other. Living allowances within this region alone varied from $8,307 at the Illinois Center for
Broadcasting to $23,227 at East-West University. Robert Morris University-Illinois and National
Louis University are located within four blocks of each other, but the living allowances were
$10,017 and $21,240, respectively. The same general story is true in downtown Philadelphia
(Figure 2), where allowances varied from $7,790 at Peirce College to $18,365 at Drexel
University. Drexel is about one-half of a mile from Penn, yet Penn’s living allowance of $14,720
is $3,645 less than Drexel’s. As of 2014, the neighborhoods in which the two universities are
located both had median rent values of $1.46 per square foot (Dent, 2014), suggesting there is no
reason to expect such a large variation in living allowances between the two universities.
Data, Methods, and Sample
We began by examining the listed living allowances for off-campus students living away
from their family in the 2013-14 academic year. We then estimated county-level living costs
based on government and third-party data using different assumptions about living with a
roommate and explored the differences between our estimates and reported allowances. Finally,
RUNNING HEAD: THE COSTS OF COLLEGE ATTENDANCE
we conducted a series of regressions to examine whether student demographic and institutional
characteristics were associated with differences between our estimated and reported allowances.
The following section contains details on our data, methods, and sample.
Data and Methods
Data on cost of attendance components came from the U.S. Department of Education’s
Integrated Postsecondary Education Data System (IPEDS) for the 2013-14 academic year. We
focused on the living allowance component of the COA for students living off campus away
from their family, which consists of a room and board allowance and a category of other or
miscellaneous expenses to cover transportation, entertainment, and personal care expenditures.
The total cost of attendance also includes tuition and fees as well as a textbook allowance, but we
excluded textbooks from our analysis since there is little reason to expect textbook costs to
systemically vary across counties.
In order to compare institutional living cost allowances to a consistently-determined
benchmark for local living expenses, we modeled our approach on the MIT Living Wage
Calculator (Glasmeier & Arete, 2014). This calculator provides county-level estimates of how
much money is needed to meet basic necessities based on data compiled by federal agencies and
nationally representative datasets compiled by private sources. Unlike the federal poverty metric,
it includes estimates of transportation, health insurance premiums, and personal care expenses in
addition to food and housing; however, the estimates are minimal enough to include purchasing
one set of clothing per year instead of separate clothing for summer and winter (Smith, 2014). In
addition, we excluded allowances for taxes, direct healthcare expenses such as co-pays and
RUNNING HEAD: THE COSTS OF COLLEGE ATTENDANCE
deductibles, and childcare that are included in the MIT Living Wage Calculator. To ensure
comparability to the institutional data, we employed living expense data that would have been
available for building the living cost allowance budget for the 2013-14 academic year. Details
about the data sources and definitions used to estimate living allowances and information
regarding the guidance that financial aid administrators receive (NASFAA, 2014) are contained
in Table 1.
Data on housing expenses are drawn from the U.S. Department of Housing and Urban
Development 50th
Percentile Rents calculated for FY 2012. Since guidance given to financial aid
administrators does not specify whether students should be assumed to live with a roommate
(NASFAA, 2014), we used three different scenarios with different assumptions in order to
estimate housing expenses:
Scenario 1: students live alone in a zero-bedroom (efficiency) apartment.
Scenario 2: students share a two-bedroom apartment with one roommate and evenly
divide the cost of rent.
Scenario 3: students age 24 or younger live with a roommate in a two-bedroom
apartment and students age 25 or older live in an efficiency apartment. We estimate
this “age-adjusted housing expense” by taking an age-weighted average of the
roommate and no roommate estimates. Data from the 2011-12 National
Postsecondary Student Aid Study show that 66% of all undergraduate students over
the age of 25 are either married or have children, compared to just 11% of
undergraduates age 24 or younger. For that reason—and because all students
RUNNING HEAD: THE COSTS OF COLLEGE ATTENDANCE
considered as independent from their parent(s) for financial aid purposes after
reaching age 24—we used this as our cutoff.
While 60% of four-year public and private nonprofit colleges had at least three-fourths of
their undergraduates under age 25, less than 10% of two-year and for-profit colleges
predominately served ‘traditional’ students (Table 2). Age-adjusted living allowances are
therefore higher for community colleges and for-profit institutions, as an efficiency apartment is
more expensive than a shared two-bedroom apartment.
Costs for food were derived from the U. S. Department of Agriculture Food Plans: Cost
of Food for June 2012. The low-cost plan for men ages 19-50 of $234 per month was averaged
with the low-cost plan for women ages 19-50 of $203 a month to arrive at a cost of $218 per
month. The 2013 County Cost of Living Index (COLI) from the Council for Community and
Economic Research was used to adjust this figure to account for regional differences. These two
components added together represent the county-based estimate for room and board costs
comparable to what institutions report in IPEDS.
Costs for transportation, health care, and miscellaneous expenses together comprised the
estimate for expenses other than room and board. Costs for transportation were taken from the
2012 Bureau of Labor Statistics Consumer Expenditure (CE) Survey for individuals under 25
years old (Table 1300). The CE survey estimated that the average expense for public
transportation among all individuals is $291 per year, but because this amount includes a
majority of individuals who do not use public transportation, it significantly underestimates
actual costs using public transportation as a principal means of commuting. Thus, the cost of
RUNNING HEAD: THE COSTS OF COLLEGE ATTENDANCE
operation and maintenance costs of a car were used to estimate transportation costs for off-
campus students, but costs for capital outlay, and depreciation were not included. These amounts
were $1,931 per year ($161 per month) for gasoline and motor oil and $1,322 per year ($110 per
month) for other expenses such as financing, maintenance and repairs, and license fees.
Health care costs were estimated based on average per person costs for health insurance
premiums by state in 2010 as compiled by the Kaiser Family Foundation. For the states for
which data were unavailable (Alaska, Kansas, Nevada, Ohio, Oklahoma, and Texas) the national
average of $215 was used but adjusted using the county-level COLI in those states only;
estimates in other states were not adjusted using the COLI. Costs for actual out-of-pocket
medical expenses were not included in estimates. State and federal health care exchanges may
provide better sources for regional data going forward, but these would not have been available
when 2013-14 cost of attendance budgets were constructed by institutions and so were not
integrated into estimates. Costs for miscellaneous items were also taken from the Consumer
Expenditure Survey for 2012 for individuals under 25 years old. Included in this category were
personal care products and services at $372 per year ($31 per month), $249 per year ($21 per
month) for fees and admissions, and $360 per year ($30 per month) for miscellaneous expenses.
These amounts totaled to $981 annually or $82 per month.
After compiling the three different living cost estimates (all students living alone, all
students having a roommate, and the age-adjusted estimated detailed above), we compared those
estimates to the college’s reported living allowance for the 2013-14 academic year. For the 38%
of colleges in our sample (primarily certificate-granting and for-profit institutions) that reported
RUNNING HEAD: THE COSTS OF COLLEGE ATTENDANCE
living allowances for the length of the largest program of study instead of on an academic year
basis, we converted the living allowance to a nine-month basis by dividing the living allowance
by the listed length of the program and multiplying by nine. We then examined the percentage of
colleges by sector and level that had allowances at least 20 percent above our estimates, 10-20
percent above our estimates, within ten percent of our estimates, 10-20 percent above our
estimates. We conducted two robustness checks, by creating categories for colleges at least 30
percent above or below our estimates and dropping colleges in counties that contained large
cities. Neither of these substantially changed our results, and tables are available upon request
from the corresponding author.
Finally, we conducted a series of regressions exploring whether the differences between
colleges’ reported living allowances and our estimates are related to student demographic,
institutional, or local characteristics as measured in the 2012-13 academic year. For each of our
three estimates (assuming no roommates, assuming a roommate, and the age-adjusted estimate),
we ran two regressions. The first regression examined the percentage difference between our
estimates and the reported allowances. In the second regression, we used the absolute value of
the percentage difference to explore whether certain characteristics are associated with large
variations from our estimates regardless of the direction of the difference.
The student demographic factors in our model included the percentage of Pell Grant
recipients, race/ethnicity, gender, and age from IPEDS and logged family income for
independent and dependent students from the College Scorecard. The institutional
characteristics, all from IPEDS, consisted of the logged number of full-time equivalent
RUNNING HEAD: THE COSTS OF COLLEGE ATTENDANCE
undergraduates, control and level, logged tuition and fees, and whether colleges reported living
allowances on an academic year basis or for their largest program. Finally, county-level
measures included urbanicity (from IPEDS), unemployment rates, and the percentage of
residents living in poverty (from the Census Bureau). As a robustness check, we also ran a
separate model for four-year colleges that included six-year graduation rates as a covariate. As
this was not significant at p<.05 in any of our specifications, the results are not shown here but
are available upon request from the corresponding author.
Sample
We began with the 6,604 colleges that reported living allowances for students living off
campus away from their family to IPEDS in the 2013-14 academic year. This omitted 107
highly-selective colleges that had all students living on campus during their first year (and thus
did not report an off-campus living allowance), as well as 232 colleges with incomplete
information on living allowances. We then excluded 346 colleges (primarily branch campuses of
large for-profit chains) for not reporting information on the age distribution of their students to
IPEDS. This results in an analytic sample of 6,258 colleges for our comparisons of reported and
estimated living allowances. For our regressions exploring whether student demographic or
institutional factors affect variation between reported and estimated allowances, we excluded an
additional 265 colleges without information on all covariates. This yielded a final sample of
5,993 colleges.
Limitations
RUNNING HEAD: THE COSTS OF COLLEGE ATTENDANCE
Our approach has some limitations. Data were generally unavailable for Puerto Rico,
U.S. Territories, and Outlying Areas and therefore estimates were not generated for these areas
and these institutions were not included in the sample. While use of counties as the principal
geographic unit for estimating cost of living expenses is superior to using MSAs, costs for living
expenses are not uniform across counties. This means a COA budget that represents the median
or average for a “typical” student might still be insufficient to account for personal
circumstances. Housing values and rental prices often vary considerably based on proximity to
campus (Des Rosiers & Theriault, 1995; Kashian & Rockwell, 2013), with substantial variation
within several blocks of campus. Conversely, in larger rural western counties where housing
expenses may be more uniform, transportation costs could vary significantly based on the
distance between students’ places of residence and their institutions. However, the most granular
data available are at the county level, and so that is what we employed.
Results
Variation by Urbanicity
Given the wide range of areas in which institutions of higher education are located across
the nation, some of the variation in living cost allowances likely reflects geographic differences.
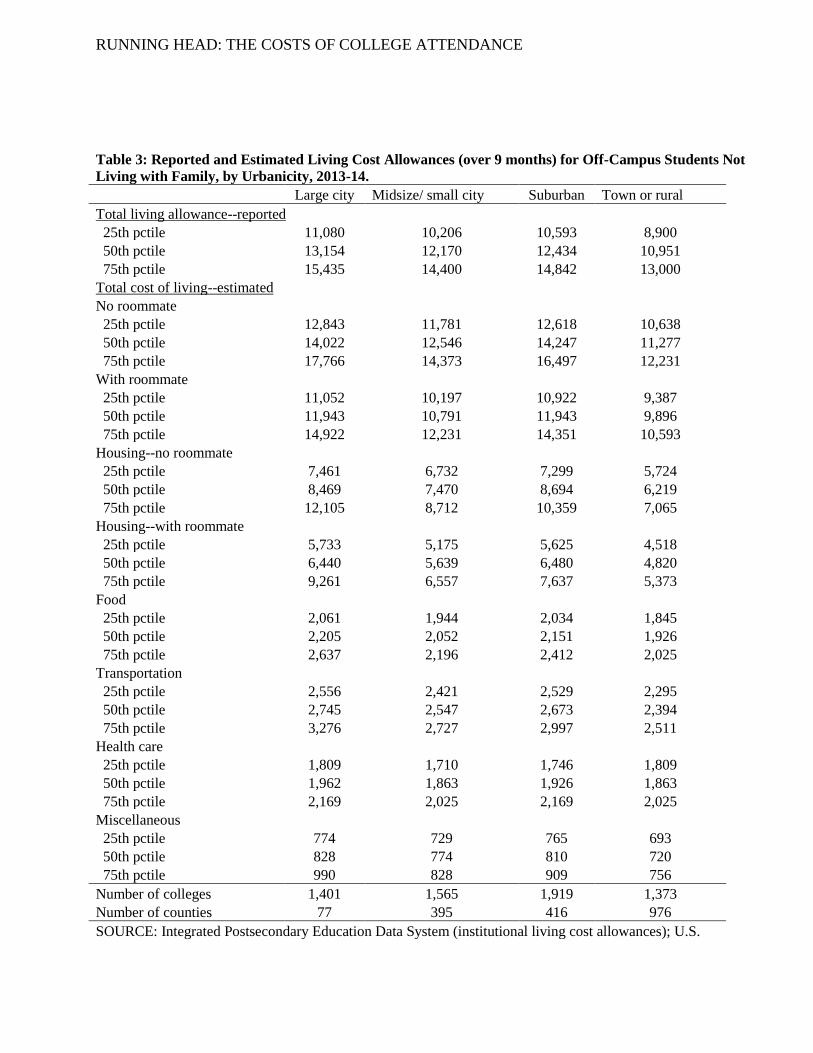
In 2013, the living cost allowances reported by institutions in large cities were about $500-
$1,000 above the allowances reported in smaller cities and suburbs and $2,100 higher than the
typical allowance in rural areas. Similar gaps were present at each percentile in the distribution
(Table 3).

RUNNING HEAD: THE COSTS OF COLLEGE ATTENDANCE
Estimated living expenses at the median college were highest in suburban areas, with
estimated 9-month expenses of $14,247 for no roommate and $11,993 assuming a roommate.
Median expenses were similar in large cities, but $2,000-$3,000 lower in rural areas. Housing
costs made up about half of the estimated living expense, with food, transportation, health care,
and miscellaneous expenses combining to contribute about $7,000 toward the living expense;
these non-housing categories vary relatively little by urbanicity.
But there is striking variation in living cost allowances reported by institutions within the
same urbanicity. The difference between the 25th
percentile and the 75th
percentile for reported
total nine-month living costs for off-campus students not living with family was $4,000-$5,000 –
an amount that exceeds the total published charges for most community colleges. While actual
living costs within these geographies may well be variable, this magnitude of variation—
especially among institutions with lower allowances—may lead students to face vastly different
resource constraints depending on how their institution computes the allowance.
Estimated Living Costs vs. Living Cost Allowances
We next examined variation in the consistency of living allowances across multiple
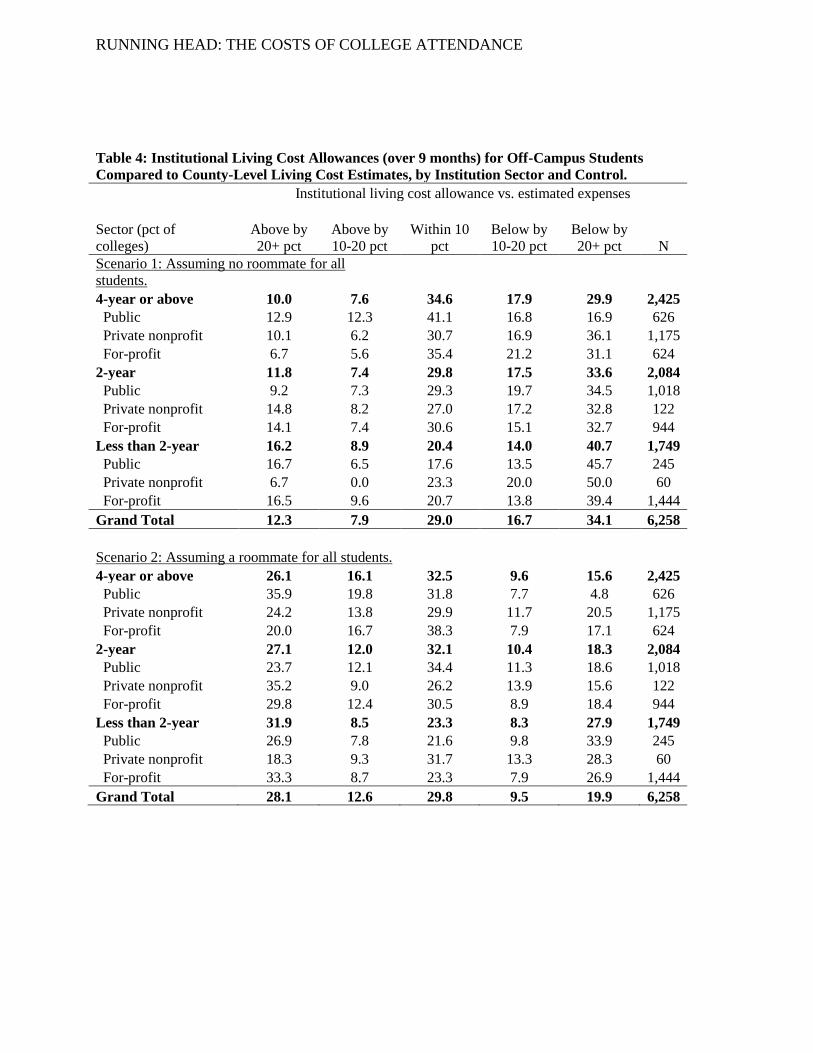
assumptions regarding student housing (Table 4). When comparing institutional living
allowances to our estimated expenses for students living alone (Scenario 1), we find that 34% of
colleges’ allowances were at least 20% below the estimates while only 12% of colleges provided
allowances at least 20% above the estimates. The distribution of actual allowances versus
estimated expenses shifts when students are assumed to have a roommate. Under that Scenario
RUNNING HEAD: THE COSTS OF COLLEGE ATTENDANCE
(2), 28% of colleges had living allowances at least 20% above the estimates compared to 20% of
colleges being at least 20% below the estimates.
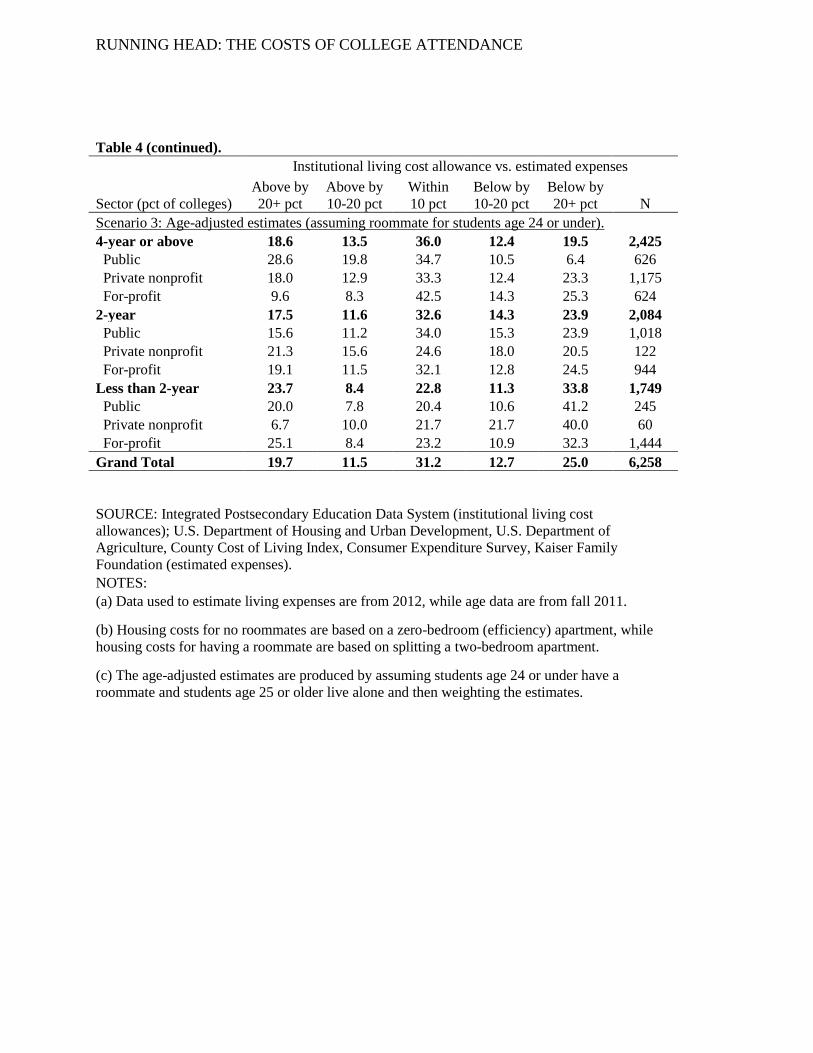
Under Scenario 3, which made different assumptions based on student age, a similar
percentage of colleges had living allowances that are 20% above (20%) and 20% below (25%)
the estimates. This means that nearly half of all colleges provided living allowances outside our
estimates of how much money students need to live modestly while in college. Public four-year
colleges and universities are more likely provide allowances above the estimate (29% of colleges
were 20% above the estimate), while nearly 30% of for-profit colleges provided allowances at
least 20% below the estimates. There is, in other words, a great deal of inconsistency.
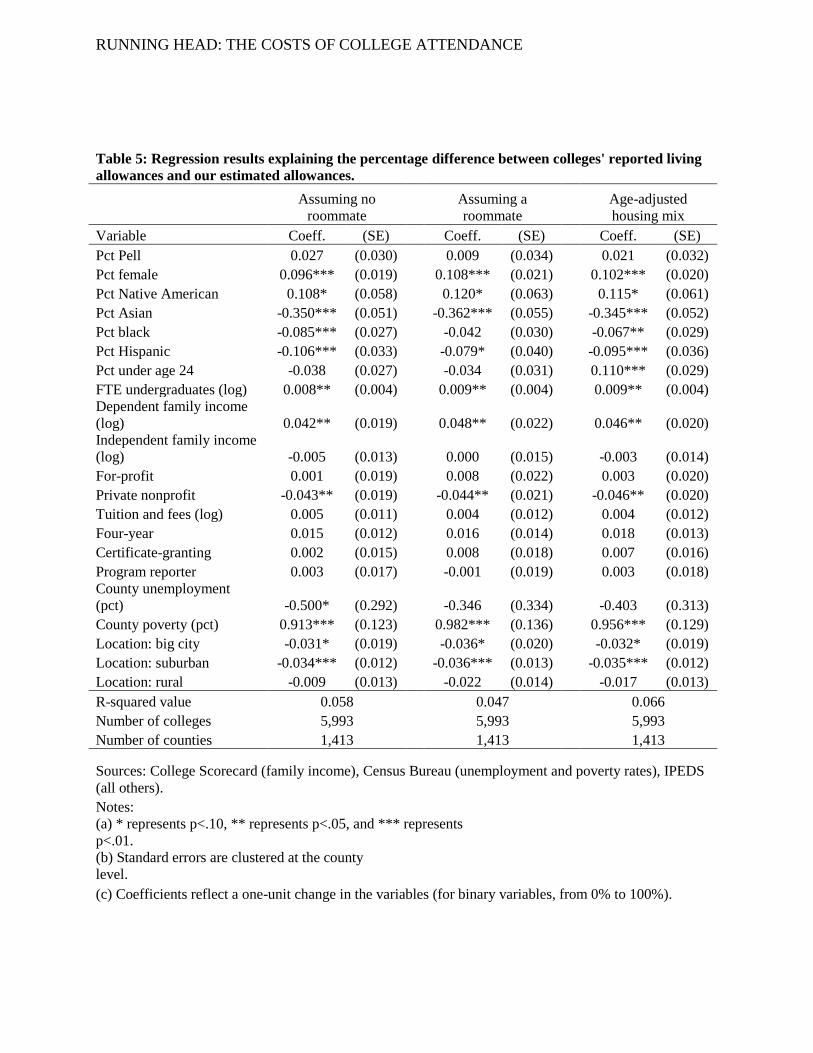
We next turn to the results of regressions exploring whether student demographic,
institutional, and county-level characteristics are associated with differences between reported
living allowances and our estimated allowances. Across each of the three regressions exploring
the percentage difference in allowances (Table 5), we found that these characteristics together
explained a small amount of the variation in the differences in our estimates as R-squared values
ranged from 0.047 to 0.066. These findings indicate colleges set their living allowances in ways
that are only somewhat related to the types of students or communities they serve and suggest a
substantial amount of unwanted variation in the process of setting allowances.
Yet some of the individual characteristics were statistically significant across the models,
suggesting that colleges set their living allowances in part based on the types of students they
serve. Higher institutional percentages of Asian, black, and Hispanic students were generally
associated with lower reported living allowances relative to our estimates, while colleges with
RUNNING HEAD: THE COSTS OF COLLEGE ATTENDANCE
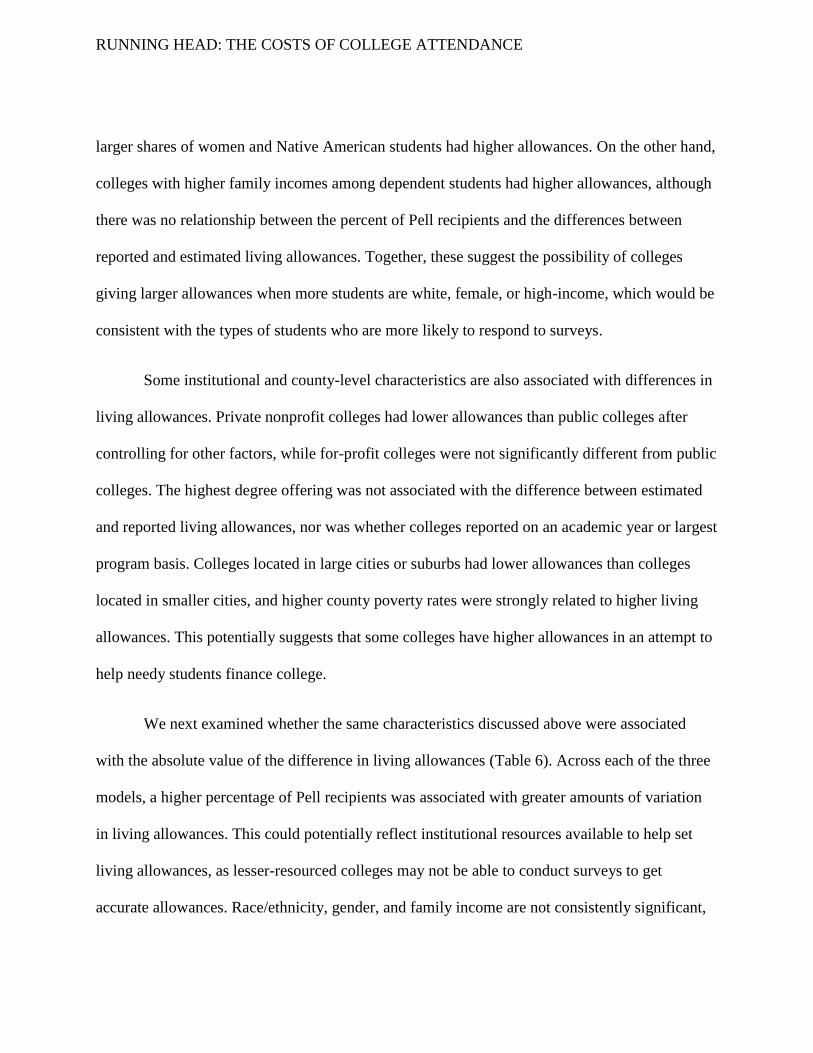
larger shares of women and Native American students had higher allowances. On the other hand,
colleges with higher family incomes among dependent students had higher allowances, although
there was no relationship between the percent of Pell recipients and the differences between
reported and estimated living allowances. Together, these suggest the possibility of colleges
giving larger allowances when more students are white, female, or high-income, which would be
consistent with the types of students who are more likely to respond to surveys.
Some institutional and county-level characteristics are also associated with differences in
living allowances. Private nonprofit colleges had lower allowances than public colleges after
controlling for other factors, while for-profit colleges were not significantly different from public
colleges. The highest degree offering was not associated with the difference between estimated
and reported living allowances, nor was whether colleges reported on an academic year or largest
program basis. Colleges located in large cities or suburbs had lower allowances than colleges
located in smaller cities, and higher county poverty rates were strongly related to higher living
allowances. This potentially suggests that some colleges have higher allowances in an attempt to
help needy students finance college.
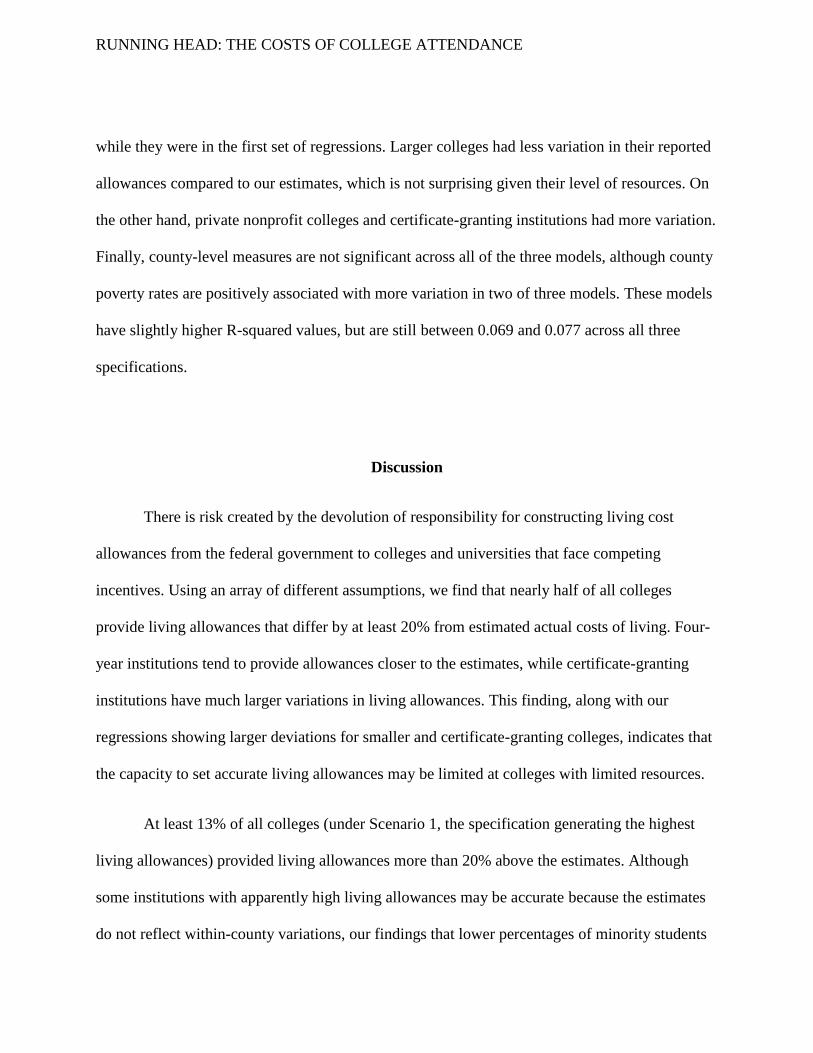
We next examined whether the same characteristics discussed above were associated
with the absolute value of the difference in living allowances (Table 6). Across each of the three
models, a higher percentage of Pell recipients was associated with greater amounts of variation
in living allowances. This could potentially reflect institutional resources available to help set
living allowances, as lesser-resourced colleges may not be able to conduct surveys to get
accurate allowances. Race/ethnicity, gender, and family income are not consistently significant,
RUNNING HEAD: THE COSTS OF COLLEGE ATTENDANCE
while they were in the first set of regressions. Larger colleges had less variation in their reported
allowances compared to our estimates, which is not surprising given their level of resources. On
the other hand, private nonprofit colleges and certificate-granting institutions had more variation.
Finally, county-level measures are not significant across all of the three models, although county
poverty rates are positively associated with more variation in two of three models. These models
have slightly higher R-squared values, but are still between 0.069 and 0.077 across all three
specifications.
Discussion
There is risk created by the devolution of responsibility for constructing living cost
allowances from the federal government to colleges and universities that face competing
incentives. Using an array of different assumptions, we find that nearly half of all colleges
provide living allowances that differ by at least 20% from estimated actual costs of living. Four-
year institutions tend to provide allowances closer to the estimates, while certificate-granting
institutions have much larger variations in living allowances. This finding, along with our
regressions showing larger deviations for smaller and certificate-granting colleges, indicates that
the capacity to set accurate living allowances may be limited at colleges with limited resources.
At least 13% of all colleges (under Scenario 1, the specification generating the highest
living allowances) provided living allowances more than 20% above the estimates. Although
some institutions with apparently high living allowances may be accurate because the estimates
do not reflect within-county variations, our findings that lower percentages of minority students

RUNNING HEAD: THE COSTS OF COLLEGE ATTENDANCE
and higher average family incomes were associated with somewhat higher reported living
allowances also raise concerns about equity. If more advantaged students are allowed to borrow
more money to cover their personal lifestyle choices than similarly-qualified low-income
students because of the college they attend, this can affect the types of experiences that students
can have while in college. The difference in experiences has the potential to reproduce inequality
in higher education (e.g., Armstrong & Hamilton, 2013) as well as potentially affecting low-
income students’ access to colleges with higher living allowances due to concerns about high
sticker prices.
On the other hand, at least 20% of colleges across all estimates provide living allowances
at least 20% below what we estimate is necessary for a very modest standard of living even when
assuming a roommate. When students do not have sufficient resources with which to cover their
living costs, they are more likely to take on additional work hours or make compromises that
affect their school work—such as forgoing books and other supplies, or skipping meals (Broton,
Frank, & Goldrick-Rab, 2014; Goldrick-Rab, 2016). This may, in turn, inhibit the odds of
accumulating credits in a timely manner, potentially affecting degree completion (Darolia, 2014).
These low allowances could be a result of student surveys administered by under-
resourced and overburdened financial aid offices, or they could be an intentional decision by
some colleges to reduce living allowances in order to reduce borrowing, spread out the
distribution of financial aid, or achieve other goals. In our regression models, we found that some
student demographic characteristics and institutional characteristics were associated with larger
variations between our estimated living allowances and the allowances reported by colleges, but
RUNNING HEAD: THE COSTS OF COLLEGE ATTENDANCE
we cannot definitively say whether these relationships are a result of unintentional or intentional
decisions. Further research is needed to explore whether colleges are behaving strategically when
setting living allowances, as well as the extent to which allowances are influenced by street-level
bureaucrats such as financial aid officers (e.g., Weatherley & Lipsky, 1977) compared to higher-
level administrators or even trustees. A particular point of interest is how frequently
administrators overrule financial aid officers’ requests to change living allowances.
Ongoing federal efforts to enhance institutional accountability, such as the College
Affordability Lists (HEOA, 2008) and the newly released College Scorecard tool, prominently
feature net price. Net prices are also used by numerous private-sector organizations in
developing college rankings, which can help drive colleges’ actions (e.g., Bastedo & Bowman,
2011). Since living costs are a principal, and in some cases the largest, component of net price,
and because these living costs are unevenly determined, however, caution must be exercised
when utilizing and interpreting institutional net prices. Given the wide and unexplained variation
in cost of living expenses discussed here, it may be unwise to use net price as an accountability
measure. Beyond the reliability and validity issues with the measure, net price is subject to
manipulation with little risk for exposure. Further, it may be unreasonable to hold colleges and
universities accountable for increases in cost of living expenses that are outside their control, and
in many instances dwarf the actual charges to students.
Instead, the U.S. Department of Education should convene a working group in order to
develop a consistent method of determining living costs that accounts for regional and local
variation and student circumstances (such as dependency status) but eliminates or at least
RUNNING HEAD: THE COSTS OF COLLEGE ATTENDANCE
minimizes differences between institutions in close proximity to one another. Lessons from the
administration of other social programs should be utilized; for example the Department of
Housing and Urban Development has experience establishing fair market rents and the
Department of Defense has experience with the Basic Housing Allowance provided to service
members (U.S. Department of Defense, 2014). In the meantime, the Department of Education
could provide clearer and more definitive guidance to institutions so they can make more
uniform calculations. This guidance could include 1) language for survey questions, sampling,
and administration procedures, 2) reference to particular federal and other resources for
determining costs, 3) instructions for benchmarking against institutions in the same geographic
area, and 4) instructions for setting off-campus costs as a function of on-campus costs. Such
guidance should be aimed to even out costs within geographic areas and place institutions and
students on a level playing field.
1 The College Board (n.d.) uses BLS data to issue tables of “low and moderate-expense living
budgets” updated on an annual basis for 24 metropolitan statistical areas (MSAs), but this
approach is of limited use because MSAs often include ten or more counties with disparate living
costs and do not cover less-urbanized parts of the country.
2 Colleges are allowed to set a room and board allowance of zero dollars for students living with
their families—and this allowance is not collected by the U.S. Department of Education to be
included in official cost of attendance (or net price) estimates. This is in spite of evidence that
students from low-income families who live at home often financially contribute to their
household while in college (e.g., Kinsley, 2014).
References
Archibald, R. B. & Feldman, D. (2011). Why does college cost so much? New York, NY: Oxford
University Press.
Armstrong, E. A., & Hamilton, L. T. (2013). Paying for the party: How college maintains
inequality. Cambridge, MA: Harvard University Press.
Bastedo, M. N., & Bowman, N. A. (2011). College rankings as an interorganizational
dependency: Establishing the foundation for strategic and institutional accounts.
Research in Higher Education, 52(1), 3-23.
Broton, K., Frank, T. & Goldrick-Rab, S. (2014). Safety, security, and college attainment: An
investigation of undergraduates' basic needs and how colleges respond. Paper presented
at the annual meetings of the Association of Public Policy and Management, October.
Bowman, W. (1976). Keeping up with student expense budgets using expenditure diaries.
Journal of Student Financial Aid, 6(2), 26-33.
Bowman, W. (1975). Keeping up with student expenses: Towards systematic methods of
computing student budgets. Journal of Student Financial Aid, 5(2), 12-24.
Bureau of Labor Statistics (2013). Consumer Expenditure Survey, 2012. Retrieved October 31,
2016 from http://www.bls.gov/cex/2012/combined/age.pdf.
Carlson, A. (2013). State tuition, fees, and financial assistance policies for public colleges and
universities. Boulder, CO: State Higher Education Executive Officers Association.
RUNNING HEAD: THE COSTS OF COLLEGE ATTENDANCE
Castleman, B. L., & Long, B. T. (2016). Looking beyond enrollment: The causal effect of need-
based grants on college access, persistence, and graduation. Journal of Labor Economics,
34(4), 1023-1073.
College Board (n.d.). 2014-15 low and moderate living expense budgets. Retrieved January 7,
2015 from http://professionals.collegeboard.com/higher-ed/financial-aid/living-
expense/2014/9-month.
College Board and Art & Science Group, LLC (2012, September 14). A majority of students rule
out colleges based on sticker price. Retrieved October 31, 2016 from
http:/www.artsci.com/studentpoll/v9n1/index.html.
Council for Community and Economic Research (2013). County cost of living index. Arlington,
VA, Author.
Cousteau, L. (2013). College textbook costs: Factors, trends, and access to information.
Hauppauge, NY: Nova Science Publishing.
Darolia, R. (2014). Working (and study) day and night: Heterogeneous effects of working on the
academic performance of full-time and part-time students. Economics of Education
Review, 38(1), 38-50.
Dent, M. (2014, November 24). The Philly neighborhood index: The safest, loudest, and most
livable ‘hoods. Billy Penn. Retrieved October 31, 2016 from
http://billypenn.com/2014/11/24/the-philly-neighborhood-index-the-safest-loudest-and-
most-livable-hoods/.
RUNNING HEAD: THE COSTS OF COLLEGE ATTENDANCE
Des Rosiers, F., & Theriault, M. (1995). Rental amenities and the stability of hedonic prices: A
comparative analysis of five market segments. The Journal of Real Estate Research,
12(1), 17-36.
Dougherty, K. J., & Natow, R. S. (2015). The politics of performance funding for higher
education: Origins, discontinuations, and transformations. Baltimore, MD: Johns
Hopkins University Press.
Dynarksi, S. (2000). Hope for whom? Financial aid for the middle class and its impact on college
attendance. National Tax Journal, 53(2), 629-662.
Eligon, J. (2013, June 14). In student housing, luxuries overshadow studying. The New York
Times. Retrieved October 31, 2016 from http://www.nytimes.com/2013/06/15/us/in-
luxury-student-housing-gym-tan-and-study.html.
Federal Student Aid. (2014a). 2014-2015 federal student aid handbook. Washington, DC:
Author.
Federal Student Aid (2014b). Three-year official cohort default rates for schools. Retrieved
August 13, 2015 from http://www2.ed.gov/offices/OSFAP/defaultmanagement/cdr.html.
Fording, R. C., Soss, J., & Schram, S. F. (2007). Devolution, discretion, and the effect of local
political values on TANF sanctioning. Social Service Review, 81, 285-316.
Glasmeier, A. K., & Arete, W. (2014). Living wage calculator. Retrieved October 31, 2016 from
http://livingwage.mit.edu/pages/about.
RUNNING HEAD: THE COSTS OF COLLEGE ATTENDANCE
Goldrick-Rab, S. (2016). Paying the price: College costs and the betrayal of the American
dream. Chicago, IL: University of Chicago Press.
Goldrick-Rab, S., Kelchen, R., Harris, D. N., & Benson, J. (2016). Reducing income inequality
in educational attainment: Experimental evidence on the impact of financial aid on
college completion. American Journal of Sociology, 121(6), 1762-1817.
Goldrick-Rab, S. & Kendall, N. (2014). Redefining college affordability: Securing America’s
future with a free two year college option. Indianapolis, IN: Lumina Foundation.
Hagelskamp, C., Schleifer, D., & DiStasi, C. (2013). Is college worth it for me? How adults
without degrees think about going (back) to school. New York, NY: Public Agenda.
Jackson, B., & Pogue, J. (1983). Determining a student expense budget: What costs students
incur in higher education. Journal of Student Financial Aid, 13(1), 16-20.
Kaiser Family Foundation (2011). Average per person monthly premiums in the individual
market, 2010. Retrieved October 31, 2016 from http://kff.org/other/state-
indicator/individual-premiums.
Kashian, R., & Rockwell, S. J. (2013). Town and gown: The negative externality of a university
on housing prices. Journal of Real Estate Practice and Education, 16(1), 1-12.
Kinsley, P. (2014). The pull of home: Family dynamics and the initial college experiences of
low-income undergraduates. Doctoral dissertation, University of Wisconsin-Madison.
Laguilles, J. S., Williams, E. A., & Saunders, D. B. (2011). Can lottery incentives boost web
survey response rates? Findings from four experiments. Research in Higher Education,
52, 537-553.
RUNNING HEAD: THE COSTS OF COLLEGE ATTENDANCE
Massimo, J. (2011, April 8). 90/10 rule: A ‘catch-22’ for Corinthian Colleges. The Chronicle of
Higher Education. Retrieved October 31, 2016 from http://chronicle.com/article/90-10-
Rule-a-Catch-22-for/127072/.
McKinney, L., & Roberts, T. (2012). The role of community college financial aid counselors in
helping students understand and utilize financial aid. Community College Journal of
Research and Practice, 36(10), 761-774.
Mettler, S. (2005). Soldiers to citizens: The G.I. Bill and the making of the greatest generation.
New York, NY: Oxford University Press.
Mitchell, J. (2014, March 2). Student loans entice borrowers more for cash than a degree. The
Wall Street Journal. Retrieved October 31, 2016 from
http://www.wsj.com/articles/SB10001424052702304585004579415022664472930.
National Association of Student Financial Aid Administrators. (2014). Developing the cost of
attendance. Monograph No. 24. Washington, DC: Author.
New, J. (2015, August 12). More money…if you can play ball. Inside Higher Ed. Retrieved
October 31, 2016 from https://www.insidehighered.com/news/2015/08/12/colleges-
inflate-full-cost-attendance-numbers-increasing-stipends-athletes.
Newman, J. (2014, July 10). Tuition and fees rise, but cost of living—by colleges’ estimate—
falls. The Chronicle of Higher Education. Retrieved October 31, 2016 from
http://chronicle.com/blogs/data/2014/07/10/tuition-and-fees-rise-but-cost-of-living-by-
colleges-estimate-falls/.
RUNNING HEAD: THE COSTS OF COLLEGE ATTENDANCE
Porter, S. R., & Whitcomb, M. E. (2005). Non-response in student surveys: The role of
demographics, engagement and personality. Research in Higher Education, 46(2), 127-
152.
Reynolds, C. L. (2014). State politics, tuition, and the dynamics of a political budget cycle.
Empirical Economics, 46(4), 1241-1270.
Rowan-Kenyon, H. T., Bell, A. D., & Perna, L. W. (2008). Contextual influences on parental
involvement in college going: Variations by socioeconomic class. The Journal of Higher
Education, 79(5), 564-586.
Sheehy, K. (2013, July 24). Undergrads blow it with student loan refunds. U.S. News & World
Report. Retrieved October 31, 2016 from http://www.usnews.com/education/best-
colleges/paying-for-college/articles/2013/07/24/undergrads-blow-it-with-student-loan-
refunds.
Soss, J., Fording, R. C., & Schram, S. F. (2011). Disciplining the poor: Neoliberal paternalism
and the persistent power of race. Chicago, IL: University of Chicago Press.
Smith, N. D. (2014, February 6). MIT living wage calculator: Why higher wages help everybody.
Retrieved October 31, 2016 from https://slice.mit.edu/2014/02/06/mit-living-wage-
calculator-why-higher-wages-help-everybody/.
Tennessee Promise (2015). About. Retrieved October 31, 2016 from
http://tennesseepromise.gov/about.shtml.
RUNNING HEAD: THE COSTS OF COLLEGE ATTENDANCE
The White House (2015). Higher education. Retrieved October 31, 2016 from
https://www.whitehouse.gov/issues/education/higher-education.
U.S. Department of Agriculture (2012). USDA food plans: Cost of food report for June 2012.
Retrieved October 31, 2016 from
http://www.cnpp.usda.gov/USDAFoodPlansCostofFood/reports.
U.S. Department of Defense (2014). Basic allowance for housing. Retrieved October 31, 2016
from http://www.defensetravel.dod.mil/site/bah.cfm.
U.S. Department of Education (n.d.). Net price calculator center. Retrieved October 31, 2016
from http://collegecost.ed.gov/netpricecenter.aspx.
U.S. Department of Housing and Urban Development (2012). FY2012 50th percentile rents:
data by county. Retrieved October 31, 2016 from
http://www.huduser.org/portal/datasets/50per.html.
U.S. Government Accountability Office. (2013). College textbooks: Students have greater access
to textbook information. Washington, DC, Author.
Ware, M., Weissman, E., & McDermott, D. (2013). Aid like a paycheck: Incremental aid to
promote student success. New York, NY: MDRC.
Weatherley, R., & Lipsky, M. (1977). Street-level bureaucrats and institutional innovation:
Implementing special-education reform. Harvard Educational Review, 47(2), 171-197.
Wilkinson, D. (2014, December 23). The ramen noodle diet: Not just for college students.
National Geographic. Retrieved October 31, 2016 from
RUNNING HEAD: THE COSTS OF COLLEGE ATTENDANCE
http://theplate.nationalgeographic.com/2014/12/23/the-ramen-noodle-diet-not-just-for-
college-students/.
Zhen, C., Taylor, J., Muth, M. & Leitbag, E. 2009. Understanding differences in self-reported
expenditures between household scanner data and diary survey data: A comparison of
Homescan and Consumer Expenditure Survey. Review of Agricultural Economics, 31(3),
470-492.
Ziskin, M., Fischer, M. A., Torres, V., Pellicciotti, B., & Player-Sanders, J. (2014). Working
students’ perceptions of paying for college: Understanding the connections between
financial aid and work. The Review of Higher Education, 37(4), 429-467.
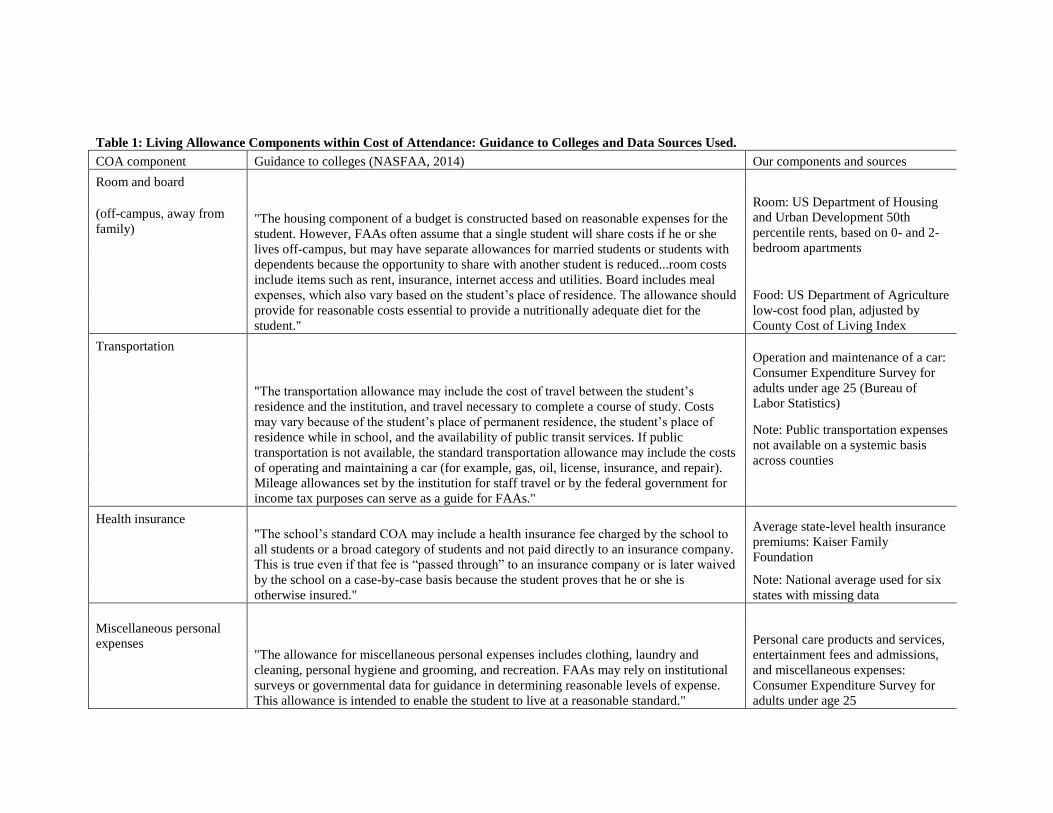
Table 1: Living Allowance Components within Cost of Attendance: Guidance to Colleges and Data Sources Used.
COA component Guidance to colleges (NASFAA, 2014) Our components and sources
Room and board
"The housing component of a budget is constructed based on reasonable expenses for the
student. However, FAAs often assume that a single student will share costs if he or she
lives off-campus, but may have separate allowances for married students or students with
dependents because the opportunity to share with another student is reduced...room costs
include items such as rent, insurance, internet access and utilities. Board includes meal
expenses, which also vary based on the student’s place of residence. The allowance should
provide for reasonable costs essential to provide a nutritionally adequate diet for the
student."
Room: US Department of Housing
and Urban Development 50th
percentile rents, based on 0- and 2-
bedroom apartments
(off-campus, away from
family)
Food: US Department of Agriculture
low-cost food plan, adjusted by
County Cost of Living Index
Transportation
"The transportation allowance may include the cost of travel between the student’s
residence and the institution, and travel necessary to complete a course of study. Costs
may vary because of the student’s place of permanent residence, the student’s place of
residence while in school, and the availability of public transit services. If public
transportation is not available, the standard transportation allowance may include the costs
of operating and maintaining a car (for example, gas, oil, license, insurance, and repair).
Mileage allowances set by the institution for staff travel or by the federal government for
income tax purposes can serve as a guide for FAAs."
Operation and maintenance of a car:
Consumer Expenditure Survey for
adults under age 25 (Bureau of
Labor Statistics)
Note: Public transportation expenses
not available on a systemic basis
across counties
Health insurance "The school’s standard COA may include a health insurance fee charged by the school to
all students or a broad category of students and not paid directly to an insurance company.
This is true even if that fee is “passed through” to an insurance company or is later waived
by the school on a case-by-case basis because the student proves that he or she is
otherwise insured."
Average state-level health insurance
premiums: Kaiser Family
Foundation
Note: National average used for six
states with missing data
Miscellaneous personal
expenses "The allowance for miscellaneous personal expenses includes clothing, laundry and
cleaning, personal hygiene and grooming, and recreation. FAAs may rely on institutional
surveys or governmental data for guidance in determining reasonable levels of expense.
This allowance is intended to enable the student to live at a reasonable standard."
Personal care products and services,
entertainment fees and admissions,
and miscellaneous expenses:
Consumer Expenditure Survey for
adults under age 25
RUNNING HEAD: THE COSTS OF COLLEGE ATTENDANCE
NOTES:
(a) Tuition/fees and allowances for books and supplies are included in the COA, but not examined in this paper.
(b) Students living off-campus with their parents do not receive an allowance for room and board. Students living on-campus do get a room and board
allowance, but that is not examined in this paper.
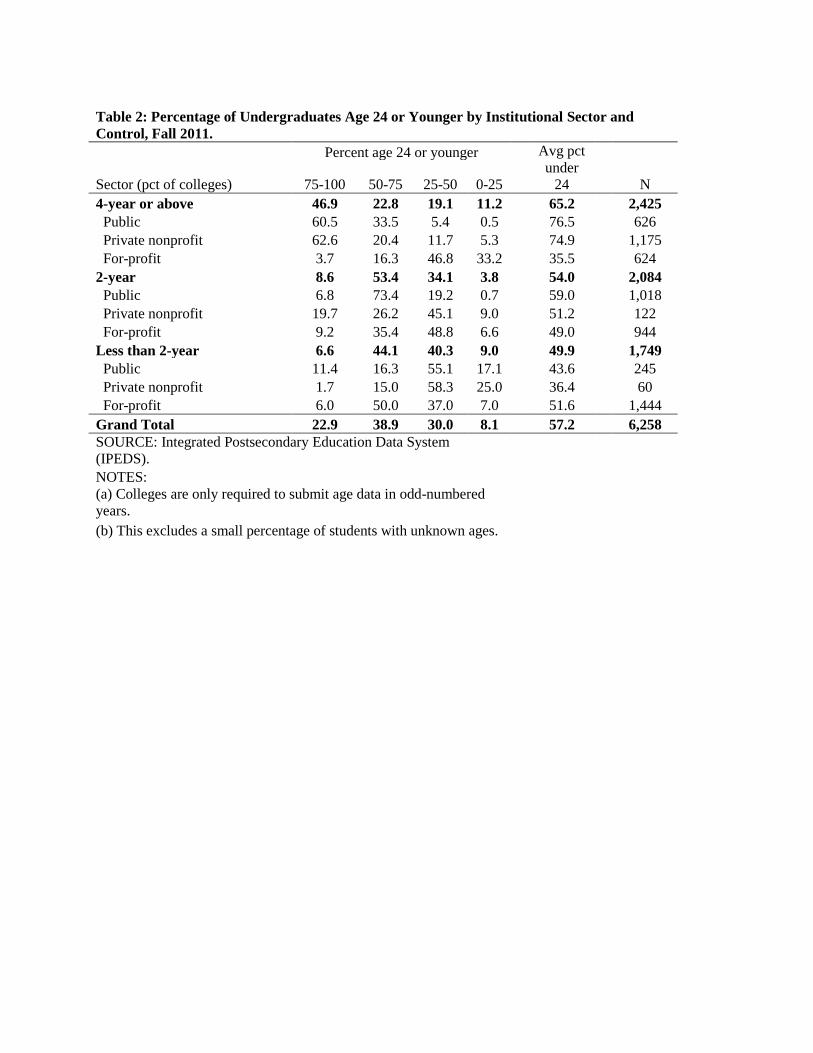
Table 2: Percentage of Undergraduates Age 24 or Younger by Institutional Sector and
Control, Fall 2011.
Percent age 24 or younger Avg pct
under
24
N Sector (pct of colleges) 75-100 50-75 25-50 0-25
4-year or above 46.9 22.8 19.1 11.2
65.2
2,425
Public 60.5 33.5 5.4 0.5
76.5
626
Private nonprofit 62.6 20.4 11.7 5.3
74.9
1,175
For-profit 3.7 16.3 46.8 33.2
35.5
624
2-year 8.6 53.4 34.1 3.8
54.0
2,084
Public 6.8 73.4 19.2 0.7
59.0
1,018
Private nonprofit 19.7 26.2 45.1 9.0
51.2
122
For-profit 9.2 35.4 48.8 6.6
49.0
944
Less than 2-year 6.6 44.1 40.3 9.0
49.9
1,749
Public 11.4 16.3 55.1 17.1
43.6
245
Private nonprofit 1.7 15.0 58.3 25.0
36.4
60
For-profit 6.0 50.0 37.0 7.0
51.6
1,444
Grand Total 22.9 38.9 30.0 8.1 57.2 6,258
SOURCE: Integrated Postsecondary Education Data System
(IPEDS).
NOTES:
(a) Colleges are only required to submit age data in odd-numbered
years.
(b) This excludes a small percentage of students with unknown ages.
RUNNING HEAD: THE COSTS OF COLLEGE ATTENDANCE
Table 3: Reported and Estimated Living Cost Allowances (over 9 months) for Off-Campus Students Not
Living with Family, by Urbanicity, 2013-14.
Large city Midsize/ small city Suburban Town or rural
Total living allowance--reported
25th pctile 11,080 10,206 10,593 8,900
50th pctile 13,154 12,170 12,434 10,951
75th pctile 15,435 14,400 14,842 13,000
Total cost of living--estimated
No roommate
25th pctile 12,843 11,781 12,618 10,638
50th pctile 14,022 12,546 14,247 11,277
75th pctile 17,766 14,373 16,497 12,231
With roommate
25th pctile 11,052 10,197 10,922 9,387
50th pctile 11,943 10,791 11,943 9,896
75th pctile 14,922 12,231 14,351 10,593
Housing--no roommate
25th pctile 7,461 6,732 7,299 5,724
50th pctile 8,469 7,470 8,694 6,219
75th pctile 12,105 8,712 10,359 7,065
Housing--with roommate
25th pctile 5,733 5,175 5,625 4,518
50th pctile 6,440 5,639 6,480 4,820
75th pctile 9,261 6,557 7,637 5,373
Food
25th pctile 2,061 1,944 2,034 1,845
50th pctile 2,205 2,052 2,151 1,926
75th pctile 2,637 2,196 2,412 2,025
Transportation
25th pctile 2,556 2,421 2,529 2,295
50th pctile 2,745 2,547 2,673 2,394
75th pctile 3,276 2,727 2,997 2,511
Health care
25th pctile 1,809 1,710 1,746 1,809
50th pctile 1,962 1,863 1,926 1,863
75th pctile 2,169 2,025 2,169 2,025
Miscellaneous
25th pctile 774 729 765 693
50th pctile 828 774 810 720
75th pctile 990 828 909 756
Number of colleges 1,401 1,565 1,919 1,373
Number of counties 77 395 416 976
SOURCE: Integrated Postsecondary Education Data System (institutional living cost allowances); U.S.
RUNNING HEAD: THE COSTS OF COLLEGE ATTENDANCE
Department of Housing and Urban Development, U.S. Department of Agriculture, County Cost of Living
Index, Consumer Expenditure Survey, Kaiser Family Foundation (estimated expenses).
NOTES:
(a) The categories of urbanicity are defined by the Census Bureau and included in IPEDS.
(b) Values reported are at the college level, not the county level.
(c) Some cities in Virginia are classified as counties in our analyses.
RUNNING HEAD: THE COSTS OF COLLEGE ATTENDANCE
Table 4: Institutional Living Cost Allowances (over 9 months) for Off-Campus Students
Compared to County-Level Living Cost Estimates, by Institution Sector and Control.
Institutional living cost allowance vs. estimated expenses
Above by
20+ pct
Above by
10-20 pct
Within 10
pct
Below by
10-20 pct
Below by
20+ pct
Sector (pct of
colleges) N
Scenario 1: Assuming no roommate for all
students.
4-year or above 10.0 7.6 34.6 17.9 29.9 2,425
Public 12.9 12.3 41.1 16.8 16.9 626
Private nonprofit 10.1 6.2 30.7 16.9 36.1 1,175
For-profit 6.7 5.6 35.4 21.2 31.1 624
2-year 11.8 7.4 29.8 17.5 33.6 2,084
Public 9.2 7.3 29.3 19.7 34.5 1,018
Private nonprofit 14.8 8.2 27.0 17.2 32.8 122
For-profit 14.1 7.4 30.6 15.1 32.7 944
Less than 2-year 16.2 8.9 20.4 14.0 40.7 1,749
Public 16.7 6.5 17.6 13.5 45.7 245
Private nonprofit 6.7 0.0 23.3 20.0 50.0 60
For-profit 16.5 9.6 20.7 13.8 39.4 1,444
Grand Total 12.3 7.9 29.0 16.7 34.1 6,258
Scenario 2: Assuming a roommate for all students.
4-year or above 26.1 16.1 32.5 9.6 15.6 2,425
Public 35.9 19.8 31.8 7.7 4.8 626
Private nonprofit 24.2 13.8 29.9 11.7 20.5 1,175
For-profit 20.0 16.7 38.3 7.9 17.1 624
2-year 27.1 12.0 32.1 10.4 18.3 2,084
Public 23.7 12.1 34.4 11.3 18.6 1,018
Private nonprofit 35.2 9.0 26.2 13.9 15.6 122
For-profit 29.8 12.4 30.5 8.9 18.4 944
Less than 2-year 31.9 8.5 23.3 8.3 27.9 1,749
Public 26.9 7.8 21.6 9.8 33.9 245
Private nonprofit 18.3 9.3 31.7 13.3 28.3 60
For-profit 33.3 8.7 23.3 7.9 26.9 1,444
Grand Total 28.1 12.6 29.8 9.5 19.9 6,258
RUNNING HEAD: THE COSTS OF COLLEGE ATTENDANCE
Table 4 (continued).
Institutional living cost allowance vs. estimated expenses
Above by
20+ pct
Above by
10-20 pct
Within
10 pct
Below by
10-20 pct
Below by
20+ pct Sector (pct of colleges) N
Scenario 3: Age-adjusted estimates (assuming roommate for students age 24 or under).
4-year or above 18.6 13.5 36.0 12.4 19.5 2,425
Public 28.6 19.8 34.7 10.5 6.4 626
Private nonprofit 18.0 12.9 33.3 12.4 23.3 1,175
For-profit 9.6 8.3 42.5 14.3 25.3 624
2-year 17.5 11.6 32.6 14.3 23.9 2,084
Public 15.6 11.2 34.0 15.3 23.9 1,018
Private nonprofit 21.3 15.6 24.6 18.0 20.5 122
For-profit 19.1 11.5 32.1 12.8 24.5 944
Less than 2-year 23.7 8.4 22.8 11.3 33.8 1,749
Public 20.0 7.8 20.4 10.6 41.2 245
Private nonprofit 6.7 10.0 21.7 21.7 40.0 60
For-profit 25.1 8.4 23.2 10.9 32.3 1,444
Grand Total 19.7 11.5 31.2 12.7 25.0 6,258
SOURCE: Integrated Postsecondary Education Data System (institutional living cost
allowances); U.S. Department of Housing and Urban Development, U.S. Department of
Agriculture, County Cost of Living Index, Consumer Expenditure Survey, Kaiser Family
Foundation (estimated expenses).
NOTES:
(a) Data used to estimate living expenses are from 2012, while age data are from fall 2011.
(b) Housing costs for no roommates are based on a zero-bedroom (efficiency) apartment, while
housing costs for having a roommate are based on splitting a two-bedroom apartment.
(c) The age-adjusted estimates are produced by assuming students age 24 or under have a
roommate and students age 25 or older live alone and then weighting the estimates.
RUNNING HEAD: THE COSTS OF COLLEGE ATTENDANCE
Table 5: Regression results explaining the percentage difference between colleges' reported living
allowances and our estimated allowances.
Assuming no
roommate
Assuming a
roommate
Age-adjusted
housing mix
Variable Coeff. (SE) Coeff. (SE) Coeff. (SE)
Pct Pell 0.027 (0.030)
0.009 (0.034)
0.021 (0.032)
Pct female 0.096*** (0.019)
0.108*** (0.021)
0.102*** (0.020)
Pct Native American 0.108* (0.058)
0.120* (0.063)
0.115* (0.061)
Pct Asian -0.350*** (0.051)
-0.362*** (0.055)
-0.345*** (0.052)
Pct black -0.085*** (0.027)
-0.042 (0.030)
-0.067** (0.029)
Pct Hispanic -0.106*** (0.033)
-0.079* (0.040)
-0.095*** (0.036)
Pct under age 24 -0.038 (0.027)
-0.034 (0.031)
0.110*** (0.029)
FTE undergraduates (log) 0.008** (0.004)
0.009** (0.004)
0.009** (0.004)
Dependent family income
(log) 0.042** (0.019)
0.048** (0.022)
0.046** (0.020)
Independent family income
(log) -0.005 (0.013)
0.000 (0.015)
-0.003 (0.014)
For-profit 0.001 (0.019)
0.008 (0.022)
0.003 (0.020)
Private nonprofit -0.043** (0.019)
-0.044** (0.021)
-0.046** (0.020)
Tuition and fees (log) 0.005 (0.011)
0.004 (0.012)
0.004 (0.012)
Four-year 0.015 (0.012)
0.016 (0.014)
0.018 (0.013)
Certificate-granting 0.002 (0.015)
0.008 (0.018)
0.007 (0.016)
Program reporter 0.003 (0.017)
-0.001 (0.019)
0.003 (0.018)
County unemployment
(pct) -0.500* (0.292)
-0.346 (0.334)
-0.403 (0.313)
County poverty (pct) 0.913*** (0.123)
0.982*** (0.136)
0.956*** (0.129)
Location: big city -0.031* (0.019)
-0.036* (0.020)
-0.032* (0.019)
Location: suburban -0.034*** (0.012)
-0.036*** (0.013)
-0.035*** (0.012)
Location: rural -0.009 (0.013)
-0.022 (0.014)
-0.017 (0.013)
R-squared value 0.058 0.047 0.066
Number of colleges 5,993
5,993
5,993
Number of counties 1,413 1,413 1,413
Sources: College Scorecard (family income), Census Bureau (unemployment and poverty rates), IPEDS
(all others).
Notes:
(a) * represents p<.10, ** represents p<.05, and *** represents
p<.01.
(b) Standard errors are clustered at the county
level.
(c) Coefficients reflect a one-unit change in the variables (for binary variables, from 0% to 100%).
RUNNING HEAD: THE COSTS OF COLLEGE ATTENDANCE
Table 6: Regression results explaining the absolute value of the percentage difference between
colleges' reported living allowances and our estimated allowances.
Assuming no
roommate
Assuming a
roommate
Age-adjusted
housing mix
Variable Coeff. (SE) Coeff. (SE) Coeff. (SE)
Pct Pell 0.054*** (0.020)
0.061*** (0.020)
0.055*** (0.020)
Pct female 0.019 (0.013)
0.077*** (0.013)
0.047*** (0.013)
Pct Native American -0.070* (0.038)
-0.061 (0.043)
-0.069* (0.039)
Pct Asian 0.124*** (0.043)
-0.107** (0.043)
0.030 (0.043)
Pct black 0.020 (0.016)
-0.004 (0.017)
0.009 (0.016)
Pct Hispanic -0.010 (0.020)
-0.067*** (0.026)
-0.043** (0.021)
Pct under age 24 0.069*** (0.018)
0.044** (0.019)
0.066*** (0.019)
FTE undergraduates (log) -0.020*** (0.003)
-0.017*** (0.003)
-0.019*** (0.003)
Dependent family income
(log) -0.011 (0.012)
-0.004 (0.012)
-0.004 (0.011)
Independent family
income (log) 0.002 (0.009)
0.008 (0.009)
0.003 (0.009)
For-profit -0.008 (0.012)
0.000 (0.014)
-0.006 (0.013)
Private nonprofit 0.034*** (0.012)
0.027* (0.014)
0.024* (0.013)
Tuition and fees (log) -0.019*** (0.007)
-0.020*** (0.008)
-0.023*** (0.007)
Four-year -0.008 (0.008)
0.005 (0.009)
0.005 (0.009)
Certificate-granting 0.030*** (0.010)
0.046*** (0.012)
0.042*** (0.011)
Program reporter 0.007 (0.011)
0.003 (0.012)
0.013 (0.011)
County unemployment
(pct) -0.137 (0.164)
-0.275 (0.193)
-0.238 (0.159)
County poverty (pct) -0.095 (0.071)
0.394*** (0.077)
0.193*** (0.070)
Location: big city 0.014 (0.010)
-0.008 (0.009)
0.001 (0.008)
Location: suburban 0.016** (0.017)
-0.003 (0.008)
0.005 (0.007)
Location: rural 0.001 (0.008)
-0.010 (0.009)
0.001 (0.008)
R-squared value 0.069 0.077 0.072
Number of colleges 5,993
5,993
5,993
Number of counties 1,413 1,413 1,413
Sources: College Scorecard (family income), Census Bureau (unemployment and poverty rates), IPEDS
(all others).
Notes:
(a) * represents p<.10, ** represents p<.05, and *** represents
p<.01.
(b) Standard errors are clustered at the county level.
(c) Coefficients reflect a one-unit change in the variables (for binary variables, from 0% to 100%).
RUNNING HEAD: THE COSTS OF COLLEGE ATTENDANCE
Figure 1: Living allowances, Chicago Loop.
Figure 2: Living allowances, Center City Philadelphia.