Embed Size (px)
Citation preview

The Cost of Borders: Evidence from the Eurasian Customs Union
Arevik Gnutzmann-Mkrtchyana, Hinnerk Gnutzmanna
aInstitute for Macroeconomics, Leibniz University Hannover, Germany
Abstract
How strongly can trade facilitation bene�t trade? We study the most comprehensive tradefacilitation measure possible – complete elimination of customs points – within the EurasianCustoms Union EACU). The EACU abolished internal customs controls between its membersin two stages, which makes it possible to identify the e�ect of border elimination. We �nd thatmost of the trade impact is driven by the non-tari� costs rather than changes in MFN tari�s.Removal of the internal customs controls increased the intra-CU by 65% and hurt trade withthe MFN partners to a similar extent. While the trade gain for the members is largely drivenby the �nal goods trade and at the expense of the MFN partners, the intermediates trade isa�ected much less. This �nding suggests that international fragmentation of production limitsthe scope for trade diversion from regional trade agreements.
Keywords: customs union, non-tari� trade costs, border e�ects, Russia, Belarus, KazakhstanJEL: F14, F15, F55
1. Introduction
Following the reduction in tari�s throughout the world, policymakers are increasingly turningtheir attention to non-tari� barriers to trade. Reducing these barriers – which include productstandards, slow customs processing and excessive paperwork – is a part of the trade facilitationagenda. Administrative burdens on international trade are still substantial in many parts of theworld. However, it is still an open question which are policies are most e�ective in reducingnon-tari� trade barriers, and to what extent these policies are ultimately successful in raisingtrade. This paper studies the trade e�ect of one particularly ambitious trade facilitation policy:the complete elimination of customs borders within a customs union to address this issue.
URL: [email protected] (Arevik Gnutzmann-Mkrtchyan),[email protected] (Hinnerk Gnutzmann)
1

We consider the experience of three middle income countries – Russia, Belarus and Kaza-khstan – which established the “Eurasian Customs Union” in January 2010. The initial tradeagreement involved both the introduction of a common external tari� (CET) and the elimi-nation of internal customs controls within the CU territority. Prior to forming the CU, themember countries were already in free trade agreements (FTAs) which almost entirely elim-inated internal tari�s, but non-tari� barriers remained high (UNECE, 2012, 2013; Vinokurov,2013). For example, Russia and Kazakhstan continue to score poorly on the World Bank’sTrading Across Borders index, which measures the time lost and cost incurred due to tradepolicies. In this setting, trade facilitation measures should be particularly e�ective in raisingtrade. Furthermore, because internal tari�s were already eliminated ahead of the trade facili-tation measure, an important potential confounding factor is excluded. Our results show that– even after controlling for changes in external tari�s due to the CU – the elimination of cus-toms posts was highly e�ective in raising trade. For the average product, it trade increased bymore than 50% due to the border removal. Gains were especially large where trade value waspreviously very low; but also for intensively traded products, trade growth of 20% was causedby the elimination of internal customs controls.
This paper adds to the literature on trade facilitation. On the one hand, Freund and Pierola(2012) �nd that border crossing times and variations in time strongly a�ect trade; similarly,�ndings from Martincus et al. (2013) suggest that customs delays have a signi�cant negativeimpact on exports. Wilson (2007) demonstrates, in a gravity setting, the substantial e�ects ofadministrative procedures on trade volumes. Among the few studies of the e�ectiveness ofpolicy reform is Fernandes et al. (2015), which show that reduction in time to trade increasedtrade values in Albania.
In terms of methods, the study uses highly disaggregated bilateral trade within the CUand with main trade partners of the CU members from 2007 to 2012 to disentangle the tari�and non-tari� impact. Clausing (2001) demonstrates that using product-level data allows tocapture trade e�ects that are blurred in the pooled data while Anderson and Yotov (2010b) andAnderson and Yotov (2010a) show the estimation bias of aggregation.
Theory suggests that trade facilitation in a customs union can drive internal trade growth(Gnutzmann and Gnutzmann-Mkrtchyan, 2017). When countries that are initially in a freetrade agreement “upgrade” their trade agreement to a customs union, internal tari�s – i.e.between the CU members – do not change. However, the member states face incentives toagree on an external tari� that is higher than the previous FTA tari�s; thus, internal trade
2

increases in part due to trade diversion, as third countries may face a higher MFN tari� wall.However, trade facilitating measures such as the closure of internal customs points may reducetrade costs, creating a separate boost for internal trade. From the perspective of third countries,e�ects need to be distinguished by trade regime. On the one hand, those countries that tradeunder MFN with the CU are likely to see their position weakened in the CU market, as highertari�s and lower internal trade costs crowd out their exports. However, countries that have anFTA in place with the CU member countries, may see gains. Since those countries continueto maintain tari�-free access to the CU market, they may crowd out some exports from MFNpartners. At the same time, the reduced internal trade costs again promote CU members totrade more among each other, potentially reducing trade volumes. Thus, while the e�ect ofCU formation and internal trade facilitation is likely to be adverse for MFN partners, it isambiguous for FTA partners.
To identify these e�ects, we rely on variation between goods. Importantly, while averagetari�s certainly rose after CU formation, some goods were not a�ected. In particularly, formany intermediate goods, each of the CU member imposed a zero MFN tari� both and afterCU formation. Thus, changes in internal trade for these products cannot be attributed to exter-nal tari� e�ects. To disentangle the trade diversion and trade facilitation e�ects, we estimateour model separately for products where external tari�s did not change after CU introduction.These results suggest that the majority of the internal trade e�ect in the customs union wasdriven by trade facilitation rather than trade diversion. Regarding third countries, our esti-mates show that FTA partners on average experienced mild positive trade e�ects with the CU;however, this does not hold when the sample is restricted to products where external tari�s donot change. In line with theory, FTA partners bene�t from crowding out of third countries (forproducts where MFN tari�s rose), but themselves see their market position eroded for prod-ucts with unchanged tari�s. For MFN partners, their exports to the CU members decline in allspeci�cations – as expected, the e�ect is largest when including lines where tari�s increased.For products whose tari�s did not change after CU, losses are between 13–33%. This showsthat trade facilitation may have adverse e�ects on third countries, in line with theory.
Countries with poorer customs procedures bene�t more from trade facilitation. We �ndthat the trade-promoting e�ect was largest for Kazakhstan, where trade facilitation is esti-mated to have more than doubled trade with CU members. For Belarus, the e�ect is muchmore modest at 15%, with Russia taking a middle spot. Interestingly, these results mirror ex-actly the ranking of the EACU member countries in the Trading Across Borders index, where
3
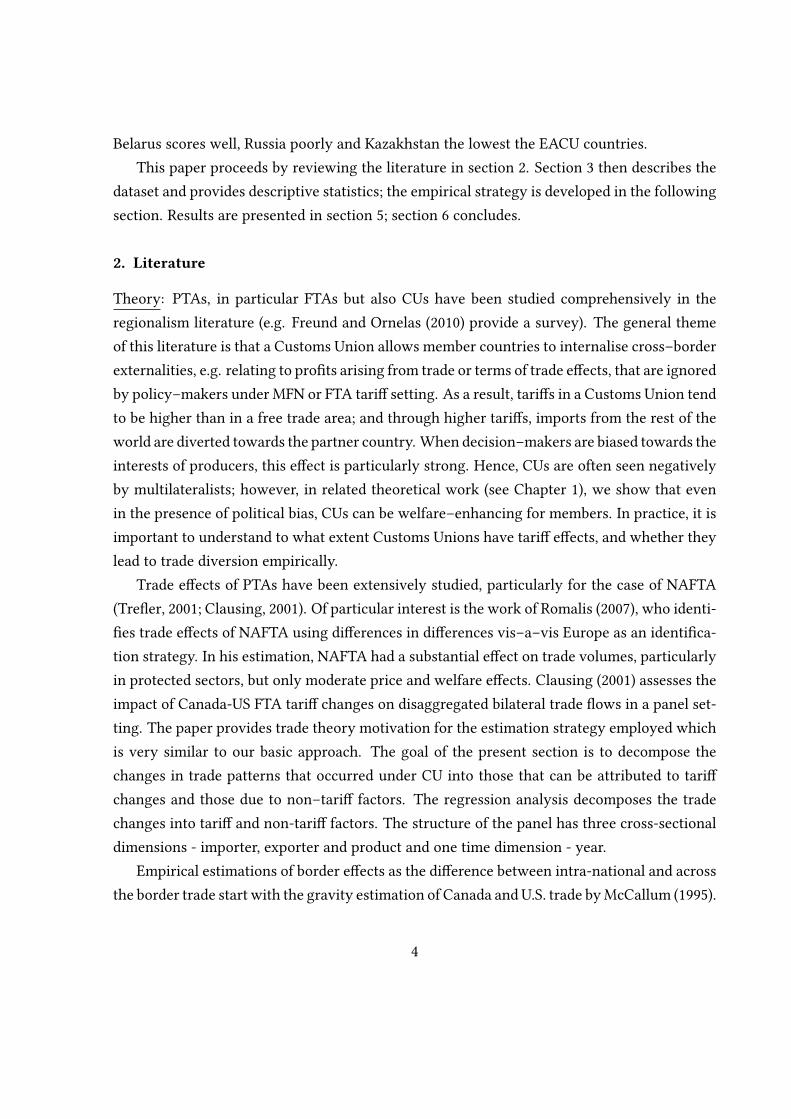
Belarus scores well, Russia poorly and Kazakhstan the lowest the EACU countries.This paper proceeds by reviewing the literature in section 2. Section 3 then describes the
dataset and provides descriptive statistics; the empirical strategy is developed in the followingsection. Results are presented in section 5; section 6 concludes.
2. Literature
Theory: PTAs, in particular FTAs but also CUs have been studied comprehensively in theregionalism literature (e.g. Freund and Ornelas (2010) provide a survey). The general themeof this literature is that a Customs Union allows member countries to internalise cross–borderexternalities, e.g. relating to pro�ts arising from trade or terms of trade e�ects, that are ignoredby policy–makers under MFN or FTA tari� setting. As a result, tari�s in a Customs Union tendto be higher than in a free trade area; and through higher tari�s, imports from the rest of theworld are diverted towards the partner country. When decision–makers are biased towards theinterests of producers, this e�ect is particularly strong. Hence, CUs are often seen negativelyby multilateralists; however, in related theoretical work (see Chapter 1), we show that evenin the presence of political bias, CUs can be welfare–enhancing for members. In practice, it isimportant to understand to what extent Customs Unions have tari� e�ects, and whether theylead to trade diversion empirically.
Trade e�ects of PTAs have been extensively studied, particularly for the case of NAFTA(Tre�er, 2001; Clausing, 2001). Of particular interest is the work of Romalis (2007), who identi-�es trade e�ects of NAFTA using di�erences in di�erences vis–a–vis Europe as an identi�ca-tion strategy. In his estimation, NAFTA had a substantial e�ect on trade volumes, particularlyin protected sectors, but only moderate price and welfare e�ects. Clausing (2001) assesses theimpact of Canada-US FTA tari� changes on disaggregated bilateral trade �ows in a panel set-ting. The paper provides trade theory motivation for the estimation strategy employed whichis very similar to our basic approach. The goal of the present section is to decompose thechanges in trade patterns that occurred under CU into those that can be attributed to tari�changes and those due to non–tari� factors. The regression analysis decomposes the tradechanges into tari� and non-tari� factors. The structure of the panel has three cross-sectionaldimensions - importer, exporter and product and one time dimension - year.
Empirical estimations of border e�ects as the di�erence between intra-national and acrossthe border trade start with the gravity estimation of Canada and U.S. trade by McCallum (1995).
4

Anderson and Van Wincoop (2001) pointed to the overestimation of the border e�ects by Mc-Callum (1995) due to omitted variable bias - country-speci�c price index. Further, Feenstra(2002) suggests the use of importer-exporter �xed e�ects over the computational method ofAnderson and Van Wincoop (2001) of controlling for price index as �xed e�ects provide consis-tent estimates, control for other possible country-speci�c omitted variables and are simple toapply. Olper and Raimondi (2008) follow Feenstra (2002) in their gravity estimation of bordere�ects follow and for OECD countries. Requena and Llano (2010) and Emlinger et al. (2008)use sectoral data and include the country- and industry-�xed e�ects. Similar to this paperChen and Novy (2011) apply a gravity model of bilateral trade for disaggregate panel data.
These studies rely on the theoretical model behind the gravity equation as in Andersonand Van Wincoop (2004).
Analysis of the CU of Russia, Belarus and Kazakhstan: Isakova and Plekhanov (2012) in-vestigate the impact of the Customs Union on the structure of imports in Kazakhstan. Theynote that Kazakh–Russian trade fell before the Customs Union became e�ective, creating thepossible problem that increases in bilateral trade could be due to a natural recovery – whichwould have happened even in the absence of a CU being formed – rather than causal. Us-ing ITC Trade Map time series data from 2006–2010 disaggregated at the 10–digit level andstatutory tari�s the authors then estimate a panel of the form
∆IMj,t = α∆dj,t + βIMj,t−1 + λZj,t + εj,t (1)
with IM being the (log) import �ows, d the change in the tari�, and Z a vector of controls,which include lagged import changes (to account for possible natural recovery e�ects). Theirparameter of interest is α - captures change in trade due to change in tari�s, and the modelis separately estimated by trading partner. In addition, there are �xed e�ects at the productgroup (i.e. 2 digit) level. Estimated for the Customs Union partners, their model yields apositive and signi�cant estimate of α. A 1% increase in tari�s would promote intra–CU by0.8%. For other trading partners – they consider China, European Union, CIS and Rest of theWorld, the estimate is of α is negative, but small and not signi�cant at the 5% level. Theyconclude that the Customs Union had a small impact on trade promotion and some evidenceof trade diversion.
Using similar strategy, Isakova et al. (2013) extends the previous work to include Russiaand Belarus. The study explains the change in the trade between 2009 and 2010 through tari�
5

changes. They �nd some trade creation for Russia with the rest of the world due to tari� falls inthat country. The �nd positive impact of tari� increases on imports from Russia. The authorsnote that the magnitude is however small and they anticipate that the larger bene�ts couldcome from reduced internal trade costs. Tarr (2012) argues that previous attempts for deepregional integration projects of Russia were failing as they involved transfers from potentialmembers to Russia, and in this respect the current Customs Union aims to reduce internal tradecosts in which case other members will also bene�t. The author also suggests that Russia’sWTO accession will be a step in the direction of reducing non-tari� barriers to trade.
Krotov (2011) presents a detailed discussion of the Customs Union’s administration system,customs legislation and clearance. He �nds that the Customs Union is functional and, althoughthe rules are yet to be fully formed, the necessary institutions and legislation for CustomsUnion’s work are at place.
Dragneva and Wolczuk (2012) discuss the impact of the Customs Union on the EU’s re-lationship with eastern neighbours, in particular, Ukraine. The paper also mentions that EUhas become associated with modernization and rules-based governance, promoting Russia toadopt similar approach for its regional policy, speci�cally, by highlighting the economic gainsand rules-based functioning of the Customs Union for potential members.
3. Data and Descriptive Statistics
3.1. Trade Flows
Bilateral trade �ows were obtained from at the 6-digit level according to HS2002 classi�cationcome from UN COMTRADE cover the period from 2006 to 2014.
The data is inaccurate for some bilateral intra-CU trade �ows in 2010. Whenever possible,the mirror data for the whole sample was used for consistency. However in the case of exportsof Russia to Kazakhstan in 2010 the mirror data did not resolve the problem, and this trade�ow is controlled for by a dummy in the regressions.
In the years prior to formation of the Customs Union, internal trade between the threecountries amounted to $44bn., about 16% of total imports by the three countries. The bilateral�ows are highly uneven: in 2009, Russian exports to Belarus and Kazakhstan respectivelyaccounted for 46% and 24% respectively of the total. Belarussian exports to Russia made upanother 18%, and Kazakh exports to the same destination 10%. Belarussian-Kazakh trade, atjust over 1% of the total, was almost insigni�cant.
6

TABLE 1Intra-CU bilateral trade exports (excluding mineral fuels)
Importer Exporter 2008, USD bln 2011, USD bln Growth, %RU BY 10.5 14.3 36RU KZ 4.48 5.74 28
KZ RU 9.02 11.9 31KZ BY 0.360 0.668 85
BY RU 9.65 8.24 -14BY KZ 0.172 0.102 -40
Total 34.2 41.0 20
Source: uthors’ calculations
The table 2 summarises the changes in intra-CU export �ows for a pre-crisis year 2008before the creation of the CU and for 2011, by which year intra-CU borders were removed.
By 2011 some changes were already apparent as Table 1 shows. Internal trade grew byabout 20% from pre-crisis level of 2008 to $41bn (excluding mineral fuels), faster than the10% growth in total non-fuel imports of the three countries. Thus, the intra-CU trade sharerose from 10% to 12.4%. Exports from both Belarus and Kazakhstan to the Russian marketincreased signi�cantly, by 36% and %28, respectively, compared to 2008. Exports from Russiato Kazakhstan grew by 31%, while from Belarus to Kazakhstan – by 85%, making these bilateraltrade �ows the fastest growing. However Belarus’ imports from Kazakhstan and Russia wentdown 40% and 14%, respectively.
Table 2 presents the share of bilateral intra-CU trade in the total non-fuel imports andcon�rms the observations from the Table 1. The share of imports from the CU partners sig-ni�cantly increases for Kazakhstan and Russia while decreasing for Belarus.
The 6-digit tari� data comes from UNCTAD and is obtained from the World Bank’s TRAINSplatform for the period of 2006-2014. Table 3 summarises the tari� averages of the membersand the number of product lines where no tari� was levied for the per-CU year 2009 and post-harmonization year 20101. The tari� means are calculated as simple averages of the tari� lines
1tari� averages before 2009 are similar to the 2009 levels, while tari�s after 2010 are similar to the 2010 levels.Important changes in the MFN tari�s happened took place in 2010
7
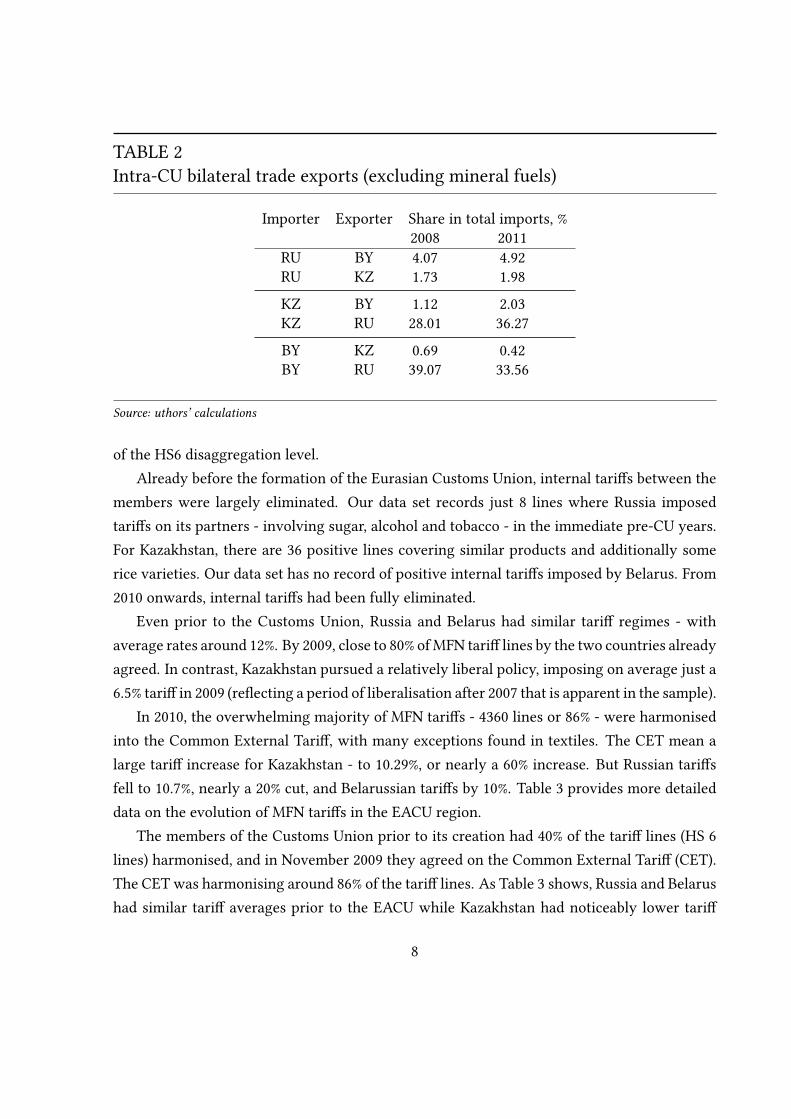
TABLE 2Intra-CU bilateral trade exports (excluding mineral fuels)
Importer Exporter Share in total imports, %2008 2011
RU BY 4.07 4.92RU KZ 1.73 1.98
KZ BY 1.12 2.03KZ RU 28.01 36.27
BY KZ 0.69 0.42BY RU 39.07 33.56
Source: uthors’ calculations
of the HS6 disaggregation level.Already before the formation of the Eurasian Customs Union, internal tari�s between the
members were largely eliminated. Our data set records just 8 lines where Russia imposedtari�s on its partners - involving sugar, alcohol and tobacco - in the immediate pre-CU years.For Kazakhstan, there are 36 positive lines covering similar products and additionally somerice varieties. Our data set has no record of positive internal tari�s imposed by Belarus. From2010 onwards, internal tari�s had been fully eliminated.
Even prior to the Customs Union, Russia and Belarus had similar tari� regimes - withaverage rates around 12%. By 2009, close to 80% of MFN tari� lines by the two countries alreadyagreed. In contrast, Kazakhstan pursued a relatively liberal policy, imposing on average just a6.5% tari� in 2009 (re�ecting a period of liberalisation after 2007 that is apparent in the sample).
In 2010, the overwhelming majority of MFN tari�s - 4360 lines or 86% - were harmonisedinto the Common External Tari�, with many exceptions found in textiles. The CET mean alarge tari� increase for Kazakhstan - to 10.29%, or nearly a 60% increase. But Russian tari�sfell to 10.7%, nearly a 20% cut, and Belarussian tari�s by 10%. Table 3 provides more detaileddata on the evolution of MFN tari�s in the EACU region.
The members of the Customs Union prior to its creation had 40% of the tari� lines (HS 6lines) harmonised, and in November 2009 they agreed on the Common External Tari� (CET).The CET was harmonising around 86% of the tari� lines. As Table 3 shows, Russia and Belarushad similar tari� averages prior to the EACU while Kazakhstan had noticeably lower tari�
8

TABLE 3Trends in MFN Tari�s
Year N of rows N of rows with zero tari� Mean MFN tari�Russia Belarus Kazakhstan Russia Belarus Kazakhstan
2009 5052 445 373 1164 12.18 11.81 6.492010 5052 554 554 712 10.67 10.60 10.30
Source: Authors’ calculations
average. The creation of the Customs Union and tari� harmonisation led to 1,5% and 1,2%decrease in mean MFN tari� for Russia and Belarus, respectively and 3,8% increase in meanMFN tari� for Kazakhstan. The MFN tari� is applied among important trade partners, inparticular, to the EU and US.
The di�erences in the trade policy of Russia and Belarus on one side and Kazakhstan onthe other side prior to the creation of the Customs Union is seen also through the number oftari� lines where no tari� is levied. In Kazakhstan 1164 product lines were subject to free tradeprior to the EACU, almost three times more than in the partner countries, and Kazakhstan gota transition period to reduce that number over the course of several years.
Data on the bilateral trade preference regimes and trade agreements comes from Baieret al. (2014). The database provide bilateral trade agreements until 2012. In order to includeyears 2013 and 2014, we interpolated the agreements in the last two years as in 2012. Thisassumption is not very demanding as trade agreements are rarely downgraded, and creationof new ones is a slow process. We ran regressions with restricted sample to only until 2012and only until 2013 for robustness, the �ndings were in line with those found for the wholesample.
Classi�cation of HS 6-digit goods into primary, intermediate and �nal comes from Stur-geon and Memedovic (2010). The authors develop a more precise division of goods into up-stream and downstream products than provided by BEC classi�cation.
4. Empirical Strategy
The paper follows the basic structural model of gravity equation developed by Anderson andVan Wincoop (2003) adapted for disaggregated panel data. Adopting the panel approach withvarying trade costs across goods requires adjustment of the structural model and estimation
9
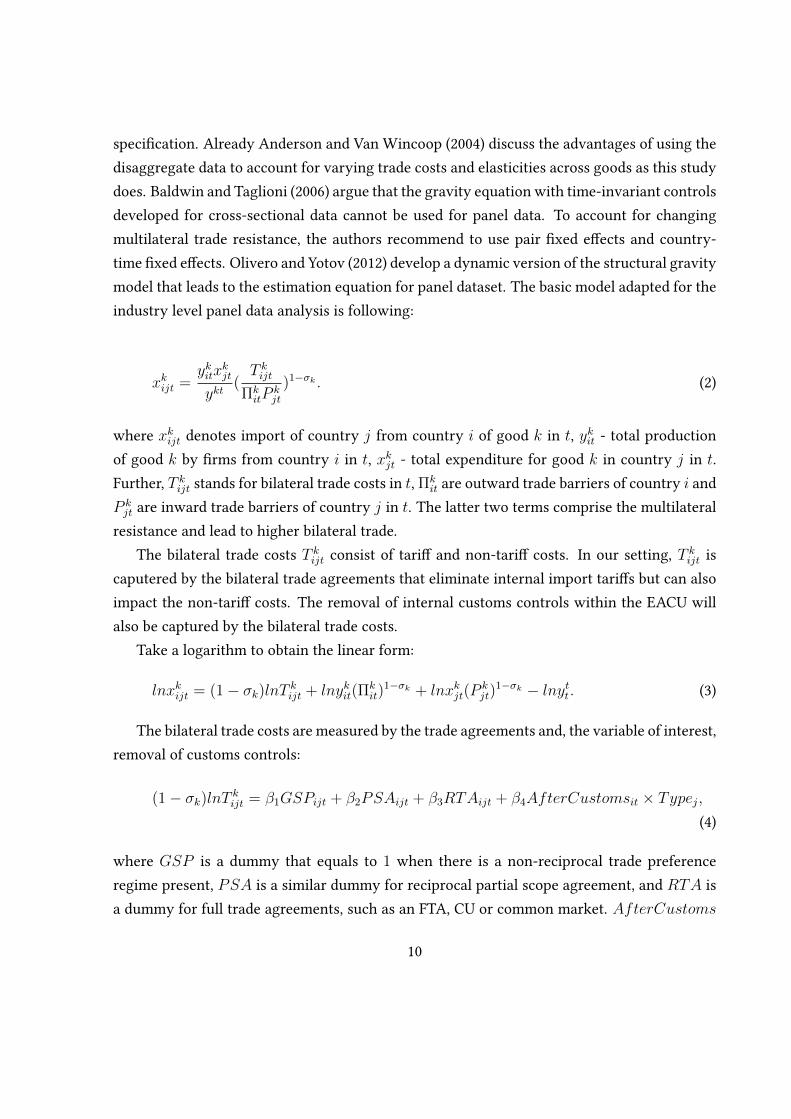
speci�cation. Already Anderson and Van Wincoop (2004) discuss the advantages of using thedisaggregate data to account for varying trade costs and elasticities across goods as this studydoes. Baldwin and Taglioni (2006) argue that the gravity equation with time-invariant controlsdeveloped for cross-sectional data cannot be used for panel data. To account for changingmultilateral trade resistance, the authors recommend to use pair �xed e�ects and country-time �xed e�ects. Olivero and Yotov (2012) develop a dynamic version of the structural gravitymodel that leads to the estimation equation for panel dataset. The basic model adapted for theindustry level panel data analysis is following:
xkijt =ykitx
kjt
ykt(T kijt
ΠkitP
kjt
)1−σk . (2)
where xkijt denotes import of country j from country i of good k in t, ykit - total productionof good k by �rms from country i in t, xkjt - total expenditure for good k in country j in t.Further, T kijt stands for bilateral trade costs in t, Πk
it are outward trade barriers of country i andP kjt are inward trade barriers of country j in t. The latter two terms comprise the multilateral
resistance and lead to higher bilateral trade.The bilateral trade costs T kijt consist of tari� and non-tari� costs. In our setting, T kijt is
caputered by the bilateral trade agreements that eliminate internal import tari�s but can alsoimpact the non-tari� costs. The removal of internal customs controls within the EACU willalso be captured by the bilateral trade costs.
Take a logarithm to obtain the linear form:
lnxkijt = (1− σk)lnT kijt + lnykit(Πkit)
1−σk + lnxkjt(Pkjt)
1−σk − lnytt. (3)
The bilateral trade costs are measured by the trade agreements and, the variable of interest,removal of customs controls:
(1− σk)lnT kijt = β1GSPijt + β2PSAijt + β3RTAijt + β4AfterCustomsit × Typej,(4)
where GSP is a dummy that equals to 1 when there is a non-reciprocal trade preferenceregime present, PSA is a similar dummy for reciprocal partial scope agreement, and RTA isa dummy for full trade agreements, such as an FTA, CU or common market. AfterCustoms
10

is the variable of interest that equals to one after the removal of customs controls within theEACU and exporter Typej is a dummy equal to one when the exporter belongs to a certaingroup. The set of exporters for which Type equals to one will vary across estimations. Inparticular, we will distinguish the exporters that are EACU members, FTA partners of theEACU members and third countries.
The terms ykit(Πkit)
1−σk and xkjt(P kjt)
1−σk are estimated with the exporter- and-importer-time-product �xed e�ects, thus leading to the structural model based gravity equation. Fur-ther, we include country-pair-product �xed e�ects to account for the endogeneity of trade pol-icy and time-invariant information abourt bilateral trade costs ((Baier and Bergstrand, 2007;Agnosteva et al., 2014; Egger and Nigai, 2015).
lnxkij = β1GSPijt + β2PSAijt + β3RTAijt + β4AfterCustomsit × Typej (5)
+ αkit + γkjt + θkij + εkijt.
4.1. Removal of Customs Controls
Creation of the Eurasian Customs Union had an impact of both tari�s and non-tari� costs. Themost important non-tari� change was the removal of customs controls between members thattook place in two stages. Figure 1 visualises the order in which the internal customs checksin the CU were removed. As the time-line of the CU indicates, the borders were removed intwo stages: �rst, in 2010 between Russia and Belarus and only in 2011 between Russia andKazakhstan.
FIGURE 1Stages of Customs Controls Removal in the CU
pre-CU July 2010 July 2011
Source: Authors
There are several implications from the removal of customs controls. First, there are fewer
11

administrative obstacles to trade within the CU. All import and export within the CU canhappen without any customs check crossing leading to savings in customs waiting times, doc-ument checks, possible bribes and etc. Second, similar e�ect extends to the non-CU partners.Indeed, once the goods go through the customs clearance at the borders of the CU, they canbe easier transported to all the CU members.
Further, the lack of internal customs controls creates a base for the common economicmarket, in particular from the investment perspective. In the common economic market the�rms can invest in either of the CU members and sell the products in all the CU countries. Atthe same time foreign investment is often associated with imports of equipment and materialsfrom rest of the world. There are already examples of investment and production decisionsoriented to the common market, e.g. China’s investment in Belarus with the focus on potentialexports to Russia (Anishenko (2014)).
Finally, the international fragmentation of production of recent decades has been well es-tablished. This means that, mainly apart from agricultural products, any trade creation in theintra-CU trade will necessarily imply increase in demand in imports from non-members. Asan example, among the automotive companies with local plants in Russia, Renault-Nissan isthe leader with 70% sourcing locally, while others are much lower: Volkswagen and Hyundaiwith 50% and Ford, General Motors and Toyota around 10-30% (Frost and Davies (2014)).
The removal of internal customs controls impacts both internal trade and trade with ex-ternals. Firms from the CU do not have to cross customs controls when selling within theEACU members. Firms from non-members countries have to pass through a customs controlbut once in the EACU they, too, can enjoy trade facilitation. Thus we are interested to measurethe trade facilitation e�ect of the removal of customs controls on di�erent types of exporters.
Creation of EACU brought a new common external tari� of the members, thus we shoulddistinguish the changes caused by the new MFN tari�s from the removal of customs controls.Due to changes in the MFN tari�s, we could expect the customs controls removal to impact thetrade partners that pay MFN tari� di�erently than those that enjoy free trade due to multipliere�ects.
AfterCustomsit =
1 if i = (Belarus, Russia), t ≥ 2010
1 if i = (Belarus, Kazakhstan, Russia), t ≥ 2011
0 otherwise
.
12

The analysis is based on interacting the removal of customs controls in the EACU withcertain groups of exporters. Additionally, we interact the removal of the customs controlswith upstream and downstream goods to examine how goods in di�erent stages of productionprocess are a�ected by the trade policy.
Further, MFN tari� changes brought by the EACU will impact both the countries that paythe MFN rates and those that enjoy free trade. Indeed, higher tari� imposed by an EACU mem-ber, puts the partners enjoying duty-free trade in a better position. In the case of the customsunion of Russia, Belarus and Kazakhstan, this argument is very quite important. Although theinternal tari�s were zero already before the CU, the MFN tari�s saw signi�cant changes dueto harmonization. Increase in MFN tari� should be positively associated with the intra-CUtrade and trade with the FTA partners. We will focus on the lines with zero MFN tari�s andlines with constant equal tari�s throughout the sample period to isolate the non-tari� e�ects.
5. Results
This section presents the impact of the removal of customs controls within the EACU. First,we look at the impact on the intra-CU trade. That is, the exporters are EACU membersType = 1j ∈ (Belarus,Kazakhstan,Russia). Moreover, as controls between Kazakhstanand Russia were removed only in 2011, we decided to include it as a “no-border” exporter from2011 only.
Table 4 shows that the increase in the intra-EACU trade ranges between 20% and 80%. Thee�ect is about 20− 30% once we focus on the goods that have a yearly bilateral import valusof at least USD100, 000 in columns (2) and (7). EACU brought MFN tari� changes, which canlead to an increase in trade among EACU members, bene�ting from duty-free trade. Columns(5) and (6) isolate the non-tari� impact by restricting the sample to the goods for which theMFN tari�s were zero or didn’t change throughout sample for all members. The overall e�ectin the baseline more (1) is almost fully driven by the removal of the customs controls as theestimated coe�cient in the baseline model is comparable to those in columns (5) and (6). Thisis also con�rmed by the similarity of the coe�cients estimated in models (2) and (7). Model (8)further interacts the customs controls removal e�ects with the EACU importers. As expectedfrom the descriptive statistics in 1 and 2, customs controls removal had the smallest impact onBelarus. This could be connected with the pre-existing trade facilitation measures that existedbetween Russia and Belarus.
13

14
TABLE 4Removal of Customs Controls: E�ect on Internal Trade
Dependent Log Import Value
(1) (2) (3) (4) (5) (6) (7) (8)Sample
Product Sample Baseline Baseline All Products Baseline Baseline Baseline Baseline Baseline
Trade Restriction More >100K More >100K
MFN Restriction Only Only Tari�s Only Tari�s Only Tari�s
MFN Zero unchanged unchanged unchangedCustoms Removal E�ect
AfterCustomsit× 0.73*** 0.29*** 0.72*** 0.79*** 0.51*** 0.59*** 0.19***EACU exporters (44.85) (17.85) (44.75) (49.1) (8.64) (17.84) (5.46)
Importer Interaction Terms
Belarus 0.15***(3.73)
Kazakhstan 1.05***(20.65)
Russia 0.58***(7.93)
Controls
GSP 0.10*** 0.046*** 0.10*** 0.10*** 0.080*** 0.081*** 0.039** 0.084***(17.85) (7.52) (17.83) (18.34) (3.79) (6.53) (3.09) (6.73)
PSA -0.051*** -0,003 -0.051*** -0.051*** -0.040** -0.053*** -0.0056 -0.053***(-13.86) (-0.63) (-13.85) (-13.76) (-3.25) (-6.95) (-0.63) (-6.88)
RTA 0.048*** 0.053*** 0.048*** 0.048*** 0.033** 0.051*** 0.046*** 0.050***(14.3) (15.19) (14.33) (14.36) (2.94) (7.43) (6.84) (7.31)
Underreporting -0.80*** -0.68*** -0.80*** -0.93*** -0.81*** -0.75*** -0.61***(-26.87) (-28.40) (-26.96) (-9.19) (-13.72) (-14.42) (-10.20)
N 54612518 15297770 54831920 54612518 4114739 13091799 3814659 13091799
All regressions include importer-product-year, exporter-product-year and importer-exporter-product �xed e�ects.t statistics in parentheses+ p<0.10, * p<0.05, ** p<0.01, *** p<0.001Baseline products exclude fuels (HS Group 27).
Source: Authors

Table 5 assesses the e�ect of the removal of internal EACU customs controls on importsfrom the FTA partners of the EACU members. These countries are Armenia, Kyrgyzstan,Moldova, Tajikistan and Ukraine, the latter being the most important FTA partner within thesample period2. The estimated non-tari� impact of the EACU is not consistent across the esti-mated models. The FTA are expected partners to gain from MFN tari�. The e�ect is moderatelypositive in models (1) to (4), however in models (5) to (8) where only goods with constant MFNtari�s are included, the e�ect turns negative. Column (8) helps to dissect the overall e�ect byconsidering each EACU importer separately. The FTA partners increased their exports to Kaza-khstan by about 30% due to the removal of customs controls in the EACU while decreasingexports to Belarus and Russia.
The asymmetric impact of the removal of customs controls on EACU members and FTApartners is a familiar case of trade agreement’s impact on non-members, although here itis about non-tari� e�ect only. The EACU members could enjoy trade without burdensomecustoms checks while FTA partners that still have to cross customs checks when exporting tothe EACU.
Table 6 considers the imports of the EACU members from MFN partners. The removalof the internal customs controls in the EACU had a consistently negative e�ect on the MFNexporters. The e�ect is stronger for goods with small trade values, and more modest for goodsthat have a yearly import value ofUSD100, 000. Further, the isolated non-tari� e�ect (modelswith constant tari�s (5)-(8)), estimated at around 13%−33% fall in exports, is less negative thanthe baseline model. This suggests that changes in MFN tari�s had an indirect trade-depressinge�ect, as the direct impact of MFN tari�s is controlled through importer-product-year �xede�ects. Such indirect impact of tari�s is well known in trade agreements theory since seminalwork of Krishna (1998) but, to our knowledge, has not been empirically assessed. Finally,as model (8), the largest e�ect is found in exports to Kazakhstan. Note that Kazakhstan hadthe largest increase in MFN tari�s, and the �nding would be expected in overall sample butmodel (8) includes products with identical MFN tari�s with no change in the sample periodfor all EACU members. This suggests that the reduction in non-tari� costs among the EACUmembers is the driving force.
2Russia formally suspended its FTA with Ukraine in December 2015. However trade could have been seriouslya�ected already in 2014, thus reported �ndings can be seen as lower bound. However regressions without 2014didn’t lead to signi�cantly di�erent results
15

16
TABLE 5Removal of Customs Controls: E�ect on FTA partners
Dependent Log Import Value
(1) (2) (3) (4) (5) (6) (7) (8)Sample
Product Sample Baseline Baseline All Products Baseline Baseline Baseline Baseline Baseline
Trade Restriction More >100K More >100K
MFN Restriction Only Only Tari�s Only Tari�s Only Tari�s
MFN Zero unchanged unchanged unchangedCustoms Removal E�ect
AfterCustomsit× 0.044* 0.00056 0.046* 0.037+ -0.25*** -0.094* 0.016FTA exporters (2.14) (0.03) (2.21) (1.82) (-4.07) (-2.29) (0.34)
Importer Interaction Terms
Belarus -0.18**(-3.05)
Kazakhstan 0.27**(3.24)
Russia -0.24***(-4.25)
GSP 0.087*** 0.040*** 0.087*** 0.089*** 0.066** 0.068*** 0.036** 0.067***(15.31) (6.58) (15.31) (15.69) (3.14) (5.44) (2.85) (5.43)
PSA -0.053*** -0.0038 -0.053*** -0.052*** -0.041*** -0.054*** -0.0060 -0.054***(-14.24) (-0.81) (-14.23) (-14.14) (-3.33) (-7.11) (-0.67) (-7.09)
RTA 0.048*** 0.052*** 0.048*** 0.048*** 0.033** 0.050*** 0.046*** 0.051***(14.33) (15.03) (14.36) (14.45) (2.98) (7.42) (6.80) (7.45)
Underreporting -1.21*** -0.86*** -1.21*** -1.21*** -1.15*** -0.88*** -1.16***(-40.94) (-38.98) (-41.03) (-12.11) (-20.11) (-18.33) (-20.21)
N 54612518 15297770 54831920 54612518 4114739 13091799 3814659 13091799
All regressions include importer-product-year, exporter-product-year and importer-exporter-product �xed e�ects.t statistics in parentheses+ p<0.10, * p<0.05, ** p<0.01, *** p<0.001Baseline products exclude fuels (HS Group 27).
Source: Authors

17
TABLE 6Removal of Customs Controls: E�ect on MFN partners
Dependent Log Import Value
(1) (2) (3) (4) (5) (6) (7) (8)Sample
Product Sample Baseline Baseline All Products Baseline Baseline Baseline Baseline Baseline
Trade Restriction More >100K More >100K
MFN Restriction Only Only Tari�s Only Tari�s Only Tari�s
MFN Zero unchanged unchanged unchangedCustoms Removal E�ect
AfterCustomsit× -0.46*** -0.19*** -0.46*** -0.51*** -0.18*** -0.33*** -0.13***External exporters (-34.75) (-13.77) (-34.77) (-38.38) (-4.01) (-12.29) (-4.21)
Importer Interaction Terms
Belarus -0.043(-1.19)
Kazakhstan -0.86***(-18.77)
Russia -0.087+(-1.90)
GSP 0.10*** 0.046*** 0.10*** 0.11*** 0.076*** 0.080*** 0.039** 0.082***(18.03) (7.55) (18.02) (18.64) (3.60) (6.44) (3.09) (6.56)
PSA -0.051*** -0.0030 -0.051*** -0.051*** -0.041** -0.053*** -0.0056 -0.053***(-13.85) (-0.64) (-13.84) (-13.73) (-3.27) (-6.98) (-0.63) (-6.89)
RTA 0.048*** 0.053*** 0.048*** 0.048*** 0.033** 0.050*** 0.046*** 0.050***(14.32) (15.16) (14.35) (14.40) (2.95) (7.40) (6.83) (7.30)
Underreporting -0.96*** -0.75*** -0.96*** -1.12*** -0.97*** -0.80*** -0.73***(-32.29) (-32.45) (-32.37) (-11.17) (-16.60) (-15.92) (-12.30)
N 54612518 15297770 54831920 54612518 4114739 13091799 3814659 13091799
All regressions include importer-product-year, exporter-product-year and importer-exporter-product �xed e�ects.t statistics in parentheses+ p<0.10, * p<0.05, ** p<0.01, *** p<0.001Baseline products exclude fuels (HS Group 27).
Source: Authors

5.1. Results for Upstream and Downstream Goods
International fragmentation of production can create a limit to trade diverting e�ects of re-gional integration as demand for output of an agreement partner increases the demand for in-puts, including imported inputs. Traditional assessment of trade creation and trade diversione�ects of trade agreements assumes vertically integrated production. However many productsrequire imported inputs in the production process. This raises a question how a regional tradeagreement a�ects products in di�erent stages of production process. As an example, tradefacilitation in the customs union might allow Belarusian exporters to expand their exports toKazakhstan as the expense of producers outside of the customs union. But the increase indemand for Belarusian goods will lead to an increase in inputs demand, including importedinputs. Thus trade facilitation, by increasing the overall demand, can increase demand forinputs from non-members of the agreement. In particular, if the input demand increase is suf-�ciently strong, it would reduce or eliminate trade diversion e�ects of trade agreements. Weexamine whether such asymmetric e�ect on inputs is present in the aftermath of the removalof internal customs controls in the EACU.
Table 7 presents the results for di�erent groups of exporters that were separately esti-mated. First, we see that both EACU members and FTA partners gained from the EACU in�nal goods exporters. However �nal goods could have largest MFN tari� increases whichbene�t exporters that enjoy duty-free trade. Columns (5) and (6) look at goods with zero MFNtari�s and constant identical MFN tari�s of EACU members in order to separate the non-tari�impact from MFN tari� changes. The �nding is robust for internal trade: the gains are largeand concentrated in �nal goods trade. The EACU members boost their internal trade thanks tothe trade facilitating e�ect of trade without customs controls. However the positive e�ect onthe FTA partners disappears suggesting that tari� preferences are important for their exports.Instead, removal of internal customs controls of EACU, while bene�ting internal trade, doesnot have a trade-promoting e�ect on FTA partners.
Consistent with our hypothesis, inputs trade of MFN partners su�ered least from the re-gional integration. Although the exports of MFN partners decreased because of removal ofinternal customs controls for all goods, the estimated coe�cient for �nal goods is about dou-ble in magnitude than for primary and intermediate goods. Note that the negative e�ect seemsto be driven by non-tari� trade costs as we can see from columns (5) and (6).
18

19
TABLE 7Removal of Customs Controls: E�ects on Upstream and Downstream Products
Dependent Log Import Value
(1) (2) (3) (4) (5) (6)Sample
Product Sample Baseline Baseline All Products Baseline Baseline Baseline
Trade Restriction More >100K
MFN Restriction Only Only Tari�s
MFN Zero unchangedRemoval of Customs Controls: E�ect on Internal Tradea
rimary 0.24* 0.094 0.24* 0.33** 1.26* 0.68***(2.38) (0.88) (2.38) (3.23) (2.32) (3.43)
Intermediate 0.48*** 0.18*** 0.48*** 0.56*** 0.073 0.57***(10.96) (3.69) (10.96) (12.68) (0.22) (5.93)
Fianl 1.09*** 0.45*** 1.09*** 1.16*** 1.21*** 0.99***(25.49) (9.82) (25.49) (26.66) (5.91) (5.96)
Removal of Customs Controls: E�ect on FTA Partnersa
Primary 0.20 0.31+ 0.20 0.19 -0.22 0.70**(1.55) (1.87) (1.55) (1.43) (-0.61) (3.13)
Intermediate 0.029 0.044 0.029 0.023 0.33 -0.045(0.37) (0.46) (0.37) (0.29) (0.81) (-0.23)
Final 0.33*** 0.17** 0.33*** 0.32*** 0.12 0.10(6.87) (2.97) (6.87) (6.77) (0.63) (0.65)
Removal of Customs Controls: E�ect on MFN Partnersa
Primary -0.23** -0.17+ -0.23** -0.30*** -0.66+ -0.73***(-2.74) (-1.72) (-2.74) (-3.52) (-1.83) (-4.77)
Intermediate -0.34*** -0.15** -0.34*** -0.40*** -0.12 -0.42***(-8.45) (-3.24) (-8.45) (-9.98) (-0.43) (-4.77)
Final -0.77*** -0.37*** -0.77*** -0.82*** -0.78*** -0.65***(-23.49) (-9.83) (-23.49) (-24.49) (-5.15) (-5.21)
N 18591785 4713945 18591785 18591785 830578 3435981
a. Other controls are not reported.All regressions include importer-product-year, exporter-product-year and importer-exporter-product �xed e�ects.t statistics in parentheses+ p<0.10, * p<0.05, ** p<0.01, *** p<0.001Baseline products exclude fuels (HS Group 27).
Source: Authors
6. Conclusion
This paper showed that much of the trade increase in the Eurasian Customs Union can beattributed to the removal in internal borders. We bene�ted from the natural experiment of CUestablishment, which allowed a direct measurement of the e�ect of border removal. The tradepromoting e�ect of border removal applies most strongly to internal trade – where producersalready bene�ted from zero tari�s for almost all goods before the formation of the CU – butwere held back by high trade costs. Furthermore, external trade partners also bene�ted fromthe border removal, as reduced trade costs through easier transit had benign e�ects on theirtrade volume.
Generally, our results demonstrate strong trade e�ects due to CU formation. While a smallpart of this was driven by increases in external tari�s, the lion’s share is accounted for byreduced internal trade costs. Countries that scored worse on the Trading Across Borders indexexperienced higher gains from removal of customs points. In this regard, the CU membercountries appear to have bene�ted from trade facilitation.
For third countries, an ambiguous picture emerges. On the one hand, MFN partner lostground in the CU market: most strongly for those products where tari�s rose. But reducedinternal trade costs also crowded out some exports for products where tari�s did not change.For FTA partners, the latter e�ect also applies and contributed to trade falls. However, FTApartners saw their trade values rise in those goods where MFN tari�s were increased.
References
Agnosteva, D. E., Anderson, J. E., and Yotov, Y. V. (2014). Intra-national trade costs: Measure-ment and aggregation. Technical report, National Bureau of Economic Research.
Anderson, J. E. and Van Wincoop, E. (2001). Gravity with gravitas: a solution to the borderpuzzle. Technical report, National bureau of economic research.
Anderson, J. E. and Van Wincoop, E. (2003). Gravity with Gravitas: A Solution to the BorderPuzzle.
Anderson, J. E. and Van Wincoop, E. (2004). Trade costs. Journal of Economic literature,42(3):691–751.
20

Anderson, J. E. and Yotov, Y. V. (2010a). The changing incidence of geography. AmericanEconomic Review, 100(5):2157–86.
Anderson, J. E. and Yotov, Y. V. (2010b). Specialization: pro-and anti-globalizing, 1990-2002.Technical report, National Bureau of Economic Research.
Anishenko, N. (2014). Why China Is Investing Big Time In Belarus. Worldcrunch.
Baier, S. and Bergstrand, J. (2007). Do free trade agreements actually increase members’ inter-national trade? Journal of International Economics, 71(1):72–95.
Baier, S. L., Bergstrand, J. H., and Feng, M. (2014). Economic integration agreements and themargins of international trade. Journal of International Economics, 93(2):339–350.
Baldwin, R. and Taglioni, D. (2006). Gravity for dummies and dummies for gravity equations.Technical report, National Bureau of Economic Research.
Chen, N. and Novy, D. (2011). Gravity, trade integration, and heterogeneity across industries.Journal of International Economics, 85(2):206–221.
Clausing, K. A. (2001). Trade creation and trade diversion in the canada–united states free tradeagreement. Canadian Journal of Economics/Revue canadienne d’économique, 34(3):677–696.
Dragneva, R. and Wolczuk, K. (2012). Russia, the eurasian customs union and the eu: Cooper-ation, stagnation or rivalry? Chatham House Brie�ng Paper REP BP, 1.
Egger, P. H. and Nigai, S. (2015). Structural gravity with dummies only: Constrained anova-type estimation of gravity models. Journal of International Economics, 97(1):86–99.
Emlinger, C., Jacquet, F., and Lozza, E. C. (2008). Tari�s and other trade costs: assessingobstacles to mediterranean countries’ access to eu-15 fruit and vegetable markets. EuropeanReview of Agricultural Economics, 35(4):409–438.
Feenstra, R. C. (2002). Border e�ects and the gravity equation: consistent methods for estima-tion. Scottish Journal of Political Economy, 49(5):491–506.
Fernandes, A. M., Hillberry, R. H., and Mendoza Alcantara, A. (2015). Trade e�ects of customsreform: evidence from albania.
21

Freund, C. and Ornelas, E. (2010). Regional trade agreements. Annual Review of Economics,2(1):139–166.
Freund, C. and Pierola, M. D. (2012). Export superstars.
Frost, L. and Davies, M. (2014). Renault-nissan’s russian resilience has limits. Reuters.
Gnutzmann, H. and Gnutzmann-Mkrtchyan, A. (2017). The silent success of customs unions.Technical report, SSRN: Available online https://papers.ssrn.com/sol3/papers.cfm?abstract_id=2490929.
Isakova, A., Koczan, Z., and Plekhanov, A. (2013). How much do tari�s matter? evidence fromthe customs union of belarus, kazakhstan and russia. Technical report.
Isakova, A. and Plekhanov, A. (2012). Customs union and kazakhstans imports. EBRDWorkingPaper, forthcoming.
Krishna, P. (1998). Regionalism and multilateralism: A political economy approach. QuarterlyJournal of Economics, 113(1):227–250.
Krotov, I. (2011). Customs union between the republic of belarus, the republic of kazakhstanand the russian federation within the framework of the eurasian economic community.World Customs Journal, 5(2):133.
Martincus, C. V., Carballo, J., and Graziano, A. (2013). Customs as doorkeep-ers: What are their e�ects on international trade? Technical report, work-ing paper, www. usitc. gov/research_and_analysis/documents/Customs_ as-Doorkeepers-What_Are_Their_E�ects_on_International_Trade. pdf.
McCallum, J. (1995). National borders matter: Canada-us regional trade patterns. The AmericanEconomic Review, pages 615–623.
Olivero, M. P. and Yotov, Y. V. (2012). Dynamic gravity: endogenous country size and assetaccumulation. Canadian Journal of Economics/Revue canadienne d’économique, 45(1):64–92.
Olper, A. and Raimondi, V. (2008). Agricultural market integration in the oecd: A gravity-border e�ect approach. Food Policy, 33(2):165–175.
22

Requena, F. and Llano, C. (2010). The border e�ects in spain: an industry-level analysis. Em-pirica, 37(4):455–476.
Romalis, J. (2007). Nafta’s and cusfta’s impact on international trade. The Review of Economicsand Statistics, 89(3):416–435.
Sturgeon, T. J. and Memedovic, O. (2010). Mapping global value chains: Intermediate goodstrade and structural change in the world economy.
Tarr, D. (2012). The eurasian customs union among russia, belarus and kazakhstan: Can itsucceed where its predecessor failed? Belarus and Kazakhstan: Can It Succeed Where ItsPredecessor Failed.
Tre�er, D. (2001). The long and short of the canada-us free trade agreement. Technical report,National Bureau of Economic Research.
UNECE (2012). Regulatory and procedural barriers to trade in belarus. Technical report, UnitedNations Economic Commission for Europe.
UNECE (2013). Overcoming trade barriers in the republic of kazakhstan. Technical report,United Nations Economic Commission for Europe.
Vinokurov, E. (2013). Emerging eurasian continental integration: Trade, investment and in-frastructure.
Wilson, N. (2007). Examining the trade e�ect of certain customs and administrative proce-dures.
23