Embed Size (px)
Citation preview

Institute of Actuaries of Australia ABN 69 000 423 656
Level 2, 50 Carrington Street, Sydney NSW Australia 2000
t +61 (0) 2 9239 6100 f +61 (0) 2 9239 6170
e [email protected] w www.actuaries.asn.au
The cost and funding of natural disasters in
Australia – current position paper
Draft for discussion
Prepared by a sub-committee of the Actuaries Institute’s Natural Disasters
Working Group (NDWG) Tim Andrews
Shirley Chau (Secretary)
Yifan Fu
Kostia Lubarsky
Daniel Smith
Jeremy Waite
Presented to the Actuaries Institute
General Insurance Seminar
13 – 15 November 2016
Melbourne
This paper has been prepared for the Actuaries Institute 2016 General Insurance Seminar.
The Institute’s Council wishes it to be understood that opinions put forward herein are not necessarily those of the
Institute and the Council is not responsible for those opinions.
NDWG
The Institute will ensure that all reproductions of the paper acknowledge the
author(s) and include the above copyright statement.
Page 1 of 29
13-15 November 2016
1 Introduction and Key Findings
This paper is currently in draft form for discussion at the Actuaries Institute’s General Insurance Seminar
in 2016. The paper is expected to be finalised following the seminar, including appendices. The paper
should not be relied upon for making commercial decisions.
1.1 Introduction
In Australia, 2011 was a year that experienced a high number of natural perils which resulted in the third
highest year of economic cost over the last 50 years. Following the events of 2011, the General
Insurance Practice Committee, on behalf of the Actuaries Institute, made a number of submissions to
Government including :
Queensland Floods Commission of Inquiry (2011)
National Disaster Insurance Review (2011)
Reforming Flood Insurance (2012)
Effectiveness of Current National Disaster Fund Arrangements (2014).
These submissions tended to be reactive to the circumstances at that time and were crafted in response
to specific Government issues in very short time frames.
For this reason the Natural Disasters Working Group (NDWG) was formed in 2016 to prepare a series of
discussion papers on issues relating to natural perils in Australia on behalf of the Actuaries Institute’s
General Insurance Practice Committee.
The purpose of the NDWG is to formulate a current and forward looking point of view which could form
the basis of the Actuaries Institute’s public policy for natural perils.
One of the aims was to make the series of discussion papers available to the whole profession for debate
and discussion so that in future the Actuaries Institute’s responses to Natural Disaster issues would be
abstracted from a solid body of work which represented the best in class from our profession.
This is the first paper produced by the NDWG which sets out the estimated costs of natural perils in
Australia, current efforts to mitigate and fund these costs and the adequacy of data that is available to
manage the natural peril risk. The paper is intended to be a scene setting document, with planned later
papers expected to be more forward looking and solution focussed. The paper intentionally focusses on
existing work that is available.
1.2 Key findings
In Australia natural perils are estimated to cost $11 billion p.a. on average. Less than 40% of this cost is
pre funded by insurance. There is scope to improve the management of the natural peril risk by:
more coordinated and increased pre event funding of adaptation strategies
further collection and use of data to quantify the risk
Pools structured to encourage risk reduction could also be considered on a temporary basis to spread
the cost more broadly and subsidise the risk in areas where there are concerns around affordability of the
cost of insurance.
Most of the thought and discussion surrounding the cost and funding of natural perils is focussed on the
tangible costs. Very little time is devoted to considering the impacts of intangible costs, however the
intangible costs are estimated to be very considerable. Ultimately, intangible costs are predominantly

Page 2 of 29
13-15 November 2016
funded by government via taxes and, as such, are heavily cross-subsidised. This is quite different to the
underlying philosophy of funding tangible costs currently applied, which is to largely remove cross-
subsidies.
1.3 Summary of report
In Sections 2 and 3 we estimate the current annual cost of natural perils in Australia to be $11 billion,
comprising:
$3.7 billion of privately insured costs
$2.5 billion of other direct and indirect tangible costs (includes commercially insured costs and
non-insured property and business interruption costs)
$4.8 billion of intangible costs (eg. the mental health impact on families and communities).
Note: For the purposes of this report we have used the same definitions of tangible and intangible cost as are used in the
report called “The economic cost of the social impact of natural disasters, March 2016” (the Deloitte Report). This report
was prepared by Deloitte Access Economics on behalf of the Australian Business Roundtable for Disaster Resilience &
Safer Communities. Direct tangible costs include damage to properties, infrastructure, vehicles etc. Indirect tangible costs
include the flow on costs such as business disruption, clean up costs, network disruptions. Intangible costs reflect
damages that cannot be easily measured such as impacts to health and wellbeing, including opportunity costs (for
example, where someone is unable to be part of the community due to time in hospital).
All of the cost estimates involve uncertainty due the small number of extreme events that have occurred
and due to the limited information that is available about those events. The intangible cost estimates in
particular involve considerable subjectivity but are intended to highlight the order of magnitude.
Our estimate of $11 billion is higher than the estimate of $9.6 billion contained in the Deloitte Report.
This is because we have adopted a higher estimate of insured natural perils costs, noting that the
Insurance Council of Australia (ICA) Catastrophe data which Deloitte have used is limited to the larger
natural disasters.
Claims costs would be expected to increase over time due to inflation, population growth and growth in
higher risk areas near to the coast. Normalised for these influences, there is no clear trend in the insured
costs over time. Natural cycles and variability remain dominant factors.
In Section 4 we describe the main aspects of the adaptation that exists in Australia and the key role it
plays in reducing the impact of natural perils. However, gaps exist across all areas of adaptation and
there is significant scope for increased investment, with studies suggesting favourable cost-benefit trade-
offs. In recent years the level of post disaster recovery costs has significantly exceeded the current
levels of adaptation funding. The federal government invests about $50 million each year on adaptation
funding but spends in excess of $500 million on average on post-disaster relief and recovery.
Section 5 sets out the plethora of data available relating to natural perils. Whilst there is a broad range of
information there are considerable limitations on the use and extent of data available. Key issues are:
much of the publicly available data, particularly in relation to the insured cost of events, is at an
aggregated level which limits its usability;
there are numerous owners of the various data sources and most of the data is not publicly
available (largely due to intellectual property and competitive advantage issues);
where publicly available, detailed property information requires manipulation to create databases
and there is often inconsistency in definitions across different locations.
Page 3 of 29
13-15 November 2016
There is a need to continue to improve the amount and quality of data that is publicly available.
Section 6 describes the range of funding sources for the cost of natural perils. The current funding
solutions may not provide the right incentives to reduce risk and follow cost effective recovery solutions
post event. Concerns around affordability for certain individuals could be addressed via the use of
temporary insurance pools properly structured to encourage long term risk reduction.

Page 4 of 29
13-15 November 2016
2 Privately insured claims costs
2.1 Introduction
This section summarises our assessment of the current annual claims costs from natural perils in
Australia due to economic loss that is privately insured. The costs included in this section represent only
a part of the total costs of natural perils. Section 3 considers the remaining costs, including damage to
properties that are self-insured, damage to government property and other economic and non-economic
costs.
The costs included in this section are the property damage and consequential loss costs relating to
natural peril claims in Australia that are insured under direct (or primary) insurance policies by:
APRA licensed insurers
Unlicensed Foreign Insurers (UFIs)
Lloyds.
The cost estimates exclude reinsurance that is placed by government or self insurers directly with
reinsurers (for example, where state governments reinsure some of their exposure).
The consequential loss component covers lost profits by businesses as a result of the event, where that
cover has been purchased by the company, noting that many smaller companies elect to self insure this
cost.
The cost estimates are intended to be for all classes of business combined (Home, Commercial Property,
Motor, Public Liability etc).
2.2 Types of Perils Included
We have separately assessed cost for the following types of natural perils:
Flood (ie. riverine flooding)
Bushfire
Cyclone, including impact from the sea to the extent that it is insured
Storm, includes both convective and synoptic storms. Costs can arise due to damage from hail,
wind, water ingress and flash flooding
Earthquake.
Note: Riverine flooding or flash flooding resulting from an ex-tropical low are included in the Flood and Storm categories
respectively, rather than in the Cyclone costs. No explicit allowance has been made for actions of the sea besides those
costs covered by insurance. Insured actions of the sea associated with Storms do not contribute material cost at the current
time and hence can be regarded as included on an implicit basis in the Storm peril. Also, costs from tornadoes are
included in Storm, rather than as a separate explicit category.

Page 5 of 29
13-15 November 2016
2.3 Our Approach
The analysis of each peril is set out in Appendix A (not available for this draft) and involved:
summarising the costs between 1967 and 2016 indicated by the ICA’s Catastrophe Dataset. The
ICA data shown throughout this report is adjusted to current dollar values (using an index of
construction cost inflation) and allows for the impact of changes in building standards and for
growth in population by area;
using data of the cost of weather claims over the last 10 years for Home Insurance shown in the
2016 Finity/Deutsche Pendulum publication. The data is originally provided by Insurance Statistics
Australia (ISA);
considering other information that is available and relevant to each peril. For example, for Bushfire
this included consideration of the trend over time in the Forest Fire Danger Index (FFDI), whereas
for Cyclone we have included the costs from catastrophe models as presented in the Northern
Australia Insurance Premiums Taskforce;
drawing on the judgement and benchmarks of the sub-committee members.
For each peril we have estimated:
the current average annual loss (AAL)
the largest event over the last 50 years
the largest event expected once every 200 years.
It is important to emphasise that the estimates of costs are uncertain. This reflects in particular the
inherent variability of the natural peril experience and the relatively short period for which we had data –
for example, 50 years of data is short in the context of assessing the long term cost of cyclones. This has
meant that the estimates rely on, to some extent, the cost and frequency of simulated events indicated by
catastrophe models used by insurers. Further, the data that is available about the natural peril events
that have occurred is patchy at an industry level.
Page 6 of 29
13-15 November 2016
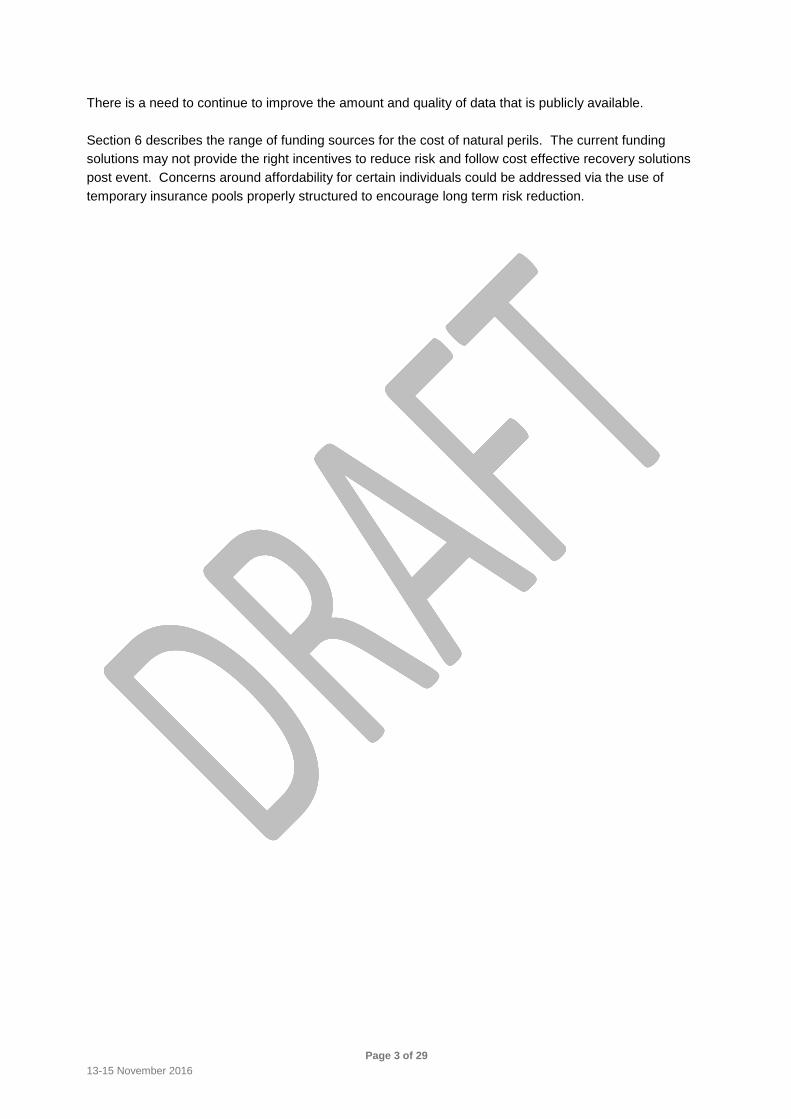
2.4 Summary of Insured Cost Estimates
Table 2.1 sets out the estimated costs by peril, and overall.
Table 2.1 – Estimated Costs for each type of natural peril ($2016)
Peril
Actual
AAL from
ICA
Disaster
Dataset
AAL
Estimated Largest event last 50 years
Cost of largest
Event
Estimated Worst 1
in 200 year event
$bn $bn $bn $bn
Bushfire 0.19 0.25 Ash Wednesday (Vic and SA) 1983 2.6 7.0
Flood 0.30 0.70 Cyclone Wanda, Brisbane (1974) 3.9 7.0
Cyclone 0.37 0.70 Cyclone Tracy (1974) 6.0 16.0
Storm 0.77 1.60 Sydney Hailstorm (1999) 6.3 9.0
Earthquake 0.10 0.40 Newcastle (1989) 4.8 22.0
Total 1.73 3.65
We estimate the average annual insured cost of natural perils to be around $3.7 billion. The largest
contributor to these costs is storms, which is estimated to account for around 44% of the long term cost.
In financial terms the largest event over the last 50 years (in current dollars) was the 1999 Sydney
hailstorm. Whilst infrequent in Australia, earthquakes are thought the most likely to produce a substantial
cost at the current time, although substantial costs can arise from each of the types of peril listed.
2.5 Changes in the insured costs over time
Figure 2.1 shows the ICA’s Catastrophe Dataset costs by year over the last 50 years. The analysis is
shown by type of peril in Appendix A (not available for this draft). We have only included events with a
cost of $50 million or more, noting that in the earlier years only large events were recorded in the list. All
figures are in current values and adjusted for population growth by area.
Figure 2.1 – ICA Catastrophe Dataset Costs by Year
0
1
2
3
4
5
6
7
8
19
671
968
19
691
970
19
711
972
19
731
974
19
751
976
19
771
978
19
791
980
19
811
983
19
841
985
19
861
987
19
881
989
19
901
991
19
921
994
19
951
996
19
971
998
19
992
000
20
012
002
20
032
004
20
052
006
20
072
008
20
092
010
20
112
012
20
132
014
20
152
016
Infl
ate
d C
ost
($
b)
Financial YearInflated Cost Average
The data shows two periods of higher costs (1973-76, and 2007-11). In both these phases there were a
higher than average number of La Nina years (when the sea surface temperatures to the north west of
Australia were warmer), which are associated with higher levels of flood and cyclone cost in the eastern

Page 7 of 29
13-15 November 2016
states. The intervening period (1977-2006) experienced an above average number of El Nino years,
which tend to be associated with drought and fewer cyclones.
A number of other natural cycles are important to the variations in insured costs over time, including the
Indian Ocean Dipole, which has contributed to the 2016 winter being the second wettest on record for
Australia, and the Southern Annular Mode, which is linked to the reduction in the number of synoptic lows
impacting on southern Australia over the last 30 years.
Adjusted for natural weather cycles and changes in population, there is limited evidence of any material
change to date in the level of costs over time. This assessment is equivalent to other global studies,
which show that increases in cost to date are mostly explained by inflation, population shifts and building
standards.
When looked at by peril, there is evidence of an increasing frequency of bushfire events. This is
consistent with the expected climate change impacts, and we note that the FFDI has increased
significantly in many of the most bushfire prone areas over the last 30 years. There are also studies
available which show an increasing intensity of storms.
We note that climate change is expected to lead to an increased intensity of storms and cyclones. The
impacts to frequency are more complex, with some areas expected to have higher frequency and others
lower. It is difficult to measure the frequency and severity impacts to date, with complications relating to
insufficient data, natural cycles and variability and the relatively modest (although significant in absolute
terms) warming to date.

Page 8 of 29
13-15 November 2016
3 Other costs besides those insured by private insurers
3.1 Introduction
Our starting point (and ending point, as it turned out) for quantifying the other costs was the work set out
in the Deloitte Report.
In this section we summarise the approach adopted in the Deloitte Report and the key results. We also
provide high level comments on those results.
3.2 Deloitte Report - Approach
The approach adopted in the Deloitte Report to estimate the other costs was as follows:
Non-insured tangible costs: These were derived from ICA catastrophe cost data and used
benchmark ratios for the cost of uninsured losses relative to insured losses. These ratios vary by
type of peril;
Intangible costs: For these costs a case study approach was adopted. This involved estimating
the intangible costs in two events (Black Saturday bushfires 2009 and Brisbane Floods 2011). It
was assumed that the ratio of the intangible costs to tangible costs in these two events could be
applied to estimate the intangible costs across all events.
3.3 Deloitte Report – Results
The Deloitte Report suggests that uninsured tangible costs are of the order of 1.25 times the level of
insured costs.
The intangible costs are estimated at around 1.0 times the level of total tangible costs. Deloitte state
that this ratio may understate the intangible costs.
The following table shows the components of the intangible costs from Black Saturday bushfires
(estimated to cost $3.9 billion) and the Brisbane Floods (estimated to cost $7.4 billion). These figures are
not shown explicitly in the report, but have been derived from data shown there.
Table 3.1 - Proportion of total intangible costs
Intangible factor Queensland floods (%) Black Saturday bushfires (%)
Deaths / Injuries 4 24
Chronic disease 6 8
Mental health 80 27
Family violence 10 25
Alcohol abuse 0 5
Environment - 11
The most significant component of the intangibles cost is for mental health issues, although
deaths/injuries and family violence can also be significant.
Page 9 of 29
13-15 November 2016
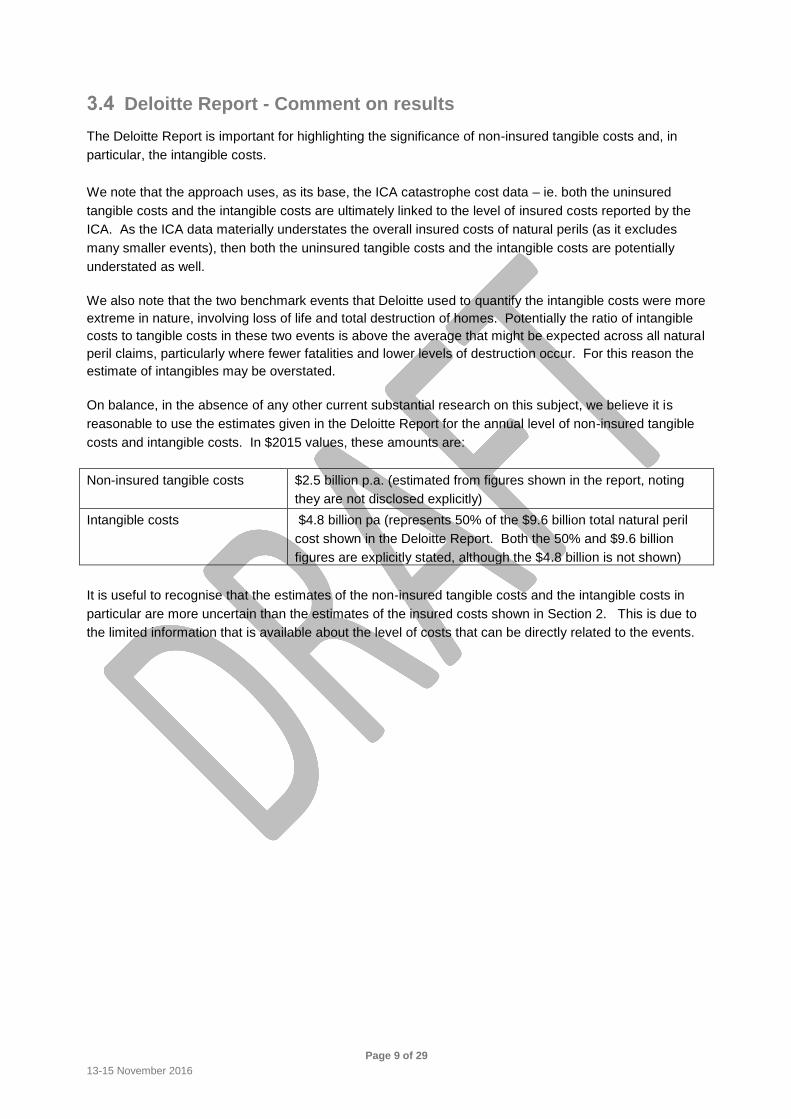
3.4 Deloitte Report - Comment on results
The Deloitte Report is important for highlighting the significance of non-insured tangible costs and, in
particular, the intangible costs.
We note that the approach uses, as its base, the ICA catastrophe cost data – ie. both the uninsured
tangible costs and the intangible costs are ultimately linked to the level of insured costs reported by the
ICA. As the ICA data materially understates the overall insured costs of natural perils (as it excludes
many smaller events), then both the uninsured tangible costs and the intangible costs are potentially
understated as well.
We also note that the two benchmark events that Deloitte used to quantify the intangible costs were more
extreme in nature, involving loss of life and total destruction of homes. Potentially the ratio of intangible
costs to tangible costs in these two events is above the average that might be expected across all natural
peril claims, particularly where fewer fatalities and lower levels of destruction occur. For this reason the
estimate of intangibles may be overstated.
On balance, in the absence of any other current substantial research on this subject, we believe it is
reasonable to use the estimates given in the Deloitte Report for the annual level of non-insured tangible
costs and intangible costs. In $2015 values, these amounts are:
Non-insured tangible costs $2.5 billion p.a. (estimated from figures shown in the report, noting
they are not disclosed explicitly)
Intangible costs $4.8 billion pa (represents 50% of the $9.6 billion total natural peril
cost shown in the Deloitte Report. Both the 50% and $9.6 billion
figures are explicitly stated, although the $4.8 billion is not shown)
It is useful to recognise that the estimates of the non-insured tangible costs and the intangible costs in
particular are more uncertain than the estimates of the insured costs shown in Section 2. This is due to
the limited information that is available about the level of costs that can be directly related to the events.
Page 10 of 29
13-15 November 2016
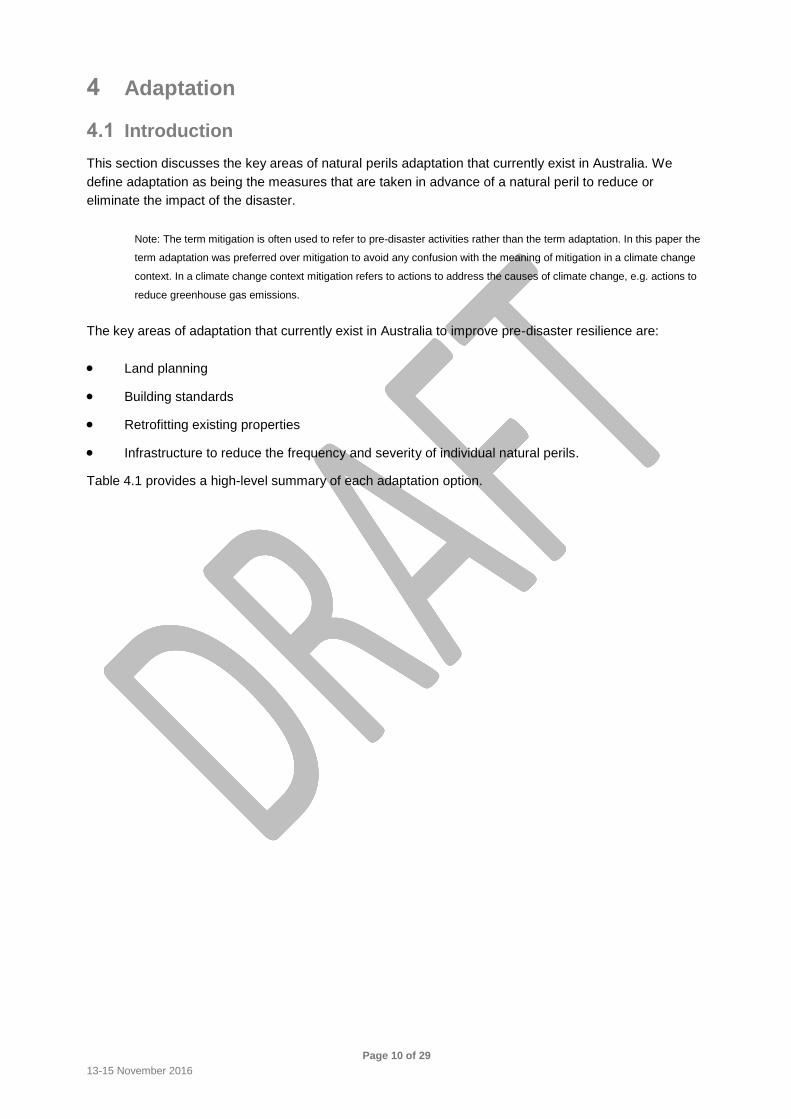
4 Adaptation
4.1 Introduction
This section discusses the key areas of natural perils adaptation that currently exist in Australia. We
define adaptation as being the measures that are taken in advance of a natural peril to reduce or
eliminate the impact of the disaster.
Note: The term mitigation is often used to refer to pre-disaster activities rather than the term adaptation. In this paper the
term adaptation was preferred over mitigation to avoid any confusion with the meaning of mitigation in a climate change
context. In a climate change context mitigation refers to actions to address the causes of climate change, e.g. actions to
reduce greenhouse gas emissions.
The key areas of adaptation that currently exist in Australia to improve pre-disaster resilience are:
Land planning
Building standards
Retrofitting existing properties
Infrastructure to reduce the frequency and severity of individual natural perils.
Table 4.1 provides a high-level summary of each adaptation option.

Page 11 of 29
13-15 November 2016
Table 4.1 - High-level summary of each adaptation option
Adaptation area Effectiveness Cost Current usage Key gaps
Land planning
Zoning of new development
Most effective adaptation option for new properties
Direct costs are very low but indirect costs can be very high, e.g. economic growth opportunity cost of disallowing development of multi-story residential building
Majority of councils incorporate natural perils risk in their zoning process
New developments are still allowed to be constructed in high risk areas. Lack of clear and simple rules exposes councils to legal risk and creates inconsistency between councils.
Relocating properties
Most effective adaptation option for existing properties
Costs are very high, driven largely by the price of land
Not widely used due to high costs involved. Only used for very high risk properties
No funding available
Building standards Very effective adaptation option for new properties
Costs can be high, not all improvements will have a favourable benefit-cost ratio
Australia-wide building standards are more stringent in areas exposed to natural perils
Building standards focus on health and safety whilst minimising property damage is not an objective
Retrofitting existing properties
Can be very effective for existing properties
Costs are relatively high. Generally more expensive than cost of building new houses to the same standard
Not widely used due to high upfront costs and lack of government grants or incentives
No funding available
Infrastructure to reduce frequency and severity of individual natural perils
Effective for localised perils (flood, bushfire and storm surge). Not effective for other perils such as cyclone and earthquake Effectiveness is often compromised due to conflicting priorities (e.g. dams being used for both water supply and flood adaptation) and poor maintenance over time
Costs are high. Key costs are construction costs and regular maintenance costs
Some infrastructure such as flood levees and seawalls are used extensively. Other infrastructure such as underground power lines are less common
No funding available
All adaptation areas Lack of government adaptation funding. Framework to prioritise adaptation projects and funding can be strengthened

Page 12 of 29
13-15 November 2016
4.2 Land planning
Land planning is widely considered to be a key component of best practice pre-disaster adaptation. The
two key areas of land planning that are related to natural perils adaptation are:
Zoning of new development
Relocating properties (buy-backs and land swaps)
Zoning of new development
Zoning and development approval in Australia is predominantly undertaken at a council level. Zoning plays
a critical role in natural perils adaptation since it dictates whether new properties can be built in areas that
are exposed to natural perils.
The majority of councils in Australia recognise that zoning plays an important role in reducing natural perils
costs and subsequently incorporate natural perils risk in their zoning and development approval process.
Although the majority of councils incorporate natural perils risk in their zoning process, a number of gaps
can be identified in the current zoning framework:
New developments are still allowed to be constructed in high risk areas;
Although zoning may reduce property damage for more frequent events, they will often be ineffective
in more extreme events;
A lack of clear and simple rules around some zoning requirements and the subsequent need for
councils to incorporate judgement when approving certain developments;
Zoning is predominantly a local council responsibility which creates inconsistent rules across
different councils and states in Australia. Hence, natural perils adaptation is stronger in some areas
of Australia than others.
Relocating properties
Whereas zoning of new development is one of the most effective ways to build pre-disaster resilience for
new properties, relocating properties from high to low risk areas is one of the most effective adaptation
options for existing properties. Relocating properties may be accomplished in a number of ways, including
buy-backs and land swaps.
Despite being a very effective method to reduce property damage, this adaptation measure is not widely
used due to the high costs involved in purchasing property.
4.3 Building Standards
Along with zoning, building standards play a critical role in reducing natural peril damage for new
properties. The development and management of building standards in Australia is undertaken at a
national level by the Australian Building Codes Board (ABCB). The implementation and regulation of
building standards is then undertaken at a state and local government level.
Building standards have been improving over time, however from a pre-disaster adaptation perspective a
gap exists in the current building standards framework, since the key focus of building standards is on
health and safety rather than minimising property damage. According to the ABCB, the current objective of
building standards is to “provide the minimum necessary requirements for safety, health, amenity and
sustainability in the design and construction of new buildings (and new building work in existing buildings)
Page 13 of 29
13-15 November 2016
throughout Australia”. As a result, changes that would improve pre-disaster resilience, but don’t improve
health and safety, are not likely to be included in revised building codes.
4.4 Retrofitting existing properties
Retrofitting involves making structural improvements to existing properties to increase their resilience to
natural perils. Whereas building standards play an important role in reducing damage for new properties,
retrofitting can significantly reduce natural peril damage for existing properties.
Although retrofitting can generate significant and immediate reductions to natural peril costs, retrofitting
options have not been widely implemented in Australia. A key reason for this is the large cost associated
with retrofitting.
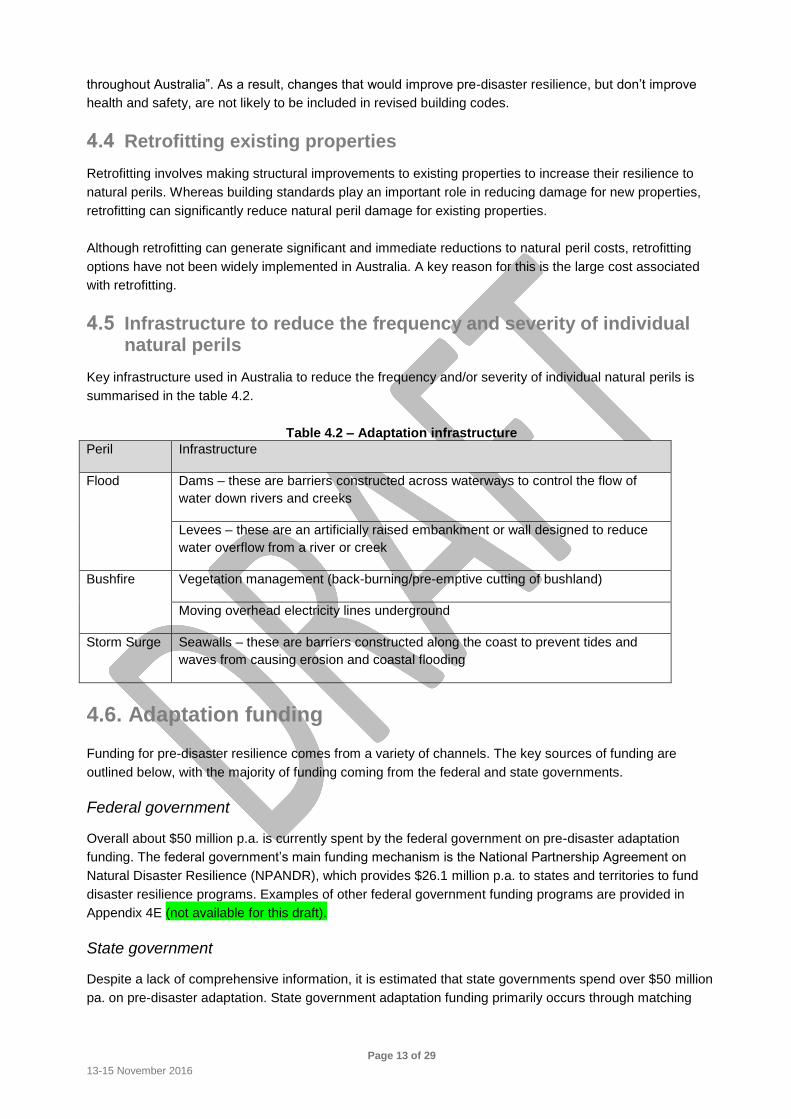
4.5 Infrastructure to reduce the frequency and severity of individual natural perils
Key infrastructure used in Australia to reduce the frequency and/or severity of individual natural perils is
summarised in the table 4.2.
Table 4.2 – Adaptation infrastructure
Peril Infrastructure
Flood Dams – these are barriers constructed across waterways to control the flow of
water down rivers and creeks
Levees – these are an artificially raised embankment or wall designed to reduce
water overflow from a river or creek
Bushfire Vegetation management (back-burning/pre-emptive cutting of bushland)
Moving overhead electricity lines underground
Storm Surge Seawalls – these are barriers constructed along the coast to prevent tides and
waves from causing erosion and coastal flooding
4.6. Adaptation funding
Funding for pre-disaster resilience comes from a variety of channels. The key sources of funding are
outlined below, with the majority of funding coming from the federal and state governments.
Federal government
Overall about $50 million p.a. is currently spent by the federal government on pre-disaster adaptation
funding. The federal government’s main funding mechanism is the National Partnership Agreement on
Natural Disaster Resilience (NPANDR), which provides $26.1 million p.a. to states and territories to fund
disaster resilience programs. Examples of other federal government funding programs are provided in
Appendix 4E (not available for this draft).
State government
Despite a lack of comprehensive information, it is estimated that state governments spend over $50 million
pa. on pre-disaster adaptation. State government adaptation funding primarily occurs through matching
Page 14 of 29
13-15 November 2016
federal government contributions and general infrastructure spending. More details are provided in
Appendix 4E (not available for this draft).
Local government
Local governments contribute to adaptation funding through contributions to specific projects and general
infrastructure spending. However, due to limited funding, particularly for remote councils with small rate
bases, local government expenditure is generally lower than state government expenditure.
Private funding
Currently the vast majority of adaptation funding comes from government, with private funding not being
very significant.
Gaps in current adaptation funding
Although adaptation funding exists and plays a key role in strengthening pre-disaster resilience, two key
gaps can be identified in current adaptation funding arrangements:
Adaptation funding remains low: The current approach to natural perils funding is heavily weighted toward
post-disaster relief and recovery, with limited levels of investment in preventative disaster adaptation.
Although the federal government spends $50 million p.a. on adaptation funding, it’s estimated that each
year an estimated $560 million is spent on post-disaster relief and recovery by the federal government.
This ratio of more than 10 to 1 is even higher if all natural perils costs are considered, including costs
borne by all levels of government, insurers and individuals, as well as both indirect and intangible costs;
Framework to prioritise adaptation projects and funding can be strengthened: Currently adaptation funding
often arises after an event (i.e. prioritisation of projects is reactive rather than proactive) or due to political
pressure. This gap was also highlighted by the Productivity Commission inquiry, which found that “current
government natural disaster funding arrangements are not efficient, equitable or sustainable. They are
prone to cost shifting, ad hoc responses and short-term political opportunism”.
Significant scope for more adaptation
Although important adaptation exists across all key areas described above, each area contains substantial
gaps and significant scope exists for more adaptation investment in Australia. This can be seen through
the low level of adaptation funding relative to post-disaster relief and recovery costs. In addition, many
adaptation projects have not been undertaken despite very favourable benefit-cost trade-offs. A few
examples are shown in table 4.3.

Page 15 of 29
13-15 November 2016
Table 4.3 – Example cost benefit ratios
Peril Adaptation area Adaptation activity Benefit-
cost ratio
Flood Infrastructure to reduce
frequency and severity of
individual perils
Raising the walls of Warragamba dam by
23m
8.5
Bushfire Retrofitting existing
properties
Burying electricity wires for all 71,000 high
risk houses in Melbourne
3.1
Clearing 5m of bushland around all high risk
houses in Melbourne
1.3
Cyclone Building standards Building new houses to a more cyclone
resilient standard in foreshore areas of
South-East QLD
3.1
Retrofitting existing
properties
Roof strapping upgrades that cost around
$3,000 per dwelling
1.45
Page 16 of 29
13-15 November 2016
5 Key data sources available to enable assessment of risk
5.1 Data Relating to Natural Perils
The data relating to natural perils can be broken down into 4 main types:
Aggregate event cost data in relation to a single event or series of events;
Individual loss data (typically relating to insured losses);
Geological, meteorological and engineering data;
Data available to governments in relation to the cost of losses relating to public assets.
While each data source on its own can be useful, it is typically the amalgamation of the various data
sources that is required to produce meaningful insights.
Whilst there are considerable amounts of data created, its accessibility, use, interpretability and
consistency varies considerably.
5.2 Aggregate Event Cost Data
Broad level data (on an event basis) is available sometime after an event to those who search for it.
Sources include ICA and Government reviews (such as Productivity Commission reports). These reports
provide an overall view of significant events in terms of cost (and several are adjusted to be in current
dollars and current exposure levels), but they are general in nature and require the user to interpret the
results. They are good sources of data for understanding the overall insured cost of natural perils but they
provide very limited insight into the risk rating requirements, etc.
Reviews typically provide useful sources for aggregated data but these typically come from a small number
of sources:
ICA
Disaster funding from Treasury
Deloitte Access Economics
Risk Frontiers
Australian Business Roundtable for Disaster Resilience
Bureau of Meteorology
Geoscience Australia
Centre for Research on the Epidemiology of Disasters (CRED)
Australian Emergency Management Institute (AEMI)
Major reinsurers often provide summaries of annual event costs around the world.
The aggregate event data is useful for developing policy and understanding the long term cost of natural
perils. The information is of use to governments, policy makers and insurers but is of limited use for
individual companies, local governments and consumers.

Page 17 of 29
13-15 November 2016
Individual Loss Data
Individual loss data is typically associated with insurers. Each insurer will have their own records relating
to the nature and cost of individual losses but, depending on their exposure, may not have a good view of
the overall cost of a particular event. Further, only the largest insurers are likely to have sufficient
information to enable their own loss experience to drive underwriting and pricing for natural perils.
Individual loss data is of considerable value to insurers for risk underwriting and pricing, and can be useful
for informing the more detailed application of public policy, such as changes in building standards.
Individual loss data is of limited value to the broad setting of policy and for individual businesses and
consumers unless it has been aggregated in some form to provide community/district/State level insights.
The exception might be where an owner has previously experienced an event and subsequently manages
the risk as far as possible (e.g. clearing around the house in a bushfire area will reduce the chance of
suffering loss but does not remove the possibility of bushfire damage).
5.3 Geological, Meteorological and Engineering Data
Geological, meteorological and engineering (GME) data provide valuable insight into the underlying
structures that lead to or cause natural perils and which help measure the likely impact of a natural peril.
Whilst a considerable amount of GME data is readily available, expert advice is typically required to turn
that data into meaningful information. For example, local councils will often seek advice of an engineer to
develop a flood map of their constituency.
Flood has recently been the most topical peril where modelling and mapping is undertaken but similar
models have been developed for earthquake, cyclone, hailstorm and bushfire. The driving parameters of
the models are obviously different, as is the level of uncertainty in the models (given the very different
frequencies in which events occur).
Historically, much of the useful model information utilising GME data has been treated as confidential by
the purchaser or developer. This remains the case with several elements such as the catastrophe models
developed for use by insurers and reinsurers.
There has, however, been a recent trend to providing access to GME information to consumers, and in a
form that is usable. A number of councils with significant flood prone areas now provide maps where
consumers can view the relative level of flood risk that individual properties face.
The Australian Flood Risk Information Portal should, when complete, provide an additional resource for all
stakeholders.
There are websites containing information regarding bushfire risks, but the type of information needed for
flood is not required for bushfire on the basis that proximity to bush and/or grassland is obvious – hence
the cost of developing maps is considerably less. Maps of bushfire prone areas are available, notably in
Victoria and Western Australia.
Limited consumer accessible information regarding cyclone risks is available and the reasonably random
nature of hailstorm and infrequency of earthquakes means that it is difficult to see what useful information
could be provided.
Increased availability of GIS data and access to mapping software means that more user-friendly ways of
distributing information are readily available.

Page 18 of 29
13-15 November 2016
5.4 Government Data
In theory Governments have access to a broad range of data relating to natural perils with respect to the
cost of damage to public assets. Data should be available which covers the cost of building various
infrastructure assets and what the cost of repairing/replacing them has been over time. Data should also
be available regarding the nature and value of Government-owned assets.
In its 2011 report to the Department of Finance and Deregulation’s Review of Insurance Arrangements of
state and territory governments under the Natural Disaster Relief and Recovery Arrangements (NDRRA),
KPMG has highlighted that the level of detail maintained by governments is not necessarily complete
and/or consistent across the various jurisdictions. Examples include:
The definition and measurement of Essential Public Assets;
The basis of historical claims experience – i.e. net or gross of insurance/reinsurance, data provided
by financial year rather than year of loss;
Separation between state information and the data relating to local governments.
It is not clear that sufficient information exists (at least readily) to produce an holistic picture of the
exposure of public assets to natural perils and the historical cost of such.
5.5 Data Amalgamations
There are some Australian examples of data amalgamations where data from a range of sources is
combined to provide information that is useful to individual businesses and consumers.
The ICA has developed a database on Australian catastrophic events in its Dataglobe. The Dataglobe has
been developed to provide a communications resource for the ICA and member companies involved in
dialogue with the community and governments.
The Dataglobe contains hazard information linked to location which enables mapping of historical events.
It also contains an ICA natural perils exposure score for a large number of addresses across Australia,
policy in-force information by address (currently being populated across Australia), and is in the process of
developing a building resilience rating tool.
In 2012, following a series of extremely severe floods and the Natural Disasters Insurance Review, the
Australian Government launched an initiative to create the Australian Flood Risk Information Portal. The
portal is under construction but aims to collate and document flood studies from around Australia. The
portal will host data and tools that allow public discovery, visualisation and retrieval of flood studies, flood
maps, satellite derived water observations and other related information, from a single location.
The Geoscience Australia website states that “the portal will host standards and guidelines for use by
jurisdictions and information custodians to encourage best practice in the development of new flood risk
information. While the portal will initially host existing flood information, the architecture has been
designed to allow the portal content to grow over time to meet the needs of users. The aim is for the portal
to display data for a range of scenarios from small to extreme events, though this will be dependent on
stakeholder contribution”.

Page 19 of 29
13-15 November 2016
The NSW Government has developed NSW Globe which provides access to a variety of NSW spatial data
via Google Maps. Information available includes satellite imagery, response imagery, terrain data, places,
boundaries, roads, rail, addresses, land parcels, surveying and history as well as linking property sales,
land values and ABS data. A similar service is available in Queensland and Western Australia.
5.6 Data - accessibility, use, interpretability and consistency
Whilst the previous sub-sections highlight a considerable amount of data that is created, the access to that
data, and particularly the source data, is hampered by privacy, intellectual property, liability and
competition concerns. As a result, there are aspects of data which are available to select stakeholders
and, at least at this stage, nobody has access to complete data.
Data gaps
Whilst access to data is an issue, there are also considerable data gaps and inconsistencies. Significant
advancements have been made in recent years in terms of being able to collate and analyse considerable
amounts of data along with developments in geocoding. Nevertheless, there are numerous elements of
data, relevant for assessing the potential impact of natural perils, which are not readily available.
Examples of areas where there are gaps in the data include:
A Department of Finance and Deregulation review of insurance arrangements with the states and
territories under the NDRRA highlighted considerable inadequacies and inconsistencies in the data
provided to the Commonwealth by the States;
The Productivity Commission in its inquiry into Natural Disaster Funding arrangements highlighted
that essential public assets are not clearly defined or valued and that indirect economic costs can be
considerable – not well measured nor reported on;
A lack of clarity around what constitutes ‘current building and engineering standards’;
Understanding what standards existing assets have been built to;
The maintenance of databases of historical claims and exposure data relating to government-owned
assets enabling an holistic view to be taken.
Challenges of using the data
Even where data exists, there can be considerable challenges in applying that data. A simple example
relates to the use of flood maps. The types of issues that arise are:
Maps for different regions being prepared on different bases and for differing purposes;
The information obtained from the flood maps typically provides an indication of the average return
period for a flood at a particular depth. Information is required for a variety of return periods to
enable the construction of a damage curve. The development of the damage curve is then
complicated by the fact that the exact location of the assets and their height off the ground is often
not known;
Access to the detailed information behind the maps may not be available meaning that analysis is
limited to regions or neighbourhoods rather than individual properties.
Other challenges arise due to changes in the built environment over time meaning that historical weather
observations may not be representative of the impact of an equivalent event in future.

Page 20 of 29
13-15 November 2016
Informing policy and decision makers
The inability for various stakeholders to convince decision makers of the benefits of risk adaptation
highlights that a comprehensive picture of the issues surrounding natural perils and their linkages has not
been able to have been developed.
Developments in risky locations still continue to be authorised highlighting the need for a more
comprehensive cost-benefit assessment, which adequately considers the costs of natural perils. A
requirement for more comprehensive reporting on building developments, building materials used and the
applicable building and planning standards might assist in enhancing the decision making process.
Amongst a range of data-related recommendations, the Productivity Commission recommended that:
the Australian Government should publish estimates (and their confidence ranges) of future costs of
natural perils to its budget in the Statement of Risks with those estimates being informed by
catastrophe loss modelling;
Governments at all levels should make new and currently held natural perils data publicly available
in accordance with open public sector information principles. When collecting new natural perils data
or undertaking modelling, all levels of government should make information publicly available unless
it would not be in the public interest to do so;
All stakeholders should consider partnerships to share data and that the data be used to inform land
use planning and adaptation;
Governments should task the Australia–New Zealand Emergency Management Committee with
leading the development of guidelines for the collection and dissemination of natural perils mapping,
modelling and metadata. Guidelines should be developed for all hazards that need to be modelled
and mapped at the local/regional level and where consistency across regions is desirable.

Page 21 of 29
13-15 November 2016
6 Current funding arrangements
The cost of natural perils presents a funding challenge to many parts of the Australian community due to
the frequency, severity, scope and potential catastrophic nature. There is no single available solution to the
problem. A range of funding options, including insurance, reinsurance, government and non-insurance
solutions, are covered in the following section to demonstrate the pros and cons of each alternative.
6.1 Role of insurer
Australia has a highly competitive general insurance market and cover is available for the majority of
conceivable risks to property. Purchasing insurance products has been a common risk transfer mechanism
for managing natural peril exposures. Insurance products are competitive in price and coverage is widely
available for most perils such as storm, earthquake, bushfires and cyclones. Flood was largely excluded
until 2011 while actions of the sea remain as exclusions from most insurance policies.
Insurance policies often have a separate deductible (excess) and/or limit for losses caused by natural
perils, which helps to reduce the insurance premium and requires the policy holder to bare part (albeit
typically a small part) of the cost when a loss occurs.
In recent years, many Australian insurers have improved their pricing methodologies, especially in the area
of natural perils, aiming to achieve competitiveness in premiums and maintain profitability. A further driver
of the improvement in natural perils pricing is the increasing availability of detailed information regarding
the insured assets and their exposure to natural perils, such as council flood maps, which allow
considerably greater precision in the rating of individual properties.
An outcome of refinements in the pricing methodology is reduced premium cross-subsidisation and this
has led to significant increases in insurance premiums for certain exposures and communities over quite a
short period of time. This has resulted in insurance affordability (availability at an affordable price)
becoming a public and political concern in some areas. For example, whilst flood cover is available for
practically any risk, some property owners purchase cover with flood exclusions, or do not buy insurance at
all, due to the high insurance cost.
6.2 Reinsurers
For most Australian insurers and government schemes, purchasing reinsurance protection has been a
standard practice to transfer the aggregation of risk faced by insurers resulting from natural perils.
In addition, the utilisation of reinsurance protections has been a common method for regulated Australian
insurers to reduce their Insurance Concentration Risk Charge (ICRC), which forms part of the Prudential
Capital Requirement (PCR). The ICRC formula considers both a natural perils vertical requirement (in
effect, the cost from a large single event) and the natural perils horizontal requirement (the cost arising
from a series of events).
Catastrophe Excess of Loss reinsurance is the most commonly utilised type of reinsurance to transfer
natural perils losses in both the Australian and international insurance markets. The program is typically
placed with more than one reinsurer, domiciled either locally or overseas, with each reinsurer contracting
for a proportion of the reinsurance program. The program specifies the attachment and limit of the
reinsurance coverage, as well as the number of available reinstatements (additional covers) to the
program.

Page 22 of 29
13-15 November 2016
Other reinsurance programs, such as facultative reinsurance, proportional reinsurance treaties (quota
share and surplus share) and other non-proportional reinsurance treaties, may also provide some
coverage for natural peril losses, however the catastrophe excess of loss program is currently the
predominant approach.
Whilst Australian natural perils could be of significant size, they are relatively small compared with global
peak catastrophe scenarios such as US hurricane, US earthquake, Japan earthquake and European
windstorm. Market research undertaken by Aon Benfield (AB) estimated the global reinsurer capital as at
September 30, 2015 to be approximately US$565 billion. Hence the global reinsurance market currently
has more than sufficient capacity to accommodate the capital requirements of the Australian market –
particularly with Australia currently viewed as a providing diversification to other global exposures.
The traditional reinsurance market has been softening with the increase in total reinsurance capacity since
2011. Rate reductions have been observed both locally and overseas. When considering the future cost of
reinsurance the cyclical nature of the global reinsurance market needs to be taken into account. Significant
price increases due to a shortage of (global) reinsurance capacity post large losses could have a major
impact on the local markets and affordability concerns could be exacerbated.
6.3 Government (Federal, State and Local)
The natural peril funding arrangements are shaped by the Australian Constitution, which assigns the roles
and responsibilities of each level of government. Most service delivery is the responsibility of the state
governments (local governments are essentially an extension of state governments). Consequently, most
natural peril risk management is the responsibility of those levels of government.
Currently, the Federal Government’s role in national disaster funding arrangements consists of three main
elements:
Natural Disaster Relief and Recovery Arrangements
Australian Government assistance to individuals;
The National Partnership Agreement for Natural Disaster Resilience (NPANDR).
The arrangements have undergone many changes over time as new policies have been added and
NDRRA determinations have been released. The evolution of the funding arrangements can be
characterised by growing generosity by the Australian Government during the past decade, followed by a
swing to constrain costs and increase oversight in response to the recent spate of costly disasters.
Natural Disaster Relief and Recovery Arrangements
NDRRA set out the framework for the Australian Government to share the costs of natural peril recovery
with state governments (and ultimately, through the states to local governments). The Australian
Government provides reimbursement for a portion of eligible expenditure on assistance to individuals and
businesses, and for restoration of essential public assets.

Page 23 of 29
13-15 November 2016
The fundamental elements of the NDRRA are:
annual thresholds — the Australian Government only provides assistance if cumulative state
expenditure (meeting the small disaster criterion) exceeds a certain threshold in a financial year;
small disaster criterion — only events that lead to expenditure above the ‘small disaster criterion’
(currently $240,000) can be counted toward the annual threshold;
cost-sharing rates — the level of reimbursement (up to 75 per cent) depends on the level of state
expenditure and the type of activity;
eligible expenditure — reimbursement is only available for defined activities, falling under three
categories (with a fourth category available for discretionary assistance as determined by the Prime
Minister).
Over the last 10 years the average amount provided by the federal government under the NDRRA is
approximately $1.2 billion p.a.
The Productivity Commission’s 2014 review of Natural Disaster Funding Arrangements identified a number
of concerns regarding the structure of the NDRRA. These included that:
The level of support creates a financial disincentive for state and local governments to manage the
natural perils risk, especially through land use planning;
The reimbursement model can drive undesirable behaviours, including excessive expenditure in
areas that are eligible for reimbursement, and can prevent the most cost effective recovery options
being followed.
Australian Government Assistance to Individuals
The Australian Government assistance to individuals takes a range of forms.
Examples include:
The Australian Government Disaster Recovery Payment, which is a one-off non-means tested
payment of $1,000 for adults and $400 for children who are adversely affected by a major disaster,
as determined by the Minister for Justice;
The Disaster Recovery Allowance (DRA) which is paid for up to 13 weeks to people who
demonstrate a loss of income.
The average level of payments over the last 10 years appears to be around $0.2 billion p.a.
The National Partnership Agreement for Natural Disaster Resilience
The NPANDR is an intergovernmental agreement for shared funding of activities that contribute to natural
peril resilience and adaptation. It is an agreement between the Australian Government and the states to
fund adaptation projects in accordance with the National Strategy for Disaster Resilience. Under the
agreement, the Australian Government provides funding for activities undertaken by states and territories
that increase disaster resilience.
6.4 Funding for non-insured cost of natural perils
Much of the costs for natural perils are not covered by insurance. The full economic costs of natural perils
are difficult to measure. Full economic costs include (direct and indirect) tangible and intangible costs.

Page 24 of 29
13-15 November 2016
Typically the indirect and non-tangible costs fall to individuals and families or, in some cases, to
government natural peril relief, as described above. The government natural peril recovery costs are
treated as contingent liabilities and therefore not included in government financial statements (that is, the
forward estimates only include provision for fiscal costs from past disasters). This budget treatment means
that most natural peril costs have become a volatile and unfunded liability for governments, especially the
Commonwealth Government.
There is a spectrum of alternatives, varying from one extreme of a provision set aside before disasters
occur (pre loss financing) to the other of obtaining funds if and when a disaster occurs (post loss
financing). Budgeting for these costs could provide incentives to introduce cost effective ways to reduce
the cost (e.g. adaptation).
6.5 Pooling arrangements
As noted elsewhere in this paper there are concerns about the affordability of natural peril insurance
coverage in some parts of Australia, particularly for flood and cyclone. One approach to managing
affordability is the use of pools, which can be funded more broadly and used to subsidise some or all of the
cost of high risk properties. There are currently no pools in Australia to subsidise the cost of natural perils
for high risk properties.
Critics of pools often point to the importance of risk based rating to provide incentives for homeowners and
councils to undertake adaptation strategies and discourage the construction of properties in high risk
areas.
In 2012 the Actuaries Institute issued a media release supporting the establishment of a temporary
national pool to subsidise high insurance premium for flood prone properties. The Actuaries Institute
stated that “…..it’s vital that any subsidies provided from the pool are conditional on policyholders and local
councils taking action to reduce the risk of damage from flooding, such as carrying out the appropriate
property renovations and building levees in high risk areas”.
The NDWG supports the use of pools in this manner, noting in particular the intention that the pool be
temporary and that it be structured to provide incentives to reduce risk.

Page 25 of 29
13-15 November 2016
6.6 Alternative capital / risk transfer
The continued flow of new capital into the (re)insurance industry constitutes the largest change to the
sector’s capital structure in recent memory. New capital has entered the market through investments in
insurance-linked securities (ILS) funds, sidecars, hedge fund-backed reinsurance companies and
collateralised reinsurance vehicles. Investors have increasingly been attracted to low correlation returns
from catastrophe risk relative to traditional capital markets risks and the attractive yield for the measured
(re)insurance risk relative to other investments, particularly in the current low inflation, low yield market.
Guy Carpenter estimated the new capital as at July 1, 2015 to be approximately US$66 billion. This
includes catastrophe bonds, industry loss warranties, collateralized reinsurance and sidecars.
Traditional reinsurance arrangements rely on a “promise to pay” and therefore expose clients to
counterparty credit risk. Collateralised placements and many ILS reduced this risk by placing the full limit in
a single beneficiary trust or securing the limit via methods such as Letter of Credit (LOC), for the benefit of
the ceding insurer.
In the past few years, there have been several attempts by Australian (re)insurance companies to transfer
some of the natural perils risks to the alternative markets, such as catastrophe bonds. There have been
few successes so far with the main reasons for low success rates being:
- Competitive pricing from the traditional reinsurance markets;
- Concerns around the difficulties of assessing (and getting regulatory approval) in the solvency
capital calculations.

Page 26 of 29
13-15 November 2016
The convergence of (re)insurance with the capital markets is a significant development for the private
sector’s ability to assume and diversify catastrophe risk and assist in de-risking public sector entities. While
the growth of this form of reinsurance capital has been strong, it still represents less than 20 percent of
total reinsurance capital. When compared with the US$ 30 trillion of global pension funds’ assets under
management, the current level of capital market involvement in ILS is only 0.22 percent of total global
pension assets under management. The risk bearing potential of capital markets that now exists for new
insurance risk is enormous. The challenge will be to create motivation to transfer risk through a process of
risk identification, cost allocation and development of a conduit to transfer risk.

Finity Consulting Pty Limited
Page 27 of 29
13-15 November 2016
7 References
Attorney-General’s Department, n.d., State and territory disaster resilience funding, accessed 13 June
2016, available at https://www.ag.gov.au/EmergencyManagement/Disaster-assistance-and-
grants/Pages/State-and-territory-disaster-resilience-funding.aspx
Australian Building Codes Board, 2015, Australian Building Codes Board About Page, accessed 17 April
2016, available at http://www.abcb.gov.au/NCC/About
Australian Treasury, 2015, Northern Australia Insurance Premiums Taskforce – Final Report, available at
http://www.treasury.gov.au/~/media/Treasury/Consultations%20and%20Reviews/Reviews%20and%20In
quiries/2015/NAIP%20Taskforce/Final%20Report/Downloads/PDF/NAIP_final_report.ashx
Brisbane City Council, 2016, Flooding in Brisbane, accessed 10 May 2016, available at
http://floodinformation.brisbane.qld.gov.au/fio/
Bureau of Meteorology, 2016, About Severe Thunderstorms, accessed 10 May 2016, available at
http://www.bom.gov.au/nsw/sevwx/about.shtml
Bureau of Meteorology, 2016, Climatology of Tropical Cyclones in Western Australia, accessed 10 May
2016, available at http://www.bom.gov.au/cyclone/climatology/wa.shtml
Clarke H, Lucas C & Smith P, 2012, ‘Changes in Australian fire weather between 1930 and 2010’,
International Journal of Climatology, vol. 33, iss. 4, pp. 931-944.
Crompton R P, 2011, Normalising the Insurance Council of Australia Natural Disaster Event List: 1967-
2011, Insurance Council of Australia, available at
http://www.insurancecouncil.com.au/assets/files/normalising%20the%20insurance%20council%20of%20
australia%20natural%20disaster%20event%20list.pdf
Cyclone Testing Station, Urbis & Suncorp Group Limited, n.d., Build to Last: A Protecting the North
Initiative, commissioned by Suncorp Group Limited, pp. 4, available at
http://www.suncorpgroup.com.au/sites/default/files/pdf/news/Suncorp%20Build%20to%20Last%20Summ
ary.pdf
Deloitte Access Economics, 2016, The economic cost of the social impact of natural disasters,
commissioned by the Australian Business Roundtable for Disaster Resilience and Safer Communities,
available at http://australianbusinessroundtable.com.au/assets/documents/Report%20-
%20Social%20costs/Report%20-
%20The%20economic%20cost%20of%20the%20social%20impact%20of%20natural%20disasters.pdf
Deloitte Access Economics, 2013, Building out nation’s resilience to natural disasters, commissioned by
the Australian Business Roundtable for Disaster Resilience and Safer Communities, available at
http://australianbusinessroundtable.com.au/assets/documents/White%20Paper%20Sections/DAE%20Ro
undtable%20Paper%20June%202013.pdf
Department of Fire & Emergency Services, 2016, Map of Bush Fire Prone Areas, accessed 10 May
2016, available at https://maps.slip.wa.gov.au/landgate/bushfireprone/
Department of Social Services, 2015, 5.1.6.20 AGDRP – Current Rates, accessed 2 May 2016, available
at http://guides.dss.gov.au/guide-social-security-law/5/1/6/20
Page 28 of 29
13-15 November 2016
Deutsche Bank & Finity Consulting, 2016, ‘Pendulum GI Review 2016’
FloodCheck, 2016, FloodCheck map, Department of Natural Resources and Mines, accessed 10 May
2016, available at http://dnrm-floodcheck.esriaustraliaonline.com.au/floodcheck/
Geoscience Australia, 2016, Australian Flood Risk Information Portal, accessed 10 May 2016, available
at http://www.ga.gov.au/flood-study-
web/#/search?utm_source=promotion&utm_medium=homepage&utm_content=Flood_Studies&utm_cam
paign=Online-Tools
Hancock R & Rea M, 2013, Australian Storms and Floods: White Paper, Zurich Risk Engineering,
Australia & New Zealand, available at
https://www.zurich.com.au/content/dam/australia/general_insurance/risk_engineering/australian-storms-
and-floods-white%20paper.pdf
ICA DataGlobe, 2016, CAT Data, Insurance Council of Australia, accessed 10 May 2016, available at
http://www.icadataglobe.com/access-catastrophe-data/
Insurance Council of Australia, 2016, Catastrophe events and the community, accessed 10 May 2016,
available at http://www.insurancecouncil.com.au/issue-submissions/issues/catastrophe-events
Insurance Council of Australia, 2016, Insurance losses from summer catastrophes pass half a billion
dollars, accessed 10 May 2016, available at
http://www.insurancecouncil.com.au/media_release/plain/347
Insurance Council of Australia, 2012, Historical Disaster Statistics, available at
http://www.insurancecouncil.com.au/assets/files/current%20and%20historical%20disaster%20statistics%
20aug%2012.pdf
Land Channel, 2016, Designated Bushfire Prone Areas, Department of Environment, Land, Water and
Planning, accessed 10 May 2016, available at http://services.land.vic.gov.au/maps/bushfire.jsp
Productivity Commission, 2014, Natural Disaster Funding Arrangements, Inquiry Report vol. 1 no. 74,
Canberra, available at http://www.pc.gov.au/inquiries/completed/disaster-funding/report/disaster-funding-
volume1.pdf
Productivity Commission, 2014, Natural Disaster Funding Arrangements, Inquiry Report vol. 2 no. 74,
Canberra, available at http://www.pc.gov.au/inquiries/completed/disaster-funding/report/disaster-funding-
volume2.pdf
Swiss Re, 2016, Natural Catastrophes and Man-made Disastesr in 2015: Asia suffers substantial losses,
Swiss Re, sigma no. 1, available at http://www.swissre.com/library/373820071.html
Page 29 of 29
13-15 November 2016
Part III Appendices
[tba]