Embed Size (px)
Citation preview
San Jose State University San Jose State University
SJSU ScholarWorks SJSU ScholarWorks
Master's Projects Master's Theses and Graduate Research
Spring 5-2018
The Correlation between Enrollment Status and Graduation Rates The Correlation between Enrollment Status and Graduation Rates
of Master of Public Administration Programs of Master of Public Administration Programs
Jasmine Lorraine Ferrer San Jose State University
Follow this and additional works at: https://scholarworks.sjsu.edu/etd_projects
Part of the Educational Assessment, Evaluation, and Research Commons, Higher Education
Commons, Other Public Affairs, Public Policy and Public Administration Commons, and the Public
Administration Commons
Recommended Citation Recommended Citation Ferrer, Jasmine Lorraine, "The Correlation between Enrollment Status and Graduation Rates of Master of Public Administration Programs" (2018). Master's Projects. 651. DOI: https://doi.org/10.31979/etd.gvhy-jv9d https://scholarworks.sjsu.edu/etd_projects/651
This Master's Project is brought to you for free and open access by the Master's Theses and Graduate Research at SJSU ScholarWorks. It has been accepted for inclusion in Master's Projects by an authorized administrator of SJSU ScholarWorks. For more information, please contact [email protected].
The Correlation between Enrollment Status and Graduation Rates of Master of Public
Administration Programs
by
Jasmine Lorraine Ferrer
A Thesis Quality Research Paper
Submitted in Partial Fulfillment of the
Requirements for the
Masters Degree
in
PUBLIC ADMINISTRATION
Prof. Frances Edwards. Ph.D.
Advisor
The Graduate School
San Jose State University
May 2018
2
Table of Contents
INTRODUCTION 3
Statement of the Problem 3
Research Question 3
BACKGROUND 4
History of Accreditation 6
Table 1: NASPAA Standards 8
Graduation Rates 9
Challenges and Opportunities within MPA Programs 10
Value of this Research 11
LITERATURE REVIEW 12
Gap in Literature 12
Student Enrollment Status and Doctorate Degrees 14
METHODOLOGY 16
Methods Overview 16
Data Sources 16
Valid Responses 17
Table 2: NASPAA Research Variables 18
FINDINGS 19
Results 19
Table 3: Demographic Characteristics by Institution Percentages of Part-Time Students 20
Table 4: Program Characteristics by Institution Percentages of Part-Time Students 20
Table 5: Graduation Completion Rates by Institution Percentages of Part-Time Students 21
Table 6: Graduation Rates by Variable 22
Graduated within 3 Years 22
Graduated within 4 Years 23
Graduated within 5 Years 24
Threats to Validity 25
ANALYSIS 27
SOURCES CONSULTED 31
3
INTRODUCTION
Statement of the Problem
The Network of Schools of Public Policy, Affairs and Administration (NASPAA) is an
international association of universities and colleges that grant professional master’s degrees in
public policy, affairs and administration. In the academic year 2017-18 there were 301 member
schools (NASPAA, 2017). NASPAA’s mission is to advocate for quality education in the field of
public service (Kellough, 2014). NASPAA promotes the global standard in public service
education by ensuring the quality of master’s degree programs in policy, administration, and
public affairs of their member schools. This is evidenced by the association incorporating
standards in their mission-based accreditation process (NASPAA, 2018a).
The Master’s in Public Administration (MPA) degree program is designed to prepare
students for a career in public service. Graduates of the program find careers in public sector
management, healthcare, policy analysis, and in local, state and federal government
organizations. NASPAA has noticed a decline in public service degree program applications and
is concerned about retaining top-quality students to pursue careers in public service (Cheng,
2017).
Research Question
What is the correlation between part-time and full-time enrollment status and graduation rates for
the MPA degree programs in NASPAA accredited schools?
4
BACKGROUND Educational institutions have developed into highly competitive environments (Bright, 2016). As
a result, universities generally emphasize the values of affordability, access, retention, and
success as they compete for the best students. Further, there has been a demand to investigate
and understand the needs and expectations of prospective students, as well as the success of
degree programs (Bright, 2016).
Bessett and Burton (2014) state that an individual’s educational experience is vital to his
or her career development. Individuals pursuing higher education have been shown to achieve
economic, health and social benefits (Baume et al., 2013). Blumenstyk (2013) references
President Barack Obama’s 2012 campaign in which he commented on the importance of higher
education to the economy. While it has been proven that education has a significant positive
impact on society, the increasing cost of higher education creates barriers to entry. Two
approaches to help alleviate the financial strain on students are to shorten degree completion time
through incorporating a blend of online and in-class courses, and to assess not only enrollment
rates but also graduation rates (Blumenstyk, 2013).
Higher education enrollments in master’s, doctorate and professional degrees have been
increasing (Hussar & Bailey, 2013). The purpose of a master’s degree is to equip students with
specialized skills and advanced knowledge to become experts in a specific field of study (Bright,
2016). From 1997 to 2010, the total number of master’s degrees awarded increased by 63 percent
and is anticipated to increase by a further 34 percent by 2022 (Hussar & Bailey, 2013). This
demand is in response to the potential career advancements and salary increases that result from
having a master’s degree (U.S. Department of Education, 2007). In 2013, full-time workers over
the age of 25 with a graduate degree earned $12,000 more annually than their undergraduate
degree counterparts. This salary difference does not include the factors of occupational
5
qualifications, such as education or experience, however, the data provides a general comparison
between the degrees (Torpey & Terrel, 2015).
In order to make a decision on whether to pursue graduate school education, prospective
students usually compare the tangible benefits, career advancements, and salary increases,
against the degree’s purpose and personal financial factors. These individuals evaluate the
program’s completion length and likely benefit in achieving his or her career goals (Torpey &
Terrell, 2015). Prospective students can anticipate completing a master’s degree within two to
three years as a full-time student, and about three to five years as a part-time student (United
States Department of Education, 2007). Additionally, it is important for these individuals to
financially plan for their graduate program. The National Center for Education Statistics (2013)
reported that the average cost for a master’s degree in 2013, including tuition and fees, was
$16,435 a year. It is advisable for individuals with financial constraints to explore available
resources, such as state grants, employer tuition reimbursement and scholarships (United States
Department of Education, 2007) to manage the financial commitment.
NASPAA accredited MPA degree programs have the common goal, which is to educate
students for careers in the public sector (NASPAA, 2018d). Based on the institution, MPA
programs can reside in various departments, such as political science, health, social work,
business, law and criminal justice (Bright, 2016). Each institution has different MPA program
admission requirements, which include grade point average (GPA), graduate record
examinations (GRE), letter of intent, letter of recommendation and course pre-requisites (Cheng,
2017). Likewise, the definition of a part-time or full-time student differs from one institution to
another. The most common definition of a part-time graduate student is one who is enrolled in 8
6
units or less, and a full-time graduate student is one who is enrolled in 9 units or more (CSU,
n.d).
History of Accreditation
Sylvia and Sylvia (2012) state that organizations have clear standards to illustrate their structure
and support for the achievement of their mission. Standards are defined as the criteria by which
an organization's operations and services can be judged. Criteria can be categorized as industry
standards, or comparative, historical, or engineered standards; however, standards can
incorporate a combination of these categories based on the services being evaluated and the
clientele (Sylvia and Sylvia, 2012).
Standards can promote the organization’s transparency and accountability. The
legislature and politically appointed administrators set efficiency standards for public
organizations, while professional associations also enforce external standards. As a result,
professionals working in these fields focus on the following: adhere to qualification standards,
ensure that treatment modalities are aligned with professional practices for their respective
disciplines and that services are beneficial to the populations the organization is serving. Overall,
the purpose of the standards used by an organization is to ensure that there is a consistent
implementation of services by well-qualified providers (Sylvia & Sylvia, 2012).
Professional associations develop and maintain processes pertaining to accreditation
standards. According to the United States Department of Education (n.d.), the purpose of
accreditation is to verify that higher education institutions are providing adequate quality levels
of instruction to their students. The educational accreditation process in the United States
involves federal and state government agencies and non-government agencies. The primary
functions of accreditation are to evaluate the quality of academic programs, develop a culture of
7
continuous improvements regarding academic quality, to promote the standards in the institution,
involve staff and faculty in the process, and to develop measures for professional licensure and
certification (United States Department of Education, n.d.).
There are two types of educational accreditation: institutional and specialized.
Institutional accreditation pertains to the entire higher education institution, whereas specialized
accreditation, or programmatic accreditation applies to the individual programs, departments or
schools of an institution (U.S. Department of Education, n.d.). Accreditation is granted for a
specific duration, and upon expiration, the institution or program will need to go through a
review process. However, it has become more common for institutions and programs to
incorporate assessments and evaluations prior to accreditation reviews to prevent accreditation
loss (Sylvia & Sylvia, 2012).
An example of a specialized educational accreditation is the entity that provides
accreditation for MPA degrees, NASPAA’s Commission on Peer Review and Accreditation
(COPRA). NASPAA originated in 1970 as the accrediting arm of the American Society for
Public Administration and currently provides a global standard for programs in public service
education (NASPAA, n.d.). In its early stages, NASPAA was an avenue for MPA administrators
to collaborate on the topics of faculty, course content, and overall program autonomy and
delivery. As the association progressed, NASPAA sought ways to promote the quality of its
programs and developed COPRA. COPRA then created standards for programs to assess
themselves against (Sylvia & Sylvia, 2012). Additionally, COPRA is recognized as the global
accreditor of MPA programs by the Council for Higher Education Accreditation (CHEA). In
1986, NASPAA became the accrediting entity of the Council on Postsecondary Accreditation
(COPA) for MPA programs, and developed standards that were adopted in 2009 and amended in
8
2014 (NASPAA, 2014). These standards currently set compliance guidelines for programs
seeking reaccreditation or beginning the accreditation process (NASPAA, 2018b). The standards
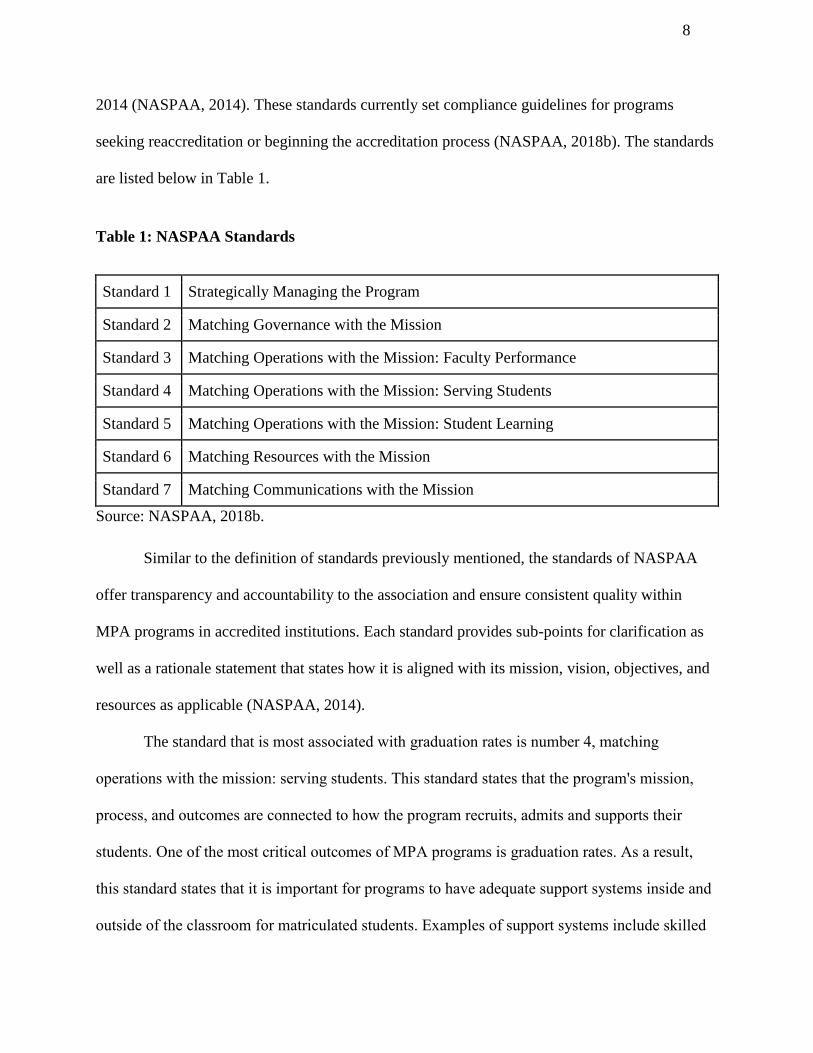
are listed below in Table 1.
Table 1: NASPAA Standards
Standard 1 Strategically Managing the Program
Standard 2 Matching Governance with the Mission
Standard 3 Matching Operations with the Mission: Faculty Performance
Standard 4 Matching Operations with the Mission: Serving Students
Standard 5 Matching Operations with the Mission: Student Learning
Standard 6 Matching Resources with the Mission
Standard 7 Matching Communications with the Mission
Source: NASPAA, 2018b.
Similar to the definition of standards previously mentioned, the standards of NASPAA
offer transparency and accountability to the association and ensure consistent quality within
MPA programs in accredited institutions. Each standard provides sub-points for clarification as
well as a rationale statement that states how it is aligned with its mission, vision, objectives, and
resources as applicable (NASPAA, 2014).
The standard that is most associated with graduation rates is number 4, matching
operations with the mission: serving students. This standard states that the program's mission,
process, and outcomes are connected to how the program recruits, admits and supports their
students. One of the most critical outcomes of MPA programs is graduation rates. As a result,
this standard states that it is important for programs to have adequate support systems inside and
outside of the classroom for matriculated students. Examples of support systems include skilled
9
faculty and lesson plans, advising sessions and internship and job placements. In turn, MPA
students learn skills that can be transferred to their future careers, and receive guidance
throughout their academic career towards graduation (NASPAA 2018d).
Graduation Rates
Prior to the academic year 2017-18, NASPAA categorized graduation rates based on the
benchmarks of three years, four years and five years. In an effort to align these benchmarks with
how institutions actually report graduation rates, COPRA has amended the benchmarks for the
academic year 2017-18; they will now reflect benchmarks of two, three and four years.
Additionally, institutions can report on students that graduate from the program after four years
(NASPAA, 2018d).
As previously stated, students typically complete a graduate program in two to five years.
However, graduate programs in the United States may allow graduate students to complete their
programs in up to seven years. This time limit policy for program completion is evidenced in the
universities in the state of California, Eastern Kentucky University (EKU, 2018), University of
Oregon (UO, 2018), University of Illinois (Illinois Graduate College, 2018), University of
Connecticut (UCONN, 2018), and University of Alabama (UA, 2018). According to the
California Code of Regulations (The Master’s Degree, 5 CCR §40510), the maximum number of
years for a candidate for a master’s degree to complete program requirements is seven years.
Extensions may be permitted based on the California institution, with the expectation that the
outdated courses are validated. The California Code of Regulations further states that in order for
a candidate to complete the master’s degree program, he or she is required have a 3.0 GPA, and
to satisfactorily complete a comprehensive examination, thesis or project that evidences the
10
student's critical and independent thinking and mastery of the subject matter (The Master’s
Degree, 5 CCR §40510).
Challenges and Opportunities within MPA Programs
While investigating graduation rates, it is also important to understand the characteristics of
MPA programs. Pautz and Neeley (2017) state that small program sizes are the norm for most
MPA programs in the United States and that these programs have certain opportunities and
challenges. This article defines a small program as a program having less than one hundred
students (NASPAA, 2016). However, this is not to dismiss the challenges and difficulties caused
by internal and external factors of MPA programs of other larger sizes.
The seven main challenges that the authors identified are explaining the value of the
program to the university’s community, having limited advocates for the program, enhancing the
value of the MPA graduate program in an institution that promotes undergraduate education,
capitalizing on the institution’s undergraduate focus to create a pipeline for graduate students,
collaborating with both undergraduate and graduate disciplines, recruiting prospective students
and retaining bright students, and responding to external regional factors in the public sector.
These specific challenges are in addition to the common concerns of faculty staffing and
financial resources (Pautz and Neeley, 2017).
In response to these challenges, Pautz and Neeley (2017) offer suggestions for
improvement for MPA programs facing similar situations. These opportunities consist of
leveraging opportunities to educate program stakeholders on the value of the MPA program and
degree, to partner with other disciplines in the institution, to consider each student’s unique
academic situation, and to encourage alumni engagement. Also, having limited advocates for the
11
program allows for the advantage of faster decision making processes, because there is no need
to acquire consent from a large team (Pautz and Neeley, 2017).
It is important to delineate the challenges that smaller MPA programs face because most
MPA programs in the United States fall into this category. Further, these are variables that could
influence graduation rates and do not necessarily affect enrollment status (whether students
attend full time or part time). Lastly, it is beneficial to understand that the authors used a multi-
step process to assess these seven challenges to then enabled them to provide solutions to bridge
the gaps within MPA programs (Pautz and Neeley, 2017).
Value of this Research
This research into the possible influence of full time or part time status on graduation rates is
valuable because it provides useful information about graduation outcomes to the stakeholders of
MPA programs. The findings will be significant to the following stakeholders: NASPAA
accredited schools, directors and faculty of the MPA program, and prospective and current
students of the MPA program.
12
LITERATURE REVIEW
Gap in Literature
The researcher acknowledges that there is a lack of literature pertaining specifically to student
enrollment statuses and MPA degree programs, as well as student enrollment status and master’s
degree programs in general. This study is worthwhile because it has responded to this gap in the
literature. In order to understand the impact of enrollment status and degree attainment, this
section provides insight into the qualities of graduate students and graduate programs.
Characteristics of Graduate Students
Students enrolling in graduate programs exhibit self-determination to master a specific
subject matter (Hegarty, 2011). Hegarty (2011) states that enrolling in a graduate program is an
intimidating process in comparison to that of a professional certificate or continuing education
credits. This is a result of the decision-making process that graduate students go through and the
attitude they have in regards to the time commitment to attain a degree. Individuals pursue higher
education due to intrinsic and extrinsic motivations associated with graduate degrees. Intrinsic
motivation is the student’s genuine passion for the subject matter and the desire to learn more
about the field of study. Extrinsic motivation is the student’s tangible goals that will be achieved
in the program. This could include monetary rewards or job placements (Hegarty, 2011).
Mullen et al., (2003) conducted a study to better understand the demographic
characteristics of graduate students. Graduate students who were older than 30 were typically
from low socioeconomic backgrounds and completed the program at a slower rate than younger
students (Mullen et al., 2003). Also, students are indirectly influenced by their parents’ academic
achievements to pursue higher education (Mullen et al., 2003). Students whose parents had a
13
graduate degree were likely to enroll into a graduate program, excel in the program and to obtain
a degree (Mullen et al., 2003).
Additionally, Girves and Wemmerus (1988) conducted a regression analysis that
identified full-time graduate students as having higher graduation completion rates than part-time
graduate students. It was concluded that full-time students had more incentives to obtain a
master’s degree and fewer distractions from external factors, such as employment, families or
financial responsibilities (Girves & Wemmerus, 1988).
Characteristics of Graduate Programs
It is important to consider the characteristics of graduate programs when investigating
degree attainment. Smaller cohorts positively impacted degree attainment due to an increase in
interactions between graduate students and faculty. This communication is an essential
distinction between undergraduate programs and graduate programs. Unlike undergraduate
programs, the faculty in graduate programs is responsible for more than advising on course
requirements. They are responsible for providing their students with motivation, networking
opportunities and constant feedback. Faculty in graduate programs offered guidance and support
for the student academically and professionally (Girves & Wemmerus, 1988).
In order for graduate programs to be successful, Hegarty (2011) found that it was
important for institutions to be aware of different learning styles among graduate students. This
is valuable for the faculty and program coordinators because it allows them to best meet the
needs of its students. For instance, it was beneficial for faculty to understand that some students
needed group exercises to learn the skills of problem solving and that others benefited from
hearing experiences in the workplace from peers to understand a topic. Additionally, graduate
students that attended classes during the day had different qualities than those who were enrolled
14
in the evening or online classes. Those who attended classes during the day were likely to be
full-time graduate students and had similarities in ethnicity and motivations. Conversely, those
enrolled in evening or weekend classes were likely to be part-time students and from a variety of
ethnic backgrounds (Hegarty, 2011). Graduate programs need to be aware of their student
populations in order for their faculty to better serve them. Students who felt supported and
respected by their professors were on track for graduation. These are important elements for the
students to persist through the program and ultimately complete the degree (Girves &
Wemmerus, 1988).
Factors that can negatively impact a student’s persistence and degree attainment include
financial constraints and career advancements. Financial obligations and unforeseen costs can
cause the student to discontinue the program. Career advancements can also decrease the
motivation and academic progress because of the opportunity for jobs and financial security
(Girves & Wemmerus, 1988). This could offer possible reasons as to why graduate students do
not complete the MPA program.
Student Enrollment Status and Doctorate Degrees
Gardner and Gopaul (2012) conducted a study on the experiences of part-time and full-
time doctoral students of varying degree programs. The authors stated that full-time doctorate
students may adopt the habits, skills, and attitudes necessary to obtain a doctorate degree.
Further, these students have the time to concentrate solely on the program’s research
requirements which leads to increased graduation rates. Interestingly, the study found that the
characteristics of part-time doctoral students varied depending on the student’s field of study.
This is due to the culture and nature of the program. For instance, there is a large population of
15
part-time students in the education and social work fields, in comparison to other disciplines
(Gardner & Gopaul, 2012).
Since full-time students have more time to focus on the doctorate program’s
requirements, it is perceived that part-time doctorate students are less engaged and committed to
the program. However, the study found that the part-time doctorate population had barriers to
degree completion, such as financial constraints, schedule conflicts, personal obligations and
lack of support. The authors found that both part-time and full-time doctorate students had a
difficult time balancing the program with external responsibilities, but that part-time students felt
significantly more pressure to balance their obligations than the full-time students. The part-time
doctorate students in this study either worked full-time, were parents and/or a single parent. They
expressed that during their academic career they have made sacrifices to maintain the balance of
the constraints noted, and mentioned that they felt discouraged at the amount of time they could
dedicate to their studies in comparison to their full-time counterparts. In response to these
concerns for the part-time doctoral student population, the authors suggest that doctoral
programs provide on-campus counseling, childcare, and writing resources, and for specialized
disciplines to offer academic career path planning workshops. These recommendations were
made in an effort to retain part-time doctoral students and increase completion rates (Gardner &
Gopaul, 2012). It is likely that similar differences exist among part-time and full-time master's
level graduate students, as well.
16
METHODOLOGY
Methods Overview
This research study used descriptive analysis to assess the relationship between student
enrollment statuses and graduation rates of MPA programs of NASPAA accredited schools. The
forecasting methods of correlation and regression analysis were used to evaluate the relationship
between these variables. These quantitative research methods provided a statistical evaluation of
past data to examine the significance of the relationships (Sylvia & Sylvia, 2012). The data
acquired for this study were analyzed using the Statistical Package for the Social Sciences
software (IBM SPSS, 24).
Data Sources
This research study used survey data acquired from NASPAA’s public data center. In
2010, NASPAA started gathering data on an annual basis to identify the major outcomes and
outputs of nationally and internationally accredited programs. NASPAA collected this data
through accreditation maintenance reports, self-study reports and annual program surveys
(NASPAA, 2018c).
The research compiled and assessed the raw data available for the academic years 2010-
2016 and determined that the academic years 2014-15 and 2015-16 had the most valuable data to
guide the research process to answer the research question: What is the correlation between part-
time and full-time enrollment status and graduation rates of MPA degree programs at NASPAA
accredited schools? The academic years 2014-15 and 2015-16 were selected because of the
stabilization of the data collection methodology by NASPAA.
Data pertaining to international programs and accredited NASPAA programs that were
not categorized as MPA programs were excluded for the sake of conceptual parsimony. As such,
17
the findings of this study only applies to NASPAA accredited schools with MPA programs in the
United States.
Table 2 presents the descriptive statistics for the variables for this study. As illustrated
below, the dependent variable is graduation rates of MPA students within a given MPA program,
which is separately measured as graduation within three, four and five years of commencing
classwork.
The independent variable is the program’s enrollment status, and the control variables
consist of gender, the size of the program, ethnicity, evening classes and weekend classes.
Gender is measured by the percentage of female students enrolled in the program and ethnicity is
measured by the percentage of students identifying as a non-white ethnic group. The control
variables size of the program, weekend classes, and evening classes are dummy variables. The
size of the program is defined as 0 meaning small and 1 meaning large. A small MPA program is
one with ninety-nine students or less, while a large program is defined as one with one hundred
or more students. The variables of weekend classes and evening classes is defined as 0 meaning
no and 1 meaning yes. While the focus of this research pertains to enrollment status and
graduation rates, it was important to include additional control variables in order to understand
the variance of graduation rates in the sample.
Valid Responses
A total of 154 accredited schools with MPA programs provided responses to NASPAA
for the academic years 2014-15 and 2015-16. Therefore, a total of 308 responses were gathered
for this study. Of those 308 responses, Table 2 displays the number of valid responses per
variable in the column labeled Number of Institution Responses.
18
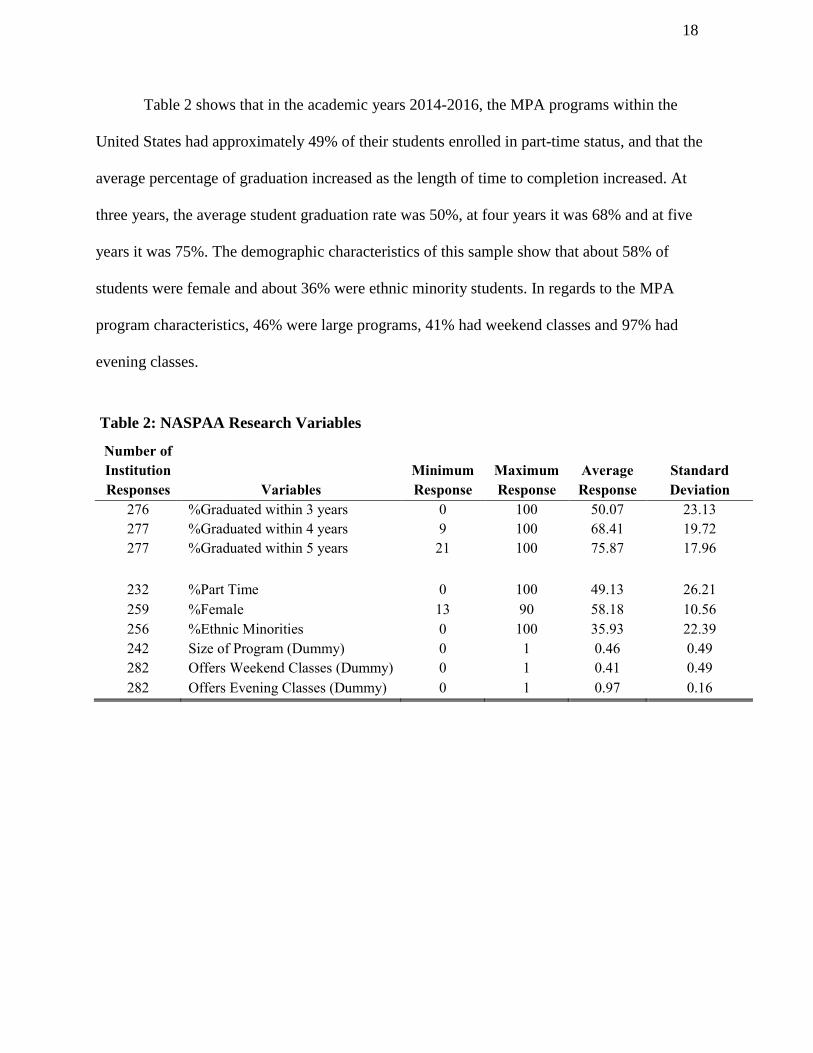
Table 2 shows that in the academic years 2014-2016, the MPA programs within the
United States had approximately 49% of their students enrolled in part-time status, and that the
average percentage of graduation increased as the length of time to completion increased. At
three years, the average student graduation rate was 50%, at four years it was 68% and at five
years it was 75%. The demographic characteristics of this sample show that about 58% of
students were female and about 36% were ethnic minority students. In regards to the MPA
program characteristics, 46% were large programs, 41% had weekend classes and 97% had
evening classes.
Table 2: NASPAA Research Variables
Number of
Institution
Responses Variables
Minimum
Response
Maximum
Response
Average
Response
Standard
Deviation
276 %Graduated within 3 years 0 100 50.07 23.13
277 %Graduated within 4 years 9 100 68.41 19.72
277 %Graduated within 5 years 21 100 75.87 17.96
232 %Part Time 0 100 49.13 26.21
259 %Female 13 90 58.18 10.56
256 %Ethnic Minorities 0 100 35.93 22.39
242 Size of Program (Dummy) 0 1 0.46 0.49
282 Offers Weekend Classes (Dummy) 0 1 0.41 0.49
282 Offers Evening Classes (Dummy) 0 1 0.97 0.16
19
FINDINGS
The purpose of this research was to determine whether there was a positive or negative
correlation between enrollment status (part-time or full-time) and graduation rates. This section
presents cross-tabulations and regression models to illustrate the relationships between
enrollment statuses and demographic characteristics, program characteristics and graduation
rates.
Results
The percentage of students enrolled in a part-time status was divided into four groups:
schools, where less than 25% of students were enrolled at part-time, where 25-49% of students
were enrolled part-time, where 50-74% of students were enrolled part-time, and where more than
75% of students were enrolled part-time. Dividing the percentage of part-time students in this
way allowed the research to better evaluate the graduation persistence of part-time students from
this sample.
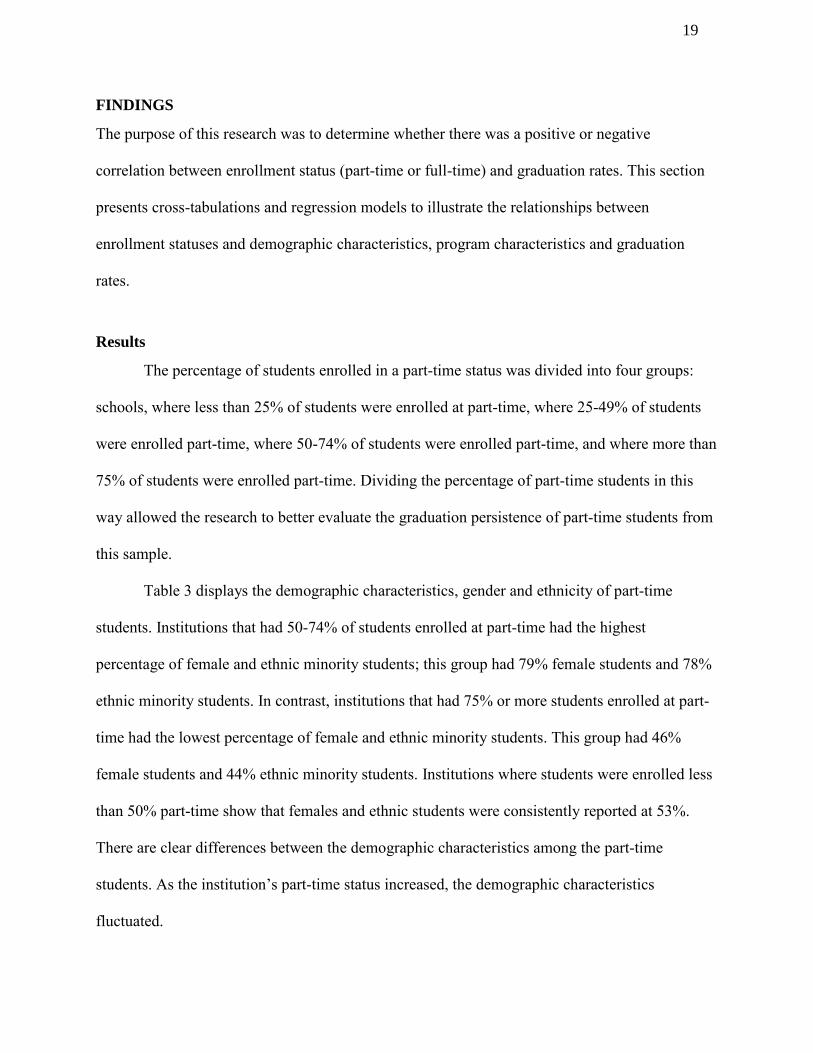
Table 3 displays the demographic characteristics, gender and ethnicity of part-time
students. Institutions that had 50-74% of students enrolled at part-time had the highest
percentage of female and ethnic minority students; this group had 79% female students and 78%
ethnic minority students. In contrast, institutions that had 75% or more students enrolled at part-
time had the lowest percentage of female and ethnic minority students. This group had 46%
female students and 44% ethnic minority students. Institutions where students were enrolled less
than 50% part-time show that females and ethnic students were consistently reported at 53%.
There are clear differences between the demographic characteristics among the part-time
students. As the institution’s part-time status increased, the demographic characteristics
fluctuated.
20
Table 3: Demographic Characteristics by Institution Percentages of Part-Time Students
% Female % Ethnic Minorities
0-24% Part-Time 53% 53%
25-49% Part-Time 53% 53%
50-74% Part-Time 79% 78%
75-100% Part-Time 46% 44%
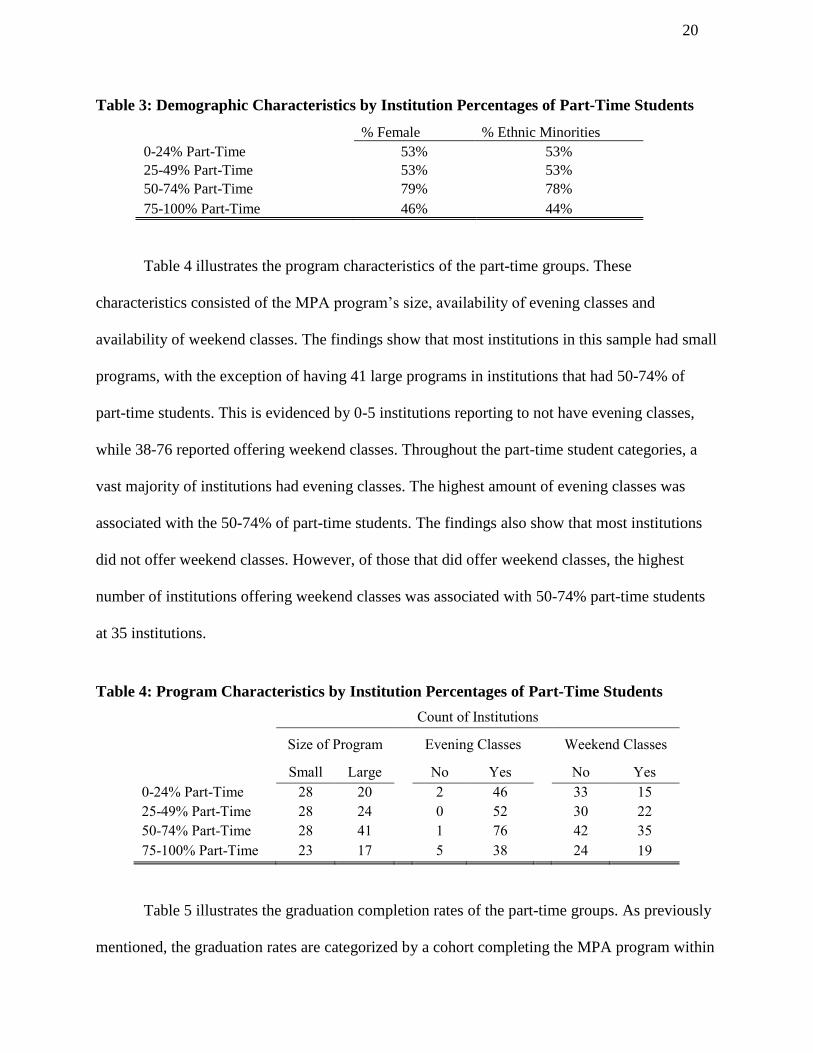
Table 4 illustrates the program characteristics of the part-time groups. These
characteristics consisted of the MPA program’s size, availability of evening classes and
availability of weekend classes. The findings show that most institutions in this sample had small
programs, with the exception of having 41 large programs in institutions that had 50-74% of
part-time students. This is evidenced by 0-5 institutions reporting to not have evening classes,
while 38-76 reported offering weekend classes. Throughout the part-time student categories, a
vast majority of institutions had evening classes. The highest amount of evening classes was
associated with the 50-74% of part-time students. The findings also show that most institutions
did not offer weekend classes. However, of those that did offer weekend classes, the highest
number of institutions offering weekend classes was associated with 50-74% part-time students
at 35 institutions.
Table 4: Program Characteristics by Institution Percentages of Part-Time Students
Count of Institutions
Size of Program Evening Classes Weekend Classes
Small Large No Yes No Yes
0-24% Part-Time 28 20 2 46 33 15
25-49% Part-Time 28 24 0 52 30 22
50-74% Part-Time 28 41 1 76 42 35
75-100% Part-Time 23 17 5 38 24 19
Table 5 illustrates the graduation completion rates of the part-time groups. As previously
mentioned, the graduation rates are categorized by a cohort completing the MPA program within
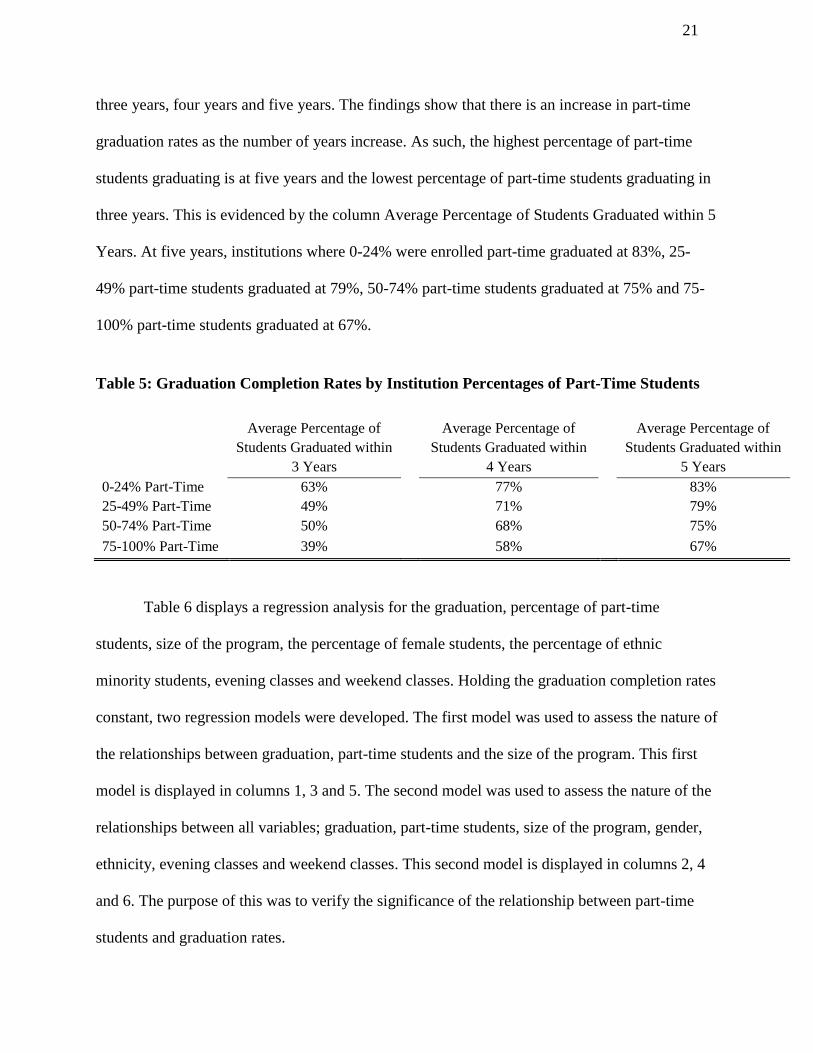
21
three years, four years and five years. The findings show that there is an increase in part-time
graduation rates as the number of years increase. As such, the highest percentage of part-time
students graduating is at five years and the lowest percentage of part-time students graduating in
three years. This is evidenced by the column Average Percentage of Students Graduated within 5
Years. At five years, institutions where 0-24% were enrolled part-time graduated at 83%, 25-
49% part-time students graduated at 79%, 50-74% part-time students graduated at 75% and 75-
100% part-time students graduated at 67%.
Table 5: Graduation Completion Rates by Institution Percentages of Part-Time Students
Average Percentage of
Students Graduated within
3 Years
Average Percentage of
Students Graduated within
4 Years
Average Percentage of
Students Graduated within
5 Years
0-24% Part-Time 63% 77% 83%
25-49% Part-Time 49% 71% 79%
50-74% Part-Time 50% 68% 75%
75-100% Part-Time 39% 58% 67%
Table 6 displays a regression analysis for the graduation, percentage of part-time
students, size of the program, the percentage of female students, the percentage of ethnic
minority students, evening classes and weekend classes. Holding the graduation completion rates
constant, two regression models were developed. The first model was used to assess the nature of
the relationships between graduation, part-time students and the size of the program. This first
model is displayed in columns 1, 3 and 5. The second model was used to assess the nature of the
relationships between all variables; graduation, part-time students, size of the program, gender,
ethnicity, evening classes and weekend classes. This second model is displayed in columns 2, 4
and 6. The purpose of this was to verify the significance of the relationship between part-time
students and graduation rates.
22
The statistical significance is based on the variable's t score and sig output from the
regression analysis. To clarify, the t score is significant if it is greater than 1.96 and less than
-1.96. Secondly, the sig is significant if it is less than 0.05. It should be noted that if the result
yields statistical significance that the findings from this sample are representative of the rest of
the population.
Table 6: Graduation Rates by Variable
Graduated within
3 Years
Graduated within
4 Years
Graduated within
5 Years
(1) (2) (3) (4) (5) (6)
%Part Time -0.268*** -0.200*** -0.212*** -0.156*** -0.199*** -0.143***
(0.059) (0.059) (0.051) (0.051) (0.047) (0.047)
Size of Program 14.803*** 16.594*** 11.403*** 11.142*** 8.837*** 7.638***
(3.086) (3.116) (2.645) (2.663) (2.478) (2.492)
%Female -0.084 -0.62 -0.149
(0.147) (0.126) (0.118)
%Ethnic Minority -0.278*** -0.236*** -0.176***
(0.070) (0.060) (0.56)
Evening Classes 20.238*** 24.245*** 25.841***
(7.875) (6.731) (6.298)
Weekend Classes -3.596 0.919 2.130
(3.203) (2.737) (2.561)
R-Squared 0.172 0.271 0.147 0.254 0.126 0.234
Significance codes: '***' 0.01 '**' 0.05 ‘*’ 0.1
(Standard Deviation)
Graduated within 3 Years
Column 1 expresses that as there is an increase of 1% of cohorts graduating within 3
years, there is a -0.268% decrease in the percentage of part-time students. As indicated, this is
statistically significant and therefore shows a correlation between the percentage of students
graduating within 3 years and the percentage of part-time students. At the same 1% increase in
23
graduation, the size of the program increases by 14%, which is significant. Therefore, there is a
significant positive correlation between the size of the program and the graduation completion
rate. The R-Square indicates that the variables in this column account for 17% of the variance in
graduation completion rates within 3 years.
Column 2 expresses that when other control variables are included, the previous findings
in the percentage of part-time students has decreased while the findings of the size of the
program increased. However, the results still indicate a significant negative correlation between
graduation completion rates and the percentage of part-time students, and a significant positive
correlation between graduation and the size of the program. Of the added control variables, there
was a significant relationship between graduation completion and ethnicity and evening classes.
There was a negative relationship between graduation completion and ethnicity. As graduation
increased at a rate of 1%, ethnicity decreased by -0.278%. As for evening classes, it had a
positive relationship with graduation. The findings show that as graduation increased at a rate of
1%, evening classes increased at a rate of 20%. There was also a negative relationship between
graduation rates and weekend classes, however, it was not statistically significant. Lastly, as
stated by the R-Square, these variables define 27% of the variance in graduation completion rates
within 3 years.
Graduated within 4 Years
Column 3 expresses that as there is an increase of 1% of cohorts graduating within 4
years, there is a -0.212% decrease in the percentage of part-time students. As indicated, this is
significant and therefore shows a correlation between the percentage of students graduating
within 4 years and the percentage of part-time students. At the same 1% increase in graduation,
the size of the program increases by 11%, which is significant. Therefore, there is a correlation
24
between the size of the program and the graduation completion rate. The R-Square indicates that
the variables in this column account for 14% of the variance in graduation completion rates
within 4 years.
Similar to the findings in Column 2, Column 4 expresses that when other control
variables are included, the relationships between graduation and part-time students, the size of
the program, ethnicity and evening classes are still statistically significant. The findings show
that as graduation increases at 1% in graduating within 4 years, there is a -0.156% decrease in
part-time students and a -0.236% decrease in ethnic minority students. At the same 1% increase
in graduation, the size of the program increases by about 11%, which is significant. There was
also a significant positive relationship between graduation and evening classes, in that as
graduation increased by 1%, evening classes increased by 24%. This column also expresses a
positive change in the findings in Column 4 for weekend classes, however, it is not statistically
significant. Lastly, the R-Square states that the variables in this column account for 25% of the
variance in graduation completion rates within 4 years.
Graduated within 5 Years
Column 5 expresses that as there is an increase of 1% of cohorts graduating within 5
years, there is a -0.199% decrease in the percentage of part-time students. As indicated, this is
very significant and therefore shows a correlation between the percentage of students graduating
within 5 years and the percentage of part-time students. At the same 1% increase in graduation,
the size of the program increases by 8% which is significant. Therefore, there is a correlation
between the size of the program and the graduation completion rate. This column indicates a
negative relationship between graduating at 5 years and the variables percentage of part-time
students, and a positive relationship between graduation and the size of the program. Lastly, the
25
R-Square states that the variables in this column account for 12% of the variance in graduation
completion rates within 5 years.
Column 6 expresses that when other control variables are included, the significant
relationships are between graduation completion rates and the percentage of part-time students,
the size of the program, ethnic minorities and evening classes. This shows that as graduation
completion rates increase at 1%, the percentage of part-time students decreases by -0.143, the
size of the program increases by 7%, the percentage of ethnic minority students decreases by
-0.176, and the percentage of evening classes increases by 25%. Lastly, the R-Square states that
the variables in this column account for 23% of the variance in graduation completion rates
within 5 years.
Threats to Validity
The threats of the validity of this study include the lack of other research on the subject
matter, the number of years of available data, the data was self-reported and the limitation of
variables to account for the variance in graduation rates. The researcher acknowledges these as
limitations, however, offers these findings as a foundation for future research.
The absence of research on MPA enrollment statuses and graduation rates limited the
researcher’s knowledge of current trends in the program. The lack of recent literature on the
graduate programs and enrollment statuses also limited the researcher’s knowledge of general
trends. While past research offered insight into the topic, they only accounted for trends at that
point in time. As a result, there is a lack of research on the topic of graduation rates and
enrollment statuses that account for current economic, personal or professional influences.
The available years of data was a longitudinal limitation because the results only
described two academic years, therefore, the findings could have been situational to the years
26
analyzed. Access to multiple years would have allowed the researcher to have a better
understanding of the relationships in the sample, and increased the confidence in associating the
correlations with the general population. Self-reported data can rarely be independently verified.
Since the data was self-reported by MPA accredited institutions, the raw data had to be analyzed
and assessed at face-value.
Lastly, there was a limited number of variables available to describe the variance of
graduation rates in NASPAA accredited MPA programs. It would have been ideal to have
additional control variables to see the influence on part-time students. This would enhance the
robustness check, which enables the researcher to examine how part-time enrollment findings are
affected by the addition of other factors. Additional variables or factors influencing graduation
completion that would enhance the understanding of graduation rates are age, marital status,
parental status, family education history, work status, income, student motivations and student
satisfaction with the program and faculty.
27
ANALYSIS
The primary purpose of this study was to identify whether there was a correlation between
enrollment status and graduation rates in NASPAA accredited MPA programs in the United
States. The independent variable, percentage of part-time students, was used to define the
enrollment status of the sample. The dependent variable, graduation completion rates, was held
constant in each of the regression models. The findings show that even when other control
variables were included in the regression model, there was a consistent negative significant
relationship between graduation rates and the percentage of part-time students. In contrast, this
negative relationship between part-time students and graduation completion rates at three years,
four years, and five years show that there is a positive relationship between full-time students
and graduation completion rates.
The cross tabulation in Table 5 found that the percentage of part-time students enrolled in
an MPA program influences the program’s graduation rates. The findings express that
throughout the institutions, programs with part-time students had the highest graduation rates at
the fifth year of the program. The second highest rate of degree completion among part-time
students was at four years. This indicates that part-time students are more likely to need more
time to complete the MPA program than just the extra time accounted for in taking fewer classes
each semester. This suggests that there is also more time needed by part-time students to
complete their culminating experience requirements. These findings are in line with the literature
review stating that part-time students complete a graduate program at a slower rate than those of
their full-time counterparts. Part-time MPA students may have external distractions, such as
employment, families or financial responsibilities, that impede their program completion.
The demographic characteristics of part-time students have been shown in Table 3. It was
interesting to find that institutions that had less than 49% of its students enrolled at part-time had
28
a consistent 53% of female and ethnic minority students. Institutions where students were
enrolled at 50-74% part-time also had the highest percentages of female and ethnic minority
students. The observation of this percentage increase lead the researcher to assume that there
would be another percentage increase within the institutions where more than 75% of students
were part-time. However, this group displayed a decrease in female and ethnic minority students.
This research does not present a reasonable explanation for this finding.
The institution's program characteristics of part-time students were shown in Table 4. It
was shown that most institutions that had less than 100 students enrolled offered evening classes,
but typically did not offer weekend classes.
As stated in the literature review, academic qualities also impact graduation completion
rates in master’s programs. A reason for most MPA programs to have small program sizes is to
promote faculty and student relationships. This, in turn, gives the student motivation and the
necessary support to persist through the program. Institutions that offered evening classes
displayed an awareness for their part-time students, and acknowledged potential schedule
conflicts in response to employment or family obligations.
The regression analysis in Table 6 confirmed that there is a significantly negative
relationship between part-time enrollment and graduation completion rates. As mentioned, this
model showed that as graduation rates at 4 years increased by 1%, the percentage of part-time
students decreased by about one-fifth of a percent. This is considered a significant relationship
between enrollment statuses and graduation rates of MPA programs. Of all the regression models
conducted, the model indicated in Column 4 accounts for the most variance in graduation rates.
This means that the variables in the model, percentage of part-time, size of the program,
29
percentage of female, percentage of ethnic minority, evening classes and weekend classes,
represented 25% of the reason why students graduated within 4 years from the MPA program.
Interestingly, the regression analysis displayed a significant positive relationship between
graduation rates and the size of the program. While it was found that most MPA programs were
small, the regression analysis expressed that as graduation rates increased, as did the size of the
MPA program. This is in opposition to the literature review’s statements that smaller graduate
programs lead to students completing the program sooner than larger programs. Although this
study does not provide reasoning for this anomaly, it may be in response to larger programs
possessing more institutional support and resources for students to persist through the MPA
program.
The findings also expressed that NASPAA accredited MPA programs in the United
States have made accommodations for the characteristics of a working and commuting student.
This is evidenced by the significant relationship between graduation completion rates and
evening classes. This assumes that the part-time student population is likely to enroll in evening
courses for the MPA program. It can further assume that these students are preoccupied with
family or work obligations during the day. The findings also indicate that NASPAA accredited
MPA programs have leveraged their technological advancements by promoting internet access to
MPA courses. This is evidenced by schools self-reporting that they offer online MPA courses.
While the findings for this control variable were not statistically significant, it is beneficial to
note this innovative feature. Overall, these findings display that NASPAA accredited MPA
programs acknowledge the part-time student population and are enhancing their skillsets for
professional careers in public service.
30
CONCLUSION
This research focuses on identifying whether there was a correlation between enrollment statuses
and graduation rates in NASPAA accredited MPA programs. Raw data from the NASPAA
public database was used to compile the findings of this research, which guided the analysis of
the research and the subsequent conclusions. Further, the use of correlation and regression
analysis adequately provided an answer to this study’s research question.
Overall, the statistical significance between part-time students and graduation rates leads
to the conclusion that there is a negative correlation between enrollment status and graduation
rates of NASPAA accredited MPA programs. The regression analysis concludes that there is a
negative correlation between part-time enrollments and graduation rates of the MPA degree
program in NASPAA accredited schools. Conversely, this conclusion can assume that there is a
positive correlation between full-time enrollments and graduation rates of the MPA degree
program in NASPAA accredited schools.
In order to develop a better understanding of graduation rates in NASPAA accredited
schools, is it advisable for NASPAA to continue to obtain data in a standardized manner.
Researchers might want to enhance their findings by independently collecting demographic and
social data from representative samples of MPA students at NASPAA accredited schools. These
factors might include age, marital status, parental status, family education history, work status,
income, students’ motivation and student satisfaction.
31
SOURCES CONSULTED
Blumenstyk, G. (2012). The Chronicle of Higher education. In Speech on Economy, Obama
Vows to 'Shake Up' Higher Education. Retrieved from:
http://www.chronicle.com/article/in-speech-on-economy-obama/140525
Brigham Young University. (2016). Effects of Employment on Student Academic Success.
Retrieved from:
https://www.byu.edu/hr/sites/default/files/effects_of_student_employment.pdf
Bright, L., Graham Jr., C. B. (2016) Predictors of Graduate Student Satisfaction in Public
Administration Programs. Retrieved from:
http://web.b.ebscohost.com.libaccess.sjlibrary.org/ehost/detail/detail?vid=0&sid=23baa1
45-d185-4519-a622-
10ef23bce6ce%40sessionmgr101&bdata=JnNpdGU9ZWhvc3QtbGl2ZSZzY29wZT1zaX
Rl#db=ehh&AN=113172158
California State University. (n.d.). Glossary of Terms. Retrieved from:
https://www.calstate.edu/as/stat_abstract/stat0809/pdf/z8a09.pdf
Cheng, L. (2017). NASPAA Annual Accreditation Data Report 2015-2016. Retrieved from:
https://naspaaaccreditation.files.wordpress.com/2017/10/2015-16-accr-data-report2.pdf
CiviCore. (n.d.) NASPAA School Search. Retrieved from:
http://naspaa.civicore.com/search/index.php?section=basic&action=list_cycle9&fwID=6
4506
EKU. (2018). Registration Guide. Retrieved from: https://gradschool.eku.edu/registration-guide
Gardner, S. & Gopaul, B. (2012). The Part-Time Doctoral Student Experience. Retrieved from:
http://informingscience.com/ijds/Volume7/IJDSv7p063-078Gardner352.pdf
Girves, J. & Wemmerus, V. (1988). Developing Models of Graduate Student Degree Progress.
Retrieved from:
http://www.jstor.org.libaccess.sjlibrary.org/stable/1981691?seq=8#page_scan_tab_conten
ts
Hegart, N. (2011). Adult Learners as Graduate Students: Underlying Motivation in Completing
Graduate Programs. The Journal of Continuing Higher Education. Retrieved from:
http://web.b.ebscohost.com.libaccess.sjlibrary.org/ehost/pdfviewer/pdfviewer?vid=4&sid
=7013ca18-63b7-4f18-8bd5-97cd93b29a40%40sessionmgr103
32
Hussar, W. & Bailey. (2013). Projections of Education Statistics to 2021. Retrieved from:
https://nces.ed.gov/pubs2013/2013008.pdf
Illinois Graduate School. (2018). E. Time Limits. Retrieved from:
https://grad.illinois.edu/gradhandbook/2/chapter6/time-limits
Kellough, J. (2014). NASPAA in a Time of Transition. Retrieved from:
http://www.jstor.org/stable/24369700?seq=1#page_scan_tab_contents
Mullen, A., Goyette, K., & Soares, J. (2003). Who Goes to Graduate School? Social and
Academic Correlates of Educational Continuation after College. American Sociological
Association. Retrieved from:
http://www.jstor.org/stable/3090274?casa_token=OkCVf5qEgjYAAAAA:8etqE4mlb22
VaWR_rpOelWBJOG4TbdBcAKwpzwa4l4GzoZuM64a3gpw9ARTYsuJ2qPGcU9l1VZ
yepF8eOSQCuKgKJC-3CLRtUU9B2qf8FdtiE508h-8&seq=8#page_scan_tab_contents
NASPAA. (n.d.). An Overview of NASPAA. Retrieved from:
http://www.naspaa.org/about_naspaa/about/overview.asp
NASPAA. (2014). NASPAA Standards. Retrieved from:
https://naspaaaccreditation.files.wordpress.com/2015/02/naspaa-accreditation-
standards.pdf
NASPAA. (2016). NASPAA Data Center. Retrieved from:
http://www.naspaa.org/DataCenter/NASPAADisaggregatereports.asp.
NASPAA. (2017). 2017-2018 Roster of Accredited Programs. Retrieved from:
https://naspaaaccreditation.files.wordpress.com/2017/09/annual-roster-of-accredited-
programs-09-01-17.pdf
NASPAA. (2018a). About NASPAA Accreditation. Retrieved from:
https://accreditation.naspaa.org/about/
NASPAA. (2018b). Data on Accredited Programs. Retrieved from:
https://accreditation.naspaa.org/resources/data-on-accredited-programs/
NASPAA. (2018c). Historical Guidelines. Retrieved from:
https://accreditation.naspaa.org/about/historical-documents/
33
NASPAA. (2018d). Standard 4: Matching Operations – Serving Students. Retrieved from:
https://accreditation.naspaa.org/standard-4/
National Center for Education Statistics. (2013). Digest of Education Statistics. Average
graduation tuition and required fees in degree-granting postsecondary institutions.
Retrieved from: https://nces.ed.gov/programs/digest/d13/tables/dt13_330.50.asp
Naylor, L., Wooldridge, B., Lyles, A. (2014). U.S. public administration programs: Increasing
academic achievement by identifying and utilizing student learning styles. Retrieved
from: http://journals.sagepub.com/doi/abs/10.1177/0144739414522481
Pautz, M., & Neeley, G. (2017). Beyond the Usual Complaints: The Front-Line Challenges and
Opportunities of Small MPA Programs. Retrieved from:
http://web.b.ebscohost.com.libaccess.sjlibrary.org/ehost/pdfviewer/pdfviewer?vid=1&sid
=27650d27-c9fb-45cc-9997-6f75395e4aff%40sessionmgr104
Selingo, J. (2013). Graduation Rate: Flawed as a Measure of Colleges, but still useful. Retrieved
from: https://www.chronicle.com/blogs/next/2013/05/19/graduation-rates-flawed-as-a-
measure-of-colleges-but-still-useful
Sylvia, R. & Sylvia, K. (2012). Program Planning & Evaluation for the Public Manager,
Waveland Press, ISBN 1-57766- 778-6. 2012.
The Master’s Degree, 5 CCR §40510. Retrieved from:
https://govt.westlaw.com/calregs/Document/IF41B2430D48211DEBC02831C6D6C108E
?contextData=(sc.Search)&rank=1&originationContext=Search+Result&navigationPath
=Search%2Fv3%2Fsearch%2Fresults%2Fnavigation%2Fi0ad6005600000150da221fa74
7d412c2%3FstartIndex%3D1%26Nav%3DREGULATION_PUBLICVIEW%26context
Data%3D(sc.Default)&list=REGULATION_PUBLICVIEW&transitionType=SearchIte
m&listSource=Search&viewType=FullText&t_T2=40510&t_S1=CA+ADC+s
Torpey, E. & Terrel, D. (2015). Bureau of Labor Statistics. Should I get a master’s degree?
Retrieved from: https://www.bls.gov/careeroutlook/2015/article/should-i-get-a-masters-
degree.htm
UCONN. (2018). Bringing Students to Uconn. Retrieved from:
https://grad.uconn.edu/faculty/bringing-students-to-uconn/
United States Department of Education. (n.d.). Accreditation in the United States. Retrieved
from https://www2.ed.gov/admins/finaid/accred/accreditation.html#Overview
34
United States Department of Education. (2007). The Path Through Graduate School: A
Longitudinal Examination 10 Years After Bachelor’s Degree. Retrieved from:
https://nces.ed.gov/pubs2007/2007162.pdf
UA. (2018). Admission Criteria. Retrieved from:
https://catalog.ua.edu/graduate/about/academic-policies/admission-criteria/
UO. (2018). Graduate School: Summary of Master’s Degree Minimum Requirements. Retrieved
from: https://gradschool.uoregon.edu/policies-procedures/masters