Embed Size (px)
Citation preview
Iowa Department of Human Rights, Division of Criminal and Juvenile Justice Planning Statistical Analysis Center Steve Michael, Administrator 321 E. 12th Street Des Moines, IA 50319 (515) 242-5823 https://humanrights.iowa.gov
The Correctional Policy Project
Iowa Prison-Population Forecast FY 2020 - FY 2030
Authors: Mindi TenNapel, Ph.D. – Research Coordinator Meg Berta, M.A. Laura Roeder-Grubb
Completion of this report fulfills the Division of Criminal and Juvenile Justice Planning’s legislative obligation outlined in Iowa Code §216A.137 to maintain a correctional policy project. Points of view or opinions expressed in this report are those of the
Division of Criminal and Juvenile Justice Planning.
2
TABLE OF CONTENTS
TABLE OF CONTENTS ..........................................................................................................................2 EXECUTIVE SUMMARY .......................................................................................................................4
Findings ..................................................................................................................................................... 4 Recommendations ..................................................................................................................................... 5
INTRODUCTION .................................................................................................................................6 COVID-19-Related Changes in Department of Corrections Policy and Procedure ..................................... 6 Terminology ............................................................................................................................................... 7
METHODS ..........................................................................................................................................8 Iowa’s Forecasting Model ......................................................................................................................... 8 Benefits of Forecasting .............................................................................................................................. 9 Forecasting Assumptions ........................................................................................................................... 9
FORECASTED POPULATION AND CAPACITY ....................................................................................... 10 Accuracy of Historic Forecasts ................................................................................................................. 10
Figure 1: Prison Forecast Estimates Compared to Actual Population ................................................. 10 Short-Term Projection ............................................................................................................................. 10 Long-Term Projections ............................................................................................................................. 11 Prison Capacity – Male and Female Inmates .......................................................................................... 11
Figure 2: Actual and Projected Number of Total Inmates and Prison Capacity .................................. 11 Figure 2a: Actual and Projected Number of Inmates and Prison Capacity: Females .......................... 11 Figure 2b: Actual and Projected Number of Inmates and Prison Capacity: Males .............................. 12
ADMISSIONS AND RETURNS ............................................................................................................. 13 Figure 3: Actual and Forecasted Prison Admissions ............................................................................ 13
OFFENSE TYPE .................................................................................................................................. 14 Figure 4: FY 2020 New Prison Admissions by Offense Type ................................................................ 14
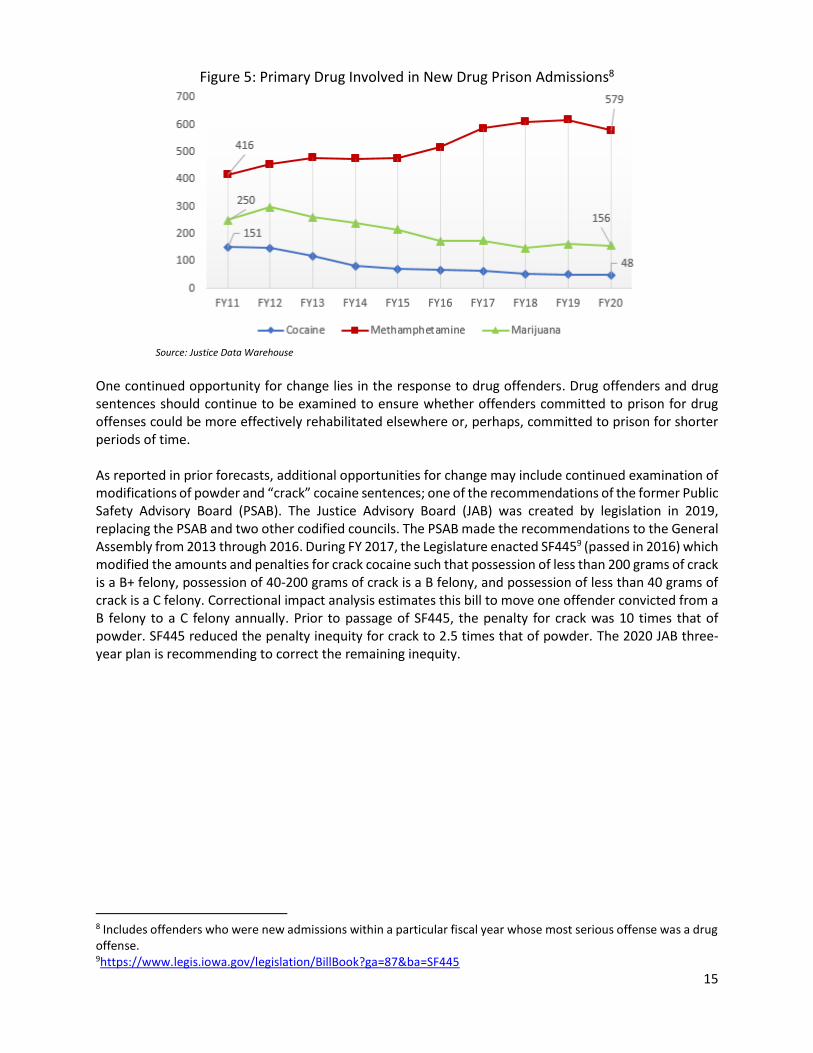
Drug Offenses .......................................................................................................................................... 14 Figure 5: Primary Drug Involved in New Drug Prison Admissions ....................................................... 15
AVERAGE LENGTH OF STAY (LOS) ..................................................................................................... 16 Offense Class ........................................................................................................................................... 16
Figure 6: Average LOS for Returns in Months by Class, FY 2011 and FY 2020 .................................... 16 Mandatory Minimum Sentences ............................................................................................................. 16
COMMUNITY-BASED CORRECTIONS ................................................................................................. 17 Figure 7: Prison Releases by Type from FY 2011 to FY 2020 ............................................................... 17
Revocations ............................................................................................................................................. 17 Parole ...................................................................................................................................................... 17 Work Release ........................................................................................................................................... 17 Special Sentence for Sex Offenders ......................................................................................................... 17
Figure 8: Special Sentence Offenders .................................................................................................. 18 Probation ................................................................................................................................................. 18
RACIAL DEMOGRAPHICS IN ADMISSIONS AND RELEASES .................................................................. 19 Admissions ............................................................................................................................................... 19 Releases ................................................................................................................................................... 19
CONCLUSION ................................................................................................................................... 20 APPENDIX I: Prison-Population Forecast ........................................................................................... 21
Table 1: Active-At-End Prison Population, Forecast Population, and Capacity: Total ........................ 21 Table 2: Active-At-End Prison Population, Forecasted Population, and Capacity: Females ............... 22 Table 3: Active-At-End Prison Population, Forecasted Population, and Capacity: Males ................... 23
3
Table 4: Active-At-End Prison Population Compared to Prior Year Forecast ...................................... 24 APPENDIX II: Prison Admission Populations and Forecasts ................................................................ 25
Table 5: Prison Admissions by Admission Reason ............................................................................... 25 Table 6: Prison Admissions by Offense Type and Subtype .................................................................. 26 Table 7: Prison Admissions by Offense Class ....................................................................................... 27 Table 8: Prison Admissions: Actual and Projected .............................................................................. 28
APPENDIX III: Prison Release Populations ......................................................................................... 29 Table 9: Prison Releases by Supervision Status ................................................................................... 29
APPENDIX IV: LOS for Release Cohorts .............................................................................................. 30 Table 10: Average Length-of-Stay (In Months) for Prison Release Populations, by Fiscal Year and Offense Class........................................................................................................................................ 30 Table 11: Average Length-of-Stay (In Months) for Prison Release Populations, by Fiscal Year and Offense Class (Cont.)............................................................................................................................ 31
APPENDIX V: Community-Based Corrections Offenders Served and Revocations................................ 32 Table 12: Probation Revocations, Probation Population (Offenders Served), and Percent Revoked . 32 Table 13: Revocations (Non-Probation), Offenders Served, and Change over Time .......................... 32
APPENDIX VI. Prison Population Demographics ................................................................................ 33 Table 14: Active-At-End Prison Population Demographic Trends ....................................................... 33
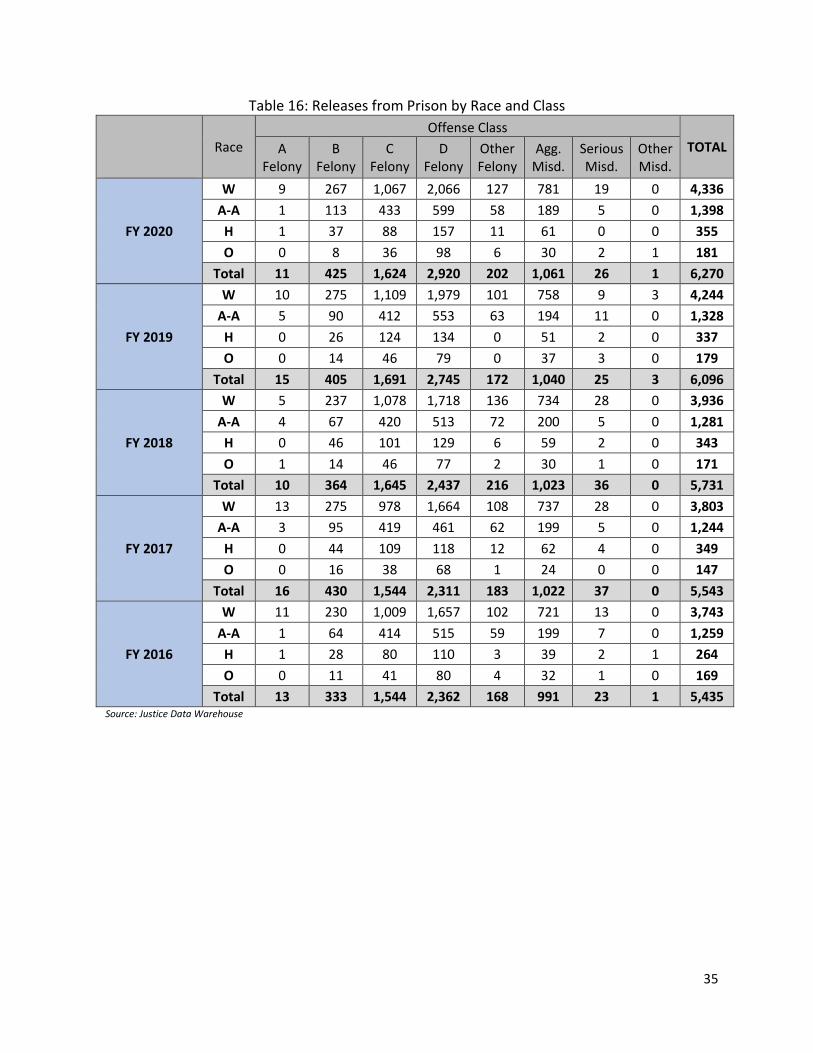
APPENDIX VII. Race by Offense Class ................................................................................................ 34 Table 15: Admissions to Prison by Race and Class .............................................................................. 34 Table 16: Releases from Prison by Race and Class .............................................................................. 35
The staff of CJJP would like to thank the Iowa Department of Corrections for providing information on
current and planned prison population data and capacities.
4
EXECUTIVE SUMMARY The Iowa Prison-Population Forecast prepared by the Iowa Department of Human Rights, Division of Criminal and Juvenile Justice Planning (CJJP) has been developed to assist the executive and legislative branches of government in annually assessing the impact of current criminal justice policy on Iowa’s prison population.
Findings Current prison population (as of June 30, 2020):
o Iowa’s prison population was 7,574, a decrease of 900 (10.6%) since June 30, 2019, in part due to the COVID-19 pandemic.
o Prisons were overcapacity by 9.2%. o 92.1% of the prison population were male and 7.9% were female.
One year changes - FY 2019 to FY 2020: o New admissions to prison decreased 16.6% (3,697 to 3,085). o Probation revocations decreased 17.3% (1,956 to 1,617). o Non-probation revocations decreased 5.3% (2,121 to 2,009).
Forecasted prison population: o The short-term forecast predicts an increase in the prison population from 7,574 inmates
on June 30, 2020 to 7,775 on June 30, 2021; an increase of 201 offenders (2.7%). o The long-term forecast predicts the population will increase to 8,485 (12.0%) by the end
of FY 2030, resulting in overcapacity of 22.4%.
Parole: o Over the past 10 years, the offenders served on parole has increased 57.2% (from 5,185
to 8,150). o Releases from prison to parole have increased by 108.3% (1,452 to 3,025). o The number of parole revocations have increased 95.6% (609 to 1,191).
Special sentence: o Over the last 10 years there has been a 260.5% increase in offenders serving special
sentences in the community (435 to 1,568). o From FY 2011 to FY 2020 admissions for special sentence increased 110.3% (68 to 143).
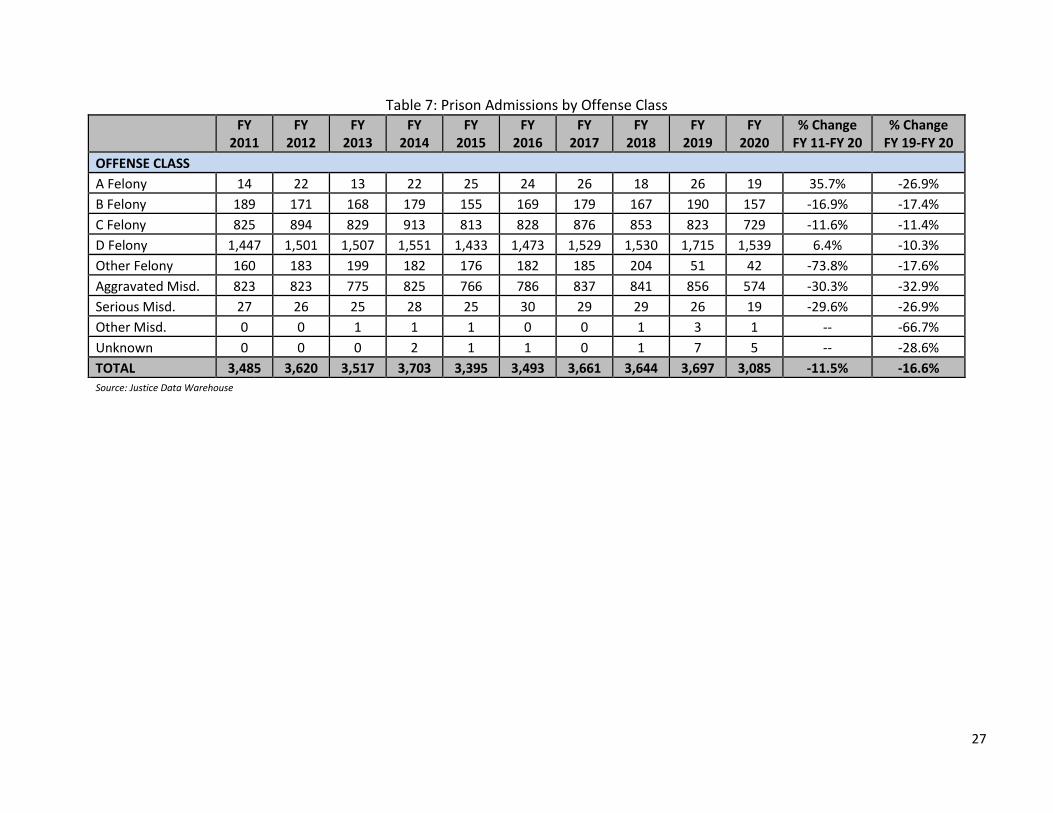
New admissions to prison: o Admissions decreased 11.5% from FY 2011 to FY 2020 (3,485 to 3,085). o Over the past 10 years all offense class admissions decreased, except for A felony and D
felony and over the past year admissions for all offense class decreased. o New admissions for methamphetamine were more prevalent compared to marijuana and
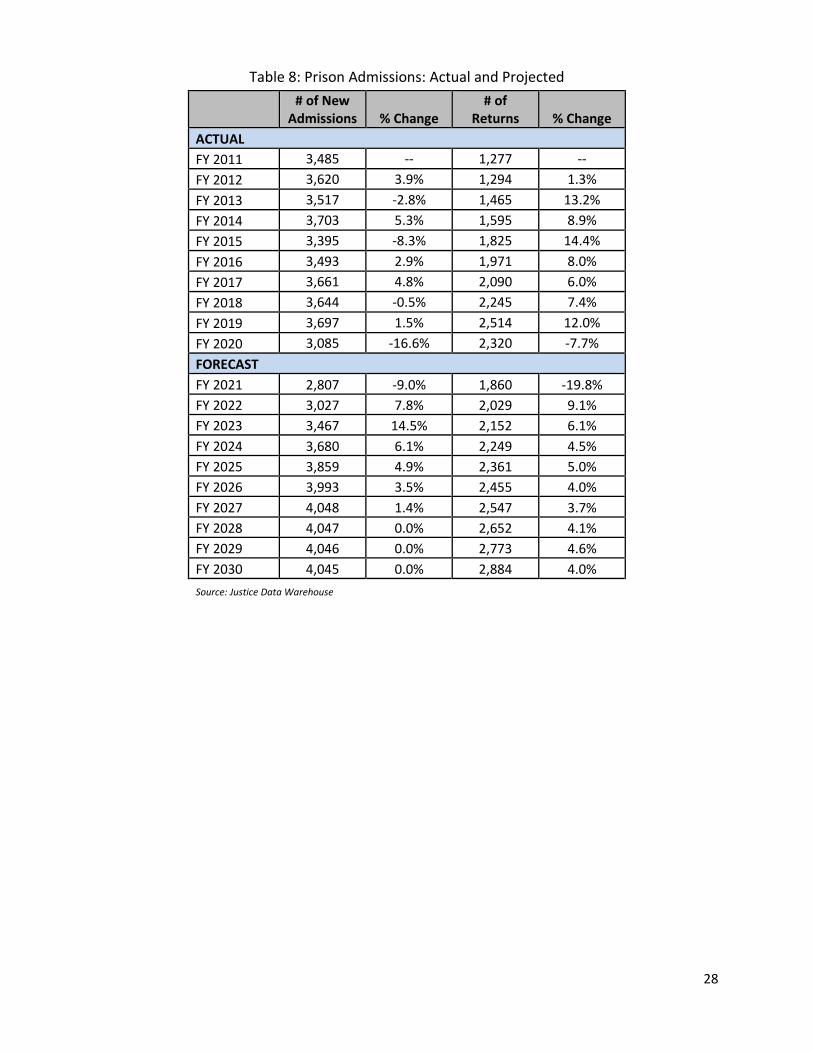
cocaine in FY 2020 (579, 156 and 48, respectively). o New admissions are projected to increase from 3,085 in FY 2020 to 4,045 in FY 2030.
Return admissions to prison: o Returns have increased 81.8% from FY 2011 to FY 2020 (1,277 to 2,321). o Parole returns have increased 112.4% over the same period from 692 to 1,470.
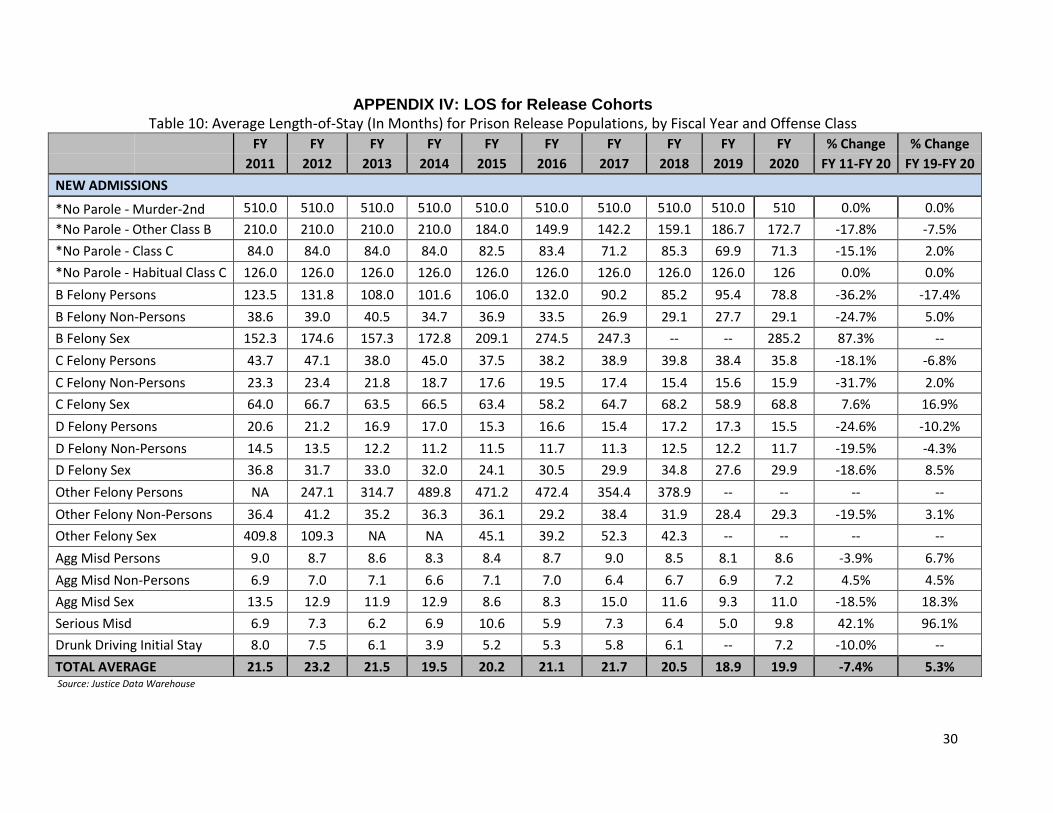
Length of Stay: o The average time served for released inmates, identified as new admissions, decreased
from 21.5 months to 19.9 months (-7.4%). o Average length of stay (LOS) for prison returns decreased 33.1% over the past 10 years,
from 13.6 months to 9.1 months. o LOS for all crime categories decreased, with the exception of misdemeanor returns, which
increased from 5.0 months in FY 2011 to 9.6 months in FY 2020.
5
Demographics (FY 2016-FY 2020) o In FY 2020, 65.1% of the prison population were White, 25.5% African-American, 6.7%
Hispanic, 1.9% Native American or Alaskan, and 0.8% Asian or Pacific Islander. Admits
o From FY 2016 to FY 2020, admissions for Whites and African-Americans decreased 1.1% and 3.9%, respectively.
o Admissions for B, C and D felonies increased while admissions for aggravated misdemeanors decreased nearly 24%.
Releases o Releases for Whites and African-Americans increased 15.8% and 11.0%, respectively. o Total releases increased by 15.4%.
Recommendations DOC reviews capacity and population data regularly. There are several actions, which if taken, could alter the prison population forecasted in this report, including, but not limited to:
Investigation of institutional and community-based programming to mitigate and divert revocations of offenders in the community. The Justice Advisory Board (JAB) has identified community-based corrections and alternatives to incarceration as a priority, along with mental health for those in the criminal justice system1. The goals associated with these two priorities include:
o Reduce entry and revocation to prison by ensuring effective alternative services and strategies are available in community-based corrections.
o Evaluate risk assessment tools to determine the overall effectiveness and the accuracy for all races.
o Identify those who need mental health care and provide appropriate services and placement in the juvenile and criminal justice system for offenders.
o Provide safe treatment and living conditions for those with mental health needs within the juvenile and criminal justice system.
o Continue to advocate for legislation to appropriately reduce the prison population. The
JAB recommends to equalize the quantity for each class level and sentence for crack and
powder cocaine, so that fewer African Americans are incarcerated for longer periods of
time than Whites. In addition, the JAB will continue the work of the Public Safety
Advisory Board (PSAB) and study mandatory minimum sentences and its impact on
African Americans, along with the effectiveness of the special sentence for sex
offenders.
Review policy and practices put in place regarding COVID-19, and determine how they may have impacted admissions and releases. DOC may want to consider a more in-depth review of the impact of COVID-19 in order to better assess resources, services, and outcomes that may be kept. Various practice changes could assist in limiting prison admissions in the future.
Investigate racial disparity in juvenile waivers to adult court and the impact they might have on the prison population. This could include working with the Juvenile Justice Advisory Council (JJAC) and the JAB.
DOC and CJJP should expand their research partnership to include predictive analytics for prison releases and returns. This initiative could assist in determining the likelihood and potential reduction of recidivism.
1 Link not available at time of publication, it will be posted at: https://humanrights.iowa.gov/cjjp
6
INTRODUCTION This is the 29th Iowa Prison-Population Forecast prepared by the Iowa Department of Human Rights, Division of Criminal and Juvenile Justice Planning (CJJP), which has been developed to assist the executive and legislative branches of government in annually assessing the impact of current criminal justice policy on Iowa’s prison population. The report is not an attempt to predict the future of the prison population in Iowa. Instead, it is meant to provide an indication of the direction the prison population will likely move under current laws, policies and procedures. As these are modified, different results can be anticipated in future forecasts, but it is important to note that it can take several years for legislative changes to have an effect and to be reflected in the data. It is possible that legislative modifications enacted in the recent past are not accounted for in current projections.
The prison forecast is one of several tools which inform the Department of Corrections (DOC) and Board of Parole (BOP) concerning expected prison growth. The forecast is a guide for programmatic and policy changes to improve outcomes for offenders. To-date, there have been several efforts by state government officials, DOC, and policy makers to help ensure that prison populations do not reach their forecasted growth figures.
The current report utilizes data obtained from Iowa’s Justice Data Warehouse (JDW). The JDW is a central repository of key criminal and juvenile justice information from the Judicial Branch Case Management System and information from the Iowa Correctional Offender Network (ICON). The overall mission of the JDW is to provide the judicial, legislative and executive branches of state government and other entities, with improved statistical and decision support information pertaining to justice system activities.
On March 14th, 2020, a state order postponed jury trials and permitted all parties to a case to appear via teleconference, holding only emergency cases in person. On July 9th a list of mitigation measures was released for resuming in-person judicial business. Jury trials were set to begin September 14th, with teleconferencing permitted for certain juvenile cases. As cases increased in Iowa through the fall, the Iowa Supreme Court issued a November 10 order postponing pending jury trials until after February 1st, 2021, and extended the speedy trial deadline from 90 days to 120 days for those in custody and 180 days to those not in custody.2
COVID-19-Related Changes in Department of Corrections Policy and Procedure The DOC reports that on June 30th, 2020 the final prison population was approximately 7,569 inmates. This is the lowest prison population observed within the last two decades, with comparable prison populations of 7,646 last observed in FY 2000. The prison population reduction experienced in FY 2020 is due to a multitude of factors stemming from the COVID-19 pandemic.
Declines in the prison population are due in part to both the efforts of Correctional officials, the Board of Parole (BOP), as well as inadvertent changes to justice system operations, as a result of the pandemic. The DOC has completed several activities to-date to reduce populations in order to create facility space.
In March, 2020, the DOC created eight tiers of data which helped correctional facilities in various capacities bolster release planning efforts for appropriate clients. This data was updated daily to help assist correctional officials in identifying those who may be most appropriate for release consideration during the height of the pandemic. Also, in April, 2020, the BOP conducted double panels to review additional cases proposed for parole and work release. During this time period, the BOP reviewed 1,953 cases, and approved approximately 57% of those cases for release. For comparison purposes, in FY 2020 the BOP reviewed on average approximately 1,200 cases per month with 50% approved for release.
2 https://www.iowacourts.gov/iowa-courts/covid-19-information-and-updates/
7
In addition, during April and May 2020, the Iowa Medical and Classification Center (IMCC), the DOC’s intake facility, suspended prison admissions. As a direct result of DOC staff release planning efforts, bolstered BOP reviews, and admission suspensions the prison population was reduced by approximately 9%; or by 745 inmates. The overall reduction in the prison population has resulted in the ability for prisons to create space, necessary for large quarantine areas should a facility experience an outbreak of COVID-19. While space creation within prisons is necessary to reduce the spread of the virus, it is important to note that social distancing is challenging in a correctional setting, particularly amongst facilities with shared cells. The Iowa DOC reports that on 6/30/2020 there were approximately 176 individuals in jail who were waiting to be admitted to prison; as of 11/16/2020, this number rose to 219. While it is difficult to estimate the impact of those who are currently in jail, waiting to be admitted into the prison, it is important to note that in the coming months, the DOC's population is expected to increase following the admission of these individuals. The prison forecast estimate does not account for these anticipated prison admissions, as this group of individuals had yet to become officially admitted as of 6/30/2020.
Terminology New admissions: New admissions include court-ordered commitments and probation
revocations.
Returns: Returns include all offenders who had one or more prior unsuccessful conditional release on their current commitment, including those revoked from Operating While Intoxicated (OWI) facility placement. LOS for this category is defined as the time served in prison from the last admission (or return) to release (which may be parole, work release, expiration of sentence, etc.). Please note that, while this category is labeled “returns,” it includes some offenders who were not previously incarcerated; examples include OWI offenders who were directly placed in community-based OWI treatment facilities but were later revoked.
Active-at-end (AAE): AAE counts are point-in-time estimates of the number of prisoners, parolees, or probationers in Iowa. AAE estimates throughout this report refer to samples drawn at the end of the state fiscal year (i.e. June 30 at 12:00:00 AM).
Most-serious offense or supervision status: The Justice Data Warehouse (JDW) uses a hierarchical system of business rules to organize information according to severity, displaying the most-serious offenses, offense types, sub-types, supervision statuses, etc. which are used throughout this report when the offender has multiple offenses or supervision statuses.
Projected prison admissions: Projections are accomplished through Auto-Regressive Integrated Moving Average (ARIMA) modeling with adjustments based on knowledge of recent law and conviction changes that may not yet be reflected in observed trends. This is accomplished through analysis of historical prison admissions data, obtained from the Iowa Corrections Offender Network (ICON) and JDW, and felony charges and convictions from the JDW. Projected admissions are made for various offense classes and types of offenses (e.g., Class C 70% offenders, Class C violent non-sex offenders, Class C sex offenders, and Class C non-violent offenders) in two separate categories (new admissions and returns).
Average length-of-stay (LOS): This estimate is executed utilizing correctional data extracted from the JDW for offenders who are released from prison. Estimates of average LOS are made for the most serious offense classes and types of offenses in two separate categories, categorized by admission type (new admissions and returns).
Projected releases: Projected releases of offenders who are incarcerated at the onset of the projection period (referred to as “decay”). This involves analysis of the prison population at the beginning of the projection period combined with historical data on numbers of inmates released.
8
METHODS Iowa’s Forecasting Model This analysis used Autoregressive Integrated Moving Average (ARIMA) modeling to perform prison-population forecast analysis. ARIMA modeling constitutes “a class of statistical models for analyzing and forecasting time series data.”3 The ARIMA models in this report take the difference between consecutive, lagged time points to forecast 10 non-stationary future time points. The statewide prison-population forecast and policy simulation model used in this analysis is a matrix that distributes Iowa’s prison population over the projection period by quarter. There are three basic components of the model:
Projected prison admissions. Projections are accomplished through ARIMA modeling, with adjustments based on knowledge of recent law changes that may not yet be reflected in observed trends. This is accomplished through analysis of historical prison admissions data, obtained from the ICON and JDW, and felony charges and convictions from the JDW. Projected admissions are made for various offense classes and types of offenses (e.g., Class C 70% offenders, Class C violent non-sex offenders, Class C sex offenders, and Class C non-violent offenders) in two separate categories described below (new admissions and returns). Sex offenders have been a separate category since FY 2006, in part because sex offenders tend to serve higher percentages of their sentences than other offenders.
Projected average length-of-stay.4 This projection is executed utilizing correctional data extracted from the JDW for offenders who are released from prison. Projections for average LOS are made for the most serious offense classes and types of offenses in two separate categories in subsequent sections. These estimates are also categorized by admission type (new or return).
Projected releases of offenders who are incarcerated at the onset of the projection period (referred to as “decay”). This involves analysis of the prison population at the beginning of the projection period combined with historical data on numbers of inmates released. The forecast for this year uses a technique initiated in previous reports, using two different calculations based upon the inmate group:
o The average length of time inmates with mandatory terms have served; o The average length of time served prior to release.
Prison admissions and average LOS data are analyzed within two broad categories based on the type of prison admission: new admissions and returns. A point-in-time estimate of the prison population – Active-At-End (AAE) is the third component. Admissions are further categorized by whether or not the most serious crime was a sex offense or other crime against persons. Crimes against persons are those offenses involving death, injury, attempted injury, abuse, threats, coercion, intimidation, or duress. Due to the current pandemic and impact on trends to the criminal justice system, CJJP reviewed adult court convictions and prison admissions for the impacted time frame, and compared to the same time frame a year ago. Based on the percent changes observed, the ARIMA models were smoothed to better accommodate for these more recent trends. The forecast does result in a modest increase, but less than the prior year.
3 https://machinelearningmastery.com/arima-for-time-series-forecasting-with-python/ 4 Regarding LOS figures as contained in this report, “Drunken Driving Initial Stay” describes drunken drivers sentenced to prison who are awaiting placement at community-based treatment facilities.
9
Benefits of Forecasting To estimate the number of offenders who may be incarcerated at some point in the future, if
current justice system trends, policies, and practices continue.
To simulate alternative corrections futures based on specific changes in laws, policies and/or practices. For example, data from the forecast are used extensively in estimating changes resulting from proposed legislation.
Forecasting Assumptions It is assumed that certain historical phenomena such as trends in population growth, prison
admissions rates, and the length of stay of inmates will return to previous trends once the pandemic is under control. It is further assumed that the data provided as measurements of these phenomena accurately reflect actual conditions.
It is assumed there will be minimal legislative changes in the state criminal code or criminal procedures during the projection period.
It is assumed there will be minimal changes in judicial sentencing, parole board release policies, or probation/parole revocation policies and practices during the projection period.
It is important to note that there may be slight discrepancies in findings and figures reported by the Prison Forecast, Department of Corrections (DOC), and the Board of Parole. These variations are attributable to several factors, including but not limited to, changes within ICON and the JDW at the time of data extraction, variations in data parameter reporting, and variation in prison population estimates. Prison forecast analysis requires AAE case-level data. DOC largely reports population estimates, using averages over the course of a year.
10
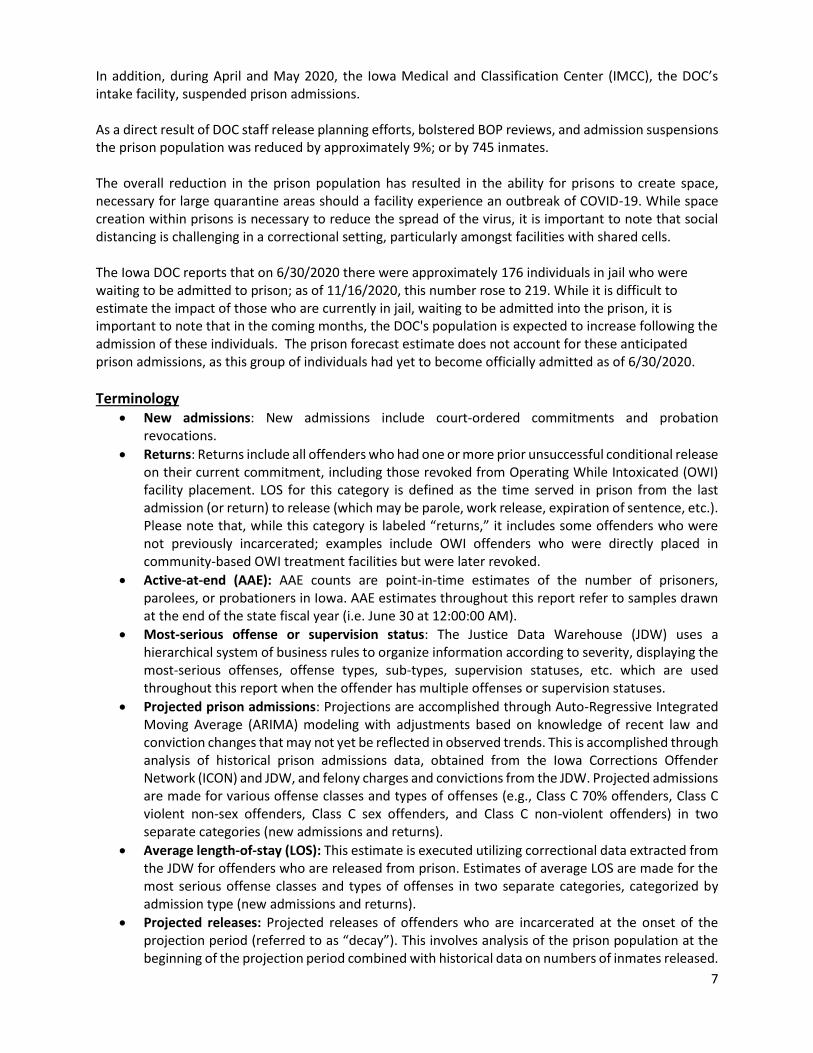
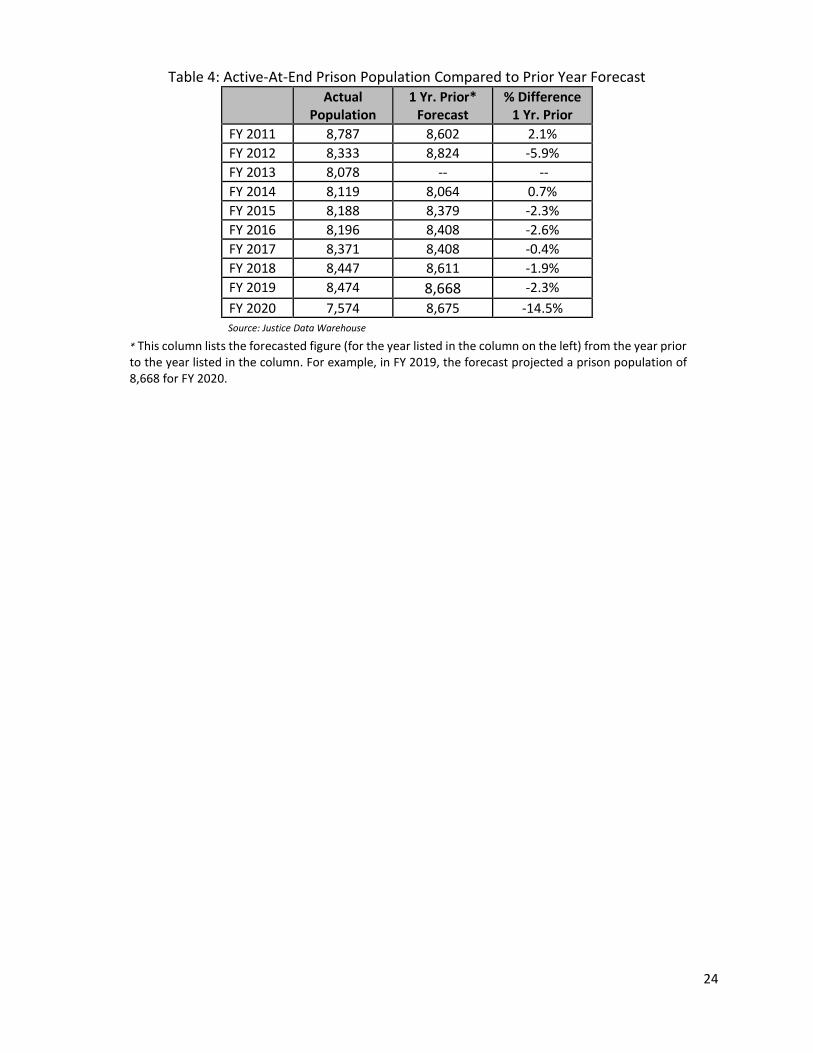
FORECASTED POPULATION AND CAPACITY Accuracy of Historic Forecasts The FY 2020 prison population of 7,574 was overestimated by 1,101 (14.5%) compared to last year’s projection (Figure 1; Appendix I, Table 4). This discrepancy can be attributed in part, to COVID-19-related changes in policy and procedure across the criminal justice system. Since the last forecast, new prison admissions decreased by 612 and returns decreased by 193 (Appendix II, Table 5). Figure 1 shows prison forecast estimates for the past 10 fiscal years.
Figure 1: Prison Forecast Estimates Compared to Actual Population5
Source: Prison Forecast Estimates and Justice Data Warehouse
Short-Term Projection COVID-19 is having an effect on the prison population, which has decreased since last year. It is difficult to know when the effects of COVID-19 will end, and without legislation or more lasting policy/procedural change, it is unknown whether the prison population will eventually return to pre-COVID levels. Iowa’s prison population is projected to increase 2.7% from 7,574 inmates on June 30, 2020, to 7,775
inmates on June 30, 2021. This will exceed capacity6 by about 842 inmates, or by 12.1% (Appendix I, Table 1).
5 There was a resource issue in FY 2012, therefore no forecast information is available. 6 In August of 2016, the IDOC established a principle that official prison capacity should reflect the actual beds present in their institutions. While an institution has a specified design capacity when opened, official capacity may change as units and spaces are repurposed to best meet the needs of the institution and its population.
11
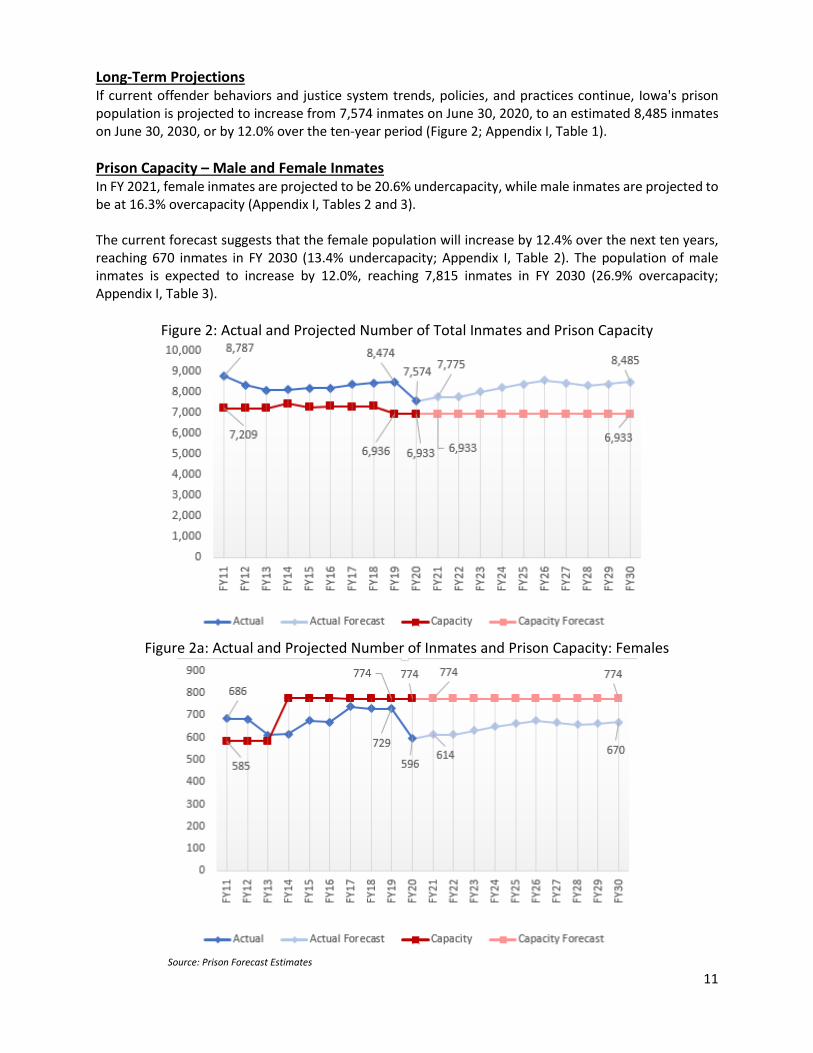
Long-Term Projections If current offender behaviors and justice system trends, policies, and practices continue, Iowa's prison population is projected to increase from 7,574 inmates on June 30, 2020, to an estimated 8,485 inmates on June 30, 2030, or by 12.0% over the ten-year period (Figure 2; Appendix I, Table 1).
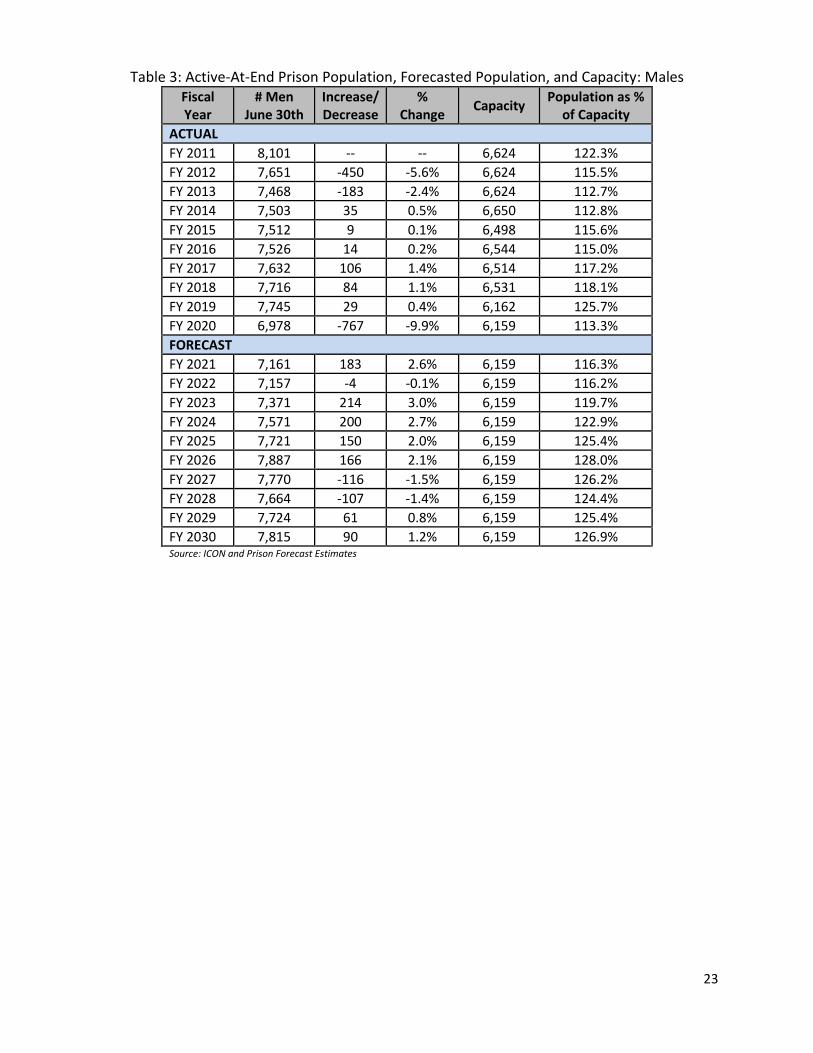
Prison Capacity – Male and Female Inmates In FY 2021, female inmates are projected to be 20.6% undercapacity, while male inmates are projected to be at 16.3% overcapacity (Appendix I, Tables 2 and 3). The current forecast suggests that the female population will increase by 12.4% over the next ten years, reaching 670 inmates in FY 2030 (13.4% undercapacity; Appendix I, Table 2). The population of male inmates is expected to increase by 12.0%, reaching 7,815 inmates in FY 2030 (26.9% overcapacity; Appendix I, Table 3).
Figure 2: Actual and Projected Number of Total Inmates and Prison Capacity
Figure 2a: Actual and Projected Number of Inmates and Prison Capacity: Females
Source: Prison Forecast Estimates
12
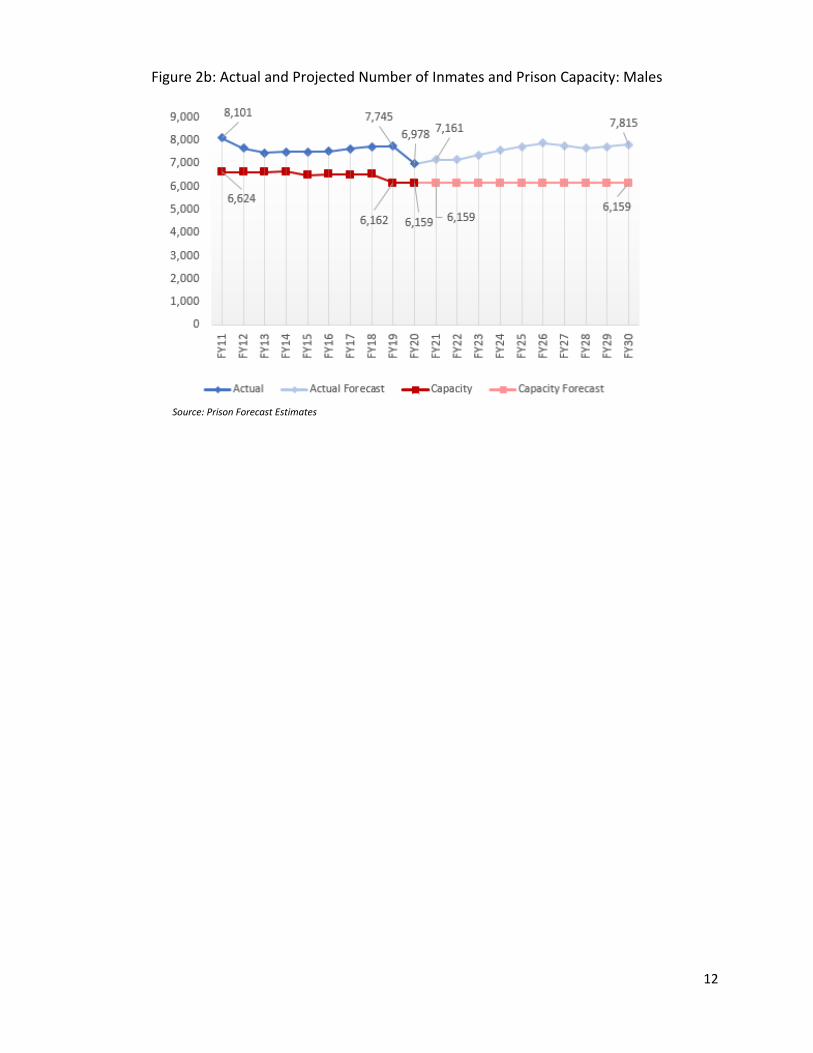
Figure 2b: Actual and Projected Number of Inmates and Prison Capacity: Males
Source: Prison Forecast Estimates
13
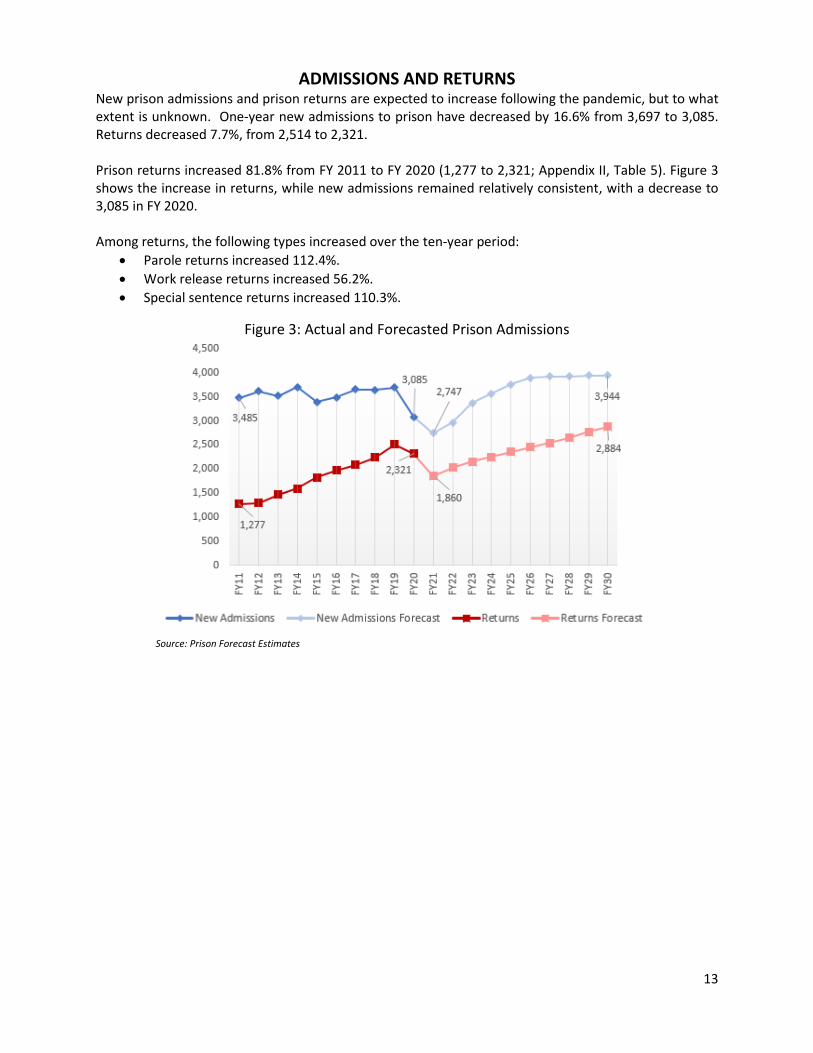
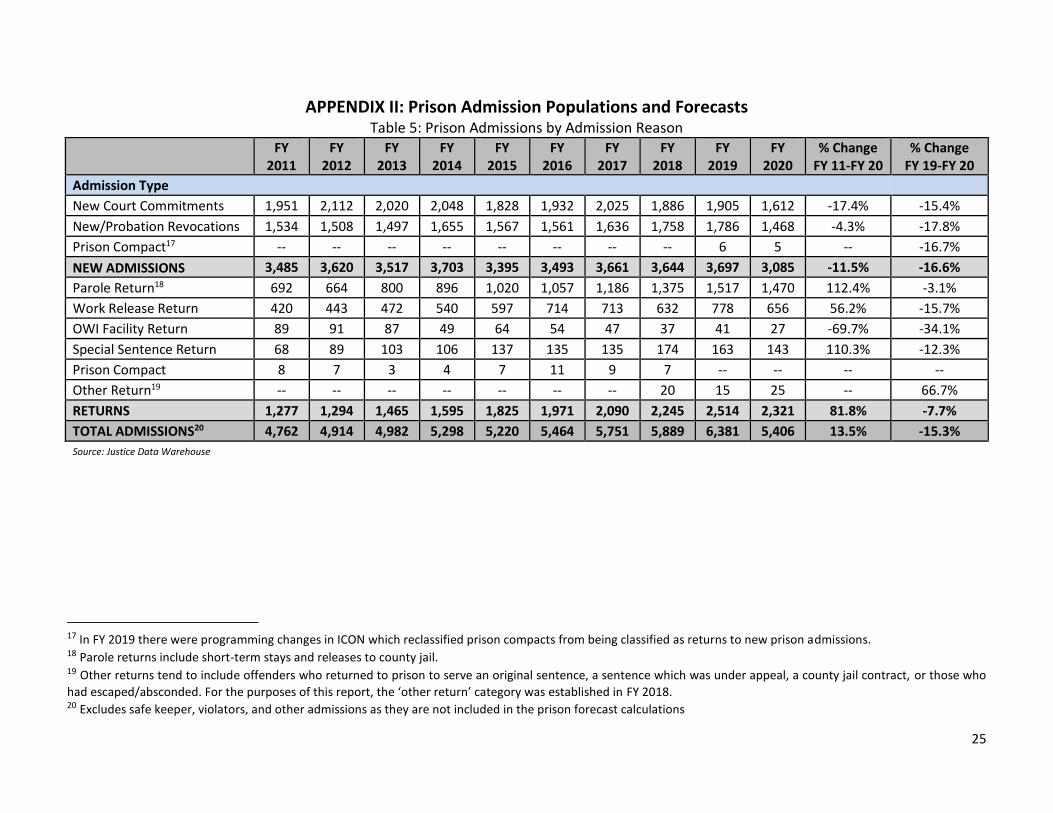
ADMISSIONS AND RETURNS New prison admissions and prison returns are expected to increase following the pandemic, but to what extent is unknown. One-year new admissions to prison have decreased by 16.6% from 3,697 to 3,085. Returns decreased 7.7%, from 2,514 to 2,321. Prison returns increased 81.8% from FY 2011 to FY 2020 (1,277 to 2,321; Appendix II, Table 5). Figure 3 shows the increase in returns, while new admissions remained relatively consistent, with a decrease to 3,085 in FY 2020. Among returns, the following types increased over the ten-year period:
Parole returns increased 112.4%.
Work release returns increased 56.2%.
Special sentence returns increased 110.3%.
Figure 3: Actual and Forecasted Prison Admissions
Source: Prison Forecast Estimates
14
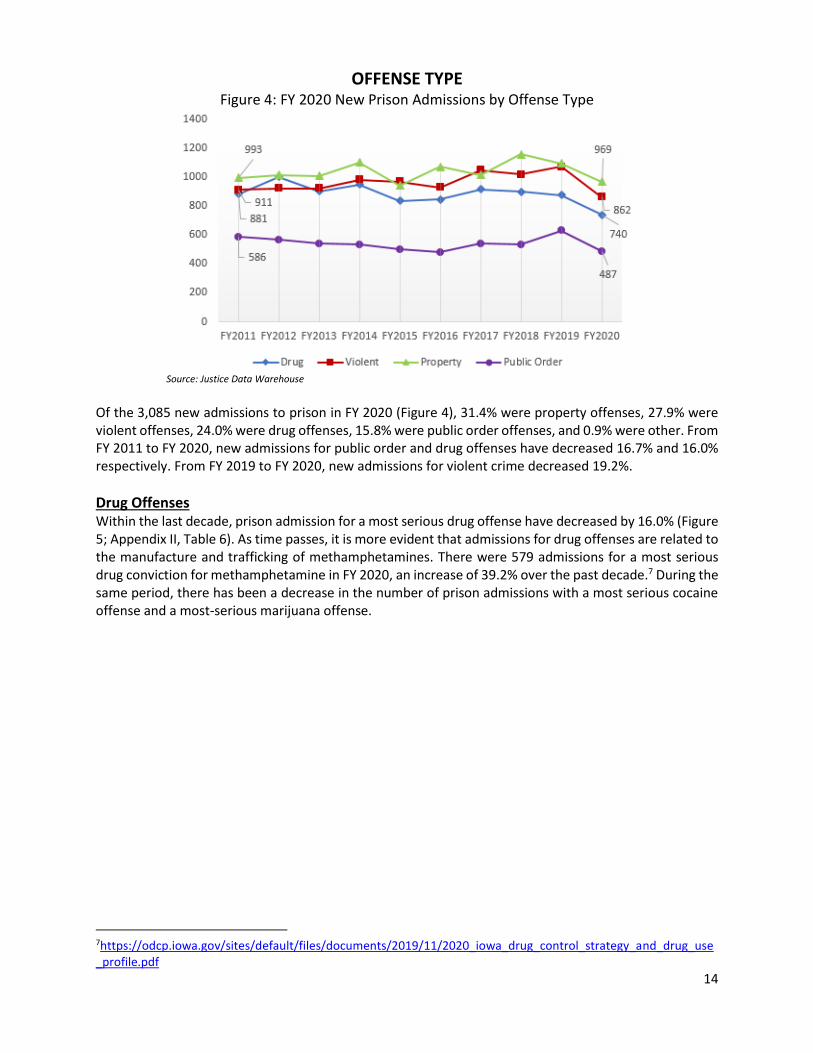
OFFENSE TYPE Figure 4: FY 2020 New Prison Admissions by Offense Type
Source: Justice Data Warehouse
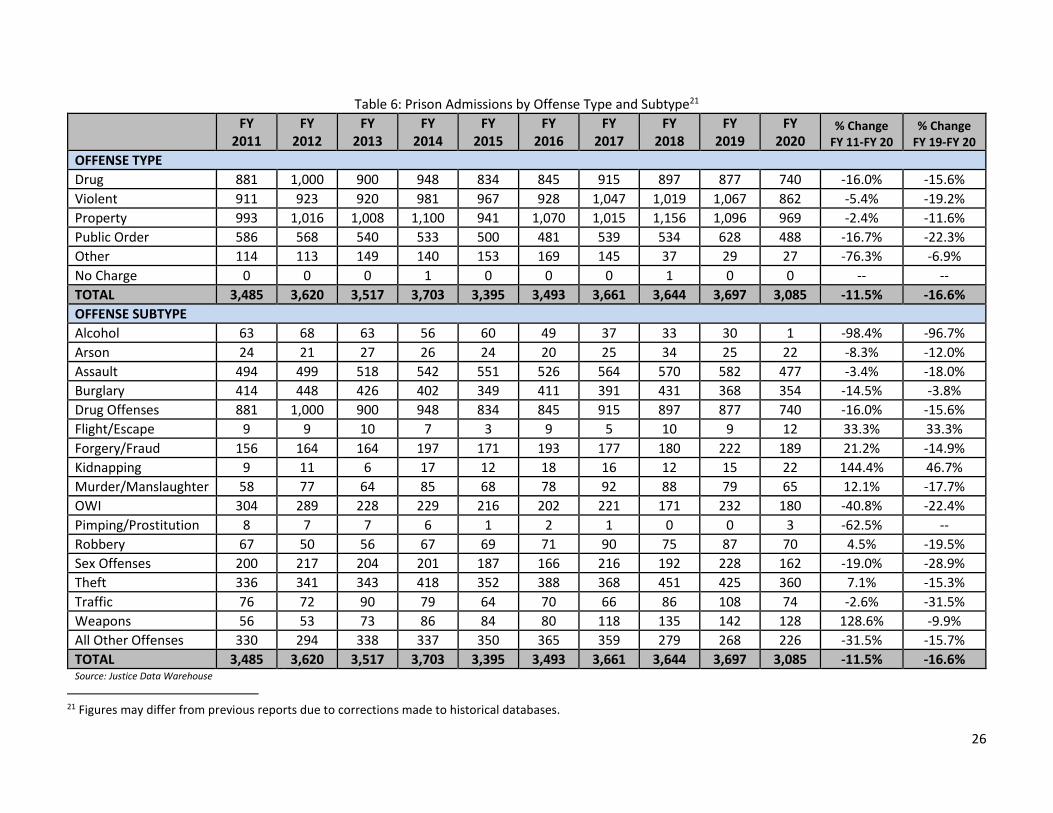
Of the 3,085 new admissions to prison in FY 2020 (Figure 4), 31.4% were property offenses, 27.9% were violent offenses, 24.0% were drug offenses, 15.8% were public order offenses, and 0.9% were other. From FY 2011 to FY 2020, new admissions for public order and drug offenses have decreased 16.7% and 16.0% respectively. From FY 2019 to FY 2020, new admissions for violent crime decreased 19.2%.
Drug Offenses Within the last decade, prison admission for a most serious drug offense have decreased by 16.0% (Figure 5; Appendix II, Table 6). As time passes, it is more evident that admissions for drug offenses are related to the manufacture and trafficking of methamphetamines. There were 579 admissions for a most serious drug conviction for methamphetamine in FY 2020, an increase of 39.2% over the past decade.7 During the same period, there has been a decrease in the number of prison admissions with a most serious cocaine offense and a most-serious marijuana offense.
7https://odcp.iowa.gov/sites/default/files/documents/2019/11/2020_iowa_drug_control_strategy_and_drug_use_profile.pdf
15
Figure 5: Primary Drug Involved in New Drug Prison Admissions8
Source: Justice Data Warehouse
One continued opportunity for change lies in the response to drug offenders. Drug offenders and drug sentences should continue to be examined to ensure whether offenders committed to prison for drug offenses could be more effectively rehabilitated elsewhere or, perhaps, committed to prison for shorter periods of time. As reported in prior forecasts, additional opportunities for change may include continued examination of modifications of powder and “crack” cocaine sentences; one of the recommendations of the former Public Safety Advisory Board (PSAB). The Justice Advisory Board (JAB) was created by legislation in 2019, replacing the PSAB and two other codified councils. The PSAB made the recommendations to the General Assembly from 2013 through 2016. During FY 2017, the Legislature enacted SF4459 (passed in 2016) which modified the amounts and penalties for crack cocaine such that possession of less than 200 grams of crack is a B+ felony, possession of 40-200 grams of crack is a B felony, and possession of less than 40 grams of crack is a C felony. Correctional impact analysis estimates this bill to move one offender convicted from a B felony to a C felony annually. Prior to passage of SF445, the penalty for crack was 10 times that of powder. SF445 reduced the penalty inequity for crack to 2.5 times that of powder. The 2020 JAB three-year plan is recommending to correct the remaining inequity.
8 Includes offenders who were new admissions within a particular fiscal year whose most serious offense was a drug offense. 9https://www.legis.iowa.gov/legislation/BillBook?ga=87&ba=SF445
16
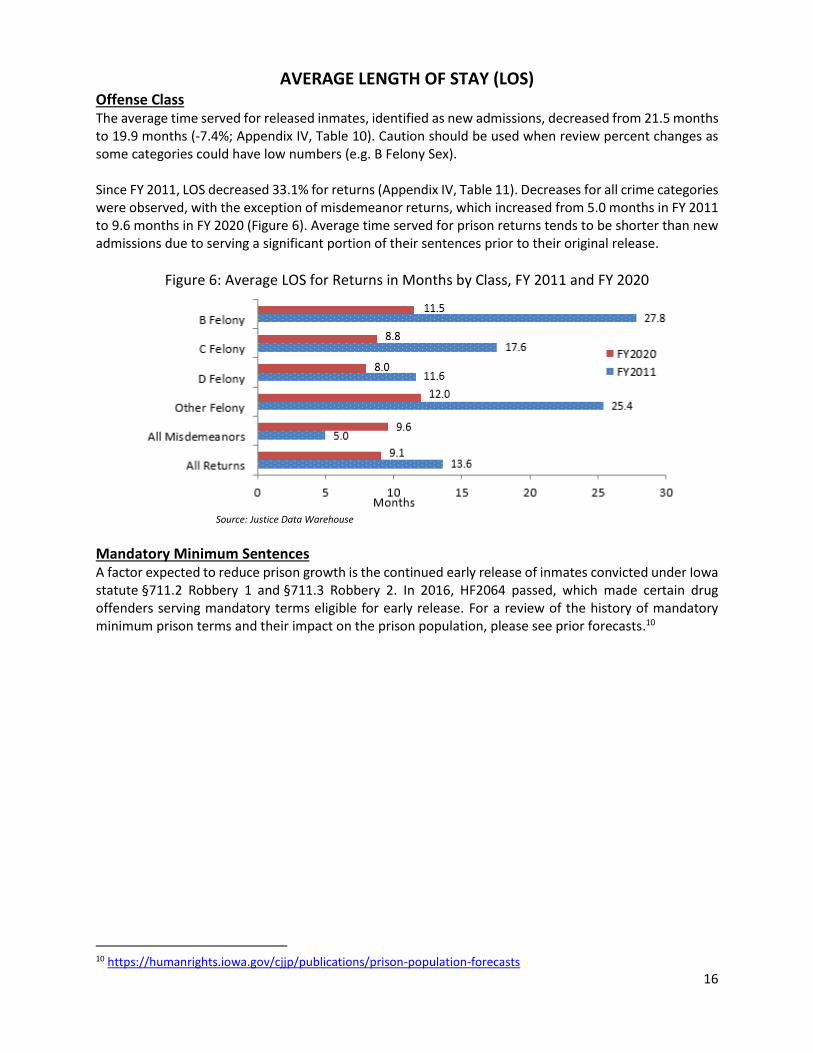
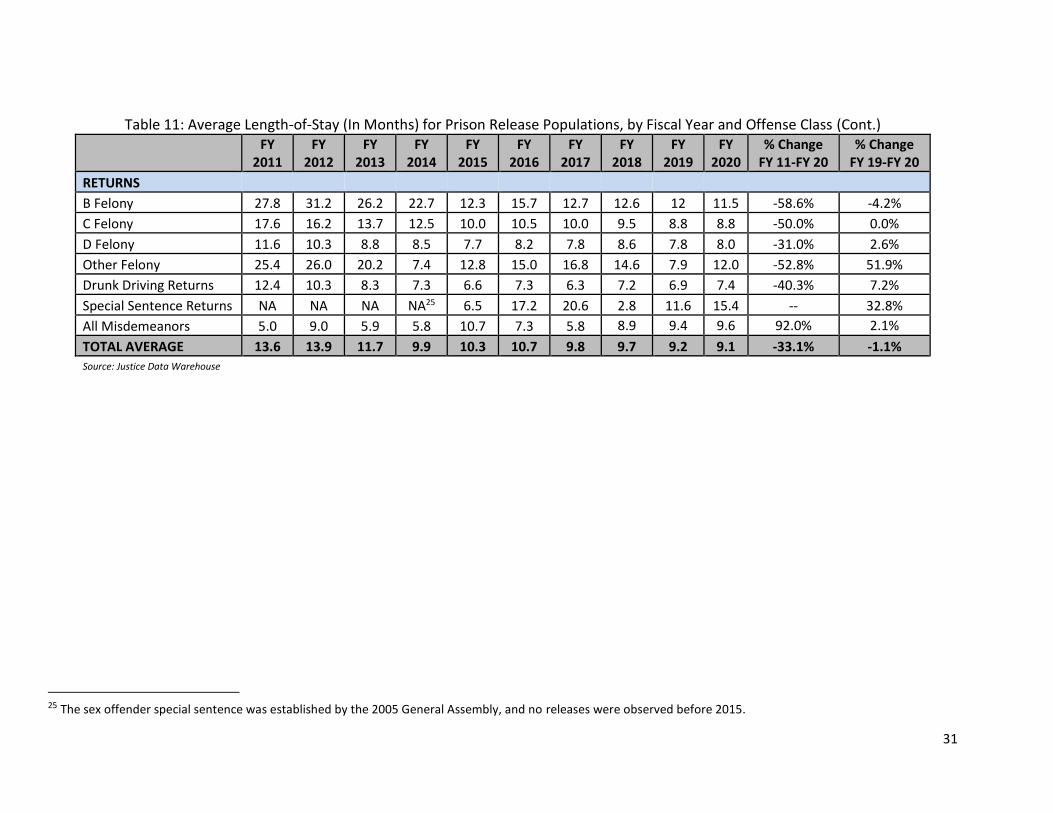
AVERAGE LENGTH OF STAY (LOS) Offense Class The average time served for released inmates, identified as new admissions, decreased from 21.5 months to 19.9 months (-7.4%; Appendix IV, Table 10). Caution should be used when review percent changes as some categories could have low numbers (e.g. B Felony Sex). Since FY 2011, LOS decreased 33.1% for returns (Appendix IV, Table 11). Decreases for all crime categories were observed, with the exception of misdemeanor returns, which increased from 5.0 months in FY 2011 to 9.6 months in FY 2020 (Figure 6). Average time served for prison returns tends to be shorter than new admissions due to serving a significant portion of their sentences prior to their original release.
Figure 6: Average LOS for Returns in Months by Class, FY 2011 and FY 2020
Source: Justice Data Warehouse
Mandatory Minimum Sentences A factor expected to reduce prison growth is the continued early release of inmates convicted under Iowa statute §711.2 Robbery 1 and §711.3 Robbery 2. In 2016, HF2064 passed, which made certain drug offenders serving mandatory terms eligible for early release. For a review of the history of mandatory minimum prison terms and their impact on the prison population, please see prior forecasts.10
10 https://humanrights.iowa.gov/cjjp/publications/prison-population-forecasts
17
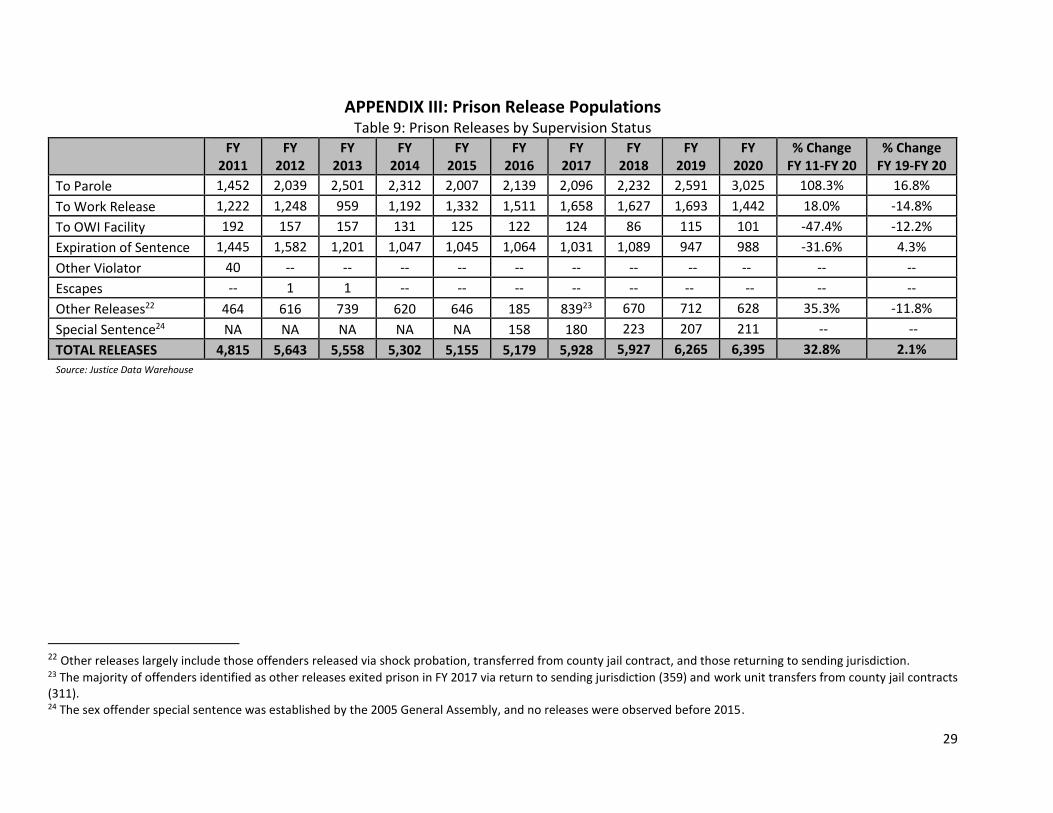
COMMUNITY-BASED CORRECTIONS Figure 7: Prison Releases by Type from FY 2011 to FY 2020
Source: Justice Data Warehouse
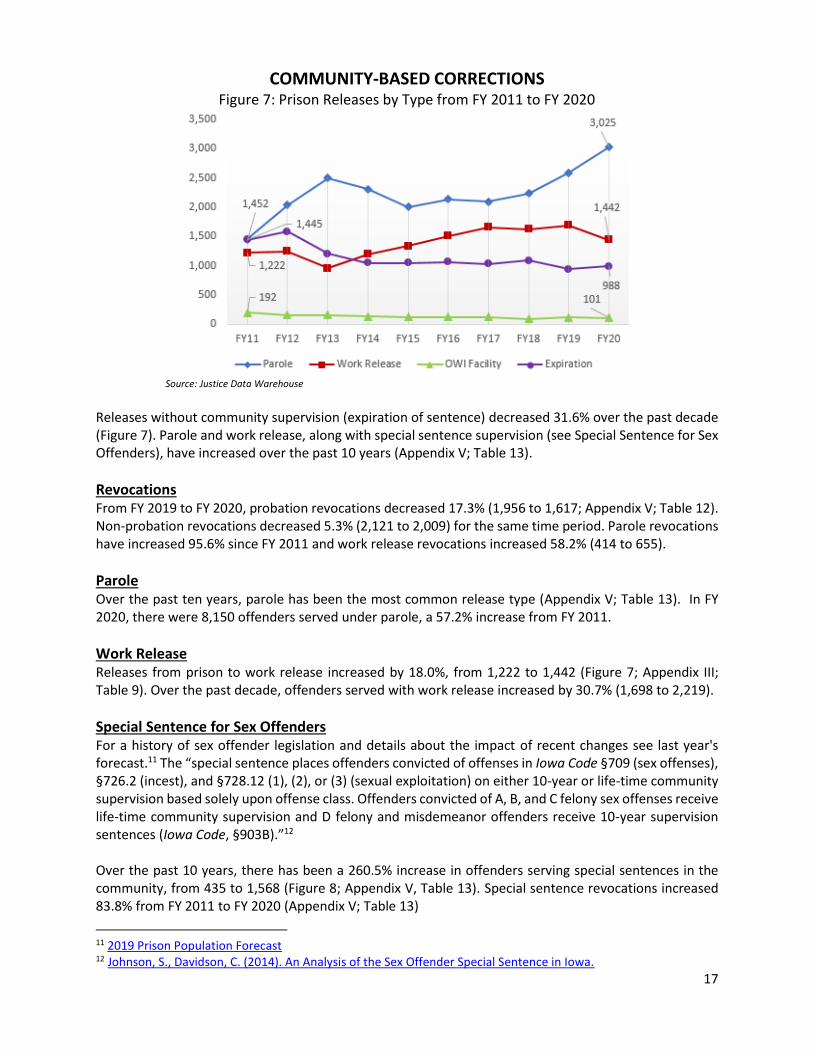
Releases without community supervision (expiration of sentence) decreased 31.6% over the past decade (Figure 7). Parole and work release, along with special sentence supervision (see Special Sentence for Sex Offenders), have increased over the past 10 years (Appendix V; Table 13).
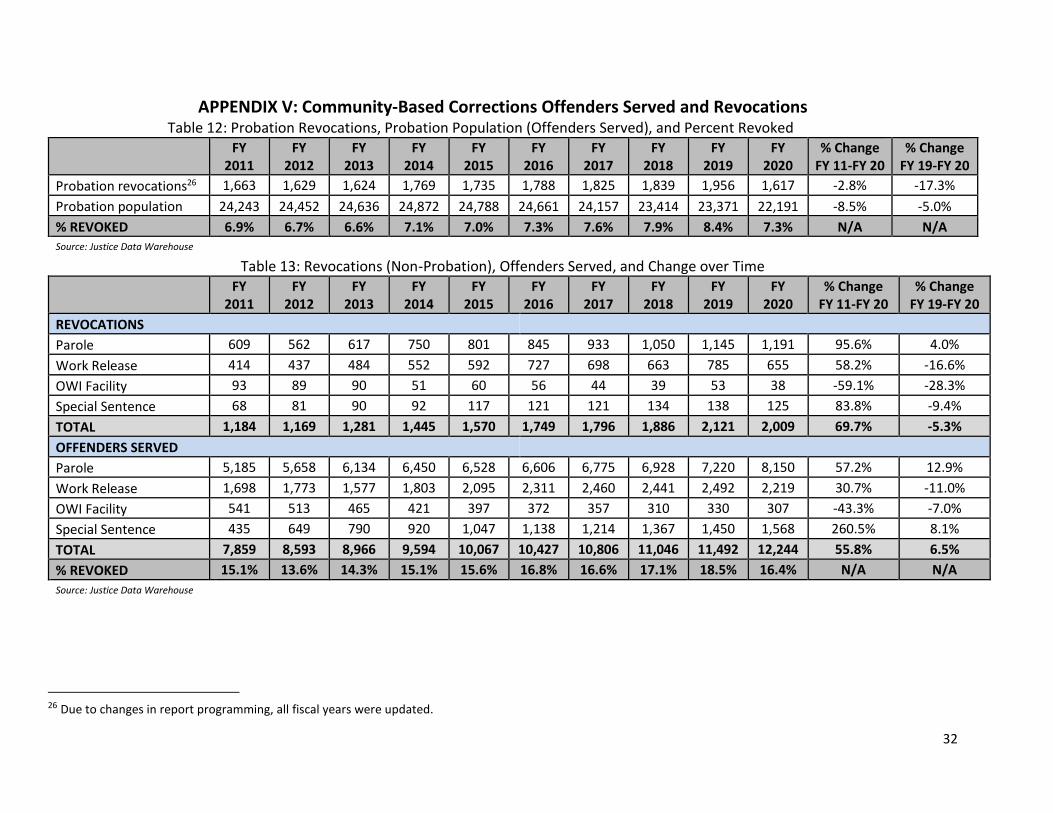
Revocations From FY 2019 to FY 2020, probation revocations decreased 17.3% (1,956 to 1,617; Appendix V; Table 12). Non-probation revocations decreased 5.3% (2,121 to 2,009) for the same time period. Parole revocations have increased 95.6% since FY 2011 and work release revocations increased 58.2% (414 to 655).
Parole Over the past ten years, parole has been the most common release type (Appendix V; Table 13). In FY 2020, there were 8,150 offenders served under parole, a 57.2% increase from FY 2011.
Work Release Releases from prison to work release increased by 18.0%, from 1,222 to 1,442 (Figure 7; Appendix III; Table 9). Over the past decade, offenders served with work release increased by 30.7% (1,698 to 2,219).
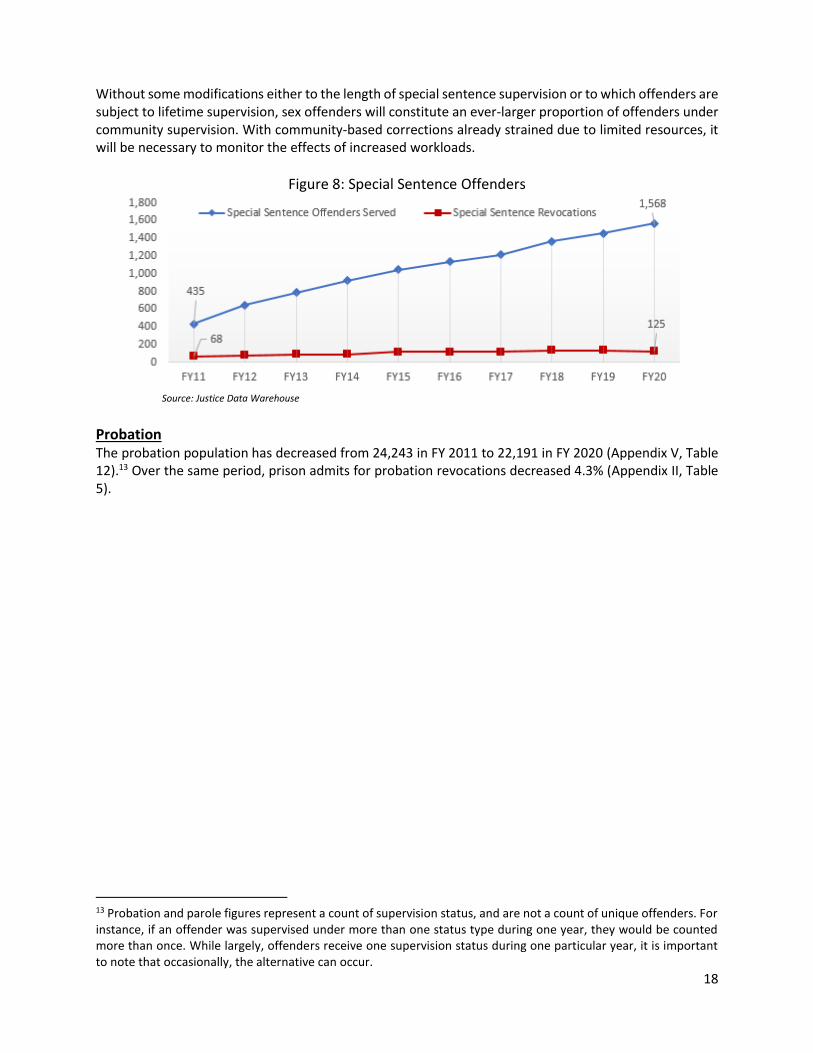
Special Sentence for Sex Offenders For a history of sex offender legislation and details about the impact of recent changes see last year's forecast.11 The “special sentence places offenders convicted of offenses in Iowa Code §709 (sex offenses), §726.2 (incest), and §728.12 (1), (2), or (3) (sexual exploitation) on either 10-year or life-time community supervision based solely upon offense class. Offenders convicted of A, B, and C felony sex offenses receive life-time community supervision and D felony and misdemeanor offenders receive 10-year supervision sentences (Iowa Code, §903B).”12 Over the past 10 years, there has been a 260.5% increase in offenders serving special sentences in the community, from 435 to 1,568 (Figure 8; Appendix V, Table 13). Special sentence revocations increased 83.8% from FY 2011 to FY 2020 (Appendix V; Table 13)
11 2019 Prison Population Forecast 12 Johnson, S., Davidson, C. (2014). An Analysis of the Sex Offender Special Sentence in Iowa.
18
Without some modifications either to the length of special sentence supervision or to which offenders are subject to lifetime supervision, sex offenders will constitute an ever-larger proportion of offenders under community supervision. With community-based corrections already strained due to limited resources, it will be necessary to monitor the effects of increased workloads.
Figure 8: Special Sentence Offenders
Source: Justice Data Warehouse
Probation The probation population has decreased from 24,243 in FY 2011 to 22,191 in FY 2020 (Appendix V, Table 12).13 Over the same period, prison admits for probation revocations decreased 4.3% (Appendix II, Table 5).
13 Probation and parole figures represent a count of supervision status, and are not a count of unique offenders. For instance, if an offender was supervised under more than one status type during one year, they would be counted more than once. While largely, offenders receive one supervision status during one particular year, it is important to note that occasionally, the alternative can occur.
19
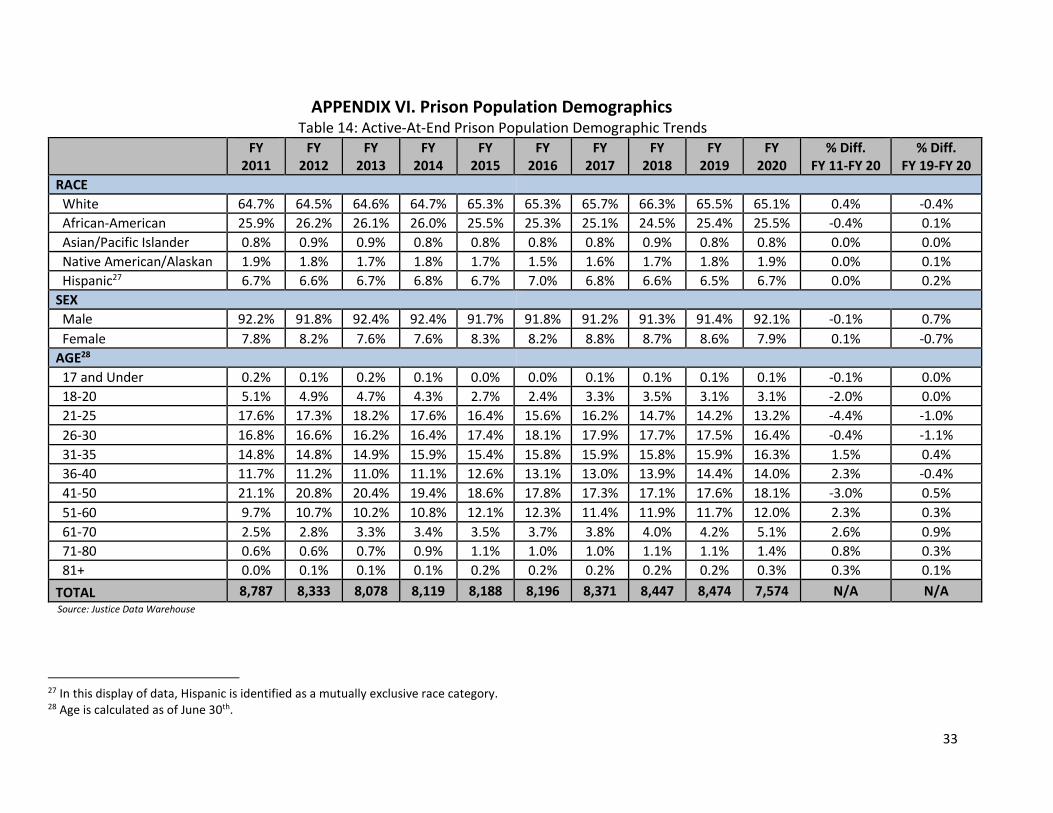
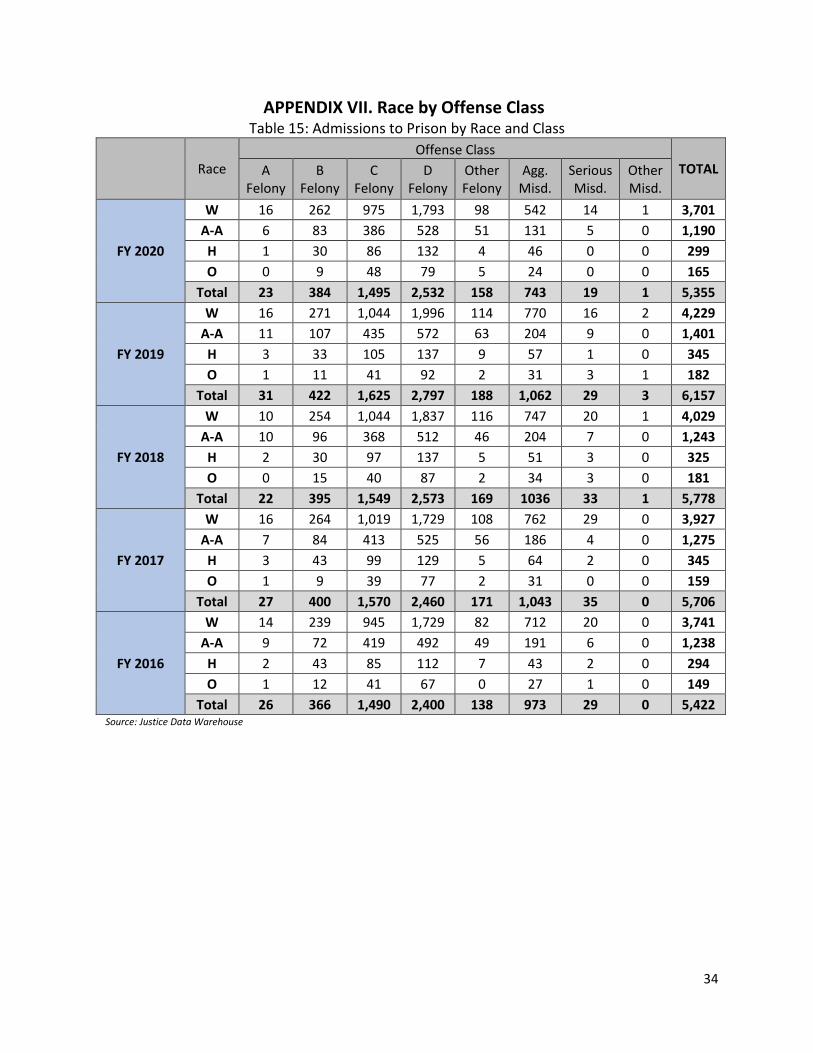
RACIAL DEMOGRAPHICS IN ADMISSIONS AND RELEASES On June 30, 2020, 65.1% of the prison population were White, 25.5% African-American, 6.7% Hispanic, 1.9% Native American or Alaskan, and 0.8% Asian or Pacific Islander (Appendix VI, Table 14). The prison population racial trend has remained steady from FY 2011 to FY 2020. Admissions and release data was compiled by race and offense class for FY 2016 to FY 2020 and can be found in Appendix VII, Tables 15 and 16.
Admissions The number of Whites and African-Americans admitted to prison decreased by 1.1% and 3.9%, respectively. Prison admissions decreased by 1.2% (5,422 to 5,355). Felony B, C, and D admissions increased, while aggravated misdemeanor admits decreased nearly 24%.
Releases Releases from prison for Whites and African-Americans increase 15.8% and 11.0%, respectively. Total releases from prison increased 15.4% (5,435 to 6,270).
20
CONCLUSION The number of parole releases, parole returns, offenders served in the community, and revocations have increased from FY 2011 to FY 2020. Similarly, special sentence releases, returns, and offenders served in the community have also increased. The revocation rate for special sentences has decreased from 15.6% to 8.0%. Institutional and community-based treatment programs are an area of opportunity to help mitigate returns and revocations. Currently, this report continues to show that special sentences, mandatory minimums, and drug offense sentencing remain to be contributors to overpopulation. Continued investigation into the current length of these sentences is needed and would help to reduce the size of the prison population. Another area of interest in the current report is the effect of COVID-19. At the time this report was finalized the pandemic was still affecting the prison population and community-based-corrections. Access to, and timeliness of treatment-based services in the facilities and in the community may be more of a challenge until the pandemic subsides. The prison population has decreased since last year, however, some prisons are overcapacity. Overall, the impact of the pandemic decreased forecasted populations from last year's report. Examination of the impact to determine effectiveness could lead to practice changes to keep prison admissions, revocations, and community supervision down, resulting in a reduction of the prison population. CJJP recently presented a report14 on juvenile waivers to adult court to the JAB. Review of these cases show racial disparity towards African-Americans. Further investigation is needed to review the impact on the prison population. A joint effort between the Juvenile Justice Advisory Council (JJAC) and the JAB, two CJJP Councils, could be beneficial. 2020 has brought racial disparity to the forefront of criminal justice issues across the nation. Analyzing sentencing practices in Iowa could provide updated information regarding current trends and highlighting areas for potential change. CJJP and DOC should partner to develop a model using predictive analytics to better understand factors in recidivism. Recognizing these factors could assist with program and policy changes, and ensure that inmates are receiving interventions/programs that are beneficial to their transition back to the community, and reduce recidivism.
14 Racial Disparities - An Analysis of Three Decision Points in Iowa’s Juvenile Justice System
21
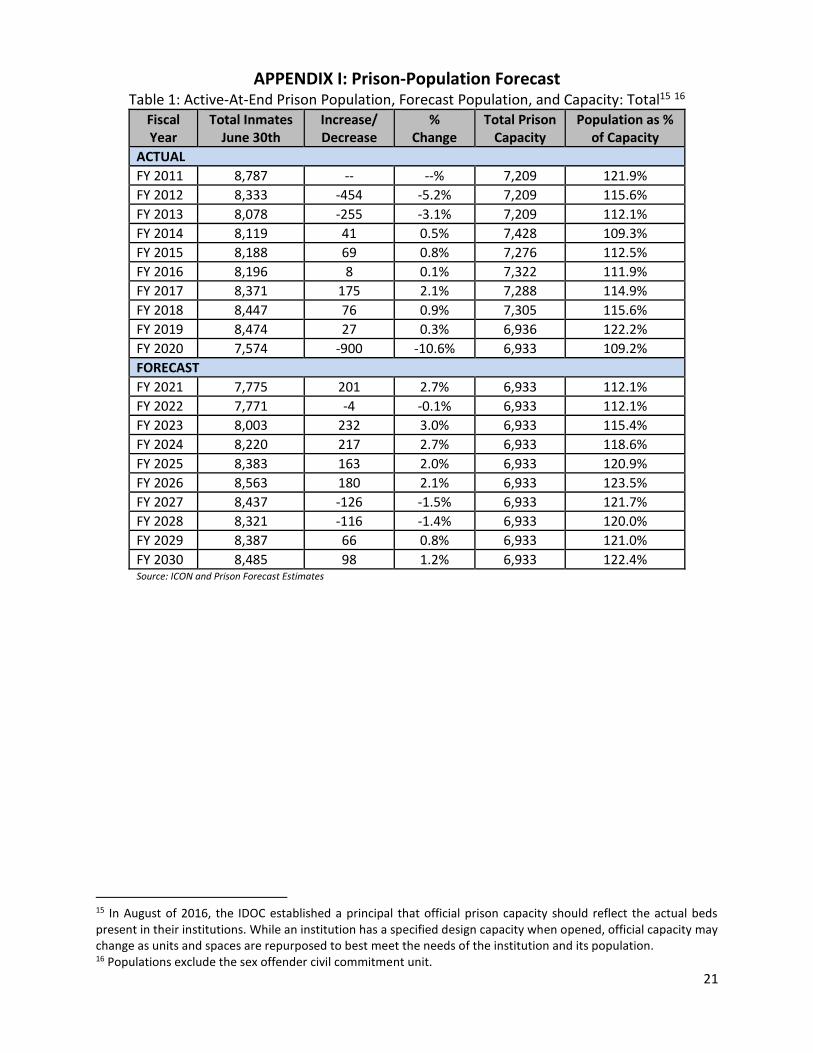
APPENDIX I: Prison-Population Forecast Table 1: Active-At-End Prison Population, Forecast Population, and Capacity: Total15 16
Fiscal Year
Total Inmates June 30th
Increase/ Decrease
% Change
Total Prison Capacity
Population as % of Capacity
ACTUAL
FY 2011 8,787 -- --% 7,209 121.9%
FY 2012 8,333 -454 -5.2% 7,209 115.6%
FY 2013 8,078 -255 -3.1% 7,209 112.1%
FY 2014 8,119 41 0.5% 7,428 109.3%
FY 2015 8,188 69 0.8% 7,276 112.5%
FY 2016 8,196 8 0.1% 7,322 111.9%
FY 2017 8,371 175 2.1% 7,288 114.9%
FY 2018 8,447 76 0.9% 7,305 115.6%
FY 2019 8,474 27 0.3% 6,936 122.2%
FY 2020 7,574 -900 -10.6% 6,933 109.2%
FORECAST
FY 2021 7,775 201 2.7% 6,933 112.1%
FY 2022 7,771 -4 -0.1% 6,933 112.1%
FY 2023 8,003 232 3.0% 6,933 115.4%
FY 2024 8,220 217 2.7% 6,933 118.6%
FY 2025 8,383 163 2.0% 6,933 120.9%
FY 2026 8,563 180 2.1% 6,933 123.5%
FY 2027 8,437 -126 -1.5% 6,933 121.7%
FY 2028 8,321 -116 -1.4% 6,933 120.0%
FY 2029 8,387 66 0.8% 6,933 121.0%
FY 2030 8,485 98 1.2% 6,933 122.4% Source: ICON and Prison Forecast Estimates
15 In August of 2016, the IDOC established a principal that official prison capacity should reflect the actual beds present in their institutions. While an institution has a specified design capacity when opened, official capacity may change as units and spaces are repurposed to best meet the needs of the institution and its population. 16 Populations exclude the sex offender civil commitment unit.
22
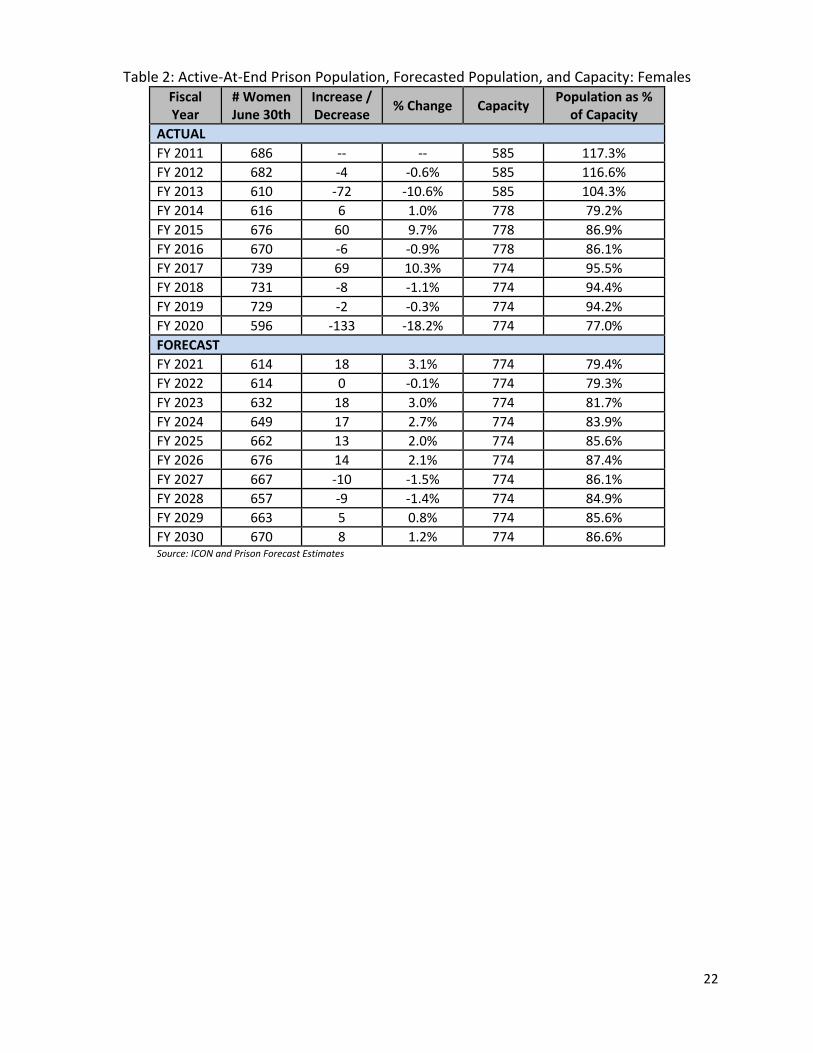
Table 2: Active-At-End Prison Population, Forecasted Population, and Capacity: Females Fiscal Year
# Women June 30th
Increase / Decrease
% Change Capacity Population as %
of Capacity
ACTUAL
FY 2011 686 -- -- 585 117.3%
FY 2012 682 -4 -0.6% 585 116.6%
FY 2013 610 -72 -10.6% 585 104.3%
FY 2014 616 6 1.0% 778 79.2%
FY 2015 676 60 9.7% 778 86.9%
FY 2016 670 -6 -0.9% 778 86.1%
FY 2017 739 69 10.3% 774 95.5%
FY 2018 731 -8 -1.1% 774 94.4%
FY 2019 729 -2 -0.3% 774 94.2%
FY 2020 596 -133 -18.2% 774 77.0%
FORECAST
FY 2021 614 18 3.1% 774 79.4%
FY 2022 614 0 -0.1% 774 79.3%
FY 2023 632 18 3.0% 774 81.7%
FY 2024 649 17 2.7% 774 83.9%
FY 2025 662 13 2.0% 774 85.6%
FY 2026 676 14 2.1% 774 87.4%
FY 2027 667 -10 -1.5% 774 86.1%
FY 2028 657 -9 -1.4% 774 84.9%
FY 2029 663 5 0.8% 774 85.6%
FY 2030 670 8 1.2% 774 86.6% Source: ICON and Prison Forecast Estimates
23
Table 3: Active-At-End Prison Population, Forecasted Population, and Capacity: Males Fiscal Year
# Men June 30th
Increase/ Decrease
% Change
Capacity Population as %
of Capacity
ACTUAL
FY 2011 8,101 -- -- 6,624 122.3%
FY 2012 7,651 -450 -5.6% 6,624 115.5%
FY 2013 7,468 -183 -2.4% 6,624 112.7%
FY 2014 7,503 35 0.5% 6,650 112.8%
FY 2015 7,512 9 0.1% 6,498 115.6%
FY 2016 7,526 14 0.2% 6,544 115.0%
FY 2017 7,632 106 1.4% 6,514 117.2%
FY 2018 7,716 84 1.1% 6,531 118.1%
FY 2019 7,745 29 0.4% 6,162 125.7%
FY 2020 6,978 -767 -9.9% 6,159 113.3%
FORECAST
FY 2021 7,161 183 2.6% 6,159 116.3%
FY 2022 7,157 -4 -0.1% 6,159 116.2%
FY 2023 7,371 214 3.0% 6,159 119.7%
FY 2024 7,571 200 2.7% 6,159 122.9%
FY 2025 7,721 150 2.0% 6,159 125.4%
FY 2026 7,887 166 2.1% 6,159 128.0%
FY 2027 7,770 -116 -1.5% 6,159 126.2%
FY 2028 7,664 -107 -1.4% 6,159 124.4%
FY 2029 7,724 61 0.8% 6,159 125.4%
FY 2030 7,815 90 1.2% 6,159 126.9% Source: ICON and Prison Forecast Estimates
24
Table 4: Active-At-End Prison Population Compared to Prior Year Forecast
Source: Justice Data Warehouse
* This column lists the forecasted figure (for the year listed in the column on the left) from the year prior to the year listed in the column. For example, in FY 2019, the forecast projected a prison population of 8,668 for FY 2020.
Actual Population
1 Yr. Prior* Forecast
% Difference 1 Yr. Prior
FY 2011 8,787 8,602 2.1%
FY 2012 8,333 8,824 -5.9%
FY 2013 8,078 -- --
FY 2014 8,119 8,064 0.7%
FY 2015 8,188 8,379 -2.3%
FY 2016 8,196 8,408 -2.6%
FY 2017 8,371 8,408 -0.4%
FY 2018 8,447 8,611 -1.9%
FY 2019 8,474 8,668 -2.3%
FY 2020 7,574 8,675 -14.5%
25
APPENDIX II: Prison Admission Populations and Forecasts Table 5: Prison Admissions by Admission Reason
FY
2011 FY
2012 FY
2013 FY
2014 FY
2015 FY
2016 FY
2017 FY
2018 FY
2019 FY
2020 % Change
FY 11-FY 20 % Change
FY 19-FY 20
Admission Type
New Court Commitments 1,951 2,112 2,020 2,048 1,828 1,932 2,025 1,886 1,905 1,612 -17.4% -15.4%
New/Probation Revocations 1,534 1,508 1,497 1,655 1,567 1,561 1,636 1,758 1,786 1,468 -4.3% -17.8%
Prison Compact17 -- -- -- -- -- -- -- -- 6 5 -- -16.7%
NEW ADMISSIONS 3,485 3,620 3,517 3,703 3,395 3,493 3,661 3,644 3,697 3,085 -11.5% -16.6%
Parole Return18 692 664 800 896 1,020 1,057 1,186 1,375 1,517 1,470 112.4% -3.1%
Work Release Return 420 443 472 540 597 714 713 632 778 656 56.2% -15.7%
OWI Facility Return 89 91 87 49 64 54 47 37 41 27 -69.7% -34.1%
Special Sentence Return 68 89 103 106 137 135 135 174 163 143 110.3% -12.3%
Prison Compact 8 7 3 4 7 11 9 7 -- -- -- --
Other Return19 -- -- -- -- -- -- -- 20 15 25 -- 66.7%
RETURNS 1,277 1,294 1,465 1,595 1,825 1,971 2,090 2,245 2,514 2,321 81.8% -7.7%
TOTAL ADMISSIONS20 4,762 4,914 4,982 5,298 5,220 5,464 5,751 5,889 6,381 5,406 13.5% -15.3%
Source: Justice Data Warehouse
17 In FY 2019 there were programming changes in ICON which reclassified prison compacts from being classified as returns to new prison admissions. 18 Parole returns include short-term stays and releases to county jail. 19 Other returns tend to include offenders who returned to prison to serve an original sentence, a sentence which was under appeal, a county jail contract, or those who
had escaped/absconded. For the purposes of this report, the ‘other return’ category was established in FY 2018. 20 Excludes safe keeper, violators, and other admissions as they are not included in the prison forecast calculations
26
Table 6: Prison Admissions by Offense Type and Subtype21
FY 2011
FY 2012
FY 2013
FY 2014
FY 2015
FY 2016
FY 2017
FY 2018
FY 2019
FY 2020
% Change FY 11-FY 20
% Change FY 19-FY 20
OFFENSE TYPE
Drug 881 1,000 900 948 834 845 915 897 877 740 -16.0% -15.6%
Violent 911 923 920 981 967 928 1,047 1,019 1,067 862 -5.4% -19.2%
Property 993 1,016 1,008 1,100 941 1,070 1,015 1,156 1,096 969 -2.4% -11.6%
Public Order 586 568 540 533 500 481 539 534 628 488 -16.7% -22.3%
Other 114 113 149 140 153 169 145 37 29 27 -76.3% -6.9%
No Charge 0 0 0 1 0 0 0 1 0 0 -- --
TOTAL 3,485 3,620 3,517 3,703 3,395 3,493 3,661 3,644 3,697 3,085 -11.5% -16.6%
OFFENSE SUBTYPE
Alcohol 63 68 63 56 60 49 37 33 30 1 -98.4% -96.7%
Arson 24 21 27 26 24 20 25 34 25 22 -8.3% -12.0%
Assault 494 499 518 542 551 526 564 570 582 477 -3.4% -18.0%
Burglary 414 448 426 402 349 411 391 431 368 354 -14.5% -3.8%
Drug Offenses 881 1,000 900 948 834 845 915 897 877 740 -16.0% -15.6%
Flight/Escape 9 9 10 7 3 9 5 10 9 12 33.3% 33.3%
Forgery/Fraud 156 164 164 197 171 193 177 180 222 189 21.2% -14.9%
Kidnapping 9 11 6 17 12 18 16 12 15 22 144.4% 46.7%
Murder/Manslaughter 58 77 64 85 68 78 92 88 79 65 12.1% -17.7%
OWI 304 289 228 229 216 202 221 171 232 180 -40.8% -22.4%
Pimping/Prostitution 8 7 7 6 1 2 1 0 0 3 -62.5% --
Robbery 67 50 56 67 69 71 90 75 87 70 4.5% -19.5%
Sex Offenses 200 217 204 201 187 166 216 192 228 162 -19.0% -28.9%
Theft 336 341 343 418 352 388 368 451 425 360 7.1% -15.3%
Traffic 76 72 90 79 64 70 66 86 108 74 -2.6% -31.5%
Weapons 56 53 73 86 84 80 118 135 142 128 128.6% -9.9%
All Other Offenses 330 294 338 337 350 365 359 279 268 226 -31.5% -15.7%
TOTAL 3,485 3,620 3,517 3,703 3,395 3,493 3,661 3,644 3,697 3,085 -11.5% -16.6% Source: Justice Data Warehouse
21 Figures may differ from previous reports due to corrections made to historical databases.
27
Table 7: Prison Admissions by Offense Class
FY
2011 FY
2012 FY
2013 FY
2014 FY
2015 FY
2016 FY
2017 FY
2018 FY
2019 FY
2020 % Change
FY 11-FY 20 % Change
FY 19-FY 20
OFFENSE CLASS
A Felony 14 22 13 22 25 24 26 18 26 19 35.7% -26.9%
B Felony 189 171 168 179 155 169 179 167 190 157 -16.9% -17.4%
C Felony 825 894 829 913 813 828 876 853 823 729 -11.6% -11.4%
D Felony 1,447 1,501 1,507 1,551 1,433 1,473 1,529 1,530 1,715 1,539 6.4% -10.3%
Other Felony 160 183 199 182 176 182 185 204 51 42 -73.8% -17.6%
Aggravated Misd. 823 823 775 825 766 786 837 841 856 574 -30.3% -32.9%
Serious Misd. 27 26 25 28 25 30 29 29 26 19 -29.6% -26.9%
Other Misd. 0 0 1 1 1 0 0 1 3 1 -- -66.7%
Unknown 0 0 0 2 1 1 0 1 7 5 -- -28.6%
TOTAL 3,485 3,620 3,517 3,703 3,395 3,493 3,661 3,644 3,697 3,085 -11.5% -16.6% Source: Justice Data Warehouse
28
Table 8: Prison Admissions: Actual and Projected
# of New
Admissions % Change # of
Returns % Change
ACTUAL
FY 2011 3,485 -- 1,277 --
FY 2012 3,620 3.9% 1,294 1.3%
FY 2013 3,517 -2.8% 1,465 13.2%
FY 2014 3,703 5.3% 1,595 8.9%
FY 2015 3,395 -8.3% 1,825 14.4%
FY 2016 3,493 2.9% 1,971 8.0%
FY 2017 3,661 4.8% 2,090 6.0%
FY 2018 3,644 -0.5% 2,245 7.4%
FY 2019 3,697 1.5% 2,514 12.0%
FY 2020 3,085 -16.6% 2,320 -7.7%
FORECAST
FY 2021 2,807 -9.0% 1,860 -19.8%
FY 2022 3,027 7.8% 2,029 9.1%
FY 2023 3,467 14.5% 2,152 6.1%
FY 2024 3,680 6.1% 2,249 4.5%
FY 2025 3,859 4.9% 2,361 5.0%
FY 2026 3,993 3.5% 2,455 4.0%
FY 2027 4,048 1.4% 2,547 3.7%
FY 2028 4,047 0.0% 2,652 4.1%
FY 2029 4,046 0.0% 2,773 4.6%
FY 2030 4,045 0.0% 2,884 4.0%
Source: Justice Data Warehouse
29
APPENDIX III: Prison Release Populations Table 9: Prison Releases by Supervision Status
22 Other releases largely include those offenders released via shock probation, transferred from county jail contract, and those returning to sending jurisdiction. 23 The majority of offenders identified as other releases exited prison in FY 2017 via return to sending jurisdiction (359) and work unit transfers from county jail contracts (311). 24 The sex offender special sentence was established by the 2005 General Assembly, and no releases were observed before 2015.
FY
2011 FY
2012 FY
2013 FY
2014 FY
2015 FY
2016 FY
2017 FY
2018 FY
2019 FY
2020 % Change
FY 11-FY 20 % Change
FY 19-FY 20
To Parole 1,452 2,039 2,501 2,312 2,007 2,139 2,096 2,232 2,591 3,025 108.3% 16.8%
To Work Release 1,222 1,248 959 1,192 1,332 1,511 1,658 1,627 1,693 1,442 18.0% -14.8%
To OWI Facility 192 157 157 131 125 122 124 86 115 101 -47.4% -12.2%
Expiration of Sentence 1,445 1,582 1,201 1,047 1,045 1,064 1,031 1,089 947 988 -31.6% 4.3%
Other Violator 40 -- -- -- -- -- -- -- -- -- -- --
Escapes -- 1 1 -- -- -- -- -- -- -- -- --
Other Releases22 464 616 739 620 646 185 83923 670 712 628 35.3% -11.8%
Special Sentence24 NA NA NA NA NA 158 180 223 207 211 -- --
TOTAL RELEASES 4,815 5,643 5,558 5,302 5,155 5,179 5,928 5,927 6,265 6,395 32.8% 2.1%
Source: Justice Data Warehouse
30
APPENDIX IV: LOS for Release Cohorts Table 10: Average Length-of-Stay (In Months) for Prison Release Populations, by Fiscal Year and Offense Class
FY FY FY FY FY FY FY FY FY FY % Change % Change
2011 2012 2013 2014 2015 2016 2017 2018 2019 2020 FY 11-FY 20 FY 19-FY 20
NEW ADMISSIONS
*No Parole - Murder-2nd 510.0 510.0 510.0 510.0 510.0 510.0 510.0 510.0 510.0 510 0.0% 0.0%
*No Parole - Other Class B 210.0 210.0 210.0 210.0 184.0 149.9 142.2 159.1 186.7 172.7 -17.8% -7.5%
*No Parole - Class C 84.0 84.0 84.0 84.0 82.5 83.4 71.2 85.3 69.9 71.3 -15.1% 2.0%
*No Parole - Habitual Class C 126.0 126.0 126.0 126.0 126.0 126.0 126.0 126.0 126.0 126 0.0% 0.0%
B Felony Persons 123.5 131.8 108.0 101.6 106.0 132.0 90.2 85.2 95.4 78.8 -36.2% -17.4%
B Felony Non-Persons 38.6 39.0 40.5 34.7 36.9 33.5 26.9 29.1 27.7 29.1 -24.7% 5.0%
B Felony Sex 152.3 174.6 157.3 172.8 209.1 274.5 247.3 -- -- 285.2 87.3% --
C Felony Persons 43.7 47.1 38.0 45.0 37.5 38.2 38.9 39.8 38.4 35.8 -18.1% -6.8%
C Felony Non-Persons 23.3 23.4 21.8 18.7 17.6 19.5 17.4 15.4 15.6 15.9 -31.7% 2.0%
C Felony Sex 64.0 66.7 63.5 66.5 63.4 58.2 64.7 68.2 58.9 68.8 7.6% 16.9%
D Felony Persons 20.6 21.2 16.9 17.0 15.3 16.6 15.4 17.2 17.3 15.5 -24.6% -10.2%
D Felony Non-Persons 14.5 13.5 12.2 11.2 11.5 11.7 11.3 12.5 12.2 11.7 -19.5% -4.3%
D Felony Sex 36.8 31.7 33.0 32.0 24.1 30.5 29.9 34.8 27.6 29.9 -18.6% 8.5%
Other Felony Persons NA 247.1 314.7 489.8 471.2 472.4 354.4 378.9 -- -- -- --
Other Felony Non-Persons 36.4 41.2 35.2 36.3 36.1 29.2 38.4 31.9 28.4 29.3 -19.5% 3.1%
Other Felony Sex 409.8 109.3 NA NA 45.1 39.2 52.3 42.3 -- -- -- --
Agg Misd Persons 9.0 8.7 8.6 8.3 8.4 8.7 9.0 8.5 8.1 8.6 -3.9% 6.7%
Agg Misd Non-Persons 6.9 7.0 7.1 6.6 7.1 7.0 6.4 6.7 6.9 7.2 4.5% 4.5%
Agg Misd Sex 13.5 12.9 11.9 12.9 8.6 8.3 15.0 11.6 9.3 11.0 -18.5% 18.3%
Serious Misd 6.9 7.3 6.2 6.9 10.6 5.9 7.3 6.4 5.0 9.8 42.1% 96.1%
Drunk Driving Initial Stay 8.0 7.5 6.1 3.9 5.2 5.3 5.8 6.1 -- 7.2 -10.0% --
TOTAL AVERAGE 21.5 23.2 21.5 19.5 20.2 21.1 21.7 20.5 18.9 19.9 -7.4% 5.3% Source: Justice Data Warehouse
31
Table 11: Average Length-of-Stay (In Months) for Prison Release Populations, by Fiscal Year and Offense Class (Cont.)
FY
2011 FY
2012 FY
2013 FY
2014 FY
2015 FY
2016 FY
2017 FY
2018 FY
2019 FY
2020 % Change
FY 11-FY 20 % Change
FY 19-FY 20
RETURNS
B Felony 27.8 31.2 26.2 22.7 12.3 15.7 12.7 12.6 12 11.5 -58.6% -4.2%
C Felony 17.6 16.2 13.7 12.5 10.0 10.5 10.0 9.5 8.8 8.8 -50.0% 0.0%
D Felony 11.6 10.3 8.8 8.5 7.7 8.2 7.8 8.6 7.8 8.0 -31.0% 2.6%
Other Felony 25.4 26.0 20.2 7.4 12.8 15.0 16.8 14.6 7.9 12.0 -52.8% 51.9%
Drunk Driving Returns 12.4 10.3 8.3 7.3 6.6 7.3 6.3 7.2 6.9 7.4 -40.3% 7.2%
Special Sentence Returns NA NA NA NA25 6.5 17.2 20.6 2.8 11.6 15.4 -- 32.8%
All Misdemeanors 5.0 9.0 5.9 5.8 10.7 7.3 5.8 8.9 9.4 9.6 92.0% 2.1%
TOTAL AVERAGE 13.6 13.9 11.7 9.9 10.3 10.7 9.8 9.7 9.2 9.1 -33.1% -1.1%
Source: Justice Data Warehouse
25 The sex offender special sentence was established by the 2005 General Assembly, and no releases were observed before 2015.
32
APPENDIX V: Community-Based Corrections Offenders Served and Revocations Table 12: Probation Revocations, Probation Population (Offenders Served), and Percent Revoked
FY 2011
FY 2012
FY 2013
FY 2014
FY 2015
FY 2016
FY 2017
FY 2018
FY 2019
FY 2020
% Change FY 11-FY 20
% Change FY 19-FY 20
Probation revocations26 1,663 1,629 1,624 1,769 1,735 1,788 1,825 1,839 1,956 1,617 -2.8% -17.3%
Probation population 24,243 24,452 24,636 24,872 24,788 24,661 24,157 23,414 23,371 22,191 -8.5% -5.0%
% REVOKED 6.9% 6.7% 6.6% 7.1% 7.0% 7.3% 7.6% 7.9% 8.4% 7.3% N/A N/A
Source: Justice Data Warehouse
Table 13: Revocations (Non-Probation), Offenders Served, and Change over Time
26 Due to changes in report programming, all fiscal years were updated.
FY
2011 FY
2012 FY
2013 FY
2014 FY
2015 FY
2016 FY
2017 FY
2018 FY
2019 FY
2020 % Change
FY 11-FY 20 % Change
FY 19-FY 20
REVOCATIONS
Parole 609 562 617 750 801 845 933 1,050 1,145 1,191 95.6% 4.0%
Work Release 414 437 484 552 592 727 698 663 785 655 58.2% -16.6%
OWI Facility 93 89 90 51 60 56 44 39 53 38 -59.1% -28.3%
Special Sentence 68 81 90 92 117 121 121 134 138 125 83.8% -9.4%
TOTAL 1,184 1,169 1,281 1,445 1,570 1,749 1,796 1,886 2,121 2,009 69.7% -5.3%
OFFENDERS SERVED
Parole 5,185 5,658 6,134 6,450 6,528 6,606 6,775 6,928 7,220 8,150 57.2% 12.9%
Work Release 1,698 1,773 1,577 1,803 2,095 2,311 2,460 2,441 2,492 2,219 30.7% -11.0%
OWI Facility 541 513 465 421 397 372 357 310 330 307 -43.3% -7.0%
Special Sentence 435 649 790 920 1,047 1,138 1,214 1,367 1,450 1,568 260.5% 8.1%
TOTAL 7,859 8,593 8,966 9,594 10,067 10,427 10,806 11,046 11,492 12,244 55.8% 6.5%
% REVOKED 15.1% 13.6% 14.3% 15.1% 15.6% 16.8% 16.6% 17.1% 18.5% 16.4% N/A N/A
Source: Justice Data Warehouse
33
APPENDIX VI. Prison Population Demographics Table 14: Active-At-End Prison Population Demographic Trends
FY
2011 FY
2012 FY
2013 FY
2014 FY
2015 FY
2016 FY
2017 FY
2018 FY
2019 FY
2020 % Diff.
FY 11-FY 20 % Diff.
FY 19-FY 20
RACE
White 64.7% 64.5% 64.6% 64.7% 65.3% 65.3% 65.7% 66.3% 65.5% 65.1% 0.4% -0.4%
African-American 25.9% 26.2% 26.1% 26.0% 25.5% 25.3% 25.1% 24.5% 25.4% 25.5% -0.4% 0.1%
Asian/Pacific Islander 0.8% 0.9% 0.9% 0.8% 0.8% 0.8% 0.8% 0.9% 0.8% 0.8% 0.0% 0.0%
Native American/Alaskan 1.9% 1.8% 1.7% 1.8% 1.7% 1.5% 1.6% 1.7% 1.8% 1.9% 0.0% 0.1%
Hispanic27 6.7% 6.6% 6.7% 6.8% 6.7% 7.0% 6.8% 6.6% 6.5% 6.7% 0.0% 0.2%
SEX
Male 92.2% 91.8% 92.4% 92.4% 91.7% 91.8% 91.2% 91.3% 91.4% 92.1% -0.1% 0.7%
Female 7.8% 8.2% 7.6% 7.6% 8.3% 8.2% 8.8% 8.7% 8.6% 7.9% 0.1% -0.7%
AGE28
17 and Under 0.2% 0.1% 0.2% 0.1% 0.0% 0.0% 0.1% 0.1% 0.1% 0.1% -0.1% 0.0%
18-20 5.1% 4.9% 4.7% 4.3% 2.7% 2.4% 3.3% 3.5% 3.1% 3.1% -2.0% 0.0%
21-25 17.6% 17.3% 18.2% 17.6% 16.4% 15.6% 16.2% 14.7% 14.2% 13.2% -4.4% -1.0%
26-30 16.8% 16.6% 16.2% 16.4% 17.4% 18.1% 17.9% 17.7% 17.5% 16.4% -0.4% -1.1%
31-35 14.8% 14.8% 14.9% 15.9% 15.4% 15.8% 15.9% 15.8% 15.9% 16.3% 1.5% 0.4%
36-40 11.7% 11.2% 11.0% 11.1% 12.6% 13.1% 13.0% 13.9% 14.4% 14.0% 2.3% -0.4%
41-50 21.1% 20.8% 20.4% 19.4% 18.6% 17.8% 17.3% 17.1% 17.6% 18.1% -3.0% 0.5%
51-60 9.7% 10.7% 10.2% 10.8% 12.1% 12.3% 11.4% 11.9% 11.7% 12.0% 2.3% 0.3%
61-70 2.5% 2.8% 3.3% 3.4% 3.5% 3.7% 3.8% 4.0% 4.2% 5.1% 2.6% 0.9%
71-80 0.6% 0.6% 0.7% 0.9% 1.1% 1.0% 1.0% 1.1% 1.1% 1.4% 0.8% 0.3%
81+ 0.0% 0.1% 0.1% 0.1% 0.2% 0.2% 0.2% 0.2% 0.2% 0.3% 0.3% 0.1%
TOTAL 8,787 8,333 8,078 8,119 8,188 8,196 8,371 8,447 8,474 7,574 N/A N/A Source: Justice Data Warehouse
27 In this display of data, Hispanic is identified as a mutually exclusive race category. 28 Age is calculated as of June 30th.
34
APPENDIX VII. Race by Offense Class Table 15: Admissions to Prison by Race and Class
Race
Offense Class
TOTAL A Felony
B Felony
C Felony
D Felony
Other Felony
Agg. Misd.
Serious Misd.
Other Misd.
FY 2020
W 16 262 975 1,793 98 542 14 1 3,701
A-A 6 83 386 528 51 131 5 0 1,190
H 1 30 86 132 4 46 0 0 299
O 0 9 48 79 5 24 0 0 165
Total 23 384 1,495 2,532 158 743 19 1 5,355
FY 2019
W 16 271 1,044 1,996 114 770 16 2 4,229
A-A 11 107 435 572 63 204 9 0 1,401
H 3 33 105 137 9 57 1 0 345
O 1 11 41 92 2 31 3 1 182
Total 31 422 1,625 2,797 188 1,062 29 3 6,157
FY 2018
W 10 254 1,044 1,837 116 747 20 1 4,029
A-A 10 96 368 512 46 204 7 0 1,243
H 2 30 97 137 5 51 3 0 325
O 0 15 40 87 2 34 3 0 181
Total 22 395 1,549 2,573 169 1036 33 1 5,778
FY 2017
W 16 264 1,019 1,729 108 762 29 0 3,927
A-A 7 84 413 525 56 186 4 0 1,275
H 3 43 99 129 5 64 2 0 345
O 1 9 39 77 2 31 0 0 159
Total 27 400 1,570 2,460 171 1,043 35 0 5,706
FY 2016
W 14 239 945 1,729 82 712 20 0 3,741
A-A 9 72 419 492 49 191 6 0 1,238
H 2 43 85 112 7 43 2 0 294
O 1 12 41 67 0 27 1 0 149
Total 26 366 1,490 2,400 138 973 29 0 5,422 Source: Justice Data Warehouse
35
Table 16: Releases from Prison by Race and Class
Race
Offense Class
TOTAL A Felony
B Felony
C Felony
D Felony
Other Felony
Agg. Misd.
Serious Misd.
Other Misd.
FY 2020
W 9 267 1,067 2,066 127 781 19 0 4,336
A-A 1 113 433 599 58 189 5 0 1,398
H 1 37 88 157 11 61 0 0 355
O 0 8 36 98 6 30 2 1 181
Total 11 425 1,624 2,920 202 1,061 26 1 6,270
FY 2019
W 10 275 1,109 1,979 101 758 9 3 4,244
A-A 5 90 412 553 63 194 11 0 1,328
H 0 26 124 134 0 51 2 0 337
O 0 14 46 79 0 37 3 0 179
Total 15 405 1,691 2,745 172 1,040 25 3 6,096
FY 2018
W 5 237 1,078 1,718 136 734 28 0 3,936
A-A 4 67 420 513 72 200 5 0 1,281
H 0 46 101 129 6 59 2 0 343
O 1 14 46 77 2 30 1 0 171
Total 10 364 1,645 2,437 216 1,023 36 0 5,731
FY 2017
W 13 275 978 1,664 108 737 28 0 3,803
A-A 3 95 419 461 62 199 5 0 1,244
H 0 44 109 118 12 62 4 0 349
O 0 16 38 68 1 24 0 0 147
Total 16 430 1,544 2,311 183 1,022 37 0 5,543
FY 2016
W 11 230 1,009 1,657 102 721 13 0 3,743
A-A 1 64 414 515 59 199 7 0 1,259
H 1 28 80 110 3 39 2 1 264
O 0 11 41 80 4 32 1 0 169
Total 13 333 1,544 2,362 168 991 23 1 5,435 Source: Justice Data Warehouse