Embed Size (px)
Citation preview
Borgar T Olsen
Lisa Henden, Audun Fosselie Hansen, Markku Lähteenoja
The Core of Techno- Economicshistorical review and new business modeling
with examples from the CELTIC MARCH project
Techno-Economics in Telecommunication, a personal historical review
Before 1992
RACE I / R1044 “Integrated broadband communications development and implementation strategies”
Developed The “SYNTHESYS model and tool”
– D. Gardan, A. Zaganiaris, A. Madani, R.Madigou, D.Machon, «Techno-economics of Advanced Optical Subscriber Networks,» in Proc. IEEE Globecom ‘89, Nov. 27-30, 1989, Dallas, USA
– A. Zaganiaris, D. Gardan, A. Roosma, M. Potts, R. Beeler, A. Socard, «Fiber to the home, A techno-economic evaluation within Europe, by RACE program,» in Proc. International Symposium on Subscriber Loops and Services (ISSLS ‘91), April 22-26, 1991, Amsterdam, the Netherlands
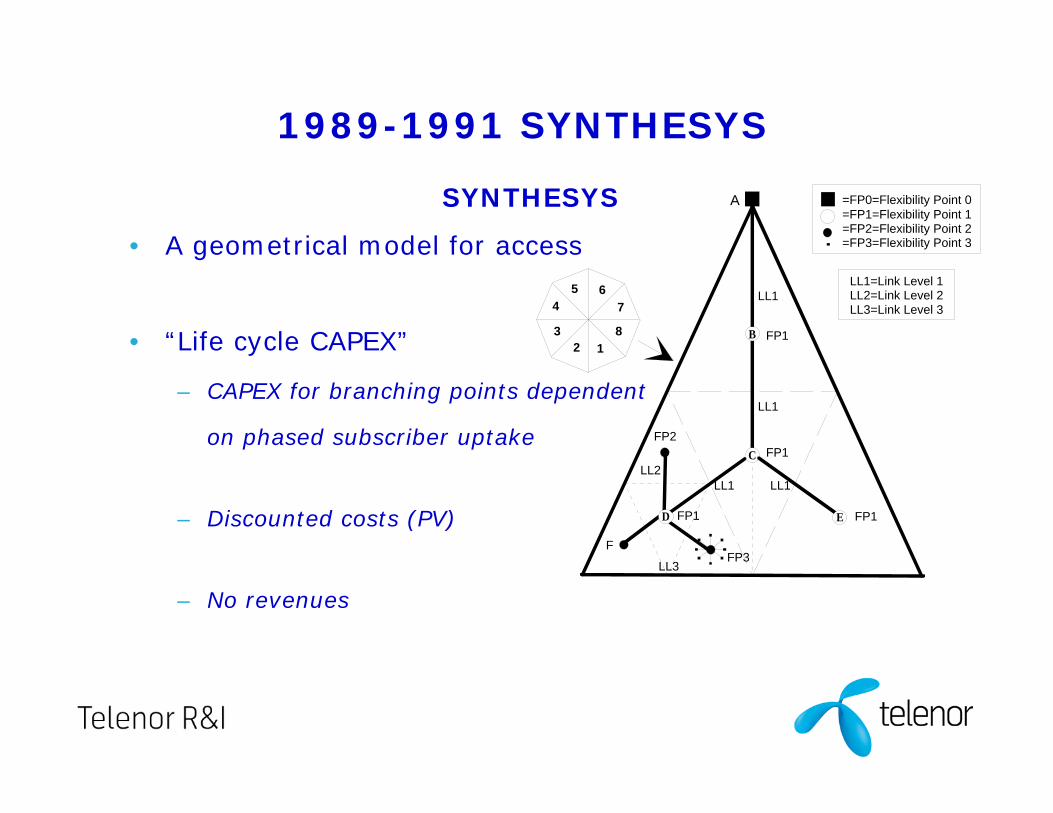
1989-1991 SYNTHESYS
SYNTHESYS
• A geometrical model for access
• “Life cycle CAPEX”
– CAPEX for branching points dependent
on phased subscriber uptake
– Discounted costs (PV)
– No revenues
=FP0=Flexibility Point 0=FP1=Flexibility Point 1=FP2=Flexibility Point 2=FP3=Flexibility Point 3
LL1=Link Level 1LL2=Link Level 2LL3=Link Level 3
LL1
A
LL1
LL1LL1
FP1
FP1
FP1FP1
FP2
FP3LL3
LL2
123
45 6
7
8 B
C
D
F
E
EU / Research projects with development of techno-economic methodology and tool
• RACE I / R1044: Integrated broadband communications development and implementation strategies 1989-1991
• RACE 2087/TITAN: Tool for Introduction scenarios and Techno-economic studies for the Access Network1992-1996
• AC226/OPTIMUM: Optimized Network Architectures for Multimedia Services 1996-1998
• AC364/TERA: Techno-Economic Results from ACTS 1998-2000
• IST-2000-25172/TONIC: TecnO-ecoNomICs of IP optimised networks and services 2000-2002
The methodology and tool has been used in many technical telecommunication projects in the different EU research programs as well as in national projects by the partners
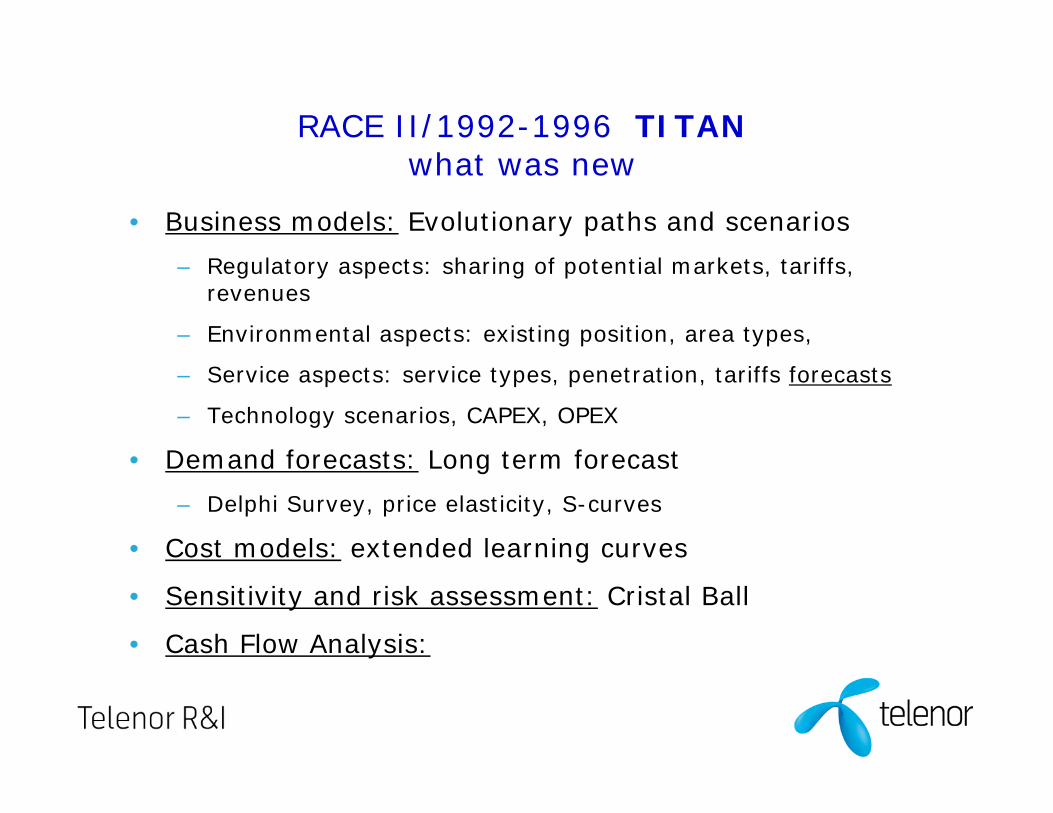
RACE II/1992-1996 TITANwhat was new
• Business models: Evolutionary paths and scenarios
– Regulatory aspects: sharing of potential markets, tariffs, revenues
– Environmental aspects: existing position, area types,
– Service aspects: service types, penetration, tariffs forecasts
– Technology scenarios, CAPEX, OPEX
• Demand forecasts: Long term forecast
– Delphi Survey, price elasticity, S-curves
• Cost models: extended learning curves
• Sensitivity and risk assessment: Cristal Ball
• Cash Flow Analysis:
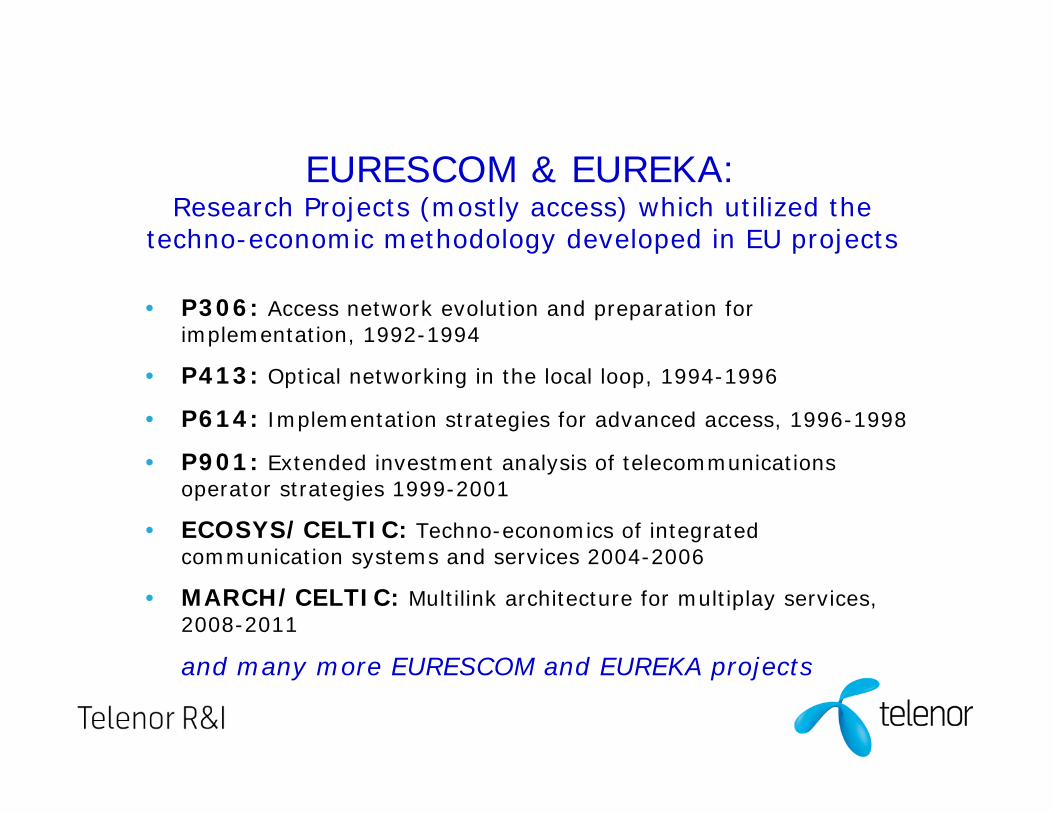
EURESCOM & EUREKA: Research Projects (mostly access) which utilized the
techno-economic methodology developed in EU projects
• P306: Access network evolution and preparation for implementation, 1992-1994
• P413: Optical networking in the local loop, 1994-1996
• P614: Implementation strategies for advanced access, 1996-1998
• P901: Extended investment analysis of telecommunications operator strategies 1999-2001
• ECOSYS/CELTIC: Techno-economics of integrated communication systems and services 2004-2006
• MARCH/CELTIC: Multilink architecture for multiplay services, 2008-2011
and many more EURESCOM and EUREKA projects
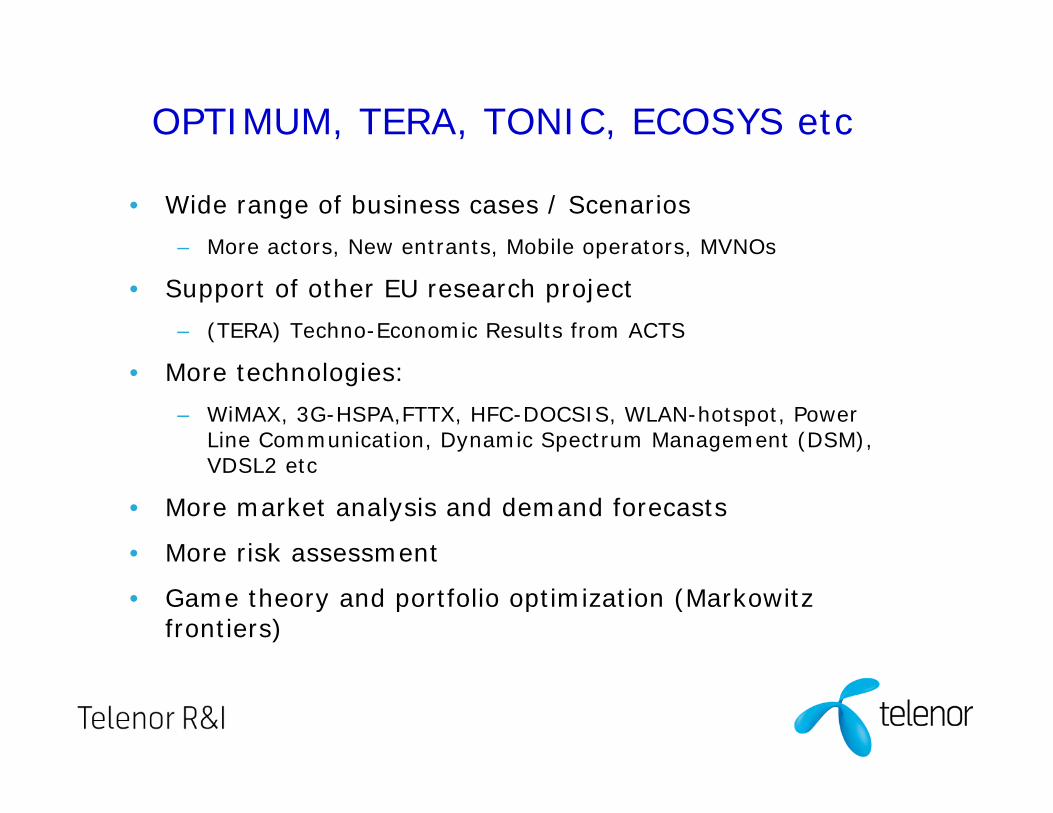
OPTIMUM, TERA, TONIC, ECOSYS etc
• Wide range of business cases / Scenarios
– More actors, New entrants, Mobile operators, MVNOs
• Support of other EU research project
– (TERA) Techno-Economic Results from ACTS
• More technologies:
– WiMAX, 3G-HSPA,FTTX, HFC-DOCSIS, WLAN-hotspot, Power Line Communication, Dynamic Spectrum Management (DSM), VDSL2 etc
• More market analysis and demand forecasts
• More risk assessment
• Game theory and portfolio optimization (Markowitz frontiers)
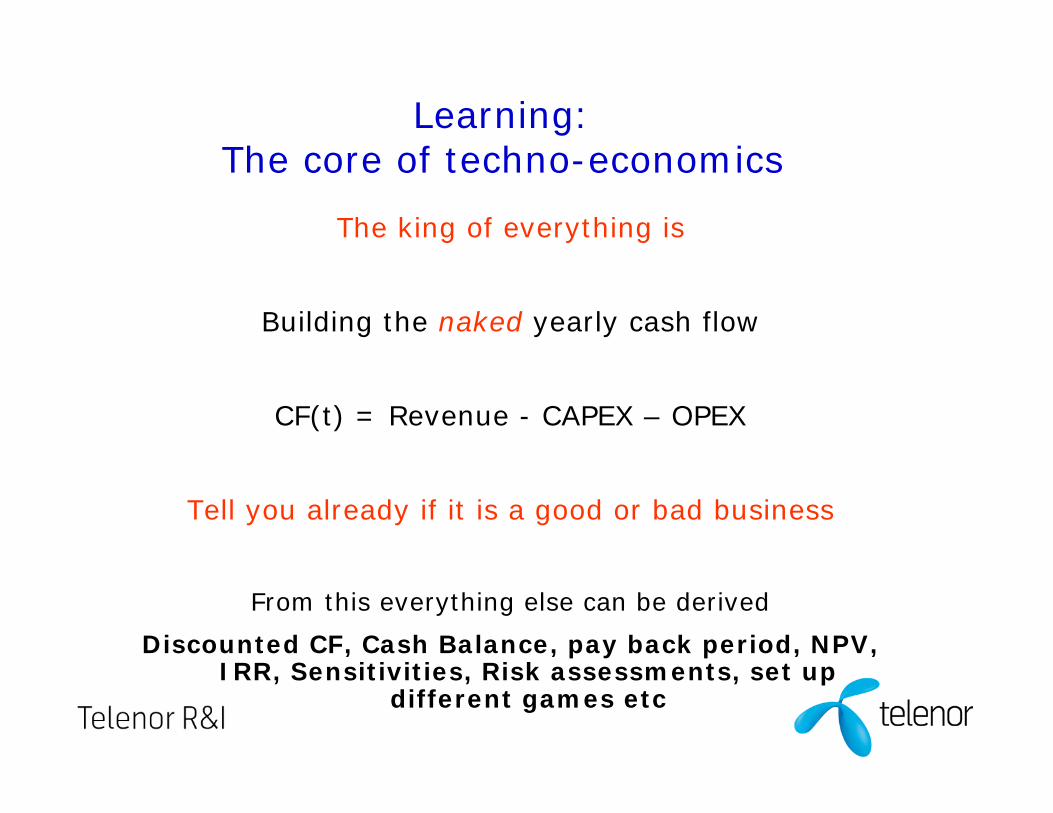
Learning:The core of techno-economics
The king of everything is
Building the naked yearly cash flow
CF(t) = Revenue - CAPEX – OPEX
Tell you already if it is a good or bad business
From this everything else can be derived
Discounted CF, Cash Balance, pay back period, NPV, IRR, Sensitivities, Risk assessments, set up
different games etc
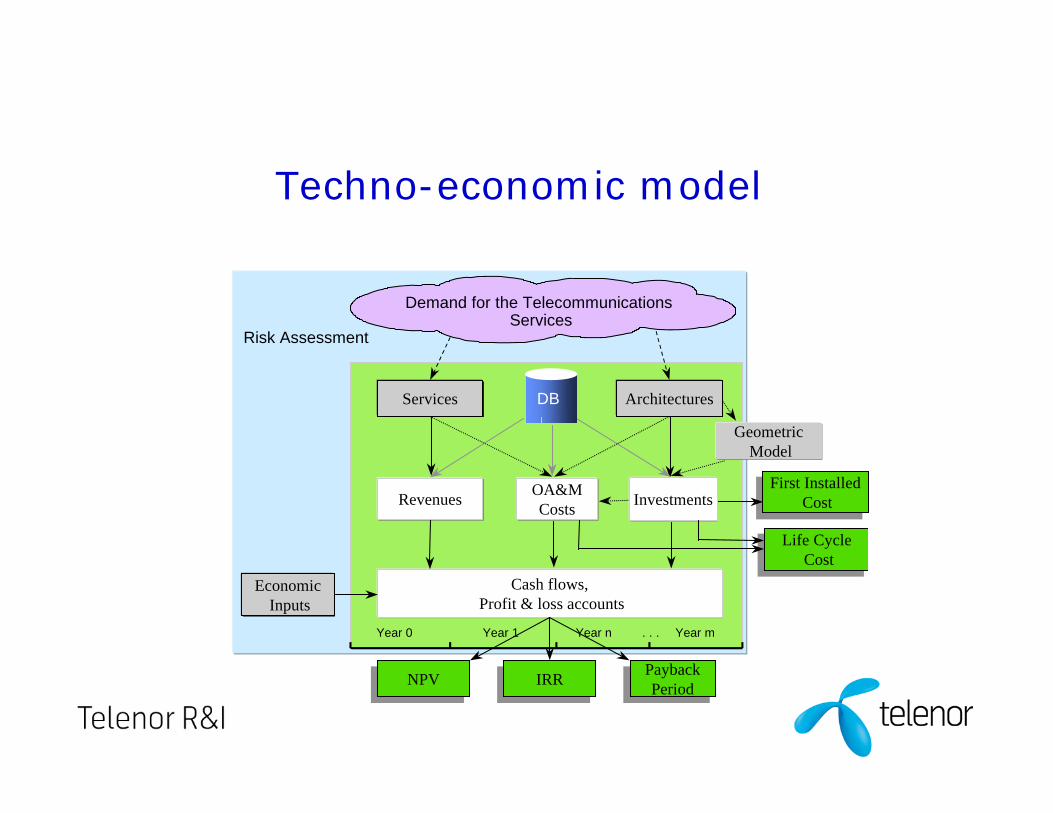
Techno-economic model
NPVNPV IRRIRR PaybackPeriodPaybackPeriod
Economic Inputs
Cash flows, Profit & loss accounts
Geometric Model
Services Architectures
Year 0 Year 1 Year n Year m. . .
Demand for the Telecommunications Services
DB
Revenues OA&MCosts
Life Cycle Cost
Life Cycle Cost
First Installed Cost
First Installed CostInvestments
Risk Assessment
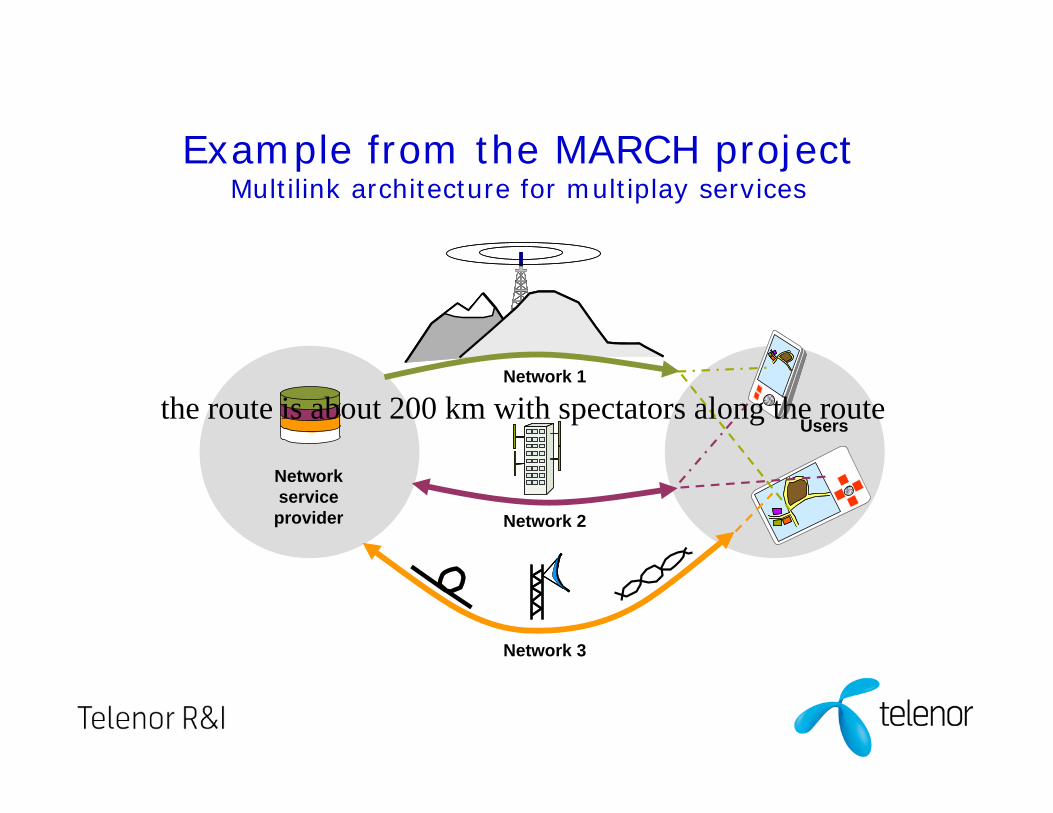
Example from the MARCH project Multilink architecture for multiplay services
Users
Networkservice
provider
Network 1
Network 2
Network 3
the route is about 200 km with spectators along the route
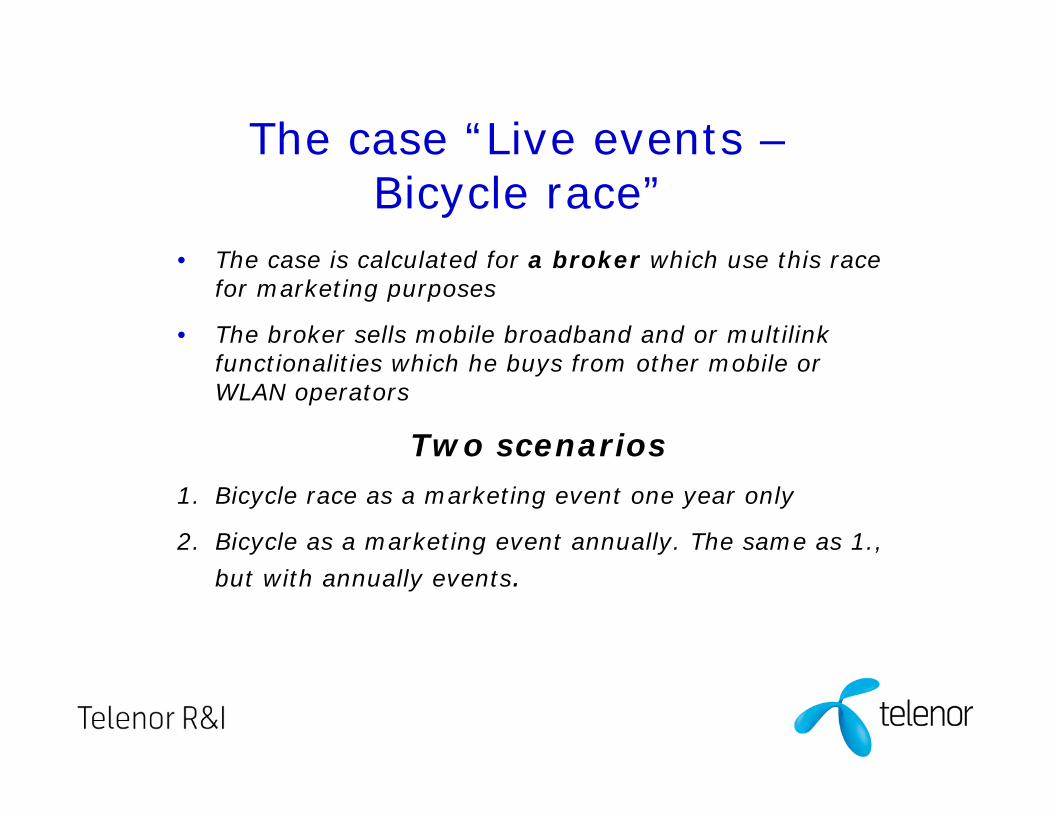
The case “Live events –Bicycle race”
• The case is calculated for a broker which use this race for marketing purposes
• The broker sells mobile broadband and or multilink functionalities which he buys from other mobile or WLAN operators
Two scenarios1. Bicycle race as a marketing event one year only
2. Bicycle as a marketing event annually. The same as 1.,
but with annually events.
The services/ products
• mobile broadband (broker)
• multilink functionalities (mediator)
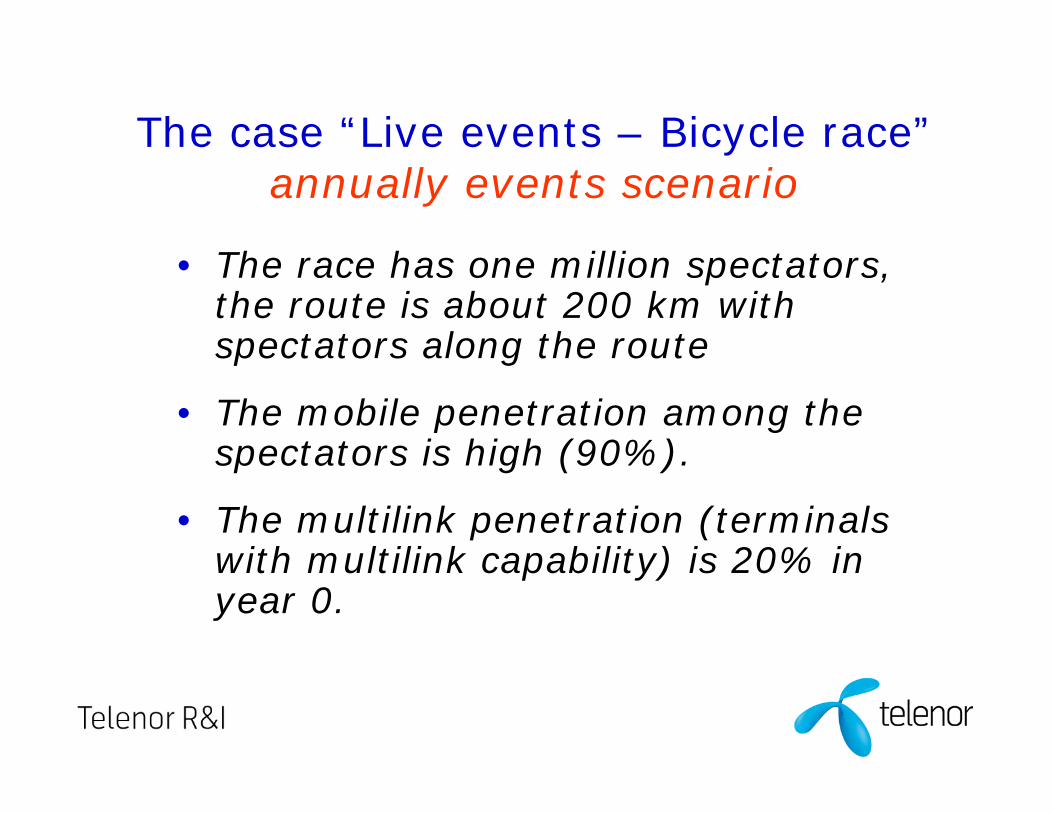
The case “Live events – Bicycle race”annually events scenario
• The race has one million spectators, the route is about 200 km with spectators along the route
• The mobile penetration among the spectators is high (90%).
• The multilink penetration (terminals with multilink capability) is 20% in year 0.
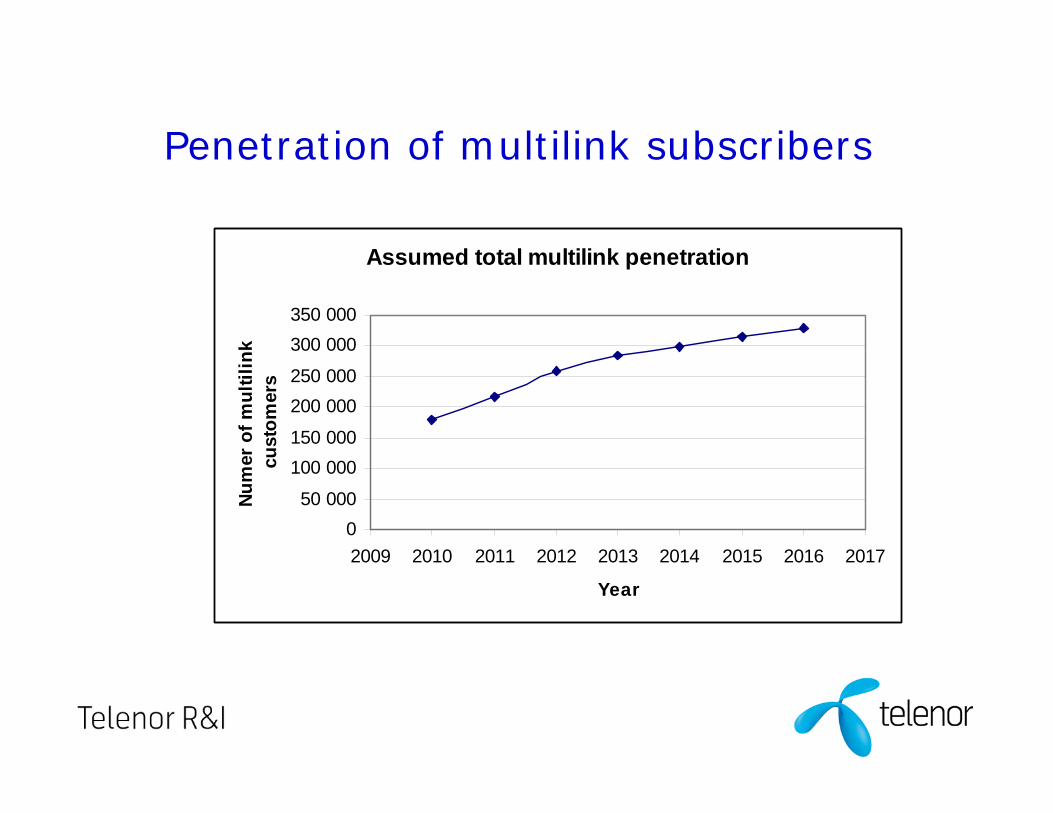
Penetration of multilink subscribers
Assumed total multilink penetration
050 000
100 000150 000
200 000250 000
300 000350 000
2009 2010 2011 2012 2013 2014 2015 2016 2017
Year
Num
er o
f mul
tilin
k cu
stom
ers
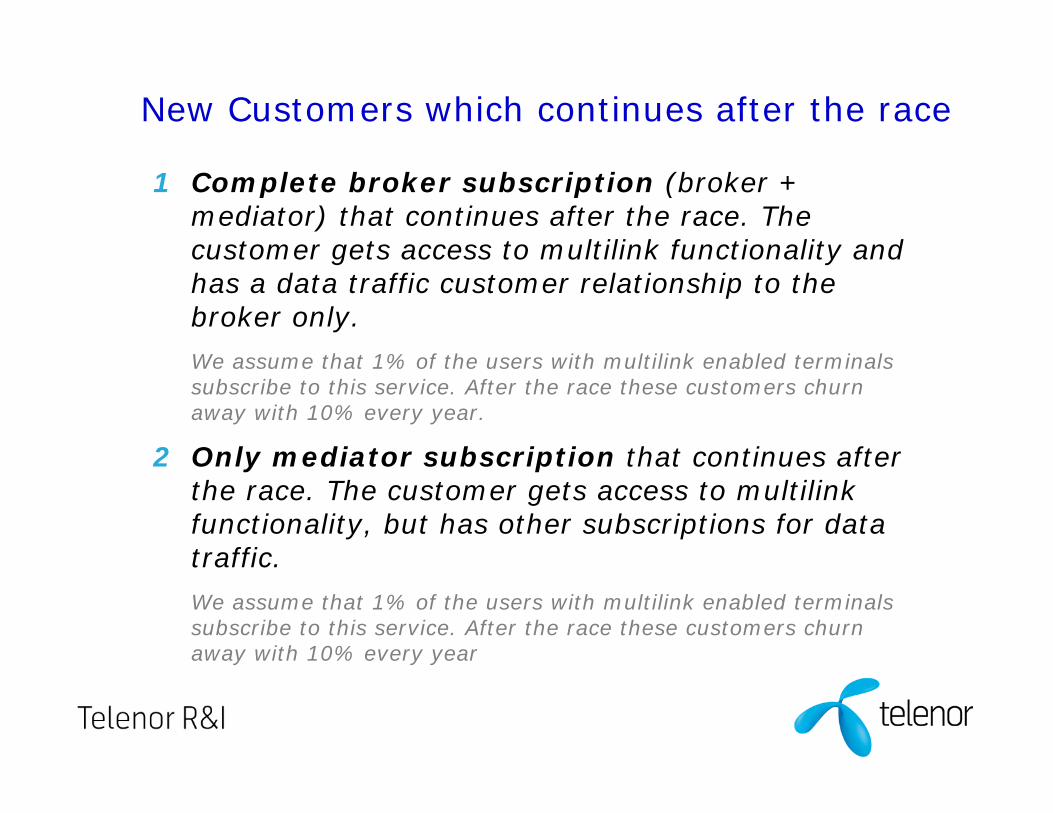
New Customers which continues after the race
1 Complete broker subscription (broker + mediator) that continues after the race. The customer gets access to multilink functionality and has a data traffic customer relationship to the broker only.
We assume that 1% of the users with multilink enabled terminals subscribe to this service. After the race these customers churn away with 10% every year.
2 Only mediator subscription that continues after the race. The customer gets access to multilink functionality, but has other subscriptions for data traffic.
We assume that 1% of the users with multilink enabled terminals subscribe to this service. After the race these customers churn away with 10% every year
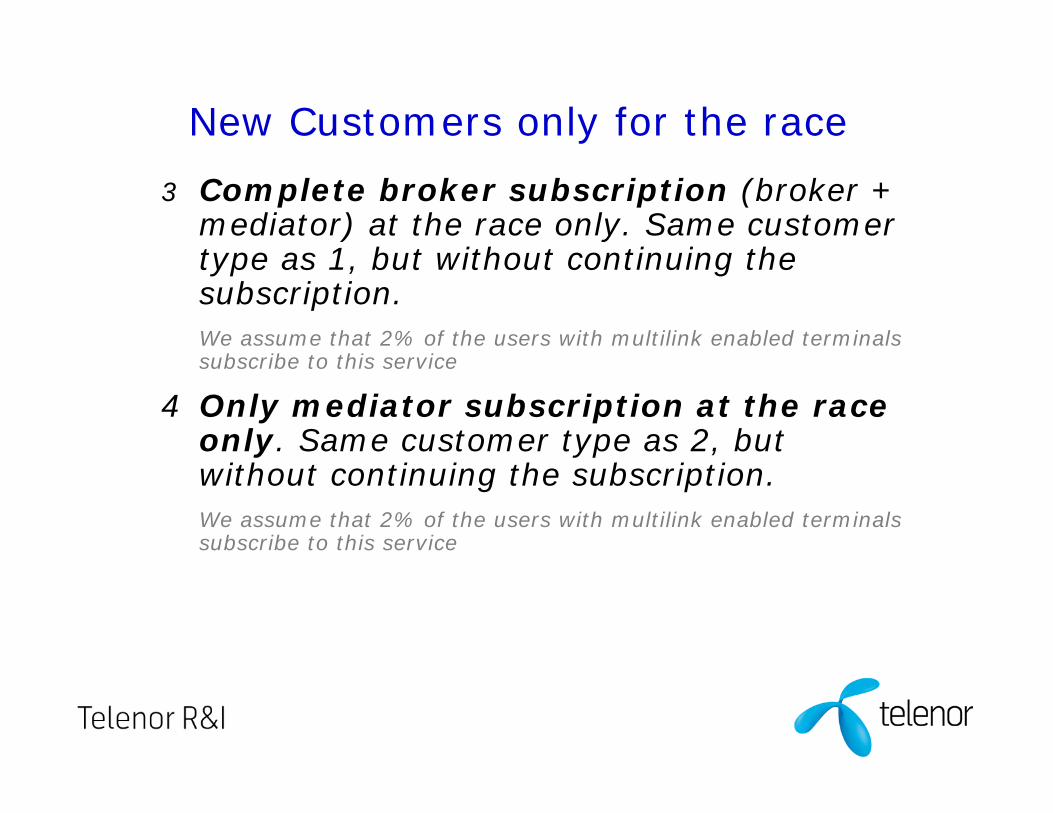
New Customers only for the race
3 Complete broker subscription (broker + mediator) at the race only. Same customer type as 1, but without continuing the subscription. We assume that 2% of the users with multilink enabled terminals subscribe to this service
4 Only mediator subscription at the race only. Same customer type as 2, but without continuing the subscription. We assume that 2% of the users with multilink enabled terminals subscribe to this service
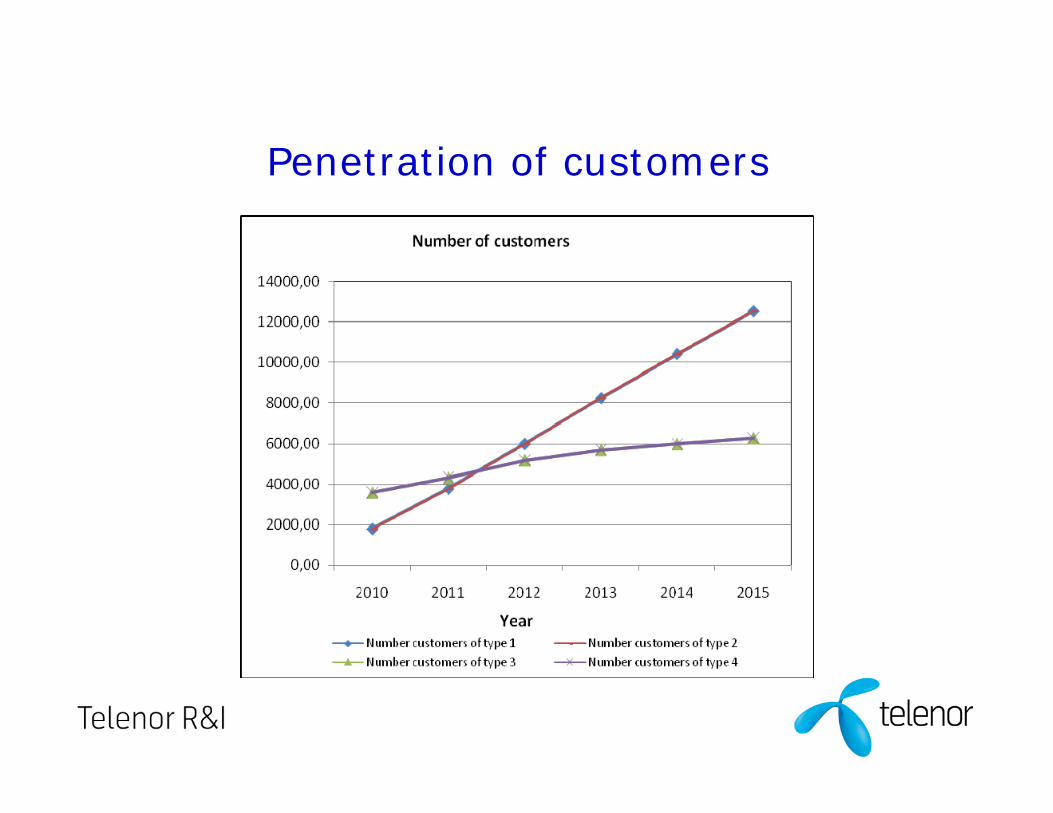
Penetration of customers
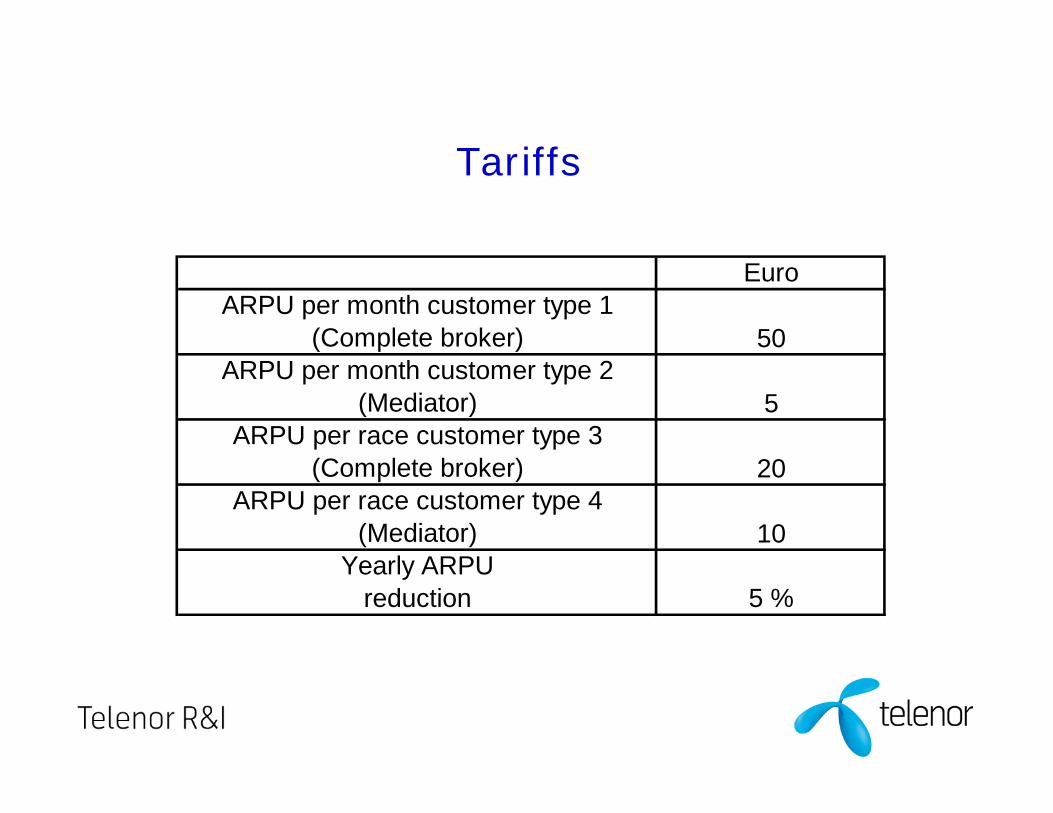
Tariffs
EuroARPU per month customer type 1
(Complete broker) 50ARPU per month customer type 2
(Mediator) 5ARPU per race customer type 3
(Complete broker) 20ARPU per race customer type 4
(Mediator) 10Yearly ARPU
reduction 5 %
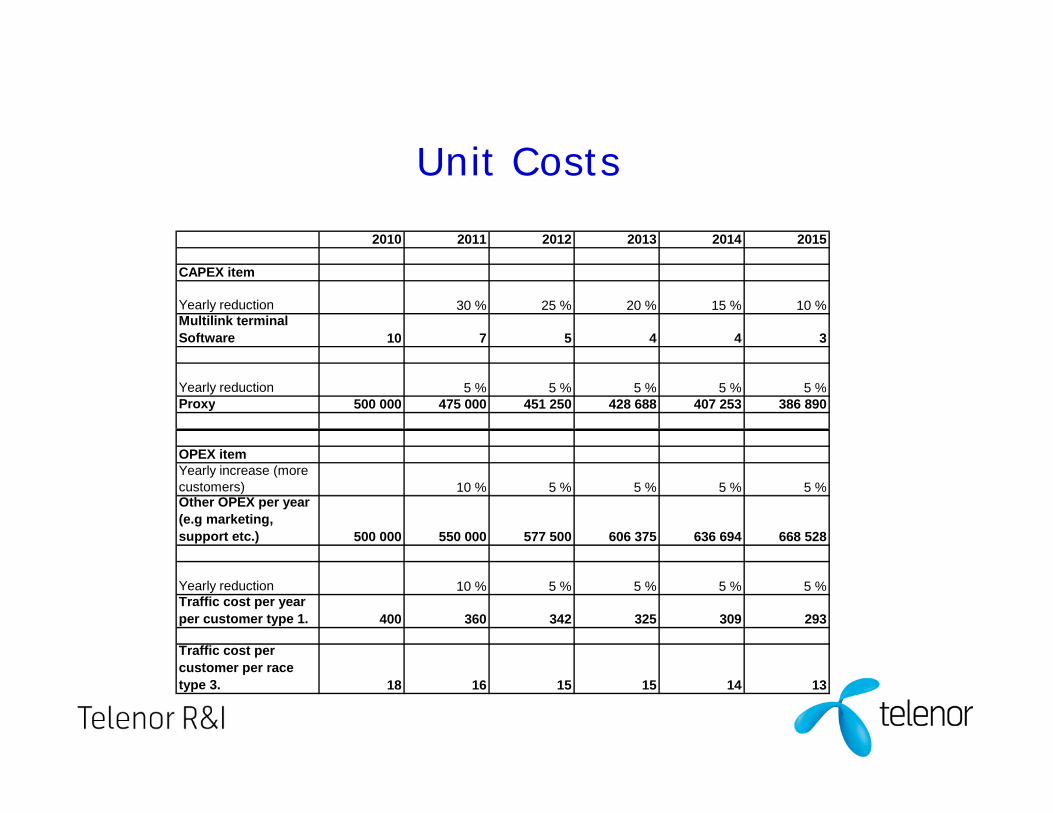
Unit Costs
2010 2011 2012 2013 2014 2015
CAPEX item
Yearly reduction 30 % 25 % 20 % 15 % 10 %Multilink terminal Software 10 7 5 4 4 3
Yearly reduction 5 % 5 % 5 % 5 % 5 %Proxy 500 000 475 000 451 250 428 688 407 253 386 890
OPEX itemYearly increase (more customers) 10 % 5 % 5 % 5 % 5 %Other OPEX per year (e.g marketing, support etc.) 500 000 550 000 577 500 606 375 636 694 668 528
Yearly reduction 10 % 5 % 5 % 5 % 5 %Traffic cost per year per customer type 1. 400 360 342 325 309 293
Traffic cost per customer per race type 3. 18 16 15 15 14 13
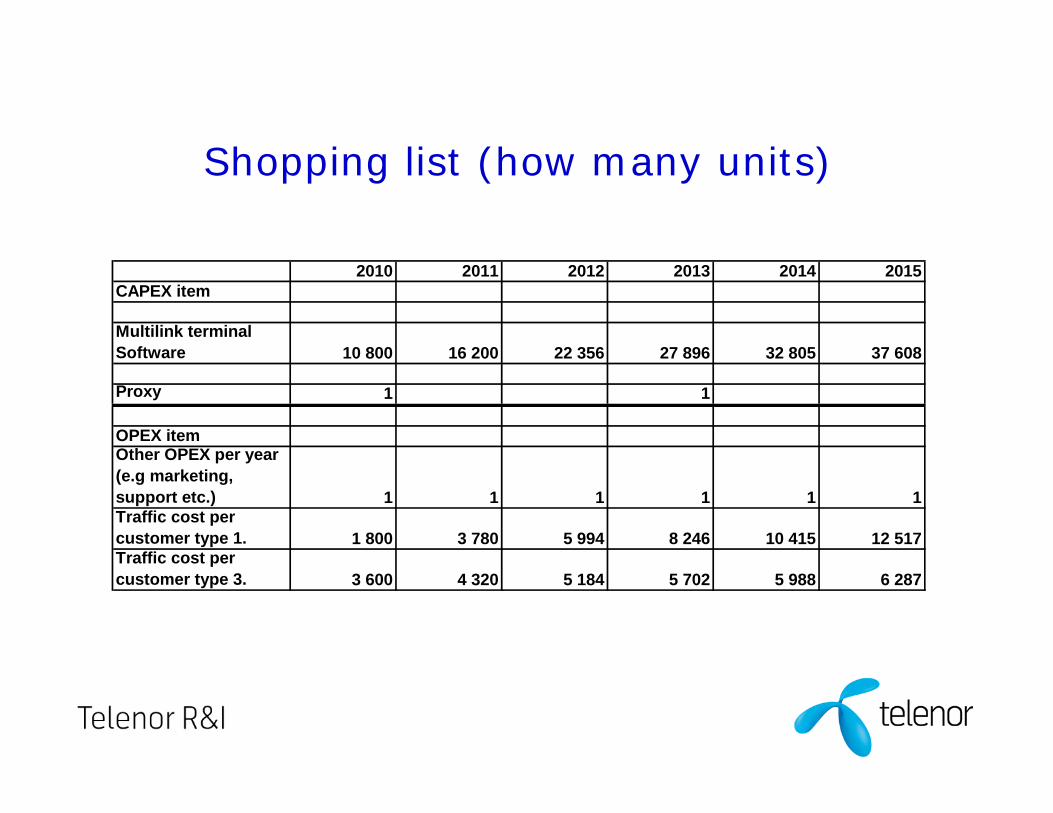
Shopping list (how many units)
2010 2011 2012 2013 2014 2015CAPEX item
Multilink terminal Software 10 800 16 200 22 356 27 896 32 805 37 608
Proxy 1 1
OPEX itemOther OPEX per year (e.g marketing, support etc.) 1 1 1 1 1 1Traffic cost per customer type 1. 1 800 3 780 5 994 8 246 10 415 12 517Traffic cost per customer type 3. 3 600 4 320 5 184 5 702 5 988 6 287
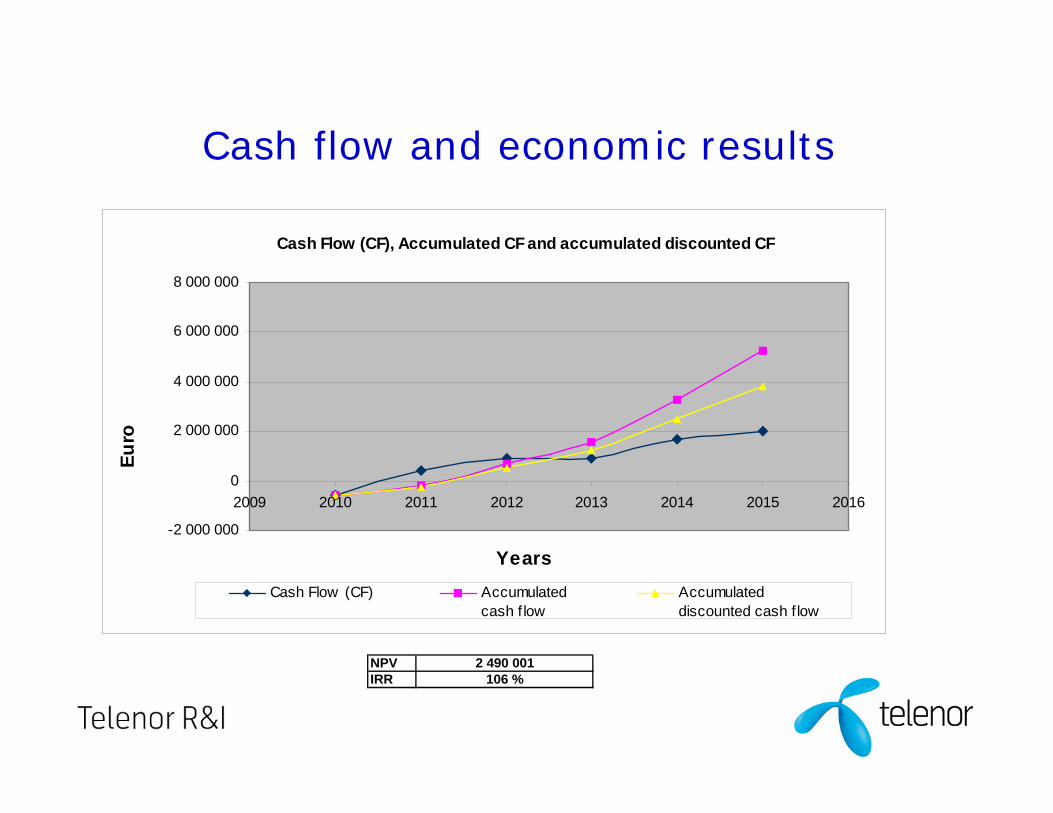
Cash flow and economic results
Cash Flow (CF), Accumulated CF and accumulated discounted CF
-2 000 000
0
2 000 000
4 000 000
6 000 000
8 000 000
2009 2010 2011 2012 2013 2014 2015 2016
Years
Euro
Cash Flow (CF) Accumulated cash f low
Accumulated discounted cash f low
NPV 2 490 001IRR 106 %


![Web view17-02New CTTE Certificate Program – Initial Certificate11-20-2017 [Type text][Type text] [Type text] 17-02New CTTE Certificate Program – Initial](https://img.pdfslide.us/doc/110x75/5a78c1d37f8b9a273b8e65d1/web-view17-02new-ctte-certificate-program-initial-certificate11-20-2017-type.jpg)