Embed Size (px)
Citation preview

Brodogradnja/Shipbilding/Open access Volume 72 Number 3, 2021
29
Hartono Yudo
Serliana Yulianti
Ovin Ranica Pratiwi
Tuswan Tuswan
http://dx.doi.org/10.21278/brod72303 ISSN 0007-215X
eISSN 1845-5859
THE CONVERSION STRATEGY FROM LANDING CRAFT TANK
INTO LIVESTOCK CARRIER: AN OVERVIEW OF TECHNICAL
EVALUATION AND ECONOMICAL BENEFIT
UDC 629.5.083.6:629.5.015.1: 629.5.015.2:629.5.017.2
Original scientific paper
Summary
The conversion of Landing Craft Tank into Livestock Carrier as an alternative solution
was conducted by performing technical and economic assessments. The conversion analysis of
LCT vessels to Livestock Carrier was achieved by performing layout rearrangement, stability
test, seakeeping, and resistance test to measure the technical change occurring due to the
modification. The economic added-value analysis was conducted by calculating the payback
period to determine the estimated time needed to recover the cost of an investment. The result
showed that the conversion of LCT ships has a good technical assessment. The intact and
damage stability performance qualifies the standard criteria given by the IMO standard. The
motion result qualifies the standard according to the type of vessel in terms of heave, pitch, and
roll motions. Moreover, the resistance of the Livestock Carrier is reduced due to a decrease in
displacement and draft. In terms of economic assessment, the Livestock Carrier conversion
project qualifies for investment projects and improves the use-value and economy of a business
segment.
Key words: ship conversion; Landing Craft Tank; Livestock Carrier; seakeeping;
resistance; stability; investment analysis.
1. Introduction
The Landing Craft Tank (LCT) ship was designed to carry combat and heavy equipment
during World War II. LCT is a type of ship used by the British and United States Navy to land
tanks onshore [1]. To comprehend the safety aspect based on the decision of the Directorate
General of Sea Transportation of Indonesia, LCT ships are forbidden to be used as ferry
transportation. LCT is prohibited from being used in shipping activities. To anticipate losses
due to the operational prohibition of LCT, a function modification is needed.
One alternative to solve the problem is the conversion of LCT vessels into Livestock
Carrier. Due to the lengthy sailing period required to carry cattles between islands, the vessel
should be designed specifically in order to provide dependable services for animal welfare even

Hartono Yudo, Serliana Yulianti, The Conversion Strategy From Landing Craft Tank Into Livestock Carrier:
Ovin Ranica Pratiwi, Tuswan Tuswan An Overview of Technical Evaluation and Economical Benefit
30
under adverse conditions during sea transportation [2]. Based on data obtained from the Animal
Husbandry Statistic book in 2017, the livestock population increases every year. According to
the Directorate General of the Ministry of Cross and Sea Transportation, transportation using
Livestock Carrier pays more attention to animal welfare. This is evidenced by the decrease of
livestock depreciation by 8-10% compared to transportation using cargo ships, which caused
depreciation above 13%. Therefore, to reduce damnification of ship owners due to the
prohibition of using LCT as a mode of sea transportation and the increasing population of
livestock, the conversion of LCT ships to livestock vessels for the transportation facility of live
animals (sheep, cattle, pigs, goats, etc.) is an alternative solution [3].
Several technical and economic aspects need to be considered for conversion purposes to
perform in operation with maximum profit. The shape of the hull underwater will affect the
fluid flow characteristics around the ship, representing ship resistance. Ships consume a
considerable amount of fuel to provide necessary propellant force to overcome resistance in
their movement. Several studies have been conducted to reduce the resistance and powering on
the ship's hull during operation by modifying the hull form [4-6]. The assessment of ship
conversion in order to obtain high-level stability performance is also one of a crucial aspect.
The stability during operation must fulfill the requirement of IMO standards. In addition to
resistance and stability aspects, another essential aspect is its ability to maintain its position in
water. It is challenging to improve the intrinsic seakeeping performance of a ship once it has
been designed. Rolling, pitching, and heaving motion responses will have an impact on comfort,
safety, and maneuverability. Aside from technical aspects, it is also crucial to conduct an
economic investigation to ensure the ship conversion has an economic added value. Moreover,
structural aspect in service during ship conversion is a crucial aspect to investigate the
behaviour of the ship’s structure in terms of stress level and other safety criteria in all considered
load cases. Jurišić & Parunov [7] conducted a strength assessment during conversion from
general cargo ships to cement carriers. The analysis of longitudinal and local strength, and FE
analysis of primary supporting members were conducted in all considered load cases. It can be
found that the structural responses have satisfied Croatian Register of Shipping rule
requirements.
Although the number of studies has risen considerably, the comprehensive evaluation in
the technical and economic aspects regarding the ship conversion from LCT tank to Livestock
Carrier is limited, especially in Indonesia. In this case, the ship conversion is evaluated by
conducting technical measurements, including redesigning the ship layout, measuring the ship's
structural weight, and considering the ship’s performances numerically, including resistance
test, stability, and ship motion. Moreover, the economic aspect is measured by calculating the
feasibility level of LCT vessels after being converted into livestock vessels in the case of
shipping from Kumai Port to Tanjung Perak Port, Surabaya.
2. Theoretical background and method
The ship conversion scenario was conducted by analyzing the technical and economic
aspects. In the technical aspect, the initial step was the complete realignment of the LCT layout
by adding some compartments on the main deck to transport the animals. The next step was
calculating the lightweight and deadweight tonnage as an input to perform further technical
analysis. The performance analysis, including the measurement of ship resistance and
powering, ship stability, and motion, was calculated numerically in the technical analysis. The
financial approach method included calculating NPV, IRR, and PP. Results were evaluated in
the economic added-value study.
The Conversion Strategy From Landing Craft Tank Into Livestock Carrier: Hartono Yudo, Serliana Yulianti
An Overview of Technical Evaluation and Economical Benefit Ovin Ranica Pratiwi, Tuswan Tuswan
31
2.1 Intact and damage stability calculation
Ship operation required a high level of ship stability, so stability calculation was essential
for providing safety guidelines [8,9]. The fundamental concept of the state of stability is based
on the equilibrium condiction depending on the relation between the center of gravity and the
center of buoyancy. In this study, a stability test was performed numerically using Maxsurf
Stability software for both intact and damage stability analysis. For the intact stability analysis,
the test procedure was initially performed by defining all rooms/ compartments by adding the
type of room, permeability, specific gravity, fluid type and compartment dimension of both ship
types. The second step was done by defining the load case by setting the unit mass of each
component, longitudinal arm, and transversal vertical arm. In this case, there are three loading
conditions based on the difference in the quantity of mass of each component. In load case I,
the cargo (truck & livestock) was assumed to be in full load condition. The consumable
components such as fuel oil, freshwater, lubrication oil and provision were set in full load
(100%). The cargo was set in full load in load case II, however consumable components were
set in partial condition (50%). In load case III, the cargo was set in full load condition with 10%
of consumable components, as seen in Table 3. The vessel was assumed to be in regular
operation, and the hull was not breached in any compartment. The analysis was performed by
comparing the stability value to the limit standard. IMO MSC.267 (85) [10] was used for intact
stability analysis of LCT and Livestock Carrier, as shown in Table 1.
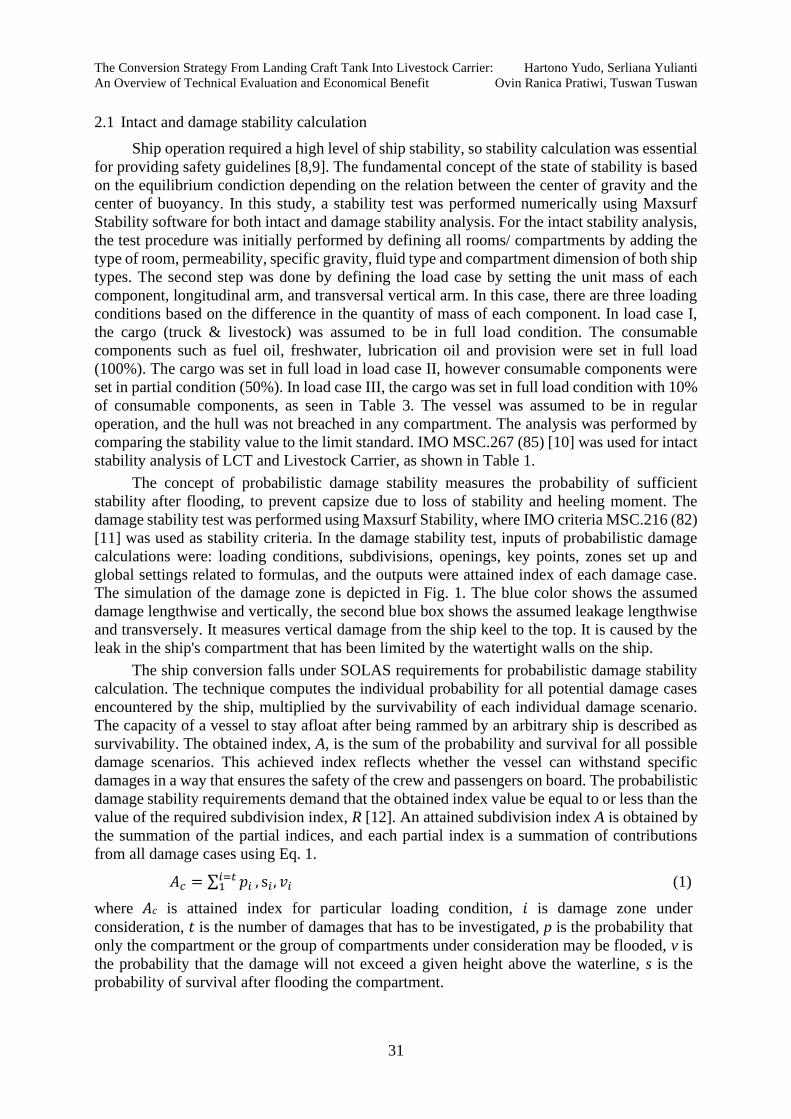
The concept of probabilistic damage stability measures the probability of sufficient
stability after flooding, to prevent capsize due to loss of stability and heeling moment. The
damage stability test was performed using Maxsurf Stability, where IMO criteria MSC.216 (82)
[11] was used as stability criteria. In the damage stability test, inputs of probabilistic damage
calculations were: loading conditions, subdivisions, openings, key points, zones set up and
global settings related to formulas, and the outputs were attained index of each damage case.
The simulation of the damage zone is depicted in Fig. 1. The blue color shows the assumed
damage lengthwise and vertically, the second blue box shows the assumed leakage lengthwise
and transversely. It measures vertical damage from the ship keel to the top. It is caused by the
leak in the ship's compartment that has been limited by the watertight walls on the ship.
The ship conversion falls under SOLAS requirements for probabilistic damage stability
calculation. The technique computes the individual probability for all potential damage cases
encountered by the ship, multiplied by the survivability of each individual damage scenario.
The capacity of a vessel to stay afloat after being rammed by an arbitrary ship is described as
survivability. The obtained index, A, is the sum of the probability and survival for all possible
damage scenarios. This achieved index reflects whether the vessel can withstand specific
damages in a way that ensures the safety of the crew and passengers on board. The probabilistic
damage stability requirements demand that the obtained index value be equal to or less than the
value of the required subdivision index, R [12]. An attained subdivision index A is obtained by
the summation of the partial indices, and each partial index is a summation of contributions
from all damage cases using Eq. 1.
𝐴𝑐 = ∑ 𝑝𝑖𝑖=𝑡1 , s𝑖 , 𝑣𝑖 (1)
where 𝐴𝑐 is attained index for particular loading condition, 𝑖 is damage zone under
consideration, 𝑡 is the number of damages that has to be investigated, p is the probability that
only the compartment or the group of compartments under consideration may be flooded, v is
the probability that the damage will not exceed a given height above the waterline, s is the
probability of survival after flooding the compartment.
Hartono Yudo, Serliana Yulianti, The Conversion Strategy From Landing Craft Tank Into Livestock Carrier:
Ovin Ranica Pratiwi, Tuswan Tuswan An Overview of Technical Evaluation and Economical Benefit
32
Table 1 IMO Stability Criteria
Fig. 1 Simulation of damage zone in 12 different compartments, presented by blue color.
2.2 Seakeeping analysis
Potential flow theory is used to build computer programs that estimate the motion
response of a floating structure. ANSYS AQWA, which includes a three-dimensional panel
code to calculate linear wave forcing and ship motion characteristics in the frequency domain,
is a popular tool for computing RAOs [13]. It is critical to accurately estimate ship motion in a
complicated maritime environment during the ship design process [14, 15]. Ship motion
behavior was divided into six degrees of freedom along the X, Y, and Z axes and divided into
rotational and translational movements. Heaving is the ship motion parallel to the Z-axis, and
when heaving occurs, the ship experiences vertical ups and downs caused by waves. Rolling is
the ship's movement around the longitudinal axis or X-axis. When rolling occurs, the right side
of the ship moves to the left side of the ship, which repeats alternately [16]. Pitching is defined
as rotation along a transverse axis comparable to an axis parallel to the Y-axis. This is a typical
maneuver that causes the ship's bow and stern to go up and down.
The seakeeping analysis was conducted by CFD-Based software using the hydrodynamic
diffraction method. The modeling of the body hull is the first step in determining the response
behavior of the LCT and Livestock Carrier. In general, a panel model is used to define the body
surface geometry and mass distribution, followed by a description of the environment. The ship
was assumed to operate in Java sea conditions (Kumai Port to Tanjung Perak Port) at wave
height 1.25 m and forward speed of 5.14 m/s. In the setting of domain geometry, the body
shape, movements, forces, and other hydrodynamic parameters were defined using space
coordinate systems. The axes system for hydrodynamic analysis were as follows: X-axis is
positive towards bow from aft perpendicular (AP-frame 0). From the ship's centerline, the Y-
axis is pointed to the portside. The Z-axis is positive upwards from the base line. The model
Code Criteria IMO Criteria Unit
267(85)
Ch2
Area 0 to 30 3.151 m.deg
Area 0 to 40 5.156 m.deg
Area 30 to 40 1.718 m.deg
GZmax at 30 or greater 0.200 m
Angle of GZmax 25 deg
Initial GMt 0.150 m
The Conversion Strategy From Landing Craft Tank Into Livestock Carrier: Hartono Yudo, Serliana Yulianti
An Overview of Technical Evaluation and Economical Benefit Ovin Ranica Pratiwi, Tuswan Tuswan
33
has a thickness of 0 m and is cut across the waterline (draft). The origin of the global coordinate
is at LCG in the X-direction, CL in the Y-direction, and KG from the sea surface in the Z-
direction. As a result, all hydrodynamic quantities were calculated at the center of gravity. In
setting the domain, the basin was set at 5 x LWL in length, 1.5 x LWL in width, and 2 x LWL
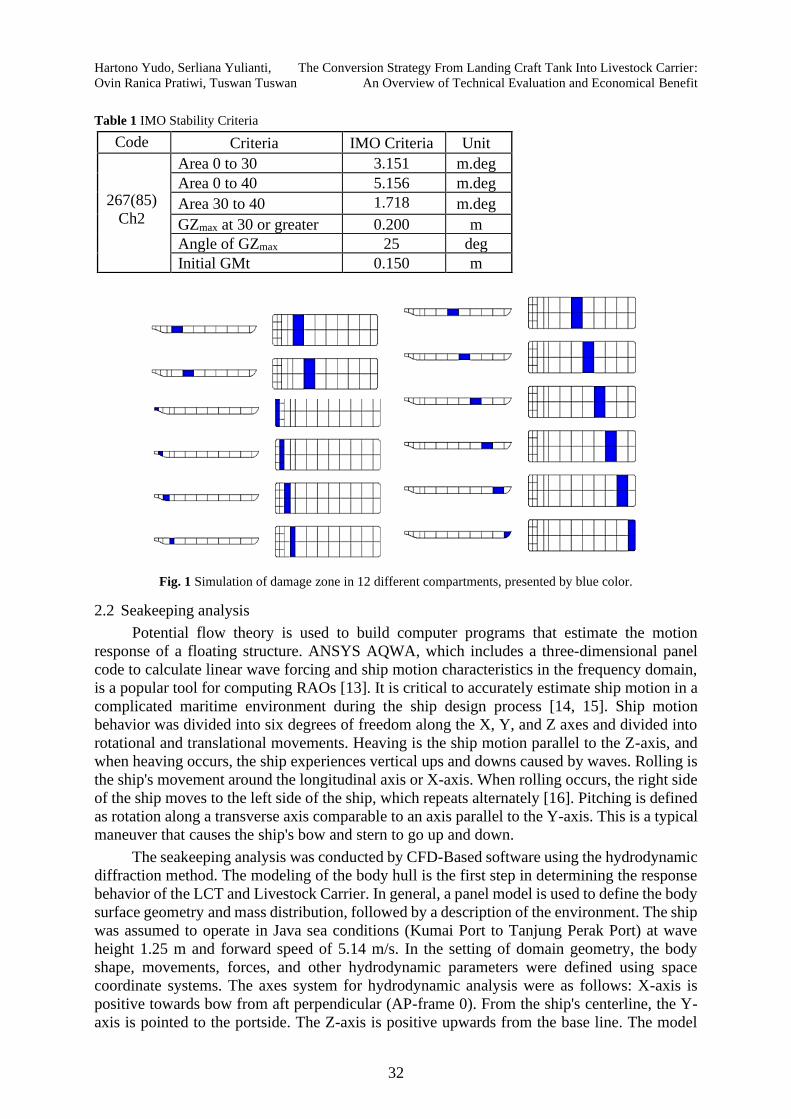
in water depth. A range of wave frequencies were considered in the calculation of the RAOs at
five different waves heading, including following sea (0o), stern quartering sea (45o), beam sea
(90o), bow quartering sea (135o), and head sea (180o). The illustration of five different wave
heading angles is depicted in Fig. 2.
Fig. 2 Heading angle of the ship against wave
2.3 Resistance calculation
The fluid force was applied to a body in motion in order to counteract its motion. The
component of fluid forces operated parallel to the body's axis of motion [16,17]. RT denotes
total resistance, and various components of resistance are defined below. Total resistance is the
summary of all drag components work, including friction resistance, wave resistance,
appendages resistance, and air resistance. The resistance value affects several factors, including
ship velocity, wetted surface area, and hull form. In this case, the ship's resistance is predicted
by comparing two different methods: analytical and numerical methods. In the analytical
method, in simple terms, the total ship resistance RT can be obtained by adding up all the
components of the resistance components working on the ship, which include friction
resistance, wave resistance, and air resistance. General formulation of resistance using the
Holtrop method can be expressed with the equation as following [18]:
RT = RF (1 + K1) + RAPP + RW + RB + RTR + RA (2)
where 𝑅𝐹 is the frictional resistance according to the ITTC-1957 friction formula; 1 + 𝐾1 is the
form factor describing the viscous resistance of the hull form in relation to 𝑅𝐹, 𝑅𝐴𝑃𝑃 is the
resistance of appendages, 𝑅W is the wave-making and wave-breaking resistance, 𝑅𝐵 is the
additional pressure resistance of bulbous bow near the water surface, 𝑅𝑇𝑅 is the additional
pressure resistance of immersed transom stern and 𝑅𝐴 is the model-ship correlation resistance.
The second approach was based on the computer-based numerical method. The use of
numerical simulation appears as the most straightforward approach with much less time and
cost compared to an experimental test [19]. In this case, a numerical test was conducted with
speed ranging from 0 knots to 10 knots using the Holtrop-based method for relatively large
sized vessels. Moreover, a power calculation was set using 65% efficiency. The analysis was
Hartono Yudo, Serliana Yulianti, The Conversion Strategy From Landing Craft Tank Into Livestock Carrier:
Ovin Ranica Pratiwi, Tuswan Tuswan An Overview of Technical Evaluation and Economical Benefit
34
done by comparing the resistance and power values between the LCT ship and Livestock
Carrier.
2.4 Economic added value analysis
Economic added-value analysis was used to determine the feasibility level of LCT vessels
after being converted into livestock vessels. The method used in this research was a financial
approach that includes calculating NPV, IRR, and PP [20].
The net present value (NPV) is the calculation outcome used to determine the current
value of a future stream of payments. It takes into consideration the time worth of money and
may be used to evaluate similar investment options. The NPV is calculated using a discount
rate determined from the cost of capital necessary to make the investment, and any project or
investment with a negative NPV should be avoided. NPV formula is expressed as:
𝑁𝑃𝑉 = 𝑅𝑡
(1+𝑖)𝑡 (3)
where 𝑅𝑡 is the net cash flow at time t, i is the discount rate, and t is the time of the cash flow.
When computing IRR, the projected cash flows for a project or investment are provided, and
the NPV is set to zero. The initial cash investment for the initial period will be equal to the
present value of the investment's future cash flows. Once established, the internal rate of return
is generally compared to a corporate hurdle rate or cost of capital. The project is a solid
investment if the IRR is greater than or equal to the cost of capital. IRR formula is expressed as:
IRR= i1+ NPV1
NPV1-NPV2 (i1-i2) (4)
where i1 is the lower discount rate chosen, i2 is the higher discount rate chosen, and NPV1 is
equal with NVP at i2, and NPV2 equals NVP at i1. The payback period is the amount of time
needed to return the initial cost of an investment. It determines the number of years it would
take to repay a project's initial expenditure. As a result, as a capital planning tool, the payback
time is used to compare projects and calculate the number of years required to reimburse the
initial expenditure. Typically, the project with the shortest number of years is chosen. Analysis
of the payback period in the feasibility study also needs to be shown to determine how long the
business/project has taken the investment return, as expressed in Eq. 5 [20].
PP = n + (a-b)/(c-b) x 1 year (5)
where n is the last year in which the amount of cash flow still cannot cover the initial investment,
a is the amount of initial investment, b is the cumulative amount of cash flows in the previous
year, and c is the cumulative amount of cash flows in the previous following year.
3. Result and discussion
3.1 Overview of the conversion of LCT ship
In the phase of ship design, preliminary design and concept design is two important
phases. In the first phase, preliminary design is addressed to determine ship's principal
characteristic and powering in accordance with national and international maritime rules. The
primary ship particular dimensions and hull form characteristics (hull form hydrostatics,
powering, weight components, stability, ship motion), are required in the first phase [21].
In this case, the conversion of the LCT ship into a Livestock Carrier is firstly conducted
by rearranging the ship layout due to cargo change. The conversion of the LCT ship is done
by changing the cargo from 38 trucks (988 tons) to livestock of 292 cows dan 228 goats (125
tons). The conversion is accomplished by adding the main deck and bridge deck for livestock,

The Conversion Strategy From Landing Craft Tank Into Livestock Carrier: Hartono Yudo, Serliana Yulianti
An Overview of Technical Evaluation and Economical Benefit Ovin Ranica Pratiwi, Tuswan Tuswan
35
water ballast tanks, and freshwater tanks. The illustration of layout rearrangement is depicted
in Fig. 3.
Fig. 3 Layout rearrangement from LCT ship to Livestock Carrier.
As a consequence, there is lightweight addition of cattle pen steel and equipment in total
of 325 tons. In deadweight components, there is an increase of water ballast tank to 208 ton and
freshwater tank to 145 ton. The comparison of LWT and DWT components are illustrated in
Fig. 4 and Fig. 5. Table 2 shows the comparison of the main dimension between the two ships.
It can be seen that the size of LOA, B, and H remains constant, but the draft of Livestock Carrier
is decreased to 2.03 m. From data in Table 2, the LWT of the Livestock Carrier is higher due
to the weight addition of cattle pen and livestock equipment. In contrast, the DWT of the LCT
ship is greater than the Livestock Carrier due to the weight of the truck/ vehicle. Consequently,
the displacement of LCT is higher, around 183 tons, compared to Livestock Carrier. The layout
change, hydrostatic data, and weight calculation can be used as input data for further technical
and economic calculations.
Water ballast tank Freshwater tank

Hartono Yudo, Serliana Yulianti, The Conversion Strategy From Landing Craft Tank Into Livestock Carrier:
Ovin Ranica Pratiwi, Tuswan Tuswan An Overview of Technical Evaluation and Economical Benefit
36
Fig. 4 LCT and Livestock Carrier comparison of deadweight tonnage
Fig. 5 LCT and Livestock Carrier comparison of lightweight tonnage
Table 2 Main dimension of LCT ship and Livestock Carrier
3.2 Result of intact and damage stability
Initially, IMO regulation regulated the gross tonnages have to be no less than 500 GT to
calculate intact and damage stability [22]. The GT calculation shows that the gross tonnage of
LCT is 853 tons, and the gross tonnage of Livestock Carrier is 1553 tons. It can be concluded
that the gross tonnage of two ships fulfill the minimum standard. In this case, the result of
intact stability analysis of the two ship types using the IMO standard was evaluated. The
parameter of each load case between LCT and Livestock Carrier are depicted in Table 3.
120
58
0
988
0
72
145
208
0
125
0 200 400 600 800 1000 1200
Fuel Oil
Freshwater
Water ballast
Truck carrier
Livestock
Mass (tons)
Livestock Carrier
LCT
0 200 400 600 800
Hull weight
Superstructure
Cattle pen
Crane
Outfitting and
equipment
Livestock
equipment
Mass (tons)
Livestock Carrier
LCT
Parameters LCT Livestock
Carrier
Displacement (tons) 2254 2060
LWT (m) 848 1234
DWT (m) 1406 826
LOA (m) 70.00 70.00
B (m) 17.00 17.00
T (m) 2.40 2.03
H (m) 3.60 3.60
Vs (knots) 10 10

The Conversion Strategy From Landing Craft Tank Into Livestock Carrier: Hartono Yudo, Serliana Yulianti
An Overview of Technical Evaluation and Economical Benefit Ovin Ranica Pratiwi, Tuswan Tuswan
37
Table 3 The load case difference between Landing Craft Tank and Livestock-Carrier ship stability items
Parameters
Landing Craft Tank Livestock Carrier
Load
case I
Load
case II
Load
case III
Load
case I
Load
case II
Load
case III
Displacement (tons) 2254 2046 1880 2060 1710 1430
DWT (tons) 1406 1198 1032 826 476 196
LWT (tons) 848 848 848 1234 1234 1234
LCG (m) 31.9 31.7 31.6 32.7 31.8 30.9
KG (m) 2.8 3.2 3.4 2.7 3.4 3.9
Table 4 Results of intact stability
IMO Criteria Unit
LCT Model Livestock Model
Status Load
case I
Load
case II
Load
case
III
Load
case
I
Load
case
II
Load
case
III
Area 0 to 30 m.deg 69.03 71.17 74.28 74.63 78.4 83.2 Pass
Area 0 to 40 m.deg 101.68 103.76 107.78 110.1 113.4 117.97 Pass
Area 30 to 40 m.deg 32.65 32.6 33.5 35.46 34.97 34.74 Pass
Max GZ at 30 or
greater m 3.4 3.43 3.53 3.68 3.68 3.69 Pass
Angle of max GZ deg 26.4 25.5 25.5 26.4 26.4 25.5 Pass
Initial GM m 10.4 11.1 11.8 11.33 12.76 14.87 Pass
In the result of intact stability, it can be found from Table 4 that the result of LCT ships
with three different load cases fulfills the six stability criteria given by IMO. It can be compared
that the stability of Livestock Carrier has a higher value than stability value of LCT with the
same load case. Moreover, it can be seen that the righting arm (GZ) and the angle of max GZ
of the Livestock Carrier are higher compared to the LCT ship with the same load case. The
maximum righting arm result is proportional to the largest static heeling moment required to
bring the ship back to its upright position. Furthermore, the higher the righting arm, the better
the ship at returning to initial position.
After conducting intact stability analysis, damage stability analysis is needed to measure
the ship's ability on damage conditions. The ship may sink due to flooding of the compartments
when buoyancy cannot return the vessel back to its initial position. In this case, the analysis
was performed using Maxsurf Stability with simulating damage zone in the 12 compartments,
as shown in Fig.1. The permeability value for each compartment is shown in Table 5.
Permeability of a space is the proportion of the immersed volume of that space that water can
occupy.
The damage stability analysis was performed based on the criteria of IMO MSC 261
(82). Ships should be as efficiently subdivided as possible, having regard to the nature of the
intended. The degree of the subdivision should vary with the subdivision length of the ship and
with the service, in such manner that the highest degree of subdivision corresponds with the
ships of greatest subdivision length. The results of the damage stability analysis are shown in
Table 6. The damage stability result qualifies the standard criteria for predetermined LCT and
Livestock Carrier. It can be found from the result that the A index value of LCT and Livestock
Hartono Yudo, Serliana Yulianti, The Conversion Strategy From Landing Craft Tank Into Livestock Carrier:
Ovin Ranica Pratiwi, Tuswan Tuswan An Overview of Technical Evaluation and Economical Benefit
38
Carrier is 0.879, and the R index value is 0.576. The results are all declared acceptable because
of A ≥ R.
Table 5 Permeability value for each compartment [12].
No Spaces Permeability
1 Appropiated to stores 0.6
2 Occupied by accomodation 0.95
3 Occupied by machinery 0.85
4 Void spaces 0.95
5 Intended for liquids 0 or 0.95
Table 6 Results of damage stability
Model A
Factor
R
Factor
Index
A
Index
R Status
LCT 0.977 0.5768 0.879 0.576 Pass
Livestock Carrier 0.977 0.5768 0.879 0.576 Pass
3.3 Result of intact and damage stability
This section conducts seakeeping analysis by comparing the RAO curve of heaving,
rolling, and pitching between two ship types at five different wave headings. The analysis is
achieved with speed of 10 knots and wave height of 1.25, representing the operation condition
of the route from Kumai Port to Tanjung Priok Port, as seen in BMKG data [23]. Analysis of
ship motion was done using Ansys Aqwa software using the hydrodynamic diffraction method.
Ships moving at sea level are almost always in oscillatory motion. There are three types of
movements of purely oscillatory motions, namely heave, roll, and pitch, which causes the ship
to experience a restoring force to return the equilibrium position. The ship's motion response
to regular waves is depicted in the RAO value, as shown in Fig. 6-8.
The comparison between the RAO heaving values of LCT and Livestock Carrier is shown
in Fig. 6. The curve shows the peak of the RAO value curve for the LCT, which is at encounter
frequency of 0.427 rad/s with an RAO value of 1.01 in the following sea condition. Moreover,
the peak of heave RAO of LCT ships is at encounter frequency of 0.427 rad/s with an RAO
value of 1.01 m/m on following sea conditions. The RAO heaving value of the Livestock
Carrier ship is slightly more significant than the RAO heaving value of the LCT. It can be seen
that the seakeeping performance due to the heaving motion of the Livestock Carrier has similar
behavior. From the results in Fig. 8, heave motion caused by the following sea undergoes a
superposition due to more than two peaks of wave frequency, causing the ship to move
unevenly.
The comparison between the RAO values of the ship pitching is shown in Fig. 7. It can
be analyzed that the pitching motion between the two ships is quite similar. It is caused by
similar hull characteristics of the two ship types. The waves from the head sea and bow
quartering sea experience higher pitch motion than other wave headings. From the result due to
bow quartering sea, the peak of the RAO value of the LCT is at encounter frequency of 1.46rad/s
with an RAO value of 2.73 deg/m. At the same time, the peak of the pitch RAO of Livestock
Carrier is at encounter frequency of 1.4634 rad/s with an RAO value of 2.70 deg/m. Moreover,
a similar phenomenon occurs in the pitch motion in which there is a superposition of more than
two peaks of wave frequency in the following sea conditions.
At last, the comparison between the roll RAO values is shown in Fig. 8. From the curve,
it can be seen that the highest roll motion is experienced due to beam sea conditions. The peak
of roll RAO of LCT is at encounter frequency of 1.57 rad/s with an RAO value of 14.74 deg/m,
The Conversion Strategy From Landing Craft Tank Into Livestock Carrier: Hartono Yudo, Serliana Yulianti
An Overview of Technical Evaluation and Economical Benefit Ovin Ranica Pratiwi, Tuswan Tuswan
39
and the peak of roll RAO of the Livestock Carrier is at encounter frequency of 1.57 rad/s with
an RAO value of 13.07 deg/m. Moreover, the roll RAO due to bow quartering and stern
quartering seas has low motion due to the wave headings of bow quartering and stern quartering
seas. In contrast, it was revealed that there was no motion found due to wave heading from head
sea condition.
a b
Fig. 6 Comparison of heave RAO a) LCT ship b) Livestock Carrier
a b
Fig. 7 Comparison of pitch RAO a) LCT b) Livestock Carrier
a b
Fig. 8 Comparison of roll RAO a) LCT b) Livestock Carrier
In general, the RAO response data can be obtained from the square root of the variances.
These values are needed to easily observe the response behavior. RMS values of heave, roll and
pitch motions of LCT and Livestock Carrier are presented in Table 6. This study uses the RMS
0
0.5
1
1.5
2
2.5
3
0 2 4 6 8 10 12 14 16
RA
O P
itch
(d
eg/m
)
Encounter wave (rad/s)
Following seaStern quarteringBeam seaBow quarteringHead sea
0
0.5
1
1.5
2
2.5
3
0 2 4 6 8 10 12 14 16
RA
O P
itch
(d
eg/m
)
Encounter wave (rad/s)
Following sea
Stern quartering
Beam sea
Bow quartering
Head sea
0
3
6
9
12
15
18
0 1 2 3 4 5 6 7 8 9 10
RA
O R
oll
(d
eg
/m)
Encounter wave (rad/s)
Following seaStern quarteringBeam seaBow quarteringHead sea
0
3
6
9
12
15
0 1 2 3 4 5 6 7 8 9 10
RA
O R
oll
(d
eg/m
)
Wave Encounter (Rad/s)
Following seaStern quarteringBeam seaBow quarteringHead sea

Hartono Yudo, Serliana Yulianti, The Conversion Strategy From Landing Craft Tank Into Livestock Carrier:
Ovin Ranica Pratiwi, Tuswan Tuswan An Overview of Technical Evaluation and Economical Benefit
40
criteria of NATO STANAG 4154 for LCT vessels [24] and AMSA regulations for Livestock
Carrier [25]. It was found that the RMS value of heave, roll, and pitch in all evaluated wave
headings of both two ship types fulfill the RMS criteria. It can be seen that the RMS values of
LCT and Livestock Carrier have similar values. It is due to the similar hull shapes with different
drafts of both ships. Moreover, it was found that the highest heave motion is experienced due to
wave heading from the bow quartering sea. Wave heading from beam seas is found to affect the
roll motion significantly. In pitch motion, the wave heading from the following sea has the
highest response.
Table 7 RMS value between LCT and Livestock Carrier
Item Wave
Heading
RMS
Criteria LCT
RMS
Criteria
Livestock
Carrier Unit
RMS
Heave
motion
0˚
-
0.2156
0.67
0.2155 m
45˚ 0.2307 0.2307 m
90˚ 0.2767 0.2768 m
135˚ 0.2785 0.2781 m
180˚ 0.273 0.2725 m
RMS
Roll
motion
0˚
4
0.0024
8
0.0026 deg
45˚ 0.2739 0.2717 deg
90˚ 0.4775 0.469 deg
135˚ 0.3459 0.3494 deg
180˚ 0.0051 0.0057 deg
RMS
Pitch
motion
0˚
1.5
0.379
2.3
0.3786 deg
45˚ 0.3635 0.3627 deg
90˚ 0.0164 0.0164 deg
135˚ 0.0236 0.0236 deg
180˚ 0.0211 0.0211 deg
3.4 Result of resistance test
The comparison of the resistance test is discussed in this section. For validation purposes,
ship resistance was calculated using both analytical and numerical methods using the Holtrop
regression method at a speed of 10 knots (Froude number 0.2). Table 8 shows the comparison
result of the validation test of both LCT and Livestock Carrier. It can be seen that the validation
test shows a good agreement between the two different methods, represented by a small error
below 10%. Furthermore, the validity and effectiveness of the numerical hull shape model can
be achieved for both ship types.
The resistance and powering test results at speed in the range of 0-10 knots can be seen
in Fig. 9. The result given in Fig. 9 shows a decrease in resistance after converting to Livestock
Carrier. Analyzed at a speed of 10 knots, the resistance of LCT was 83.8 kN, and the resistance
of Livestock Carrier was 75.6 kN. It can be interpreted that the resistance of Livestock Carrier
is slightly lower, about 9.8% than LCT ship. It is caused by the decrease of the draft of Livestock
Carrier from 2.4 m to 2.03 m due to ship conversion. As a result, the wetted surface area is
slightly lower than the LCT ship. To conduct further analysis, the power needed for both ship
types was calculated at a speed in the range of 0-10 knots with 65% efficiency. It was found
that the powering of Livestock Carrier also decreased as the resistance value decreased. The
powering value of the LCT ship was 663 kW, and the Livestock Carrier was 598 kW at a speed

The Conversion Strategy From Landing Craft Tank Into Livestock Carrier: Hartono Yudo, Serliana Yulianti
An Overview of Technical Evaluation and Economical Benefit Ovin Ranica Pratiwi, Tuswan Tuswan
41
of 10 knots. It was found that the power of Livestock Carrier was slightly lower, about 9.8%
than LCT ship.
Table 8 Validation of numerical and theoretical methods
Model Froud
Number
Resistance at 10 knots (kN)
Analytical Numerical Error
LCT 0.2 78.1 83.8 6.80%
Livestock Carrier 0.2 72.2 75.6 4.49%
a b
Fig. 9 The result of LCT and Livestock Carrier a) resistance b) powering
3.5 Economic value-added analysis of ship conversion
Economic analysis is important to determine the time duration needed to cover the
investment costs of the ship conversion. Based on the research results on the Livestock Carrier,
a list of LCT operations is presented in Table 9. Ship operating costs are costs incurred in
connection with the operation of a vessel on a voyage. The amount of ship operating costs per
trip is IDR. 201,418,949.00. It is planned that the boat within a year will work for 48 voyages.
Therefore, the costs to be incurred per year are as shown in Table 10. It is assumed that the
Livestock Carrier plans to carry livestock with a cattle load capacity of 87.6 tons and a goat
load capacity of 21.67 tons. The ideal age for beef cattle is between 12-18 months. The
Lambourne formulation and weight calculations of goats was done using the Danish
formulation for calculating the weight of livestock. It was calculated that the cow weight is 300
kg, cow load capacity is 292 cows, goat weight is 55 kg, goat load capacity is 394 goats, so the
capacity of the cattle that can be transported is 292 cows and 394 goats. The cost of cargo varies
by the distance of the ship traveled to the port. The ship is planned to sail from Kumai Port -
Tanjung Perak Port, Surabaya. It is assumed that the total operation cost per year is IDR
10,536,109,594, and the total livestock rate per year is IDR 13,510,656,00.
In this livestock ship investment project, the economic value has a turnover in 15 years.
It is necessary to calculate the value of the IRR with 48 trips per year. Prior to calculating the
IRR, the total discount rate (dR) must be analyzed. The NPV value of 15% is used because it
produces positive results to execute the project. During 15 years of the estimated project life,
the present cost value is obtained between the discount rate dR values of 15% and 40%. Due
to this reason, the Internal Rate of Return (IRR) value is only calculated between the dR 15%
and dR 40%. Calculation of the Internal Rate of Return (IRR) of 18.92 % is accepted if the IRR
is greater than the discount rate (dR).
The payback period is the length of time it takes to return an investment. Suppose the
proceeds each year from a project are the same for the life of the project. In that case, the total
investment cost of IDR 7,905,980,500 produces an IRR value of 18.92%. The calculated
0
10
20
30
40
50
60
70
80
90
0 0.05 0.1 0.15 0.2
Res
ista
nce
(kN
)
Froude number
LCT
Livestock
0
100
200
300
400
500
600
700
0 0.05 0.1 0.15 0.2
Po
wer
(k
W)
Froude number
LCT
Livestock

Hartono Yudo, Serliana Yulianti, The Conversion Strategy From Landing Craft Tank Into Livestock Carrier:
Ovin Ranica Pratiwi, Tuswan Tuswan An Overview of Technical Evaluation and Economical Benefit
42
turnover and estimate of the ship's durability is 15 years. The payback period or capital costs
are covered for 2.25 years.
Table 9 List of operational ship cost
Table 10 List of ship costs per year
Table 11 Calculation of the Present Value of Cost (PVC) at several discounts rate values (dR)
4. Conclusion
Some technical and economic assessments due to the conversion of LCT into Livestock
Carrier was performed. The general arrangement layout was firstly changed due to the
difference in cargo types. The deadweight and lightweight tonnages were then calculated to
compare the weight due to conversion purposes. Several results of the technical assessment
were obtained. The stability of both intact and damage scenarios were analyzed numerically,
and results were found to qualify with the IMO standard in all evaluated shipping operation
scenarios. The ship motion analysis shows that seakeeping performance at the shipping
conditions from Kumai Port to Tanjung Priok Port represented by RAO of heave, pitch, and
roll motion have similar characteristics. The comparative result from five different wave
headings shows that pitch motion is significantly influenced by bow quartering and head sea.
The roll motion is influenced substantially by beam sea. As the result of the resistance and
Operational items Usage cost The number of costs
(per voyage)
Fuel Oil IDR 7,500 litre IDR 148,061,184
Lubricating Oil IDR 26,000 litre IDR 19,506,072
Freshwater IDR 50 litre IDR 5,585,286
Salaries and crew allowances IDR 235,000 day/person IDR 13,696,094
Animal Feed IDR 7,500 day/tail IDR 14,570,313
Total IDR 201,418,950
Total trip for one year IDR 9,668,109,594
Outlay The amount of cost (per year)
Annual trip fee IDR 9,668,109,594
Port fee IDR 48,000,000
Maintenance fee IDR 520,000,000
Assurance IDR 300,000,000
Total Outlay IDR 10,536,109,594
Operational items Usage cost The number of costs
(per voyage)
Fuel Oil IDR 7,500 litre IDR 148,061,184
Lubricating Oil IDR 26,000 litre IDR 19,506,072
Freshwater IDR 50 litre IDR 5,585,286
Salaries and
allowances for crew IDR 235,000 day/person IDR 13,696,094
Animal Feed IDR 7,500 day/tail IDR 14,570,313
Total IDR 201,418,950
Total trip for one year IDR 9,668,109,594
The Conversion Strategy From Landing Craft Tank Into Livestock Carrier: Hartono Yudo, Serliana Yulianti
An Overview of Technical Evaluation and Economical Benefit Ovin Ranica Pratiwi, Tuswan Tuswan
43
powering test, the Livestock Carrier is more ideal when sailing on the sea with less resistance,
and the engine is predicted to be more optimal with less power required.
Moreover, the results of the economic calculation due to the conversion of cargo purposes
are decent and comply with the investment project criteria. It was found that the Present Net
Value (NPV) value was 15% and the Internal Rate of Return (IRR) was 18.92%. On the other
hand, the Payback Period (PP) calculation value requires a cost of capital of 2.25 years to return
the conversion project cost.
Acknowledgments
The work is supported by the Laboratory of Computer-Aided Design at the Department
of Naval Architecture, Universitas Diponegoro, which provides research tools and facilities.
The authors gratefully acknowledge the support.
REFERENCES
[1] Misbah, M.N.; Setyawan, D.; Dananjaya, W.M. (2018). Construction strength analysis of landing craft
tank conversion to passenger ship using finite element method. IOP Conference Series: Journal of Physics:
Conference Series, 974, 012054. https://doi.org/10.1088/1742-6596/974/1/012054
[2] Zakki, A.F.; Windyandari, A.; Suharto; Ramadhan, A. (2019). Comparative Study on Catamaran and
Monohull for The Hull Form Design of Livestock Carrier. Journal of Engineering Science and
Technology, 14(4), 2074-2089.
[3] Andric, J.; Piric, K.; Prebeg, P.; Andrisic, J.; Dmitrasinovic, A. (2018). Structural design and analysis of
a large ‘open type’ Livestock Carrier. Ships and Offshore Structures, 1-15.
https://doi.org/10.1080/17445302.2018.1429159
[4] Bahatmaka, A.; and Kim, D.J. (2019). Numerical approach for the traditional fishing vessel analysis of
resistance by CFD. Journal of Engineering Science and Technology, 14(1), 207-217.
[5] Julianto, R.I.; Prabowo, A.R.; Muhayat, N.; Putranto, T.; Adiputra, R. Investigation of hull design to
quantify resistance criteria using Holtrop’s regression based method and Savitsky’s mathematical model:
a study case of fishing vessels. Journal of Engineering Science and Technology, 16(2), 1426-1443.
[6] Chrismianto, D.; Tuswan; Manik, P. (2018). Analysis of resistance and effective wake friction due to
addition of stern tunnels on passenger ship using CFD. IOP Conference Series Earth and Environmental
Science, 135(1), 012008. https://doi.org/10.1088/1755-1315/135/1/012008
[7] Jurišić, P.; Parunov, J. (2021). Structural aspect during conversion from general cargo ships to cement
carriers. Brodogradnja, 72(2), 37-55. https://doi.org/10.21278/brod72203
[8] Manderbacka, T.; Themelis, N.; Bačkalov, I.; Boulougouris, E.; Eliopoulou, E.; Hashimoto, H.;
Konovessis, D.; Leguen, J.F.; González, M.M.; Rodríguez, C.A.; Rosén, A.; Ruponen, P.; Shigunov, V.;
Schreuder, M.; Terada, D. (2019). An overview of the current research on stability of ships and ocean
vehicles: The STAB2018 perspective. Journal of Ocean Engineering, 186, 106090.
https://doi.org/10.1016/j.oceaneng.2019.05.072
[9] Im, N. K.; Choe, H. (2021). A quantitative methodology for evaluating the ship stability using the index
for marine ship intact stability assessment model. International Journal of Naval Architecture and Ocean
Engineering. 13, 246-259. https://doi.org/10.1016/j.ijnaoe.2021.01.005
[10] International Maritime Organization. (2008). Code on intact stability for all types of covered by IMO
instruments resolution. MSC.267(85).
[11] International Maritime Organization. (2006). Resolution MSC.216(82).
[12] SOLAS. (2014). Consolidated edition, International Maritime Organization. London.
[13] Nordforsk. (1987). Assessment of Ship Performance in a Seaway: The Nordic Co-operative Project:
Seakeeping Performance of Ships, Nordforsk.
[14] Prabowo, A.R.; Tuswan, T.; Ridwan R. (2021). Advanced development of sensors’ roles in maritime-
based industry and research: from field monitoring to high-risk phenomenon measurement. Applied
Sciences, 11(1), 3954. https://doi.org/10.3390/app11093954
[15] Nimma, R.B.; Arundeepan, V.; Shashikala, A.P. (2018). Ship motion in viscous flow under irregular
waves. International Journal of Scientific and Engineering Research, 9(4), 8-13.
[16] Poundra, G.A.P.; Utama, I.K.A.P.; Hardianto, D.; Suwasono. (2017). Optimizing trimaran yacht hull
configuration based on resistance and seakeeping criteria. Procedia Engineering, 194, 112-119.
https://doi.org/10.1016/j.proeng.2017.08.124

Hartono Yudo, Serliana Yulianti, The Conversion Strategy From Landing Craft Tank Into Livestock Carrier:
Ovin Ranica Pratiwi, Tuswan Tuswan An Overview of Technical Evaluation and Economical Benefit
44
[17] Tupper, E.C. (2013). Introduction to Naval Architecture, Fifth Edition. Elsevier Ltd.
https://doi.org/10.1016/B978-0-08-098237-3.00001-1
[18] Holtrop, J. (1988). A statistical resistance prediction method with a speed dependent factor. Proceedings
of the Scientific and Methodological Seminar on Ship Hydrodynamics (SMSSH). Varna, Bulgaria.
[19] Tuswan; Zubaydi, A.; Piscesa, B.; and Ismail, A. (2020). Dynamic characteristic of partially debonded
sandwich of ferry ro-ro’s car deck: a numerical modelling. Open Engineering, 10, 424-433.
https://doi.org/10.1515/eng-2020-0051
[20] Abdillah, H.N.; Artana, K.B.; Ariana, I.M.; and Masroeri, A.A. (2018). Technical and Economic Analysis
of LCT (Landing Craft Tank) Vessel Conversion into Non Conventional LNG (Liquid Natural Gas)
Carriers. Proceeding of Marine Safety and Maritime Installation (MSMI 2018), 322-329.
[21] Prabu, C.S.K.; Vishwanath, N.; Prakash, S.O. (2020). Study on the lightship characteristic of merchant
ships. Brodogradnja, 71(3), 37-70. https://doi.org/10.21278/brod71304
[22] Tonnage. (1969). International convention on tonnage measurement of ships.
[23] BMKG-Ocean Forest System, (2021). Significant Wave Height. Retrieved January 1, 2021, from:
https://peta-maritim.bmkg.go.id/ofs/
[24] Standardization agreement (STANAG). (2000). Common Procedures for Seakeeping in the Ship Design
Process. North Atlantic Treaty Organization, Military Agency for Standardization
[25] AMSA (2006). Marine Order 43 (Cargo and cargo handling — livestock).
Submitted: 06.07.2021.
Accepted: 30.08.2021.
Hartono Yudo
Associate Professor, Department of Naval Architecture, Universitas
Diponegoro, Semarang, Indonesia ([email protected])
Serliana Yulianti
Research scholar, Department of Naval Architecture, Universitas Diponegoro,
Semarang, Indonesia
Ovin Ranica Pratiwi
Research scholar, Department of Naval Architecture, Universitas Diponegoro,
Semarang, Indonesia
Tuswan Tuswan
Associate Professor, Department of Naval Architecture, Universitas
Diponegoro, Semarang, Indonesia