Embed Size (px)
Citation preview

Hydrology and Earth System Sciences, 2003,7(5), 755-766
The contribution of soil structural degradation to catchment
flooding: a preliminary investigation of the 2000 floods in England
and Wales
I.P. Holman, J.M. Hollis1 , M.E. Bramley2 and T.R.E. Thompson1
Institute of Water and Environment, Cranfield University, Silsoe. Bedford MK45 4DT, United
Kingdom
1 National Soil Resources Institute, Cranfield University, Silsoe, Bedford, MK45 4DT, UK
2 Environment Agency, Head Office, Aztec West, Almonsbury, Bristol, BS32 4UD
Corresponding author: I.P. Holman
Institute of Water and Environment, Cranfield University, Silsoe. Bedford MK45 4DT, United
Kingdom
Tel: +44 (0)1525 863000
Fax: +44 (0)1525 863344
Email [email protected]
Abstract
During the autumn of 2000, England and Wales experienced the wettest conditions for over 270 years
causing significant flooding. The exceptional combination of both a wet spring and autumn provided
the potential for soil structural degradation. Soils under five common lowland cropping systems
(autumn-sown crops, late-harvested crops, field vegetables, orchards and sheep fattening and livestock
rearing systems) prone to structural degradation were examined within four catchments that
experienced serious flooding.
Soil structural degradation of the soil surface, within the topsoil or at the topsoil/subsoil junction was
observed to be widespread in all five cropping systems, under a wide range of soil types and in all four
catchments. Extrapolation to the catchment scale suggests that soil structural degradation may have
occurred on approximately 40% of the Severn, 30-35 % of the Yorkshire Ouse and Uck catchments
and 20% of the Bourne catchment. Soil structural conditions were linked via Hydrological Soil
Group, Soil condition and Antecedent Rainfall Conditions to SCS Curve Numbers to allow a
preliminary evaluation of the volume of enhanced runoff in each catchment.
Such a response at the catchment-scale is only likely during years when prolonged wet weather and
the timing of cultivation practices lead to widespread soil structural degradation. Nevertheless, an
holistic catchment-wide approach to managing the interactions between agricultural land use and
hydrology, allowing appropriate runoff (and consequent flooding) to be controlled at source, rather
than within the floodplain or the river channel, should be highlighted in catchment flood management
plans.
Keywords
Flooding, soil structure, land management, Curve Number, runoff, agriculture
Introduction
During the autumn of 2000, England and Wales as a whole experienced the wettest conditions
(September to November) for over 270 years (Environment Agency, 2001a). Repeated heavy rainfall
in October and November caused significant, extensive and, in some cases, repeated flooding over

large areas of the country. Over 10,000 homes and businesses were flooded, train services were
cancelled, major motorways closed and power services disrupted (Environment Agency, 2001a).
It was repeatedly suggested in the media that catchments such as the Severn, Yorkshire Ouse and
Medway flooded because the soils were 'saturated' by the first storms in October and were unable to
absorb further rainfall.
Prior to the autumn, the spring and early summer of 2000 were also particularly wet with flooding
occurring in several English regions. Soils which are wet during critical times for land management
operations, such as for ploughing or harvesting, can be prone to compaction and structural damage
(Earl, 1997). Soil structural damage leads to a reduction in soil water storage and infiltration capacity
(Horton et al., 1994), which reduces the inherent ability of the soil to absorb rain, leading to increased
runoff.
The exceptional combination of a wet spring and a wet autumn during 2000, together with long term
changes in farming practice, provided the potential for significant soil structural degradation to have
occurred, even where farmers followed Best Practice (Ministry of Agriculture, Fisheries and Food,
1998; Environment Agency, 2001b) guidelines. If extensive, the resulting increased runoff may have
contributed to the severe floods. This paper describes the results of a survey undertaken to ascertain
the conditions of a range of soils under different cropping systems within catchments that experienced
serious flooding and the possible consequent contribution of these soils to event runoff.
.
Soil hydrological and agronomic background
The speed with which water reaches the river network is strongly influenced by the nature and
condition of the underlying soil (Boorman et al., 1995; U.S. Soil Conservation Service, 1986). A range
of cropping and stock management systems in UK agriculture have the potential to significantly
modify soil hydrology (e.g. Boardman, 1991; Boardman, 1995; Chambers & Garwood, 2000), by

impacting upon soil structural conditions. These impacts mainly result from the need for machinery or
livestock to access land at times when soil is at, or approaching, its wettest season. Five main lowland
agricultural management practices potentially pose a problem:
Cultivation of autumn-sown cereals, oilseed rape and field beans during the autumn when the soil is
‘wetting up’. This can lead to compacted plough layers and, tractor ‘wheelings’ and, particularly in
the case of cereals, fields which are sparsely vegetated over the winter period and prone to capping
(Kwaad, 1994) and erosion (Chambers & Garwood, 2000).
Harvesting operations for late-harvested crops such as maize, sugar beet and main crop potatoes
using heavy machinery during late Autumn and early Winter when the soils are likely to be at their
‘field capacity’ moisture state, leave some, or all of the field surfaces bare, compacted (Arvidsson,
2001) and rutted.
Cultivation of intensive crops of field vegetables where access to the land is often required through
the winter period when soils are likely to be at their wettest. Harvested areas usually remain bare
and compacted over the winter period (Harrod, 1994).
Farming systems with fruit orchards often maintain a minimum of vegetation in the rows between
trees or bushes. The soil surface in these rows is often compacted, leading to a reduced infiltration
capacity (Haynes, 1981), erosion (Boardman and Hazelden, 1986), and exposure to rainfall during
the late autumn and winter periods due to the minimal interception from the trees or bushes.
Lowland sheep fattening and livestock rearing systems. A common practice in sheep fattening
systems is to allow stock to feed on the vegetation left after harvesting sugar beet or to feed on
fodder beet during the autumn and early winter periods when soil surfaces are bare. Also, in areas
where grass growth starts early in the year or persists later in the year, stock may be kept on the
land at times when the soil surface is at its wettest point in the annual hydrological cycle and thus
most susceptible to compaction (Vallentine, 1990).

Methodology
The Severn, Yorkshire Ouse, Bourne and Uck catchments, which all experienced severe flooding
during the late autumn and winter of 2000 / 2001, were selected for study (Holman et al., 2002). The
whole of the smaller catchments of the rivers Uck and Bourne, which are sub-catchments of the
Medway, were investigated. Due to the size of the Severn and the Yorkshire Ouse catchments, field
investigations were focused on three areas of 10 km x 10 km (Figure 1) within each. These areas were
selected as representative of the range of soils and lowland agricultural management practices of the
catchments (Whitfield, 1975; Hollis, 1978; Thompson, 1982; Bradley & Allison, 1985; Allison &
Hartnup, 1981).
Field examination
The selected areas were visited between December 2000 and March 2001, before the soil structural
conditions and associated hydrological effects of that winter (e.g. signs of erosion) were altered by any
spring cultivation. Fields were selected at random from those under the same land management
practice, and were chosen to reflect the approximate proportions of the five identified land
management systems in each area, using a stratified random sampling method (Webster, 1993). The
numbers of fields inspected under each cropping system in each study area are summarised in Table 1.
The percentages of each soil class were fairly representative of those given by the national soil map
(Ragg et al., 1984) particularly in the larger catchments.
Crop, soil surface condition, soil moisture state and the characteristics of the topsoil and upper subsoil
horizons were recorded using standardised soil surveying procedures (Hodgson, 1997). Soil horizon
properties were observed from small trial pits (approximately 30x30x40 cm) enabling a clear
interpretation of soil structure.

Classification of the extent of soil structural degradation
A simple descriptive classification of soil structural degradation was constructed (Table 2). The
following characteristics, identified during the field examination, were used to characterise the ‘soil
degradation features’ present and, based on these, each site was allocated to a soil structural
degradation class according to specific combinations of features as defined in Table 3:
Surface soil condition- the presence of a slaked or capped topsoil indicating that the natural
infiltration capacity of the soil surface has been reduced (National Soil Resources Institute, 2001);
Presence of wheeling or tramlines- the passage of vehicles over the soil surface deforms and
compacts the upper parts of the topsoil, leading to a reduced infiltration capacity and the creation
of preferential pathways for rapid water movement off the land (Chambers & Garwood, 2000;
Evans, 1996);
The extent of poaching- overstocking, or grazing when soil is too wet, leads to poaching and
compaction of the upper topsoil (Vallentine, 1990);
The presence of structural change within, or at the base of, the topsoil- the ill-timed use of some
cultivation practices, especially of ploughing, can result in the formation of compacted layers
within, or at the base of, the topsoil (Ministry of Agriculture, Fisheries and Food, 1998). The
overall permeability of the topsoil and/or the topsoil/subsoil junction is reduced, promoting topsoil
saturation and lateral water movement;
The presence of erosion and deposition features- indicating that runoff has been sufficiently great
to cause the movement of detached soil particles;
Vertical wetness gradients within the soil profile- In naturally well-drained, permeable soils it
would be expected during the winter months that, except shortly after intense rainfall events, the
soil profile will be of approximately similar wetness throughout. An indication of structural
degradation is provided when such soils are significantly drier in the subsoil, compared to the
topsoil.
Classification of natural soil characteristics
The susceptibility of a soil to structural degradation associated with land management practices is
strongly influenced by natural soil physical properties, in particular texture and inherent water regime.
For example, soils with a large clay content have lower bearing strength when wet and are therefore
more susceptible to compaction and damage during trafficking and cultivation than soils with a small
clay content. Conversely soils with high silt content and low clay content are more prone to capping
(or crusting) at the surface associated with the breakdown of soil aggregates. The soils within the
catchments and at the selected sites have been classified into 8 categories (Soil Classes), according to
their natural textural and water regime characteristics (Table 4), to aid the extrapolation of data from
representative areas.
Extrapolation of the observed data to the catchments
The observed data were extrapolated to the catchment scale using two data sources. Soil data was
derived from the digital vector data version of the 1:250,000 scale National Soil Map of England and
Wales (Ragg et al., 1984). Cropping statistics were derived from the Department of Environment,
Food and Rural Affairs (DEFRA) parish agricultural census data. For areas within England, NUTS5
(ward-level) statistics from the 2000 census data were used. Due to the unavailability of recent
individual crop data in Wales, a 2 km x 2 km gridded dataset of cropping statistics from the 1995
census data had to be used for the area of the Severn catchment within Wales.
The cropping and soil datasets used, which are the only nationally available datasets in the UK, are
both statistical datasets which are not fully distributed. They each give the percentages of different
crop or soil types within a given area but not their location, and hence cannot be spatially overlain
within a Geographic Information System. As similar levels of soil structural degradation were
observed in all the areas visited (from south-east England to Wales to northern England) a simple yet
robust statistical upscaling method was used at the catchment-scale. The extrapolation process was
carried out as follows, for each catchment:
1. Each site within the catchment was classified according to its cropping system, natural soil
characteristics (soil class) and level of soil structural degradation. The proportion of the sites in
each soil structural degradation class were determined, by both land management system and soil
class.
2. The proportions of the land management systems were calculated based upon the constituent
cropping categories.
3. All soil series were assigned to one of the Soil Classes. The proportion of each of these classes
was then determined using the 1:250,000 scale National Soil Map of England and Wales.
4. The proportion of each land management system within each soil class was calculated by simple
proportional combination.
5. The proportion of each soil degradation class within each management system-soil class
combination was calculated, using the observed proportions.
6. The proportions of each soil degradation class within each management system- soil class
combination were then combined to give the proportions of each soil degradation class within the
catchment.
7. The proportions of each soil degradation class were combined with the catchment area to the give
the area of each soil degradation class.
Results
Distribution of observed soil structural degradation
Figure 2 shows the number of sites assigned to each soil structural degradation class within each
agricultural management system within each catchment. This indicates how soil degradation differs
between the catchments and management systems.
As a generalisation, the few cases of severe degradation identified are generally confined to sites on
autumn sown or late autumn harvested crops, although some poorly established or heavily poached ley
grassland sites are included. The high, moderate and low degradation classes are roughly evenly
divided on the grassland sites. In contrast, sites on autumn sown crops have a preponderance of high
and moderate degradation, whereas late autumn harvested crops are characterised by high degradation.
Sites in orchards have a predominance of moderate degradation, due to the alternating nature of the
soil cover characteristics associated with the linear planting.
Figure 3 shows soil structural degradation classes within each soil class within each management
system in all catchments. It shows that severe soil structural degradation class is generally most
common on soil classes 4 and 5, but is also common for late autumn harvested crops in soil classes 1
and 3 and, to a lesser extent, in soil classes 1 and 2 under autumn sown crops. For most soil classes,
there are approximately equal cases of high and moderate soil structural degradation, except for soil
class 3 (three times as many moderate cases) and soil class 4 (twice as many high cases).
Extrapolated soil structural degradation
The results of the extrapolation are shown in Table 5 for the four catchments. The results for each soil
degradation class are expressed as the percentage of the total area of each catchment. The percentages
shown do not sum to 100 % for two reasons. Firstly, each of the catchments contains both non-
agricultural areas and areas of cropping systems not considered in this study. Secondly, DEFRA
suppresses significant amounts of data in the NUTS5 statistics to maintain farmer confidentiality,
especially where the cultivation of a particular crop in an area is dominated by one or two farms. It is
likely that the percentage of each cropping system in the catchments, as used in the extrapolation,
represents an underestimate of actual land use. The combined effects of these two factors are shown
in Table 6, where the total agricultural area and the combined area of the land management systems of
interest to this study are expressed as a proportion of the catchment area.
The extrapolation of the site-specific observations to the catchment scale implies that soil structural
degradation (as given by Severe, High and Moderate classes) may have occurred over significant areas
of land- approximately 45 % of the Severn catchment, 30-35% of the Yorkshire Ouse and Uck
catchments, and 20 % of the Bourne catchment.

Potential impact of soil structural degradation
Studies have shown that the impact of soil structural degradation on in-field runoff is significant (e.g.
Martyn et al., 2000). However, the impact of this soil degradation on river flow response is less clear.
There are no regionally applicable methods available in the UK to establish the extent to which stream
response to rainfall is modified by land management, soil crusting and soil compaction or the
connectivity between field-scale runoff and stream response during storm events. The only method
available to directly link land use and management with catchment-scale runoff is the United States
Department of Agriculture Curve Number approach (Rallinson, 1980; US Soil Conservation Service,
1986), which is as dependent on land use or cover as it is on the soil type (Institute of Hydrology,
1975). Although the Curve Number approach does not form a universally applicable model of rainfall
and runoff, it is qualitatively relevant to this paper because of the greater influence of storm rainfall,
compared to the UK's Flood Studies Report (Institute of Hydrology, 1975). In the absence of
quantitative data linking soil degradation with stream response in the UK and the increasing use of the
Curve Number in hydrological modelling in the UK and Europe, the Curve Number approach has
therefore been used to illustrate the potential magnitude of the hydrological impact of the extrapolated
soil structural degradation in the four catchments.
The SCS Runoff Curve Number (CN) method is described in detail in SCS (1985). The SCS runoff
equation is
SIP
IPQ
a
a
2
(1)
Where Q is the direct surface runoff depth (mm), Ia is the initial abstraction (mm), P is the storm
rainfall (mm) and S is the potential maximum retention after runoff begins (mm). Ia is empirically
linked to S by:
SI a 2.0 (2)
So that equation 1 becomes:
SPSP
Q8.02.0 2
(3)
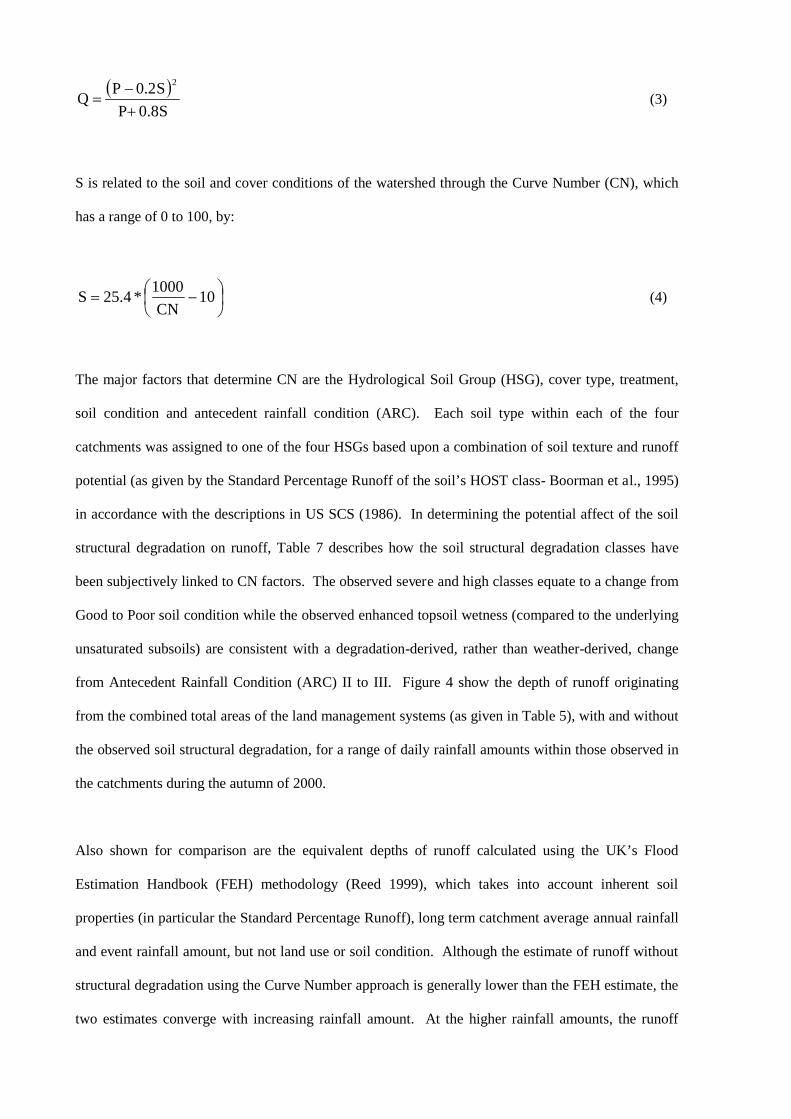
S is related to the soil and cover conditions of the watershed through the Curve Number (CN), which
has a range of 0 to 100, by:
101000
*4.25CN
S (4)
The major factors that determine CN are the Hydrological Soil Group (HSG), cover type, treatment,
soil condition and antecedent rainfall condition (ARC). Each soil type within each of the four
catchments was assigned to one of the four HSGs based upon a combination of soil texture and runoff
potential (as given by the Standard Percentage Runoff of the soil’s HOST class- Boorman et al., 1995)
in accordance with the descriptions in US SCS (1986). In determining the potential affect of the soil
structural degradation on runoff, Table 7 describes how the soil structural degradation classes have
been subjectively linked to CN factors. The observed severe and high classes equate to a change from
Good to Poor soil condition while the observed enhanced topsoil wetness (compared to the underlying
unsaturated subsoils) are consistent with a degradation-derived, rather than weather-derived, change
from Antecedent Rainfall Condition (ARC) II to III. Figure 4 show the depth of runoff originating
from the combined total areas of the land management systems (as given in Table 5), with and without
the observed soil structural degradation, for a range of daily rainfall amounts within those observed in
the catchments during the autumn of 2000.
Also shown for comparison are the equivalent depths of runoff calculated using the UK’s Flood
Estimation Handbook (FEH) methodology (Reed 1999), which takes into account inherent soil
properties (in particular the Standard Percentage Runoff), long term catchment average annual rainfall
and event rainfall amount, but not land use or soil condition. Although the estimate of runoff without
structural degradation using the Curve Number approach is generally lower than the FEH estimate, the
two estimates converge with increasing rainfall amount. At the higher rainfall amounts, the runoff
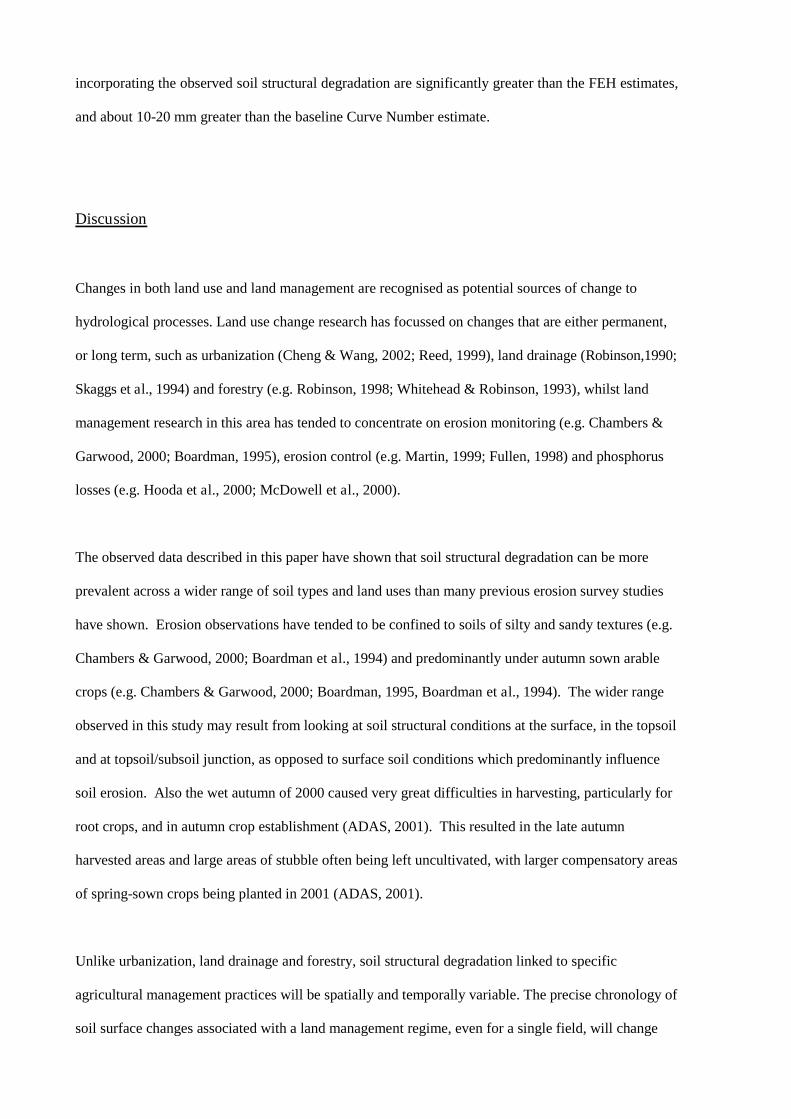
incorporating the observed soil structural degradation are significantly greater than the FEH estimates,
and about 10-20 mm greater than the baseline Curve Number estimate.
Discussion
Changes in both land use and land management are recognised as potential sources of change to
hydrological processes. Land use change research has focussed on changes that are either permanent,
or long term, such as urbanization (Cheng & Wang, 2002; Reed, 1999), land drainage (Robinson,1990;
Skaggs et al., 1994) and forestry (e.g. Robinson, 1998; Whitehead & Robinson, 1993), whilst land
management research in this area has tended to concentrate on erosion monitoring (e.g. Chambers &
Garwood, 2000; Boardman, 1995), erosion control (e.g. Martin, 1999; Fullen, 1998) and phosphorus
losses (e.g. Hooda et al., 2000; McDowell et al., 2000).
The observed data described in this paper have shown that soil structural degradation can be more
prevalent across a wider range of soil types and land uses than many previous erosion survey studies
have shown. Erosion observations have tended to be confined to soils of silty and sandy textures (e.g.
Chambers & Garwood, 2000; Boardman et al., 1994) and predominantly under autumn sown arable
crops (e.g. Chambers & Garwood, 2000; Boardman, 1995, Boardman et al., 1994). The wider range
observed in this study may result from looking at soil structural conditions at the surface, in the topsoil
and at topsoil/subsoil junction, as opposed to surface soil conditions which predominantly influence
soil erosion. Also the wet autumn of 2000 caused very great difficulties in harvesting, particularly for
root crops, and in autumn crop establishment (ADAS, 2001). This resulted in the late autumn
harvested areas and large areas of stubble often being left uncultivated, with larger compensatory areas
of spring-sown crops being planted in 2001 (ADAS, 2001).
Unlike urbanization, land drainage and forestry, soil structural degradation linked to specific
agricultural management practices will be spatially and temporally variable. The precise chronology of
soil surface changes associated with a land management regime, even for a single field, will change

within a season (Imeson & Kwaad, 1990), and from season to season (Burt & Slattery, 1996). Such
intra-annual and inter-annual changes in soil structure and infiltration capacity make the identification
of any short-term effects of soil structural degradation on river flows difficult. They will not occur in
the same parts of a catchment at the same time each year nor necessarily generate a consistent increase
in runoff, but will depend on the interactions between weather, tillage system, crop type and
management on the runoff mechanisms (Burt & Slattery, 1996). The physical changes that are
associated with the soil structural degradation reported here are more akin to the changes that occur
with urbanisation - an increase in surface sealing and a channelling of flows. The overall effects of
such structural degradation are thus similar to those of urbanisation and are likely to have a significant
effect on river flows, at least at a local level (Robinson, 1990), but significant impacts will only be
apparent when adverse seasonal weather patterns coincide with specific agricultural management
practices.
With the lack of quantified data from the UK on river flow response to increased runoff due to soil
structural degradation, the results presented in this paper using the CN approach are only indicative.
Nevertheless, the large absolute increases in runoff calculated using the CN approach supports the
potential for soil structural degradation to cause a significant increase in runoff impacting upon peak
river flows. However, such a significant response at the catchment-scale is only likely to occur during
exceptional years when the combination of prolonged wet weather and the timing of cultivation
practices lead to widespread soil structural degradation.
Implications for catchment management
The cropping and stock management systems observed in the four catchments have been practised for
many years, but recent trends towards the use of larger harvesting and cultivation machinery,
increased stocking densities and out-wintering of sheep, have the potential to increase significantly the
structural degradation of soil. The results presented have demonstrated that such degradation has
indeed occurred in the four catchments and will therefore have caused enhanced field-scale runoff.

By reducing both the overall storage capacity in the soil and the extent of vertical subsurface flow, and
by increasing the rate of runoff, the structural degradation is likely to exacerbate the ‘normal’ response
of streams to rainfall. This is likely to have greatest effect during extreme rainfall events at critical
times of the year in late autumn, early winter and spring. This has consequent implications for
flooding, and for mitigation or control measures required to reduce the effects of these higher flows on
flooding downstream.
Any such flood mitigation or control measures need to be considered in a catchment-based context
within catchment or river basin planning, such as the Catchment Flood Management Planning process
that was introduced in England and Wales by DEFRA and the Environment Agency (DEFRA /
Environment Agency, 2001). The process provides for the progressive development of policies,
strategies and specific flood management solutions.
The role of natural processes, particularly of catchment wetlands (Environment Agency, 2001c) and
floodplains, in providing storage and attenuating flood peaks and therefore in reducing flood risks is
already well recognised. The study presented in this paper supports the need for catchment flood
management policies and strategies to take the widest possible view of the interactions between land
use and hydrology. In general, flood management strategies should seek to control enhanced runoff at
source and should therefore support appropriate land management as a flood management solution
(Environment Agency, 2001b).
The current debate regarding the future nature of the agricultural industry and its role in the
management of the countryside represents an important opportunity to highlight the importance of
agricultural land practices for flood management (Holmes, 2001). The future linking of agri-
environmental and set-aside payments with practices that promote the mitigation or control of runoff
(e.g. Martin, 1999) could be a valuable addition to the measures discussed within the draft Catchment
Flood Management Planning guidelines (DEFRA / Environment Agency, 2001).

Conclusions
Field examination of soil surface and soil structural conditions showed that soil structural degradation,
associated with a number of common cropping systems/management practices, was present in all four
catchments studied. Unlike many previous studies, Severe soil structural degradation in the
catchments studied was associated with late harvested crops such as maize, sugar beet and, at least
during the autumn of 2000, main crop potatoes, as well as autumn sown crops. High degradation
occurred on approximately 55 % of inspected sites on late harvested crops, 30 % of sites under grass,
autumn sown crops and field vegetables and 10 % of sites under orchards. The study did not
investigate the effects of overgrazing in upland peaty catchments.
Extrapolation to the catchment scale suggests that soil structural degradation may have occurred on
approximately 40% of the Severn, 30-35 % of the Yorkshire Ouse and Uck catchments and 20% of the
Bourne catchment. The lack of quantified data from the UK on river flow response to increased runoff
due to soil structural degradation, allowed only the Curve Number approach to be used. Soil structural
conditions were linked via Soil Hydrological Group, Soil condition and Antecedent Rainfall
Conditions to SCS Curve Numbers to allow a preliminary evaluation of the possible contribution of
enhanced runoff in each catchment. Increased runoff of around 10-20 mm from the total area of the 5
land management systems was predicted by the CN approach for large rainfall events in the Severn,
Ouse and Uck catchments, and around 5mm in the Bourne catchment. The significant predicted
responses in increased runoff at the catchment-scale are only likely to occur during exceptional years
when the combination of prolonged wet weather and the timing of cultivation practices lead to
widespread soil structural degradation. Nevertheless, the use of an holistic catchment-wide approach
to managing the interactions between agricultural land use and hydrology, allowing appropriate runoff
(and consequent flooding) to be controlled at source, rather than within the floodplain or the river
channel, should be highlighted in the guidelines on Catchment Flood Management Plans.
Acknowledgements
The work described in this paper was carried out under Environment Agency R&D Project no. W5B-
026. The authors acknowledge the permission of the Environment Agency to publish, the access
granted by the many farmers in the catchments and the contribution made by colleagues in the NSRI
and the Environment Agency. Opinions expressed in the paper are those of the authors, and do not
necessarily reflect those of their respective organisations.
References
ADAS, 2001. The Wet Autumn Of 2000: Implications For Agriculture. Report CC0372 for
Department of Environment, Food and Rural Affairs.
Allison, J.W. and Hartnup, R., 1981. Soils in North Yorkshire VI (SE39, Northallerton). Soil Survey
Record 68.
Arvidsson, J., 2001. Subsoil compaction caused by heavy sugarbeet harvesters in southern Sweden - I.
Soil physical properties and crop yield in six field experiments. Soil, Tillage Research 60(1-2): 67-
78
Boardman, J., 1991. Land-use, rainfall and erosion risk on the South Downs. Soil Use &
Management, 7(1), 34-38
Boardman, J., 1995. Damage to property by runoff from agricultural land, South Downs, southern
England, 1976-93. Geogr. J. 161(2), 177-191
Boardman, J. and Hazelden, J., 1986. Examples of erosion on brickearth soils in east Kent. Soil Use
and Management, 2, 105-108.
Boardman, J., Ligneau, L., Deroo, A. and Vandaele, K., 1994. Flooding of property by runoff from
agricultural land in northwestern Europe. Geomorphology, 10(1-4), 183-196
Boorman, D.B., Hollis, J.M. and Lilly, A., 1995. Hydrology of Soil Types: A hydrologically-based
classification of the soils or the United Kingdom. Institute of Hydrology Report No. 126,
Wallingford: UK; 137.
Bradley, R.I. and Allison, J.W., 1985. Soils in North Yorkshire VII (SE47, Dalton). Soil Survey
Record 87.

Burt, T.P. and Slattery, M.C. 1996. Time-dependent changes in soil properties and surface runoff
generation. In: Advances in Hillslope Processes, Volume 1, Anderson MG, Brooks SM (eds.).
Wiley: Chichester; 79-95.
Chambers, B.J. and Garwood, T.W.D., 2000. Monitoring of water erosion on arable farms in England
and Wales, 1990-1994. Soil Use & Management, 16(2), 93-99.
Cheng, S.J. and Wang, R.Y., 2002. An approach for evaluating the hydrological effects of
urbanization and its application. Hydrol. Process. 16, 1403–1418.
DEFRA / Environment Agency, 2001. Catchment Flood Management Plans: Interim Guidelines for
Consultation and Pilot Catchment Studies. Unpublished report by Halcrow, Swindon.
Earl R. 1997. Prediction of trafficability and workability from soil moisture deficit. Soil, Tillage
Research 40: 155-168.
Environment Agency, 2001a. Lessons learned: Autumn 2000 floods. Environment Agency: Bristol.
Environment Agency, 2001b. Best Farming Practices: profiting from a good environment. R&D
Publication 23. Environment Agency: Bristol; 57.
Environment Agency, 2001c. An Environmental Vision: The Environment Agency’s Contribution to
Sustainable Development. Environment Agency: Bristol.
Evans, R., 1996. Soil erosion and its impacts in England and Wales. Friends of the Earth: London;
121.
Fullen, M.A., 1998. Effects of grass ley set-aside on runoff, erosion and organic matter levels in sandy
soils in east Shropshire, UK. Soil & Tillage Research, 46(1-2), 41-49
Harrod, T.R., 1994. Runoff, soil erosion and pesticide pollution in Cornwall. In Conserving Soil
Resources: European perspectives, Rickson RJ (ed). CAB International: Wallingford; 425.
Haynes, R.J., 1981. Effects of soil management practices on soil physical properties, earthworm
populations and tree root distribution in a commercial apple orchard. Soil Tillage, Research 1(3):
269-280.
Hodgson, J.M., 1997. Soil survey field handbook. Soil Survey and Land Research Centre Technical
Monograph No. 5. Cranfield University: Bedford; 166.
Hollis, J.M., 1978. Soils in Salop I (Sheet SO79E/89W, Claverly). Soil Survey Record 49.

Holman, I.P., Hollis, J.M. and Thompson, T.R.E., 2002. Impact of agricultural soil conditions on
floods – Autumn 2000. R&D Technical Report W5B-026/TR, Environment Agency: Bristol.
Holmes, N.. 2001. Prospects for flood friendly landscapes. ECOS, 22(2):58-63.
Hooda, P.S., Edwards, A.C., Anderson, H.A. and Miller, A., 2000. A review of water quality concerns
in livestock farming areas. Sci. Tot. Env., 250 (1-3): 143-167
Horton, R., Ankeny, M.D. and Allmaras, R.R., 1994. Effects of compaction on soil hydraulic
properties. In Soil Compaction in Crop Production, Soane BD, van Ouwerkerk C. (eds.)..
Elsevier: Amsterdam; 662.
Imeson, A.C. and Kwaad, F.J.P.M., 1990. The response of tilled soils to wetting by rainfall and the
dynamic character of soil erodibility, In Soil Erosion on Agricultural Land, Boardman J, Foster
IDL, Dearing JA (eds.). Wiley, Sons, Chichester, pp 3-14
Institute of Hydrology, 1975. Flood Studies Report- volume 1 (Hydrological Studies). Natural
Environment Research Council: UK.
Kwaad, F.J.P.M., 1994. Cropping systems of fodder maize to reduce erosion of cultivated Loess soils.
In Conserving Soil Resources: European perspectives, Rickson RJ (ed). CAB International:
Wallingford; 425.
Martin, P., 1999. Reducing flood risk from sediment-laden agricultural runoff using intercrop
management techniques in northern France. Soil & Tillage Research, 52(3-4), 233-245.
Martyn T M, Donaldson G, Clements R O and Lindsay J, 2000. Soil erosion control in maize stubbles.
In Proceedings of Sixth Research Conference, British Grassland Society, 29-30. C2.
McDowell, R.W., Sharpley, A.N., Condron, L.M., Haygarth, P.M. and Brookes, P.C., 2001. Processes
controlling soil phosphorus release to runoff and implications for agricultural management.
Nutrient Cycling In Agroecosystems, 59 (3): 269-284 2001
Ministry of Agriculture, Fisheries and Food, 1998. Code of Good Agricultural Practice for the
Protection of Soil (The Soil Code). MAFF Publications: London; 60.
National Soil Resources Institute, 2001. A Guide to Better Soil Structure. Cranfield University:
Silsoe; 19.

Ragg, J.M., Beard, G.R., George, H., Heaven, F.W., Hollis, J.M., Jones, R.J.A., Palmer, R.C., Reeve,
M.J., Robson, J.D. and Whitfield, W.A.D., 1984. Soils and their use in Midland and western
England. Soil Survey of England and Wales Bulletin No. 12: Harpenden.
Rallinson, R.E., 1980. Origin and evolution of the SCS Runoff Equation. Symposium on Watershed
Management. ASCE: New York; 912-924.
Reed, D., 1999. Flood Estimation Handbook Volume 1: Overview. Institute of Hydrology:
Wallingford; 107.
Robinson, M., 1990. Impact of improved land drainage on river flows. Institute of Hydrology Report
No. 113. Institute of Hydrology: Wallingford; 226
Robinson, M., 1998. 30 years of forest hydrology changes at Coalburn: water balance and extreme
flows. Hydrology and Earth System Sciences 2(2-3): 233-238
Skaggs, R.W., Breve, M.A. and Gilliam. J.W., 1994. Hydrological and water quality impacts of
agricultural drainage. Critical Reviews in Environmental Science and Technology 241: 1-32.
Soil Conservation Service. 1985. National engineering handbook. Section 4- Hydrology. Washington, DC.
Thompson, T.R.E., 1982. Soils in Powys II (SJ21, Arddleen). Soil Survey Record 75.
U.S. Soil Conservation Service. 1986. Urban Hydrology for Small Watersheds. Technical Release
55, U.S Department of Agriculture.
Vallentine, J.F., 1990. Grazing Management. Academic Press Ltd.: London; 533.
Webster, R., 1993. Dealing with spatial variation In Soil monitoring, Schulin R, Desaules A, von
Stieger B, Webster R (eds). Birkhauser Verlag: Basel; 295-307
Whitehead, P.G. and Robinson, M., 1993. Experimental basin studies- an international and historical
perspective of forest impacts. J. Hydrol., 145(3-4), 217-230
Whitfield, W.A., 1975. Soils in Warwickshire II (Sheet SP05, Alcester). Soil Survey Record 25.

#
SJ21
#
SO79/89
#
SP05
#
SE39
#
SE28
#
SE47
#Bourne
#Uck
Yorkshire Ouse
Severn
50 0 50 Kilometers
N
Figure 1 Location of the study catchments and the representative 10 km x 10 km blocks
chosen to represent the Severn and Yorkshire Ouse catchments

Figure 2 Distribution of observed Soil Degradation Class by management system in the (top left) Yorkshire Ouse, (top right) Severn, (bottom left) Uck
and (bottom right) Bourne catchments
13
12
14
11
22
7
5
15
9
S
H
M
L
Gr As Lah
Landuse class
Deg
rada
tion
clas
s10
11
12
3
11
17
3
3
19
6
3
51
1S
H
M
L
Gr As Lah Fv
Landuse class
Deg
rada
tion
clas
s
2
14
11
4
7
11
4
7
4 4
5
5
S
H
M
L
Gr As Lah Fv Or
Landuse class
Deg
rada
tion
clas
s
4
4
10
6
14
4
36
12
2
11S
H
M
L
Gr As Lah Fv Or
Landuse class
Deg
rada
tion
clas
s
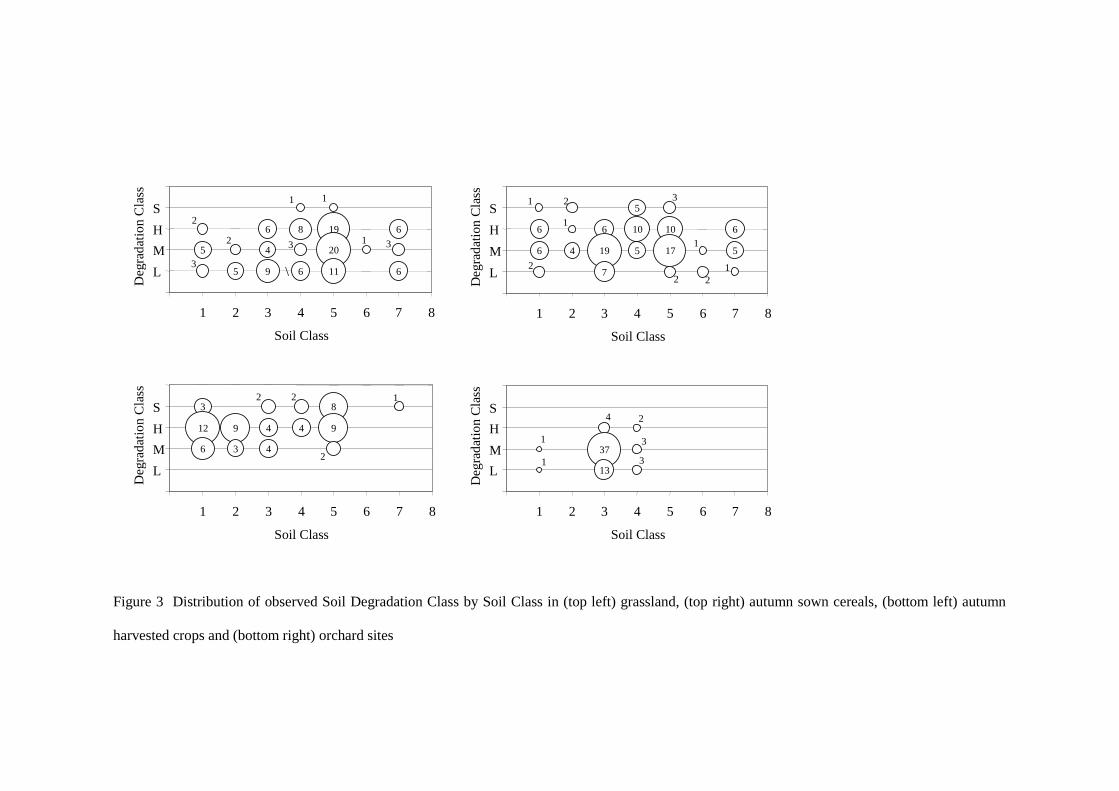
Figure 3 Distribution of observed Soil Degradation Class by Soil Class in (top left) grassland, (top right) autumn sown cereals, (bottom left) autumn
harvested crops and (bottom right) orchard sites
5
5
6
4
9
8
6
19
20
11
6
6
3
3
2
2 31
11S
H
M
L
1 2 3 4 5 6 7 8
Soil Class
Deg
rada
tion
Cla
ss
\
6
6 4
6
19
7
5
10
5
10
17
6
5
3
2 22
1 2
1
1
1
S
H
M
L
1 2 3 4 5 6 7 8
Soil Class
Deg
rada
tion
Cla
ss
3
12
6
9
3
4
4
4
8
9
2 2
2
1S
H
M
L
1 2 3 4 5 6 7 8
Soil Class
Deg
rada
tion
Cla
ss
37
133
3
24
1
1
S
H
M
L
1 2 3 4 5 6 7 8
Soil Class
Deg
rada
tion
Cla
ss

0
20
40
60
80
0 20 40 60 80 100 120
Storm rainfall (mm)
Run
off(
mm
)Baseline_FEHBaseline_CNDegraded_CN
0
20
40
60
80
0 20 40 60 80 100 120
Storm rainfall (mm)
Run
off(
mm
)
0
20
40
60
80
0 20 40 60 80 100 120
Storm rainfall (mm)
Run
off(
mm
)
0
20
40
60
80
0 20 40 60 80 100 120
Storm rainfall (mm)R
unof
f(m
m)
Figure 4 Potential increase in runoff caused by a soil structural degradation for a range of rainfall events calculated using a Curve Number
approach for the (top left) Uck, (top right) Bourne, (bottom left) Yorkshire Ouse and (bottom right) Severn catchments

Table 1 Numbers of fields investigated under different management systems in
each study area
Catchment
Ouse Severn Uck Bourne
Management
system
SE39 SE28 SE47 SO79/89 SJ21 SP05
Grass (Gr) 14 16 9 3 20 11 31 18
Autumn sown (As) 9 18 13 14 5 15 22 25
Late autumn
harvested (Lah)
14 5 10 21 5 2 11 1
Field vegetable (Vf) 0 0 0 0 1 9 0 0
Orchards* (Or) 0 0 0 0 0 0 14 50
Total 37 39 32 38 31 37 78 94
* Paired observations were made at each location, between the trees and between the rows

Table2 Soil Structural Degradation classes
Class Name Description
S
H
M
L
Severe
High, extensive
Moderate, local
Low
Soil degradation generates sufficient enhanced runoff to cause
widespread erosion that is not confined to wheelings / tramlines.
Soil degradation generates enhanced runoff across whole field, where
slopes allow
Soil degradation generates localised areas of enhanced runoff, where
slopes allow
Insignificant enhanced runoff generation

Table 3 Features associated with the Soil Structural Degradation classification
Class Management
system
Soil degradation features
S
H
H
M
M
L
All
(As, Lah, Vf, Or, Gr)1
Arable or Orchard
(As, Lah, Vf, Or)
Grassland
(Gr)
Arable or Orchard
(As, Lah, Vf, Or)
Grassland
(Gr)
All
(As, Lah, Vf, Or, Gr)
Extensive rill erosion that is not confined to wheelings on
slopes and depositional fans on footslopes and level ground +
characteristics of Class H
Slaked or capped topsoil + topsoil structural change /
compaction or ‘loose’ surface / poor load bearing capacity +
extensive areas of standing water (not confined to wheelings)
+ vertical wetness gradient ± erosion in wheelings
Extensively poached surface + extensive areas of standing
water + topsoil compaction + vertical wetness gradient
Slaked or partly slaked topsoil + standing water in wheelings
± topsoil structural change
Slight poaching (locally severe) + localised areas of standing
water
Few signs of enhanced runoff mechanisms present, but can
show signs of localised poaching and standing water as long
as the whole profile maintains a good soil structure
1Autumn-sown crops (As); Late autumn harvested crops (Lah); Field vegetables (Vf); Orchards (Or);
Grassland (Gr)

Table 4 Characteristics of the Soil Classes
Soil class Topsoil texture Water regime
1
2
3
4
5
6
7
8
Sand, loamy sand or sandy loam
Sand, loamy sand or sandy loam
Sandy silt loam, silty clay loam, silt loam,
clay loam or sandy clay loam
Sandy silt loam, silty clay loam, silt loam,
clay loam or sandy clay loam
Sandy silt loam, silty clay loam, silt loam,
clay loam or sandy clay loam
Heavy clay loam (>27% clay), sandy clay,
silty clay or clay
Heavy clay loam (>27% clay), sandy clay,
silty clay or clay
Organic
Permeable soils, either freely drained, or
experiencing seasonal subsoil waterlogging
due to groundwater
Experience occasional seasonal
waterlogging in upper layers due to slowly
permeable subsoils
Permeable soils, either freely drained, or
experiencing seasonal subsoil waterlogging
due to groundwater
Experience occasional seasonal
waterlogging in upper layers due to slowly
permeable subsoils
Experience prolonged seasonal
waterlogging due to slowly permeable
subsoils or high groundwater levels
Experience occasional seasonal
waterlogging in upper layers due to slowly
permeable subsoils
Experience prolonged seasonal
waterlogging due to slowly permeable
subsoils or high groundwater levels
Experience prolonged seasonal
waterlogging due to slowly permeable
subsoils or high groundwater levels
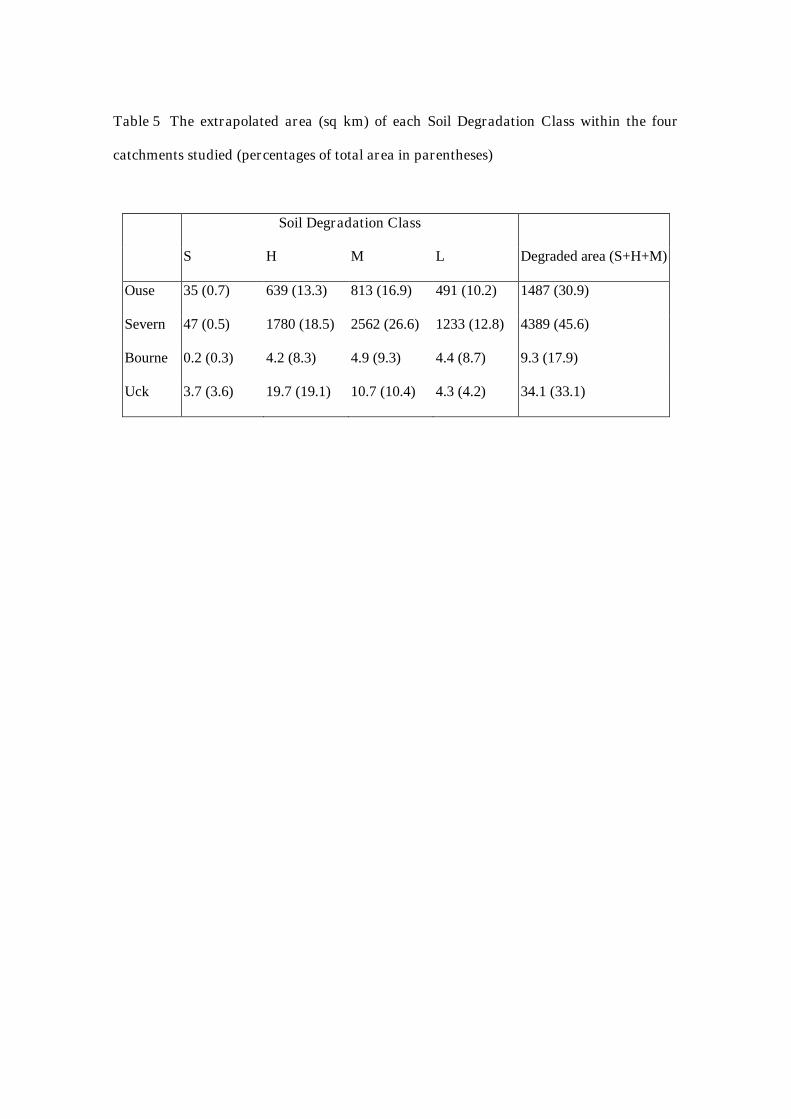
Table 5 The extrapolated area (sq km) of each Soil Degradation Class within the four
catchments studied (percentages of total area in parentheses)
Soil Degradation Class
S H M L Degraded area (S+H+M)
Ouse 35 (0.7) 639 (13.3) 813 (16.9) 491 (10.2) 1487 (30.9)
Severn 47 (0.5) 1780 (18.5) 2562 (26.6) 1233 (12.8) 4389 (45.6)
Bourne 0.2 (0.3) 4.2 (8.3) 4.9 (9.3) 4.4 (8.7) 9.3 (17.9)
Uck 3.7 (3.6) 19.7 (19.1) 10.7 (10.4) 4.3 (4.2) 34.1 (33.1)

Table 6 The agricultural area as given by agricultural statistics and the area of the
five land management systems, expressed as percentages of the catchment area
Catchment area (km2) Agricultural area (%) Target land management
systems (%)
Ouse 4829 71 50
Severn 9753 73 62
Bourne 53 47 33
Uck 103 53 40

Table 7 Linkage of Soil Degradation Classes and land use to CN parameters (cover type,
soil condition and Antecedent Rainfall Condition).
Soil Degradation Class
Land use Cover type Low Moderate High Severe
Grass Pasture Good1/ARC II Fair/ARC II Poor/ARCII Poor/ARCIII
Cereals Small
grains
Good/ARC II Good/ARC II Poor/ARCII Poor/ARCIII
Lah & veg Row crops Good/ARC II Good/ARC II Poor/ARCII Poor/ARCIII
Top fruit Woods Good/ARC II Fair/ARC II Poor/ARCII Poor/ARCIII
1 Soil condition