Embed Size (px)
Citation preview
1
Study
The Contribution of Livestock to the Economies of IGAD Member States
Study Findings, Application of the Methodology in Ethiopia and
Recommendations for Further Work
Roy Behnke Odessa Centre Great Wolford
United Kingdom
IGAD LPI Working Paper No. 02 - 10
A Living from Livestock
IGAD Livestock Policy Initiative
2
ACKNOWLEDGEMENTS
This work was made possible through the combined support of the Ministry of Finance and Economic Development, Federal Democratic Republic of Ethiopia, and the Livestock Policy Initiative of the Intergovernmental Authority on Development, IGAD. I would particularly like to thank the following IGAD LPI staff: Dil Peeling, Chief Technical Adviser, Dr. Abdi Jama, Livestock Information Adviser, and Dr. Thomas Cherenet, National Technical Focal Point. Without their enthusiasm and persistence this report would not have been possible. Equally, this report could not have been written without access to material on livestock production collected by MOFED and without MOFED’s assistance in interpreting this data. Two individuals in MOFED merit special thanks – Mr. Fitaweke Metaferia in the National Accounts Department and Mr. Leulseged Dechsa, the Head of the National Accounts Department. Their explanation of the methods used to calculate Ethiopia’s national accounts provided the framework for this report and their contribution is gratefully acknowledged.
Dr. Berhe GebreEgziabher, Head of the Animal and Plant Health Regulatory Department, Ministry of Agriculture and Rural Development, chaired the Livestock Policy Forum meeting in November 2009 in which this consultancy was introduced to livestock experts in Ethiopia, and various members of the LPF have been generous in sharing with me their knowledge on livestock and livestock research. I would especially like to recognize the assistance of Gijs Van’t Klooster of FAO in Addis Ababa, and Herrie Hamedu Ali, the FAO Afar Field Office Coordinator.
3
DISCLAIMER
This paper on Ethiopia is part of a series of Working Papers on The Contribution of Livestock to the Economies of IGAD Member States planned by the Inter-Governmental Authority on Development’s Livestock Policy Initiative (IGAD LPI). The purpose of these papers is to provide support to Livestock Policy Hubs in the Member States to use study outcomes in their engagements with PRSPs processes in their respective countries (Ethiopia's Plan for Accelerated and Sustained Development to End Poverty-PASDEP) to advocate and ensure that the representation of livestock in these national strategy documents is commensurate with its important contribution to economic growth, poverty reduction and food.
The designations employed and the presentation of material in this publication do not imply the expression of any opinion whatsoever on the part of either the Food and Agriculture Organization of the United Nations or the Inter-Governmental Authority on Development concerning the legal status of any country, territory, city or area or its authorities concerning the delimitations of its frontiers or boundaries.
The opinions expressed in this paper are solely those of the author and do not constitute in any way the position of the FAO, IGAD, the Livestock Policy Initiative nor the governments studied.
This study was undertaken in close collaboration with the National Accounts Department (NAD) of the Ministry of Finance and Economic Development (MOFED) of the Federal Republic of Ethiopia. NAD has provided constructive review and comments on the study. While the majority of these comments were incorporated, there were however areas where opinions differ. These mainly stem from the fact that IGAD LPI is most interested in the broader contribution of livestock to the national economy of the country, whereas the responsibility of MOFED relates more to GDP calculation and strict adherence to the guidelines on its calculation. A case in point is the use of oxen as source of traction power for own use. According to the GDP guidelines oxen should not be considered as production but part of non produced natural assets. The author and IGAD LPI question why milk and meat produced and used by a farm family are assigned a value for GDP estimates, but traction power is not. Furthermore, even if traction should not be included in GDP calculations, it nonetheless contributes to the Ethiopian economy and IGAD LPI believes it is therefore appropriate to include the figures in this report. There are other areas where MOFED has its reservations, relating mainly to the weakness or lack of data. The study suggests future work on refining and updating the finding of this work particularly on improving the estimates of cattle and goat output, which are both high in absolute terms and apparently underappreciated in national accounting terms. The consensus on addressing the data issue is to set up a taskforce consisting of different stakeholders (data providers, researchers and relevant line ministries and departments) to forge a common understanding and to be sure on some of the facts and figures presented in this document.
Date of publication: October 2010
4
CONTENTS
ACKNOWLEDGEMENTS ............................................................................................2
DISCLAIMER .........................................................................................................3
CONTENTS ..........................................................................................................4
ABBREVIATIONS....................................................................................................5
EXECUTIVE SUMMARY ............................................................................................6
INTRODUCTION ....................................................................................................9
PART I – AGRICULTURAL GDP ................................................................................. 10
1.1. Methodology ...................................................................................................................................... 10 1.2. National livestock population estimates .................................................................................... 15 1.3. Livestock production estimates ................................................................................................... 20
1.3.1. Offtake rates – cattle, small ruminants and camels ............................................................ 20
1.3.2. Cattle milk yields .................................................................................................................. 21
1.3.3. Milk yields from small ruminants .......................................................................................... 23
1.3.4. Camel milk yields .................................................................................................................. 24
1.3.5. Production of livestock dung for fuel ................................................................................... 25
1.3.6. Use of cattle draught power for the production of annual crops ....................................... 25 1.4. The gross value of ruminant livestock production using current and revised production
coefficients ...................................................................................................................................... 28 1.5. Conclusions Part I ............................................................................................................................ 31 PART II – SATELLITE ACCOUNTING AND FINANCIAL SERVICES ........................................... 33
2.1. Satellite accounting for livestock ................................................................................................. 34 2.2. The value of livestock as savings and investment .................................................................... 38 2.3. The value of livestock as credit and insurance ......................................................................... 38 2.4. Conclusions Part II ........................................................................................................................... 39 ANNEXES .......................................................................................................... 40
REFERENCES ..................................................................................................... 43
5
ABBREVIATIONS
BOFED Bureau of Finance and Economic Development CSA Central Statistics Agency DGDP Dairy Goat Development Project EB Ethiopian birr EEA Ethiopian Energy Authority GDP Gross Domestic Product ILCA International Livestock Centre for Africa ILRI International Livestock Research Institute LDMPS Livestock Development Master Plan Study MOFED Ministry of Finance and Economic Development PADS Pastoral Areas Development Study SC-UK Save the Children, UK ISIC Standard Industrial Classification of All Economic Activities SNA System of National Accounts SNNPR Southern Nations, Nationalities and Peoples Region TLU Tropical Livestock Unit
6
EXECUTIVE SUMMARY
1. This is the final report in a series of three reports on the contribution of livestock to the economies of IGAD member states. This report appraises the contribution of livestock to Ethiopia’s agricultural GDP. It also reviews the methods developed to examine the contribution of livestock to the Ethiopian economy, and recommends that these methods be extended to evaluate the contribution of livestock to agricultural GDP and to the wider economy of the other IGAD member states.
2. The contribution of livestock to agricultural GDP is the most commonly quoted single measure of livestock’s contribution to the overall national economy. It is therefore a very important figure. GDP estimates for Ethiopia are prepared by the National Accounts Department of the Ministry of Finance and Economic Development (MOFED) according to internationally recognized procedures described in the System of National Accounts 1993. Ethiopia follows the production approach to estimating GDP, in which the goods and services produced by all categories of economic activity are summarized to arrive at total GDP. For livestock this approach involves four stages. First, national livestock populations are estimated by MOFED based on data supplied by the Central Statistics Agency (CSA). Second, production coefficients are applied to the livestock population estimates to generate estimates of the total output of goods such as meat, milk, butter, dung for fuel etc. Third, based on CSA producer price surveys, a monetary value expressed in Ethiopian birr – the gross value of output – is ascribed to the total output of each kind of livestock product. Finally, input costs (intermediate costs) are deducted from the gross value of output to derive value added.
3. The production approach followed by Ethiopia is the most direct method of estimating GDP and is almost certainly the method used by other IGAD states. Adjusted to local husbandry practices and output profiles, the methods developed in this report should apply equally to the re-estimation of the contribution of livestock to agricultural GDP in the other IGAD states.
4. The production coefficients presently used by MOFED are potentially outdated. We evaluated and adjusted these production coefficients in light of current research and survey evidence, developed 7 revised coefficients, and retained unchanged 5 pre-existing coefficients. We retained unchanged MOFED’s estimates of the size of national cattle and camel populations, but recommended an objective formula that adjusted upwards the estimated size of goat and sheep populations. Using MOFED producer price figures for 2008-09, we then recalculated the combined gross value of 12 categories of livestock product output using our revised set of coefficients and livestock population estimates. The recalculated combined gross value of 12 categories of livestock product output totalled 48.095 billion birr in 2008-09, an increase of about 47% over the gross value of ruminant production estimated according to MOFED’s current set of coefficients and herd size estimates.
5. About 80% of Ethiopian farmers use animal traction to plough their fields. Both the mean area cultivated by a farm household and their yields per hectare are positively associated with cattle ownership and ploughing, in comparison to hand cultivation. Despite these contributions to agricultural output, no attempt is currently made to impute the monetary value of animal
7
traction for Ethiopian agriculture. The value of the animal draught power input into arable production can be estimated at 26.4% of the value of annual crop production. This calculation transfers 26.4% of the value of the production of annual crops from the arable to the livestock subsector. Based on these figures, nearly a third (31%) of the total gross value of livestock output is represented by the value of animal draught power as an input into crop cultivation, an estimated 21.500 billion EB in 2008-09. As a livestock service (albeit one provided by agriculture for agriculture) rather than a livestock product, ploughing services are classified for GDP purposes as animal husbandry service activities under the agricultural sector of national accounts.
6. The recalculated gross value of the agricultural output of ruminant livestock including the use of animal traction for cultivation totals 69.595 billion birr in 2008-09. This represents an increase of about 113% over current estimates of the 2008-09 gross value of ruminant livestock’s contribution to agriculture, 32.640 billion birr according to MOFED’s present set of coefficients and livestock population estimates.
7. In 2008-09 according to MOFED the gross value added of crop production was 111.737 billion EB at current prices. This figure does not include all of the intermediate costs of crop cultivation, now estimated at an additional 21.5 billion EB for animal traction in 2008-09 (point 5, above). When these cultivation costs are deducted from the gross value of crop output, the revised estimate of the gross value added of crop production is 90.237 billion EB in 2008-09. In the same year, the gross value added by all branches of livestock production (ruminant livestock, poultry and bees) was 74.338 billion EB (including the value of ploughing services) at prices current at that time. Total re-estimated agricultural gross value added in 2008-09 was therefore 164.575 billion EB. If we include the value of ploughing services, livestock provided 45% of agricultural GDP in 2008-09. Current MOFED estimates place livestock’s contribution at about 25% of total agricultural GDP. The gap between MOFED estimates of the contribution of livestock and the estimates in this report suggests that the significance of livestock relative to crop production has been considerably underestimated in past calculations of agricultural GDP.
8. In terms of the amount they contribute to agricultural GDP, cattle are by far the most important ruminant species, providing output re-valued in this report at about 54 billion EB in 2008-09, if the value of dung for fuel and animal drought power for cultivation are both attributed solely to cattle. At the national level, goats are the second most economically important herd species, with a re-estimated 2008-09 output value of about 8.7 billion EB. These results suggest that future work on refining and updating the conclusions of this report should focus on improving the estimates of cattle and goat output, which are both high in absolute terms and apparently underappreciated in national accounting terms.
9. Agricultural GDP is based on the value of unprocessed or lightly processed agricultural produce at point of first sale. Some agricultural produce is consumed at this stage, but much is taken up by the service and manufacturing sectors of the economy which use it, modify it, and add value to it. As these livestock goods and services transit through the wider economy they continue to contribute to national GDP, not in the form of agricultural output but classified now as services or manufactured products. The GDP benefits derived from livestock in this way appear under a variety of accounting headings and are not readily attributed to livestock, which makes it difficult to assess the full extent of livestock’s influence on the national economy. To remedy this situation and to gain a clearer understanding of the size of the livestock sector and the economic linkages between livestock production and the wider
8
economy, it is necessary to reassemble the data on livestock that are scattered under different headings throughout the national accounts. This reworking of the standard GDP estimates is termed ‘satellite accounting.’ A proposal to carry out a simplified form of satellite accounting for livestock is presented in Part II of this report.
10. Both satellite accounts and standard accounts of agricultural GDP examine the direct use value of livestock output – the immediately useful products and services, both traded and for home consumption, that livestock provide. Livestock also provide less tangible but no less important economic benefits. For rural smallholders, the most commonly cited economic functions of this kind are the use of livestock as savings, as assets that provide interest-free credit, and as insurance to mitigate risk. Without access to formal financial institutions, many peasants and pastoralists depend instead on their livestock for these important financial services.
11. The concluding sections of this report briefly discuss methods that can be used to quantify in monetary terms the value of the informal financial services provided by livestock. Preliminary results suggest that in 2008-09 the capital value of Ethiopia’s national herd as a form of savings was roughly 86 billion EB, with an annual return on this investment of about 21-26 billion EB. It is not possible at this point to accurately impute monetary values to the credit and risk mitigation functions of Ethiopian livestock, but with further research it should be possible to derive reliable estimates of these values.
12. The re-evaluation in this report of the relative contributions of crop and livestock production to Ethiopian agricultural GDP was large in absolute terms and suggests new ways of viewing the role of livestock in the national economy. The techniques developed in this report to estimate the value of the informal financial services provided by livestock are generally applicable to peasant and pastoral production systems and should be appropriate for use in all the IGAD member states. In sum, the results of this exercise are potentially significant for Ethiopian economic policy and a similar exercise can be replicated in other IGAD states. Continuation of this programme should contribute to a new understanding of the regional importance of livestock and a clearer appreciation of its true economic significance in regional economic development.
13. The reappraisal of the value of livestock output contained in this report is based on recent available field research. In a general review of this kind, some important surveys and specialized studies may not have come to the attention of the consultant and were not examined, or were in preparation or otherwise unavailable. An open discussion with the different stakeholders – data providers, livestock researchers, and relevant line ministries and departments – is necessary to have a common understanding and to appraise the accuracy of the facts and figures contained in this document.
9
INTRODUCTION
This study has the following objectives:
• To provide an assessment on whether the contribution of livestock to GDP is correctly reflected in national income accounting in Ethiopia.
• To propose and refine a methodology for the internal assessment of livestock’s contribution to GDP in Ethiopia which can subsequently be applied in Djibouti, Kenya, Somalia, Sudan and Uganda.
This is the third in a series of three reports. An Inception Report presenting the findings of the situational analysis and the proposed methodology for the study was presented on 1 December 2009. A second draft report, submitted 12 February 2010, presented the preliminary results of work conducted in Ethiopia using the proposed methodology. This final report contains the study findings, an assessment of the application of the methodology in Ethiopia and further recommendations for its application in the other IGAD member states.
The contribution of livestock to agricultural GDP is the most commonly quoted single measure of livestock’s importance to the overall national economy. Agricultural GDP represents the value of unprocessed or lightly processed agricultural produce at point of first sale. Part I of this report examines the methods currently used by MOFED to estimate the contribution of livestock to Ethiopian agricultural GDP and recommends some modifications to these methods. The impact of adopting these modifications is illustrated by recalculating livestock’s contribution to agricultural GDP in 2008-09.
Agricultural GDP is based on the value of unprocessed or lightly processed agricultural produce. Some agricultural produce is consumed at this stage, but much is taken up by the service and manufacturing sectors of the economy which use it, modify it, and add value to it. The secondary GDP benefits derived from livestock in this way appear under a variety of accounting headings and are not readily identified with livestock. To gain a clearer understanding of the size of the livestock sector, it is necessary to reassemble the data on livestock that are scattered under different headings throughout the national accounts. This reworking of the standard GDP estimates is termed ‘satellite accounting.’ A proposal to carry out a modified form of satellite accounting for livestock is discussed in Part II of this report.
For rural smallholders, livestock also perform important economic functions as repositories of household savings, as assets that provide interest-free credit, and as insurance to mitigate risk. These ‘self-help’ financial services are especially important for rural people who lack access to formal financial institutions and depend instead on their livestock. The concluding sections of Part II briefly discuss methods that can be used to quantify in monetary terms the value of the informal financial services provided by livestock.
10
PART I – AGRICULTURAL GDP
1.1. Methodology
Ethiopia’s GDP estimates conform to internationally recognized standards codified in the System of National Accounts 1993, established by the United Nations and a group of international financial institutions, and the International Standard Industrial Classification of all Economic Activities, prepared by the United Nations Statistics Division. Application of these procedures in Ethiopia is guided by the National Accounts Statistics of Ethiopia: Sources and Methods-1992 (1999/2000) Base Year Series, a manual prepared by the National Accounts Department, Ministry of Finance and Economic Development (MOFED). The GDP estimates for Ethiopia are prepared by the National Accounts Department of MOFED.
GDP can be calculated in three ways, each of which should in theory give the same result. Ethiopia follows the production approach in which the outputs of every category of economic activity are summarized to arrive at total GDP. An alternative, the expenditure approach, assumes that all production must be purchased by somebody and that the total value of output must therefore equal the sum of all expenditures. Finally, the income approach assumes that producers’ incomes must be equal to the value of their outputs, and arrives at GDP by adding together the income from all sources. The production approach followed by Ethiopia is the most direct method for calculating GDP and is, almost certainly, the method followed by the remaining IGAD states. Methodologies and lessons developed in the analysis of the contribution of livestock to Ethiopian GDP are therefore likely to be pertinent to the other IGAD states.
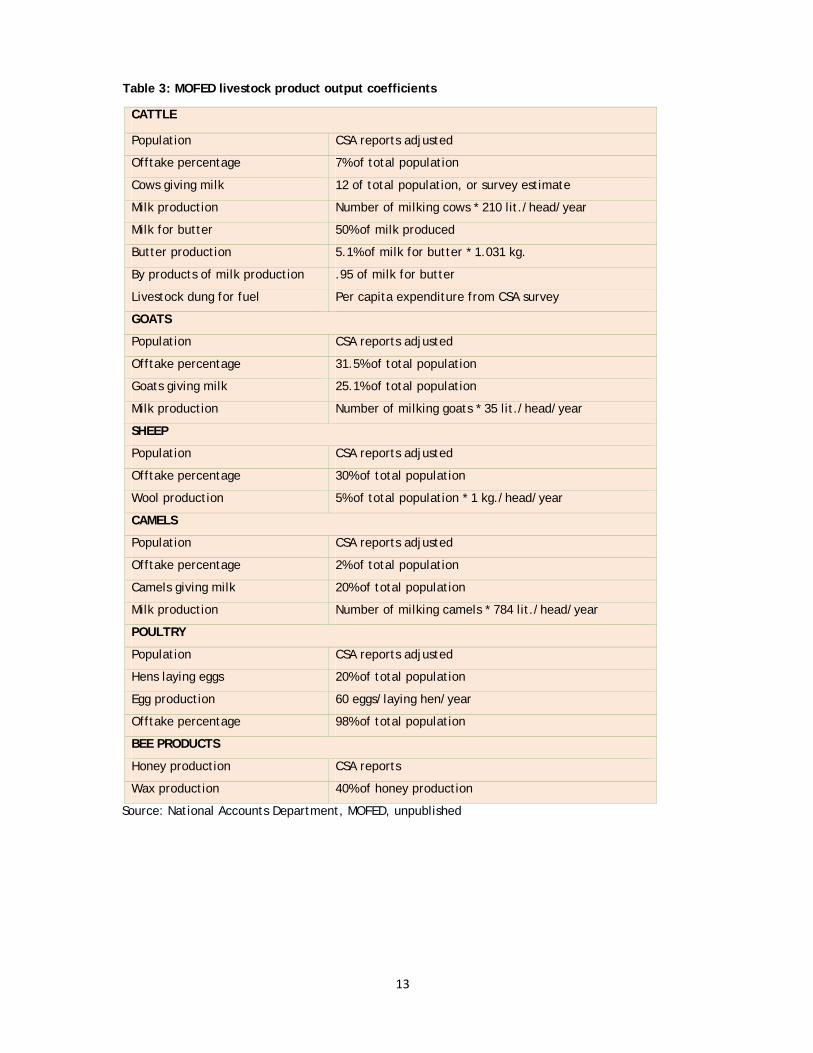
The calculation of livestock’s contribution to agricultural GDP in Ethiopia involves four different types of data. First, national livestock populations are estimated by MOFED based on data supplied by the Central Statistics Agency (CSA) (Table 1). Second, based on CSA producer price surveys, a monetary value expressed in Birr is ascribed to the output of each kind of livestock product (Table 2). Third, production coefficients are applied to the livestock population estimates to generate estimates of the total output of products such as meat, milk, butter, dung for fuel etc. (Table 3). The total monetary value of the output of various livestock products is termed the gross value of output. Finally, input costs (Table 4) are deducted from the gross value of output to estimate value added.
Calculations of GDP in this report are based either on information in Tables 1-4 or revised versions of these tables, as follows:
• As discussed in detail in the next section of this report, the CSA data on national livestock populations that forms the basis for Table 1 is flawed because it does not include the pastoral areas of Somali and Afar Regions. The following section of this report recommends a procedure for adjusting CSA annual livestock figures to incorporate all pastoral animals.
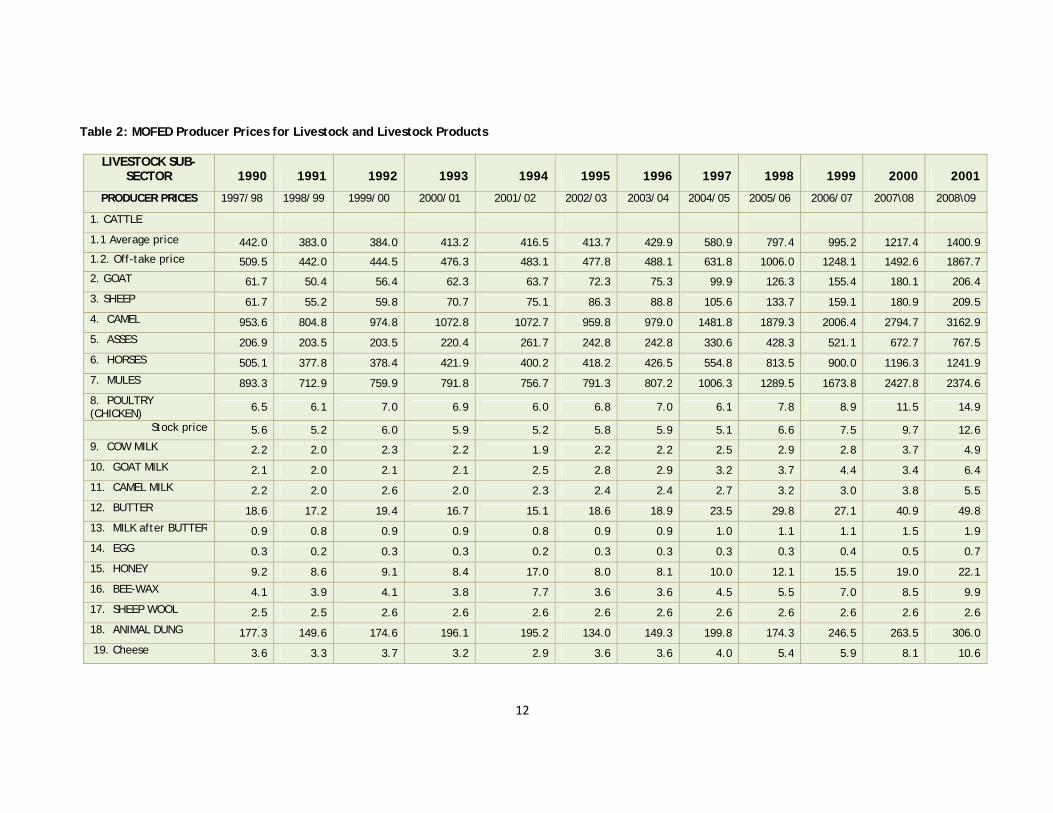
• Table 2, based on CSA surveys of producer prices, is the sole source of price data used in this report.
• The production coefficients presently used by MOFED and summarized in Table 3 are potentially outdated. Later sections of this report adjust these production coefficients in light of current research and survey evidence. These adjustments produce significant changes in the estimated volume of ruminant livestock production, in turn producing substantial increases in the estimated levels of agricultural GDP attributable to the livestock subsector.
• Table 4 gives MOFED’s estimates of the input costs associated with livestock production. Based on the aggregated figures in Table 4, it is not possible to assign precise costs to keeping particular species of livestock or to the production of particular livestock products.
11
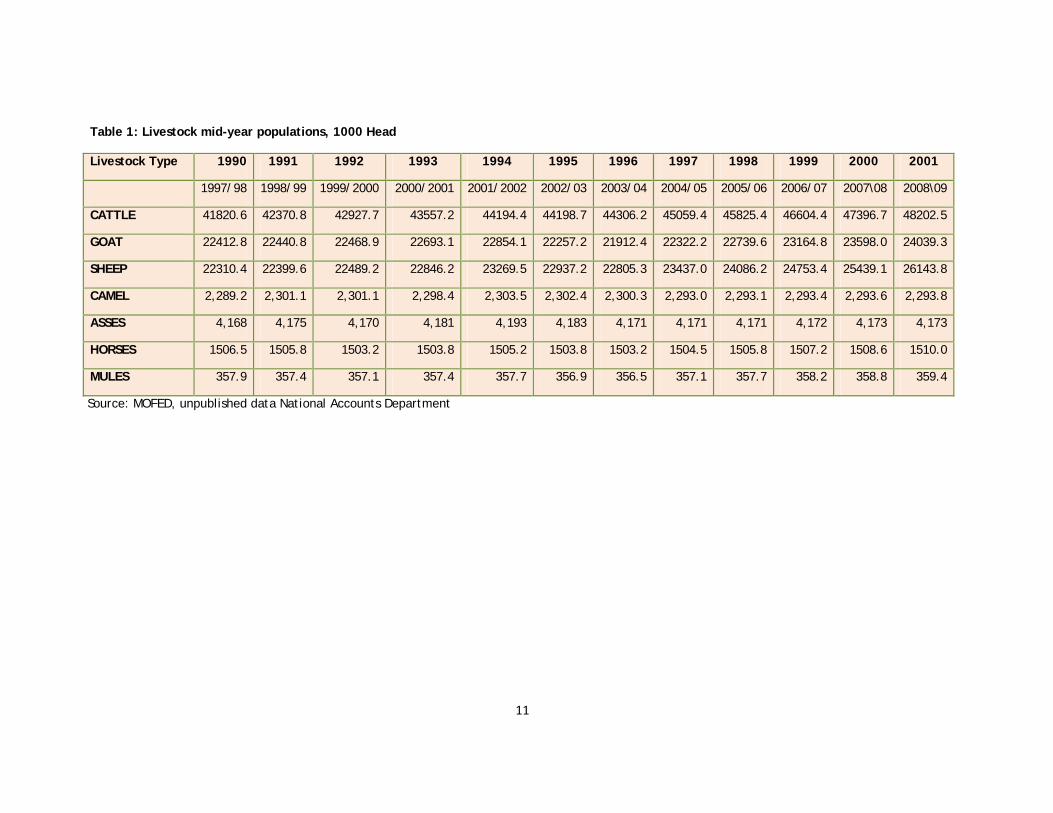
Table 1: Livestock mid-year populations, 1000 Head
Source: MOFED, unpublished data National Accounts Department
Livestock Type 1990 1991 1992 1993 1994 1995 1996 1997 1998 1999 2000 2001
1997/98 1998/99 1999/2000 2000/2001 2001/2002 2002/03 2003/04 2004/05 2005/06 2006/07 2007\08 2008\09
CATTLE 41820.6 42370.8 42927.7 43557.2 44194.4 44198.7 44306.2 45059.4 45825.4 46604.4 47396.7 48202.5
GOAT 22412.8 22440.8 22468.9 22693.1 22854.1 22257.2 21912.4 22322.2 22739.6 23164.8 23598.0 24039.3
SHEEP 22310.4 22399.6 22489.2 22846.2 23269.5 22937.2 22805.3 23437.0 24086.2 24753.4 25439.1 26143.8
CAMEL 2,289.2 2,301.1 2,301.1 2,298.4 2,303.5 2,302.4 2,300.3 2,293.0 2,293.1 2,293.4 2,293.6 2,293.8
ASSES 4,168 4,175 4,170 4,181 4,193 4,183 4,171 4,171 4,171 4,172 4,173 4,173
HORSES 1506.5 1505.8 1503.2 1503.8 1505.2 1503.8 1503.2 1504.5 1505.8 1507.2 1508.6 1510.0
MULES 357.9 357.4 357.1 357.4 357.7 356.9 356.5 357.1 357.7 358.2 358.8 359.4
12
Table 2: MOFED Producer Prices for Livestock and Livestock Products
LIVESTOCK SUB-SECTOR 1990 1991 1992 1993 1994 1995 1996 1997 1998 1999 2000 2001
PRODUCER PRICES 1997/98 1998/99 1999/00 2000/01 2001/02 2002/03 2003/04 2004/05 2005/06 2006/07 2007\08 2008\09
1. CATTLE
1.1 Average price 442.0 383.0 384.0 413.2 416.5 413.7 429.9 580.9 797.4 995.2 1217.4 1400.9 1.2. Off-take price 509.5 442.0 444.5 476.3 483.1 477.8 488.1 631.8 1006.0 1248.1 1492.6 1867.7 2. GOAT 61.7 50.4 56.4 62.3 63.7 72.3 75.3 99.9 126.3 155.4 180.1 206.4
3. SHEEP 61.7 55.2 59.8 70.7 75.1 86.3 88.8 105.6 133.7 159.1 180.9 209.5
4. CAMEL 953.6 804.8 974.8 1072.8 1072.7 959.8 979.0 1481.8 1879.3 2006.4 2794.7 3162.9
5. ASSES 206.9 203.5 203.5 220.4 261.7 242.8 242.8 330.6 428.3 521.1 672.7 767.5
6. HORSES 505.1 377.8 378.4 421.9 400.2 418.2 426.5 554.8 813.5 900.0 1196.3 1241.9
7. MULES 893.3 712.9 759.9 791.8 756.7 791.3 807.2 1006.3 1289.5 1673.8 2427.8 2374.6
8. POULTRY (CHICKEN) 6.5 6.1 7.0 6.9 6.0 6.8 7.0 6.1 7.8 8.9 11.5 14.9
Stock price 5.6 5.2 6.0 5.9 5.2 5.8 5.9 5.1 6.6 7.5 9.7 12.6 9. COW MILK 2.2 2.0 2.3 2.2 1.9 2.2 2.2 2.5 2.9 2.8 3.7 4.9
10. GOAT MILK 2.1 2.0 2.1 2.1 2.5 2.8 2.9 3.2 3.7 4.4 3.4 6.4
11. CAMEL MILK 2.2 2.0 2.6 2.0 2.3 2.4 2.4 2.7 3.2 3.0 3.8 5.5 12. BUTTER 18.6 17.2 19.4 16.7 15.1 18.6 18.9 23.5 29.8 27.1 40.9 49.8 13. MILK after BUTTER 0.9 0.8 0.9 0.9 0.8 0.9 0.9 1.0 1.1 1.1 1.5 1.9
14. EGG 0.3 0.2 0.3 0.3 0.2 0.3 0.3 0.3 0.3 0.4 0.5 0.7
15. HONEY 9.2 8.6 9.1 8.4 17.0 8.0 8.1 10.0 12.1 15.5 19.0 22.1
16. BEE-WAX 4.1 3.9 4.1 3.8 7.7 3.6 3.6 4.5 5.5 7.0 8.5 9.9
17. SHEEP WOOL 2.5 2.5 2.6 2.6 2.6 2.6 2.6 2.6 2.6 2.6 2.6 2.6 18. ANIMAL DUNG 177.3 149.6 174.6 196.1 195.2 134.0 149.3 199.8 174.3 246.5 263.5 306.0 19. Cheese 3.6 3.3 3.7 3.2 2.9 3.6 3.6 4.0 5.4 5.9 8.1 10.6
13
Table 3: MOFED livestock product output coefficients
CATTLE
Population CSA reports adjusted
Offtake percentage 7% of total population
Cows giving milk 12 of total population, or survey estimate
Milk production Number of milking cows * 210 lit./head/year
Milk for butter 50% of milk produced
Butter production 5.1% of milk for butter * 1.031 kg.
By products of milk production .95 of milk for butter
Livestock dung for fuel Per capita expenditure from CSA survey
GOATS
Population CSA reports adjusted
Offtake percentage 31.5% of total population
Goats giving milk 25.1% of total population
Milk production Number of milking goats * 35 lit./head/year
SHEEP
Population CSA reports adjusted
Offtake percentage 30% of total population
Wool production 5% of total population * 1 kg./head/year
CAMELS
Population CSA reports adjusted
Offtake percentage 2% of total population
Camels giving milk 20% of total population
Milk production Number of milking camels * 784 lit./head/year
POULTRY
Population CSA reports adjusted
Hens laying eggs 20% of total population
Egg production 60 eggs/laying hen/year
Offtake percentage 98% of total population
BEE PRODUCTS
Honey production CSA reports
Wax production 40% of honey production
Source: National Accounts Department, MOFED, unpublished

14
Table 4: Value of intermediate inputs for livestock production (current price)
Source: MOFED unpublished data
unit 1992 1993 1994 1995 1996 1997 1998 1999 2000 2001
1999/2000 2000/2001 2001/2002 2002/03 2003/04 2004/05 2005/06 2006/07 2007\08 2008\09
Prepared animal feed
000 birr
7707.7 9474.6 11306.0 13491.4 16908.6 18641.7 20552.5 21431.5 22351.0 23309.9
Vaccines 000 birr
23850.4 29318.7 25995.4 23048.8 20436.1 22530.8 22621.0 23588.5 24600.5 25655.9
Salt for cattle 000 birr
74694.2 77967.4 71153.0 72485.82 74434.4 79484.8 84877.8 88147.4 91548.6 95081.1
Poultry feed 000 birr
33887.0 23552.1 18883.8 29022.5 30814.2 36628.2 40483.8 42718.5 43625.2 44551.2
AI 000 birr
105.3 106.9 107.2 106.0 106.3 117.2 123.1 125.7 128.3 162.3
Oil cake 000 birr
30355 34228 190828 190828 191369 210984 232610 242559 252965 263817
TOTAL 000 birr
170597.3 174647.7 318273.9 328983.0 334068.5 368386.9 401268.3 418570.4 435218.4 452577.5
15
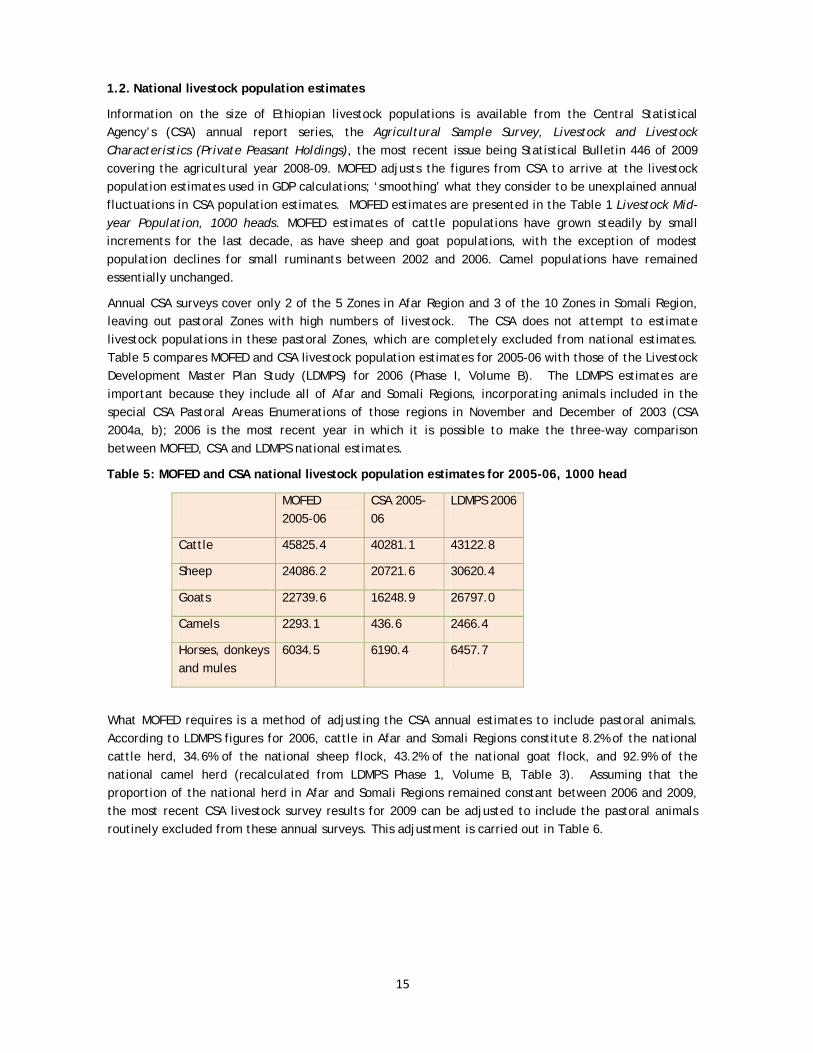
1.2. National livestock population estimates
Information on the size of Ethiopian livestock populations is available from the Central Statistical Agency’s (CSA) annual report series, the Agricultural Sample Survey, Livestock and Livestock Characteristics (Private Peasant Holdings), the most recent issue being Statistical Bulletin 446 of 2009 covering the agricultural year 2008-09. MOFED adjusts the figures from CSA to arrive at the livestock population estimates used in GDP calculations; ‘smoothing’ what they consider to be unexplained annual fluctuations in CSA population estimates. MOFED estimates are presented in the Table 1 Livestock Mid-year Population, 1000 heads. MOFED estimates of cattle populations have grown steadily by small increments for the last decade, as have sheep and goat populations, with the exception of modest population declines for small ruminants between 2002 and 2006. Camel populations have remained essentially unchanged.
Annual CSA surveys cover only 2 of the 5 Zones in Afar Region and 3 of the 10 Zones in Somali Region, leaving out pastoral Zones with high numbers of livestock. The CSA does not attempt to estimate livestock populations in these pastoral Zones, which are completely excluded from national estimates. Table 5 compares MOFED and CSA livestock population estimates for 2005-06 with those of the Livestock Development Master Plan Study (LDMPS) for 2006 (Phase I, Volume B). The LDMPS estimates are important because they include all of Afar and Somali Regions, incorporating animals included in the special CSA Pastoral Areas Enumerations of those regions in November and December of 2003 (CSA 2004a, b); 2006 is the most recent year in which it is possible to make the three-way comparison between MOFED, CSA and LDMPS national estimates.
Table 5: MOFED and CSA national livestock population estimates for 2005-06, 1000 head
MOFED 2005-06
CSA 2005-06
LDMPS 2006
Cattle 45825.4 40281.1 43122.8
Sheep 24086.2 20721.6 30620.4
Goats 22739.6 16248.9 26797.0
Camels 2293.1 436.6 2466.4
Horses, donkeys and mules
6034.5 6190.4 6457.7
What MOFED requires is a method of adjusting the CSA annual estimates to include pastoral animals. According to LDMPS figures for 2006, cattle in Afar and Somali Regions constitute 8.2% of the national cattle herd, 34.6% of the national sheep flock, 43.2% of the national goat flock, and 92.9% of the national camel herd (recalculated from LDMPS Phase 1, Volume B, Table 3). Assuming that the proportion of the national herd in Afar and Somali Regions remained constant between 2006 and 2009, the most recent CSA livestock survey results for 2009 can be adjusted to include the pastoral animals routinely excluded from these annual surveys. This adjustment is carried out in Table 6.
16
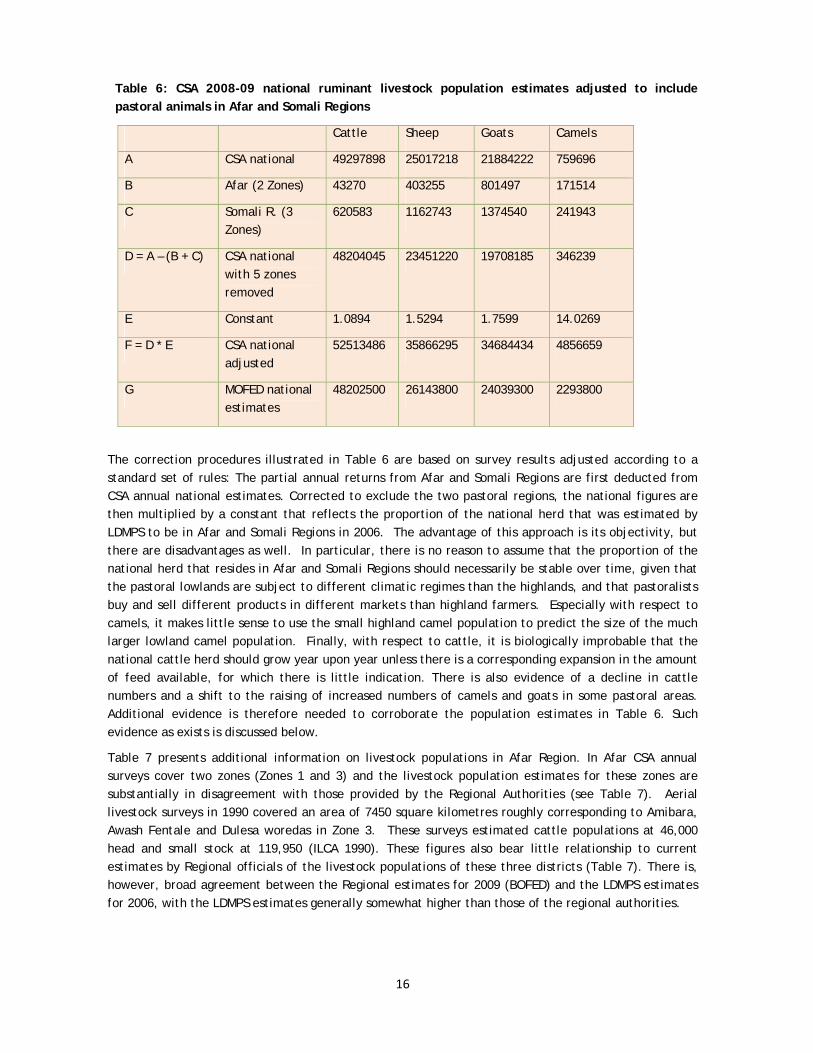
Table 6: CSA 2008-09 national ruminant livestock population estimates adjusted to include pastoral animals in Afar and Somali Regions
Cattle Sheep Goats Camels
A CSA national 49297898 25017218 21884222 759696
B Afar (2 Zones) 43270 403255 801497 171514
C Somali R. (3 Zones)
620583 1162743 1374540 241943
D = A – (B + C) CSA national with 5 zones removed
48204045 23451220 19708185 346239
E Constant 1.0894 1.5294 1.7599 14.0269
F = D * E CSA national adjusted
52513486 35866295 34684434 4856659
G MOFED national estimates
48202500 26143800 24039300 2293800
The correction procedures illustrated in Table 6 are based on survey results adjusted according to a standard set of rules: The partial annual returns from Afar and Somali Regions are first deducted from CSA annual national estimates. Corrected to exclude the two pastoral regions, the national figures are then multiplied by a constant that reflects the proportion of the national herd that was estimated by LDMPS to be in Afar and Somali Regions in 2006. The advantage of this approach is its objectivity, but there are disadvantages as well. In particular, there is no reason to assume that the proportion of the national herd that resides in Afar and Somali Regions should necessarily be stable over time, given that the pastoral lowlands are subject to different climatic regimes than the highlands, and that pastoralists buy and sell different products in different markets than highland farmers. Especially with respect to camels, it makes little sense to use the small highland camel population to predict the size of the much larger lowland camel population. Finally, with respect to cattle, it is biologically improbable that the national cattle herd should grow year upon year unless there is a corresponding expansion in the amount of feed available, for which there is little indication. There is also evidence of a decline in cattle numbers and a shift to the raising of increased numbers of camels and goats in some pastoral areas. Additional evidence is therefore needed to corroborate the population estimates in Table 6. Such evidence as exists is discussed below.
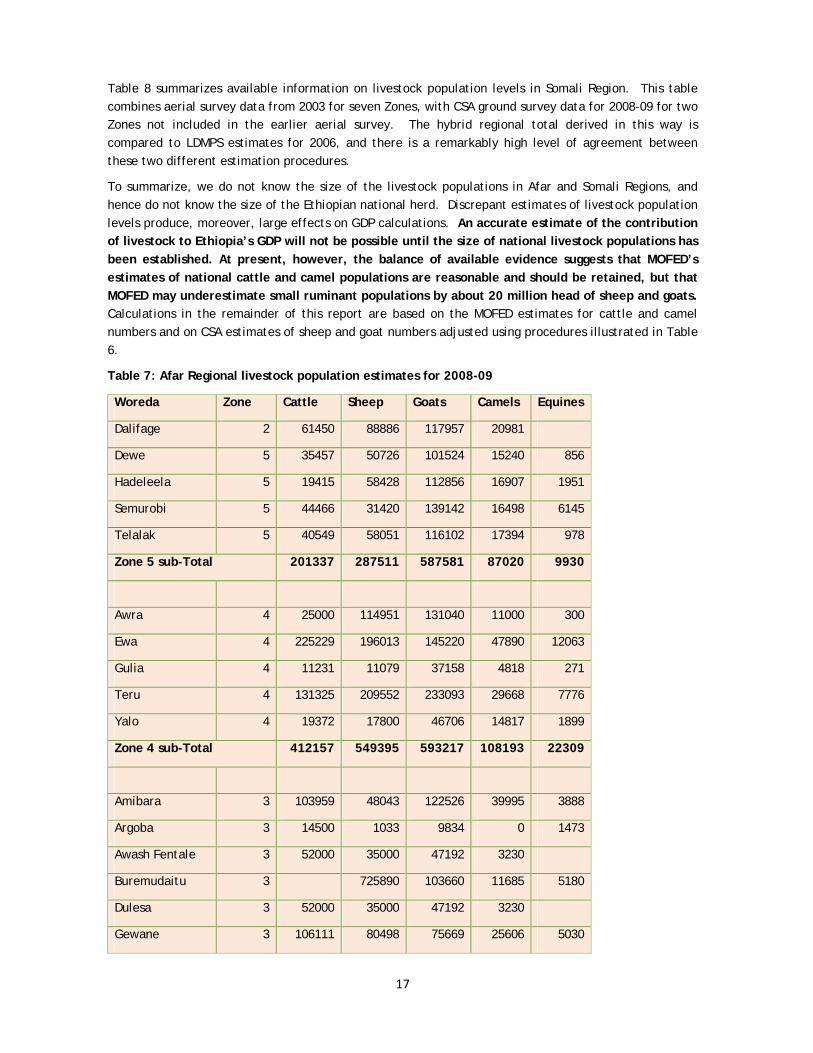
Table 7 presents additional information on livestock populations in Afar Region. In Afar CSA annual surveys cover two zones (Zones 1 and 3) and the livestock population estimates for these zones are substantially in disagreement with those provided by the Regional Authorities (see Table 7). Aerial livestock surveys in 1990 covered an area of 7450 square kilometres roughly corresponding to Amibara, Awash Fentale and Dulesa woredas in Zone 3. These surveys estimated cattle populations at 46,000 head and small stock at 119,950 (ILCA 1990). These figures also bear little relationship to current estimates by Regional officials of the livestock populations of these three districts (Table 7). There is, however, broad agreement between the Regional estimates for 2009 (BOFED) and the LDMPS estimates for 2006, with the LDMPS estimates generally somewhat higher than those of the regional authorities.
17
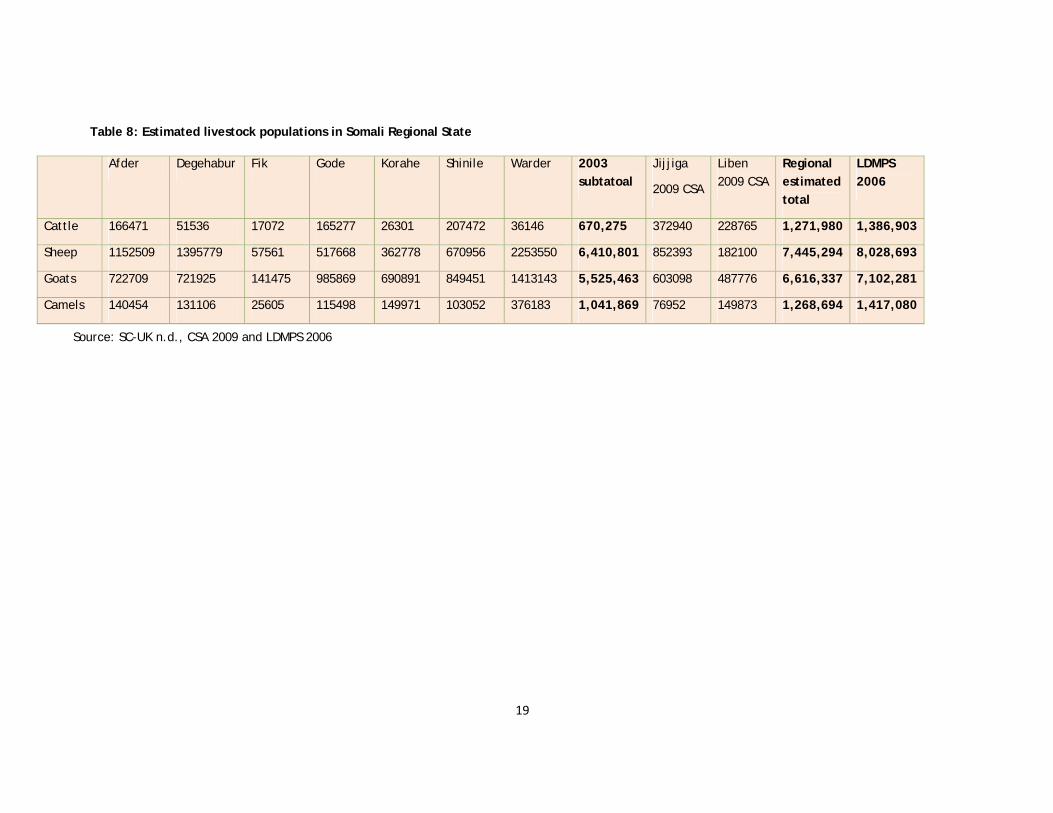
Table 8 summarizes available information on livestock population levels in Somali Region. This table combines aerial survey data from 2003 for seven Zones, with CSA ground survey data for 2008-09 for two Zones not included in the earlier aerial survey. The hybrid regional total derived in this way is compared to LDMPS estimates for 2006, and there is a remarkably high level of agreement between these two different estimation procedures.
To summarize, we do not know the size of the livestock populations in Afar and Somali Regions, and hence do not know the size of the Ethiopian national herd. Discrepant estimates of livestock population levels produce, moreover, large effects on GDP calculations. An accurate estimate of the contribution of livestock to Ethiopia’s GDP will not be possible until the size of national livestock populations has been established. At present, however, the balance of available evidence suggests that MOFED’s estimates of national cattle and camel populations are reasonable and should be retained, but that MOFED may underestimate small ruminant populations by about 20 million head of sheep and goats. Calculations in the remainder of this report are based on the MOFED estimates for cattle and camel numbers and on CSA estimates of sheep and goat numbers adjusted using procedures illustrated in Table 6.
Table 7: Afar Regional livestock population estimates for 2008-09
Woreda Zone Cattle Sheep Goats Camels Equines
Dalifage 2 61450 88886 117957 20981
Dewe 5 35457 50726 101524 15240 856
Hadeleela 5 19415 58428 112856 16907 1951
Semurobi 5 44466 31420 139142 16498 6145
Telalak 5 40549 58051 116102 17394 978
Zone 5 sub-Total 201337 287511 587581 87020 9930
Awra 4 25000 114951 131040 11000 300
Ewa 4 225229 196013 145220 47890 12063
Gulia 4 11231 11079 37158 4818 271
Teru 4 131325 209552 233093 29668 7776
Yalo 4 19372 17800 46706 14817 1899
Zone 4 sub-Total 412157 549395 593217 108193 22309
Amibara 3 103959 48043 122526 39995 3888
Argoba 3 14500 1033 9834 0 1473
Awash Fentale 3 52000 35000 47192 3230
Buremudaitu 3 725890 103660 11685 5180
Dulesa 3 52000 35000 47192 3230
Gewane 3 106111 80498 75669 25606 5030
18
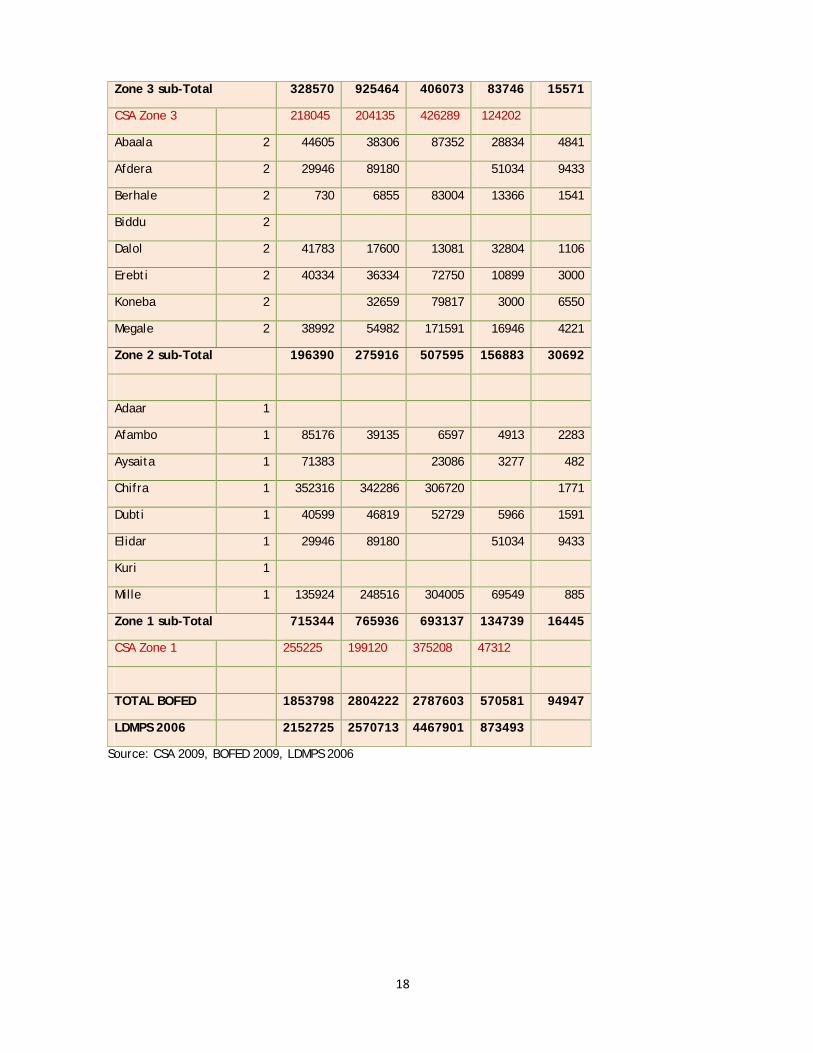
Zone 3 sub-Total 328570 925464 406073 83746 15571
CSA Zone 3 218045 204135 426289 124202
Abaala 2 44605 38306 87352 28834 4841
Afdera 2 29946 89180 51034 9433
Berhale 2 730 6855 83004 13366 1541
Biddu 2
Dalol 2 41783 17600 13081 32804 1106
Erebti 2 40334 36334 72750 10899 3000
Koneba 2 32659 79817 3000 6550
Megale 2 38992 54982 171591 16946 4221
Zone 2 sub-Total 196390 275916 507595 156883 30692
Adaar 1
Afambo 1 85176 39135 6597 4913 2283
Aysaita 1 71383 23086 3277 482
Chifra 1 352316 342286 306720 1771
Dubti 1 40599 46819 52729 5966 1591
Elidar 1 29946 89180 51034 9433
Kuri 1
Mille 1 135924 248516 304005 69549 885
Zone 1 sub-Total 715344 765936 693137 134739 16445
CSA Zone 1 255225 199120 375208 47312
TOTAL BOFED 1853798 2804222 2787603 570581 94947
LDMPS 2006 2152725 2570713 4467901 873493
Source: CSA 2009, BOFED 2009, LDMPS 2006
19
Table 8: Estimated livestock populations in Somali Regional State
Source: SC-UK n.d., CSA 2009 and LDMPS 2006
Afder Degehabur Fik Gode Korahe Shinile Warder 2003 subtatoal
Jijjiga
2009 CSA
Liben 2009 CSA
Regional estimated total
LDMPS 2006
Cattle 166471 51536 17072 165277 26301 207472 36146 670,275 372940 228765 1,271,980 1,386,903
Sheep 1152509 1395779 57561 517668 362778 670956 2253550 6,410,801 852393 182100 7,445,294 8,028,693
Goats 722709 721925 141475 985869 690891 849451 1413143 5,525,463 603098 487776 6,616,337 7,102,281
Camels 140454 131106 25605 115498 149971 103052 376183 1,041,869 76952 149873 1,268,694 1,417,080
20
1.3. Livestock production estimates
To determine the volume of production, MOFED uses a set of coefficients that estimate the output of a know number of livestock. These coefficients were developed in the 1980s in order to construct national economic plans under the Derg regime. MOFED could not give scholarly or scientific references for these production coefficients. The following sections of this report re-examine the probable accuracy of those coefficients that pertain to ruminant livestock. In light of this review, we suggest some modifications to the existing coefficients and calculate the likely impact of these adjustments on the volume and value of different livestock products.
1.3.1. Offtake rates – cattle, small ruminants and camels
An overview of available information on livestock offtake rates is provided in Table 9.
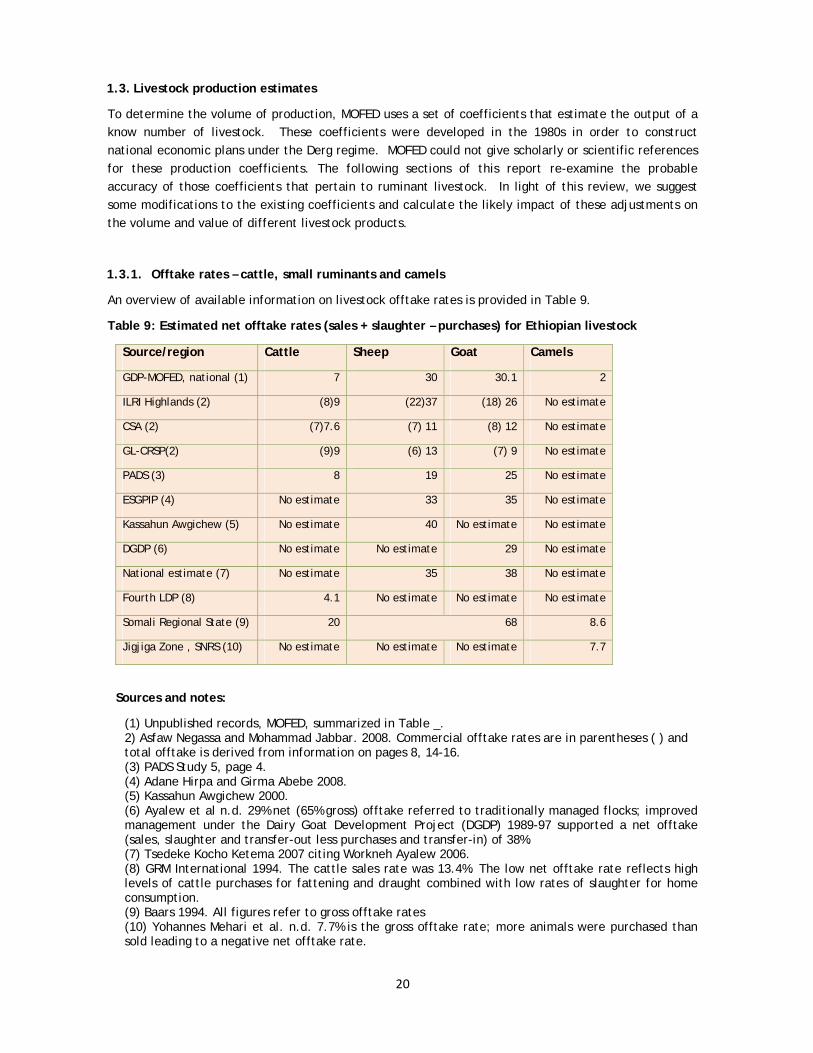
Table 9: Estimated net offtake rates (sales + slaughter – purchases) for Ethiopian livestock
Source/region Cattle Sheep Goat Camels
GDP-MOFED, national (1) 7 30 30.1 2
ILRI Highlands (2) (8)9 (22)37 (18) 26 No estimate
CSA (2) (7)7.6 (7) 11 (8) 12 No estimate
GL-CRSP(2) (9)9 (6) 13 (7) 9 No estimate
PADS (3) 8 19 25 No estimate
ESGPIP (4) No estimate 33 35 No estimate
Kassahun Awgichew (5) No estimate 40 No estimate No estimate
DGDP (6) No estimate No estimate 29 No estimate
National estimate (7) No estimate 35 38 No estimate
Fourth LDP (8) 4.1 No estimate No estimate No estimate
Somali Regional State (9) 20 68 8.6
Jigjiga Zone , SNRS (10) No estimate No estimate No estimate 7.7
Sources and notes:
(1) Unpublished records, MOFED, summarized in Table _. 2) Asfaw Negassa and Mohammad Jabbar. 2008. Commercial offtake rates are in parentheses ( ) and total offtake is derived from information on pages 8, 14-16. (3) PADS Study 5, page 4.
(4) Adane Hirpa and Girma Abebe 2008. (5) Kassahun Awgichew 2000.
(6) Ayalew et al n.d. 29% net (65% gross) offtake referred to traditionally managed flocks; improved management under the Dairy Goat Development Project (DGDP) 1989-97 supported a net offtake (sales, slaughter and transfer-out less purchases and transfer-in) of 38%.
(7) Tsedeke Kocho Ketema 2007 citing Workneh Ayalew 2006. (8) GRM International 1994. The cattle sales rate was 13.4%. The low net offtake rate reflects high
levels of cattle purchases for fattening and draught combined with low rates of slaughter for home consumption.
(9) Baars 1994. All figures refer to gross offtake rates (10) Yohannes Mehari et al. n.d. 7.7% is the gross offtake rate; more animals were purchased than sold leading to a negative net offtake rate.
21
Several points require emphasis:
a) The balance of recent survey evidence suggests that the national cattle net offtake rate is around 9%, rather than the 7% used by MOFED. Evidence of a much lower offtake rate (4.1%, Fourth Livestock Development Project) comes from 1990-1993 and reflects lower levels of market development at that time.
b) Quoted sheep and goat offtake rates are highly variable. The higher offtake estimates come from more recent sources (ESGPIP 2008; Ketema 2007 citing Ayaleu 2006), suggesting a secular trend towards higher levels of market involvement and sales by small ruminant producers. This possible trend warrants further investigation, but there is at present insufficient evidence to justify an increase in the estimated rates of sheep or goat offtake currently used by MOFED.
c) There is insufficient evidence to warrant changing the MOFED estimated camel offtake rate of 2% of the total herd.
d) Offtake rates are variable over time and the results of single-year studies must be treated with caution. This is especially true in the lowlands where recurrent cycles of drought and recovery produce periods of high offtake during droughts followed by periods of herd recovery when offtake rates are minimal. Used by their owners both as a buffer against drought and as the fastest form of livestock accumulation following a drought, small ruminants are particularly exposed to alternating periods of high and low offtake.
e) Offtake rates measured in head of livestock can be misleading when producers purchase young stock for fattening. When offtake is estimated per head, a small or young animal entering a herd will be counted as the equal to a larger or older animal leaving a herd, irrespective of the different mean weights at which animals enter and exit the herd.
1.3.2. Cattle milk yields
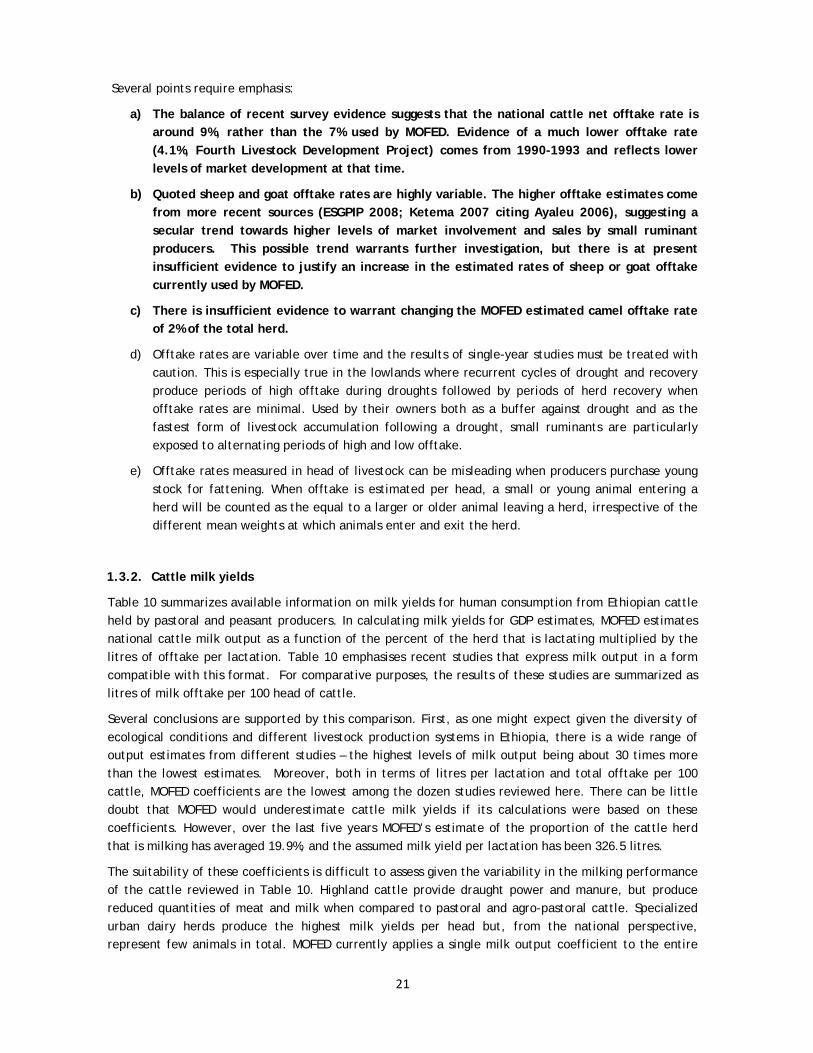
Table 10 summarizes available information on milk yields for human consumption from Ethiopian cattle held by pastoral and peasant producers. In calculating milk yields for GDP estimates, MOFED estimates national cattle milk output as a function of the percent of the herd that is lactating multiplied by the litres of offtake per lactation. Table 10 emphasises recent studies that express milk output in a form compatible with this format. For comparative purposes, the results of these studies are summarized as litres of milk offtake per 100 head of cattle.
Several conclusions are supported by this comparison. First, as one might expect given the diversity of ecological conditions and different livestock production systems in Ethiopia, there is a wide range of output estimates from different studies – the highest levels of milk output being about 30 times more than the lowest estimates. Moreover, both in terms of litres per lactation and total offtake per 100 cattle, MOFED coefficients are the lowest among the dozen studies reviewed here. There can be little doubt that MOFED would underestimate cattle milk yields if its calculations were based on these coefficients. However, over the last five years MOFED’s estimate of the proportion of the cattle herd that is milking has averaged 19.9%, and the assumed milk yield per lactation has been 326.5 litres.
The suitability of these coefficients is difficult to assess given the variability in the milking performance of the cattle reviewed in Table 10. Highland cattle provide draught power and manure, but produce reduced quantities of meat and milk when compared to pastoral and agro-pastoral cattle. Specialized urban dairy herds produce the highest milk yields per head but, from the national perspective, represent few animals in total. MOFED currently applies a single milk output coefficient to the entire
22
national herd. Arguably, a more accurate procedure would be to divide the national cattle herd into different production systems and to separately estimate the mean output per head for each system.
Additional research would be required to conclusively identify a single appropriate milk yield coefficient. In lieu of this research, calculations of milk output in this report assume the production of 9216 litres of milk for human consumption per 100 head of cattle per year. This is the mean output from 7 rural studies summarized in Table 10 (excluding MOFED’s estimates, an anomalously high value in one Somali study (Baars 2000) and SNNPR unban dairy operations). The recommended formula for determining cattle milk output is:
20.6 (percentage of cattle herd giving milk) * 448 (litres of milk per lactation) * = 9216 litres of milk for human consumption per 100 head of cattle
Table 10: Estimated milk offtake from Ethiopian cattle populations
Sources and notes:
(1) Unpublished records, MOFED, based on a three year moving average of data obtained from the CSA. (2) Gryseels n.d. (3) Central Statistical Agency. 2009. Derived from data on pages 26, 37, 111. (4) GRM International 1994. Derived from data on pages 16, 21, 39, 49. (5) Azage Tegegne et al. 2009. Derived from information on pages 27, 44, 45. (6) D.L. Coppock. 1994. Derived from information on pages 155, 145, 171. (7) GRM International 1994. Derived from data on pages 16, 21, 39, 51. (8) Davies, J. 2003. Derived from information on pages 190-94, 196, 197. (9) Baars, R.M.T. 2000. (10) Sintayehu Tigrem et al. 2008. Derived from information on pages 22-24. (11) Adugna Tolera and Aster Abebe 2007. (12) Hussen et al. 2008
Source/region Percent herd lactating
Litres offtake per lactation
Litres offtake per 100 head of cattle
GDP-MOFED, national (1) 12 210 2520
Gryseels (2) 9.5 292 2774
Central Statistics Authority, national (3)
20 238 4760
MOFED 2005-09 (1) 19.8 326.5 6465
Highland zebu (4) 15.5 447 6934
Gondor transhumant (5) 14.8 540 8004
Borana pastoral (6) 31.5 294 9261
Highland crossbreed (7) 15.5 923 14317
Afar pastoral (8) 41 401 18464
Somali pastoral (9) 23.5 2285 53675
SNNPR, urban dairy herds (10) 50.7 1516 76863
Southern Ethiopia (11) No estimate 555 No estimate
Mieso, Orimiya (12) No estimate 271 No estimate
23
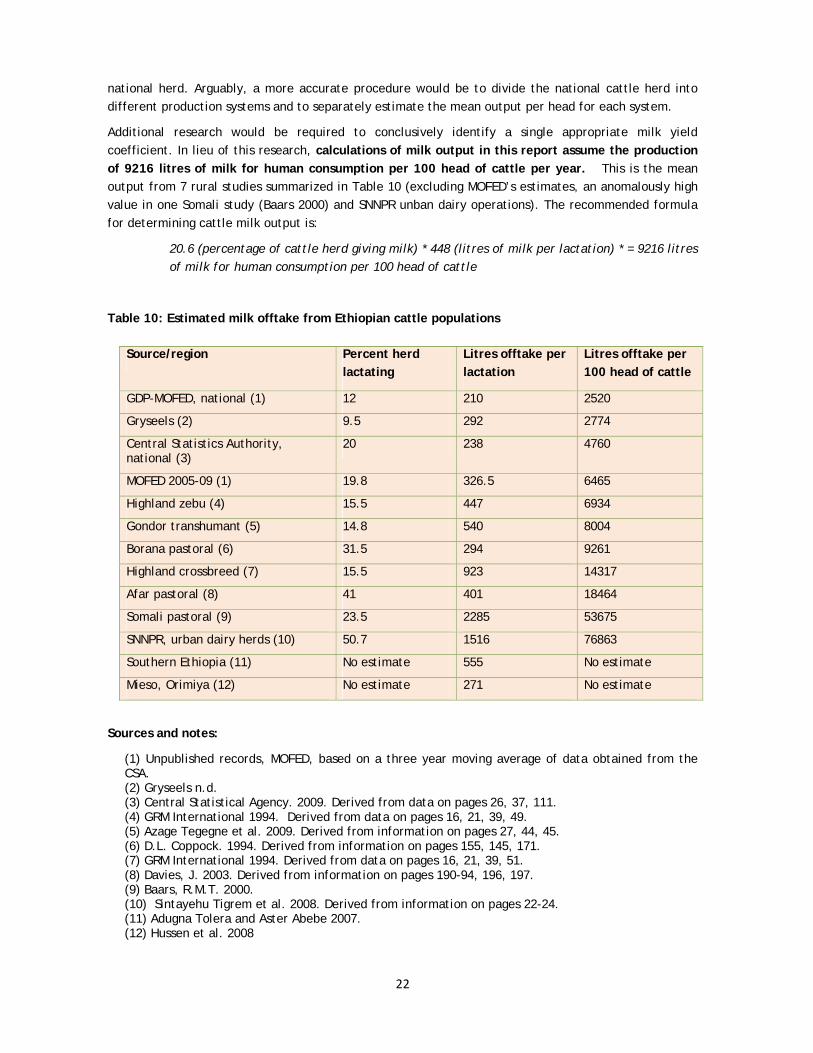
1.3.3. Milk yields from small ruminants
We have been able to locate only two studies that express goat milk output as a function of total goat numbers, the format used by MOFED in their calculations (Table 11). It has therefore been necessary to construct a composite estimate of goat milk output based on the following assumptions:
• 43% of the national goat flock are breeding females, as documented in the Afar study in Table 11
• highland small ruminants have 1.2 births per year (Gryseels n.d.) as compared to 1.7 births per year for lowland flocks in Afar (Davies 2003), or an unweighted mean national birth rate of 1.45
• excluding MOFED’s undocumented estimate, unweighted mean lactation yields in Table 11 are 46.5 litres/year.
Combining these assumptions, 100 head of goats yields 2899 litres per year. The recommended formula for determining goat milk output is:
[43 (percentage breeding females) * 1.45 (mean birth rate/year)] * 46.5 (litres per lactation) = 2899 litres of milk output per 100 head of goats per year.
Table 11: Estimated milk offtake from Ethiopian goat populations
Source/region Percent flock lactating/year
Litres offtake per lactation
Litres offtake per 100 head of goats
GDP-MOFED, national (1) 25.1 35 752.5
Central Statistics Authority, national (2) No estimate No estimate No estimate
Borana pastoral (3) No estimate Average daily offtake .32kg/head
No estimate
Afar pastoral (4) 73 54 3947
Somali pastoral (5) 29 42 1218
Borana/Garri (6) No estimate 43 No estimate
Borana (7) No estimate 47 No estimate
Sources and notes:
(1) Unpublished records, MOFED (2) Central Statistical Agency. 2009. (3) D.L. Coppock. 1994. Derived from information on pages 155, 145, 171. (4) Davies, J. 2003. Derived from information on pages 196-7. 43% of the flock is composed of adult females who give 1.7 births per year, giving a yearly milk offtake per female of 91.8 litres (5) Baars, R.M.T. 2000. Derived from information on pages 116, 121; calculations refer to combined flocks of sheep and goats. (6) Adugna Tolera and Aster Abebe. 2007. (7) Cossins NJ, Upton M. 1987.
24
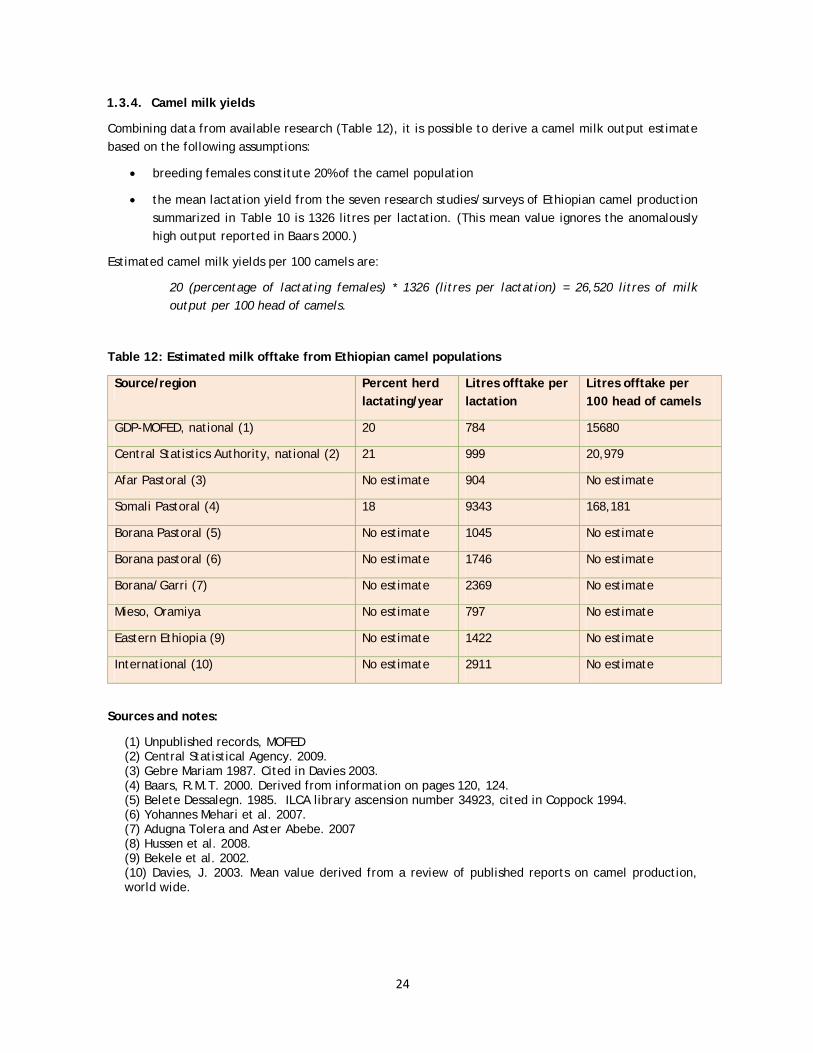
1.3.4. Camel milk yields
Combining data from available research (Table 12), it is possible to derive a camel milk output estimate based on the following assumptions:
• breeding females constitute 20% of the camel population
• the mean lactation yield from the seven research studies/surveys of Ethiopian camel production summarized in Table 10 is 1326 litres per lactation. (This mean value ignores the anomalously high output reported in Baars 2000.)
Estimated camel milk yields per 100 camels are:
20 (percentage of lactating females) * 1326 (litres per lactation) = 26,520 litres of milk output per 100 head of camels.
Table 12: Estimated milk offtake from Ethiopian camel populations
Source/region Percent herd lactating/year
Litres offtake per lactation
Litres offtake per 100 head of camels
GDP-MOFED, national (1) 20 784 15680
Central Statistics Authority, national (2) 21 999 20,979
Afar Pastoral (3) No estimate 904 No estimate
Somali Pastoral (4) 18 9343 168,181
Borana Pastoral (5) No estimate 1045 No estimate
Borana pastoral (6) No estimate 1746 No estimate
Borana/Garri (7) No estimate 2369 No estimate
Mieso, Oramiya No estimate 797 No estimate
Eastern Ethiopia (9) No estimate 1422 No estimate
International (10) No estimate 2911 No estimate
Sources and notes:
(1) Unpublished records, MOFED (2) Central Statistical Agency. 2009. (3) Gebre Mariam 1987. Cited in Davies 2003. (4) Baars, R.M.T. 2000. Derived from information on pages 120, 124. (5) Belete Dessalegn. 1985. ILCA library ascension number 34923, cited in Coppock 1994. (6) Yohannes Mehari et al. 2007. (7) Adugna Tolera and Aster Abebe. 2007 (8) Hussen et al. 2008. (9) Bekele et al. 2002. (10) Davies, J. 2003. Mean value derived from a review of published reports on camel production, world wide.
25
1.3.5. Production of livestock dung for fuel
In contrast to the methods used to compute the output of other livestock products, MOFED estimates of the value of dung used for fuel are based on CSA surveys of household expenditures on dung purchases (Sources and Methods, MOFED 2005). Most of the dung used for fuel is produced by farm households for their own use and is not bought or sold. By ignoring home production for home consumption, the use of CSA expenditure data underestimates the total value of dung as fuel. The inclusion within GDP accounts of home produced dung is permitted in terms of the NSA guidelines which encourage the valuation of home consumed agricultural production and specifically mention firewood, which performs a function similar to dung used for fuel:
The following types of production by households are, therefore, included [in estimates of GDP] whether intended for own final consumption or not: (a) The production of agricultural products and their subsequent storage…wood-cutting and the collection of firewood (SNA 1993: 125).
According to the Ethiopian Energy Authority, dairy cattle produce 2.01 kg. manure per head per day and nondairy cattle produce 2.27 kg/head/day (Asress Wolde Giogris n.d.). Based on data collected from 1987-93 the EEA calculates that 22% of all manure produced is used for fuel. (Hawando n.d. gives a higher utilization rate of 38% but provides no evidence for this estimate.) Based on EEA estimates, annual manure used for fuel per head of nondairy cattle can be calculated as follows:
2.27 (kg manure/head/day) * 365 (days per year) * .22 (utilization rate) = 182 kg dung used for fuel/head/year
An alternative method of calculation can be based on data provided in a study of manure use in Amhara Region (Mekonnen and Kohlin 2009). The mean weight of dung used for fuel by households in this study was equivalent to 293 kg dung used for fuel/head of cattle/year.
Gryseels and Goe n.d. calculated that farm households near Debre Zeit and Bebre Berhan used on average 2.314 tons of dung for fuel per year in the early 1980s. Mean livestock holdings (equines, cattle and small ruminants combined) for these households were 7.3 TLU per household, the equivalent of about 10.4 cattle. Expressing household dung use as a function of cattle numbers, each unit of cattle produced the equivalent of 222.5 kg of dung for fuel per year.
In this report we estimate that on average the amount of dung used for fuel per head of cattle is 232.5 kg., the mean of the three available studies.
1.3.6. Use of cattle draught power for the production of annual crops
About 80% of Ethiopian farmers use animal traction to plough their fields (CSA Agricultural Sample Enumeration 2001-02). In the Ethiopian highlands the area under cultivation is positively associated with cattle ownership (Abdinasir 2000; Bogale 2009; Gryseels n.d.; Meregia and Legesse 2005). Ploughing with cattle also increases crop output per hectare. According to a study in Oromiya Region based on CSA survey data, farmers who used oxen or a combination of oxen and hand cultivation obtained higher yields of both teff and maize compared to farmers using hand cultivation alone (Meregia and Legesse 2005). In an earlier study, Gryseels showed that highland farmers with one oxen increased their net farm cereal production by 267 kg more than farmers with no oxen, gaining a further 186 kg on average if they owned a second ox. MOFED makes no attempt to calculate the contribution of animal draught power to arable output.
26
The monetary value that farmers put on draught power can be estimated at prevailing sharecropping or oxen rental rates, using the following formula:
.80 (percentage of farmers using animal draught power for cultivation * .33 (portion of crop output paid for animal draught in sharecropping arrangements) = .264 * the value of annual crops.
In the above formula, the costing of animal draught at 33% of crop output is based on Meregia and Legesse (2005). According to earlier data collected by Gryseels, highland farmers in Debre Zeit and Debre Berhan, would have expended on average 23% of their output of cereals and pulses on hiring a team of two oxen, based on the rental of an oxen costing between 200-225 kg of grain per year. Webb and von Braun (IFPRI Research Rept. 92) report a higher rental fee of 320 kg per oxen per annum in 1984. Teklu (2004) and Aune et al. (2001) impliy sharecropping oxen rental rates approaching half of crop output. Oxen rental prices vary according to the relative value of land, labour and oxen in a community at a particular time, and these rates require more exhaustive investigation before attempting to determine a single national value.
There can be little doubt that the value of animal traction for purposes of cultivation can legitimately be included in national accounts. The SNA 1993 states:
Goods and services produced for own final use are included within the production boundary of the System….The goods and services should be valued at the basic prices at which they could be sold if offered for sale on the market. In order to value them in this way, goods or services of the same kind must actually be bought and sold in sufficient quantities on the market to enable reliable market prices to be calculated which can be used for valuation purposes (SNA 1993: 133).
The production of services must be confined to activities that are capable of being carried out by one unit for the benefit of another….It is also possible for a unit to produce a service for its own consumption provided that the type of activity is such that it could have been carried out by another unit (SNA 1993: 123).
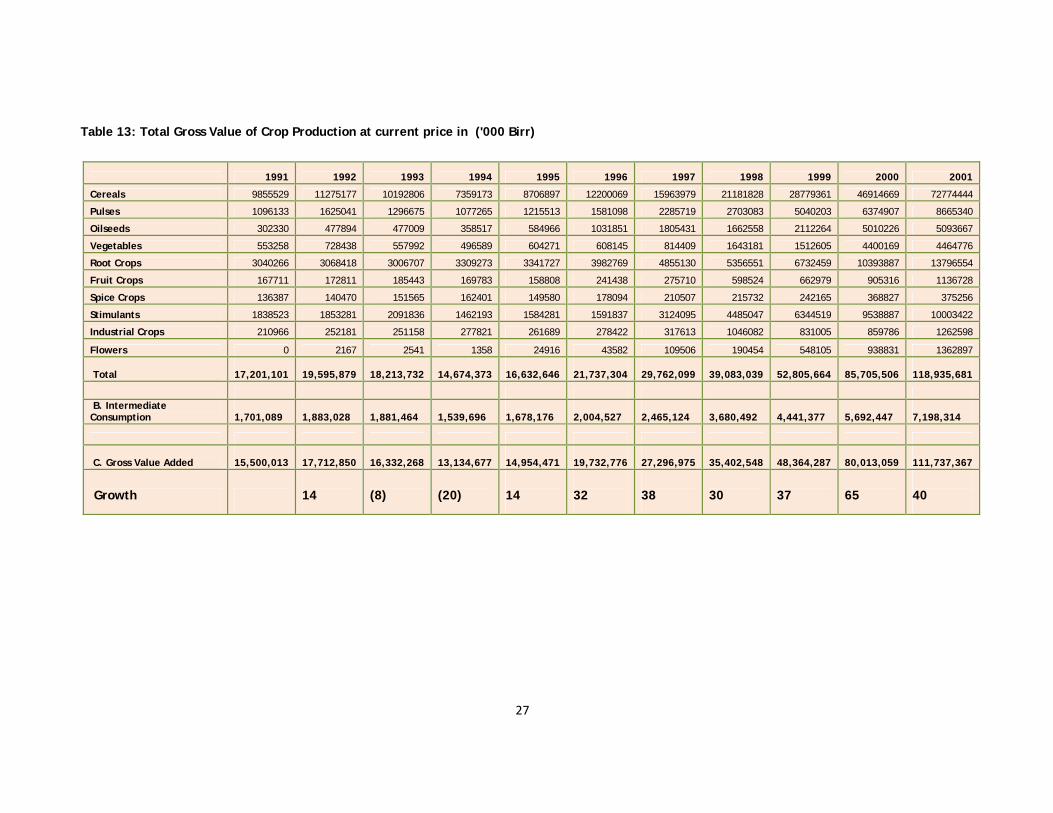
Table 13 gives MOFED’s estimates of the gross value of crop production for the last 10 years. The combined value of cereals and pulses provides a reasonable estimate of the value of those crops that are cultivated annually using animal draught. The monetary value of animal draught power as an input (or as intermediate cost) in crop production can be estimated at about 26% of the value of cereal and pulse production.
27
Table 13: Total Gross Value of Crop Production at current price in ('000 Birr)
1991 1992 1993 1994 1995 1996 1997 1998 1999 2000 2001
Cereals 9855529 11275177 10192806 7359173 8706897 12200069 15963979 21181828 28779361 46914669 72774444
Pulses 1096133 1625041 1296675 1077265 1215513 1581098 2285719 2703083 5040203 6374907 8665340
Oilseeds 302330 477894 477009 358517 584966 1031851 1805431 1662558 2112264 5010226 5093667
Vegetables 553258 728438 557992 496589 604271 608145 814409 1643181 1512605 4400169 4464776
Root Crops 3040266 3068418 3006707 3309273 3341727 3982769 4855130 5356551 6732459 10393887 13796554
Fruit Crops 167711 172811 185443 169783 158808 241438 275710 598524 662979 905316 1136728
Spice Crops 136387 140470 151565 162401 149580 178094 210507 215732 242165 368827 375256
Stimulants 1838523 1853281 2091836 1462193 1584281 1591837 3124095 4485047 6344519 9538887 10003422
Industrial Crops 210966 252181 251158 277821 261689 278422 317613 1046082 831005 859786 1262598
Flowers 0 2167 2541 1358 24916 43582 109506 190454 548105 938831 1362897
Total 17,201,101
19,595,879
18,213,732
14,674,373
16,632,646
21,737,304
29,762,099
39,083,039
52,805,664
85,705,506
118,935,681
B. Intermediate Consumption
1,701,089
1,883,028
1,881,464
1,539,696
1,678,176
2,004,527
2,465,124
3,680,492
4,441,377
5,692,447
7,198,314
C. Gross Value Added 15,500,013
17,712,850
16,332,268
13,134,677
14,954,471
19,732,776
27,296,975
35,402,548
48,364,287
80,013,059
111,737,367
Growth 14
(8)
(20)
14
32
38
30
37
65
40
28
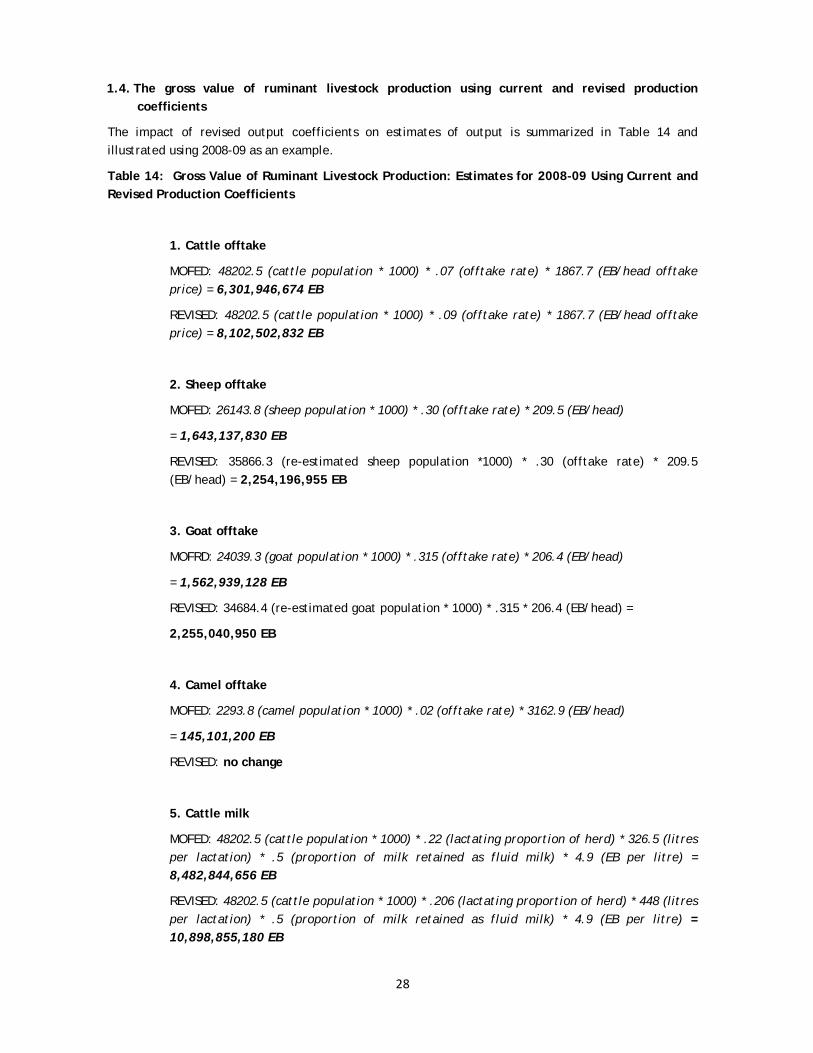
1.4. The gross value of ruminant livestock production using current and revised production coefficients
The impact of revised output coefficients on estimates of output is summarized in Table 14 and illustrated using 2008-09 as an example.
Table 14: Gross Value of Ruminant Livestock Production: Estimates for 2008-09 Using Current and Revised Production Coefficients
1. Cattle offtake
MOFED: 48202.5 (cattle population * 1000) * .07 (offtake rate) * 1867.7 (EB/head offtake price) = 6,301,946,674 EB
REVISED: 48202.5 (cattle population * 1000) * .09 (offtake rate) * 1867.7 (EB/head offtake price) = 8,102,502,832 EB
2. Sheep offtake
MOFED: 26143.8 (sheep population * 1000) * .30 (offtake rate) * 209.5 (EB/head)
= 1,643,137,830 EB
REVISED: 35866.3 (re-estimated sheep population *1000) * .30 (offtake rate) * 209.5 (EB/head) = 2,254,196,955 EB
3. Goat offtake
MOFRD: 24039.3 (goat population * 1000) * .315 (offtake rate) * 206.4 (EB/head)
= 1,562,939,128 EB
REVISED: 34684.4 (re-estimated goat population * 1000) * .315 * 206.4 (EB/head) =
2,255,040,950 EB
4. Camel offtake
MOFED: 2293.8 (camel population * 1000) * .02 (offtake rate) * 3162.9 (EB/head)
= 145,101,200 EB
REVISED: no change
5. Cattle milk
MOFED: 48202.5 (cattle population * 1000) * .22 (lactating proportion of herd) * 326.5 (litres per lactation) * .5 (proportion of milk retained as fluid milk) * 4.9 (EB per litre) = 8,482,844,656 EB
REVISED: 48202.5 (cattle population * 1000) * .206 (lactating proportion of herd) * 448 (litres per lactation) * .5 (proportion of milk retained as fluid milk) * 4.9 (EB per litre) = 10,898,855,180 EB
29
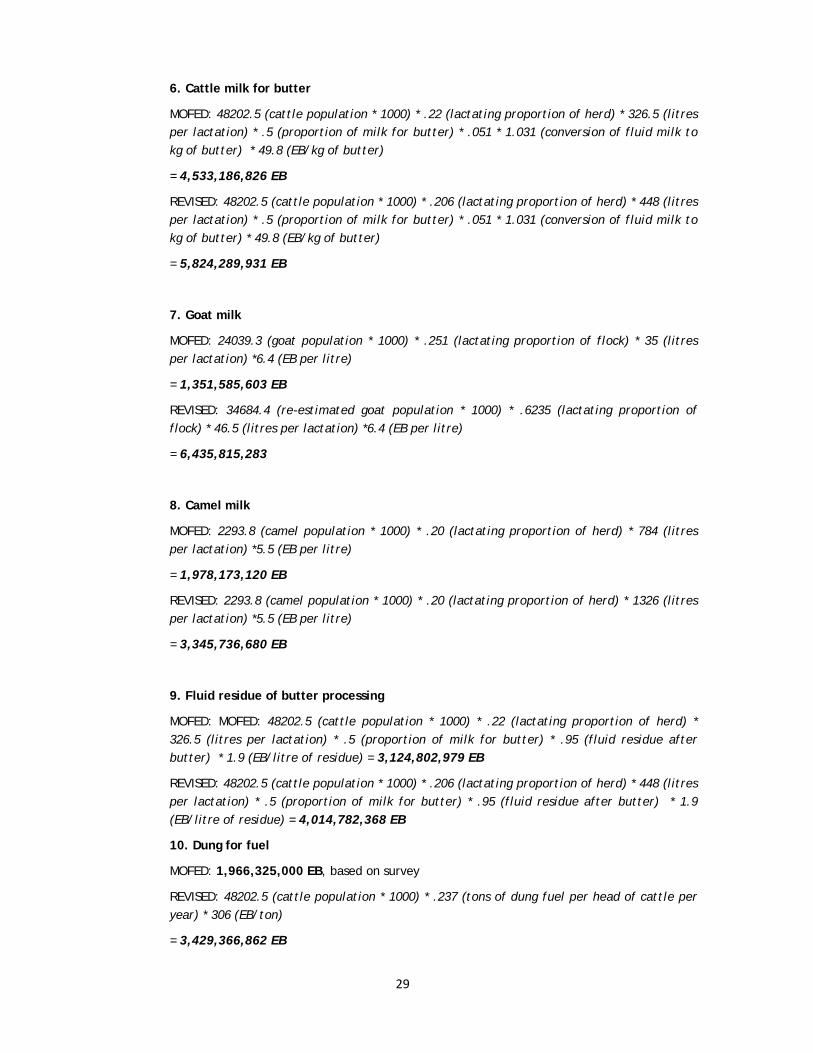
6. Cattle milk for butter
MOFED: 48202.5 (cattle population * 1000) * .22 (lactating proportion of herd) * 326.5 (litres per lactation) * .5 (proportion of milk for butter) * .051 * 1.031 (conversion of fluid milk to kg of butter) * 49.8 (EB/kg of butter)
= 4,533,186,826 EB
REVISED: 48202.5 (cattle population * 1000) * .206 (lactating proportion of herd) * 448 (litres per lactation) * .5 (proportion of milk for butter) * .051 * 1.031 (conversion of fluid milk to kg of butter) * 49.8 (EB/kg of butter)
= 5,824,289,931 EB
7. Goat milk
MOFED: 24039.3 (goat population * 1000) * .251 (lactating proportion of flock) * 35 (litres per lactation) *6.4 (EB per litre)
= 1,351,585,603 EB
REVISED: 34684.4 (re-estimated goat population * 1000) * .6235 (lactating proportion of flock) * 46.5 (litres per lactation) *6.4 (EB per litre)
= 6,435,815,283
8. Camel milk
MOFED: 2293.8 (camel population * 1000) * .20 (lactating proportion of herd) * 784 (litres per lactation) *5.5 (EB per litre)
= 1,978,173,120 EB
REVISED: 2293.8 (camel population * 1000) * .20 (lactating proportion of herd) * 1326 (litres per lactation) *5.5 (EB per litre)
= 3,345,736,680 EB
9. Fluid residue of butter processing
MOFED: MOFED: 48202.5 (cattle population * 1000) * .22 (lactating proportion of herd) * 326.5 (litres per lactation) * .5 (proportion of milk for butter) * .95 (fluid residue after butter) * 1.9 (EB/litre of residue) = 3,124,802,979 EB
REVISED: 48202.5 (cattle population * 1000) * .206 (lactating proportion of herd) * 448 (litres per lactation) * .5 (proportion of milk for butter) * .95 (fluid residue after butter) * 1.9 (EB/litre of residue) = 4,014,782,368 EB
10. Dung for fuel
MOFED: 1,966,325,000 EB, based on survey
REVISED: 48202.5 (cattle population * 1000) * .237 (tons of dung fuel per head of cattle per year) * 306 (EB/ton)
= 3,429,366,862 EB
30
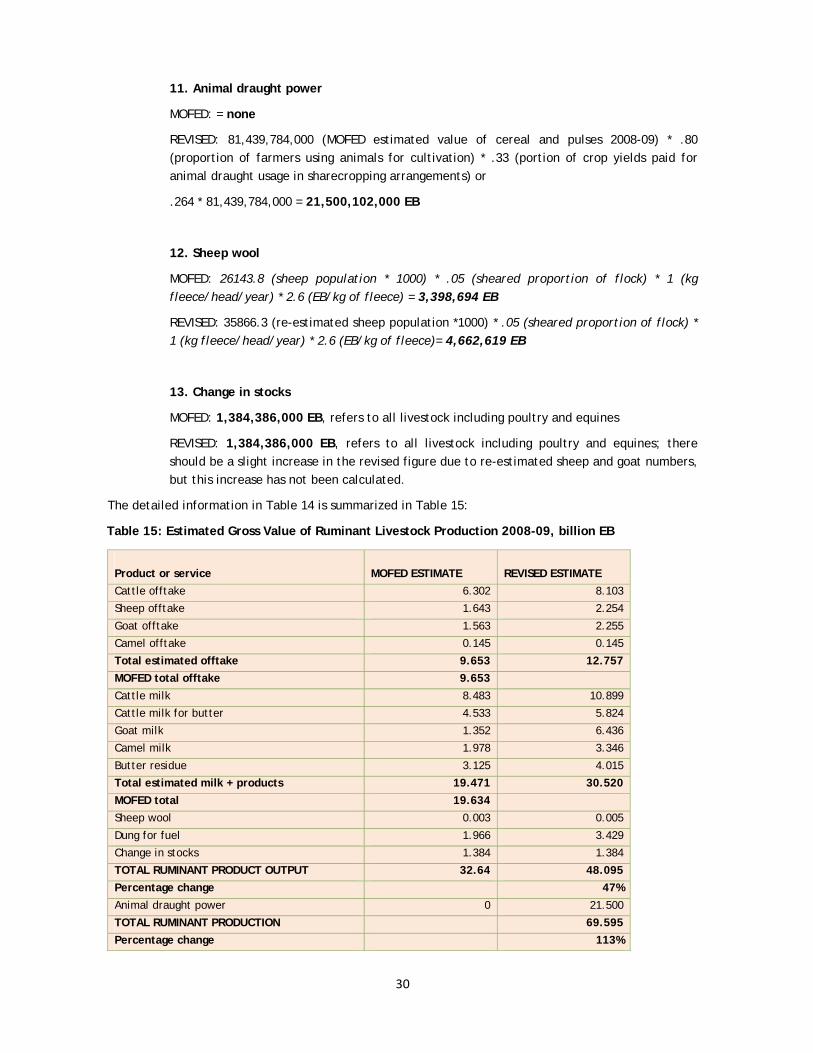
11. Animal draught power
MOFED: = none
REVISED: 81,439,784,000 (MOFED estimated value of cereal and pulses 2008-09) * .80 (proportion of farmers using animals for cultivation) * .33 (portion of crop yields paid for animal draught usage in sharecropping arrangements) or
.264 * 81,439,784,000 = 21,500,102,000 EB
12. Sheep wool
MOFED: 26143.8 (sheep population * 1000) * .05 (sheared proportion of flock) * 1 (kg fleece/head/year) * 2.6 (EB/kg of fleece) = 3,398,694 EB
REVISED: 35866.3 (re-estimated sheep population *1000) * .05 (sheared proportion of flock) * 1 (kg fleece/head/year) * 2.6 (EB/kg of fleece)= 4,662,619 EB
13. Change in stocks
MOFED: 1,384,386,000 EB, refers to all livestock including poultry and equines
REVISED: 1,384,386,000 EB, refers to all livestock including poultry and equines; there should be a slight increase in the revised figure due to re-estimated sheep and goat numbers, but this increase has not been calculated.
The detailed information in Table 14 is summarized in Table 15:
Table 15: Estimated Gross Value of Ruminant Livestock Production 2008-09, billion EB
Product or service
MOFED ESTIMATE
REVISED ESTIMATE
Cattle offtake 6.302 8.103
Sheep offtake 1.643 2.254
Goat offtake 1.563 2.255
Camel offtake 0.145 0.145
Total estimated offtake 9.653 12.757 MOFED total offtake 9.653
Cattle milk 8.483 10.899
Cattle milk for butter 4.533 5.824
Goat milk 1.352 6.436
Camel milk 1.978 3.346
Butter residue 3.125 4.015
Total estimated milk + products 19.471 30.520 MOFED total 19.634
Sheep wool 0.003 0.005
Dung for fuel 1.966 3.429
Change in stocks 1.384 1.384
TOTAL RUMINANT PRODUCT OUTPUT 32.64 48.095 Percentage change 47% Animal draught power 0 21.500
TOTAL RUMINANT PRODUCTION 69.595 Percentage change 113%
31
The recalculated combined gross value of output of ruminant livestock production totals 69.595 billion birr, an increase of about 113% over current estimates of the 2008-09 gross value of production, 32.640 billion birr according to MOFED’s present set of coefficients.
According to the recalculated figures, nearly a third (31%) of the total gross value of livestock output is represented by the value of animal draught power for crop cultivation. Relative to other kinds of livestock production, draught power for cultivation is unusual on several scores:
A. It is an input or ‘intermediate cost’ into cropping. Gross value added is the value of output less the value of intermediate consumption (SNA 1993: 121). The gross value added for arable production is the value of crop output less the cost of inputs such as draught power. For accounting purposes, animal draught power is in principle little different than a tractor ploughing service. By making animal traction costs explicit, valuing animal draught power increases the costs of cultivation and diminishes the contribution of arable production to GDP.
B. Animal draught power for cultivation is a service performed for agriculture by livestock. In terms of the ISIC classification of industrial activities used in GDP accounting, animal draught power is classified as an animal husbandry service activity and is a contribution to the Agricultural sector of the national economy. Explicitly valuing animal draught power reduces the apparent contribution of arable agriculture and increases the proportion of livestock’s contribution to the Agricultural sector and to national GDP.
C. These calculations are important because of the scale and the cost of the contribution of animal draught power to agricultural output. ‘National accounts are … used to investigate the causal mechanisms at work within an economy’ (SNA 1993:7), as a basis for ‘informed, rational policy making and decision-taking’ (SNA 1993: 6):
… estimates and imputations [of the value of unsold goods and services] should therefore not be interpreted as introducing hypothetical activities or flows of goods and services into the System. Their purpose is the opposite – namely, to capture in the accounts major flows of goods and services actually taking place in the economy that would otherwise be omitted (SNA 1993: 13).
1.5. Conclusions Part I
1. The contribution of livestock to agricultural GDP is the most commonly quoted single measure of livestock’s contribution to the overall national economy. It is therefore a very important figure.
2. Our recalculated combined gross value of 12 categories of ruminant livestock product output totalled 48.095 billion birr in 2008-09, an increase of about 47% over the gross value of ruminant production estimated according to MOFED’s current set of coefficients and herd size estimates.
3. Nearly a third (31%) of the total gross value of livestock output is represented by the value of animal draught power as an input into crop cultivation, an estimated 21.500 billion EB in 2008-09.
4. The recalculated gross value of the agricultural output of ruminant livestock including the use of animal traction for cultivation totals 69.595 billion birr in 2008-09. This represents an increase of about 113% over current estimates of the 2008-09 gross value of ruminant livestock’s contribution to agriculture, 32.640 billion birr according to MOFED’s present set of coefficients and livestock population estimates.
5. If we include the value of ploughing services, livestock provided 45% of agricultural GDP in 2008-09. Current MOFED estimates place livestock’s contribution at about 25% of total agricultural GDP. The gap between these two estimates suggests that the significance of livestock relative to crop production has been considerably underestimated in past calculations of agricultural sector GDP.
32
6. The reappraisal of the value of livestock output contained in this report is based on the most recent available field research. Some important surveys and specialized studies may not have come to the attention of the consultant and were not reviewed here. An open discussion with the different stakeholders – data providers, livestock researchers, and relevant line ministries and departments – is necessary to have a common understanding and to appraise the accuracy of the facts and figures contained in this document.
7. In terms of the amount they contribute to agricultural GDP, cattle are by far the most important ruminant species, providing output re-valued in this report at about 54 billion EB in 2008-09, if the value of dung for fuel and animal drought power for cultivation are both attributed solely to cattle. At the national level, goats are the second most economically important herd species, with a re-estimated 2008-09 output value of about 8.7 billion EB. Cattle and goats were also probably the most under-valued livestock species in MOFED’s previous GDP estimates. This report calculated the value of cattle output to be double the MOFED amount for 2008-09, with the re-estimated value of goat output being about three times that of MOFED’s 2008-09 figure. These results suggest that future work on refining and updating the conclusions of this report should focus on improving the estimates of cattle and goat output, which are both high in absolute terms and apparently underappreciated in national accounting terms.
33
PART II – SATELLITE ACCOUNTING AND FINANCIAL SERVICES
Part I of this report examined the contribution of livestock to agricultural GDP, which is the most commonly quoted single measure of livestock’s contribution to the overall national economy. Agricultural GDP is based on the value of unprocessed or lightly processed agricultural produce at point of first sale – metaphorically at the farm gate. Some agricultural produce is consumed at this stage, but much is taken up by the service and manufacturing sectors of the economy which use it, modify it, and add value to it. As these livestock goods and services transit through the wider economy they continue to contribute to GDP, now classified not as agricultural output but as services or manufactured products.
The secondary GDP benefits derived from livestock in this way appear under a variety of accounting headings and are not readily identified with livestock, which makes it difficult to assess the full extent of livestock’s influence on the national economy. To remedy this situation and gain a clearer understanding of the size of the livestock sector and the economic linkages between livestock production and the wider economy, it is necessary to reassemble the data on livestock that are scattered under different headings throughout the national accounts. This reworking of the standard GDP estimates is termed ‘satellite accounting.’ A proposal to carry out a modified form of satellite accounting for livestock is discussed in the next section of this report.
Both satellite accounts and standard accounts of agricultural GDP examine the direct use value of livestock output – the immediately useful products and services, both traded and for home consumption, that livestock provide. These values are captured in GDP estimates which attempt to determine the total value of production which ‘is understood to be a physical process … in which labour and assets are used to transform inputs of goods and services into outputs of other goods and services’ (SNA 1993: 4).
Livestock also provide less tangible but no less important economic benefits. For rural smallholders, the most commonly cited economic functions of this kind are the use of livestock as savings, as assets that provide interest-free credit, and as insurance to mitigate risk. These ‘self-help’ financial services are especially important for rural people who lack access to formal savings, credit or insurance facilities, either because these institutions do not operate in rural areas, because rural people lack the necessary skills or confidence to use them, or because relatively poor people are commercially unattractive as potential customers. Without access to formal financial institutions, many peasants and pastoralists depend instead on their livestock for important financial services. The concluding sections of this report briefly discuss methods that can be used to quantify in monetary terms the value of the informal financial services provided by livestock.
Part I of this report recommended specific, quantified changes in the methods used to estimate the contribution of livestock to agricultural GDP as defined by SNA 1993. Part II does not provide final results of this kind. It instead identifies analytical methods that could in future be used to estimate the value of livestock to the entire national economy – including livestock’s contribution to the service and manufacturing sectors and the provision by livestock of informal financial services in rural areas.
34
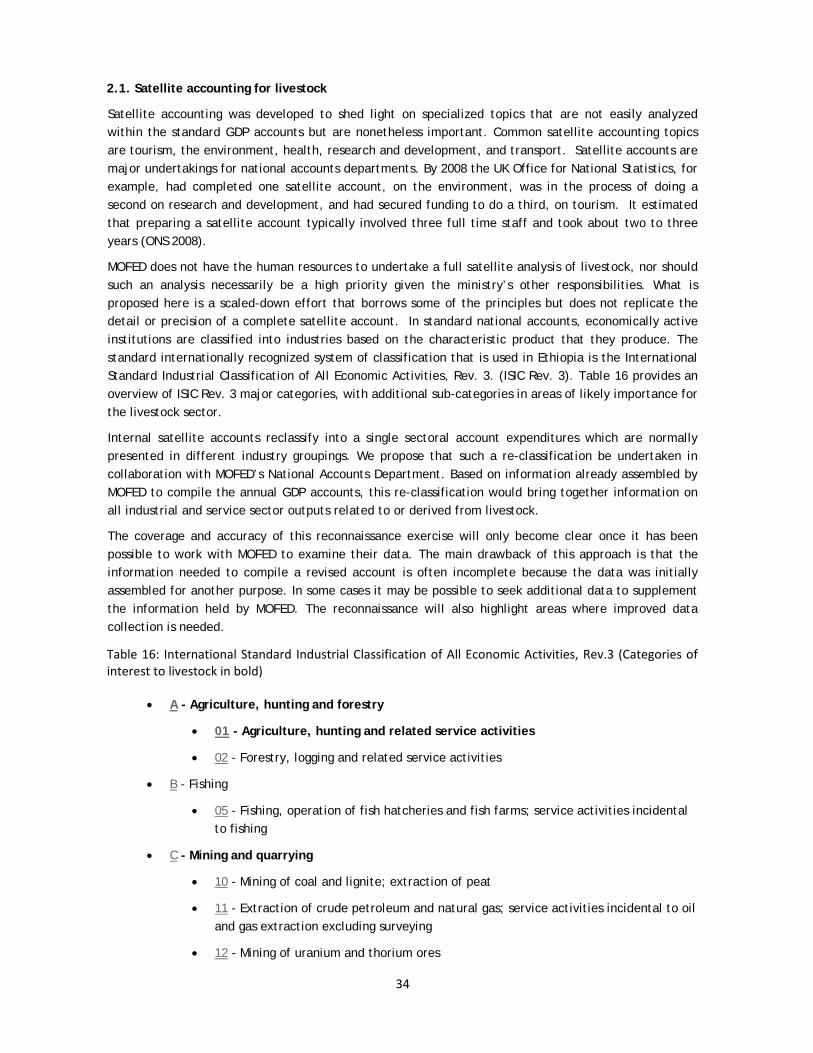
2.1. Satellite accounting for livestock
Satellite accounting was developed to shed light on specialized topics that are not easily analyzed within the standard GDP accounts but are nonetheless important. Common satellite accounting topics are tourism, the environment, health, research and development, and transport. Satellite accounts are major undertakings for national accounts departments. By 2008 the UK Office for National Statistics, for example, had completed one satellite account, on the environment, was in the process of doing a second on research and development, and had secured funding to do a third, on tourism. It estimated that preparing a satellite account typically involved three full time staff and took about two to three years (ONS 2008).
MOFED does not have the human resources to undertake a full satellite analysis of livestock, nor should such an analysis necessarily be a high priority given the ministry’s other responsibilities. What is proposed here is a scaled-down effort that borrows some of the principles but does not replicate the detail or precision of a complete satellite account. In standard national accounts, economically active institutions are classified into industries based on the characteristic product that they produce. The standard internationally recognized system of classification that is used in Ethiopia is the International Standard Industrial Classification of All Economic Activities, Rev. 3. (ISIC Rev. 3). Table 16 provides an overview of ISIC Rev. 3 major categories, with additional sub-categories in areas of likely importance for the livestock sector.
Internal satellite accounts reclassify into a single sectoral account expenditures which are normally presented in different industry groupings. We propose that such a re-classification be undertaken in collaboration with MOFED’s National Accounts Department. Based on information already assembled by MOFED to compile the annual GDP accounts, this re-classification would bring together information on all industrial and service sector outputs related to or derived from livestock.
The coverage and accuracy of this reconnaissance exercise will only become clear once it has been possible to work with MOFED to examine their data. The main drawback of this approach is that the information needed to compile a revised account is often incomplete because the data was initially assembled for another purpose. In some cases it may be possible to seek additional data to supplement the information held by MOFED. The reconnaissance will also highlight areas where improved data collection is needed.
Table 16: International Standard Industrial Classification of All Economic Activities, Rev.3 (Categories of interest to livestock in bold)
• A - Agriculture, hunting and forestry
• 01 - Agriculture, hunting and related service activities
• 02 - Forestry, logging and related service activities
• B - Fishing
• 05 - Fishing, operation of fish hatcheries and fish farms; service activities incidental to fishing
• C - Mining and quarrying
• 10 - Mining of coal and lignite; extraction of peat
• 11 - Extraction of crude petroleum and natural gas; service activities incidental to oil and gas extraction excluding surveying
• 12 - Mining of uranium and thorium ores
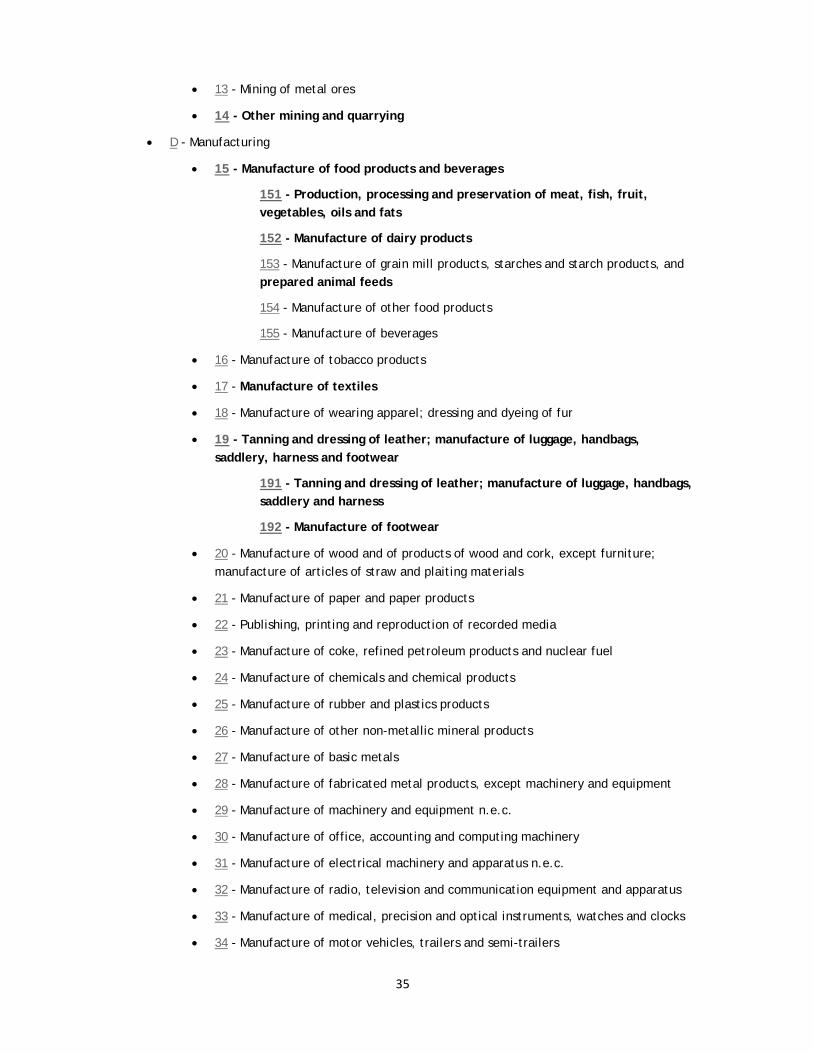
35
• 13 - Mining of metal ores
• 14 - Other mining and quarrying
• D - Manufacturing
• 15 - Manufacture of food products and beverages
151 - Production, processing and preservation of meat, fish, fruit, vegetables, oils and fats
152 - Manufacture of dairy products
153 - Manufacture of grain mill products, starches and starch products, and prepared animal feeds
154 - Manufacture of other food products
155 - Manufacture of beverages
• 16 - Manufacture of tobacco products
• 17 - Manufacture of textiles
• 18 - Manufacture of wearing apparel; dressing and dyeing of fur
• 19 - Tanning and dressing of leather; manufacture of luggage, handbags, saddlery, harness and footwear
191 - Tanning and dressing of leather; manufacture of luggage, handbags, saddlery and harness
192 - Manufacture of footwear
• 20 - Manufacture of wood and of products of wood and cork, except furniture; manufacture of articles of straw and plaiting materials
• 21 - Manufacture of paper and paper products
• 22 - Publishing, printing and reproduction of recorded media
• 23 - Manufacture of coke, refined petroleum products and nuclear fuel
• 24 - Manufacture of chemicals and chemical products
• 25 - Manufacture of rubber and plastics products
• 26 - Manufacture of other non-metallic mineral products
• 27 - Manufacture of basic metals
• 28 - Manufacture of fabricated metal products, except machinery and equipment
• 29 - Manufacture of machinery and equipment n.e.c.
• 30 - Manufacture of office, accounting and computing machinery
• 31 - Manufacture of electrical machinery and apparatus n.e.c.
• 32 - Manufacture of radio, television and communication equipment and apparatus
• 33 - Manufacture of medical, precision and optical instruments, watches and clocks
• 34 - Manufacture of motor vehicles, trailers and semi-trailers
36
• 35 - Manufacture of other transport equipment
• 36 - Manufacture of furniture; manufacturing n.e.c.
• 37 - Recycling
• E - Electricity, gas and water supply
• 40 - Electricity, gas, steam and hot water supply
• 41 - Collection, purification and distribution of water
• F - Construction
• 45 - Construction
• G - Wholesale and retail trade; repair of motor vehicles, motorcycles and personal and household goods
• 50 - Sale, maintenance and repair of motor vehicles and motorcycles; retail sale of automotive fuel
• 51 - Wholesale trade and commission trade, except of motor vehicles and motorcycles
511 - Wholesale on a fee or contract basis
512 - Wholesale of agricultural raw materials, live animals, food, beverages and tobacco
513 - Wholesale of household goods
514 - Wholesale of non-agricultural intermediate products, waste and scrap
515 - Wholesale of machinery, equipment and supplies
519 - Other wholesale
• 52 - Retail trade, except of motor vehicles and motorcycles; repair of personal and household goods
521 - Non-specialized retail trade in stores
522 - Retail sale of food, beverages and tobacco in specialized stores
523 - Other retail trade of new goods in specialized stores
524 - Retail sale of second-hand goods in stores
525 - Retail trade not in stores
526 - Repair of personal and household goods
• H - Hotels and restaurants
• 55 - Hotels and restaurants
• I - Transport, storage and communications
• 60 - Land transport; transport via pipelines
601 - Transport via railways
602 - Other land transport
37
603 - Transport via pipelines
• 61 - Water transport
• 62 - Air transport
• 63 - Supporting and auxiliary transport activities; activities of travel agencies
• 64 - Post and telecommunications
• J - Financial intermediation
• 65 - Financial intermediation, except insurance and pension funding
• 66 - Insurance and pension funding, except compulsory social security
• 67 - Activities auxiliary to financial intermediation
• K - Real estate, renting and business activities
• 70 - Real estate activities
• 71 - Renting of machinery and equipment without operator and of personal and household goods
• 72 - Computer and related activities
• 73 - Research and development
• 74 - Other business activities
• L - Public administration and defence; compulsory social security
• 75 - Public administration and defence; compulsory social security
• M - Education
• 80 - Education
• N - Health and social work
• 85 - Health and social work
• O - Other community, social and personal service activities
• 90 - Sewage and refuse disposal, sanitation and similar activities
• 91 - Activities of membership organizations n.e.c.
• 92 - Recreational, cultural and sporting activities
• 93 - Other service activities
• P - Private households with employed persons
• 95 - Private households with employed persons
• Q - Extra-territorial organizations and bodies
• 99 - Extra-territorial organizations and bodies
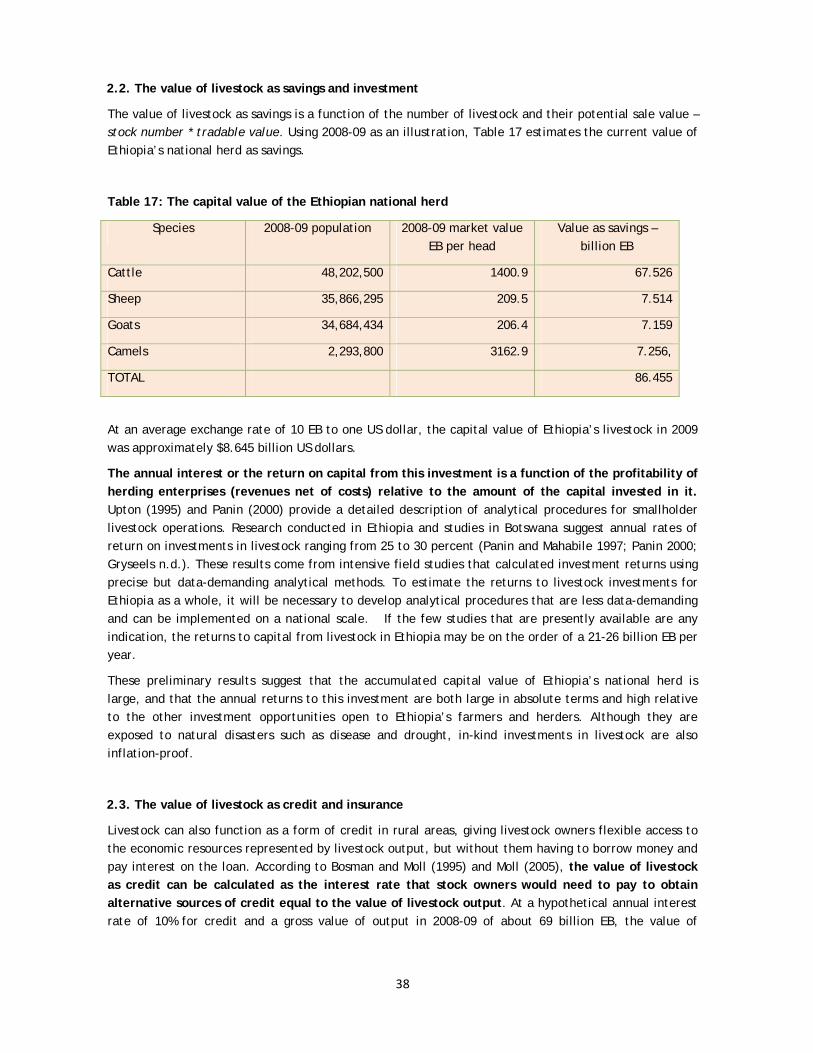
38
2.2. The value of livestock as savings and investment
The value of livestock as savings is a function of the number of livestock and their potential sale value – stock number * tradable value. Using 2008-09 as an illustration, Table 17 estimates the current value of Ethiopia’s national herd as savings.
Table 17: The capital value of the Ethiopian national herd
Species 2008-09 population 2008-09 market value EB per head
Value as savings – billion EB
Cattle 48,202,500 1400.9 67.526
Sheep 35,866,295 209.5 7.514
Goats 34,684,434 206.4 7.159
Camels 2,293,800 3162.9 7.256,
TOTAL 86.455
At an average exchange rate of 10 EB to one US dollar, the capital value of Ethiopia’s livestock in 2009 was approximately $8.645 billion US dollars.
The annual interest or the return on capital from this investment is a function of the profitability of herding enterprises (revenues net of costs) relative to the amount of the capital invested in it. Upton (1995) and Panin (2000) provide a detailed description of analytical procedures for smallholder livestock operations. Research conducted in Ethiopia and studies in Botswana suggest annual rates of return on investments in livestock ranging from 25 to 30 percent (Panin and Mahabile 1997; Panin 2000; Gryseels n.d.). These results come from intensive field studies that calculated investment returns using precise but data-demanding analytical methods. To estimate the returns to livestock investments for Ethiopia as a whole, it will be necessary to develop analytical procedures that are less data-demanding and can be implemented on a national scale. If the few studies that are presently available are any indication, the returns to capital from livestock in Ethiopia may be on the order of a 21-26 billion EB per year.
These preliminary results suggest that the accumulated capital value of Ethiopia’s national herd is large, and that the annual returns to this investment are both large in absolute terms and high relative to the other investment opportunities open to Ethiopia’s farmers and herders. Although they are exposed to natural disasters such as disease and drought, in-kind investments in livestock are also inflation-proof.
2.3. The value of livestock as credit and insurance
Livestock can also function as a form of credit in rural areas, giving livestock owners flexible access to the economic resources represented by livestock output, but without them having to borrow money and pay interest on the loan. According to Bosman and Moll (1995) and Moll (2005), the value of livestock as credit can be calculated as the interest rate that stock owners would need to pay to obtain alternative sources of credit equal to the value of livestock output. At a hypothetical annual interest rate of 10% for credit and a gross value of output in 2008-09 of about 69 billion EB, the value of
39
livestock as credit for Ethiopia as a whole would be an extra 6.9 billion EB, in addition to the value of their physical productivity.
The private insurance or security value of livestock comes from the ability of owners to liquidate their herds in an emergency. Private insurance value can be calculated as the annual cost that herd owners would need to pay to purchase insurance coverage equal to the capital value of their herd. The capital value of the Ethiopian herd in 2008-09 was roughly 86 billion EB (Table 17); we can assume for purposes of illustration that insurance premiums cost 5% of the value of the coverage they provide. In this case, for Ethiopian livestock owners as a whole, the incremental value of livestock as private insurance would be an extra 4.3 billion EB in addition to their value as capital.
For pastoralists in Ethiopia, the insurance value of livestock derives not only from their ability to liquidate their individual herds, but also from their ability to call upon assistance from fellow pastoralists in time of need. We can call this collective livestock insurance. These collective insurance schemes are based on resource sharing with large herd owners paying into the system and impoverished pastoralists drawing support from it. Since transfers are in-kind – meat, milk, live animals and traction/transport services – contributions into the system are roughly comparable to withdrawals from it in any time period. The value of the system from the perspective of resource givers and receivers is also approximately equal: Poor pastoralists extract a level of support from the system that equals what richer pastoralists are willing to invest in order to maintain their reputation for generosity and thereby retain their right to call upon community support if they require future assistance. The value of the communal aspect of livestock as insurance is therefore equal to the value of resource sharing within a pastoral community. Solely for purposes of illustration, we can assume that half of Ethiopian national livestock output or 35 billion ED annually comes from pastoral areas and that pastoralists share about 10% of this output among themselves. These hypothetical values imply that the collective insurance value of resource sharing in pastoral areas would be worth an additional 3.5 billion EB, quite apart from the more tangible values of pastoral production and pastoral livestock as capital, and in addition to the insurance value derived from the ability of pastoralists to liquidate their individual herds in time of need.
2.4. Conclusions Part II
1. Internal satellite accounts reclassify into a single sectoral account expenditures which are normally presented in different industry groupings. We propose that such a re-classification be undertaken to bring together information for Ethiopia on all industrial and service sector outputs related to or derived from livestock. Based on information already assembled by MOFED to compile the annual GDP accounts, this re-classification would borrow some of the principles of satellite accounting but would not attempt to replicate the detail or precision of a complete satellite account.
2. Objective methods exist to impute the monetary value of the informal financial services provided by livestock as savings, as sources of credit and as insurance against risk. The values assigned to these services in this report are hypothetical and for illustration only. Further work is needed to obtain the empirical data that will transform these rough calculations into estimates that are reliable enough to be suitable for planning and policy purposes in Ethiopia.
3. The techniques used in this report to estimate the value of the informal financial services provided by livestock were developed to examine the economics of smallholder livestock husbandry in Nigeria, Botswana, Zambia, West Africa, and Ethiopia. These methods are generally applicable to peasant and pastoral production systems and should be appropriate for use in the other IGAD member states.
40
ANNEXES
Annex I: Terms of Reference
Title: The Contribution of Livestock to GDP in the IGAD Member States – the case of Ethiopia. Duration: November 09, 2009 – February 28, 2010 Background
The overall objective of the IGAD Livestock Policy Initiative is to enhance the contribution of the livestock sector to sustainable food security and poverty reduction in the IGAD region. The project purpose is to strengthen the capacity in IGAD, its member states, regional organizations, and other stakeholders to formulate and implement livestock sector and related policies that sustainably reduce food insecurity and poverty. The IGAD member states covered by the project are Djibouti, Ethiopia, Kenya, Somalia, Sudan and Uganda.
IGAD LPI activities in Ethiopia are being undertaken in cooperation with the Livestock Policy Forum (LPF) - a multi-stakeholder, advisory group hosted by the Ministry of Agriculture and Rural Development. The LPF has in this context expressly asked IGAD LPI to undertake this study on the contribution of livestock to GDP and is looking to use its outcome in their engagement with Ethiopia's PRSP process, as part of their cooperation with IGAD LPI. This request is supported by one of the findings of the recently concluded Mid-Term Review of the IGAD LPI project which established that whereas Output 1 of the IGAD LPI log frame1 highlighted the relevance of livestock to GDP, the importance of the contribution of livestock to GDP in the countries was not adequately stressed. Furthermore, an IGAD LPI working paper has emphasised the range of services that livestock provide to the livelihoods of different socioeconomic groups. Many of these services are not marketed and it is therefore suspected that they are not currently reflected in the region’s national income accounting. In response to this the IGAD LPI is commissioning studies to look at the contribution of livestock to GDP in the IGAD member states. The studies will initially be carried out in Ethiopia with a view to replication in the other IGAD member states in the second half of 2009. The findings will ultimately be linked to ongoing in-country processes that are supported by the project, especially those related to the better integration of livestock in PRSP processes and the allocation of national resources. The findings will inform policy hub and working group meetings, and the process of allocating public funds.
Objective
The study has the following objectives i) To provide an assessment and understanding on the current contribution of livestock to GDP and other livestock contributions to the agricultural sector and or to national economy, which are not accounted for in the production approach valuation of GDP currently adopted by Ethiopia. This will require assigning values to the non marketable services that livestock provides and familiarity with the System of National Accounts (SNA).
ii) To revise and update the livestock economic activity coverage, data sources, estimation parameters and coefficients so as to reinforce the capacities in the country in improving the calculations in the system of national accounts in Ethiopia.
41
Specific Activities
In order to address the objective of the study, the consultant(s) will:
1. Hold initial meetings with LPF to chart out the study and to agree on the planning for the study
2. Prepare a list of literature to be reviewed and people to be interviewed
3. Make appointments for the interviews
4. Carry out a situational analysis (mainly through literature review and interviews) on how livestock is currently computed in GDP calculations within national income accounting in Ethiopia.
5. Consolidate and compile the findings of the literature review and the interviews
6. Propose a methodology for the internal computation of livestock in GDP that includes assigning values to the non marketable services that livestock provides.
7. Prepare an inception report containing the proposed methodology
8. Arrange for a date to present the inception report to IGAD LPI and LPF
9. Report the situational analysis findings and the proposed methodology to IGAD LPI and the LPF for discussion and comments.
10. Apply the proposed methodology (possibly with the support of personnel from the LPF) in determining the contribution of the livestock sector to Ethiopia’s GDP.
11. Plan for and carry out any field work as required.
12. Report the findings of the application of the methodology in Ethiopia in a draft report to be presented to IGAD LPI and the LPF for comments.
13. Integrate comments of IGAD LPI and LPF in the draft report.
14. Prepare a final report to IGAD LPI containing the findings of the study and a critical assessment of the application of the methodology in Ethiopia, together with any pertinent recommendations for how similar studies could be implemented in Djibouti, Kenya, Somalia, Sudan and Uganda.
15. Present the final report to IGAD LPI, LPF and other stakeholders.
Outputs
1. Inception Report presenting the findings of the situational analysis and the proposed methodology. 2. Draft report of findings and the application of the methodology in Ethiopia. 3. Final report containing the study findings, an assessment of the application of the methodology in Ethiopia and further recommendations for its application in Djibouti, Kenya, Somalia, Sudan and Uganda.
Reporting
The consultant will report to FAO IGAD LPI against agreed outputs and for contractual matters. The final report and its contents will be agreed upon between the consultant and IGAD LPI (taking into consideration any technical responses/areas of contention of other stakeholders including the LPF).
42
Annex II: Summary of recommended formula to estimate the contribution of ruminant livestock to agricultural GDP
1. Cattle offtake
MOFED cattle population * .09 (offtake rate) * EB/head CSA offtake price
2. Sheep offtake
re-estimated sheep population * .30 (offtake rate) * EB/head CSA offtake price
3. Goat offtake
re-estimated goat population * .315 (offtake rate) * EB/head CSA offtake price
4. Camel offtake
MOFED camel population * .02 (offtake rate) * EB/head CSA offtake price
5. Cattle milk
MOFED cattle population * .206 (lactating proportion of herd) * 448 (litres per lactation) * .5 (proportion of milk retained as fluid milk) * EB per litre CSA milk price
6. Cattle milk for butter
MOFED cattle population * .206 (lactating proportion of herd) * 448 (litres per lactation) * .5 (proportion of milk for butter) * .051 * 1.031 (conversion of fluid milk to kg of butter) * EB/kg CSA butter price
7. Goat milk
re-estimated goat population * .6235 (lactating proportion of flock) * 46.5 (litres per lactation) * EB/litre CSA goat milk price
8. Camel milk
MOFED camel population * .20 (lactating proportion of herd) * 1326 (litres per lactation) * EB/litre CSA camel milk price
9. Fluid residue of butter processing
MOFED cattle population * .206 (lactating proportion of herd) * 448 (litres per lactation) * .5 (proportion of milk for butter) * .95 (fluid residue after butter) * EB/litre CSA residue price
10. Dung for fuel
MOFED cattle population * .237 (tons of dung fuel per head of cattle per year) * EB/ton CSA dung price
11. Animal draught power
MOFED estimated value of cereal and pulses * .80 (proportion of farmers using animals for cultivation) * .33 (portion of crop yields paid for animal draught usage in sharecropping arrangements) or .264 * MOFED estimated value of cereal and pulses
12. Sheep wool
re-estimated sheep population * .05 (sheared proportion of flock) * 1 (kg fleece/head/year) * EB/kg of fleece CSA sale price
13. Change in stocks
MOFED estimates refer to all livestock including poultry and equines; there should be a slight increase in the revised figure due to re-estimated sheep and goat numbers, but this increase has not been calculated.
43
REFERENCES
Abudinasir, I. 2000. Smallholder dairy production and Dairy Technology adoption in the mixed farming system of Arsi Highland, Ethiopia. Ph.D. dissertation Humboldt University, Berlin.
Aune, J.B., M.T. Bussa, F.G. Asfaw and A.A. Ayele. 2001. The ox ploughing system in Ethiopia: can it be sustained? Outlook on Agriculture 30 (4): 275-280.
Awgichew, K. 2000. Comparative Performance Evaluation of Horro and Menz Sheep of Ethiopia Under Grazing and Intensive Feeding Conditions. Dissertation Humboldt University, Berlin.
Ayalew, W. 2006. Getting the incentives right: concerns associated with expansion of the cattle export markets in Ethiopia. Ethiopian Journal of Animal Production 6 (2): 99-103.
Ayalew, W., J.M. King, E. Bruns and B. Rischkowsky. N.d. Economic evaluation of smallholder subsistence livestock production: lessons from an Ethiopian goat development program. www.ilri.org/research/proj4/angr/article13.doc
Baars, R.M.T. 2000. Costs and returns of camels, cattle and small ruminants in pastoral herds in eastern Ethiopia. Tropical Animal Health and Production 32: 113-26.
Bekele, T. M. Zeleke and R.M.T. Baars. 2002. Milk production performance of the one humped camel (Camelus dromedarius) under pastoral management in semi-arid eastern Ethiopia. Livestock Production Science 76 (1-2): 37-44.
BoFED. 2009. Regional Atlas 2: Afar National Regional State. Finance and Economic Development Bureau, Semera.
Bogale, S. Solomon Melakus and Yami A. 2009. The interdependence of crop-livestock production sectors: the case in Sinana Dinsho District in Bale highlands of Ethiopia, Agricultura Tropica et Subtropica 42 (2): 65-71.
Bosman, HG, Moll HAJ, and HMJ Udo. 1997. Measuring and interpreting the benefits of goat keeping in tropical farm systems. Agricultural Systems 53: 349-372.
Central Statistical Agency. 2004a. Pastoral Areas Livestock Enumeration: Results of Afar Region. CSA, Addis Ababa.
Central Statistical Agency. 2004b. Pastoral Areas Livestock Enumeration November-December 2003: Results of Somali Region. CSA, Addis Ababa.
Central Statistical Agency. 2009. Agricultural Sample Survey 2008/2009, Volume II Report on Livestock and Livestock Characteristics (Private and Peasant Holdings) Statistical Bulletin 446. Addis Ababa.
Coppock, D.L.. 1994. The Borana Plateau of Southern Ethiopia: Synthesis of Pastoral Research, Development and Change, 1980-91. International Livestock Centre for Africa, Addis Ababa.
Cossins NJ, Upton M. 1987. The Borana pastoral system of Southern Ethiopia. Agricultural Systems 25: 199-218.
Davies, J. 2003. The Role of Livestock in Afar Pastoral Livelihoods: Capitalisation, Commoditisation and Obligation. Ph. D. thesis, Department of Agricultural and Food Economics, University of Reading, UK.
44
Dessalegn, B.. 1985. Smallstock and camel research in the southern rangelands. JEPSS Interin Research Report. ILCA, Addis Ababa.
Gebre Mariam 1987 Lifestock [sic] Production and its Socio-Economic Importance Among the Afar in North East Ethiopia. University of London: School of Oriental and African Studies.
Giorgis, A.W. nd. Ethiopia: Greenhouse Gas Emissions and Sources. Ethiopian Energy Authority. http://www.gcrio.org/CSP/IR/IRethiopia.html
GRM International 1994. Herd Health and Productivity Monitoring Study: Final Report, Fourth Livestock Development Project. Brisbane, Australia.
Gryseels, G. and M.R. Goe. n..d. Energy flows on smallholder farms in the Ethiopian highlands. Summary of a paper submitted to the Beijer Institute, Stockholm, Sweden. http://www.ilri.org/InfoServ/Webpub/Fulldocs/Bulletin17/Energy.htm
Gryseels, G. n.d. The role of livestock in the generation of smallholder farm income in two Vertisol areas of the central Ethiopian highlands. http://www.ilri.org/InfoServ/Webpub/Fulldocs/X5493e/x5493e14.htm
Hawando, T. n.d. Desertification in Ethiopian Highlands. RALA report No. 200, Agricultural Research Institut, Keldnaholt, 112 Reykjavik, Iceland. www.rala.is/rade/ralareport/Hawando
Hussen, K. A. Tegegne, M.Y. Kurtu and B. Gebremedhin. 2008. Traditional Cow and Camel Milk Production and Marketing in Agro-pastoral and Mixed Crop-Livestock Systems: The Case of Mieso District, Oromia Regional State, Ethiopia. ILRI, Nairobi.
ISIC. 2006. International Standard Classification of all Economic Activities, Revision 3 Structure. United Nations Statistics Division. http://unstats.un.org/unsd/cr/registry/regcst.asp?Cl=2
Ketema, T.K. 2007. Production and Marketing Systems of Sheep and Goats in Alaba, Southern Ethiopia. MSc. Thesis, University of Hawassa, Awassa.
Mehari, Y. Z. Mekuriaw and G. Gebru. 2007. Potentials of camel production in Babilie and Kebribeyah woredas of Jigjiga Zone, Somali Region, Ethiopia. Livestock Research for Rural Development 19 (4). http://www.lrrd.org/lrrd19/4/meha19058.htm
Mehari, Y., Z. Mekuriaw and G. Gebru n.d. Camel and camel product marketing in Babilie and Kebribeyah woredas of the Jijiga Zone, Somali Region, Ethiopia. http://www.mbali.info/doc266.htm
Mekonnen, Alemu and Gunnar Kohlin. 2009. Biomass Fuel Consumption and Dung Use as Manure: Evidence from Rural Households in the Amhara Region of Ethiopia. University of Gothenburg, Working Papers in Economics, No. 394. Goteborg, Sweden.
Mergia, T. and A. Legesse. 2005. The effect of ownership of oxen, method of cultivation and gender on crop area and yield in Oromia Region. In A Mottram, DP James, WI Robinson, S Zekaria and G. Taddesse (eds.) The Ethiopian Agricultural Sample Enumeration In-depth Analysis, pages 81-101. CSA, Addis Ababa.
MOFED 2005. National Accounts Statistics of Ethiopia: Sources and Methods 1992 (1999/2000) Base Year Series (draft). National Accounts Department, MOFED, Addis Ababa.
Moll, HAJ 2005. Costs and benefits of livestock systems and the role of market and nonmarket relationships. Agricultural Economics 32 (2): 181-193.
Negassa, A. and M. Jabbar. 2008. Livestock Ownership, Commercial Off-take Rates and their Determinants in Ethiopia. ILRI, Addis Ababa.
45
ONS (UK Office of National Statistics) 2008. Proposals for Satellite Accounts. UK Centre for the Measurement of Government Activity. http://www.ons.gov.uk/about-statistics/ukcemga/publications-home/publications/index.html
PADS 2004. Pastoral Areas Development Study (PADS), Phase 1 Report, Volume 2 Livestock Resources, Study 5 Animal Breeds. TECHNIPLAN, Addis Ababa and Rome.
Panin, A. 2000. A comparative economic analysis of smallholder cattle and small ruminant production systems in Botswana. Tropical Animal Health and Production 32: 189-196.
Sandford, S. and Y Habtu. 2000. Report of the Pastoral Appraisal Team On Emergency Response Interventions in Pastoral Areas of Ethiopia. DFID, Addis Ababa.
SC-UK n.d. Managing Risks and Opportunities: An Understanding of Livelihoods in Somali Regional State, Ethiopia. Save the Children UK and Disaster Prevention and Preparedness Agency, Addis Ababa.
SNA 93. 1993, with revisions. System of National Accounts 1993. Inter-Secretariat Working Group on National Accounts. unstats.un.org/unsd/sna1993/introduction.asp
Tegegne, A. and T. Mengistie, Tesfaye Desalew, Worku Teka dna Eshete Dejen. 2009. Transhumance Cattle Production System in North Gondar, Amhara Region, Ethiopia: Is It Sustainable. International Livestock Research Institute, Addis Ababa.
Teklu, T. 2004. Rural land, emerging rental land markets and public policy in Ethiopia. African Development Bank. www.paes.org/files/sustlandpolicy
Tigrem S., Fekadu Beyene, Azage Tegegne, and Berhanu Gebremedhin. 2008. Dairy Production, Processing and Marketing Systems of Shashemene-Dilla Area, South Ethiopia. Hawassa University/International Livestock Research Institute. Addis Ababa.
Tolera, A. and A. Abebe. 2007. Livestock production in pastoral and agro-pastoral production systems of Southern Ethiopia. Livestock Research for Rural Development 19 (12). http://www.lrrd.org/lrrd19/12tole19177.htm
Upton, M. 1985. Models of improved production system for small ruminants. In JE Sumberg and K Cassaday (eds.) Sheep and Goats in Humid West Africa. Proceedings of the Workshop on Small Ruminant Production Systems in the Humid Zone of West Africa, Ibadan, Nigeria, ILCA, Addis Ababa, pp. 55-67.
Webb, P. and J. von Braun. 1994. Famine and Food Security in Ethiopia. IFPRI, Washington. http://www.ifpri.org/publication/famine-and-food-security-ethiopia
Yigrem, S., F. Beyene, A. Tegegne and B. Gebremedhin. 2008. Dairy Production, Processing and Marketing Systems of Shashemene-Dilla area, South Ethiopia. Hawassa University, Awassa, and ILRI, Nairobi, Kenya.