Embed Size (px)
Citation preview

Marine Sanctuaries Conservation Series ONMS-14-07
U.S. Department of Commerce
National Oceanic and Atmospheric Administration
National Ocean Service
Office of National Marine Sanctuaries March 2014
The Containerized Shipping Industry
and the Phenomenon of
Containers Lost at Sea

About the Marine Sanctuaries Conservation Series
The Office of National Marine Sanctuaries, part of the National Oceanic and Atmospheric
Administration, serves as the trustee for a system of 14 marine protected areas encompassing
more than 170,000 square miles of ocean and Great Lakes waters. The 13 national marine
sanctuaries and one marine national monument within the National Marine Sanctuary System
represent areas of America’s ocean and Great Lakes environment that are of special national
significance. Within their waters, giant humpback whales breed and calve their young, coral
colonies flourish, and shipwrecks tell stories of our maritime history. Habitats include beautiful
coral reefs, lush kelp forests, whale migrations corridors, spectacular deep-sea canyons, and
underwater archaeological sites. These special places also provide homes to thousands of
unique or endangered species and are important to America’s cultural heritage. Sites range in
size from one square mile to almost 140,000 square miles and serve as natural classrooms,
cherished recreational spots, and are home to valuable commercial industries.
Because of considerable differences in settings, resources, and threats, each marine sanctuary
has a tailored management plan. Conservation, education, research, monitoring and
enforcement programs vary accordingly. The integration of these programs is fundamental to
marine protected area management. The Marine Sanctuaries Conservation Series reflects and
supports this integration by providing a forum for publication and discussion of the complex
issues currently facing the sanctuary system. Topics of published reports vary substantially and
may include descriptions of educational programs, discussions on resource management issues,
and results of scientific research and monitoring projects. The series facilitates integration of
natural sciences, socioeconomic and cultural sciences, education, and policy development to
accomplish the diverse needs of NOAA’s resource protection mandate. All publications are
available on the Office of National Marine Sanctuaries Web site
(http://www.sanctuaries.noaa.gov).

i
The Containerized Shipping Industry
and the Phenomenon of Containers Lost at Sea
Oren T. Frey1 and Andrew P. DeVogelaere
1
1 Monterey Bay National Marine Sanctuary, 99 Pacific Street #455, Monterey, CA 93940 USA
Silver Spring, Maryland
March 2014
U.S. Department of Commerce
Penny Pritzker, Secretary
National Ocean and Atmospheric Administration
Kathryn Sullivan, Ph.D.
Acting Under Secretary of Commerce for Oceans and
Atmosphere
National Ocean Service
Holly Bamford, Ph.D., Assistant Administrator
Office of National Marine Sanctuaries
Daniel J. Basta, Director
ii
Disclaimer
Report content does not necessarily reflect the views and policies of the Office of
National Marine Sanctuaries or the National Oceanic and Atmospheric Administration,
nor does the mention of trade names or commercial products constitute endorsement or
recommendation for use.
Report Availability
Electronic copies of this report may be downloaded from the Office of National Marine
Sanctuaries web site at http://sanctuaries.noaa.gov.
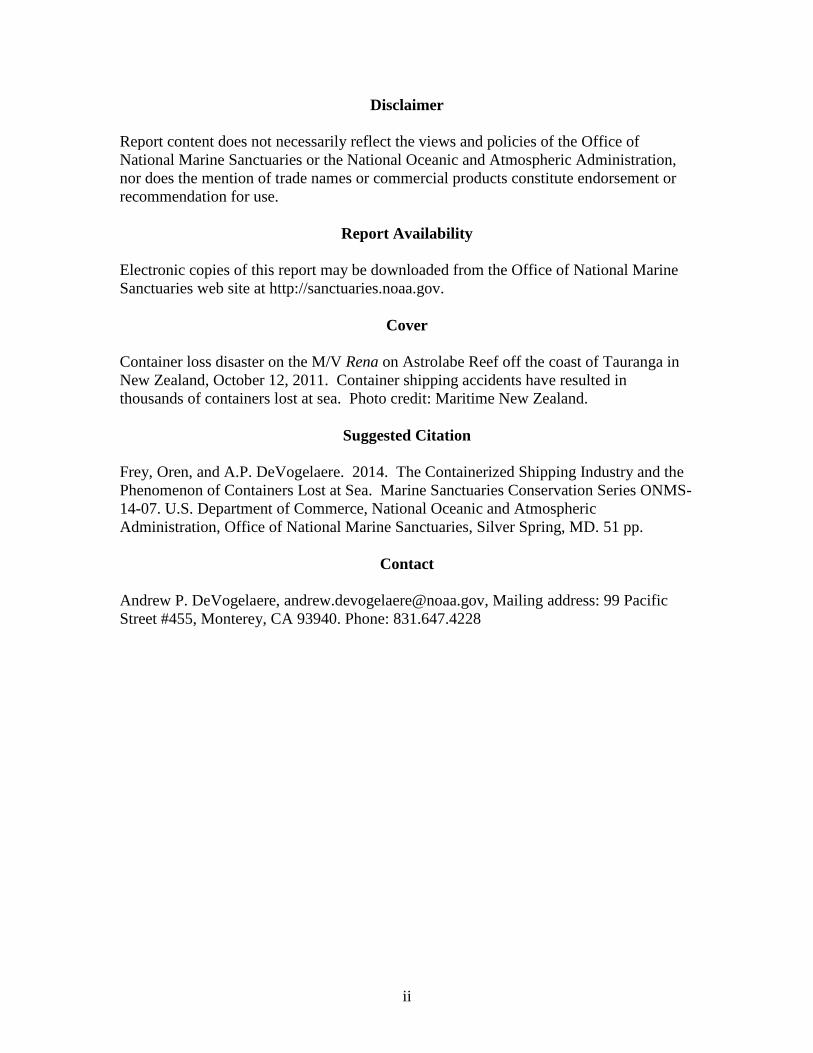
Cover
Container loss disaster on the M/V Rena on Astrolabe Reef off the coast of Tauranga in
New Zealand, October 12, 2011. Container shipping accidents have resulted in
thousands of containers lost at sea. Photo credit: Maritime New Zealand.
Suggested Citation
Frey, Oren, and A.P. DeVogelaere. 2014. The Containerized Shipping Industry and the
Phenomenon of Containers Lost at Sea. Marine Sanctuaries Conservation Series ONMS-
14-07. U.S. Department of Commerce, National Oceanic and Atmospheric
Administration, Office of National Marine Sanctuaries, Silver Spring, MD. 51 pp.
Contact
Andrew P. DeVogelaere, [email protected], Mailing address: 99 Pacific
Street #455, Monterey, CA 93940. Phone: 831.647.4228

iii
Abstract
During a transit from San Francisco Bay to the Port of Los Angeles on February 26,
2004, the M/V Med Taipei encountered a storm and lost 15 forty-foot shipping containers
in the Monterey Bay National Marine Sanctuary (MBNMS), and another nine south of
the Sanctuary. One of these containers was discovered by the Monterey Bay Aquarium
Research Institute (MBARI) on June 9, 2004 on Smooth Ridge at a depth of 1,281
meters, 17.5 nm NW of Point Pinos. This was not an isolated incident. Containerized
maritime trade grew eight-fold from 1985 to 2007, and worldwide there are now
approximately 5 to 6 million containers in transit at any given moment. Thousands of
shipping containers are lost at sea every year, often due to the nexus of rough seas,
inadequate or faulty securing mechanisms, and failure to weigh all containers at the time
of loading. On March 8-10, 2011, we conducted a research expedition to the container on
Smooth Ridge using MBARI’s R/V Western Flyer. The cruise aimed to assess the
container’s current condition, describe habitat and ecosystem impacts, and to bring public
attention to this deep-sea phenomenon that has been increasing with economic
globalization. Given the potentially severe ecological, economic, and navigational safety
consequences associated with container loss, the issue has led to a range of responses
from industry and the consideration of additional preventative measures at the
international level.
Key Words
Containerization, container loss, shipping, ecological impacts, deep-sea research,
Monterey Bay National Marine Sanctuary, MBNMS, continental shelf, marine debris
iv
Table of Contents
Topic Page
Abstract .............................................................................................................................. iii
Key Words ......................................................................................................................... iii
Table of Contents ............................................................................................................... iv
List of Figures and Tables................................................................................................... v
Introduction ......................................................................................................................... 1
Industry History and Growth .............................................................................................. 2
NOAA’s West Coast Sanctuaries and the Containership Industry ..................................... 4
Containers Lost in the MBNMS ......................................................................................... 7
Container Loss: A Widespread Phenomenon ..................................................................... 9
Scope of the Problem ...................................................................................................... 9
Causes ........................................................................................................................... 10
Container Fate After Loss ............................................................................................. 15
Are Losses Becoming More Frequent?......................................................................... 18
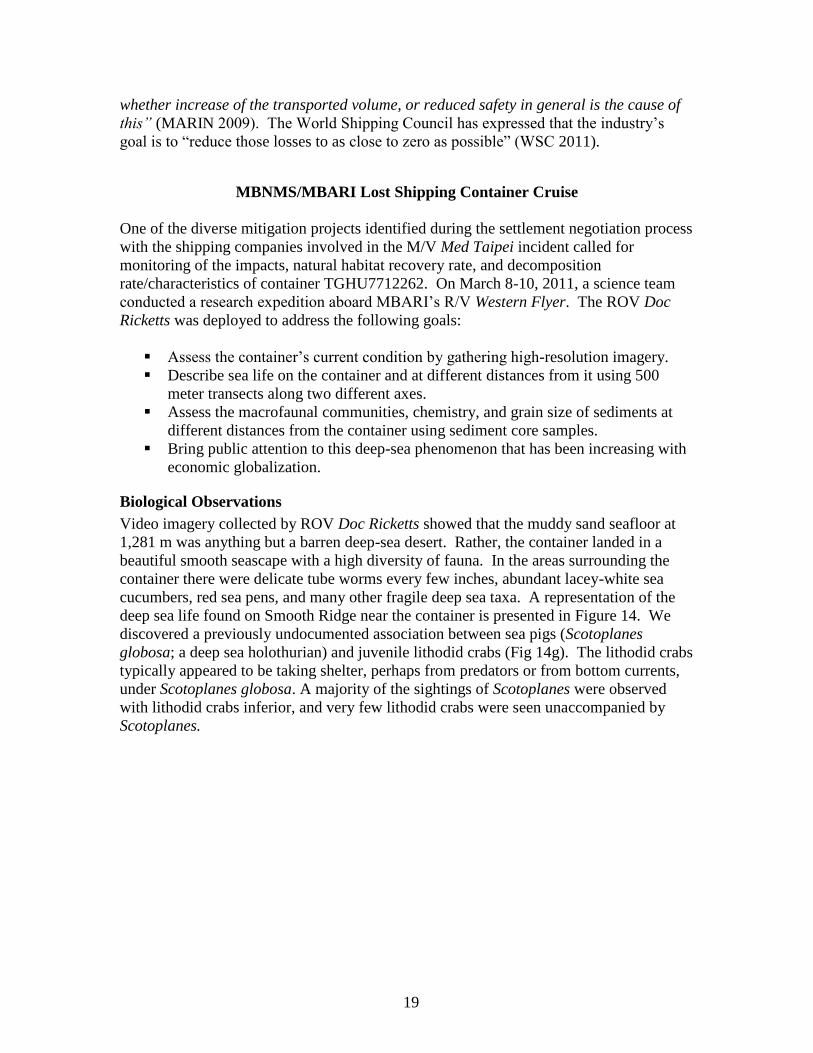
MBNMS/MBARI Lost Shipping Container Cruise .......................................................... 19
Biological Observations ................................................................................................ 19
Container Condition ...................................................................................................... 23
Public Interest ............................................................................................................... 24
Moving Forward: Can Container Losses Be Reduced? .................................................... 24
Conclusions ....................................................................................................................... 29
Acknowledgments............................................................................................................. 30
Appendix A: M/V Med Taipei Container Contents Manifest ........................................... 31
Appendix B: AIMU Casualty List of Containers Lost Overboard, ................................. 34
1989-2000 ......................................................................................................................... 34
Appendix C: Container Loss Incidents That Have Received Broad Media Attention ..... 36
Appendix D: Safety Data Sheet for a Common Container Coating ................................. 41
Literature Cited ................................................................................................................. 46

v
List of Figures and Tables
Figure/Table Number and Title Page
Figure 1. Port of Los Angeles container traffic in TEU ................................................... 3
Figure 2. Percent of container traffic by volume of the 13 countries that shipped more
than 10 million TEU in 2008 .............................................................................................. 4
Figure 3. Shipping tracks through the MBNMS recommended by the IMO .................... 5
Figure 4. AIS cargo vessel density in the MBNMS for October 2010 .............................. 6
Figure 5. Location and photo of container TGHU7712262 .............................................. 8
Figure 6. The MSC Napoli .............................................................................................. 11
Figure 7. Lashing rods tightened by turnbuckles ........................................................... 12
Figure 8. Container corner posts and fittings in unsatisfactory condition ...................... 13
Figure 9. Impact of weather on container stacks ............................................................ 14
Figure 10. Ship crews on the bridge are often not aware of the strains being placed on
container stacks on deck ................................................................................................... 14
Figure 11. Crew listed causes for cargo loss.................................................................... 15
Figure 12. Modeling of likely drift of M/V Med Taipei containers................................ 17
Figure 13. Container loss in the Bay of Biscay, 1992-2008 ........................................... 18
Figure 14. Taxa observed on the deep sea floor surrounding the lost container ............ 20
Figure 15. Taxa observed on the surface of the lost container ....................................... 21
Figure 16. Sediment samples were taken from adjacent to the lost container ................ 22
Figure 17. Container TGHU7712262 in 2004and 2011 ................................................. 23
Figure 18. Intact and undamaged semi-automatic twistlocks ......................................... 24
Figure 19. The NYK Argus leaving San Francisco Bay .................................................. 25
Figure 20. Course alteration and weather avoidance ...................................................... 26
Table 1. 2010 cargo vessel daily totals, grouped monthly, which passed through the
Monterey Bay National Marine Sanctuary ..........................................................................7
Table 2. Taxa observed on container differed substantially from species identified on
surrounding seafloor. .........................................................................................................22

1
Introduction
On June 9, 2004, researchers at the Monterey Bay Aquarium Research Institute (MBARI)
made a surprising discovery on Smooth Ridge in the depths of Monterey Bay. While
searching for a disabled sediment trap in Monterey Canyon, they found an intermodal
shipping container resting upside down on the bottom. The Monterey Bay National
Marine Sanctuary (MBNMS) later learned that this container was one of fifteen lost
during a single incident of loss from a container ship earlier that year. Seven years later,
as MBNMS and MBARI staff prepared to revisit the sunken container to assess
ecological impacts, we became aware of the magnitude of the phenomenon of container
loss at a global scale. The International Maritime Organization, governments, and marine
insurers have estimated that up to 10,000 shipping containers may fall from cargo ships
annually (Podsada 2001; Standley 2003; Hohn 2011; IMO 2004; BBC 2010; ITTS 2011;
Countryman and McDaniel 2011).
Considered cumulatively, such quantities of cargo loss obviously have substantial
economic consequences for the shipping industry, in addition to presenting navigational
hazards throughout the world’s oceans. But what implications does this accidental
dumping have for ecological communities and for the global problem of marine debris?
From a marine debris perspective, 10,000 containers lost overboard annually amounts to
approximately 41,500 tons of littered steel in container weight alone. Average maximum
payload weights of 20’ and 40’ containers range from 26–29 tons (Musson International
2012). The average weight of the contents of the fifteen containers lost in the MBNMS
(Appendix A) was approximately 10 tons. Using this conservative estimate of average
container weight, it is conceivable that 100,000 tons of substances in packaged form –
many of which may be harmful – are falling off ships in containers each year. This figure
represents approximately 1.5% of the 6.4 million tons of litter believed to enter the
world’s oceans each year (UNEP 2005). Arranged end to end, this estimate of loss would
amount to 75 miles of littered containers being added to the seafloor each year. The
accumulation of these slow-to-decay structures year after year is a cause for concern.
The discovery of the lost shipping container brought to light many questions: Why do so
many containers fall off of ships? What becomes of them after they are lost? What steps
could reduce these losses and the damage they cause to marine habitats? We attempt to
address these questions and first outline the rapid growth of the containership industry
and then explore patterns of vessel traffic along the US West Coast. We describe the
discovery of the container in the deepwater habitat of the MBNMS, and discuss the
causes of container loss and the trend in recent years toward heightened loss rates.
Because very few containers are ever found, the March 2011 MBARI/MBNMS research
cruise to the container on Smooth Ridge represents the first effort we are aware of to
investigate the ecological impacts of a lost container on the seafloor. We describe the
results of this survey and conclude with an overview of the various preventative measures
that have either already been implemented or are currently under consideration.

2
Industry History and Growth
Container shipping is a shipping method that uses large intermodal containers that can be
transferred between rail or truck and ship and are never opened while in transit between
shipper and consignee (Levinson 2006). Malcolm McLean, a leader in the American
trucking industry, designed the first standardized container and created Sea-Land
Shipping in 1956 (ISBU 2010). Initial designs called for entire truck trailers to be loaded
onto ships. To save space and weight, the industry standard quickly evolved to load only
the containers themselves, rather than containers attached to chassis (Levinson 2006).
The U.S. container shipping industry began in 1956 when 58 containers were sailed from
Newark to Houston aboard a retrofitted tanker ship (Cudahy 2006).
Shipping cargo in containers offers several key advantages to the industry. Studies have
shown that at U.S. ports, container cargo can be moved nearly twenty times faster than
break bulk cargo (goods that must be loaded individually; Herod 1998). Gains in
efficiency have greatly reduced costs: loading loose cargo cost $5.86 per ton to load in
1956; when that same cargo was containerized, it cost $0.16 per ton (ISBU 2010).
Containers that remain locked also create improved cargo security and reduce cargo
breakage and contamination risks. Because of these increases in efficiency, the industry
has experienced tremendous growth in recent decades.
Container capacity is often expressed in units of twenty-foot equivalent units (TEU).
One TEU of containerized cargo capacity is equal to one standard 20 ft × 8 ft container
(World Bank 2009).1 Container transshipment traffic figures are generally a measure of
container traffic moving from land to sea transport modes, and include both international
and coastal journeys. Movement of empty containers is included, and figures are a total
of all countries for which data is available. From 2000 to 2008, port container traffic
worldwide increased dramatically from 214,274,536 TEU to 473,821,055 TEU (World
Bank 2009). Growth in the container sector far surpasses overall growth in maritime
trade: from 1985 to 2007, total maritime trade doubled, while total containerized trade
grew eight-fold over the same period (OECD 2008). The trend is expected to continue:
Drewry Shipping Consultants forecast a more than six-fold rise in container movements
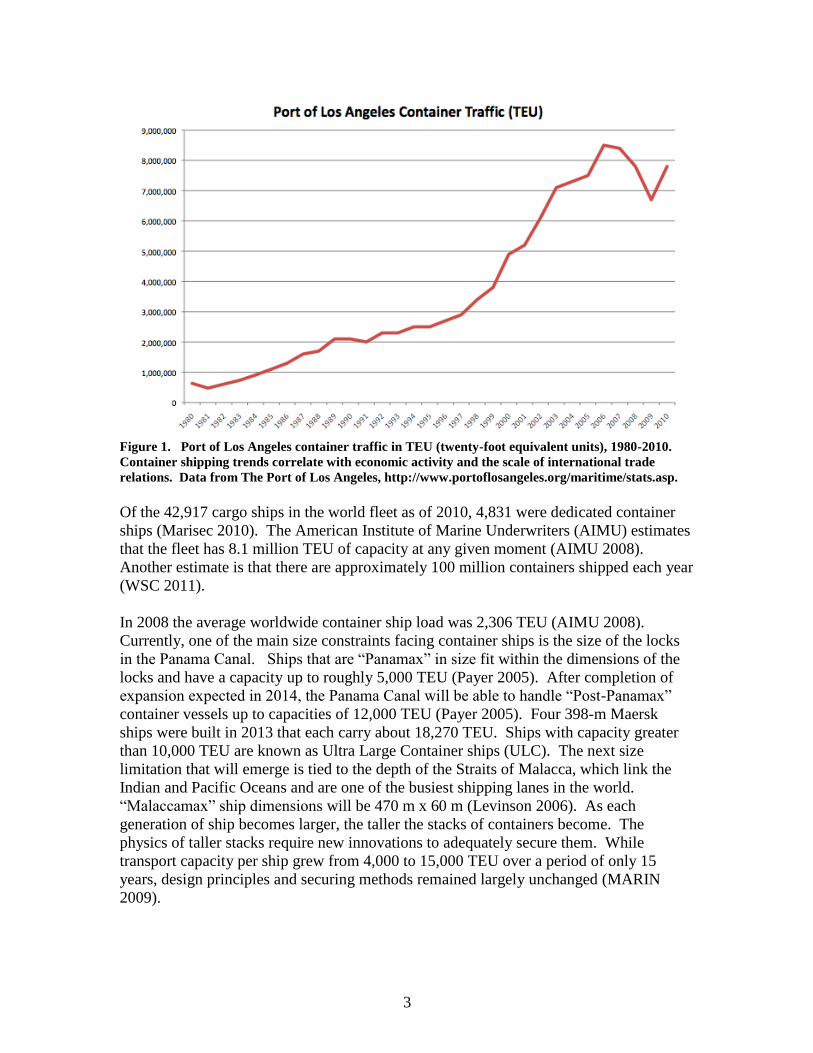
from 2000 to 2020 (OECD 2008). Container volume through the Port of Los Angeles is
representative of the steep rise in container use, broken only by the economic crisis of
2008-2009 (Figure 1).
1 Standard container width is 8 ft; standard height is 8.5 ft or 9.5 ft for “high cube” containers. There are
five standard container lengths: 20-ft (6.1 m), 40-ft (12.2 m), 45-ft (13.7 m), 48-ft (14.6 m), and 53-ft (16.2
m).
3
Figure 1. Port of Los Angeles container traffic in TEU (twenty-foot equivalent units), 1980-2010.
Container shipping trends correlate with economic activity and the scale of international trade
relations. Data from The Port of Los Angeles, http://www.portoflosangeles.org/maritime/stats.asp.
Of the 42,917 cargo ships in the world fleet as of 2010, 4,831 were dedicated container
ships (Marisec 2010). The American Institute of Marine Underwriters (AIMU) estimates
that the fleet has 8.1 million TEU of capacity at any given moment (AIMU 2008).
Another estimate is that there are approximately 100 million containers shipped each year
(WSC 2011).
In 2008 the average worldwide container ship load was 2,306 TEU (AIMU 2008).
Currently, one of the main size constraints facing container ships is the size of the locks
in the Panama Canal. Ships that are “Panamax” in size fit within the dimensions of the
locks and have a capacity up to roughly 5,000 TEU (Payer 2005). After completion of
expansion expected in 2014, the Panama Canal will be able to handle “Post-Panamax”
container vessels up to capacities of 12,000 TEU (Payer 2005). Four 398-m Maersk
ships were built in 2013 that each carry about 18,270 TEU. Ships with capacity greater
than 10,000 TEU are known as Ultra Large Container ships (ULC). The next size
limitation that will emerge is tied to the depth of the Straits of Malacca, which link the
Indian and Pacific Oceans and are one of the busiest shipping lanes in the world.
“Malaccamax” ship dimensions will be 470 m x 60 m (Levinson 2006). As each
generation of ship becomes larger, the taller the stacks of containers become. The
physics of taller stacks require new innovations to adequately secure them. While
transport capacity per ship grew from 4,000 to 15,000 TEU over a period of only 15
years, design principles and securing methods remained largely unchanged (MARIN
2009).

4
NOAA’s West Coast Sanctuaries and the Containership Industry
US National Marine Sanctuaries are areas of the ocean federally managed for special
protection that can include regulations for ship transit, discharge of material, and
disturbance of the seafloor, among other regulations. NOAA’s West Coast Region
Sanctuaries (Olympic Coast, Cordell Bank, Gulf of the Farallones, Monterey Bay, and
Channel Islands National Marine Sanctuaries) are particularly exposed to the
containership industry, as the world’s busiest container trade routes lie between North
America and East Asia. Of the thirteen countries that shipped more than 10 million TEU
in 2008, 77.6% of those container equivalents originated in Pacific Rim countries (Figure
2; Containerisation International 2011).
Figure 2. Percent of container traffic by volume of the 13 countries that shipped more than 10
million TEU in 2008. Almost three times as many containers are shipped from China as from the
country with the next-busiest ports (U.S.). Data from Containerisation International. http://www.ci-
online.co.uk
“Far East to North America West Coast” is the world’s 2nd
busiest container shipping
route by TEU, with 317 container vessels deployed on a typical day (February 1, 2011;
Containerisation International 2011). Of the world’s 20 busiest container ports, 13 are
located around the Pacific Rim, and two are in California. Three of the four busiest
container ports in the U.S. are in California (Los Angeles, Long Beach, and Oakland),
together accounting for 50% of the nation's total container cargo volume (Port of Oakland
2011). As the 4th
busiest container port in the U.S., the Port of Oakland draws much of
the container ship traffic that passes through the MBNMS.
Recommended tracks for large vessels transiting the MBNMS have been in place for over
ten years. In the late 1990s, the MBNMS Vessel Traffic Workgroup met to work on
development and implementation of strategies to move vessel traffic zones farther
offshore. The working group recommended altering the Traffic Separation Scheme (TSS)

5
off of San Francisco to move vessels away from the sensitive San Mateo shoreline.
Container ships, in addition to bulk freighters and vessels carrying hazardous cargo, were
moved about 10 km farther offshore to reduce the risk of groundings. Recommended
shipping tracks were also organized into north/south lanes to reduce the risk of collisions
(Figure 3). The working group’s recommendations were approved by the International
Maritime Organization and have been in effect since December 1, 2000. Vessel traffic
zones are managed by the U.S. Coast Guard (USCG), the U.S. Department of
Transportation, the U.S. Department of Commerce (NOAA), the IMO, and the United
Nations (NOAA 2009). Container ships following these recommended tracks will travel
15 nm off Point Sur and 12.7 nm off Pigeon Point when heading north, and 20 nm off
Point Sur and 16 nm off Pigeon Point when heading south.
Figure 3. Shipping tracks through the MBNMS recommended by the IMO. Note that only the
colored arrows represent the tracks, and there are not defined tracks extending beyond these.
Source: http://montereybay.noaa.gov/intro/maps/vessel_lanes1_lg.jpg

6
It is not easy to approximate the number of containerships transiting the MBNMS and
other West Coast Sanctuaries, but some estimates have been made using Vessel Traffic
Service (VTS) Automated Identification System (AIS) data. Designed to increase the
safety and navigation of vessels at sea, the AIS system automatically broadcasts vessel
identification, call sign, destination, position, speed over ground, course over ground,
ship type and dimensions to coastal receivers via Very High Frequency (VHF) radio
waves (Miller 2011). There are up to 4,000 coastal transits of the MBNMS each year by
large vessels (NOAA 2009). Crude oil tankers account for 20% of these transits; the
remaining 80% are container ships and bulk product carriers (NOAA 2009).
Efforts to plot vessel traffic transiting the California coast allow for a visual
representation of transits through the sanctuary and can show which areas have the
highest vessel traffic. In September 2011, the Naval Postgraduate School (NPS)
Oceanography Department analyzed archived 2010 AIS message data to calculate the
total amount of all shipping traffic through the MBNMS and to create monthly vessel
traffic density plots. Daily position reports of each vessel were interpolated to a 1 square
arc-minute resolution, on a 1-minute time scale. Monthly ship densities along the
California coast were then generated based on the total number of "ship-minutes" all
vessels occupied in each 1 square arc-minute of space. The AIS messages were further
categorized by reported ship type, with all cargo class vessels (AIS message types 70-79)
isolated and monthly location totals calculated (Miller 2011). Cargo class vessels are not
exclusively containerships, but containerized cargo is most common. The results for one
month are shown as an example of overall patterns (Figure 4).
Figure 4. Automatic Identification System (AIS) cargo vessel density in the MBNMS for October
2010. The color axis represents the total number of minutes vessels spent in one square arc-minute
of area over the course of October 2010.2 Figure from Miller 2011.
2 The color range of Figure 4 was truncated at 120 min. to preserve adequate contrast to distinguish the
traffic patterns at sea, rather than having vessels at harbor dwarf the available resolution of the seagoing
traffic (a ship sitting pier-side over the course of a month would total 43,200 minutes for the month).

7
Within the MBNMS, cargo vessels are generally contained within the prescribed shipping
lanes (Figure 3). Traffic appears to primarily be a combination of coastal transits and Far
East trade routes. An additional data product created by NPS was a comparison of
monthly cargo class vessel traffic with total vessel traffic. Cargo class vessels comprise
40-50% of all vessel traffic within the MBNMS.
Table 1. 2010 cargo vessel daily totals, grouped monthly, which passed through the Monterey Bay
National Marine Sanctuary (excluding the Davidson Seamount Management Zone). Due to the
variability and gaps in the AIS data coverage, these figures are approximate.
Month # Cargo Class Vessels Total # Vessels % Cargo Vessels
January 178 362 49
February 126 242 52
March 345 737 47
April 366 805 45
May 396 937 42
June 435 1000 44
July 439 1023 43
August 443 943 47
September 394 976 40
October 453 1053 43
November 426 858 50
December 471 877 54
Containers Lost in the MBNMS
In 2004, the M/V Med Taipei loaded its containerized cargo in China (port unknown).
After exchange of containers in the San Francisco Bay Area, the ship was en route to the
Port of Los Angeles on the night of February 25, 2004. While transiting the MBNMS,
the Med Taipei began encountering seven- to nine-meter (23- to 30-foot) westerly swells
and experiencing frequent rolls of approximately 25 degrees, with winds at or around 30
knots. At 0045 hours on February 26, 2004, 15 standard 40 ft ISO containers fell off the
ship at coordinates 36°38.5'N, 122°28.7'W (70 nm south of the Golden Gate Bridge).
Appendix A lists the contents of these containers. Later that same day, at 0908 hours,
nine more containers fell overboard at 35°06.9'N, 121°54.0'W. By the end of the voyage,
the Med Taipei had lost a total of 24 containers and had an additional 21 containers
collapsed on the deck, according to a written report by the ship's Captain. The MBNMS
was not notified of this incident of container loss.
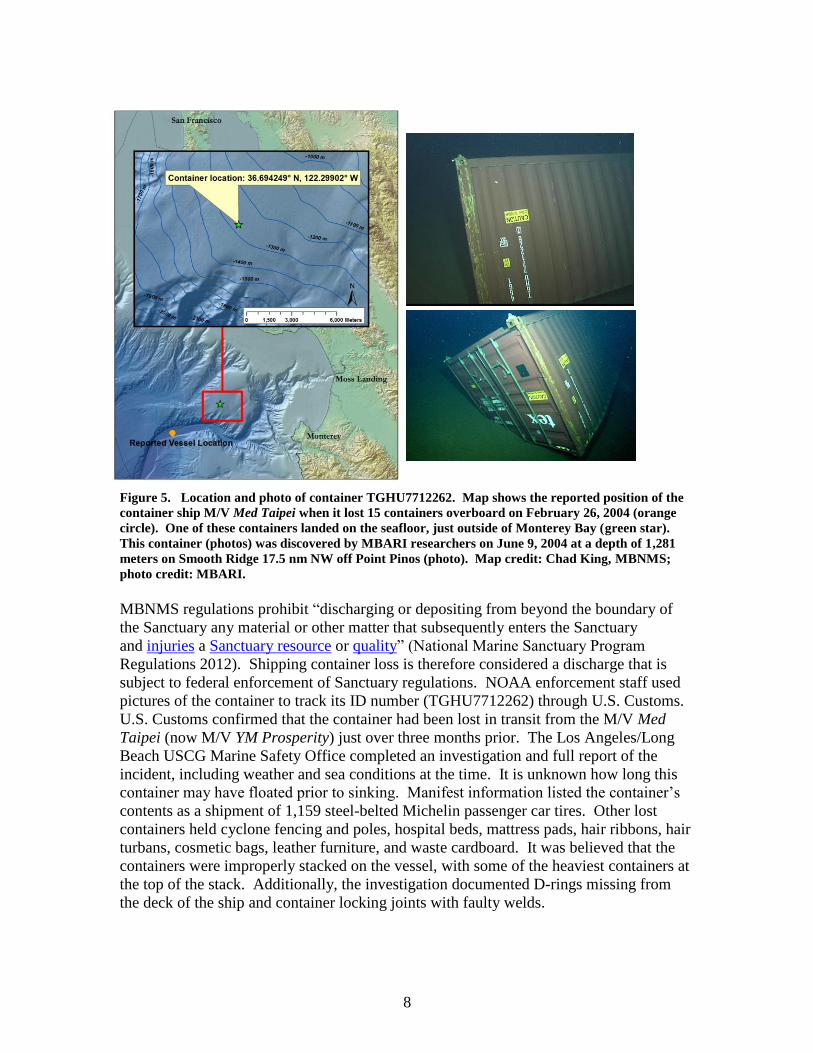
On June 9, 2004, the Monterey Bay Aquarium Research Institute (MBARI) ROV
Ventana, while searching for a disabled sediment trap, discovered an intermodal
container resting on the seafloor at a depth of 1,281 meters on Smooth Ridge, 17.5 nm
NW off Point Pinos outside Monterey Bay (coordinates 36°41.65’ N, 122°17.94’ W).
MBARI collected video and still pictures of the container (Figure 5).
8
Figure 5. Location and photo of container TGHU7712262. Map shows the reported position of the
container ship M/V Med Taipei when it lost 15 containers overboard on February 26, 2004 (orange
circle). One of these containers landed on the seafloor, just outside of Monterey Bay (green star).
This container (photos) was discovered by MBARI researchers on June 9, 2004 at a depth of 1,281
meters on Smooth Ridge 17.5 nm NW off Point Pinos (photo). Map credit: Chad King, MBNMS;
photo credit: MBARI.
MBNMS regulations prohibit “discharging or depositing from beyond the boundary of
the Sanctuary any material or other matter that subsequently enters the Sanctuary
and injuries a Sanctuary resource or quality” (National Marine Sanctuary Program
Regulations 2012). Shipping container loss is therefore considered a discharge that is
subject to federal enforcement of Sanctuary regulations. NOAA enforcement staff used
pictures of the container to track its ID number (TGHU7712262) through U.S. Customs.
U.S. Customs confirmed that the container had been lost in transit from the M/V Med
Taipei (now M/V YM Prosperity) just over three months prior. The Los Angeles/Long
Beach USCG Marine Safety Office completed an investigation and full report of the
incident, including weather and sea conditions at the time. It is unknown how long this
container may have floated prior to sinking. Manifest information listed the container’s
contents as a shipment of 1,159 steel-belted Michelin passenger car tires. Other lost
containers held cyclone fencing and poles, hospital beds, mattress pads, hair ribbons, hair
turbans, cosmetic bags, leather furniture, and waste cardboard. It was believed that the
containers were improperly stacked on the vessel, with some of the heaviest containers at
the top of the stack. Additionally, the investigation documented D-rings missing from
the deck of the ship and container locking joints with faulty welds.

9
A Seattle firm (Fugro, Inc.), ran a computer simulation model to estimate likely
deposition areas for the 15 containers discharged in the MBNMS at 0045 hours, given
container buoyancy characteristics and sea conditions recorded at a nearby NOAA data
buoy. The model produced easterly drift patterns with potential deposition throughout a
range of depths between 2743 and 914 meters in the outer Monterey Bay (4nm - 24nm
offshore). Some of the containers may still be linked together in their original stack
formations. Containers may have sunk onto relatively flat areas or onto submarine
canyon slopes. This study cost approximately $12,000 (S. Kathey, pers. comm.).
Attempted location and recovery of all 15 containers lost within the MBNMS was
estimated at approximately $25 million, with a low expected rate of success. There is no
record of a container having ever been successfully recovered from a depth of over 1,000
m. Therefore, this was not pursued.
A prolonged legal debate ensued between NOAA and the owners and operators of the
vessel – All Oceans Transportation, Inc., Italia Marritema SpA and Yang Ming Transport
Corporation – as there was some uncertainty regarding the extent of U.S. jurisdiction and
the ability to prosecute for damages. On July 26, 2006, a $3.25 million settlement was
announced for long-term damage to Sanctuary resources (NOAA 2006). The MBNMS
agreed to use the settlement funds to undertake habitat restoration and characterization
projects and to monitor the long-term impacts of container TGHU7712262.
Container Loss: A Widespread Phenomenon
Although containers lost overboard are rarely found on the seafloor, the loss from the
Med Taipei was not an isolated incident. The nexus of rough seas, inadequate or faulty
securing mechanisms, and improper container stacking procedures are responsible for
making container loss a well-documented phenomenon in the shipping industry.
Scope of the Problem
The actual numbers of lost containers are difficult to confirm and estimates of the scope
of this occurrence are wide-ranging. Many groups have cited a figure of 10,000
containers falling from ships each year (Podsada 2001; Standley 2003; Hohn 2011; IMO
2004; BBC 2010; ITTS 2011; Countryman and McDaniel 2011). The Chair of the
European Parliament’s Transport Committee, National Geographic News, BBC News,
and Friends of the Earth International are among those citing this figure, which would
amount to 83 million pounds (41,500 tons) of littered steel in container weight alone
annually. The Through Transport Club, which insures 15 of the top 20 container lines for
their losses, estimates that losses overboard are “probably less than 2,000 containers per
year” (VMI 2011). Groups including the AIMU and a joint industry project of the
Maritime Research Institute Netherlands (MARIN) have cited less specific numbers that
are nonetheless in the 1000s (Lashing@Sea 2006; AIMU 2008). However, the origins of
these estimates are not clear. Another estimate is that lost merchant freight at sea
amounts to 1.3 million tons per year (Van den Hove and Moreau 2007). This figure
includes bulk goods and break-bulk cargo in addition to containers.

10
No centralized database is maintained with comprehensive container loss statistics.
Damage and loss reports are rarely shared beyond line operators, involved local maritime
authorities and providers of protection and indemnity insurance (P&I clubs). Operators
generally avoid exposing incident details for publicity reasons. Similarly, P&I clubs
investigate loss incidents but do not share findings, making trends difficult to evaluate
(Lashing@Sea 2009; AIMU 2008). Following the media’s interest in the March 2011
MBNMS/MBARI lost shipping container cruise, the World Shipping Council (WSC) has
countered these figures with its own. The WSC surveyed its members, who collectively
account for 90% of global containership capacity. Although the WSC reports that the
carriers that responded represent over 70% of global container ship capacity (WSC
2011), it is unclear what the survey’s response rate was. Survey results were extrapolated
to all container carriers to yield a much smaller estimate of 350 containers lost at sea each
year, not counting catastrophic events (such as ship groundings). Including catastrophic
losses, the WSC reports that average annual losses increase to approximately 675
containers (WSC 2011). The most recent highly publicized container loss incident was
the grounding of the M/V Rena off New Zealand in October 2011. This single event
resulted in the loss of an estimated 267 containers overboard prior to salvage operations
(Maritime New Zealand 2012).
Causes
The time demands placed on the shipping industry mean that it can be difficult to balance
safety and efficiency. The nature of the industry has been compared to a quote from car
racer Mario Andretti: “If everything is under control you are going too slow” (Koning
2009). Following are some of the common problems that lead to container loss.
Misdeclared container weights: It is believed that shippers sometimes ignore the weight
limitations of shipping containers. The U.K.’s Marine Accident Investigation Branch
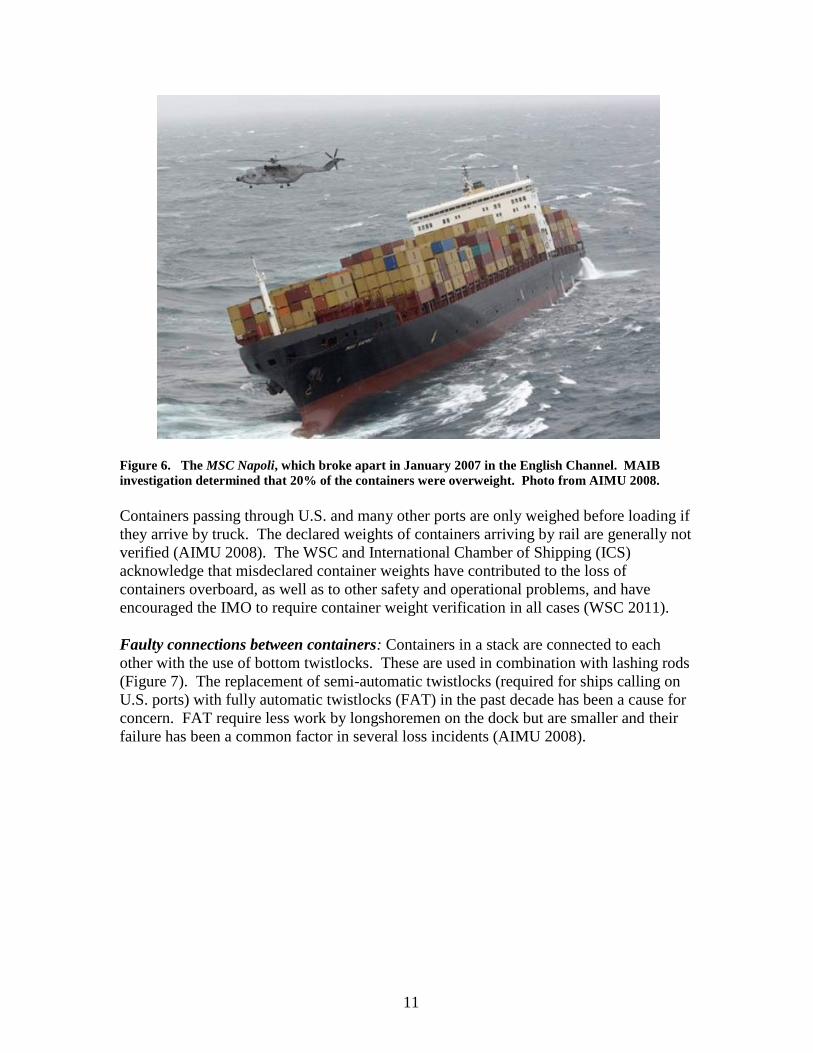
(MAIB) investigated the failure of the containership MSC Napoli in January, 2007
(Figure 6) and found that 137 (20%) of the 660 dry containers stored on deck had actual
weights greater than their declared weights. Some containers were overweight by as
much as 20 MT (AIMU 2008).
11
Figure 6. The MSC Napoli, which broke apart in January 2007 in the English Channel. MAIB
investigation determined that 20% of the containers were overweight. Photo from AIMU 2008.
Containers passing through U.S. and many other ports are only weighed before loading if
they arrive by truck. The declared weights of containers arriving by rail are generally not
verified (AIMU 2008). The WSC and International Chamber of Shipping (ICS)
acknowledge that misdeclared container weights have contributed to the loss of
containers overboard, as well as to other safety and operational problems, and have
encouraged the IMO to require container weight verification in all cases (WSC 2011).
Faulty connections between containers: Containers in a stack are connected to each
other with the use of bottom twistlocks. These are used in combination with lashing rods
(Figure 7). The replacement of semi-automatic twistlocks (required for ships calling on
U.S. ports) with fully automatic twistlocks (FAT) in the past decade has been a cause for
concern. FAT require less work by longshoremen on the dock but are smaller and their
failure has been a common factor in several loss incidents (AIMU 2008).

12
Figure 7. Lashing rods tightened by turnbuckles are attached by hand by longshoremen to help
secure loads. (This container was damaged by a bow-slamming wave). Figure from Koning 2009.
Heavier containers placed on top of lighter containers: Placing heavier containers in the
higher tiers places increased forces on the securing gear and all containers underneath.
Vessel planners, who use container weights and port of discharge to determine the
optimal arrangement of containers on a vessel, aim to prevent this. Yet a common trend
is for carriers to accept additional cargo while a ship is already being loaded, rendering
the vessel planner’s cargo plan obsolete. When late arriving heavy containers end up in
the highest tiers, stability is compromised and excessive load pressures become likely
(AIMU 2008).
Stacking height: With each new generation of container ship, the stacking height has
increased. Stacks may now be up to nine containers high below deck and eight tiers high
above deck (AIMU 2008). Current vessel designs have up to three-quarters of their
containers on deck (VMI 2011). A publication of the Standard P&I Club and Lloyd’s
Register states “if one container in a stack fails, it is likely that the entire stack will
collapse” (Murdoch and Tozer 2006). Commonly, a lashing or overloading problem with
one container stack will lead to interactions with other container stacks and unexpected
high loads in the securing system, rendering it less effective (MARIN 2009). Other
problems associated with high deck loadings include reduced ship stability, interference
with visibility from the bridge (which increases the likelihood of collisions), increased
exposure of the cargo to storms and seas, and difficult maneuverability at slow speeds
due to excessive wind impacts (AIMU 2008). These problems are compounded when
containers are stacked high at the bow and stern of the ship, where accelerations and
forces are at their greatest.
Container contents improperly loaded: Since the contents of containers are often loaded
at remote inland locations (especially in emerging nations like China), the cargo inside
containers is often haphazardly arranged and inadequately blocked and braced. Poorly
loaded or overloaded containers can cause the contents to damage the container or break

13
through its side. Such structural damage, especially when it occurs to a container in the
lower tiers, can lead to collapse of the entire stack (AIMU 2008).
Containers in poor condition: During periods of high shipping demand, shortages of
containers sometimes result in the use of containers in unsatisfactory structural condition.
Container corner posts and structural fittings in a degraded condition or not built to ISO
standards in the first place can jeopardize an entire stack of containers (Figure 8).
Figure 8. Container corner posts and fittings in unsatisfactory condition. Figures from AIMU 2008.
A study by the IMO from 1996-2002 found that of 19,704 containers inspected, 1,737, or
about 9%, had Container Safety Convention (CSC) plate and structural deficiencies
(AIMU 2008).
Failure to adapt course to weather conditions: Waves can cause ships to roll, sway,
pitch, surge, yaw and heave, subjecting container stacks to strong accelerations and
extreme motions, such as parametric rolling (MARIN 2009). When combined with the
effects of strong winds, these movements can place the containers and securing gear
under high stress (Figure 9a). Bow slamming can also occur when large waves break
over the bow of the ship (Figure 9b). A study of container loss in the Bay of Biscay and
its approaches found that of 1,251 containers lost in 158 incidents from 1992-2008, 83%
were lost between the months of November and February when sea conditions are
roughest (Interreg III B, undated). Crew failure to take precautionary measures
(changing course early) can place the ship in a risky situation. Once heading and speed
become difficult to control, heavy rolling is occurring, and green water is on deck, few
alternatives remain and accidents are likely (AIMU 2008).

14
Figure 9. Impact of weather on container stacks. A) In rough seas, the effects of waves on a ship can
create accelerations and forces that combine with wind to compromise the stability of container
stacks. B) Wave impacts such as bow-slamming can cause containers to fall from a containership in
a storm. Figures from Koning 2009 and VMI 2011.
Ship crew in the bridge unaware of dangerous conditions: A questionnaire focused on
the causes of cargo loss was distributed to operational experts on board container ships
(MARIN 2009). Crew were asked about the feasibility to determine from the bridge
when loads on securing gear become too high (Figure 10). Whether or not crew can
detect rough conditions placing undue strain on securing gear is a major factor in
determining whether remedial actions (such as speed and heading adjustments) are
needed.
Figure 10. In rough seas, ship crews on the bridge are often not aware of the strains being placed on
container stacks on deck. Figure from MARIN 2009.

15
Crew opinions: In the crew survey referenced above, 30% of crew respondents had
experienced incidents involving lost or damaged containers. Crew had a variety of
opinions about the causes of these incidents. The results of 158 responses are shown in
Figure 11 (MARIN 2009).
Figure 11. Crew listed causes for cargo loss. Factors named in order of frequency included lashing
problems, poor weight distribution during stowage, inaccurate declared container weights, rolling,
extreme weather, conditions leading to high metacentric height (GM), stack dynamics, internal cargo
shifting, bow slamming, vessel speed, vessel routing, other human factors, poor container quality,
hatch motions, and the effects of high winds. Figure from MARIN 2009.
Container Fate After Loss
Following loss incidents, containers rarely sink immediately. Depending on whether they
are full or empty, and on the nature of the cargo inside, containers may float at the
surface for several days or weeks prior to sinking. Containers are not generally entirely
watertight; while an empty container is likely to sink due to water ingress, a full container
will likely float until air trapped in the cargo has escaped. Using the deadweight
principle that the forces required to sink an object must exceed the volume of water to be
displaced, a New Zealand insurance company has calculated that a 20’ container would
have to exceed 16 tons before it sank, and a 40’ container would have to exceed 32 tons
(VMI 2011). Other factors affecting the time it takes for a container to sink include the
condition of the container, damages to the container as it breaks free, the strength of
impact with the ocean and the battering effect of loose cargo upon impact, and the size of
waves, which can have a smashing effect.
When floating, most of the container lies below the surface of the water, like an iceberg,
creating a serious navigational hazard for smaller vessels – particularly to fishing vessels
and small craft, but also to other containerships and tankers (VMI 2011). One of the
best-documented accidents occurred on January 11, 2000, when marine investigators
believe the British scallop trawler, Solway Harvester, struck a fully loaded container in
the Irish Sea. The trawler sank, all seven crewmembers were killed, and rescuers who
arrived on the scene found plastic vats filled with mayonnaise floating on the surface

16
(Geoghegan 2013). A large container ship colliding with a floating container could lead
to the release of up to one million gallons of bunker fuel oil (NOAA 2009). Floating
containers thus pose a risk to navigation and to Sanctuary resources. Although we are not
aware of any statistics or reports on the number of containers that may be floating at a
given time, the phenomenon is believed to be widespread enough to have recently
inspired an invention designed to sink lost containers (Container Sinka 2014). There are
strong incentives for being able to predict, announce, and track the positions of lost
containers. Calculation of container drift trajectories allows vessels to avoid areas
potentially dangerous to navigation and can aid in any recovery efforts.
Numerical models have been developed to predict container drift by incorporating wind
direction, currents and tides, container buoyancy, degree of immersion, and other
hydrodynamic factors. The Ocean Surface CURrent Simulator (OSCURS) model for the
North Pacific Ocean and Bering Sea has been used to predict with some accuracy where
lost containers and their contents would travel. The Central and Northern California
Ocean Observing System (CeNCOOS) has an online tool available to the public for
predicting drift. The "Drop-a-Drifter" Surface Water Trajectories in Central California
website uses the Regional Ocean Modeling System (ROMS) tool created by NASA’s Jet
Propulsion Lab.3 This technology allows the prediction of where surface water and
flotsam will travel during the past (since Oct. 4, 2010), present, and future (up to 48 hours
ahead). For the Med Taipei incident in the MBNMS, the meteorological and
oceanographic consulting firm Fugro, Inc. was contracted to run the CASP 2.0 program
to forecast the likely locations of the remaining, undiscovered containers. The results of
this modeling, which created an estimate based on 5,760 track replications, can be seen in
a probability map (Figure 12).
3 “Drop-a-Drifter” website http://www.cencoos.org/sections/products/drop_a_drifter.shtml

17
Figure 12. Modeling of likely drift of M/V Med Taipei containers after 56 hours. Clue0001 shows
location of the container loss incident; Clue0002 shows the location of discovered container
TGHU7712262. The darker the shade of purple, the greater the probability of containers being found
within that area. Credit: Fugro Inc.
Containers can then either sink or drift onto shore. In either case, a container may remain
intact or its contents may escape via collisions with other cargo, the vessel, rough seas,
reefs, or the shore. A damaged container can thus serve as a point-source of marine
debris. Potential impacts to marine natural resources include falling containers crushing
and smothering of benthic organisms, introduction of foreign habitat structure, shifts in
local ecology, an expanding benthic footprint over time as the containers degrade and
collapse, marine species entrapment and ingestion risks from released container contents,
and the deposition of plastics or other oil-based products, hazardous or radioactive
materials, and subsequent bioaccumulation (NOAA 2006). The corrosion-resistant
marine coatings used to paint the interiors and exteriors of containers are also a concern,
as they have traditionally contained toxic substances such as zinc powder. Product safety
data sheets for the marine coatings preferred by container manufacturers provide detailed
information about the composition of these paints. The risks of some ingredients are
described with phases such as “very toxic to aquatic organisms, may cause long-term
adverse effects in the aquatic environment” (Appendix D; Hempel Group 2012). Some
of the leading container manufacturers have recently switched to using zinc-free, water-
based coatings, which may represent an improvement (Valspar Corporation 2011).
In the section “MBNMS/MBARI Lost Shipping Container Cruise” we provide a
preliminary description of the ecological impacts associated with the container found in

18
the Monterey Bay National Marine Sanctuary. In addition to causing a host of potential
ecological impacts, container losses represent a tremendous waste of manufacturing
effort, energy, and money. The phenomenon is responsible for capital costs associated
with search, recovery, investigation, and legal actions following container loss, and
causes substantial losses to maritime insurers.
Are Losses Becoming More Frequent?
Whether or not container losses are becoming more frequent is a difficult question to
answer, as the vast majority of losses are not reported beyond notification to “need-to-
know” parties: the ship’s owner, line operator, the exporter, the importer, and the insurer
(VMI 2011). The Lashing@Sea government/industry investigation noted that about 50
lost container incidents were reported between the years 1989-2000 (MARIN 2009).
Appendix 2 shows the AIMU’s “casualty list” of lost containers during this period. Both
the frequency and severity of reported losses began to increase sharply in 1997. While
more than two-thirds of the losses reported over the 12-year period occurred in the last 5
years, several well-documented incidents such as the M/V Sherbro accident (1993) are
not included in this list (AIMU 2008). Analysis of container loss incidents in the Bay of
Biscay by the European Commission’s Interreg III B Community Initiative found a 15-
year trend toward increasing loss (Figure 13); these regional data can likely be
extrapolated to the global level. We should note that these trends could also reflect an
increase in reporting or an increase in the use of shipping containers.
Figure 13. Container loss in the Bay of Biscay, 1992-2008. The red line illustrates the regional trend
toward increased losses. Figure from Interreg III B, undated.
The Lashing@Sea Excecutive Summary summarizes: “Over past years various signals
have come forward from the industry with regards to safety. An increasing number of
incidents in the container sector suggest that risks have increased. The question is raised
19
whether increase of the transported volume, or reduced safety in general is the cause of
this” (MARIN 2009). The World Shipping Council has expressed that the industry’s
goal is to “reduce those losses to as close to zero as possible” (WSC 2011).
MBNMS/MBARI Lost Shipping Container Cruise
One of the diverse mitigation projects identified during the settlement negotiation process
with the shipping companies involved in the M/V Med Taipei incident called for
monitoring of the impacts, natural habitat recovery rate, and decomposition
rate/characteristics of container TGHU7712262. On March 8-10, 2011, a science team
conducted a research expedition aboard MBARI’s R/V Western Flyer. The ROV Doc
Ricketts was deployed to address the following goals:
Assess the container’s current condition by gathering high-resolution imagery.
Describe sea life on the container and at different distances from it using 500
meter transects along two different axes.
Assess the macrofaunal communities, chemistry, and grain size of sediments at
different distances from the container using sediment core samples.
Bring public attention to this deep-sea phenomenon that has been increasing with
economic globalization.
Biological Observations
Video imagery collected by ROV Doc Ricketts showed that the muddy sand seafloor at
1,281 m was anything but a barren deep-sea desert. Rather, the container landed in a
beautiful smooth seascape with a high diversity of fauna. In the areas surrounding the
container there were delicate tube worms every few inches, abundant lacey-white sea
cucumbers, red sea pens, and many other fragile deep sea taxa. A representation of the
deep sea life found on Smooth Ridge near the container is presented in Figure 14. We
discovered a previously undocumented association between sea pigs (Scotoplanes
globosa; a deep sea holothurian) and juvenile lithodid crabs (Fig 14g). The lithodid crabs
typically appeared to be taking shelter, perhaps from predators or from bottom currents,
under Scotoplanes globosa. A majority of the sightings of Scotoplanes were observed
with lithodid crabs inferior, and very few lithodid crabs were seen unaccompanied by
Scotoplanes.
20
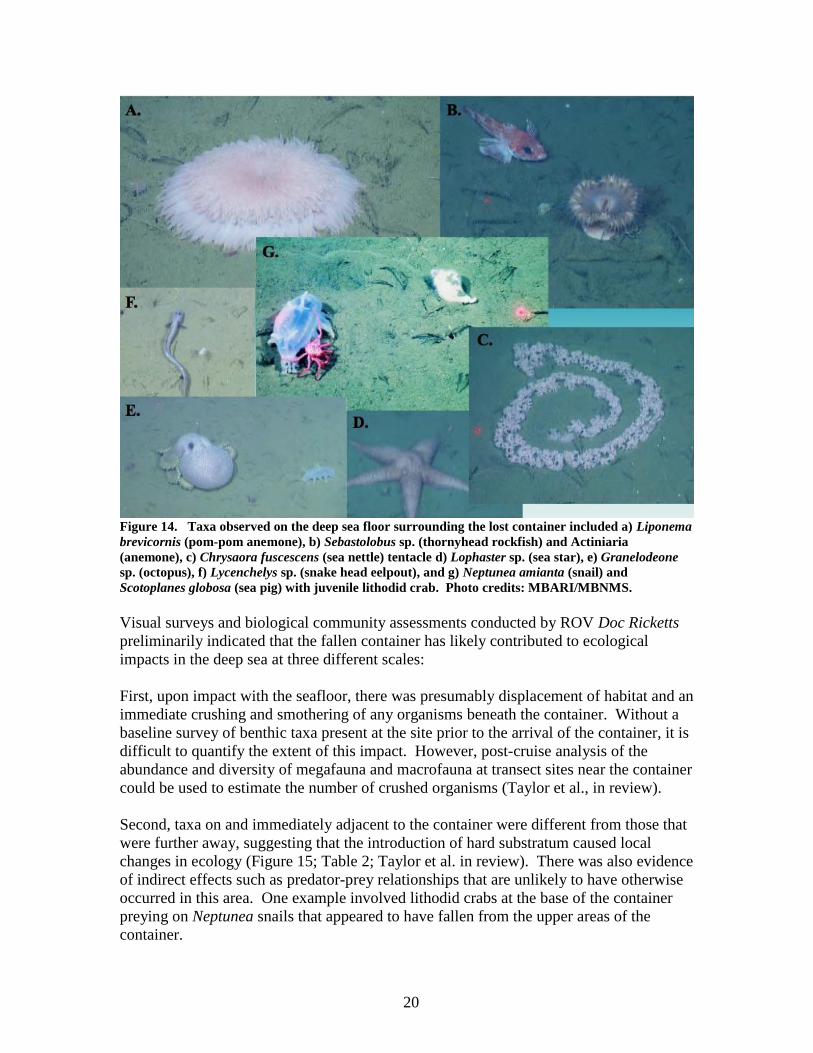
Figure 14. Taxa observed on the deep sea floor surrounding the lost container included a) Liponema
brevicornis (pom-pom anemone), b) Sebastolobus sp. (thornyhead rockfish) and Actiniaria
(anemone), c) Chrysaora fuscescens (sea nettle) tentacle d) Lophaster sp. (sea star), e) Granelodeone
sp. (octopus), f) Lycenchelys sp. (snake head eelpout), and g) Neptunea amianta (snail) and
Scotoplanes globosa (sea pig) with juvenile lithodid crab. Photo credits: MBARI/MBNMS.
Visual surveys and biological community assessments conducted by ROV Doc Ricketts
preliminarily indicated that the fallen container has likely contributed to ecological
impacts in the deep sea at three different scales:
First, upon impact with the seafloor, there was presumably displacement of habitat and an
immediate crushing and smothering of any organisms beneath the container. Without a
baseline survey of benthic taxa present at the site prior to the arrival of the container, it is
difficult to quantify the extent of this impact. However, post-cruise analysis of the
abundance and diversity of megafauna and macrofauna at transect sites near the container
could be used to estimate the number of crushed organisms (Taylor et al., in review).
Second, taxa on and immediately adjacent to the container were different from those that
were further away, suggesting that the introduction of hard substratum caused local
changes in ecology (Figure 15; Table 2; Taylor et al. in review). There was also evidence
of indirect effects such as predator-prey relationships that are unlikely to have otherwise
occurred in this area. One example involved lithodid crabs at the base of the container
preying on Neptunea snails that appeared to have fallen from the upper areas of the
container.

21
Lastly, this container and the thousands of other lost containers comprise an expanding
benthic footprint, which may be serving as hard substratum “stepping stones in the deep”
in a seascape otherwise dominated by sand and mud. As cargo ships typically travel over
the same routes when traveling between ports, lost containers are potentially forming
underwater highways across previous biogeographic breaks, enabling the migration of
invasive species between world ports. This effect may not be confined to invasive
species, as containers may act like artificial reefs in promoting the movement of native
species as well. As an example, this container appeared to be serving as a nursery for
Neptunea amianta (Fig. 15a), which is naturally occurring but may otherwise lack
suitable substrate to attach its eggcases to.
Figure 15. Taxa observed on the surface of the lost container included a) egg cases of Neptunea
amianta (snail) and Pandalopsis ampla (shrimp) b) Neptunea amianta (snail), Lycodapus sp.
(midwater eelpout), serpulid polychaetes, scallops, and brittle star, c) Tunicates and scallops, and d)
Hormathiidae (fly trap anemone), scallops, and Clavularia sp. (octocoral). Photo credits:
MBARI/MBNMS.

22
Table 2. Taxa observed on container differed substantially from species identified on surrounding
seafloor, with a small number of shared species. This is most likely due to the container offering a
hard substratum in a benthic environment otherwise dominated by sand and mud habitat. Neptunea
amianta was one of the few species found on both the container and on the nearby seafloor, but this
species had greater abundance on the container than elsewhere.
Seabed sediments were collected for faunal and sediment characteristics on 500 meter
transects along two different axes. 30-cm diameter tube cores were used to penetrate the
sediment to a depth of ~20 cm at distances of 0.1, 1, 5, 25, 50, 100, 250, and 500 meters
from the container site (Figure 16). The top 0-5 cm of 21 samples were analyzed for
macrofaunal community composition, while the top 0-1 cm of 11 samples were analyzed
for grain size, percent carbon and nitrogen, and stable isotopic composition of carbon and
nitrogen. Grain size and faunal distribution patterns indicated that the container is a mild
disturbance to the seabed that (1) alters local flow patterns, likely leading to changes in
grain size assortment very nearby, (2) increases habitat heterogeneity and adds
structure, leading to megafauna aggregation, and (3) promotes a number of cascading
indirect effects (e.g. changes in predation, competition, restructuring of sediment
community due to change in grain size, and related biological effects). These effects are
very local in scale, with a 10 m halo of significantly altered biological patterns.
Combined with the container’s approximate 30 m2 footprint, a 10 m halo gives
approximately 600 m2 of disturbance – 20 times the size of the container itself (Taylor et
al., in review.).
Figure 16. Sediment samples were taken from adjacent to the lost container and along 500 meter
transects using the ROV’s manipulator arm. Photo credits: MBARI/MBNMS.

23
Container Condition
The container showed little sign of wear or decay after seven years in 1,281 m of water
(Figure 17). One concern is that released container contents – which can be toxic – can
cause contamination, but in this case the cargo of 1,159 steel-belted tires had not escaped.
The toxicity of the container’s paint is also of concern, but the paint appeared to be in
good condition and almost entirely intact, with few observations of paint chips on bottom
sediment.
Figure 17. Container TGHU7712262 in 2004 (left) and 2011 (right). Although colonized by various
deep-sea species such as Neptunea snails, the container appeared to be in near perfect structural
condition. Photo credit: MBARI/MBNMS.
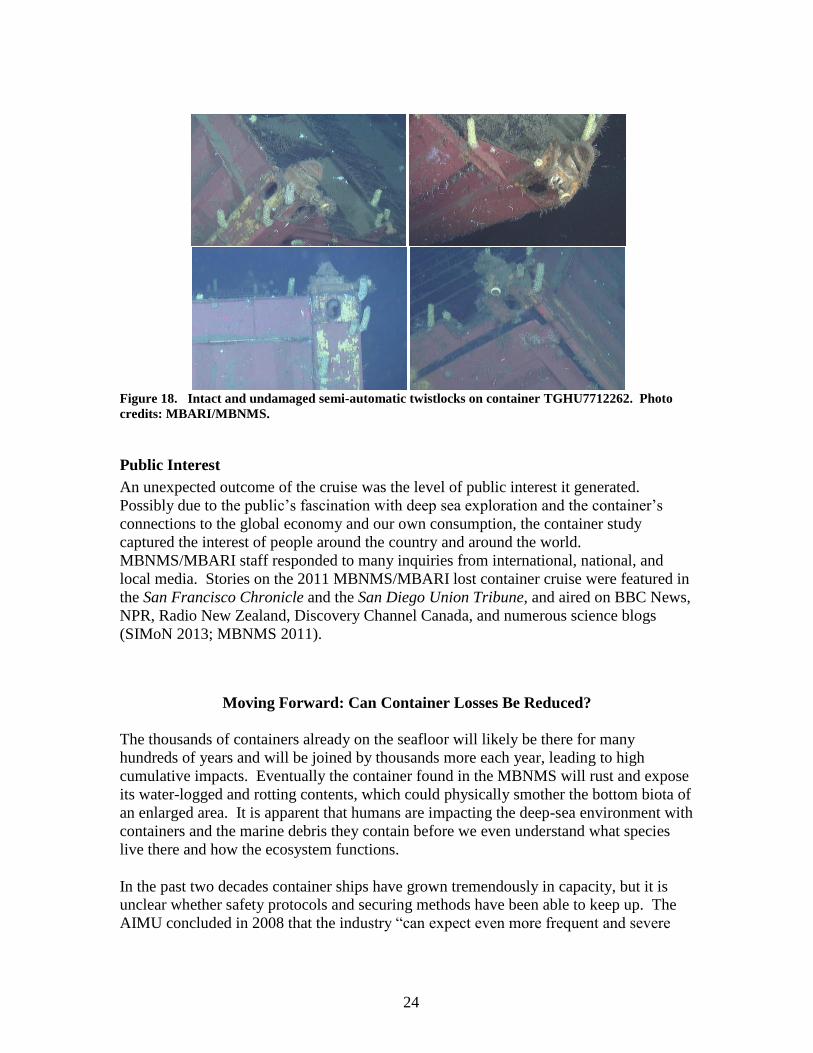
Twistlocks – used between containers in a stack – were still present on all four bottom
corner castings of the container (Figure 18). These were identified as semi-automatic
twistlocks. The locking cones are still in place and appear to be undamaged. The +/- 45
degree alignments of the triangular cones and the positions of the yellow knobs on the
steel wires indicate that the twistlocks are still in the “locked” position. It is unknown
whether the container originally beneath container TGHU7712262 was lost or remained
onboard. If it could be found or if it was documented in an incident survey, its top corner
castings would likely have experienced severe damage or tears. If this container were
found without damaged top castings, one could conclude that the twistlocks between the
containers were probably not securely locked in the first place, either due to improper
container loading, misaligned castings, or blocking objects in the castings (J. Koning,
pers. comm., April 26, 2011).
24
Figure 18. Intact and undamaged semi-automatic twistlocks on container TGHU7712262. Photo
credits: MBARI/MBNMS.
Public Interest
An unexpected outcome of the cruise was the level of public interest it generated.
Possibly due to the public’s fascination with deep sea exploration and the container’s
connections to the global economy and our own consumption, the container study
captured the interest of people around the country and around the world.
MBNMS/MBARI staff responded to many inquiries from international, national, and
local media. Stories on the 2011 MBNMS/MBARI lost container cruise were featured in
the San Francisco Chronicle and the San Diego Union Tribune, and aired on BBC News,
NPR, Radio New Zealand, Discovery Channel Canada, and numerous science blogs
(SIMoN 2013; MBNMS 2011).
Moving Forward: Can Container Losses Be Reduced?
The thousands of containers already on the seafloor will likely be there for many
hundreds of years and will be joined by thousands more each year, leading to high
cumulative impacts. Eventually the container found in the MBNMS will rust and expose
its water-logged and rotting contents, which could physically smother the bottom biota of
an enlarged area. It is apparent that humans are impacting the deep-sea environment with
containers and the marine debris they contain before we even understand what species
live there and how the ecosystem functions.
In the past two decades container ships have grown tremendously in capacity, but it is
unclear whether safety protocols and securing methods have been able to keep up. The
AIMU concluded in 2008 that the industry “can expect even more frequent and severe

25
losses, unless corrective action is taken.” This issue has begun to receive international
attention, and there are several encouraging signs of progress:
Industry Led Efforts
From 2006-2009, a consortium of 23 participants including ship owners, lashing gear
manufacturers, governments and classification societies conducted “Lashing@Sea,” a
study organized by MARIN. Methods included a monitoring campaign of five ships in
operation, model tests of secured cargo and an extensive crew survey (MARIN 2010).
One of the vessels monitored was the NYK Argus, which was equipped with an
instrumented container carried in the lowest tier to record forces imparted from the stack
above and from lashing arrangements (Figure 19). The vessel was also fitted with a grid
of 11 acceleration sensors, hull deformation and load sensors, and weather forecast and
ship movement data links (MARIN 2009). Lashing@Sea provided the IMO and the
International Association of Classification Societies (IACS) with recommendations to
improve safety levels.
Figure 19. The NYK Argus leaving San Francisco Bay, with an instrumented MARIN container on
the bottom tier to help monitor forces while underway. Photo credit: MARIN 2009.
Depending on the route traveled, carriers may also reduce the likelihood of loss by
adjusting course when possible. Tracking of the NYK Argus, which completes a
roundtrip crossing of the North Pacific every two months, showed that the ship varied its
course from one crossing to the next (Figure 20b). The variation in the sailed tracks
reveals the encouraging efforts taken by the crew to avoid severe wave fields and weather
depressions (MARIN 2009).

26
A. B.
Figure 20. Compared to a Far East – Europe route (a), the Far East – North America West Coast
route of a ship like the NYK Argus (b) allows for considerable course alteration and weather
avoidance. Red lines in the figure at right show actual routes of the NYK Argus over several months.
Figures from MARIN 2009.
New software also exists that alerts ship Masters when parametric rolling conditions
exist, allowing them to make better judgments about the need to change their course or
speed. Many new ships are also being engineered to resist parametric rolling (AIMU
2008). Some companies have constructed “bird cages,” buttresses, or other stabilizing
structures on the stern, where forces are greatest, to aid in keeping containers in place.
These have proved highly effective in reducing the severity and frequency of losses
(AIMU 2008).
In December 2008, the ICS and WSC jointly published Safe Transport of Containers by
Sea: Industry Guidance for Shippers and Container Stuffers. The document recommends
best practices for ships, port facilities, and shippers in the loading and handling of cargo
containers, including crew training on parametric rolling, safer stacking and security for
above-deck cargo in heavy swell (Lloyd’s List 2008). The guidelines were developed by
an expert industry working group that met in London and Washington D.C. during 2008.
Marine insurers and P&I clubs also have strong incentives to reduce losses, and have
produced various publications such A Master's Guide to Container Securing (Murdoch
and Tozer 2006).
In 2011, five of the world’s largest container carriers – Maersk Line, Mediterranean
Shipping Co, CMA CGM, Evergreen and Hapag-Lloyd – announced an effort to share
safety-related information across the industry. The Cargo Incident Notification System
(CINS) Network aims to create a comprehensive database of cargo-related incidents and
mishaps. By making long-term trends easier to detect and industry responses more
readily accessible, CINS is expected to increase transparency in the maritime shipping
sector (Lloyd’s List 2011).

27
Regulatory Measures Enacted
In the late 1990s, the IMO amended the International Convention for Safety of Life at
Sea (SOLAS) treaty to include regulations requiring vessels over 500 gross tons traveling
in international waters to carry a “Cargo Securing Manual” on board that is custom-
written to account for the particular forces expected on individual ships. This
requirement was first implemented on January 1, 1998. Cargo Securing Manuals now
include guidelines from a 2003 IMO book titled “Code of Safe Practice for Cargo
Stowage and Securing” and are intended to guide loading, stowage and securing (AIMU
2008). The USCG enforces this rule for all vessels operating in U.S. waters, regardless
of whether they are SOLAS signatories.
Proposed Regulatory Measures
In 2008, Egypt proposed to the Maritime Safety Committee (MSC) of the IMO that
beacons capable of emitting pulses from 20,000 feet be installed on all containers
carrying dangerous goods in order to facilitate search operations (IMO 2008). Tracking
specialist Tri-Mex International has investigated the feasibility of container monitoring
systems. While an effort to tag all the world’s containers would greatly assist with
recovery efforts and would reduce the risk of collisions while afloat, the economic costs
could be high (VMI 2011). A less costly possibility could involve placing transponders
on only the uppermost containers of ships, as they are the most likely to be lost.
In March 2011, the IMO Sub-Committee on Ship Design and Equipment (DE)
considered a proposal by Friends of the Earth International (FOEI), the International
Fund for Animal Welfare (IFAW), the World Wide Fund for Nature (WWF), and Pacific
International focused on the increased threat to the Arctic marine environment from the
loss of containers and harmful substances in packaged form (HSPF) by vessels. Proposed
measures included more stringent lashing requirements, stricter standards for stack height
and vertical weight distribution, increased use of weather and ice forecasts, prompt
reporting of loss incidents to the proper authorities, use of tracking devices, and salvage
of overboard containers to the maximum extent feasible. The DE delayed action on
incorporating these concerns into the development of a new mandatory Polar Code, as it
was foreseen that comprehensive measures to reduce container loss would soon emerge
from another IMO body.
At its 89th
session in May 2011, the IMO MSC considered a proposal by Australia,
Denmark, and the Netherlands titled ‘Proposed measures to prevent loss of containers’
(IMO 2011a). The proposal envisaged four outputs, including:
1. Mandating verification of the actual weights of all loaded containers by
strengthening SOLAS regulations VI/2 and VI/5.5. This information would then
be provided to vessel operators prior to stowage.
2. Creating guidelines on the appropriate stowage and vertical weight distribution in
container stacks.

28
3. A unified interpretation4 on cargo securing, which takes into account
environmental conditions such as wind, sea state, and accelerations.
4. A feedback instrument and guidelines for ships’ crew on dealing with extreme
metracentric height (GM)5 conditions.
The WSC and ICS, both of which are industry groups, submitted comments in support of
the above proposal, admitting that “industry self-help efforts have not solved the
problem” (IMO 2011b). As requiring comprehensive weight verification offers the
greatest chance of reducing the likelihood of future losses, the WSC and ICS focused
their support on that desired output. The MSC agreed to address the issue, with the
Dangerous Goods, Solid Cargoes and Containers (DSC) Sub-Committee as the
coordinating organ and 2013 as the target completion year for an output. (IMO 2011c).
The DSC recognized the importance of these proposed reforms issues at its 16th
session
in September 2011. The Baltic and International Maritime Council (BIMCO) joined the
WSC and ICS in their support of container weighing, and the DSC invited member
governments and international organizations to submit comments and refined proposals
to DSC 17, which took place from September 17–21, 2012. Both IMO members and
non-members were also invited to submit comments related to strengthening the
requirements for lashing gear and container stacking to both DSC 17 and the DE Sub-
Committee (IMO 2011d).
At DSC 17, draft amendments to the International Convention for Safe Containers (1972)
were agreed upon, and these were approved at MSC 91 in November 2012 (IMO 2013).
Additionally, draft guidelines for the development of an approved continuous
examination program for containers were agreed upon at DSC 17 (IMO 2013). A
correspondence group was also established to further work on mandating verification of
gross weight of containers for proposed draft amendments to SOLAS chapter VI (IMO
2013).
Opportunities for Collaboration with NOAA
MBNMS would like to encourage key shipping industry players to demonstrate
leadership on addressing this issue. MBNMS/NOAA has undertaken efforts to work with
Maersk Line Limited, its parent company A.P. Moller-Maersk A/S, and other shipping
lines to explore partnering on additional research. Several opportunities have been
4 Unified interpretations are adopted resolutions on matters arising from implementing the requirements of
IMO Conventions or Recommendations. Such adopted resolutions can involve uniform interpretations of
Convention Regulations or IMO Resolutions on those matters which in the Convention are left to the
satisfaction of the Administration or vaguely worded.
http://www.iacs.org.uk/publications/publications.aspx?pageid=4§ionid=4
5 Metacentric height (GM) is a measurement of the initial static stability of a floating body. It is calculated
as the distance between the center of gravity of a ship and its metacenter. Although a larger metacentric
height implies greater initial stability against overturning, metacentric height also has implications on the
natural period of rolling of a hull, with very large metacentric heights being associated with shorter, more
intense periods of roll.

29
discussed, including:
Shipping lines could incorporate existing container loss minimization efforts into
their portfolio of environmental initiatives and as a sustainability report metric.
This would serve the purpose of entering container loss into the broader
environmental discussion.
MBNMS/NOAA is interested in locating additional lost containers, both from the
2004 Med Taipei accident and elsewhere in the Sanctuary. We would like to
conduct a multi-beam or side-scan survey (from an AUV or from a ship such as
the RV Thompson) over the known location of the container in the MBNMS. This
will allow us to detect other missing containers in the Sanctuary and elsewhere.
The industry could help to sponsor such a project as a form of outreach.
Shipping lines could also financially support further ecological surveys and
research by MBNMS/NOAA on the impacts of lost containers. These impacts
include introduction of marine debris, local changes in community structure and
relationships, and the possible creation of invasive species corridors along
shipping routes. We would like to compare these impacts in different locations.
Industry could work with NOAA to develop a database of previously lost
containers and coordinate reporting protocols for new incidents to better
understand the patterns of container loss.
Industry and NOAA could investigate the feasibility of using inexpensive tracking
devices to monitor the location of lost containers while they are still on the sea
surface.
MBNMS is also engaged in dialogue with NGOs such as the Ocean Conservancy and
business alliances such as the World Ocean Council that are addressing the issue of
marine debris. Including container loss minimization as part of their efforts could help to
further focus international attention on the ecological impacts of lost containers.
Conclusions
Given that container ships sometime fail to comply with industry safety protocols, in the
absence of significant regulatory changes container losses seem likely to continue.
Mandating the verification of container weights likely offers the best hope of abating the
frequency of loss incidents, as overloading and improper stacking of containers on ships
is often identified as a root cause of loss. To stop the additional accumulation of
containers on the seafloor in NOAA’s National Marine Sanctuaries and elsewhere,
international efforts to prevent these accidents from occurring should be supported.

30
A streamlined mandatory container loss reporting system implemented by the IMO
would also provide resource managers with a powerful tool. Resource managers could
better understand and respond to the phenomenon of container loss if they were informed
of all accidents that occur. In the meantime, Sanctuaries could potentially review USCG
shipping loss inspection records on a regular basis to identify cargos lost in Sanctuary
waters and refer such cases to NOAA’s Office of Law Enforcement (OLE) for
investigation. Consistent enforcement through repeated assessment of fines and damage
settlements might spur greater shipping industry attention to this problem – at least where
shipping traffic passes through sanctuaries.
Rather than working antagonistically with industry to address this issue, however,
numerous opportunities exist for collaboration. No company wants their name or image
to be associated with being a primary contributor to marine debris and pollution, and
creating underwater invasive species corridors. Though not previously viewed from an
ecological perspective, container loss is inherently an environmental issue. Accidents
will always occur in an industry subjected to the forces of the ocean and storms, but there
is certainly room for improvement upon current loss levels. Shipping companies
interested in promoting their progress toward sustainability can recognize this and shine
the spotlight on their efforts to mitigate container loss.
While this report broadens awareness of the diverse and widespread impacts of container
loss, the long-term ecological and toxicological impacts of shipping containers lost in
deep sea habitats remains to be determined. Because almost none of the thousands of
containers at the bottom of the world’s oceans have been studied, the existence of a
known container location in the MBNMS presents an excellent opportunity for further
research. Monitoring local ecological and geological conditions at the container site and
comparing future observations to the baseline data collected in 2011 will make it possible
to better assess the impacts of a fallen container over the course of its lifespan.
Moreover, the identification of additional containers would make it possible to assess the
generality of patterns of change and would allow testing of the invasive species “stepping
stone” hypothesis.
Acknowledgments
We thank Jos Koning for personal communication on technical aspects of container loss,
Jim Barry for co-leading the science team, Lonny Lundsten, Erica Burton, and Josi
Taylor for their contributions to fieldwork and species identification, the MBARI video
lab, Huff McGonigal, Chad King, Patrick Whaling, and Kurt Buck for mapping and
processing of sediment samples, Kim Fulton-Bennett and Sacha Lozano for education
and outreach, the ROV Doc Ricketts pilots, and the crew of the R/V Western Flyer.
Finally, we also thank the three anonymous peer reviewers who commented on this
report.

31
Appendix A: M/V Med Taipei Container Contents Manifest

32

33

34
Appendix B: AIMU Casualty List of Containers Lost Overboard,
1989-2000
1989
December 12 MERCEDES DEL
MAR 5 containers Bay of Biscay
1992
January 3 SANTA CLARA I 21 containers off New Jersey
January 24 HYDERABAD 2 containers off U.S. East
Coast
February 11 AZILAL 15 containers off French coast
September 23 JANS 22 containers at LaGuardia
October 23 UNI-HUMANITY 13 containers off Hong Kong
October 27 STELLA I 9 containers off Hong Kong
December 14 CLYDEBANK 4 containers North Atlantic
1994
February 14 MARINE TRADER 21 containers off Dutch coast
April KAMINA 3 containers
April 14 MING FORTUNE 8 containers English Channel
December HYUNDAI SEATTLE 30+ Hyundai Seattle
1995
June 30 ALEXANDRIA III 111 containers off South Korea
1996
January MSC CLAUDIA 21 containers off Boston
February 27 MARITIME LEE 3 containers in North Sea
September 11 PONCE TRADER 27 containers off New Orleans
December 20 IBN SINA A number of containers off
N.Y.
1997
February 13 TOKYO EXPRESS 62 containers off U.K.
February 17 RENNE 28 containers North Sea
March 8 DISARFELL A number of containers
March 26 CITA 100 containers off U.K.
March 31 POL AMERICA 23 containers off Nantucket
April 14 JANG YUNG LOTUS 30 containers off Korea
August 7 VISHA NANDINI 14 containers off India
November 24 MSC CARLA Hundreds lost as ship split
November KATE MAERSK 26 containers off Coruna,
Spain
December 17 MSC RITA 15 containers off Nantucket

35
1998
January 20 SEALAND PACIFIC 26 containers in Pacific
February ARCTIC OCEAN An unknown number of
containers
April 21 KOON HONG 211 17 off Hong Kong
September 19 LEERORT 94 containers Indian Ocean
October APL CHINA 233 containers in mid-Pacific
+ 450 damaged
October PRESIDENT ADAMS 22 containers in mid-Pacific +
54 shifted
October EVER UNION 23 containers in mid-Pacific +
54 shifted
November 11 SEABARGE
TRADER 200 containers
December 20 EVER GIVEN 19 containers in mid-Pacific
1999
Unknown MSC BOSTON A number of containers in
mid-Pacific
April 26 UNION ROTOITI 12 containers off New Zealand
October 22 EVER DIVINE 80 containers at Pusan
December GUAYAMA 9 containers off Puerto Rico
December HUMACAO 51 containers off Puerto Rico
2000
January 26 OOCL AMERICA 300 containers in mid-Pacific
Unknown ASTORIA BRIDGE 17 containers in mid-Pacific
Unknown SEA LAND HAWAII 21 containers in mid-Pacific
Unknown SEA LAND PACIFIC 26 containers in mid-Pacific
February 4 CHOYANG
HONOUR
A number of containers in
mid-Pacific
April MING OCEAN A number of containers in
North Atlantic

36
Appendix C: Container Loss Incidents That Have Received Broad Media Attention
This list is a small sampling of other container loss incidents of that have brought media
attention to this issue. These examples demonstrate that in addition to deep-sea impacts,
marine debris and coastal pollution are important dimensions of the phenomenon of
container loss.
May 27, 1990 The Hansa Carrier lost 21 containers while en route from South Korea to Los Angeles.
Five of the containers contained a total of 80,000 pair of Nike sneakers, hiking boots, and
children’s shoes. The pairs were unlaced, creating twice as many individual pieces of
flotsam. The shipper did not disclose the loss to the public until some of the shoes were
found eight months later on Vancouver Island. Shoes have been identified that were
carried in four of the containers, but there has been no sign of shoes from the fifth
(Ebbesmeyer and Scigliano 2009). A pair of athletic shoes can float as surface marine
debris for as long as ten years (Podsada 2001). Jim Ingraham of NMFS’ Alaska Fisheries
Science Center used the OSCURS (Ocean Surface CURrent Simulator) model for the
North Pacific Ocean and Bering Sea to predict where the shoes would drift (Figure C-1).
Figure C-1. Drift of the Nike shoe spill of May 27, 1990 as simulated by OSCURS.
From the spill site N, the lost cargo followed the shaded drift path. The dots at
upper right show dates and locations where shoes were discovered. Map credit:
Ebbesmeyer and Scigliano 2009.
January 4, 1992 The M/V Santa Clara 1 lost 21 containers during a severe storm off the coast of New
Jersey while en route from New York to Baltimore. Seas were estimated at 25-40 ft, with
winds up to 50 knots. Four containers contained a total of 432 25-gallon drums of highly
toxic arsenic trioxide. A U.S. Navy minesweeping helicopter, ROVs and vessels
equipped with side scan sonar were used to try to locate the containers. Many of the
drums were found in 120-130 ft of water and recovered weeks later. A National Marine

37
Fisheries Service fishing ban went into effect in the area for 90 days. Upon the ship’s
subsequent arrival in Charleston, SC, the USCG found that 10 drums of magnesium
phosphide had been damaged and spilled into the vessels’ hold during the earlier incident
(Gilreath 1995). The incident was investigated by the USCG and the National
Transportation Safety Board (NTSB), and a long list of operational problems was
discovered. The probable causes identified encompass many of the root problems
associated with other loss incidents (see “Causes” section of “Container Loss: A
Widespread Phenomenon” section of this report).
January 10, 1992 A container of 29,000 floating plastic bathtub toys – in the shapes of turtles, ducks, frogs,
and beavers – fell overboard in the central Pacific. The toys, which have become known
as the “Friendly Floatees,” escaped from the container, and traveled through the Bering
Strait and into the Arctic. In 2003, a duck was found on a Massachusetts beach (Johnston
2003). Such incidents have provided opportunities for oceanographers to study ocean
currents.
December 8, 1993 The French container ship Sherbro was caught in a heavy storm while en route from
Cherbourg to Montoir, France. Of the 88 containers that fell overboard, 10 contained
dangerous substances. The total accidental discharge amounted to 12.2 tons of two types
of pesticides, 21.6 tons of nitrocellulose, 1 ton of sulfur, 200 kg of phenolm 3.5 kg of
methyl-ketone and 3.6 tons of a ‘flammable product.’ Although one container of
pesticides was recovered at sea, four others released plastic sacks of their contents, which
washed up on French, Dutch and German coasts. An additional 80 containers –
containing chemicals including chlorine, hydrochloric acid, diisocyanate, toluene,
hydrogen peroxide and cresol – had broken loose, been damaged, and were unpacked in
port. Fourteen years later, on October 11, 2007, the Versailles Court of Appeals
sentenced the ship’s owner to reimburse the cost of container recovery operations
(476,000 €), with interest. The French Supreme Court confirmed this judgment on
December 16, 2008 (Cedre 2010).
November 30, 2006 A container washed up on the shore of Frisco, NC, just south of the Cape Hatteras
Fishing Pier in the Outer Banks. The container had drifted for several days after falling
overboard with three others from the M/V Courtney L, underway from Wilmington,
Delaware to Costa Rica. Its cargo of Doritos snacks had escaped the container, and
thousands of bags of chips also washed up on the beach (Figure C-2; www.cargolaw
.com/2000nightmare_singleonly10.html, 2011).

38
Figure C-2. Shipping container and cargo of snacks deposited on the Outer Banks,
NC. Photo credit: The Virginian-Pilot.
January 20, 2007 Following abandonment on January 18, 2007 and subsequent towing, the MSC Napoli
was beached on the soft seabed less than one nautical mile off Branscombe Beach, Devon
(U.K.) on January 20, 2007 (Mercer 2008). The beaching of a loaded containership this
close to shore was unprecedented. Salvors managed to remove 2,300 containers from the
ship, but at least 50 containers were lost overnight as the ship lay listing. Some sank,
while others were deposited on Branscombe Beach (Mercer 2008). Some of the beached
containers contained hazardous materials including nitric acid and airbag inflators.
“Looting mayhem” ensued on Branscombe Beach over the course of the following days.
Although some containers may have opened due to impacts, others are believed to have
been forcibly opened by looters (Figure C-3; Mercer 2008).

39
Figure C-3. Container loss associated with the February 2007 grounding of the
MSC Napoli. Many lost containers washed up on Branscombe Beach, allowing
“beachcombers” the opportunity for extensive illegal looting, especially after initial
reports of “whisky galore.” Photo credits: Mercer 2008.

40
October 5, 2011
Just before completing a coastal transit from Napier to Tauranga, the MV Rena and its
cargo of 1,368 containers ran aground on Astrolabe Reef, off the north coast of New
Zealand (Figure C-4). With the front of the ship stuck on the reef, the vessel started to
leak oil. Although about 350 tons of oil were released from the Rena’s fuel tanks
between October 5-11, over 1,300 tons of the 1,712 tons of oil on board at the time of
grounding had been recovered (Maritime New Zealand 2012). Still, New Zealand
declared the oil spill its “worst ever environmental disaster.” Container loss began to
occur as rough seas and winds arrived on the night of October 11. The ship had
completely cracked in half by October 14, but remained in place on the reef until the
weekend of January 7-8, 2012 when sinking of the stern commenced. Container loss and
recovery is summarized in Table C-1. To aid salvage operations, 219 transponders were
fitted to containers. Following recovery, transponders have been relocated to other
containers as their locations are identified. A gallery of stunning photos of this incident
is available at http://www.maritimenz.govt.nz/Rena/gallery.asp.
Figure C-4. MV Rena and the location of its stranding near Tauranga, New
Zealand. Photo credit: BBC News.
Table C-1. MV Rena container loss and salvage by the numbers. Data are as of 1
February, 2012. Source: Maritime New Zealand 2012.
Number of Containers Status
1,368 on board Rena at time of grounding
547 stored above deck at the time of grounding
821 stored below deck at time of grounding
121 holding perishable foodstuffs
32 holding with dangerous goods
871 remain on board the severed bulk-head (bow section)
Unknown remain on board sunken Rena stern section
98 (estimated) lost overboard before 8 January 2012
150 (estimated) lost overboard on 8 January 2012

41
463 removed from Rena by salvors since container
recovery began on November 16
65 recovered from the water and beaches
Appendix D: Safety Data Sheet for a Common Container Coating
Hempel is one of the primary producers of the traditional zinc-based coatings used on the
interior and exterior of containers. HEMPADUR ZINC 17369 is a base layer used in
conjunction with other products. It is available in two shades and is recommended to be
applied at 40 micron / 1.6 mils. Below are excerpts from Hempel’s Safety Data Sheet for
one of the two shades of this product, which is likely somewhat representative of the
composition of similar products from other manufacturers. Sections 3 and 12 describe
composition/ingredients and ecological information, respectively.

42

43

44

45

46
Literature Cited
American Institute of Marine Underwriters (AIMU). 2008. On Deck Stowage of
Containers. Prepared by American Institute of Marine Underwriters Technical
Services Committee. http://www.aimu.org/ondeckstorage.html
BBC. January 19, 2010. The Box: Latest location.
http://news.bbc.co.uk/2/hi/in_depth/629/629/7600053.stm
Centre of Documentation, Research and Experimentation on Accidental Water Pollution
(Cedre). 2010. Sherbro. Accessed 14 February 2011 at
http://www.cedre.fr/en/spill/sherbro/sherbro.php
Container Sinka: A Revolution in Marine Safety. 2014. Retrieved January 26, 2014
from http://www.containersinka.com
Containerisation International. ci-online News and Services. Accessed February 17,
2011 at http://www.ci-online.co.uk/
Countryman, B. and M. McDaniel. 2011. The Photo Gallery of Transport Loss.
Accessed August 10, 2011. http://www.cargolaw.com/gallery.html
Cudahy, B.J. 2006. The Containership Revolution: Malcom McLean’s 1956 Innovation
Goes Global. TR News. Transportation Research Board of the National
Academies. No. 246: 5-9.
http://onlinepubs.trb.org/onlinepubs/trnews/trnews246.pdf
Ebeling, C.E. Winter 2009. Evolution of a Box. Invention and Technology Vol. 23, No.
4: 8–9.
Ebbesmeyer, C. and E. Scigliano. 2009. Flotsametrics and the Floating World. New
York: HarperCollins. http://flotsametrics.com/excerpt.php
Geoghegan, J.J. 2013. A Legendary Offshore Danger. Ocean Navigator. March-April
2013.
Gilreath, J. 1995. Developments in Case Law: Stormy Seas: Shipper and Carrier
Liability in M/V Santa Clara I. South Carolina Environmental Law Journal. Vol.
4, Fall 1995: 220. https://litigation-
essentials.lexisnexis.com/webcd/app?action=DocumentDisplay&crawlid=1&doctyp
e=cite&docid=4+S.C+Envtl.+L.J.+220&srctype=smi&srcid=3B15&key=a014b36b
853481076774e941ff737e16
Halpern B.S., Walbridge S., Selkoe K.A., Kappel C.V., Micheli F., D'Agrosa C., Bruno
J., Casey K.S., Ebert C., Fox H.E., Fujita R., Heinemann D., Lenihan H.S., Madin

47
E.M.P., Myers R., Perry M., Selig E., Spalding M., Steneck R. and R. Watson.
2008. A global map of human impact on marine ecosystems. Science Vol. 319:
948-952.
Halpern, B., Kappel, C., Micheli, F., and K. Selkoe. 2009. Ranking and Mapping
Human Threats to Marine Ecosystems in the California Current. Conservation
Letters. Vol. 2: 138-148. California Current Cumulative Impacts Model online at
http://globalmarine.nceas.ucsb.edu/california_current.html
Hempel Group. 2012. Safety Data Sheet for Hempadur Zinc 17360. Accessed
September 18, 2012 at http://www.hempel.com/en/products/hempadur-zinc-17360
Herod, A. 1998. Discourse on the Docks: Containerization and Inter-Union Work
Disputes in US Ports, 1955-85. Transactions of the Institute of British
Geographers. The Royal Geographical Society (UK). Vol. 23, No. 2: 177–191.
http://links.jstor.org/sici?sici=0020-
2754%281998%292%3A23%3A2%3C177%3ADOTDCA%3E2.0.CO%3B2-R.
Hohn, D. 2011. Moby Duck: The true story of 28,800 bath toys lost at sea, and of the
beachcombers, oceanographers, environmentalists, and fools, including the author,
who went in search of them. New York: Viking, 416 pp.
Institute for Trade and Transportation Studies (ITTS). 2011. ITTS blog: “Loss of
Maritime Containers at Sea.” May 13, 2011.
http://www.ittsresearch.org/blog/?p=940
Intermodal Steel Building Units & Containers Homes (ISBU). 2010. All About
Shipping Containers. http://www.isbu-info.org/all_about_shipping_containers.html
International Maritime Organization (IMO). 2004. Document DSC 9/5/1: Impact of
Container Transport: Proposed measures to reduce environmental impact of
containers. Submitted by Friends of the Earth International (FOEI) to the IMO
DSC Subcommittee July 22, 2004. http://www.sjofartsverket.se/upload/5820/9-5-
1.pdf
International Maritime Organization (IMO). 2008. Document MSC 84/22/19:
Dangerous Goods Container Beacon. Submitted by Egypt to the IMO MSC
February 8, 2008.
International Maritime Organization (IMO). 2011a. Document MSC 89/22/11: Proposed
measures to prevent loss of containers. Submitted by Australia, Denmark and the
Netherlands to the IMO MSC February 7, 2011.
International Maritime Organization (IMO). 2011b. Document MSC 89/22/17:
Comments on document MSC 89/22/11. Submitted by the World Shipping Council
(WSC) and the International Chamber of Shipping (ICS) to the IMO MSC March

48
22, 2011.
International Maritime Organization (IMO). 2011c. Document MSC 89/25: Report of
the Maritime Safety Committee on its eighty-ninth session. Paragraph 22.6. May
27, 2011.
International Maritime Organization (IMO). 2011d. Document 16/15: Report to the
Maritime Safety Committee. Paragraphs 14.4-14.6. October 26, 2011.
International Maritime Organization (IMO). 2013. Meeting summary: Sub-Committee
on Dangerous Goods, Solid cargoes and Containers (DSC) - 17th Session, 17-21
September 2012. Accessed January 31, 2013 at
http://www.imo.org/MediaCentre/MeetingSummaries/DSC/Pages/DSC-17th-
session.aspx
Interreg III B, Espace Atlantique. Undated. Rapport Final, Reponse au Probleme des
Conteneurs Perdus par les Navires de Passage dans le Golfe de Gascogne et ses
approaches, acronyme LOSCONT. http://www.interreg-
atlantique.org/upload/resultats/RAPPORT_synthese_FINAL_FR_avec_Portugal.pd
f
Johnston, L. 2003. Rubber Duckies Map the World: Oceanographer tracks bath toys to
study ocean movement. CBS Evening News, July 31, 2003.
http://www.cbsnews.com/stories/2003/07/31/eveningnews/main566138.shtml
Koning, I.J. 2009. ‘Lashing@Sea project.’ Presentation at the London RINA branch
meeting, May 14, 2009. Maritime Research Institute Netherlands (MARIN).
http://www.rina.org.uk/c2/uploads/rina_lr_2009_05_14%20_3_.pdf
Lashing @ Sea Project. 2006. Leaflet: Lashing container and RoRo cargo at sea:
MARIN initiates Joint Industry Project to prevent the loss of containers and Roll-
on/Roll-off Cargo. http://www.marin.nl/web/file?uuid=baf8599e-351d-45ff-9685-
d7697504438a&owner=12936fbc-14a5-49fb-82da-f1f646a8a3d5
Levinson, M. 2006. The Box: How the Shipping Container Made the World Smaller and
the World Economy Bigger. Princeton University Press. p. 1.
http://www.pupress.princeton.edu/titles/8131.html
Lloyd’s List. 2008. Banana box slip a worry. Lloyd's List Daily Commercial News. 2
July, 2008.
Lloyd’s List. 2011. Top box lines join forces to cut cargo-related incidents. Lloyd's List
Daily Commercial News. 3 August, 2011.

49
Maritime International Secretariat Services (Marisec). 2010. Shipping and World Trade.
http://www.marisec.org/shippingfacts/worldtrade/number-of-ships.php
Maritime New Zealand. 2012. Tauranga Incident Page. Accessed 6 February, 2012.
http://www.maritimenz.govt.nz/Rena/
Maritime Research Institute Netherlands (MARIN). 2009. Lashing@Sea Executive
Summary. http://www.mcga.gov.uk/c4mca/19717-20-tm---executive_summary.pdf
Maritime Research Institute Netherlands (MARIN). 18 January 2010. Press release:
Lashing@Sea project reveals potential reasons why containers fall overboard every
year. http://www.marin.nl/web/file?uuid=d7d5b499-c2c9-4186-a1cc-
edbd80e639d1&owner=16083613-8247-4c91-b8e5-4e50e10b2d36
Mercer, Ian. 2008. Report of an Inquiry: MSC Napoli: The aftermath of the beaching off
Branscombe, East Devon, 20 January 2007. Devon County Council.
http://www.devon.gov.uk/napoli_report_10_final2.pdf
Miller, C.W. 2011. Distribution of shipping within the Monterey Bay National Marine
Sanctuary based on Automated Identification System (AIS) message reports.
Technical Report, Naval Postgraduate School, US Department of Defense.
http://www.montereybay.noaa.gov/research/techreports/NPS-OC-11-007_sm.pdf
MBNMS. 2011. M/V Med Taipei Settlement Outcome: Lost Shipping Container
Research. MBNMS Technical Report, 4pp.
http://montereybay.noaa.gov/research/techreports/trmbnms2011b.html
Murdoch, E., and Tozer, D. 2006. A Master's Guide to Container Securing. Published
for Lloyd’s Register and the Standard P&I Club, by Charles Taylor & Co Limited,
London. http://www.standard-club.com/docs/CTCMG2CSAW_disclaimer.pdf
Musson International Freight Forwarders – LA, LLC. Container Types. Accessed 12
February 2012 at http://www.mussonfreight.com/containers/containers.html
National Marine Sanctuary Program Regulations. 2012. 15 C.F.R. pt. 922.132.
NOAA. July 26, 2006. Press Release: Container Ship Owners and Operators to Pay
$3.25 Million in National Marine Sanctuary Settlement.
http://www.publicaffairs.noaa.gov/releases2006/jul06/noaa06-r476.html
NOAA. 2009. Monterey Bay National Marine Sanctuary Condition Report 2009. US
Department of Commerce, National Oceanic and Atmospheric Administration,
National Ocean Service, National Marine Sanctuary Program.
http://sanctuaries.noaa.gov/science/condition/mbnms/welcome.html
Organisation for Economic Co-operation and Development (OECD). May-June 2008.
Sea fairer: Maritime transport and CO2 emissions. OECD Observer. No. 267.

50
http://www.oecdobserver.org/news/fullstory.php/aid/2600/Sea_fairer:_Maritime_tra
nsport_and_CO2_emissions.html
Otter Project. 2008. Issue Backgrounder: Avoiding the BIG SPILL: Large vessel traffic
along California’s Coast.
http://www.otterproject.org/site/pp.asp?c=8pIKIYMIG&b=4113547
Payer, H.G. 2005. Adequacy of Selected Lock Size Parameters for Expanded Panama
Canal: Post-Panamax Lock Size Review Study. Report commissioned by the
Panama Canal Authority. http://www.pancanal.com/esp/plan/estudios/0286.pdf
Podsada, J. 2001. Lost Sea Cargo: Beach Bounty or Junk? National Geographic News.
19 June, 2001.
Port of Oakland. 2011. Facts and Figures. Accessed 10 February, 2011 at
http://www.portofoakland.com/maritime/factsfig.asp
Sanctuary Integrated Monitoring Network (SIMoN). 2013. Ecological Assessment of a
Lost Shipping Container in the MBNMS. SIMoN Project Page. Accessed January
31, 2013 at
http://sanctuarysimon.org/projects/project_info.php?projectID=100388&site=true
Standley, J. 2003. Ducks' Odyssey Nears End. BBC News. July 12, 2003
http://news.bbc.co.uk/2/hi/americas/3060579.stm
Taylor, J.R., A.P. DeVogelaere, E.J. Burton, O. Frey, L. Lundsten, L.A. Kuhnz, P.J.
Whaling, C. Lovera, K.R. Buck, and J.P. Barry. In review. Deep-sea faunal
communities associated with a lost intermodal shipping container in the Monterey
Bay National Marine Sanctuary, CA. Marine Pollution Review.
United Nations Environment Programme (UNEP). 2005. Marine Litter: An Analytical
Overview. 58p.
http://www.unep.org/regionalseas/marinelitter/publications/docs/anl_oview.pdf
Valspar Corporation. 2011. Press Release: Valspar Commercializes Water-Based
Coating for Shipping Container Industry. Accessed September 14, 2012 at
http://www.valsparcontainer.com/pdfs/Waterbased_Coating_Commercialized-
May2011.pdf
Vero Marine Insurance (VMI). Containers Overboard. Accessed 11 February, 2011 at
http://www.veromarine.co.nz/dirvz/marine/marine.nsf/Content/PhotoFeature0007
Van den Hove, S. and V. Moreau. 2007. Deep-sea biodiversity and ecosystems: A
scoping report on their socio-economy, management, and governance. UNEP
World Conservation Monitoring Centre. http://www.unep-
wcmc.org/resources/publications/UNEP_WCMC_bio_series/28/Deep-

51
Sea%20Biodiversity%20and%20Ecosystems_large.pdf
World Bank. 2009. Indicators Data: Container Port Traffic (TEU: 20 foot equivalent
units). http://data.worldbank.org/indicator/IS.SHP.GOOD.TU
World Shipping Council. 2011. Containers Lost At Sea. Press release issued August 10,
2011. http://www.worldshipping.org/industry-
issues/safety/Containers_Overboard__Final.pdf