Embed Size (px)
Citation preview
Papers in Language Testing and Assessment, Vol. 5, issue 2, 2016 69
The Construct and Predictive Validity of a Self-Assessment Scale
Jason Jinsong Fan1
Fudan University/The University of Melbourne
Guided by the theory of interpretive validity argument, this study investigated the plausibility and accuracy of five sets of warrants which were deemed crucial to the validity of a self-assessment (SA) scale designed and used in a local EFL context. Methodologically, this study utilized both the Rasch measurement theory and structural equation modeling (SEM) to examine the five warrants and their respective rebuttals. Results from Rasch analysis indicated that the scale could reliably distinguish students at different proficiency levels. Among the 26 can-do statements in the SA scale, only one statement failed to fit the expectations of the Rasch model. Furthermore, each category was found to function as intended, though the first category was somewhat underused. Confirmatory factor analysis of the SA data supported the tenability of the Higher-Order Factor model which is consistent with the current view of L2 ability. Structural regression analysis revealed that the association between students’ self-assessments and their scores on a standardized proficiency test was moderately strong. The multiple strands of evidence generated by various quantitative analyses of the SA data generally supported the validity of the SA scale. Future research, however, is warranted to examine other inferences in the validity argument structure, particularly in relation to the utility of the SA scale in English teaching and learning.
Key words: self-assessment, validity argument, Rasch analysis, structural equation modeling
1Email address for correspondence: [email protected]
70 J. Fan
Introduction
Self-assessment in language learning and assessment
Self-assessment (SA), also known as self-evaluation, refers to “procedures by which learners themselves evaluate their language skills and knowledge” (Bailey, 1996, p. 227). With the increasing popularity of self-directed learning and learner autonomy in second language (L2) learning, recent years have witnessed SA capturing significant attention from the language learning and assessment community as an alternative and supplementary tool for assessing L2 learners’ language ability (e.g., Oscarson, 2013). SA has been described from multiple perspectives. For example, Shepard (2000) describes it as the emergent, constructivist paradigm, as opposed to the dominant 20th-century paradigm which was characterized by the scientific measurement theory (i.e., the focus on psychometric properties of measurement instruments) and standardized testing. Shohamy (2001) discusses it from the power perspective, believing that such an approach to assessment promotes the sharing of power and authority in assessment practices. In a similar vein, Luoma and Tarnanen (2003) argue that SA, from its philosophical basis, is aligned with the “alternative paradigm” where the ownership of assessment is shared between teachers and learners, and where the objective of assessment is to support learning.
SA is believed to demonstrate a number of discernible advantages such as increasing student and teacher motivation and improving students’ goal orientation (Oscarson, 1989, 2013; Ross, 1998), helping students to develop a better understanding of the purpose of the assessment and the assessment criteria (Orsmond, Merry, & Reiling, 1997), and softening the blow of a bad grade by helping students understand the reasons for their grade (Taras, 2001). Despite the numerous advantages of using SA in L2 learning, quite a number of concerns and problems have been cited in the research literature regarding the reliability, validity, and predictive accuracy in using SA in different settings (e.g., Blanche & Merino, 1989; Messick, 1995). Previous research indicates three major sources of variability in the accuracy of SA, including the domain of assessment (e.g., listening, reading, writing, and speaking), learners’ individual attributes (e.g., language proficiency, self-esteem, and anxiety), and item characteristics (e.g., the wording of the SA questionnaire).
A typical approach to investigate the accuracy of SA is to compare the SA results with external criterion measures such as teachers’ ratings, final grades, or objective tests through correlation analyses (e.g., Butler & Lee, 2006; LeBlanc & Painchaud, 1985). Though mixed findings seem to have been reported, there
Papers in Language Testing and Assessment, Vol. 5, issue 2, 2016 71
is generally an indication emerging from these studies that SA is a valid tool for assessing L2 learners’ proficiency levels. A meta-analysis study conducted by Ross (1998) indicates that the relationship between SA and the criterion variables in the four domains of language ability (i.e., listening, reading, writing, and speaking) was robust with the average coefficients ranging from 0.52 to 0.65. The results brought Ross (1998, p. 17) to the conclusion that “provided that the content validity is met, the overall picture indicates that there is clear potential for predictive accuracy of criterion skills based on self-assessment measures”. This view could find resonance in Powers and Powers (2015) who used a SA inventory in the validation study of TOEIC, an English test designed to measure everyday English skills used in an international business environment. Moderately strong correlation coefficients were observed between students’ self-assessments and their TOEIC scores, with the coefficients ranging from 0.34-0.51. Echoing the view of Ross (1998), Powers and Powers (2015) argued that “although it is unwise to trust self-assessments unconditionally, we believe that, on balance and in the appropriate context, self-assessments constitute a reasonably defensible criterion against which to gauge the utility of the TOEIC scores” (p. 157). Taken together, it seems reasonable to conclude that a SA scale, if carefully crafted and validated, has the potential to be used in some learning and assessment contexts, particularly for making low-stakes decisions (e.g., Oscarson, 2013).
Previous validation research of the SA scales, however, has depended routinely on conducting correlation analysis between self-assessments and some external measures such as teachers’ ratings or standardized tests (e.g., Enright, Bridgeman, Eignor, Lee, & Powers, 2008; Powers & Powers, 2015; Powers, Roever, Huff, & Trapani, 2003). A number of researchers, however, have expressed the view that correlation is inherently difficult to interpret even for experienced social scientists (e.g., Sackett, Borneman, & Connelly, 2008). More essentially, current view of validity advocates that multiple strands of evidence be collected, weighed, and synthesized into a coherent validity argument to support test score interpretation and use (e.g., Chapelle, Enright, & Jamieson, 2008). Therefore, it follows that conducting correlation analysis between self-assessments and external criteria is insufficient to address the various inferential links in the validity argument structure. In view of the limitations with previous research, the present study utilized both the Rasch measurement theory and structural equation modeling (SEM) to validate an SA scale developed and used for placement purposes in a local EFL context. Guided by the theory of interpretative argument (e.g., Chapelle et al., 2008; Kane, 2002), this study was aimed at examining the plausibity and accuracy of five sets of
72 J. Fan
warrants (and their respective rebuttals) which were deemed crucial to the validity of the SA scale.
Interpretative validity argument
In recent years, the argument-based approach to test validation has been widely accepted and applied in the field of language assessment (e.g., Bachman & Palmer, 2010; Chapelle et al., 2008; Xi, 2010). Under this validity framework, an interpretative argument should be formulated, which includes inferences, warrants, assumptions, backing, and rebuttal. To back up the claim that a test is sufficiently valid for its intended purposes, the inferences in the validity argument should be clarified, and each inference needs to be supported by warrants which refer to “general statements that provide the legitimacy of the inference from data to claim” (Bachman & Palmer, 2010, p. 98). Specifically, this study was guided by the interpretative argument structure proposed by Chapelle et al. (2008) who argued that a number of inter-related inferences need to be examined in order to build a coherent and compelling validity narrative for a language test, including Domain Description, Evaluation, Generalization, Explanation, Extrapolation, and Utilization.
Based on the interpretive argument structure of Chapelle, et al. (2008), five sets of warrants were proposed and examined in terms of their plausibility and accuracy in this study. First, the SA scale was reliable, and could effectively distinguish students at different proficiency levels (Warrant 1); Second, students’ responses to the items in the self-assessment (SA) scale fit the expectations of the Rasch model (Warrant 2); Third, the category structure in the SA scale functioned as intended, and did not introduce noise into the measurement process (Warrant 3); Fourth, the configuration of the constructs that the SA scale assessed was consistent with current view of language ability (Warrant 4); Fifth, students’ SA results were associated with their performance on a standardized English proficiency test (Warrant 5).
These five sets of warrants were intended to target three inferences in the structure of interpretative argument, focusing mainly on the construct and predictive aspects of validity in the unitary model of test validity (e.g., Messick, 1989). The first three sets of warrants, which concern the measurement properties of the SA scale, targeted the inference of “Generalization” (i.e., from “Observed Score” to “Expected Score”). The fourth warrant, which is related to the internal structure of the SA scale, targeted “Explanation” (i.e., from “Expected Score” to “Construct”), whereas the fifth warrant, which concerns the relationship between the SA scale and an external criterion measure,
Papers in Language Testing and Assessment, Vol. 5, issue 2, 2016 73
targeted “Extrapolation” (i.e., from “Construct” to “Target Score”). To evaluate the plausibility and accuracy of the five sets of warrants, the corresponding rebuttals of these warrants were also examined which are listed as follows. First, the SA scale was not reliable, and failed to distinguish students at different proficiency levels; Second, students’ responses to the SA scale did not fit the Rasch model; Third, the category structure of the SA scale was not appropriate which adversely affected the measurement process; Fourth, the internal structure of the SA scale failed to reflect the current view of language ability, and finally, there was no or weak association between students’ self-assessments and their performance on a standardized English proficiency test. In consequence, evidence in support of each warrant would support the plausibility and accuracy of the inference that this warrant targeted, and by extension, back up the validity of the SA scale. Conversely, evidence in support of the rebuttals may weaken or undermine the inferential link in the validity argument structure, and in consequence, the validity of the SA scale (see Chapelle, et al., 2008).
The Present Study
The self-assessment scale
The purpose of the present study was to examine the plausibility and accuracy of five sets of warrants which were deemed crucial to the validity of a SA scale. The scale in this study was developed and used at a first-tier research university in China. To cater to students’ individualized needs in college English learning, a wide variety of optional English language courses have been designed and provided to students at this university, most of which require a certain entry level of English proficiency (e.g., Ji, Fan, & Fan, 2016). Compared with standardized testing, SA provides a logistically more viable approach for teachers and students to gauge the English proficiency level crudely before students select these courses, and therefore was deemed appropriate for this context where low-stakes placement decisions were to be made based on SA results. Furthermore, students can use the SA scale to evaluate their progress in language learning, and identify their strengths as well as areas that are in need of improvement.
The SA scale was developed on the basis of the English teaching syllabus in this research university. Heeding the advice from previous researchers about the effect of wording on SA results (e.g., Bachman & Palmer, 1989; Suzuki, 2015), only can-do statements were used in the SA scale. Also, given the centrality of
74 J. Fan
content validity to a SA scale (e.g., Ross, 1998), an assortment of linguistic activities of varying degrees of difficulty was designed on the basis of a careful review of the contents and objectives in the English teaching syllabus. Moreover, expert panel reviews were organized to judge the relevance and appropriateness of the can-do statements used in the SA scale. Last but not least, as experiential factors have been found to play a significant role in the validity of self-assessments (e.g., Butler & Lee, 2006; Oscarson, 2013), the SA scale in this study was designed to contain linguistic activities that tended to be commonly experienced for the sample in this study. A total of 26 can-do statements survived this a priori review process in the four modalities of listening (n = 6), writing (n = 7), reading (n = 7), and speaking (n = 6). All can-do statements were written in Chinese, the participants’ first language, and designed on a five-point Likert-type scale of agreement (1 – Strongly Disagree; 2 – Disagree; 3 – Neutral; 4 – Agree; 5 – Strongly Agree).
General methodological considerations
The Rasch measurement theory and structural equation modeling (SEM) were used to interrogate the validity of this SA scale. The advantages of using the Rasch measurement theory over the Classical Test Theory (CTT) in analyzing Likert-type data has been treated at length in research literature (e.g., Bond & Fox, 2015; Cavanagh & Waugh, 2011). The principal disadvantage of the CTT lies in that it relies on sample statistics to derive scale estimates. Consequently, different scale properties (e.g., item-total correlations, Cronbach’s alphas) may be yielded with different samples, thus making it difficult to generalize the research findings. In addition, in analyzing the Likert-type scale survey data, the CTT assumes that the scale is linear, all items have the same impact, and that the distance between any two adjacent categories is equal. To address these limitations of the CTT, this study adopted the Rasch measurement theory to examine the measurement properties of the SA scale.
In addition to the Rasch measurement theory, this study also adopted SEM which is a comprehensive statistical methodology that takes a confirmatory approach to the analysis of a structural theory bearing on some phenomenon, and to testing theoretical hypotheses about some phenomenon (Byrne, 2006). SEM can be viewed as an integration of several models: multiple regression, path analysis, and factor analysis (e.g., Kunnan, 1998). Under the SEM framework, multiple models can be specified, evaluated against the empirical data, and compared with each other to determine the best-fitting model. Another advantage of SEM lies in that it allows researchers to model the relationship between and among latent and observed variables, and by so
Papers in Language Testing and Assessment, Vol. 5, issue 2, 2016 75
doing, SEM provides a statistically more rigorous solution to understand the relationships among these variables (Ockey & Choi, 2015). In this study, the confirmatory factor analysis (CFA) model in SEM was first utilized to model the SA data, and then a structural regression model was built to further model the relationship between students’ self-assessments and their performance on a standardized proficiency test.
Method
Data
The data in this study were collected from 244 undergraduate students from the research university where the SA scale was developed and used, adopting convenience random sampling approach (e.g., Brown, 2014). The sample consisted of 74 (30.3%) males and 170 (69.7%) females with age ranging from 16 to 24 (Mean = 19.27, SD = 1.09). At the time of investigation, 69 (28.3%) were studying their first year in the university, 133 (54.5%) in the second year, whereas the rest 42 (17.2%) in the third year. As far as their academic background was concerned, 101 (41.4%) studied majors in humanities and social sciences, whereas 143 (58.6%) studied majors in science and engineering.
The SA data were collected with the assistance of the English teachers in December, 2014. Twenty English classes with an average of 25 students in each class were randomly selected from this university. Of the 275 questionnaires that were administered to students, 250 were returned. A further examination of the data revealed that in 6 questionnaires over half of the items were not completed. These 6 questionnaires were therefore eliminated from our analysis, resulting in 244 valid responses. The response rate was calculated at 88.7%. All participants took a university-based high-stakes English proficiency test, modeled on the English teaching syllabus one week after they had completed the SA questionnaires. This test was implemented in 2011, and has been subjected to rigorous validation research which generally supported its satisfactory reliability and validity (e.g., Fan & Ji, 2014; Fan, Ji, & Song, 2014; Fan, Knoch, & Bi, 2016). It should be noted that compared with the test population in 2014 (N = 4,162), the sample had higher proficiency, as indicated by their mean scores on the test (sample: Mean = 66.72, SD = 11.12; population: Mean = 61.62, SD = 11.74). An independent samples t-test indicated that the difference was a significant one (t = -6.94, df = 275.72, p < 0.05, Cohen’s d = 0.45). This needs to be kept in mind when interpreting the results emerging from the analyses.
76 J. Fan
Analysis procedures
To examine the first three warrants, the Rating Scale Model (RSM) in Rasch measurement theory (Andrich, 1978) was utilized to examine the measurement properties of the SA scale. As preliminary analysis, both the Partial Credit Model (PCM) and RSM were utilized to analyze the data, following Knoch and McNamara (2015). No significant differences were observed in the threshold estimates generated by these two models. The more parsimonious model, i.e., the RSM, was therefore selected to analyze the SA data. The RSM is the extension of the basic (i.e., dichotomous) Rasch model (Rasch, 1960, 1980), and is routinely used to calibrate and examine the quality of response categories in Likert-type scales (Bond & Fox, 2015). The mathematical expression of this model is presented below:
log (Pnij/Pni(j-1)) = Bn - Di - Fj
Where Pnij and Pni(j-1) refer to the probability of a person n of ability Bn being observed as responding to category j or lower category j-1 respectively of a rating scale on a particular item i of difficulty Di with Fj the threshold calibration which is held as constant across all items in the rating scale. Winsteps 3.90 (Linacre, 2012) was used to implement the Rasch analysis in this study.
To examine the next two warrants, the confirmatory factor analysis (CFA) model in SEM was first utilized to investigate the configuration of the constructs measured in the SA scale. The CFA analysis in this study followed the procedures as suggested by Byrne (2006), which consisted of: (1) model specification, i.e., specifying hypothetical models which were assumed to represent the factor structure of the SA scale based on substantive theory and/or previous research; (2) model assessment, i.e., assessing the fit of the model against the empirical data; (3) model comparison, i.e., comparing the competing models in terms of their model-data fit to determine the best-fitting model as representing the internal structure of the SA scale (see also Kunnan, 1998). As preliminary analyses, the normality of the univariate score distribution was assessed using skewness and kurtosis values and the plots of score distributions. Skewness and kurtosis values within |3.30| (the z score at p < 0.01) were considered to indicate univariate normality (e.g., Field, 2009). Multivariate normality was assessed using Mardia’s normalized estimate, with values of 5.00 or below considered to indicate multivariate normality (e.g., Byrne, 2006). The maximum likelihood method was used to estimate model parameters. Whenever univariate or multivariate non-normality was observed,
Papers in Language Testing and Assessment, Vol. 5, issue 2, 2016 77
Satorra-Bentler Scaled chi-square statistic (S-B x2), which offers an adjustment for non-normality of data, was used for evaluation of model fit (Byrne, 2006).
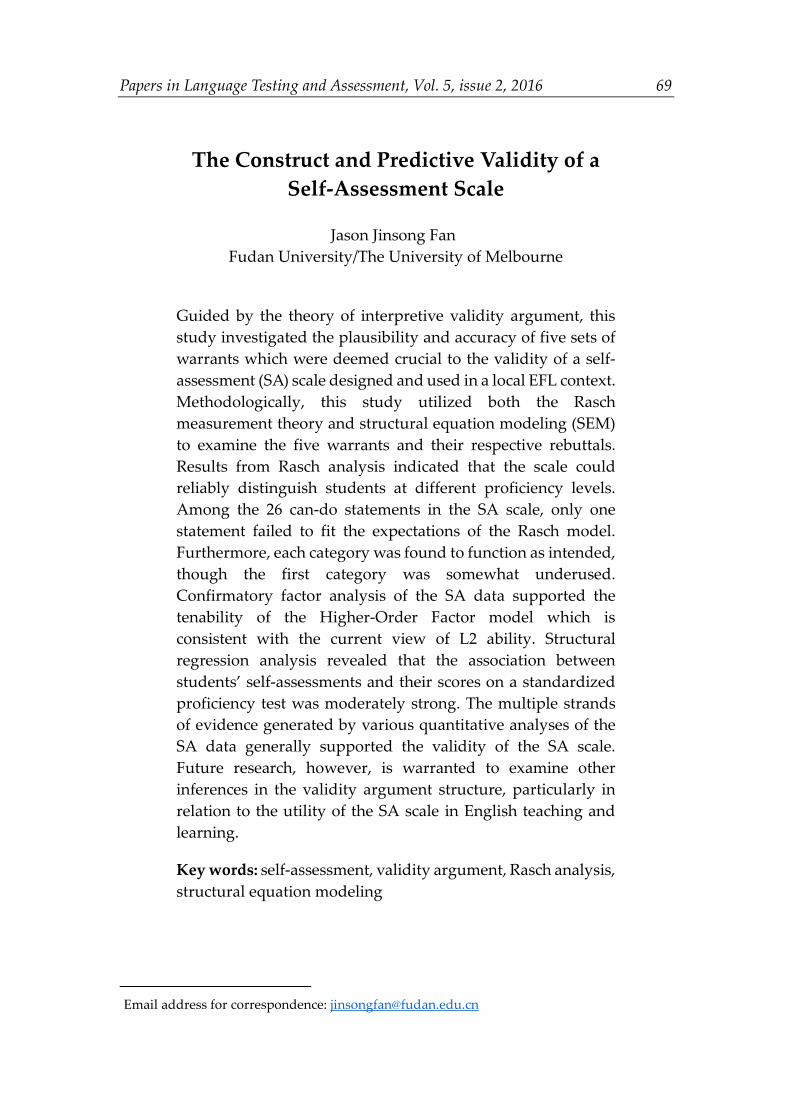
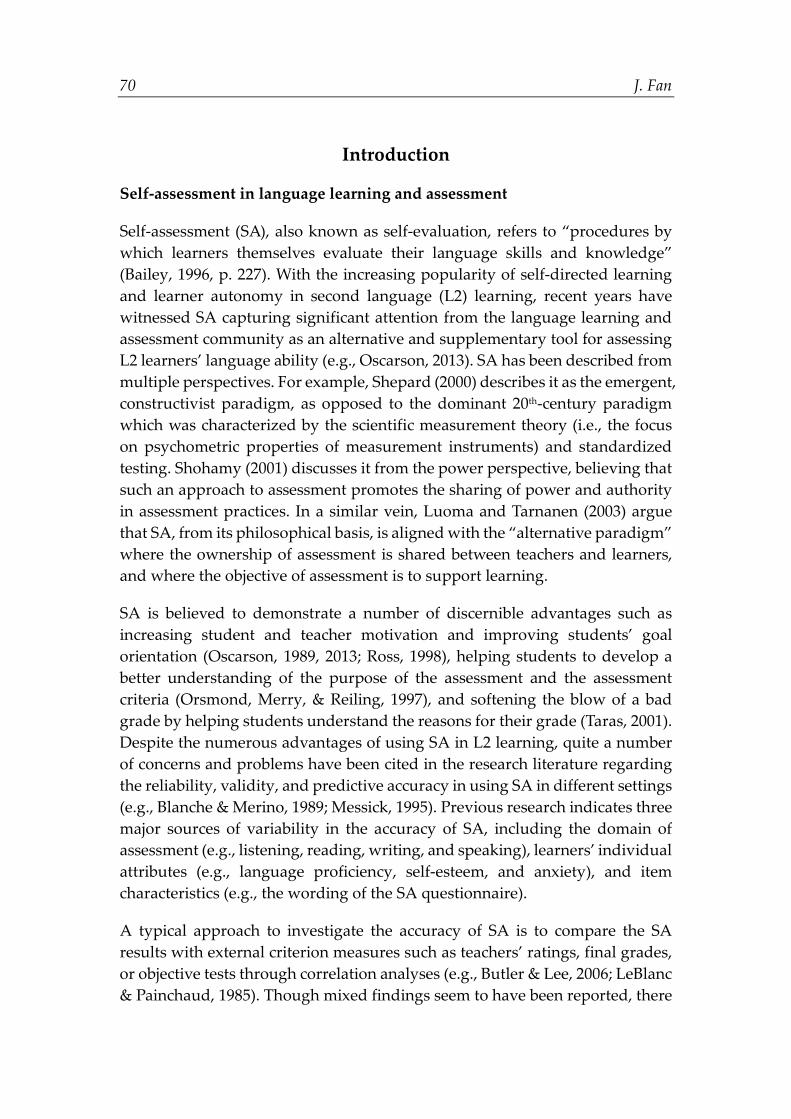
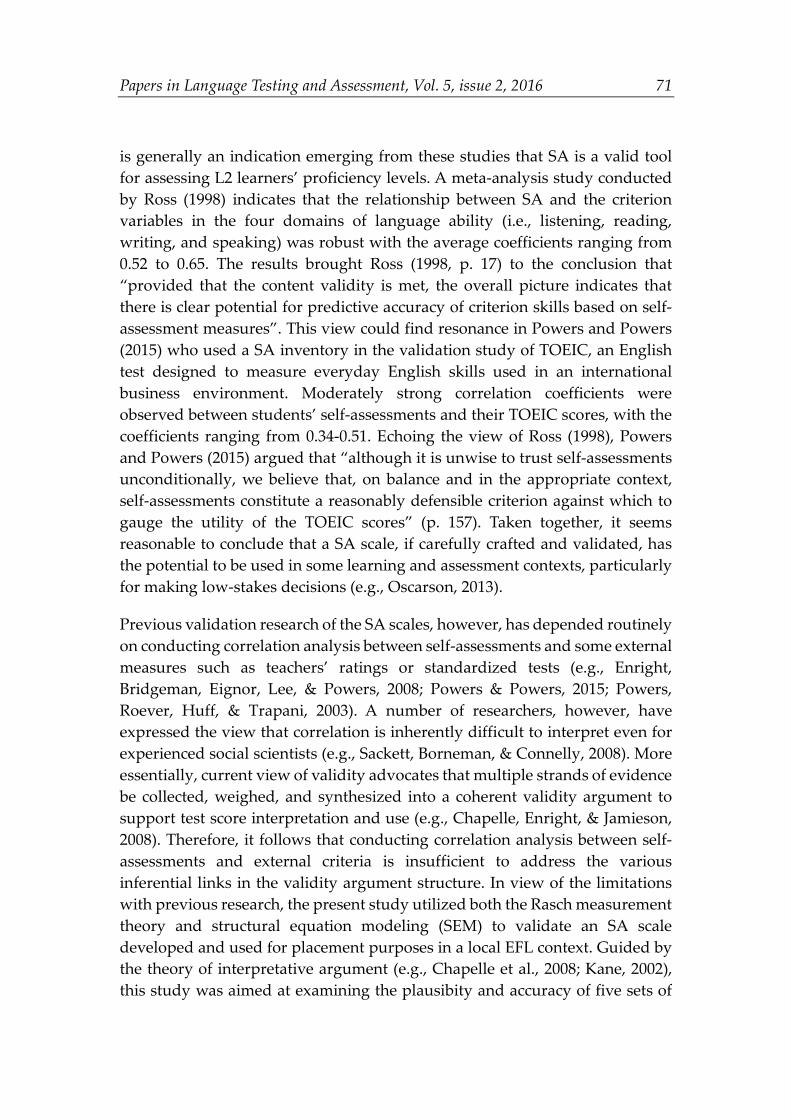
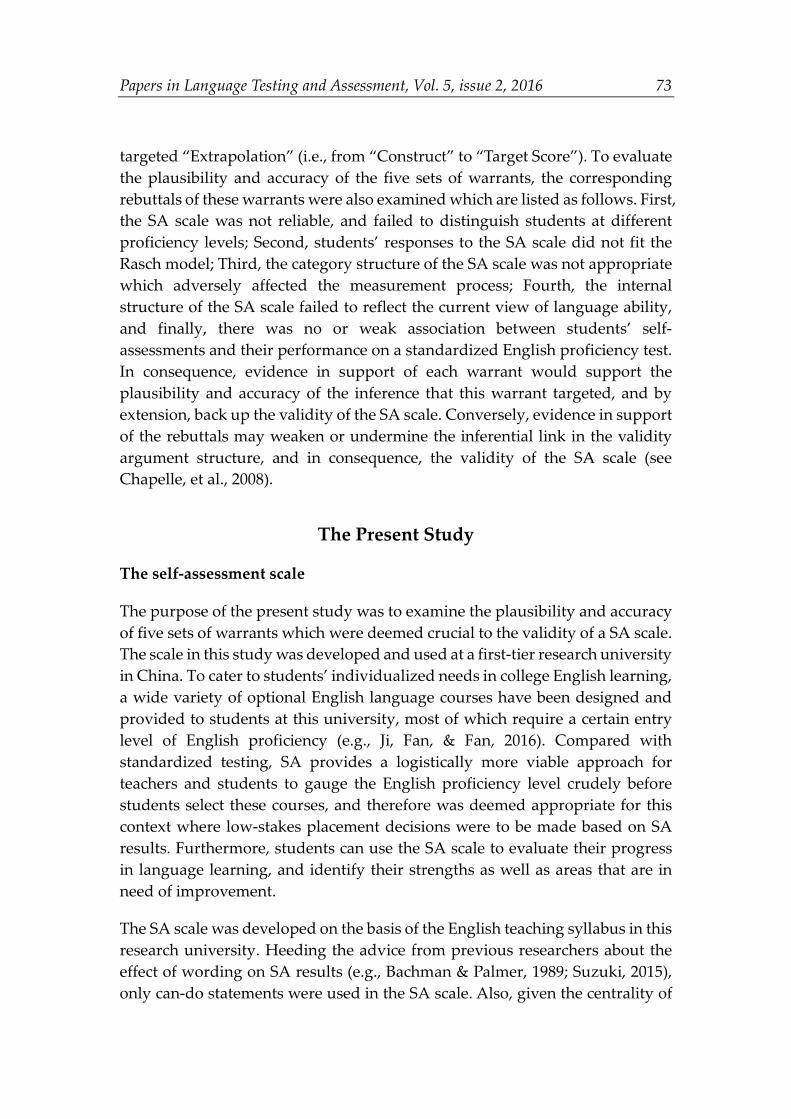
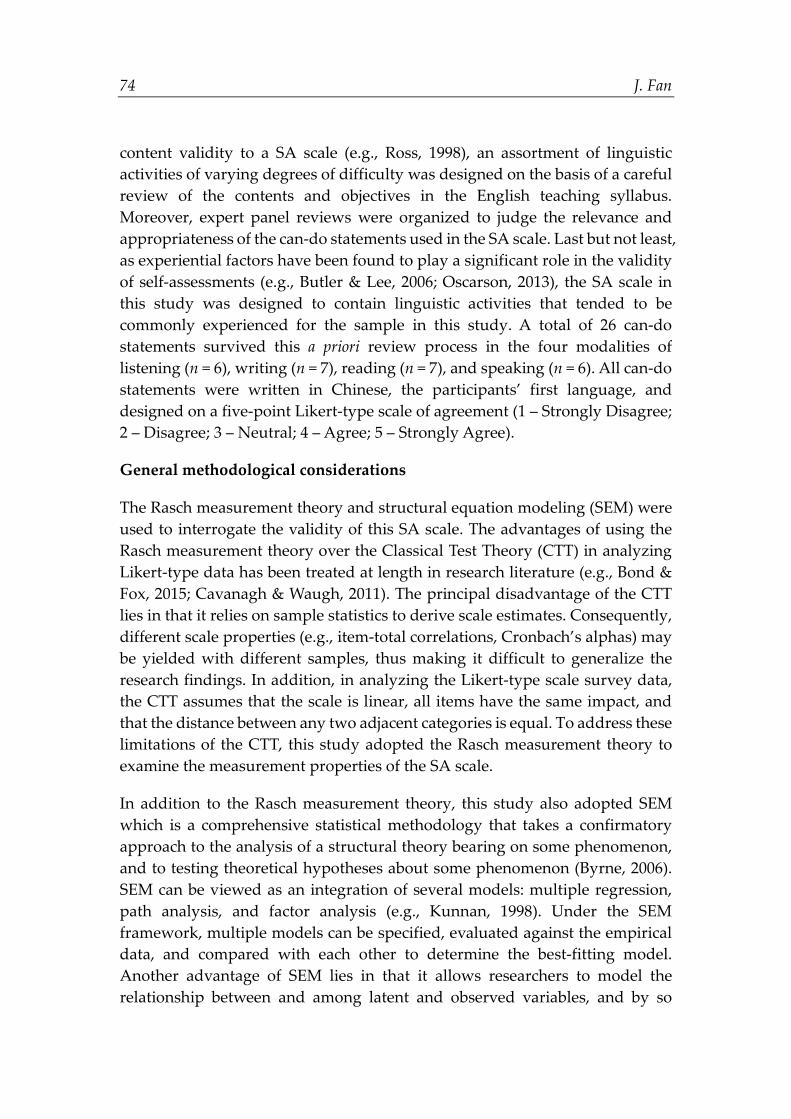
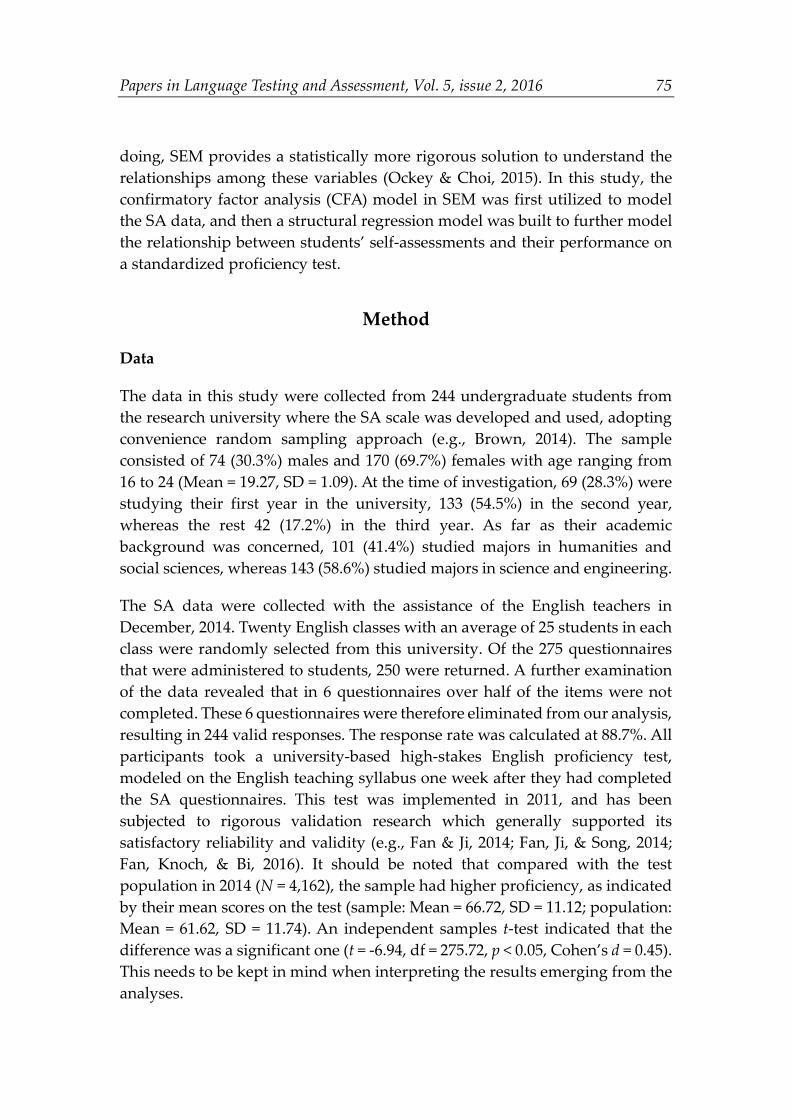
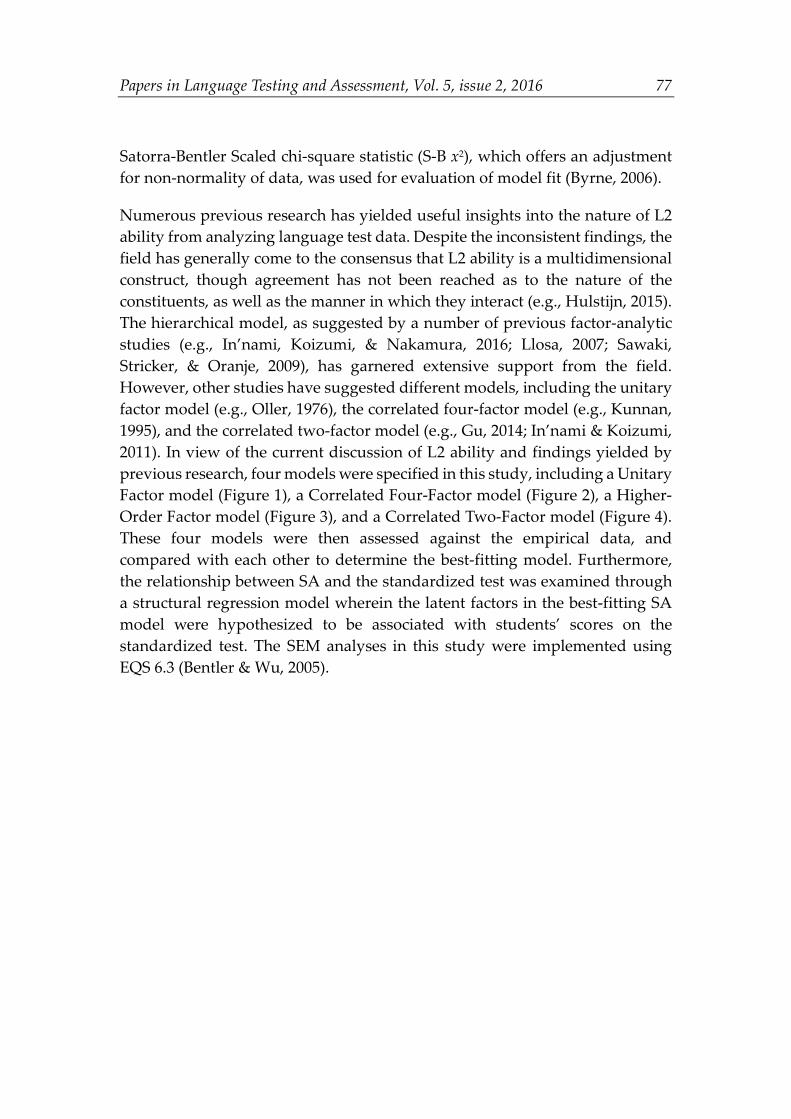
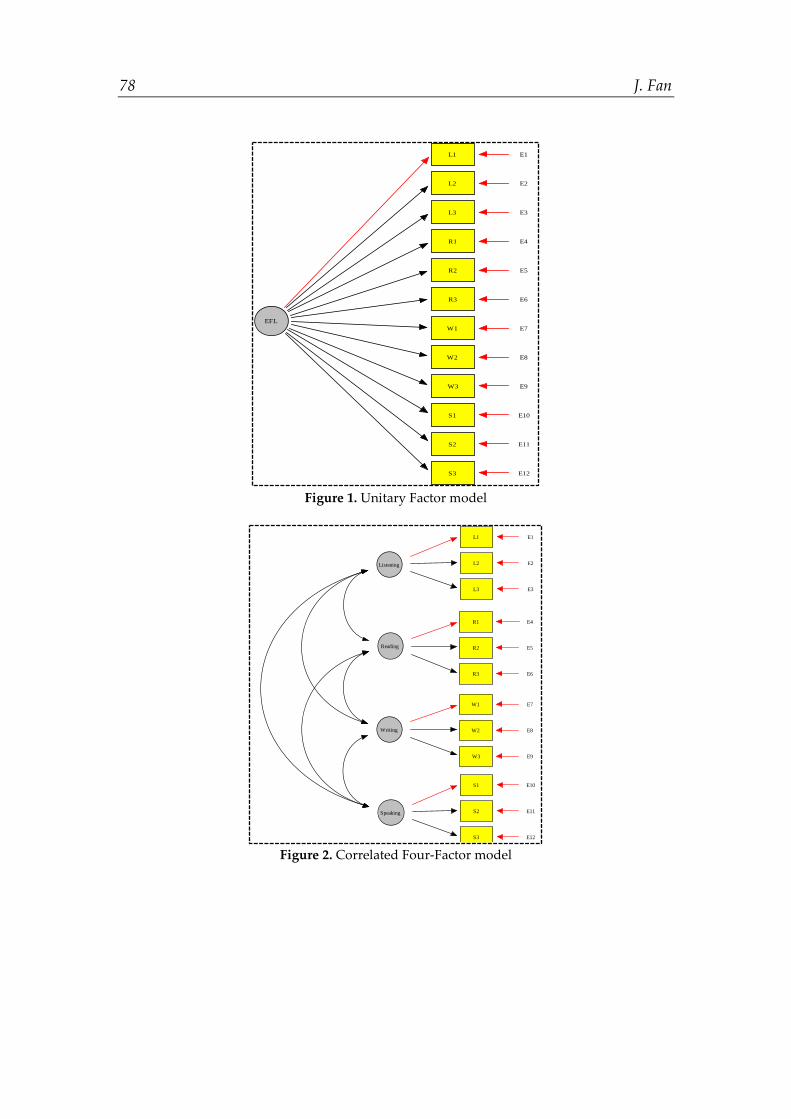
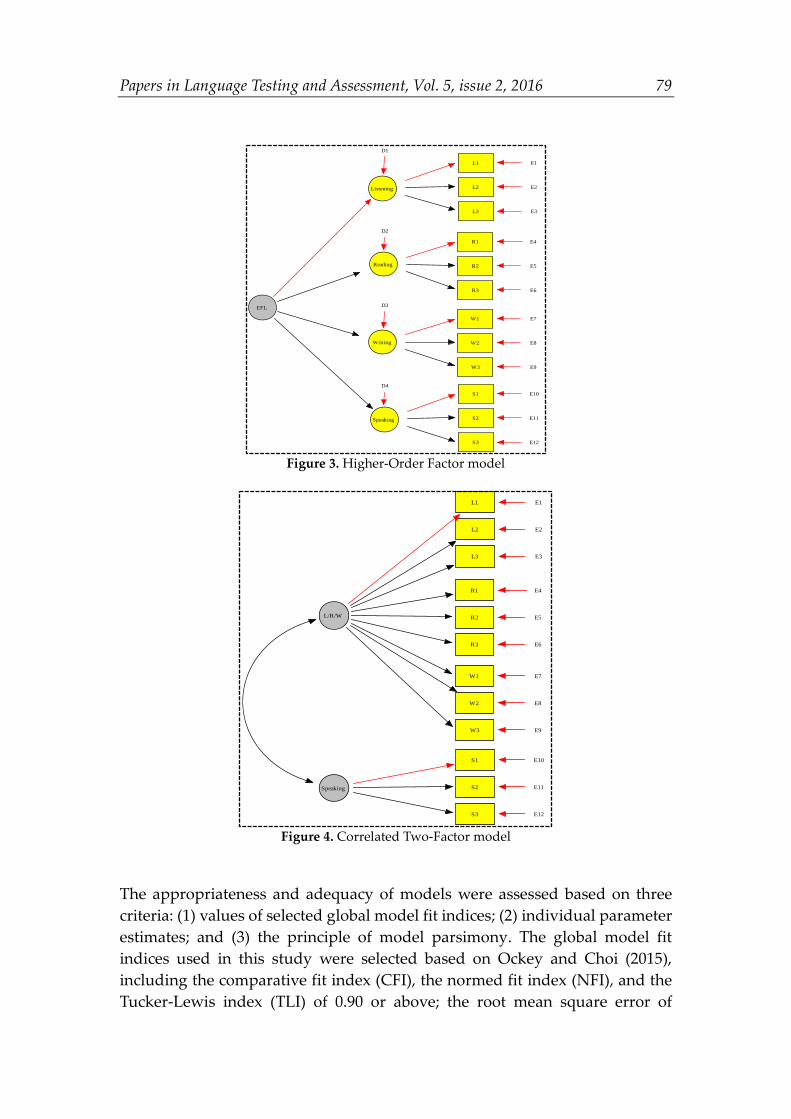
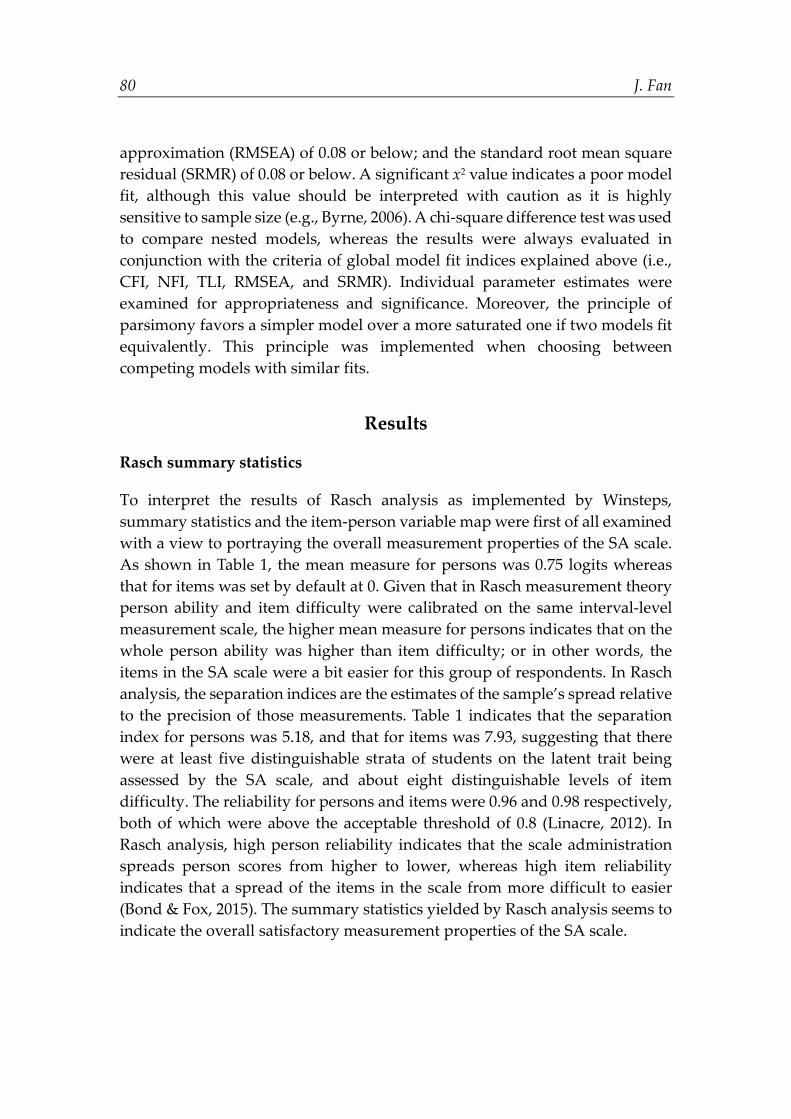
Numerous previous research has yielded useful insights into the nature of L2 ability from analyzing language test data. Despite the inconsistent findings, the field has generally come to the consensus that L2 ability is a multidimensional construct, though agreement has not been reached as to the nature of the constituents, as well as the manner in which they interact (e.g., Hulstijn, 2015). The hierarchical model, as suggested by a number of previous factor-analytic studies (e.g., In’nami, Koizumi, & Nakamura, 2016; Llosa, 2007; Sawaki, Stricker, & Oranje, 2009), has garnered extensive support from the field. However, other studies have suggested different models, including the unitary factor model (e.g., Oller, 1976), the correlated four-factor model (e.g., Kunnan, 1995), and the correlated two-factor model (e.g., Gu, 2014; In’nami & Koizumi, 2011). In view of the current discussion of L2 ability and findings yielded by previous research, four models were specified in this study, including a Unitary Factor model (Figure 1), a Correlated Four-Factor model (Figure 2), a Higher-Order Factor model (Figure 3), and a Correlated Two-Factor model (Figure 4). These four models were then assessed against the empirical data, and compared with each other to determine the best-fitting model. Furthermore, the relationship between SA and the standardized test was examined through a structural regression model wherein the latent factors in the best-fitting SA model were hypothesized to be associated with students’ scores on the standardized test. The SEM analyses in this study were implemented using EQS 6.3 (Bentler & Wu, 2005).
78 J. Fan
Figure 1. Unitary Factor model
Figure 2. Correlated Four-Factor model
EFL
L1 E1
L2 E2
L3 E3
R1 E4
R2 E5
R3 E6
W1 E7
W2 E8
W3 E9
S1 E10
S2 E11
S3 E12
Listening
L1 E1
L2 E2
L3 E3
Reading
R1 E4
R2 E5
R3 E6
Writing
W1 E7
W2 E8
W3 E9
Speaking
S1 E10
S2 E11
S3 E12
Papers in Language Testing and Assessment, Vol. 5, issue 2, 2016 79
Figure 3. Higher-Order Factor model
Figure 4. Correlated Two-Factor model
The appropriateness and adequacy of models were assessed based on three criteria: (1) values of selected global model fit indices; (2) individual parameter estimates; and (3) the principle of model parsimony. The global model fit indices used in this study were selected based on Ockey and Choi (2015), including the comparative fit index (CFI), the normed fit index (NFI), and the Tucker-Lewis index (TLI) of 0.90 or above; the root mean square error of
Listening
L1 E1
L2 E2
L3 E3
Reading
R1 E4
R2 E5
R3 E6
Writing
W1 E7
W2 E8
W3 E9
Speaking
S1 E10
S2 E11
S3 E12
EFL
D1
D2
D3
D4
L1 E1
L2 E2
L3 E3
R1 E4
R2 E5
R3 E6
W1 E7
W2 E8
W3 E9
S1 E10
S2 E11
S3 E12
L/R/W
Speaking
80 J. Fan
approximation (RMSEA) of 0.08 or below; and the standard root mean square residual (SRMR) of 0.08 or below. A significant x2 value indicates a poor model fit, although this value should be interpreted with caution as it is highly sensitive to sample size (e.g., Byrne, 2006). A chi-square difference test was used to compare nested models, whereas the results were always evaluated in conjunction with the criteria of global model fit indices explained above (i.e., CFI, NFI, TLI, RMSEA, and SRMR). Individual parameter estimates were examined for appropriateness and significance. Moreover, the principle of parsimony favors a simpler model over a more saturated one if two models fit equivalently. This principle was implemented when choosing between competing models with similar fits.
Results
Rasch summary statistics
To interpret the results of Rasch analysis as implemented by Winsteps, summary statistics and the item-person variable map were first of all examined with a view to portraying the overall measurement properties of the SA scale. As shown in Table 1, the mean measure for persons was 0.75 logits whereas that for items was set by default at 0. Given that in Rasch measurement theory person ability and item difficulty were calibrated on the same interval-level measurement scale, the higher mean measure for persons indicates that on the whole person ability was higher than item difficulty; or in other words, the items in the SA scale were a bit easier for this group of respondents. In Rasch analysis, the separation indices are the estimates of the sample’s spread relative to the precision of those measurements. Table 1 indicates that the separation index for persons was 5.18, and that for items was 7.93, suggesting that there were at least five distinguishable strata of students on the latent trait being assessed by the SA scale, and about eight distinguishable levels of item difficulty. The reliability for persons and items were 0.96 and 0.98 respectively, both of which were above the acceptable threshold of 0.8 (Linacre, 2012). In Rasch analysis, high person reliability indicates that the scale administration spreads person scores from higher to lower, whereas high item reliability indicates that a spread of the items in the scale from more difficult to easier (Bond & Fox, 2015). The summary statistics yielded by Rasch analysis seems to indicate the overall satisfactory measurement properties of the SA scale.
Papers in Language Testing and Assessment, Vol. 5, issue 2, 2016 81
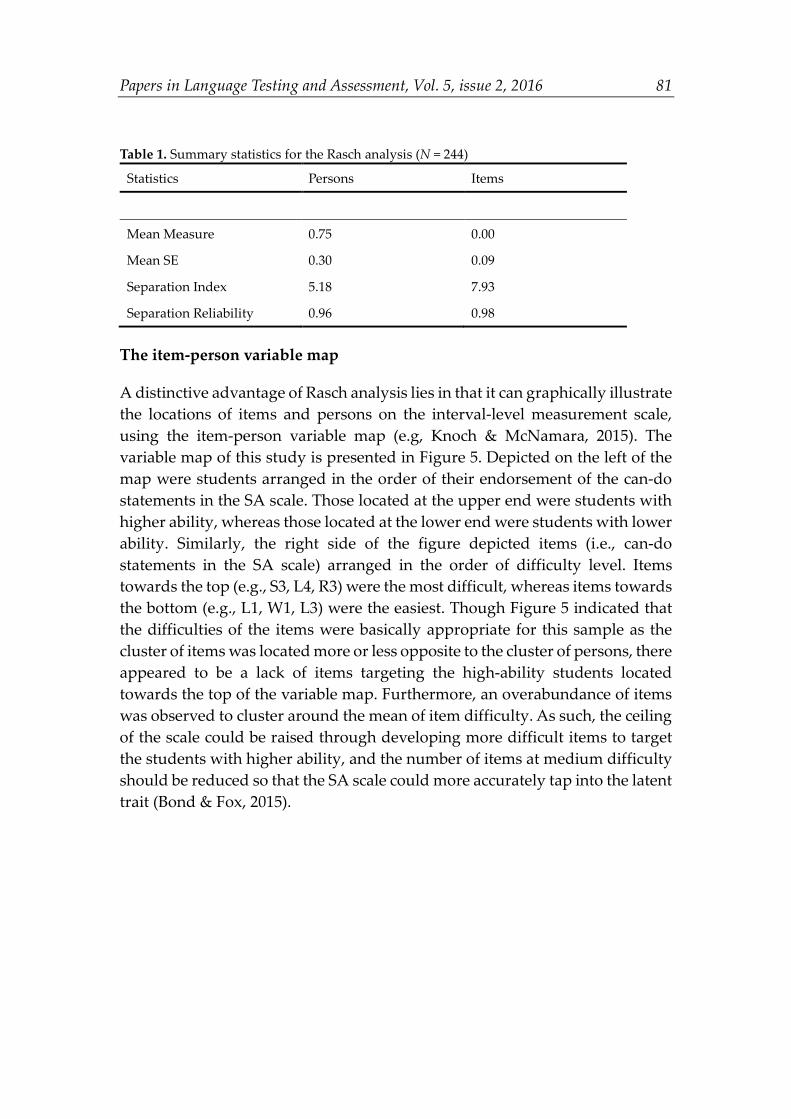
Table 1. Summary statistics for the Rasch analysis (N = 244)
Statistics Persons Items
Mean Measure 0.75 0.00
Mean SE 0.30 0.09
Separation Index 5.18 7.93
Separation Reliability 0.96 0.98
The item-person variable map
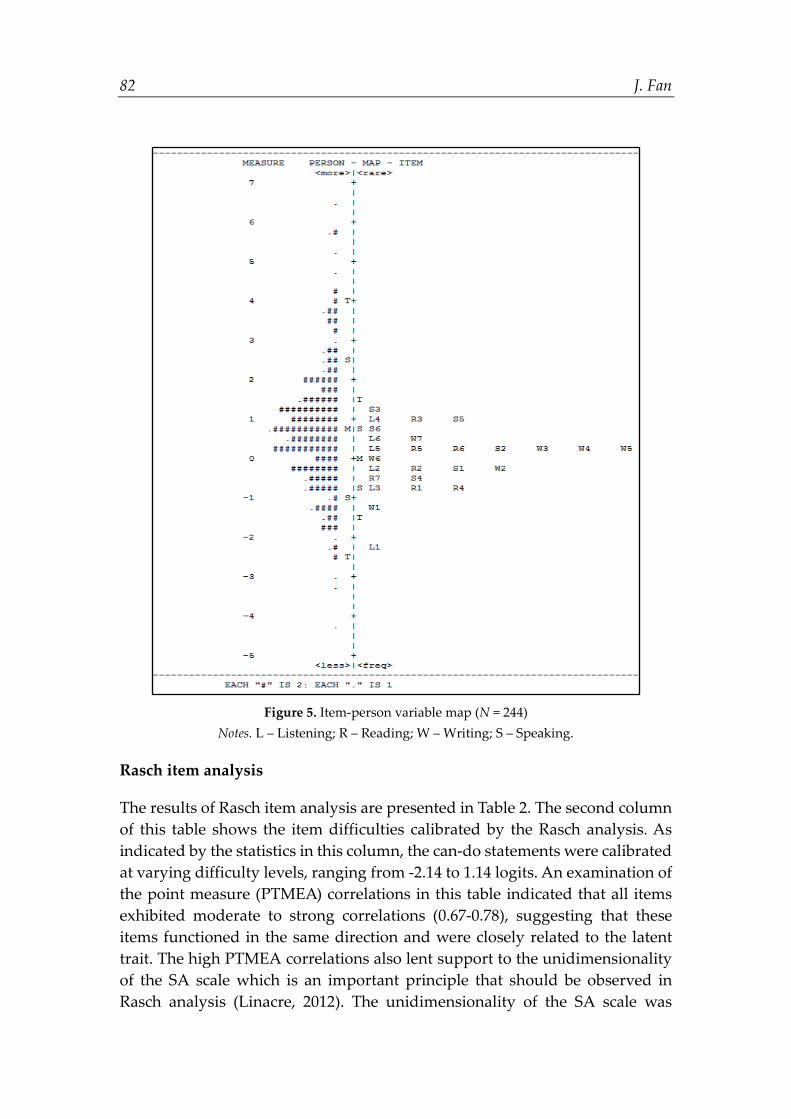
A distinctive advantage of Rasch analysis lies in that it can graphically illustrate the locations of items and persons on the interval-level measurement scale, using the item-person variable map (e.g, Knoch & McNamara, 2015). The variable map of this study is presented in Figure 5. Depicted on the left of the map were students arranged in the order of their endorsement of the can-do statements in the SA scale. Those located at the upper end were students with higher ability, whereas those located at the lower end were students with lower ability. Similarly, the right side of the figure depicted items (i.e., can-do statements in the SA scale) arranged in the order of difficulty level. Items towards the top (e.g., S3, L4, R3) were the most difficult, whereas items towards the bottom (e.g., L1, W1, L3) were the easiest. Though Figure 5 indicated that the difficulties of the items were basically appropriate for this sample as the cluster of items was located more or less opposite to the cluster of persons, there appeared to be a lack of items targeting the high-ability students located towards the top of the variable map. Furthermore, an overabundance of items was observed to cluster around the mean of item difficulty. As such, the ceiling of the scale could be raised through developing more difficult items to target the students with higher ability, and the number of items at medium difficulty should be reduced so that the SA scale could more accurately tap into the latent trait (Bond & Fox, 2015).
82 J. Fan
Figure 5. Item-person variable map (N = 244)
Notes. L – Listening; R – Reading; W – Writing; S – Speaking.
Rasch item analysis
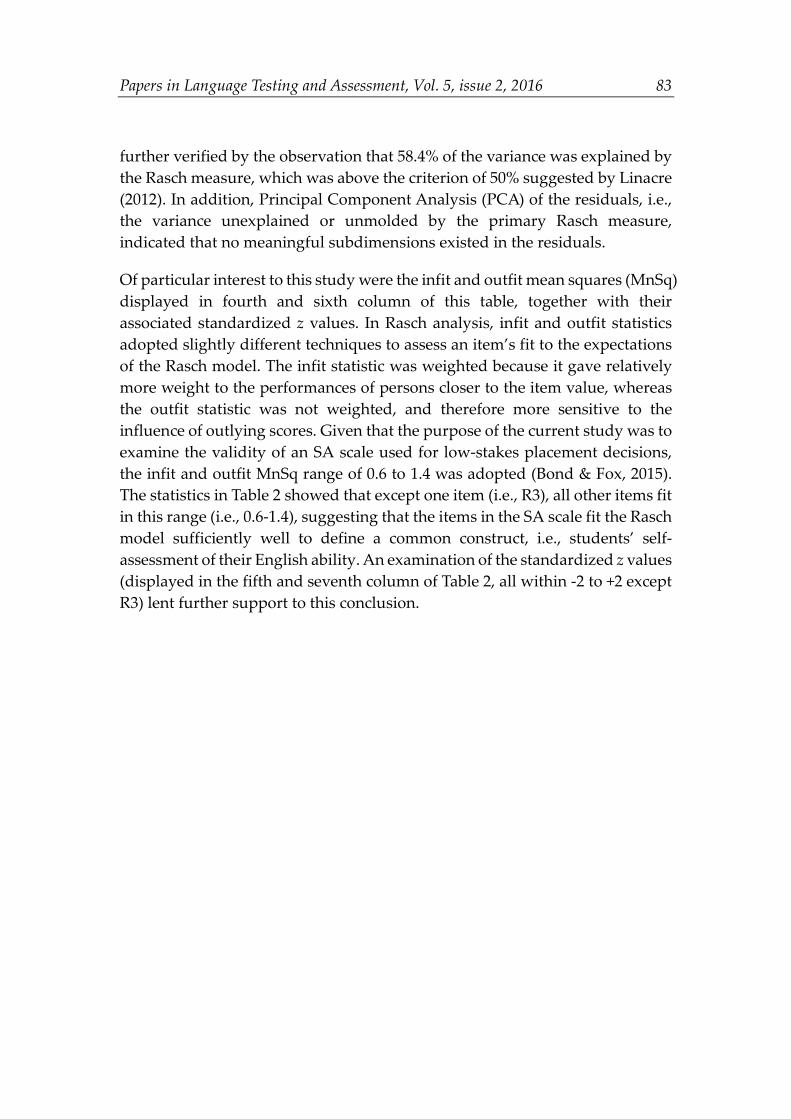
The results of Rasch item analysis are presented in Table 2. The second column of this table shows the item difficulties calibrated by the Rasch analysis. As indicated by the statistics in this column, the can-do statements were calibrated at varying difficulty levels, ranging from -2.14 to 1.14 logits. An examination of the point measure (PTMEA) correlations in this table indicated that all items exhibited moderate to strong correlations (0.67-0.78), suggesting that these items functioned in the same direction and were closely related to the latent trait. The high PTMEA correlations also lent support to the unidimensionality of the SA scale which is an important principle that should be observed in Rasch analysis (Linacre, 2012). The unidimensionality of the SA scale was
Papers in Language Testing and Assessment, Vol. 5, issue 2, 2016 83
further verified by the observation that 58.4% of the variance was explained by the Rasch measure, which was above the criterion of 50% suggested by Linacre (2012). In addition, Principal Component Analysis (PCA) of the residuals, i.e., the variance unexplained or unmolded by the primary Rasch measure, indicated that no meaningful subdimensions existed in the residuals.
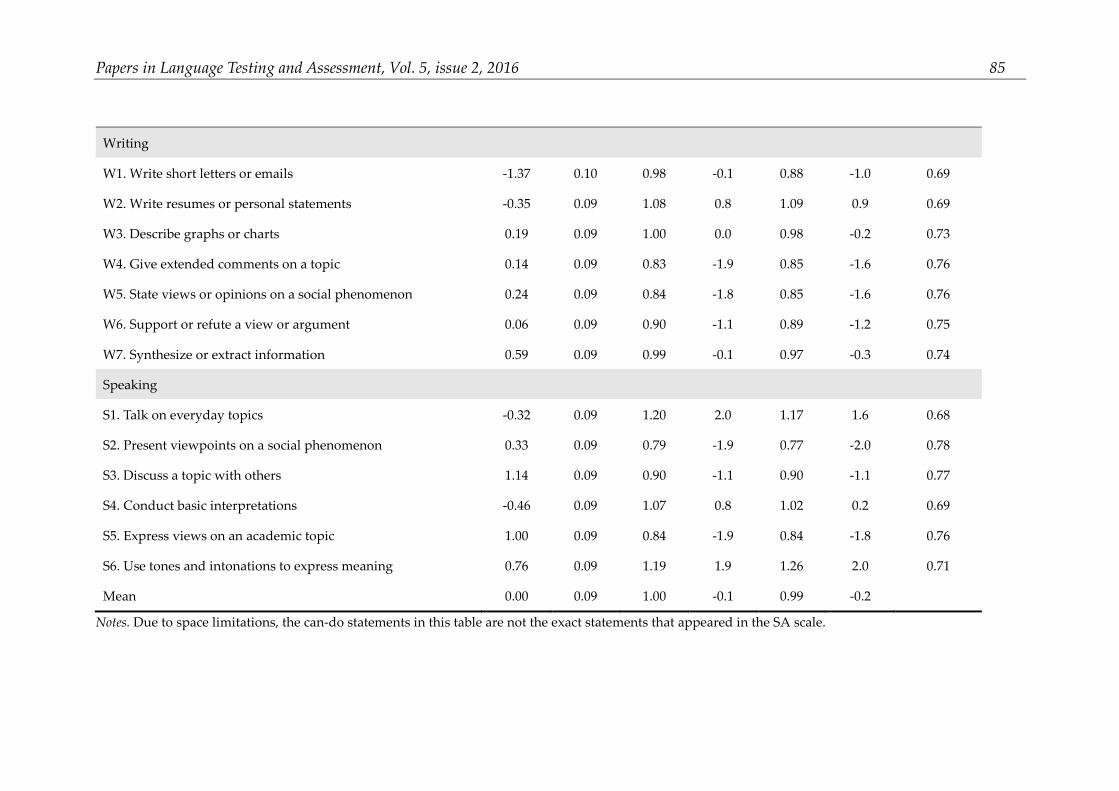
Of particular interest to this study were the infit and outfit mean squares (MnSq) displayed in fourth and sixth column of this table, together with their associated standardized z values. In Rasch analysis, infit and outfit statistics adopted slightly different techniques to assess an item’s fit to the expectations of the Rasch model. The infit statistic was weighted because it gave relatively more weight to the performances of persons closer to the item value, whereas the outfit statistic was not weighted, and therefore more sensitive to the influence of outlying scores. Given that the purpose of the current study was to examine the validity of an SA scale used for low-stakes placement decisions, the infit and outfit MnSq range of 0.6 to 1.4 was adopted (Bond & Fox, 2015). The statistics in Table 2 showed that except one item (i.e., R3), all other items fit in this range (i.e., 0.6-1.4), suggesting that the items in the SA scale fit the Rasch model sufficiently well to define a common construct, i.e., students’ self-assessment of their English ability. An examination of the standardized z values (displayed in the fifth and seventh column of Table 2, all within -2 to +2 except R3) lent further support to this conclusion.
84 J. Fan
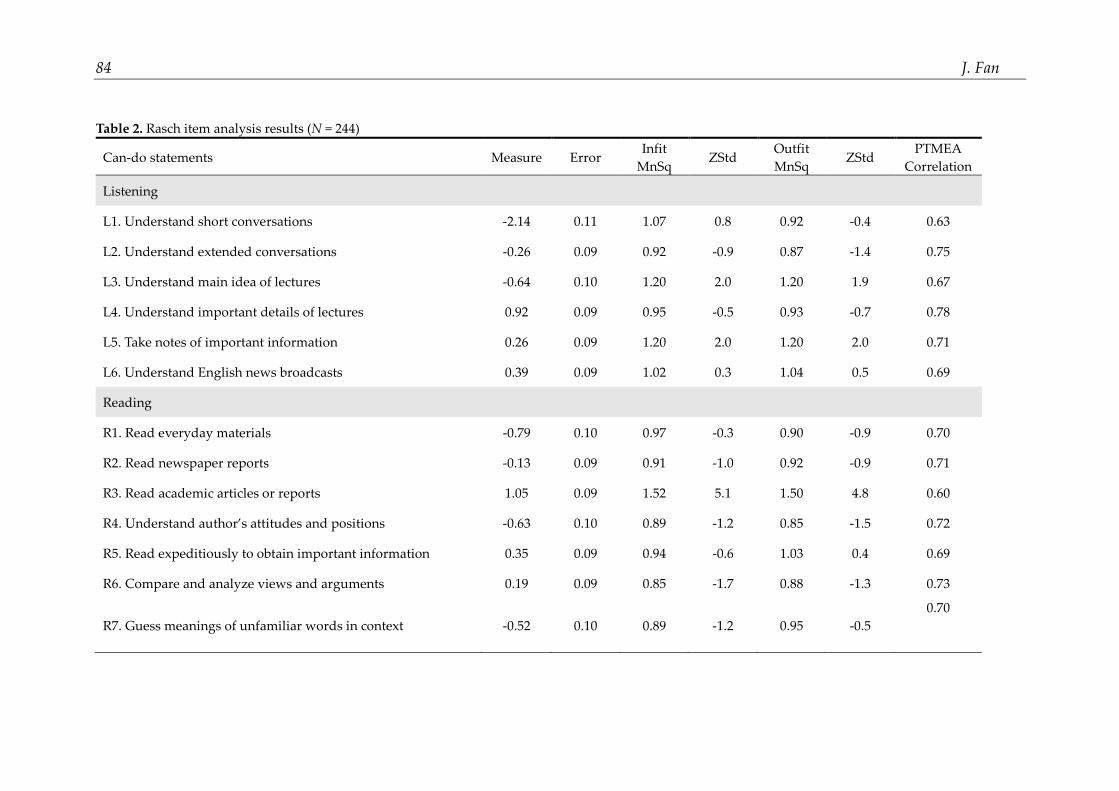
Table 2. Rasch item analysis results (N = 244)
Can-do statements Measure Error Infit
MnSq ZStd
Outfit MnSq
ZStd PTMEA
Correlation
Listening
L1. Understand short conversations -2.14 0.11 1.07 0.8 0.92 -0.4 0.63
L2. Understand extended conversations -0.26 0.09 0.92 -0.9 0.87 -1.4 0.75
L3. Understand main idea of lectures -0.64 0.10 1.20 2.0 1.20 1.9 0.67
L4. Understand important details of lectures 0.92 0.09 0.95 -0.5 0.93 -0.7 0.78
L5. Take notes of important information 0.26 0.09 1.20 2.0 1.20 2.0 0.71
L6. Understand English news broadcasts 0.39 0.09 1.02 0.3 1.04 0.5 0.69
Reading
R1. Read everyday materials -0.79 0.10 0.97 -0.3 0.90 -0.9 0.70
R2. Read newspaper reports -0.13 0.09 0.91 -1.0 0.92 -0.9 0.71
R3. Read academic articles or reports 1.05 0.09 1.52 5.1 1.50 4.8 0.60
R4. Understand author’s attitudes and positions -0.63 0.10 0.89 -1.2 0.85 -1.5 0.72
R5. Read expeditiously to obtain important information 0.35 0.09 0.94 -0.6 1.03 0.4 0.69
R6. Compare and analyze views and arguments 0.19 0.09 0.85 -1.7 0.88 -1.3 0.73
R7. Guess meanings of unfamiliar words in context -0.52 0.10 0.89 -1.2 0.95 -0.5 0.70
Papers in Language Testing and Assessment, Vol. 5, issue 2, 2016 85
Writing
W1. Write short letters or emails -1.37 0.10 0.98 -0.1 0.88 -1.0 0.69
W2. Write resumes or personal statements -0.35 0.09 1.08 0.8 1.09 0.9 0.69
W3. Describe graphs or charts 0.19 0.09 1.00 0.0 0.98 -0.2 0.73
W4. Give extended comments on a topic 0.14 0.09 0.83 -1.9 0.85 -1.6 0.76
W5. State views or opinions on a social phenomenon 0.24 0.09 0.84 -1.8 0.85 -1.6 0.76
W6. Support or refute a view or argument 0.06 0.09 0.90 -1.1 0.89 -1.2 0.75
W7. Synthesize or extract information 0.59 0.09 0.99 -0.1 0.97 -0.3 0.74
Speaking
S1. Talk on everyday topics -0.32 0.09 1.20 2.0 1.17 1.6 0.68
S2. Present viewpoints on a social phenomenon 0.33 0.09 0.79 -1.9 0.77 -2.0 0.78
S3. Discuss a topic with others 1.14 0.09 0.90 -1.1 0.90 -1.1 0.77
S4. Conduct basic interpretations -0.46 0.09 1.07 0.8 1.02 0.2 0.69
S5. Express views on an academic topic 1.00 0.09 0.84 -1.9 0.84 -1.8 0.76
S6. Use tones and intonations to express meaning 0.76 0.09 1.19 1.9 1.26 2.0 0.71
Mean 0.00 0.09 1.00 -0.1 0.99 -0.2
Notes. Due to space limitations, the can-do statements in this table are not the exact statements that appeared in the SA scale.
86 J. Fan
Utility of category structure
To examine whether the five-point category was appropriate for the SA scale, Linacre’s (1999) guidelines were applied to verify the functioning of each response category, which essentially included: (1) a minimum of 10 observations is needed for each category; (2) average category measures must increase monotonically with categories; (3) outfit MnSq statistics should be less than 2.00; (4) the category threshold should increase monotonically with categories; (5) category thresholds should be at least 1.4-5 logits apart; and (6) the shape of the probability curves should peak for each category.
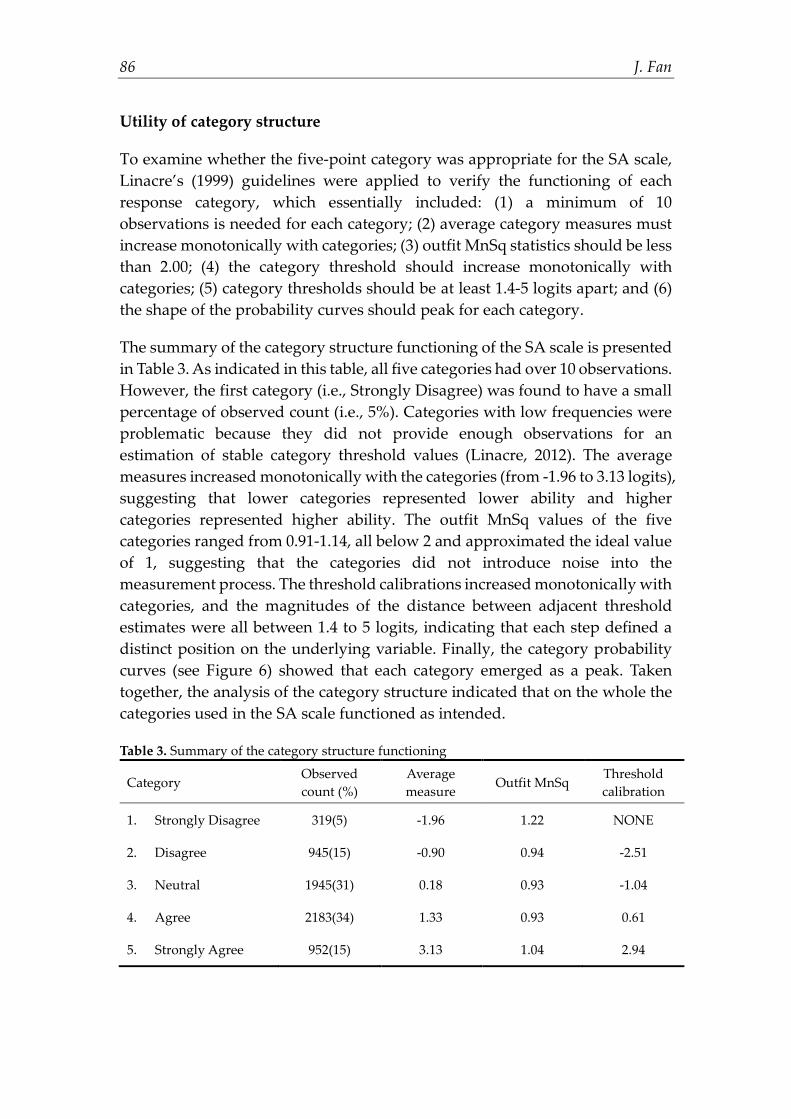
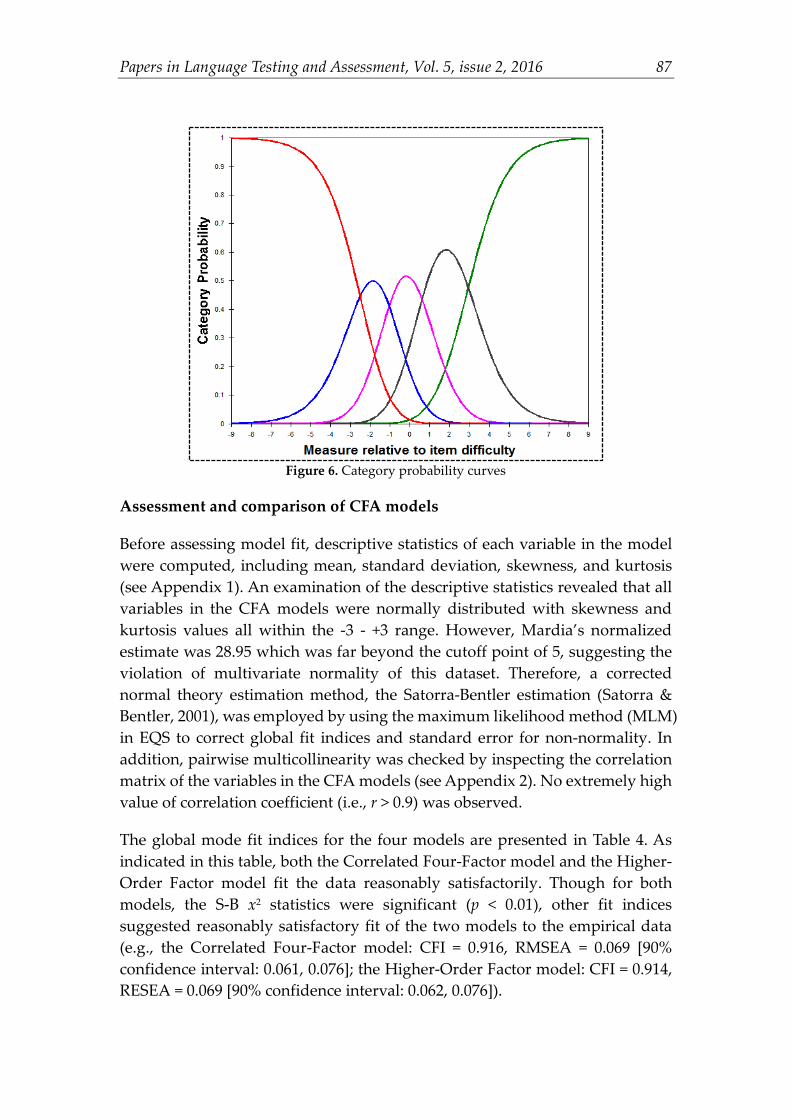
The summary of the category structure functioning of the SA scale is presented in Table 3. As indicated in this table, all five categories had over 10 observations. However, the first category (i.e., Strongly Disagree) was found to have a small percentage of observed count (i.e., 5%). Categories with low frequencies were problematic because they did not provide enough observations for an estimation of stable category threshold values (Linacre, 2012). The average measures increased monotonically with the categories (from -1.96 to 3.13 logits), suggesting that lower categories represented lower ability and higher categories represented higher ability. The outfit MnSq values of the five categories ranged from 0.91-1.14, all below 2 and approximated the ideal value of 1, suggesting that the categories did not introduce noise into the measurement process. The threshold calibrations increased monotonically with categories, and the magnitudes of the distance between adjacent threshold estimates were all between 1.4 to 5 logits, indicating that each step defined a distinct position on the underlying variable. Finally, the category probability curves (see Figure 6) showed that each category emerged as a peak. Taken together, the analysis of the category structure indicated that on the whole the categories used in the SA scale functioned as intended. Table 3. Summary of the category structure functioning
Category Observed count (%)
Average measure
Outfit MnSq Threshold calibration
1. Strongly Disagree 319(5) -1.96 1.22 NONE
2. Disagree 945(15) -0.90 0.94 -2.51
3. Neutral 1945(31) 0.18 0.93 -1.04
4. Agree 2183(34) 1.33 0.93 0.61
5. Strongly Agree 952(15) 3.13 1.04 2.94
Papers in Language Testing and Assessment, Vol. 5, issue 2, 2016 87
Figure 6. Category probability curves
Assessment and comparison of CFA models
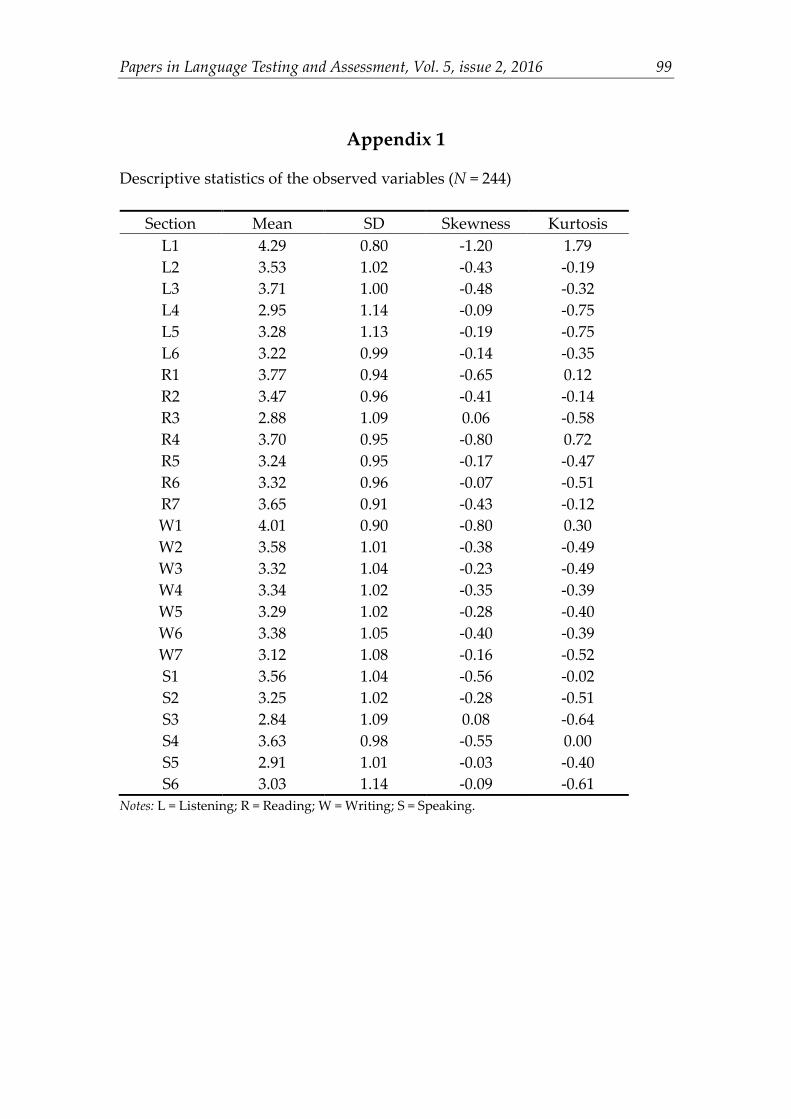
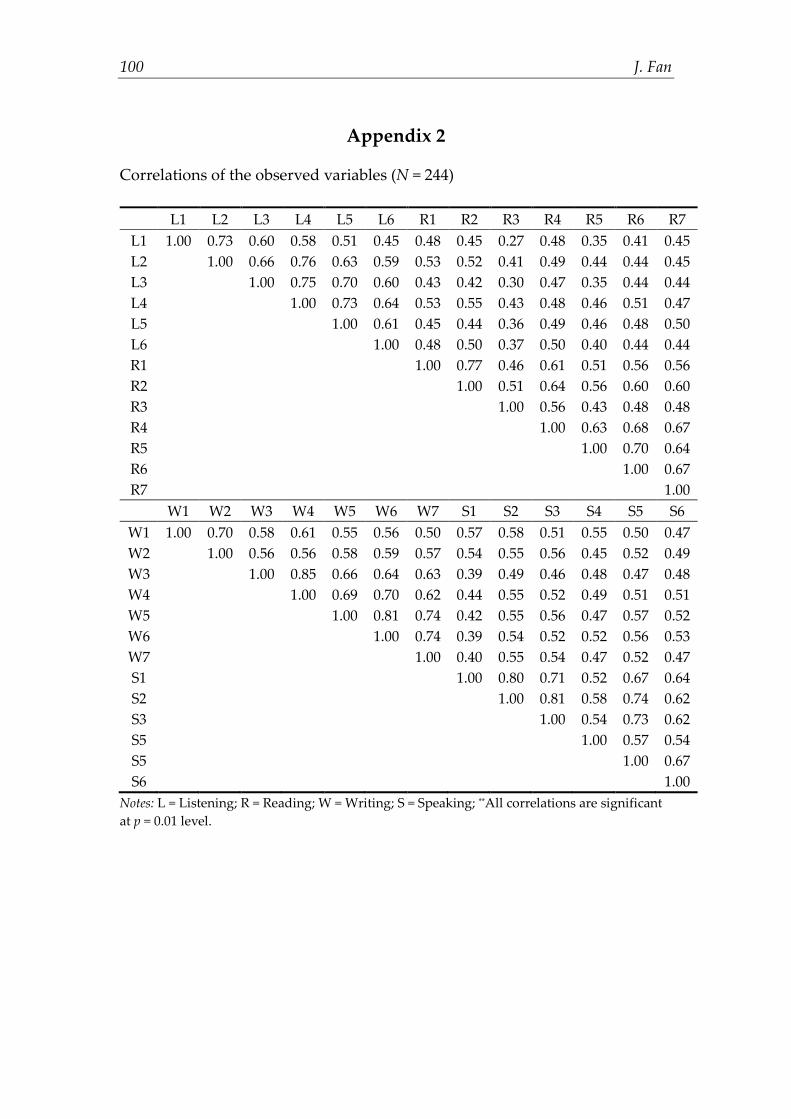
Before assessing model fit, descriptive statistics of each variable in the model were computed, including mean, standard deviation, skewness, and kurtosis (see Appendix 1). An examination of the descriptive statistics revealed that all variables in the CFA models were normally distributed with skewness and kurtosis values all within the -3 - +3 range. However, Mardia’s normalized estimate was 28.95 which was far beyond the cutoff point of 5, suggesting the violation of multivariate normality of this dataset. Therefore, a corrected normal theory estimation method, the Satorra-Bentler estimation (Satorra & Bentler, 2001), was employed by using the maximum likelihood method (MLM) in EQS to correct global fit indices and standard error for non-normality. In addition, pairwise multicollinearity was checked by inspecting the correlation matrix of the variables in the CFA models (see Appendix 2). No extremely high value of correlation coefficient (i.e., r > 0.9) was observed.
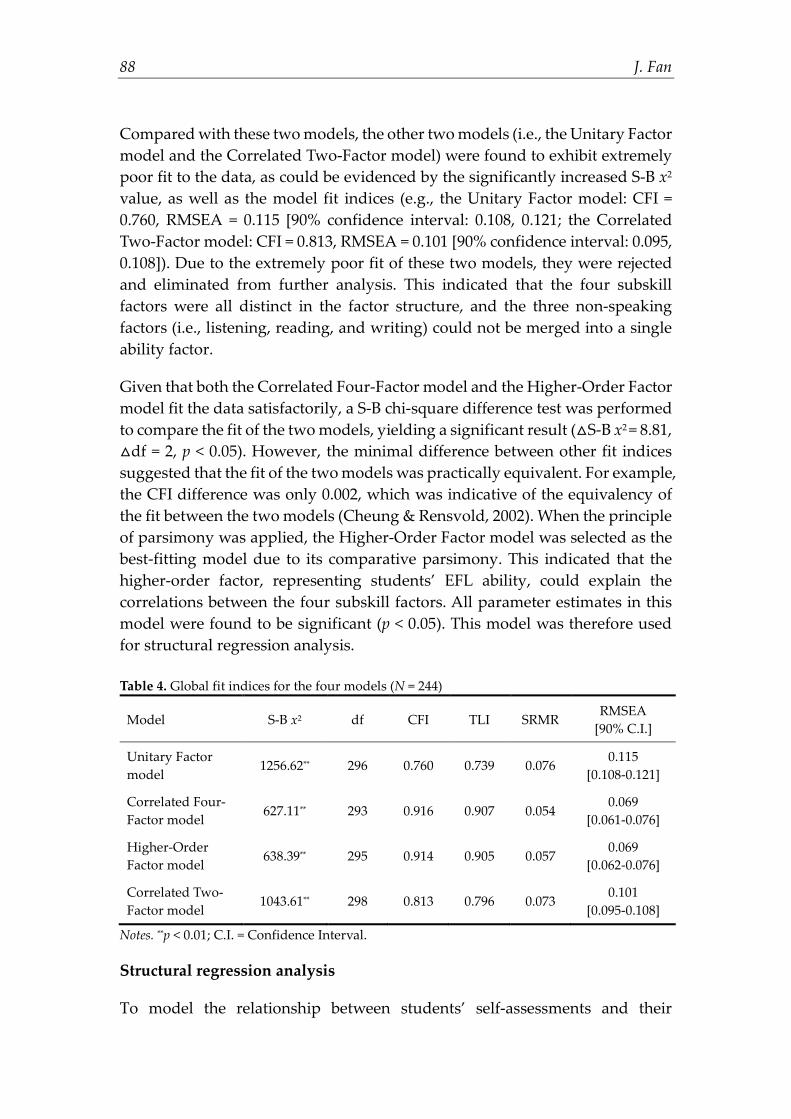
The global mode fit indices for the four models are presented in Table 4. As indicated in this table, both the Correlated Four-Factor model and the Higher-Order Factor model fit the data reasonably satisfactorily. Though for both models, the S-B x2 statistics were significant (p < 0.01), other fit indices suggested reasonably satisfactory fit of the two models to the empirical data (e.g., the Correlated Four-Factor model: CFI = 0.916, RMSEA = 0.069 [90% confidence interval: 0.061, 0.076]; the Higher-Order Factor model: CFI = 0.914, RESEA = 0.069 [90% confidence interval: 0.062, 0.076]).
88 J. Fan
Compared with these two models, the other two models (i.e., the Unitary Factor model and the Correlated Two-Factor model) were found to exhibit extremely poor fit to the data, as could be evidenced by the significantly increased S-B x2 value, as well as the model fit indices (e.g., the Unitary Factor model: CFI = 0.760, RMSEA = 0.115 [90% confidence interval: 0.108, 0.121; the Correlated Two-Factor model: CFI = 0.813, RMSEA = 0.101 [90% confidence interval: 0.095, 0.108]). Due to the extremely poor fit of these two models, they were rejected and eliminated from further analysis. This indicated that the four subskill factors were all distinct in the factor structure, and the three non-speaking factors (i.e., listening, reading, and writing) could not be merged into a single ability factor.
Given that both the Correlated Four-Factor model and the Higher-Order Factor model fit the data satisfactorily, a S-B chi-square difference test was performed to compare the fit of the two models, yielding a significant result (△S-B x2 = 8.81, △df = 2, p < 0.05). However, the minimal difference between other fit indices suggested that the fit of the two models was practically equivalent. For example, the CFI difference was only 0.002, which was indicative of the equivalency of the fit between the two models (Cheung & Rensvold, 2002). When the principle of parsimony was applied, the Higher-Order Factor model was selected as the best-fitting model due to its comparative parsimony. This indicated that the higher-order factor, representing students’ EFL ability, could explain the correlations between the four subskill factors. All parameter estimates in this model were found to be significant (p < 0.05). This model was therefore used for structural regression analysis. Table 4. Global fit indices for the four models (N = 244)
Model S-B x2 df CFI TLI SRMR RMSEA
[90% C.I.]
Unitary Factor model
1256.62** 296 0.760 0.739 0.076 0.115
[0.108-0.121]
Correlated Four-Factor model
627.11** 293 0.916 0.907 0.054 0.069
[0.061-0.076]
Higher-Order Factor model
638.39** 295 0.914 0.905 0.057 0.069
[0.062-0.076]
Correlated Two-Factor model
1043.61** 298 0.813 0.796 0.073 0.101
[0.095-0.108]
Notes. **p < 0.01; C.I. = Confidence Interval.
Structural regression analysis
To model the relationship between students’ self-assessments and their
Papers in Language Testing and Assessment, Vol. 5, issue 2, 2016 89
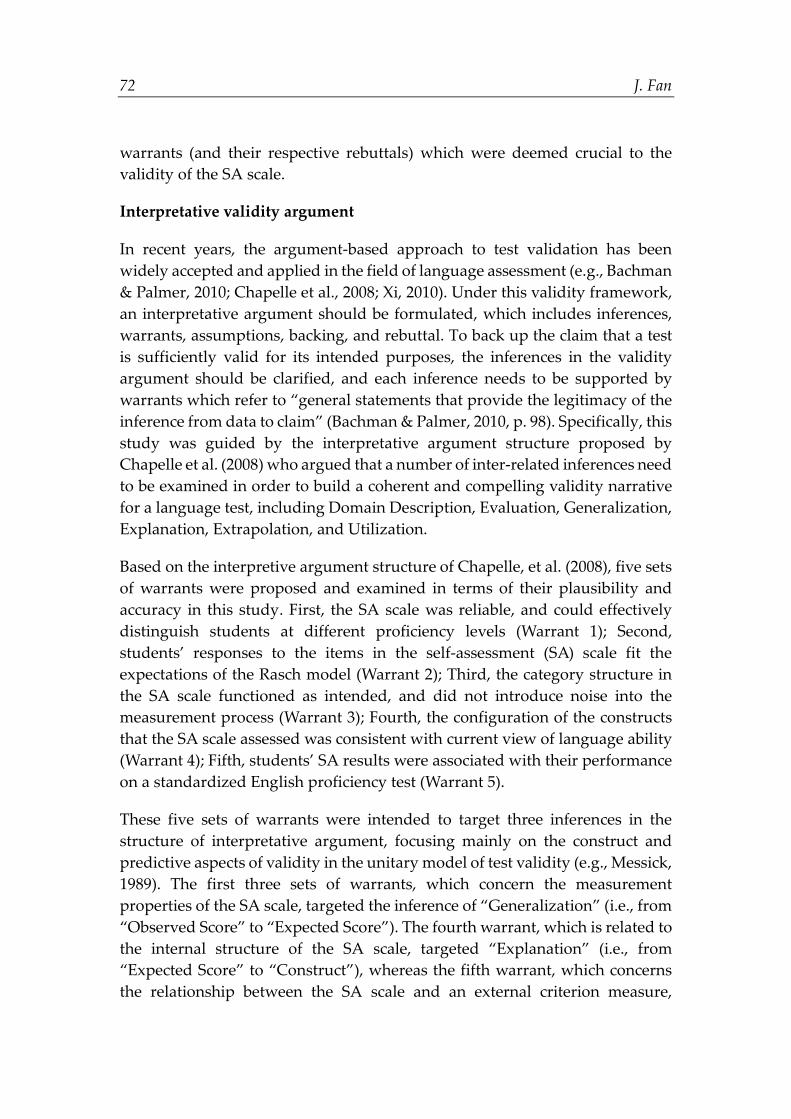
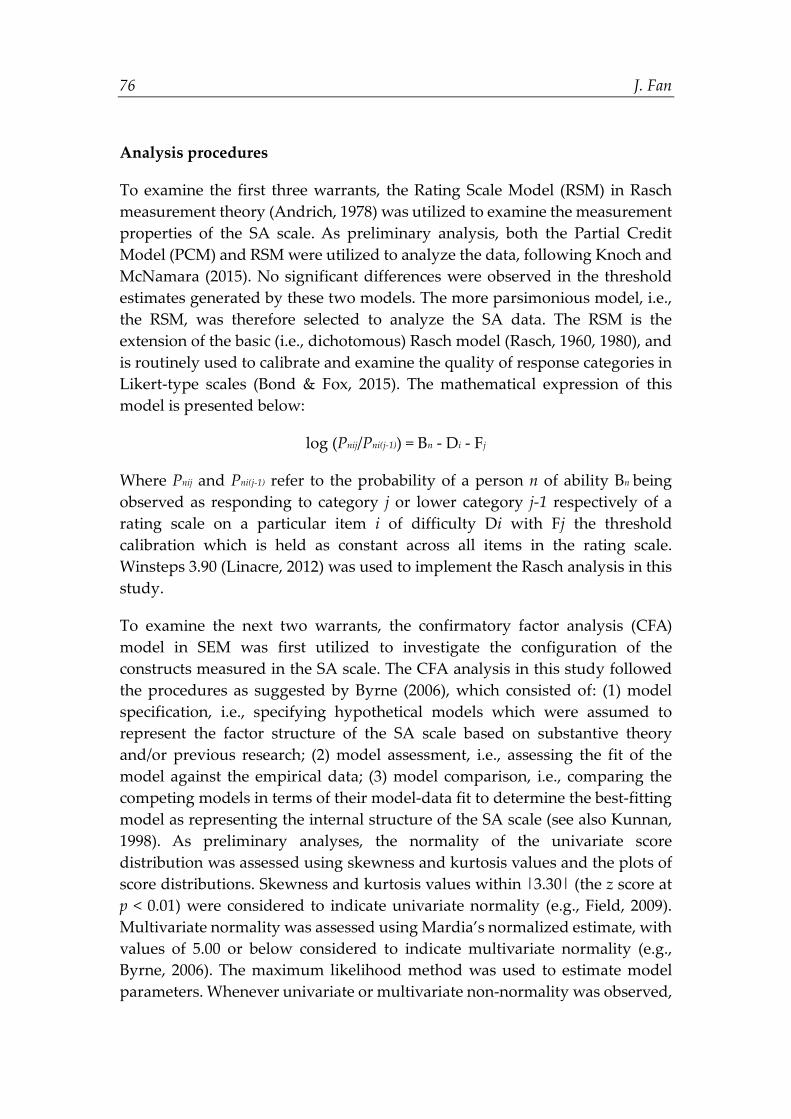
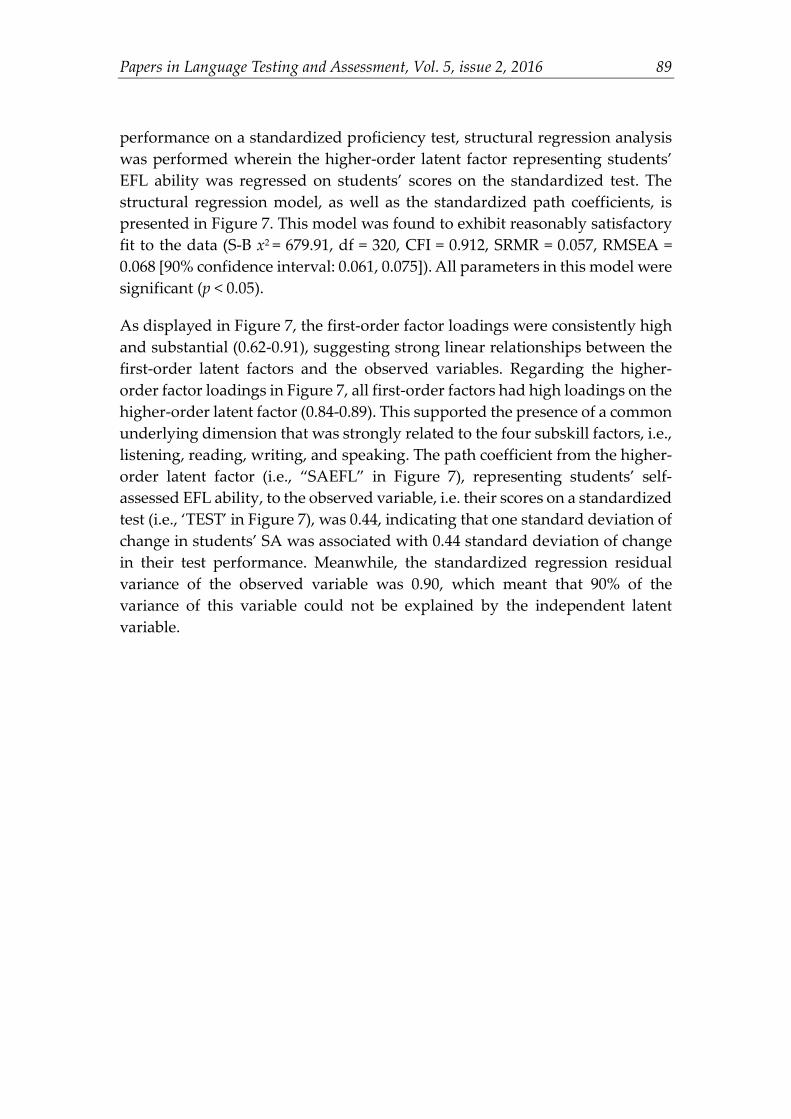
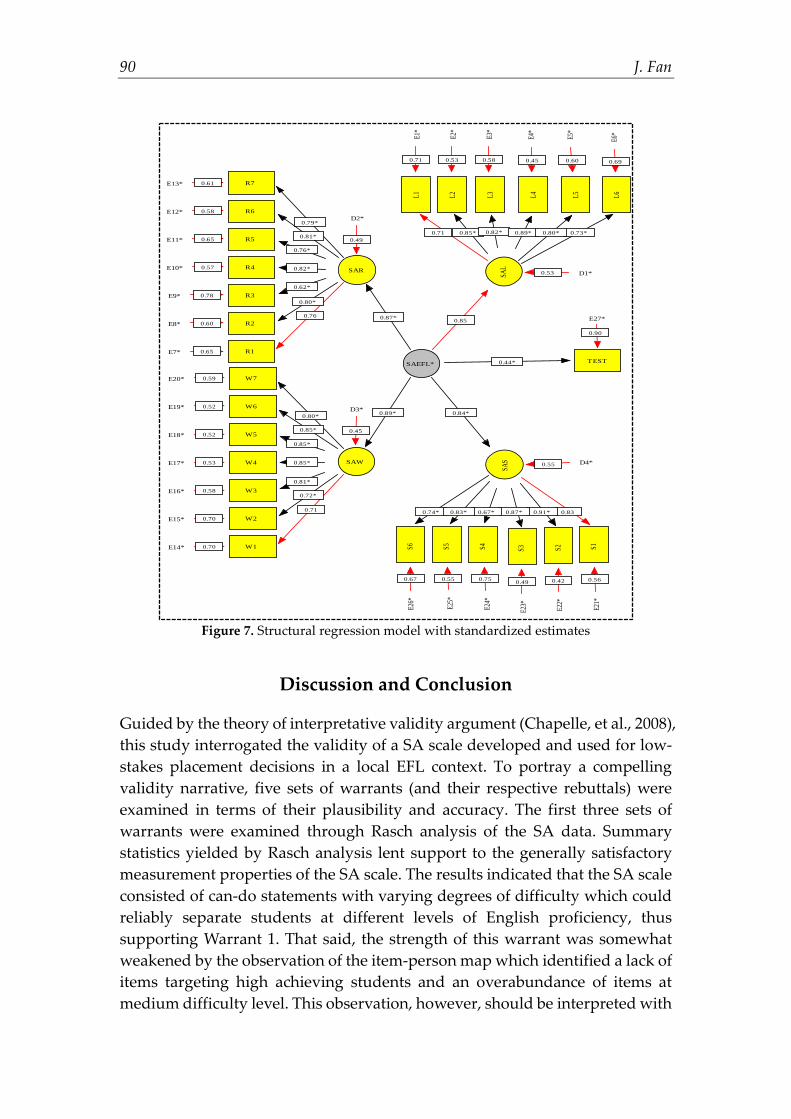
performance on a standardized proficiency test, structural regression analysis was performed wherein the higher-order latent factor representing students’ EFL ability was regressed on students’ scores on the standardized test. The structural regression model, as well as the standardized path coefficients, is presented in Figure 7. This model was found to exhibit reasonably satisfactory fit to the data (S-B x2 = 679.91, df = 320, CFI = 0.912, SRMR = 0.057, RMSEA = 0.068 [90% confidence interval: 0.061, 0.075]). All parameters in this model were significant (p < 0.05).
As displayed in Figure 7, the first-order factor loadings were consistently high and substantial (0.62-0.91), suggesting strong linear relationships between the first-order latent factors and the observed variables. Regarding the higher-order factor loadings in Figure 7, all first-order factors had high loadings on the higher-order latent factor (0.84-0.89). This supported the presence of a common underlying dimension that was strongly related to the four subskill factors, i.e., listening, reading, writing, and speaking. The path coefficient from the higher-order latent factor (i.e., “SAEFL” in Figure 7), representing students’ self-assessed EFL ability, to the observed variable, i.e. their scores on a standardized test (i.e., ‘TEST’ in Figure 7), was 0.44, indicating that one standard deviation of change in students’ SA was associated with 0.44 standard deviation of change in their test performance. Meanwhile, the standardized regression residual variance of the observed variable was 0.90, which meant that 90% of the variance of this variable could not be explained by the independent latent variable.
90 J. Fan
Figure 7. Structural regression model with standardized estimates
Discussion and Conclusion
Guided by the theory of interpretative validity argument (Chapelle, et al., 2008), this study interrogated the validity of a SA scale developed and used for low-stakes placement decisions in a local EFL context. To portray a compelling validity narrative, five sets of warrants (and their respective rebuttals) were examined in terms of their plausibility and accuracy. The first three sets of warrants were examined through Rasch analysis of the SA data. Summary statistics yielded by Rasch analysis lent support to the generally satisfactory measurement properties of the SA scale. The results indicated that the SA scale consisted of can-do statements with varying degrees of difficulty which could reliably separate students at different levels of English proficiency, thus supporting Warrant 1. That said, the strength of this warrant was somewhat weakened by the observation of the item-person map which identified a lack of items targeting high achieving students and an overabundance of items at medium difficulty level. This observation, however, should be interpreted with
E10*
E11*
E12*
E13*
0.79*
SAR
0.76
R10.65E7*
0.80*
R20.60E8*
0.62*R30.78E9*
0.82*R40.57
0.76*
R50.65 0.81*
R60.58
R70.61
0.80*
SAW
0.71
W10.70E14*
0.72*
W20.70E15*
0.81*
W30.58E16*
0.85*W40.53E17*
0.85*
W50.52E18*0.85*
W60.52E19*
W70.59E20*
TESTSAEFL*
0.74*SA
S0.83
S10.56
E21*
0.91*
S2
0.42
E22*
0.87*S3
0.49
E23*
0.67*
S4
0.75
E24*
0.83*
S5
0.55
E25*
S6
0.67
E26*
0.850.87*
D2*
0.49
0.89*D3*
0.45
0.84*
0.44*
E27*
0.90
0.73*
SAL
0.71
L1
0.71
E1*
0.85*
L2
0.53
E2*
0.82*
L3
0.58
E3*
0.89*
L4
0.45
E4*
0.80*
L5
0.60
E5*
L6
0.69
E6*
D1*0.53
D4*0.55
Papers in Language Testing and Assessment, Vol. 5, issue 2, 2016 91
caution. As noted earlier, the sample in this study had a higher level of English proficiency than the intended population of the SA scale. The item-person targeting problem might not emerge if the sample in this study was more stratified and representative.
Following summary statistics, Rasch item analysis revealed that among the 26 items in the SA scale, only one item (i.e., R3) failed fit the strict expectations of the Rasch model, thereby largely supporting Warrant 2. A plausible explanation for the underfit of this item could be associated with the experiential factor which has been found to impinge on the accuracy of students’ self-assessment of their language ability (e.g., Butler & Lee, 2006; Oscarson, 2013; Suzuki, 2015). This item asked students to self-assess their ability to read academic articles or reports. Given that the vast majority of the participants, as mentioned earlier, were first- or second-year undergraduates in an EFL context, the linguistic activity reflected in this item seems to be beyond the repertoire of their common language use. This assumption was further corroborated by the CFA analysis of the SA data which identified lower factor loading of this item on its respective latent factor, compared with other items in the scale (see Figure 7).
To further investigate the measurement properties of the SA scale, the utility of the category structure of the SA scale was analyzed. Results yielded by Rasch analysis generally supported the third set of warrant. A potential rebuttal to this warrant, however, lies in that the first category (i.e., Strongly Disagree) was somewhat underused by the participants. Arguably, this issue might be again related to the comparatively higher proficiency of the sample in this study. Similar to the item-person targeting problem discussed earlier, this issue might not surface had a more stratified and representative sample been employed.
The next two sets of warrants were examined through SEM analysis. To examine Warrant 4, four hypothetical models were assessed against the empirical data collected with the SA scale. Both the Unitary Factor model and the Correlated Two-Factor model were found to exhibit extremely poor fit to the data, suggesting that the four subskill factors are distinct in the factor structure. This was further confirmed by the reasonably satisfactory fit of the Correlated Four-Factor model, a finding which concurs with that of Enright et al. (2008). Meanwhile, the Higher-Order Factor model was found to demonstrate similar model fit. When the principle of parsimony was applied, this model was selected as the best-fitting one which represented the internal structure of the SA scale. This suggests that the SA scale tapped into the general EFL ability which was further divisible into the four subskills of listening, reading, writing, and speaking. The finding could find resonance in a profusion
92 J. Fan
of previous factor analytic studies into the internal structure of language tests (e.g., In’nami et al., 2016; Llosa, 2007; Sawaki et al., 2009). The tenability of the Higher-Order Factor model therefore contributes new empirical evidence to the multidimensional nature of L2 ability. In view of the current understanding of L2 ability (e.g., Hulstijn, 2015), the finding generally supports Warrant 4.
The fifth warrant was examined through structural regression analysis. Among the standardized parameter estimates displayed in Figure 7, of particular interest to this study is the regression path coefficient from the latent factor of students’ self-assessed EFL ability to their scores on the standardized English proficiency test (i.e., “TEST” in Figure 7). The magnitude of the path coefficient (0.44) indicated moderately strong association between the SA and the external criterion measure, hence lending support to the satisfactory predictive accuracy of the SA scale and Warrant 5. This finding is generally consistent with previous research into the relationship between self-assessments and standardized tests. For example, Enright et al. (2008) discovered moderate strong correlations between the prototype of TOEFL iBT and test takers’ self-assessments in the four subskills of listening, reading, writing, and speaking (r from 0.30 to 0.62). Powers and Powers (2015) also observed similar correlation coefficients between the measures in the TOEIC test and test takers’ self-assessments in the four subskills (r from 0.34 to 0.51). A potential rebuttal to Warrant 5, however, lies in the magnitude of the residual variance of the dependent variable, meaning that a large proportion of variance was unexplained by the independent variable. A plausible explanation is the characteristics of the sample employed in this study. As noted earlier, learner characteristics such as language proficiency and experiential factors are likely to impinge on the predictive accuracy of SA scales. Students’ lack of direct experience with some can-do statements in the SA scale, as well as the relatively higher English proficiency level, might adversely affect the predictive accuracy of the SA scale, which, in turn, caused the large residual variance of the dependent variable.
Given that multiple strands of evidence generated from Rasch analysis generally supported the first three sets of warrants, it is reasonable to conclude that the inference of “Generalization” (i.e., from “Observed Score” to “Expected Score”) is plausible and accurate. In a similar vein, CFA modeling of the SA data supported the inference of “Explanation” (i.e., from “Expected Score” to “Construct”), and structural regression analysis largely supported the inference of “Extrapolation” (i.e., from “Construct” to “Target Score”). The tenability of these three inferences in the interpretative validity argument, as this study suggests, paves the way for the construction of a coherent and compelling validity narrative for this SA scale. Furthermore, the results of this study seem to resonate with the view espoused by Ross (1988) about the
Papers in Language Testing and Assessment, Vol. 5, issue 2, 2016 93
potential of using a well-crafted and validated SA scale in language learning and assessment (see also Powers & Powers, 2015).
Implications, Limitations, and Future Research
The study described herein has two main implications for L2 learning and assessment. First, this study demonstrates how the argument-based model of test validation could be applied to investigating the validity of a SA scale. Though this model has been widely recognized in the field of language testing and applied to the validation of some language tests (e.g., Bachman & Palmer, 2010; Chapelle, et al., 2008), few attempts have been made to apply this model to the validation of SA scales. As indicated by this study, warrants can be proposed to target the different inferences in the validity argument structure, and then these warrants (and their respective rebuttals) can be examined through the collection and scrutiny of evidence, utilizing different data analytic methodologies. Second, despite the ongoing debates about the constituents of language ability as well as their relationships with each other, results yielded by CFA analysis in this study have lent further empirical support to the hierarchical structure of language ability. In addition, the moderately strong path coefficient from the SA latent factor to the standardized test indicates the satisfactory predicative accuracy of a well-crafted and validated SA scale, thereby supporting the views espoused by Ross (1998) and Powers and Powers (2015) on the use of SA in L2 teaching, learning, and assessment.
Some limitations of this study need to be addressed. First, due to the convenience random sampling approach that was adopted by this study, the participants in this study are not representative of the population in terms of some characteristics such as year of study and English proficiency level. Due to the lack of alignment, caution needs to be exercised when interpreting the relevant findings emerging from this study. The relatively higher proficiency level, for example, might have caused a lack of items targeting the high achieving students located towards the top of the variable map generated by Rasch analysis. Meanwhile, lack of direct experience with the linguistic activities in some items might have contributed to the item underfit in Rasch analysis and the lower factor loading in SEM analysis. To respond to these issues, a more rigorous sampling approach should be attempted in future research.
Second, though the argument-based approach was employed to guide this validation study, only five warrants targeting three inferences in the structure of interpretative validity argument were examined. Future investigations need
94 J. Fan
to examine other warrants related to the three inferences as well as other inferences. For example, given that the SA scale in this study was designed to make placement decisions, it is vital to examine the inference of “Utility” so as to uncover whether the SA scale correctly places students into the right level of instruction. Another important avenue of future research is to understand the impacts of this SA scale on English teaching and learning.
Finally, though the Rasch measurement theory and SEM were both utilized in this study, they could be used sequentially, in conjunction so as to better harness the potential of both methodologies. Bond and Fox (2015), for example, recommend using the Rasch model first to guide the construction and quality control of measurement scales, and then imputing interval-person Rasch measures and their standard errors (SEs) into SEM software for the calculation of the relationships between those variable measures. Future research, therefore, could attempt to utilize the Rasch model first to examine the measurement properties of the SA scale. Necessary revisions (i.e. content, category structure) could then be made based on Rasch analysis results. Subsequently, SEM could be employed to model the SA data, as well as the relationship between the SA scale and external criterion measures, using the results yielded by the Rasch analysis.
Acknowledgements
The preparation of this manuscript was supported by the National Planning Office for Philosophy and Social Sciences (NPOPSS) of the People’s Republic of China under the project title “The Development and Validation of Standards in Language Testing” (Grant Number: 13CYY032), and China Scholarship Council (CSC). An earlier draft of this manuscript was presented at the American Association for Applied Linguistics (AAAL) conference in Orlando, the United States in April, 2016. I would like to thank the two anonymous reviewers of PLTA for their insightful comments and feedback on the previous draft of this article. All remaining errors in this publication are my own.
References Andrich, D. (1978). Rating formulation for ordered response categories.
Psychometrika, 43(4), 561-573. Bachman, L. F., & Palmer, A. S. (1989). The construct validation of self-ratings
of communicative language ability. Language Testing, 6(1), 14-29. Bachman, L. F., & Palmer, A. S. (2010). Language assessment in practice: Developing
language assessments and justifying their use in the real world. Oxford; New
Papers in Language Testing and Assessment, Vol. 5, issue 2, 2016 95
York: Oxford University Press. Bailey, K. M. (1996). Working for washback: A review of the washback concept
in language testing. Language Testing, 13(3), 257-279. Bentler, P. M., & Wu, E. J. (2005). EQS 6.1 for Windows. Encino, CA: Multivariate
Software. Blanche, P., & Merino, B. J. (1989). Self-assessment of foreign-language skills:
Implications for teachers and researchers. Language Learning, 39(3), 313-338.
Bond, T., & Fox, C. M. (2015). Applying the Rasch model: Fundamental measurement in the human sciences. New York: Routledge, Taylor & Francis Group.
Brown, J. (2014). Mixed methods research for TESOL. Edinburgh: Edinburgh University Press.
Butler, Y. G., & Lee, J. (2006). On-task versus off-task self-assessments among Korean elementary school students studying English. The Modern Language Journal, 90(4), 506-518.
Byrne, B. M. (2006). Structural equation modeling with EQS: Basic concepts, applications, and programming (2nd ed.). Mahwah, New Jersey: Psychology Press.
Cavanagh, R. F., & Waugh, R. F. (Eds.). (2011). Applications of rasch measurement in learning environments research. Rotterdam; Boston: Sense Publishers.
Chapelle, C. A., Enright, M. K., & Jamieson, J. M. (2008). Building a validity argument for the Test of English as a Foreign Language. New York and London: Routledge, Taylor & Francis Group.
Cheung, G. W., & Rensvold, R. B. (2002). Evaluating goodness-of-fit indexes for testing measurement invariance. Structural equation modeling, 9(2), 233-255.
Enright, M. K., Bridgeman, B., Eignor, D., Lee, Y.-W., & Powers, D. E. (2008). Prototyping measures of listening, reading, speaking, and writing. In C. A. Chapelle, M. K. Enright, & J. M. Jamieson (Eds.), Building a validity argument for the Test of English as a Foreign Language (pp. 145-186). New York and London: Routledge, Taylor & Francis Group.
Fan, J., & Ji, P. (2014). Test candidates' attitudes and their test performance: The case of the Fudan English Test. University of Sydney Papers in TESOL, 9, 1-35.
Fan, J., Ji, P., & Song, X. (2014). Washback of university-based English language tests on students’ learning: A case study. The Asian Journal of Applied Linguistics, 1(2), 178-192.
Fan, J., Knoch, U., & Bi, Z. (2016). Factor structure and factorial invariance of language tests: A multi-sample CFA longitudinal study. Foreign
96 J. Fan
Language Testing and Teaching, 6(3), 16-27. Field, A. (2009). Discover statistics using SPSS. London: Sage. Gu, L. (2014). At the interface between language testing and second language
acquisition: Language ability and context of learning. Language Testing, 31(1), 111-133.
Hulstijn, J. H. (2015). Language proficiency in native and non-native speakers: Theory and research. Amsterdam/Philadephia: John Benjamins Publishing Company.
In’nami, Y., & Koizumi, R. (2011). Factor structure of the revise TOEFL test: A multi-sample analysis. Language Testing, 29(1), 131-152.
In’nami, Y., Koizumi, R., & Nakamura, K. (2016). Factor structure of the Test of English for Academic Purposes (TEAP®) test in relation to the TOEFL iBT® test. Language Testing in Asia, 6(1), 1-23.
Ji, P., Fan, J., & Fan, Y. (2016). College English course design and evaluation based on Language Curriculum Design Model: The case of English Translation Course. Foreign Languages in China, 13(1), 68-76.
Kane, M. T. (2002). Validating high-stakes testing programs. Educational Measurement: Issues and Practices, 21(1), 31-35.
Knoch, U., & McNamara, T. (2015). Rasch analysis. In L. Plonsky (Ed.), Advancing quantitative methods in second language research (pp. 275-304). New York Routledge.
Kunnan, A. J. (1995). Test taker characteristics and test performance: A structural modeling approach. Cambridge: Cambridge University Press.
Kunnan, A. J. (1998). An introduction to structural equation modeling for language assessment research. Language Testing, 15(3), 295-332.
LeBlanc, R., & Painchaud, G. (1985). Self-assessment as a second language placement instrument. TESOL Quarterly, 19(4), 673-687.
Linacre, M. (1999). Investigating rating scale category utility. Journal of outcome measurement, 3(2), 103-122.
Linacre, M. (2012). Winsteps Tutorial. Retrieved November, 7, 2014 http://www.winsteps.com/tutorials.htm.
Llosa, L. (2007). Validating a standards-based classroom assessment of English proficiency: A multitrait-multimethod approach. Language Testing, 24(4), 489-515.
Luoma, S., & Tarnanen, M. (2003). Creating a self-rating instrument for second language writing: From idea to implementation. Language Testing, 20(4), 440-465.
Messick, S. (1989). Validity. In R. L. Linn (Ed.), Educational measurement (Third
Papers in Language Testing and Assessment, Vol. 5, issue 2, 2016 97
ed., pp. 13-103). McMillan: American Council on Education. Messick, S. (1995). Standards of validity and the validity of standards in
performance asessment. Educational measurement: issues and practice, 14(4), 5-8.
Ockey, G. J., & Choi, I. (2015). Structural equation modeling reporting practices for language assessment. Language Assessment Quarterly, 12(3), 305-319.
Oller, J. W. (1976). Evidence for a general language proficiency factor: An expectancy grammar. Die neueren sprachen, 75(2), 165-174.
Orsmond, P., Merry, S., & Reiling, K. (1997). A study in self-assessment: tutor and students’ perceptions of performance criteria. Assessment & Evaluation in Higher Education, 22(4), 357-368.
Oscarson, M. (1989). Self-assessment of language proficiency: Rationale and applications. Language Testing, 6(1), 1-13.
Oscarson, M. (2013). Self-assessment in the classroom. In A. J. Kunnan (Ed.), The Companion to Language Assessment (Vol. 2, pp. 712-729). New York: Wiley-Blackwell.
Powers, D. E., & Powers, A. (2015). The incremental contribution of TOEIC® Listening, Reading, Speaking, and Writing tests to predicting performance on real-life English language tasks. Language Testing, 32(2), 151-167.
Powers, D. E., Roever, C., Huff, K. L., & Trapani, C. S. (2003). Validating LanguEdge™ courseware scores against faculty ratings and student self-assessments (2330-8516). Retrieved from http://www.ets.org/Media/Research/pdf/RR-03-11-Powers.pdf.
Rasch, G. (1960). Probalistic models for some intelligence and attainment tests. Copenhagen, Denmark: Paedagogiske Institut.
Rasch, G. (1980). Probalistic models for some intelligence and attainment tests. Chicago: The University of Chicago Press.
Ross, S. (1998). Self-assessment in second language testing: A meta-analysis and analysis of experiential factors. Language Testing, 15(1), 1-20.
Sackett, P. R., Borneman, M. J., & Connelly, B. S. (2008). High stakes testing in higher education and employment: appraising the evidence for validity and fairness. American Psychologist, 63(4), 215.
Satorra, A., & Bentler, P. M. (2001). A scaled difference chi-square test statistic for moment structure analysis. Psychometrika, 66(4), 507-514.
Sawaki, Y., Stricker, L. J., & Oranje, A. H. (2009). Factor structure of the TOEFL Internet-based test. Language Testing, 26(1), 5-30.
Shepard, L. A. (2000). The role of assessment in a learning culture. Educational
98 J. Fan
researcher, 4-14. Shohamy, E. (2001). Democratic assessment as an alternative. Language Testing,
18(4), 373-391. Suzuki, Y. (2015). Self-assessment of Japanese as a second language: The role of
experiences in the naturalistic acquisition. Language Testing, 32(1), 63-81. Taras, M. (2001). The use of tutor feedback and student self-assessment in
summative assessment tasks: Towards transparency for students and for tutors. Assessment & Evaluation in Higher Education, 26(6), 605-614.
Xi, X. (2010). How do we go about investigating test fairness? Language Testing, 20(10), 1-24.
Papers in Language Testing and Assessment, Vol. 5, issue 2, 2016 99
Appendix 1
Descriptive statistics of the observed variables (N = 244)
Section Mean SD Skewness Kurtosis L1 4.29 0.80 -1.20 1.79 L2 3.53 1.02 -0.43 -0.19 L3 3.71 1.00 -0.48 -0.32 L4 2.95 1.14 -0.09 -0.75 L5 3.28 1.13 -0.19 -0.75 L6 3.22 0.99 -0.14 -0.35 R1 3.77 0.94 -0.65 0.12 R2 3.47 0.96 -0.41 -0.14 R3 2.88 1.09 0.06 -0.58 R4 3.70 0.95 -0.80 0.72 R5 3.24 0.95 -0.17 -0.47 R6 3.32 0.96 -0.07 -0.51 R7 3.65 0.91 -0.43 -0.12 W1 4.01 0.90 -0.80 0.30 W2 3.58 1.01 -0.38 -0.49 W3 3.32 1.04 -0.23 -0.49 W4 3.34 1.02 -0.35 -0.39 W5 3.29 1.02 -0.28 -0.40 W6 3.38 1.05 -0.40 -0.39 W7 3.12 1.08 -0.16 -0.52 S1 3.56 1.04 -0.56 -0.02 S2 3.25 1.02 -0.28 -0.51 S3 2.84 1.09 0.08 -0.64 S4 3.63 0.98 -0.55 0.00 S5 2.91 1.01 -0.03 -0.40 S6 3.03 1.14 -0.09 -0.61
Notes: L = Listening; R = Reading; W = Writing; S = Speaking.
100 J. Fan
Appendix 2
Correlations of the observed variables (N = 244) L1 L2 L3 L4 L5 L6 R1 R2 R3 R4 R5 R6 R7
L1 1.00 0.73 0.60 0.58 0.51 0.45 0.48 0.45 0.27 0.48 0.35 0.41 0.45 L2 1.00 0.66 0.76 0.63 0.59 0.53 0.52 0.41 0.49 0.44 0.44 0.45 L3 1.00 0.75 0.70 0.60 0.43 0.42 0.30 0.47 0.35 0.44 0.44 L4 1.00 0.73 0.64 0.53 0.55 0.43 0.48 0.46 0.51 0.47 L5 1.00 0.61 0.45 0.44 0.36 0.49 0.46 0.48 0.50 L6 1.00 0.48 0.50 0.37 0.50 0.40 0.44 0.44 R1 1.00 0.77 0.46 0.61 0.51 0.56 0.56 R2 1.00 0.51 0.64 0.56 0.60 0.60 R3 1.00 0.56 0.43 0.48 0.48 R4 1.00 0.63 0.68 0.67 R5 1.00 0.70 0.64 R6 1.00 0.67 R7 1.00
W1 W2 W3 W4 W5 W6 W7 S1 S2 S3 S4 S5 S6 W1 1.00 0.70 0.58 0.61 0.55 0.56 0.50 0.57 0.58 0.51 0.55 0.50 0.47 W2 1.00 0.56 0.56 0.58 0.59 0.57 0.54 0.55 0.56 0.45 0.52 0.49 W3 1.00 0.85 0.66 0.64 0.63 0.39 0.49 0.46 0.48 0.47 0.48 W4 1.00 0.69 0.70 0.62 0.44 0.55 0.52 0.49 0.51 0.51 W5 1.00 0.81 0.74 0.42 0.55 0.56 0.47 0.57 0.52 W6 1.00 0.74 0.39 0.54 0.52 0.52 0.56 0.53 W7 1.00 0.40 0.55 0.54 0.47 0.52 0.47 S1 1.00 0.80 0.71 0.52 0.67 0.64 S2 1.00 0.81 0.58 0.74 0.62 S3 1.00 0.54 0.73 0.62 S5 1.00 0.57 0.54 S5 1.00 0.67 S6 1.00
Notes: L = Listening; R = Reading; W = Writing; S = Speaking; **All correlations are significant at p = 0.01 level.