Embed Size (px)
Citation preview

Copyright � 2010 by the Genetics Society of AmericaDOI: 10.1534/genetics.110.118661
The Confounding Effects of Population Structure, Genetic Diversityand the Sampling Scheme on the Detection and Quantification
of Population Size Changes
Lounes Chikhi,*,†,‡,1 Vitor C. Sousa,‡,§ Pierre Luisi,**,†† Benoit Goossens‡‡,§§
and Mark A. Beaumont***
*Centre National de la Recherche Scientifique, Laboratoire Evolution et Diversite Biologique (CNRS, EDB), Unite Mixte de Recherche (UMR),CNRS/Universite Paul Sabatier (UPS) 5174, F-31062 Toulouse, France, †Universite de Toulouse, UPS, EDB, F-31062 Toulouse, France,
‡Instituto Gulbenkian de Ciencia, P-2780-156 Oeiras, Portugal, §Centro de Biologia Ambiental, Faculdade de Ciencias da Universidadede Lisboa, Campo Grande, 1749-016 Lisboa, Portugal, **Institut National des Sciences Appliquees (INSA) de Toulouse, 31077
Toulouse Cedex 4, France, ††Institute of Evolutionary Biology, Universitat Pompeu Fabra, Consejo Superior de InvestigacionesCientıficas (UPF-CSIC), CEXS-UPF-PRBB, 08003 Barcelona, Spain, ‡‡School of Biosciences, Cardiff University, Cathays
Park, Cardiff CF10 3TL, United Kingdom, §§Sabah Wildlife Department, Wisma Muis, 88100 Kota Kinabalu,Malaysia and ***School of Biological Sciences, University of Reading, Reading RG6 6BX, United Kingdom
Manuscript received May 19, 2010Accepted for publication August 13, 2010
ABSTRACT
The idea that molecular data should contain information on the recent evolutionary history of popu-lations is rather old. However, much of the work carried out today owes to the work of the statisticians andtheoreticians who demonstrated that it was possible to detect departures from equilibrium conditions (e.g.,panmictic population/mutation–drift equilibrium) and interpret them in terms of deviations from neu-trality or stationarity. During the last 20 years the detection of population size changes has usually beencarried out under the assumption that samples were obtained from populations that can be approximatedby a Wright–Fisher model (i.e., assuming panmixia, demographic stationarity, etc.). However, natural pop-ulations are usually part of spatial networks and are interconnected through gene flow. Here we simulatedgenetic data at mutation and migration–drift equilibrium under an n-island and a stepping-stone model.The simulated populations were thus stationary and not subject to any population size change. We varied thelevel of gene flow between populations and the scaled mutation rate. We also used several sampling schemes.We then analyzed the simulated samples using the Bayesian method implemented in MSVAR, the MarkovChain Monte Carlo simulation program, to detect and quantify putative population size changes usingmicrosatellite data. Our results show that all three factors (genetic differentiation/gene flow, geneticdiversity, and the sampling scheme) play a role in generating false bottleneck signals. We also suggest an adhoc method to counter this effect. The confounding effect of population structure and of the sam-pling scheme has practical implications for many conservation studies. Indeed, if population structure iscreating ‘‘spurious’’ bottleneck signals, the interpretation of bottleneck signals from genetic data might beless straightforward than it would seem, and several studies may have overestimated or incorrectly detectedbottlenecks in endangered species.
THE idea that molecular data should contain infor-mation on the recent evolutionary history of pop-
ulations is not new and traces back to the beginningof the 20th century (e.g., Hirschfeld and Hirschfeld
1919). However, much of the work carried out todayowes to the seminal work of the statisticians and theo-reticians who demonstrated that it was possible to detectdepartures from equilibrium conditions (e.g., panmicticpopulation/mutation–drift equilibrium) and interpretthem in terms of deviations from neutrality (Watterson
1975; Tajima 1989b) or stationarity (Nei et al. 1975;
Tajima 1989a). Following this period most studies haveprimarily been concerned with the statistical propertiesof relatively simple models such as the Wright–Fisher(WF) or Moran models (Ewens 2004). During the last20 years the detection of population size changes (e.g.,Tajima 1989b; Slatkin and Hudson 1991; Rogers
and Harpending 1992; Cornuet and Luikart 1996;Beaumont 1999; Garza and Williamson 2001; Storz
and Beaumont 2002) has usually been carried out un-der the assumption that samples were obtained frompopulations that can be approximated by a WF model.However, natural populations are usually part of spatialnetworks and are interconnected through gene flow.They are hence rarely isolated as in the WF model. Tobe clear, structured models with several populations
Supporting information is available online at http://www.genetics.org/cgi/content/full/genetics.110.118661/DC1.
1Corresponding author: Instituto Gulbenkian de Ciencia, Rua da QuintaGrande, No. 6, P-2780-156 Oeiras, Portugal. E-mail: [email protected]
Genetics 186: 983–995 (November 2010)

or demes such as the n-island (Wright 1931) or thestepping-stone models (Kimura and Weiss 1964) havebeen proposed decades ago in population genetics.Also, a number of authors have proposed methods toinfer parameters under structured models (Wakeley
1999; Beerli and Felsenstein 2001; Chikhi et al. 2001;Hey and Nielsen 2004; Excoffier et al. 2005; Beerli
2006; Becquet and Przeworski 2007; Bray et al.2009). However, the number of populations involved isgenerally limited compared to the n-island and step-ping-stone models (but see Beerli and Felsenstein
2001; De Iorio et al. 2005). Models accounting for bothpopulation structure and population size changes wouldprobably be more realistic for most species but the onlyinferential method currently available (Hey 2005) re-mains little tested under cases of structured popula-tions (but see Strasburg and Rieseberg 2010 for avery recent study). While it would be important to de-velop and test flexible approaches allowing the de-tection and quantification of population size changesin structured populations (Hey 2005) it is also impor-tant to quantify the robustness of existing methods topopulation structure. In particular it would be impor-tant to determine the extent to which methods that arewidely used but ignore structure can correctly detect orquantify bottlenecks or expansions. This has bothpractical and theoretical reasons.
In a seminal work, Wakeley (1999) showed that whenpopulations are structured according to an n-islandmodel, a false signal of population bottleneck can beobserved within single demes. The reason behind thisconfounding effect can be understood in terms ofcoalescent trees. The genealogy of a sample taken fromone deme in an n-island model will have short branchesfor the lineages that coalesce within the sampled deme.However, for lineages that arrived in the sampled demethrough gene flow, we expect to observe much longerbranches, since coalescent events will then be depen-dent on the effective size of the whole set of demes(Wakeley 1999). Thus, a typical gene tree is expected tohave a combination of sets of short branches connectedto each other by long branches. This kind of genealogyis exactly what is expected in a bottlenecked population(Hudson 1990; Beaumont 2003a; Hein et al. 2005).How strong this effect will be should depend on therelative rate of gene flow (m) and within populationcoalescence events (1/N, where N is the effective size ofa deme). When gene flow is high over wide geographicalareas, the whole set of populations sampled may behaveas a single large population and it may be reasonable tokeep assuming a WF model. Similarly, when gene flow isvery limited, as might be the case for some isolatedpopulations, most alleles will likely coalesce within thesampled population and the WF model may apply again.Thus, in these extreme cases, it seems reasonable toapply the methods developed to detect and quantifypopulation size changes (Cornuet and Luikart 1996;
Beaumont 1999; Garza and Williamson 2001; Storz
and Beaumont 2002). Intermediate situations are likelyto be present in real-life cases but this confoundingeffect has been little studied.
Another issue that has little been explored is that ofthe sampling scheme. In most studies, whether they arebased on simulated or real data, it is usually assumedthat samples are taken from single demes. However, withreal species the delimitation between populations israrely clear. Samples obtained in nature may thus comefrom more than one population. This is particularlycrucial in endangered species, where small samplestaken from different demes (for instance forest frag-ments) may need to be pooled for some analyses. Thismay also be problematic in species where social groupsmay create another level of substructure that would alsoviolate the random mating assumptions. To understandthe potential effect of the sampling strategy on thedetection of bottlenecks, we can take the extreme andhypothetical case where each sampled individual orgene comes from a different deme. It is expected thatcoalescence times will follow a standard coalescent withan effective population size equal to that of the meta-population (Wakeley 1999). While this extreme case isunlikely to happen by chance, it suggests that the sam-pling scheme might counter, to some extent, the bot-tleneck effect due to population structure. This mayseem counterintuitive but has recently been confirmedby Stadler et al. (2009) who found that when one pop-ulation is sampled in a stepping-stone or n-island model,positive Tajima D values (corresponding to bottlenecksin a WF model) are typically observed and that theTajima D values tend toward zero (stationary populationin a WF model) when samples from different demes arepooled together and gene flow is high.
The confounding effects of population structure andof the sampling scheme have practical implications formany conservation studies. Indeed, in recent years therehas been an increasing use of genetic data to reconstructthe demographic history of endangered species, often todetect, quantify, and/or date bottlenecks (Garza andWilliamson 2001; Goossens et al. 2006; Leblois et al.2006; Okello et al. 2008; Olivieri et al. 2008; Craul
et al. 2009). Endangered species are often thoughtor known to have undergone bottlenecks due to hunt-ing, the introduction of alien species, or habitat loss(Goossens et al. 2006; Olivieri et al. 2008; Craul et al.2009; Quemere et al. 2009; Sousa et al. 2009b). However,if population structure is creating spurious bottlenecksignals, the interpretation of bottleneck signals fromgenetic data might be less straightforward than it wouldseem, and several studies may have overestimated or in-correctly detected bottlenecks.
In this study we analyze the effect of the samplingscheme, the amount of gene flow, and genetic diversityon the generation of signals of population size changeusing the method of Beaumont (1999). We used this
984 L. Chikhi et al.
method because it is a full-likelihood Bayesian methodthat is expected to use the genetic data efficiently, hencedetecting bottlenecks when summary statistics-basedmethods are potentially unable to detect significantdepartures (e.g., Olivieri et al. 2008; Sousa et al. 2008).To do this, we simulated genetic data at mutation andmigration–drift equilibrium under an n-island and astepping-stone model. The simulated populations werethus stationary and not subject to any population sizechange. We varied the level of gene flow betweenpopulations and the scaled mutation rate. We also usedseveral sampling schemes. We then analyzed the simu-lated samples using the Bayesian method implementedin the MSVAR program (Beaumont 1999) to detect andquantify putative population size changes. Our resultsshow that all three factors (gene flow/genetic differen-tiation, genetic diversity, and the sampling scheme) playa role in generating false bottleneck signals. We alsosuggest an ad hoc method to counter this effect.
MATERIALS AND METHODS
Simulated data sets: n-island model: Data were simulatedusing the coalescent algorithm of Beaumont and Nichols
(1996) for an n-island equilibrium model with n¼ 100 islands.All islands were assumed to be of size N individuals and toexchange migrants at a constant rate m. The model is fullycharacterized by the scaled mutation rate (u¼ 4dNm), where mis the per locus mutation rate, d is the number of demes orislands, and by the scaled migration rate (M¼ 4Nm). Since wewere interested in microsatellite rather than sequence data,mutations were assumed to occur under the stepwise mutationmodel (SMM), at the same rate for all loci. The SMM was alsoused as it is the mutation model assumed by the method ofBeaumont (1999). We investigated the effect of varying u andM on the detection of false bottlenecks by simulating data setswith u ¼ (1, 10) and M ¼ (99, 19, 9, 3). The values of M werechosen so as to correspond to the FST values expected atequilibrium for an infinite island model, namely FST ¼ (0.01,0.05, 0.1, 0.25), respectively, according to the expression FST¼1/(1 1 M). These values typically encompass the valuesobserved in most real data sets published in conservationgenetics, e.g., FST ¼ 0.00–0.14 in the Mediterranean toad(Goncxalves et al. 2009), FST ¼ 0.00–0.20 in mouse lemurs(Olivieri et al. 2008), and FST ¼ 0.01–0.12 in the Borneanorangutan (Goossens et al. 2005). Note that these expectedFST values are theoretically valid only under the infinite allelemodel (IAM) and infinite-island model (or n-island when n islarge). Due to homoplasy, lower FST values are expected underthe SMM. As a simple test we thus performed 1000 simulationsunder the SMM to determine the extent to which the FST
distributions and averages obtained in the simulated datawould be different from the theoretical values above. Ourresults (supporting information, Figure S1) suggest that theobserved means and expected values are very close to eachother under the n-island model whether we assume the SMMor the IAM (Figure S1, a and b). For the stepping-stone modelthe FST distribution between neighboring demes exhibited
averages slightly smaller than expected under the IAM and n-
island model (Figure S1, c and d). For simplicity, we will keep
referring to the equilibrium FST values given above throughout
the manuscript but the reader should be aware of this. We also
note that the FST values given should not be taken at face valueas measures of genetic differentiation (e.g., Chikhi et al. 1997;Jost 2008). Throughout the manuscript we provide both Mand the corresponding equilibrium FST values for comparisonwith real-case studies for which the level of gene flow isunknown but FST values are provided.
We also investigated the effect of the sampling scheme byconsidering three different sampling strategies. In all cases weconsidered that 50 diploid individuals were sampled in total(100 gene copies). In the first scheme, the genetic data weresampled from 1 deme (this is the usual assumption). In thesecond case we pooled the samples obtained in 2 differentdemes (25 individuals in each). In the third case we obtainedsamples from 50 demes, i.e., one individual per deme. Al-together there were 24 different combinations of samplingscheme and parameter values for u and M (u¼ (1, 10) and M¼(3, 9, 19, 99)). For each of them 10 independent data sets(replicates) were simulated with 5 loci. This number of loci waschosen due to the fact that MSVAR is highly computational(several days were typically necessary for one replicate/run).To determine whether the number of loci had a major effecton our results, we also repeated some of these analyses with 10loci as many published microsatellite data typically havebetween 8 and 12 loci. The samples were taken from 1 demeand the parameter values used for these simulations were u ¼(1, 10) and M ¼ (99, 19, 9) (i.e., FST ¼ (0.01, 0.05, 0.10)).
Stepping-stone model: To determine whether our results wererobust to the population structure model we repeated some ofthe simulations assuming a stepping-stone model. Here thesimulations were performed assuming 5 loci, u ¼ (1, 10) andtwo values of M ¼ (19, 3) (i.e., FST ¼ (0.05, 0.25)). All pa-rameter combinations were repeated 10 times, hence corre-sponding to 40 additional data sets. Thus, altogether 340independent data sets (corresponding to 34 combinations ofparameter values, model, or sampling scheme) were analyzedusing MSVAR under the n-island (300) and stepping-stone(40) model with 5 or 10 loci. This is to our knowledge one ofthe largest tests performed on a full-likelihood method andthe first to test the robustness with a reasonably large numberof simulations (see Table S1).
Analysis with MSVAR: MSVAR implements a full-likelihoodBayesian inferential method developed by Beaumont (1999).The model assumes that a single stable population of size N1
started to decrease (or increase) ta generations ago to thecurrent population size, N0. The change in population size canbe either linear or exponential, and mutations are assumed tooccur under a SMM model, with rate u0¼ 4N0m, where m is thelocus mutation rate. Using a coalescent-based MCMC ap-proach, the method estimates the posterior probability dis-tributions of (i) the magnitude of population size change r ¼N0/N1, (ii) the time since the population started changing sizescaled by N0, tf¼ ta/N0, and (iii) the scaled mutation rate u0¼4N0m. The method uses the full allelic distribution taking intoaccount the relative size of microsatellite alleles. It is thusexpected to be more efficient at detecting population sizechanges than methods based on summary statistics. The sim-ulated data sets were given as input to MSVAR, assuming anexponential model for the population size change. Wide uni-form prior distributions were chosen, between �5 and 5 on alog10 scale for log10(r), log10(u), and log10(tf), as in Olivieri et al.(2008). For each data set one long run of 5 3 109 steps wasperformed, with a thinning of 50,000 steps. Preliminary testsshowed that these runs were long enough to reach equilib-rium. This was also confirmed by our experience with real datasets (e.g., Goossens et al. 2006; Olivieri et al. 2008; Sousa et al.2008). The first 10% of the chain was discarded (as burn-in)and the remaining was assumed to be a sample from the jointposterior distribution. We used the R language (R Development
Population Structure and Bottleneck Signals 985

Core Team 2008) to analyze the outputs of MSVAR, using thelocfit (Loader 2007), coda (Plummer et al. 2009), mcmc (Geyer
2009), and MCMCpack (Martin et al. 2009) packages. Theconvergence of the chains was tested with the Geweke (1992)statistic. Note, however, that we were not interested in in-ferring precisely the change in population size. Indeed, wewere interested in determining whether there was a clear biastoward either bottlenecks or expansions, not whether thequantiles were precisely estimated or whether the mean wasknown with high precision. This is why convergence was not asserious an issue for us as it would be with real data sets forwhich several independent runs would need to be performedfor each data set (e.g., Okello et al. 2008; Olivieri et al. 2008;Sousa et al. 2009a). Even in the very few cases where con-vergence had not been reached (based on Geweke’s statistic)visual inspection of the chains suggested that the chain wasclose to equilibrium and the signal for either populationincrease or decrease was clear.
Since we were interested in the detection of population sizechanges we focused on the marginal posterior distribution oflog10(r) ¼ log10(N0/N1). Negative values correspond to apopulation decrease (N0 , N1), whereas positive values pointto a population expansion (N0 . N1). Values close to zerosuggest a stable population (N0 ¼ N1). Flat posterior distribu-tions suggest either a lack of information or no strong signalfor a change in population size. For each data set we alsorecorded the mean and variance of the posterior distributionand plotted the latter against the former.
Data from two Iberian minnow species and Borneanorangutan populations: To determine whether we couldidentify true from spurious bottleneck signatures in real datasets, we compared the results obtained from two Iberianminnows and orangutan populations using MSVAR (Goossens
et al. 2006; Sousa et al. 2008, 2009b) with the simulation results.The Iberian minnow data sets consisted of six microsatellite locityped at 212 and 192 individuals from Iberochondrostoma lusita-nicum and I. almacai, respectively. For each species, six pop-ulations were sampled with sample sizes ranging from 21 to 43in I. lusitanicum and from 12 to 50 in I. almacai, although most ofthe populations had �40 individuals. Note that one locus wasmonomorphic in I. lusitanicum. Thus, these real data set sam-ples were similar to the simulations, with 50 diploid individualstyped at five loci. The magnitude of the population size changes(mean log10(N0/N1) estimated with MSVAR under the sameprior as the simulations), ranged from �3.14 to 0.18 inI. lusitanicum and from �3.34 to �1.92 in I. almacai. Thesespecies were characterized by F estimates, which are analogousto average FST, obtained with the method of Vitalis andCouvet (2001b) implemented in the program ESTIM (Vitalis
and Couvet 2001a). The F estimates ranged from�0.03 to 0.42in I. lusitanicum and from�0.14 to 0.44 in I. almacai. This rangeis the same as the average pairwise FST for each populationagainst all the others and is thus a reasonable measure of driftwithin each population. The results of the two fish species werecompared with the simulations by dividing the data sets into twogroups to test for the effect of the population differentiation:(i) FST , 0.1 and (ii) FST $ 0.1. The low expected heterozygosityHe found in these species (He , 0.45) and the MSVAR estimatesfor u0 ¼ 4N0m suggested that the markers are characterizedby low u. Thus, the results were compared with the simulationswith u ¼ 1. We computed the expected heterozygosity for thesimulated data sets and found indeed He values mostly between0.08 and 0.68 with an average of 0.47.
The orangutan data were obtained from Goossens et al.(2006) and consisted of 200 individuals sampled in nine forestfragments (S1–S9) located on the two sides of the KinabatanganRiver and genotyped at 14 microsatellites. The FST valuesvaried between 0.01 and 0.12 but the highest values were
observed between samples obtained from different sides of theKinabatangan, shown to be a barrier to gene flow (Goossens
et al. 2005). When samples were taken from the same riverside the FST values varied between 0.01 and 0.03 and between0.01 and 0.06, with averages slightly above 0.02. In a studyaiming at determining whether orangutans had been subjectto population size changes (Goossens et al. 2006), two sampleswere analyzed, namely S1 and S2, each from a different side ofthe river, due to the computational cost of the method. For acomparison between the orangutan data with the simulateddata sets we randomly sampled two subdata sets with 10 locifrom the original orangutan 14 loci data from S1 and S2and analyzed them with MSVAR. The results were comparedwith the simulation results obtained under the n-island andstepping-stone models, with M ¼ (99, 19) corresponding tothe following expected FST ¼ (0.01, 0.05) and assumingu ¼ 1. Indeed, the estimated value for u for single demes was�0.007, suggesting a global value of u¼ 0.7, assuming d¼ 100demes.
RESULTS
MCMC convergence: The Geweke (1992) testsuggested that most of the MCMC chains reachedequilibrium (337 out of 340, Figure S2). Exceptions cor-responded to data sets with 10 loci and u¼ 10, where theGeweke statistic values suggest that convergence was notreached even though the chains were visually notdifferent from other chains. We note that in the vastmajority of the runs the posteriors were either similar tothe prior or suggested a population decrease. It is thusunlikely that convergence affected our main conclusionthat population structure mimics population bottle-necks (see below).
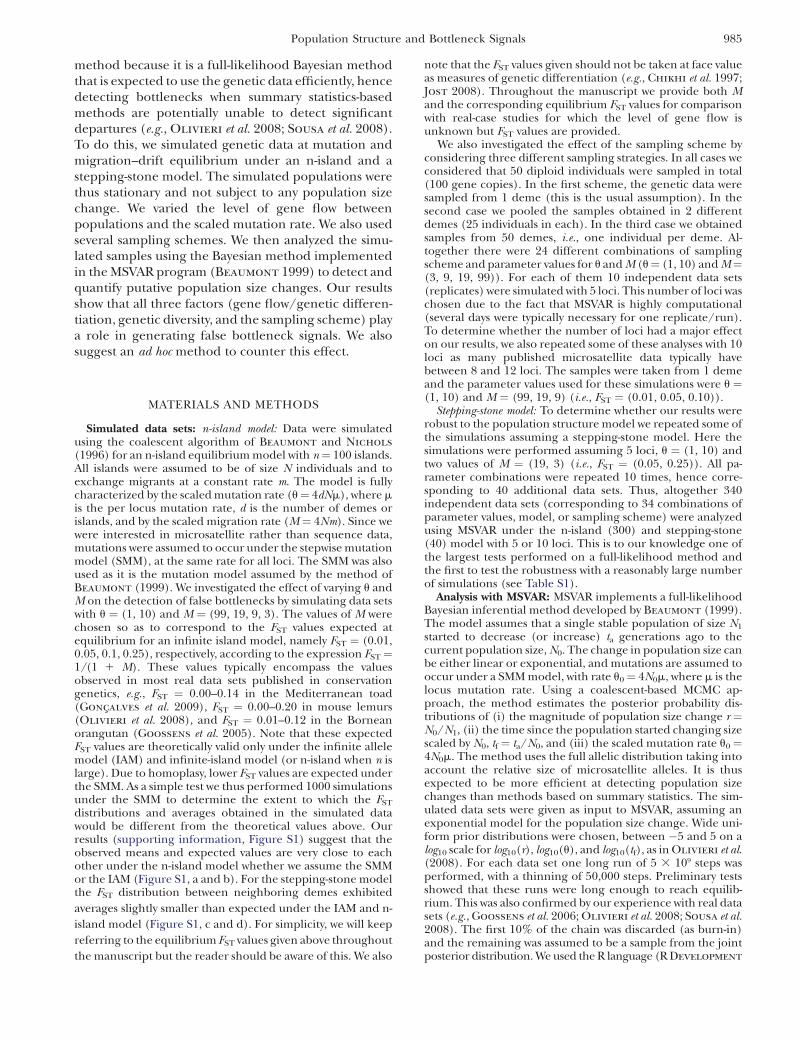
Genetic differentiation and diversity: Figure 1 showsthe posterior distributions obtained for log10(r) with fiveloci. The main results are that (i) the posterior dis-tributions are shifted toward the left (negative valuescorresponding to a bottleneck), (ii) the intensity of thisconfounding effect is dependent on the amount of geneflow between populations, (iii) the effect of populationstructure on the posteriors is itself significantly in-creased when u ¼ 10 compared to u ¼ 1 (dashed vs.solid lines). When gene flow is high with M ¼ 99 (i.e.,genetic differentiation is limited, FST ¼ 0.01) and to alesser extent for M ¼ 19 (FST ¼ 0.05) most posteriordistributions do not lead to a significant signal, as theyare relatively flat and exhibit large variances that are verysimilar to those of the prior (Figure 2). This isparticularly true when u ¼ 1. The bottleneck effect ishowever extremely clear for small M values when u¼ 10.Indeed, real data exhibiting similar posteriors would beinterpreted as strong evidence for a population de-crease around two orders of magnitude (Figures 1, c andd and 2, c and d). However, we note that even for lowlevels of gene flow (M values as low as 3 or FST values ashigh as 0.25), there are cases where the posteriors had amean close to zero and a large variance (Figure 2d).This is more frequent for u ¼ 1 but even with u ¼ 10 wefound 1 case out of 10, with a very wide and flat posterior
986 L. Chikhi et al.

distribution. Thus, it appears that population structurecreates a spurious bottleneck effect that increases withgenetic differentiation and with genetic diversity. TheFST values at which this bottleneck effect is detected aretypically found in the literature of both endangered andnonendangered species (e.g., Goossens et al. 2006;Olivieri et al. 2008; Craul et al. 2009; Holsinger andWeir 2009; Rosel et al. 2009). Another result apparentin Figure 2 (and in Figures 3 through 7) is the linearrelationship (on a log–log scale) between the mean andvariance of the posteriors obtained for the simulateddata sets. The meaning of this relationship is unclearbut it suggests that it may be possible to identify pointsthat are clearly outside this ‘‘trend’’ and correspond topopulations that are unlikely to exhibit bottlenecksignals due to population structure.
The sampling scheme: The effect of the samplingscheme appears in Figure 3 where, for M ¼ 3 or FST ¼0.25, we plotted the variance against the mean in caseswhere 2 and 50 demes were sampled (corresponding to40 posteriors). They show that the means and variancesof the posterior distributions tend toward the values ofthe prior when the number of sampled demes increases(Figure 3c). Interestingly, when two demes are sampledfor the most extreme case of gene flow (M ¼ 3, FST ¼0.25), we can see a pattern similar to that observed forM ¼ 9 (FST¼ 0.1) when only 1 deme is sampled (Figure2c). When 50 demes are sampled (one diploid in-dividual from each deme) the situation is even moreextreme with most posteriors exhibiting little bottle-neck signal as for the data obtained for M ¼ 99 (FST ¼
0.01) when only 1 deme is sampled. These resultssuggest that the chances of obtaining estimates suggest-ing a spurious population decrease are higher whenanalyzing samples taken from a single deme thansamples mixing more than 1 deme. It also suggests thatone way of countering this spurious effect is to analyzesamples taken from as many demes as possible.
The number of loci and the model of populationstructure: As Figure 4 shows, there were differenceswhen 10 loci were used instead of 5. In general the meansof the posteriors were shifted more toward negativevalues, but this effect was stronger for u ¼ 10 than foru ¼ 1. In general, the analyses with 10 loci tended toreturn more precise posterior distributions (smallervariance), thus increasing the support for spuriouspopulation declines. However, for u ¼ 1 and high geneflow (M ¼ (99, 19), i.e., FST ¼ (0.01, 0.05)) we note thatthe use of 10 loci did not have a very strong effect. As canbe seen in Figure 5 there are no major differencesbetween the results obtained under the stepping-stonemodel and the island model. For higher scaled mutationrates and lower levels of gene flow (lower right panel)the means under the stepping-stone model tend to beslightly lower than under the island model, suggesting aslightly stronger spurious bottleneck effect.
Comparison of the simulations with real data: InFigure 6 the results of the fish data are compared withthe distribution of the mean and variance of themagnitude of the population size change (log10(r)where r ¼ N0/N1) obtained in the simulations. Theresults of the two species fall outside the points
Figure 1.—Influence of gene flow and genetic diversity in the detection of bottlenecks—posteriors. Posterior distributions wereobtained for log10(r), where r is the ratio of present (N0) over ancient (N1) population size change. Negative and positive values oflog10(r) correspond to population bottlenecks and expansions, respectively. For all analyses the prior for log10(r) was a uniformbetween �5 and 5 and is represented by the horizontal dashed line. The results were obtained with five loci and 50 diploid in-dividuals sampled from a single deme assuming a 100-island model (see text for details). (a) Posteriors obtained for all the sim-ulations performed for M¼ 99 (i.e., FST¼ 0.01) and for u¼ 1 (solid lines) and u¼ 10 (dashed lines). (b) Same as in a, but for M¼19 (i.e., FST¼ 0.05). (c) Same as in a, but for M¼ 9 (i.e., FST¼ 0.10). (d) Same as in a, but for M¼ 3 (i.e., FST¼ 0.25). Most posteriordistributions are shifted to the left but are in general relatively flat for high levels of gene flow and not very different from the prior.Posteriors indicating a potential bottleneck were obtained for the lowest levels of gene flow and the highest genetic.
Population Structure and Bottleneck Signals 987

generated with the simulations, which represent theexpected distribution for the means and variances oflog10(r) values if population structure was the onlyfactor. Compared with the simulations, the real datahad a lower variance and in four samples the mean wasmore negative than the lowest value obtained with thesimulations. Also, contrary to the distribution foundwith the simulations, the results of the fish speciesappear to be independent of the FST estimates, withmost of the points in the region of means between �3and �2 and variances between 0 and 2 in both the rightand left panels (i.e., with both high and low FST values).For the orangutan data, the comparison with thesimulated data (Figure 7) shows that the real data aremore extreme, exhibiting a stronger and clearer bottle-neck than expected in the simulations. This suggeststhat population structure alone may not fully explainthe bottleneck signal detected by Goossens et al.(2006).
DISCUSSION
The importance of population structure: The simu-lations presented here show that when samples areobtained from populations that are actually stationaryand at mutation–drift equilibrium but are intercon-nected by gene flow, MSVAR detects bottlenecks that areapparently not distinguishable from real bottlenecks inWF populations. While this effect has been known froma theoretical point of view (Wakeley 1999; Beaumont
2003b, 2004; Nielsen and Beaumont 2009), it had notbeen quantified for data sets simulated with differentlevels of gene flow and diversity. We found that the effectwas limited when genetic differentiation was low butthat it could be observed for values of FST that aretypically reported in the literature (e.g., Goncxalves et al.2009; Holsinger and Weir 2009; Quemere et al. 2009;Rosel et al. 2009). We found that the effect was par-
ticularly strong with high values of u, which either cor-respond to highly variable markers or to species withlarge effective population sizes. This is particularlyinteresting as it means that structured populations withlarge effective sizes are the ones that are most likely toexhibit this spurious bottleneck effect.
This may seem counterintuitive but is in agreementwith several recent studies as we discuss later in thissection, and in particular with Wakeley (1999). It is alsoworrying because a large population that has recentlybeen affected by environmental change may exhibit abottleneck signal not necessarily because of the recenthabitat contraction but also because it used to be largeand structured. This is likely to be the kind of speciesthat attracts interest of conservation biologists. That is,our results suggest that we might have found a bottle-neck signal, even if we had sampled an abundant andstructured species before it started decreasing. Giventhat several vertebrate species currently endangeredused to be widely distributed and were probablystructured, this result may apply to some of them. Also,the fact that for most of these species we do not haveaccess to nondisturbed populations, due to majorhabitat losses that have taken place in the last centuries,we may not be able to obtain samples from undisturbedpopulations for which the spurious bottleneck effectcould be quantified.
This result does not mean that a bottleneck detectedtoday is necessarily unrelated to recent demographicchanges due to habitat loss and fragmentation inendangered species, but it does suggest that it iscurrently difficult to separate the two effects (popula-tion structure and collapse). For instance, one couldimagine a hypothetical situation where MSVAR identi-fies population size decreases by three orders ofmagnitude, but that population structure contributedto a 100-fold decrease, as some of our simulationssuggest, whereas the actual demographic decrease was
Figure 2.—Influence of gene flow and genetic diversity in the detection of bottlenecks—means and variances. This figure rep-resents on the x- and y-axes, respectively, the means and variances computed for the posterior distributions represented in Figure 1for log10(r) where r ¼ N0/N1. For comparison, the mean and variance of the prior are represented by the vertical and horizontaldotted lines, respectively. Negative means correspond to population bottlenecks, whereas positive means correspond to popula-tion expansions. The open circles correspond to posteriors obtained for u¼ 1, whereas the triangles were obtained with u¼ 10. (a)Results correspond to simulations with 5 loci and 50 diploid individuals sampled from a single deme, assuming M ¼ 99 (averageequilibrium FST ¼ 0.01) in a 100-island model (see text for details). (b) Same as in a, for M ¼ 19 (FST ¼ 0.05). (c) Same as in a,for M ¼ 9 (FST ¼ 0.10). (d) Same as in a, for M ¼ 3 (FST ¼ 0.25).
988 L. Chikhi et al.

‘‘only’’ 10-fold. One could probably imagine any com-bination of these two effects. At this stage it is difficult tosay how population structure and population sizechange may interact, whether it is additive or not.
It is also important to stress that most inferencemethods available to users that explicitly model pop-ulation size change ignore population structure, exceptfor simple models with few populations (Hey andNielsen 2004; Hey 2005). Also, it seems reasonable tostate that this confounding effect is general, as it isrelated to the statistical properties of the gene treesgenerated under different scenarios (population struc-ture/collapse). It is expected to affect all methods orstatistics currently used to detect, quantify, or datepopulation size changes. Here we used the method ofBeaumont (1999) because it is expected to be veryefficient at retrieving information from the full allelicdistribution and because full-likelihood methods tendto be less tested than those based on summary statistics(Table S1). The effect on other methods that use onlypart of this information through the computation ofone or several statistics may vary but there is noparticular reason to assume that the problem discussedhere should be specific to MSVAR. Indeed, the nulldistributions of the statistics used by other methods arederived or computed assuming a simple WF model with-out population structure. This has been confirmed byStadler et al. (2009) for the widely used Tajima
(1989b) and Fu and Li (1993) statistics. Another recentstudy by Broquet et al. (2010) also found deviationsfrom stationarity using the method of Cornuet andLuikart (1996) under scenarios of habitat loss andfragmentation. They found that reduction in theamount of gene flow between isolated fragments couldlead to signals of bottleneck using the DH statistic.
Our results are in agreement with the results ofWakeley (1999) who showed that structured popula-
tions can exhibit a signal of population bottlenecks evenif they are actually growing and increasingly exchangingmigrants. His study was partly motivated by the obser-vation that many genetic studies on humans werefinding signals of population bottlenecks when pre-sent-day population sizes are most likely greater thanthat of prehistoric humans. Our results are also similarto those of Stadler et al. (2009) who studied the effectof population structure on two summary statistics usedto detect selection or population size changes in se-quence data. They too simulated data under n-islandand stepping-stone models of population structure andfound that genetic differentiation was biasing Tajima’sD (Tajima 1989b) and Fu and Li’s D (Fu and Li 1993)toward positive values that are typically observed indeclining and isolated WF populations. Stadler et al.(2009) were mostly interested in detecting potentialspatial expansions and in quantifying the extent towhich population structure and the sampling schemecould hinder this detection. Here, by contrast, we areinterested in bottlenecks and determining the condi-tions under which bottlenecks are spuriously detected.Stadler et al. (2009) studied scenarios where an ances-tral population suddenly became structured, while eitherstaying demographically stationary or increasing signif-icantly in size. Their results showed that the above twosummary statistics were strongly influenced by popula-tion structure and the sampling scheme. Moreover, theywere interested in sequence data, whereas we wereinterested in microsatellite data and in methods usingthe full allele frequency information. The latter point isparticularly important as full-likelihood methods aresupposed to use genetic information more efficiently.We show here that instead of providing better and moreprecise results, full-likelihood methods can providestronger support for incorrect answers, at least undersome conditions.
Figure 3.—Effect of the sampling scheme. The x- and y-axes are the same as in Figure 2, representing the mean and variance ofthe posterior distributions for log10(r) obtained for three sampling schemes and with 2 scaled mutation rates (u ¼ (1, 10)) and forM¼ 3 (FST¼ 0.25). The open circles correspond to posteriors obtained for u¼ 1, whereas the triangles were obtained with u¼ 10.In all cases, 50 diploid individuals were sampled, using 5 loci and assuming a 100-island model. (a) All individuals were sampledfrom the same deme. This is identical to d in Figure 2 and is represented here for comparison. (b) Same as in a, but all individualswere sampled from 2 demes (i.e., 25 individuals from each). (c) Same as in a, but individuals were sampled from 50 demes (i.e., oneindividual from each).
Population Structure and Bottleneck Signals 989

In another study Leblois et al. (2006) tried to addressa different but related issue. These authors used anisolation-by-distance model, where each node corre-sponds to an individual rather than a deme. They thenanalyzed genetic samples after a fragmentation event,by sampling individuals from the only remaininghabitat fragment. They applied the summary statistics-based methods of Cornuet and Luikart (1996) andGarza and Williamson (2001) to determine whetherthe fragmentation event led to signals of bottleneck.Their analyses suggested that a rather complex set ofresults could be observed. They found, as expected, thatbottlenecks could be detected, but, very surprisingly,they also found a significant proportion of expansionsignals. This is particularly interesting since expansionsignals have also been observed in real data sets fromendangered species known to have rapidly decreased inthe last decades due to habitat fragmentation when themethod of Cornuet and Luikart (1996) was used (e.g.,Cook et al. 2007; Johnson et al. 2008; Olivieri et al.2008). We have also found this in another set of simu-lations to which the Bottleneck program was applied (L.Chikhi and V. Sousa, unpublished data). Altogether,the studies mentioned above (Wakeley 1999; Leblois
et al. 2006; Stadler et al. 2009; Broquet et al. 2010) andours, suggest that structured populations can generategenetic signatures and patterns that cannot be properlystudied by using simple WF models. It is important tonote that this is true for nonspatial (n-island) or
spatially structured (stepping-stone) models. The in-terest for spatially explicit models has increased in thelast few years, notably for nonequilibrium situations.For instance, a recent set of studies has shown thatspatial expansions can generate genetic signatures thatcan be very different from those expected under asimple WF model (Ray et al. 2003; Edmonds et al.2004; Klopfstein et al. 2006; Currat et al. 2006,2008). For instance Currat et al. (2006) showed thata spatial expansion can favor the surfing behavior ofneutral alleles that are rare in the source populations.This can lead to near-fixation in some of the expan-ding populations. Such large allele frequency differ-ences can then be mistaken for the signature ofselection. Clearly, all these and other recent studiesand reviews (e.g., Goldstein and Chikhi 2002;Edmonds et al. 2004; Nielsen and Beaumont 2009;Ray and Excoffier 2009) strongly suggest that there isstill much to be learned about the properties ofgenetic samples taken from structured populations,with or without expansion.
While this was not the focus of our article, it is worthmentioning that, to our knowledge, this is one of thefirst studies to perform a robustness test on a full-likelihood coalescent-based method (see, however,Strasburg and Rieseberg 2010). Indeed, the data setstypically used to test full-likelihood methods in simula-tion studies are usually generated under the model ofinterest. Our study differs from previous tests in that we
Figure 4.—Effect of the number of loci on population size change estimates. Means and variances of the posterior distributionsfor log10(r) are shown for samples using 5 and 10 loci for different levels of gene flow and for the two scaled mutation rates (u ¼ 1for a, b, and c; u ¼ 10 for d, e, and f). The results were obtained by sampling 50 diploid individuals from a single deme in a 100-island model.
990 L. Chikhi et al.

simulated data under a model that is likely to be morerealistic than a WF model for most species. We thustested the robustness of the method to a specific modelmisspecification. Our results suggest that robustnessshould be better investigated in the future and thatconclusions drawn from model-based methods mightneed to be reevaluated.
Our results would appear to suggest that the MSVARprogram has a bias toward detecting bottlenecks. Asnoted in the Introduction, Wakeley (1999) has shownthat if samples are taken from a structured population,one gene per deme, the expected genealogy should bethe same as that of a rescaled WF model. In such a casewe would expect that MSVAR and other methods shouldnot detect any signal of population size change. Figure3c showed that indeed, when we were sampling individ-uals from different demes the bottleneck signal wasnearly absent. There is still a tendency to detect bottle-necks, however, which may lead to incorrect inferencewhen the number of loci used increases. However, inthis case we were sampling two rather than one gene perdeme. Of course, one can simply sample only one geneper individual, but for endangered species, this maylead to a reduction in sample size. Another explanationfor the ‘‘bias’’ is that Wakeley’s result is based on theinfinite-island model. As a simple test, we simulated datafrom an n-island model, where one gene is sampledfrom each of the 100 islands, and from a random matingpopulation for u¼ 1 and analyzed the data with MSVAR.Our results show that most posteriors are very flat,
indicating no population size change. However, even forthe panmictic model, we do observe a slight bias in thepoint estimate toward negative values (Figure S3). Froma Bayesian perspective the notion of bias of pointestimates is not very relevant: providing the trueparameter values are distributed according to the prior(and providing the MCMC implementation has con-verged), then the coverage of the credible intervals isguaranteed to be exact—e.g., the true parameter value isguaranteed to be within, say, the 90% limits, 90% of thetime. However, given that point values are often re-ported in the literature, and there is often a naiveexpectation that these should be unbiased, our obser-vation has some cautionary relevance.
We also note that there is a literature bias since MSVARhas been mostly used to analyze genetic data fromendangered species, i.e., species that are more likely tohave experienced bottlenecks than expansions. We notethat despite this bias, there are several cases whereexpansions or no population size changes were detected(Storz and Beaumont 2002) even when bottleneckswere known to have taken place (Bonhomme et al. 2008).
Genetic data for conservation genetics: Genetic dataare increasingly used in conservation biology and it isexpected that management decisions may increasinglydepend on the results of genetic studies. However,genetic data may be interpreted in different ways. Forinstance an endangered species may lack genetic di-versity for several reasons. It could be because it hasbeen subjected to a significant population decrease or
Figure 5.—Comparison of the stepping-stone and n-island models. Means and var-iances of the posterior distributions forlog10(r) are shown for samples obtainedfor different levels of gene flow M ¼ (19,3) (FST ¼ (0.05, 0.25) at equilibrium),and scaled mutation rates u ¼ (1, 10), un-der the n-island (open circles) and a two-dimensional stepping-stone model (solidtriangles). In both cases, 50 diploid indi-viduals sampled from a single deme andtyped at 5 loci were analyzed.
Population Structure and Bottleneck Signals 991

because it has had a small population size for longperiods of time (Johnson et al. 2008; Okello et al.2008). The statistical methods used to detect populationsize changes usually ignore population subdivision andour results show that this may generate incorrect resultsunder conditions that are likely to be common innature. It may thus be necessary to reevaluate a numberof older studies that detected past population sizechanges. At the same time, we found that when thesamples are taken from several demes, MSVAR did notdetect bottlenecks in most cases. This suggests an ad hocapproach to counter this effect and determine whetherthe single sampled populations have indeed been sub-ject to a population size change. If a bottleneck is stilldetected when samples come from several demes, it maybe that the whole metapopulation was subject to apopulation size change. This ad hoc approach wouldrequire analysis of samples obtained by maximizing thenumber of subpopulations. Indeed, for many endan-gered species currently living in a fragmented environ-ment, one could take one individual per fragment, andif the number of fragments sampled is limited, onecould take individuals from different social groups orlocations within each fragment. Another solution wasalso proposed by Beaumont (2003a) for another modelof population size change without mutations (puredrift). In this model he found that the results wereimproved by using temporal samples.
At another time scale, serially sampled data (i.e.,present and ancient DNA) may prove extremely usefulin disentangling structure and population size change.The reason for this was pointed out to us by J. Thorne
(personal communication). If we assume that we haveboth modern and ancient samples from the same deme,we can consider two possibilities. Either this deme isisolated (i.e., no population structure) or it is connectedto other demes by gene flow (population structure). Ifwe now consider the sampled genes that have not yetcoalesced at the time of the ancient samples we can seethat the situation is very different with or without
structure. If there were no structure, then all non-coalesced lineages will be exchangeable, whether theywere from modern or ancient DNA samples. On theother hand, if there were some form of populationstructure, only the modern-day lineages that have notcoalesced yet will have a probability to be in anotherdeme. Thus the coalescence rates with the genessampled in the past will be different. Thus, this differ-ential rate of coalescence times suggests that with suff-icient data there should be a way to statistically separatethe two models.
Another ad hoc way to assess whether populationstructure is the main factor responsible for the geneticpatterns is to compare the real data with the simulationsresults. The comparison of the MSVAR estimates of thetwo Iberian minnow species I. lusitanicum and I. almacai(Sousa et al. 2008, 2009b) with the simulations showsthat the real data fall outside the expected distribution,suggesting that population structure alone may notexplain the results of these two species. Despite the factthat the real data sets consisted of individuals genotypedat six loci (against five in the simulations) and the factthat populations had different sample sizes, theseresults indicate that the populations in the two speciesare probably undergoing a population decrease. This isin agreement with field data indicating a recent pop-ulation decline in both species (Alves and Coelho
1994; Cabral et al. 2005). We also note that the twospecies had very low levels of genetic diversity (with He ,
0.5). The comparison with the simulations and with u¼1 was thus probably conservative. For the orangutans thedata also appeared to be outside the distribution of thesimulated data. However, the results are not completelyclear and we believe that more work is necessary toconfirm or contradict the conclusions of the Goossens
et al. (2006) study. Of course, these ad hoc methods aretentative only as many complexities of real-life systemscould still cause false bottleneck signals.
It is finally worth noting that most population geneticstudies typically try to identify ‘‘populations’’ to which
Figure 6.—Comparison of the Iberianminnow data with the simulations. Meansand variances of the posterior distributionsfor log10(r) are shown for samples gener-ated under different levels of gene flowM ¼ (99, 19) (i.e., FST ¼ (0.01, 0.05), left)and M ¼ (9, 3) (FST ¼ (0.10, 0.25), right)with scaled mutation rate u ¼ 1, under then-island model and a two-dimensional step-ping-stone model. In both cases, 50 diploidindividuals sampled from a single demeand typed at five loci were analyzed. The re-sults obtained for Iberochondrostoma lusitani-cum and I. almacai in Sousa et al. (2008,2009b) are represented by the solid circlesand triangles, respectively. The FST valuesfor the fish data were computed usingthe Vitalis and Couvet (2001b) methodas in the original studies.
992 L. Chikhi et al.

population genetics methods can be applied to estimateparameters such as admixture rates, divergence times,population size changes, etc. What our work and severalother studies implicitly or explicitly suggest (Leblois
et al. 2006; Stadler et al. 2009; Broquet et al. 2010) isthat this approach can be misleading because theidentified populations are rarely isolated. Thus, it willbe important to determine when the identified popula-tions can be approximated by an isolated WF model andwhen they cannot, as we tried here for the quantificationof population size changes.
CONCLUSION AND PERSPECTIVES
Altogether our results and those of several previousstudies (Leblois et al. 2006; Stadler et al. 2009) suggestthat population and conservation geneticists should bevery careful while interpreting genetic data. This is truefor endangered populations subject to habitat loss andfragmentation but it is just as true for other areas ofpopulation genetics. As inferential methods have be-come increasingly powerful, they may also have becomemore sensitive to departures from model assumptions.Methods that account for both population subdivisionand population size change may be difficult to imple-ment as the number of parameters to estimate may growvery quickly. An alternative solution may come from theuse of model-choice approaches. The recent develop-ment of methods based on the approximate Bayesiancomputation framework suggests that it is becomingpossible to choose among several models (e.g., Fagundes
et al. 2007; Cornuet et al. 2008; Bray et al. 2009; Lopes
et al. 2009; V. C. Sousa, unpublished results). In thatcase it should be possible to determine whether data aremore likely to come from a structured model than froma model with population size change (Peter et al. 2010).
It is important to add that all the simulations performedhere were done assuming only one kind of departure fromthe model underlying MSVAR analyses. In real data, otherdepartures could also contribute in creating false bottle-neck signals. This is particularly the case with the mutationmodel. If the microsatellite data were generated by amutation process where insertion or deletion of morethan one repeat unit are possible, then this too couldcreate gaps in the microsatellite distribution, which wouldalso be interpreted as signals of bottlenecks. It is not clearhow important this effect would be. Thus, there is a placefor further research on the detection of past populationsize changes using genetic data.
We thank Thomas Broquet and Benjamin Peter for useful com-ments and for sending us versions of their manuscripts. We are alsograteful to one anonymous reviewer for very detailed comments thathelped us clarify the manuscript and to Jeff Thorne for positivecomments on the manuscript and for pointing out why seriallysampled data may prove important to separate population sizechanges from structure. The demographic analyses were performedusing the High-Performance Computing Centre Fundacxao para aCiencia e a Tecnologia (HERMES, FCT grant H200741/re-equip/2005). We thank P. Fernandes for making available these Bioinfor-matics resources at the Instituto Gulbenkian de Ciencia (IGC) and forhis help in their use. We also thank M. M. Coelho for all her supportand helpful discussions regarding the freshwater fish species. Thiswork was supported by SFRH/BD/22224/2005 granted to V.S. by FCT,Portuguese Science Foundation. L.C. is funded by the FCT projectsPTDC/BIA-BDE/71299/2006 and PTDC/BIA-BEC/100176/2008and grant no. CD-AOOI-07-003 from the Institut Francxais de laBiodiversite, Programme Biodiversite des ıles de l’Ocean Indien. Wealso thank the Egide Alliance Programme (project no. 12130ZG toL.C. and M.B.) for funding visits between Toulouse and Reading.L.C.’s travels between Toulouse and Lisbon were partly funded by theProgramme d’Actions Universitaires Integrees Luso-francxaises 2007/2008.
LITERATURE CITED
Alves, M. J., and M. M. Coelho, 1994 Genetic variation and popu-lation subdivision of the endangered iberian cyprinid chondros-toma lusitanicum. J. Fish Biol. 44: 627–636.
Beaumont, M., and R. Nichols, 1996 Evaluating loci for use in thegenetic analysis of population structure. Proc. R. Soc. Lond. B Biol.Sci. 263: 1619–1626.
Beaumont, M. A., 1999 Detecting population expansion and de-cline using microsatellites. Genetics 153: 2013–2029.
Beaumont, M. A., 2003a Estimation of population growth or declinein genetically monitored populations. Genetics 164: 1139–1160.
Beaumont, M. A., 2003b Conservation genetics, pp. 751–792 inHandbook of Statistical Genetics, edited by D. J. Balding, M. Bishop
and C. Cannings. John Wiley & Sons, New York.Beaumont, M. A., 2004 Recent developments in genetic data anal-
ysis: What can they tell us about human demographic history?Heredity 92: 365–379.
Becquet, C., and M. Przeworski, 2007 A new approach to estimateparameters of speciation models with application to apes. Ge-nome Res. 17: 1505–1519.
Beerli, P., 2006 Comparison of Bayesian and maximum-likelihoodinference of population genetic parameters. Bioinformatics 22:341–345.
Figure 7.—Comparison of the orangutan data with thesimulations. Means and variances of the posterior distribu-tions for log10(r) are shown for samples generated under dif-ferent levels of gene flow M ¼ (99, 19) (FST ¼ (0.01, 0.05))with scaled mutation rate u ¼ 1. In both cases, 50 diploid in-dividuals sampled from a single deme and typed at 10 lociwere analyzed.
Population Structure and Bottleneck Signals 993

Beerli, P., and J. Felsenstein, 2001 Maximum likelihood estima-tion of a migration matrix and effective population sizes in n sub-populations by using a coalescent approach. Proc. Natl. Acad.Sci. USA 98: 4563–4568.
Bonhomme, M., A. Blancher, S. Cuartero, L. Chikhi andB. Crouau-Roy, 2008 Origin and number of founders in an in-troduced insular primate: estimation from nuclear genetic data.Mol. Ecol. 17: 1009–1019.
Bray, T., V. Sousa, B. P. B, M. Bruford, and L. Chikhi, 2009 2bad:an application to estimate the parental contributions duringtwo independent admixture events. Mol. Ecol. Resour. 3: 538–541.
Broquet, T., S. Angelone, J. Jaquiery, P. Joly, J.-P. Lena et al.,2010 Disconnection can drive genetic signatures of bottleneck:a case study in european tree frogs. Conserv. Biol. (in press).
Cabral, M., J. Almeida, P. Almeida, T. Dellinger, N. Ferrand de
Almeida et al., 2005 The red list of vertebrates of Portugal. In-stituto de Conservacxao da Natureza, Lisboa (in Portuguese).
Chikhi, L., J. F. Agnese and F. Bonhomme, 1997 Strong differencesof mitochondrial DNA between Mediterranean Sea and EasternAtlantic populations of Sardinella aurita. Comptes Rendus del’Academie des Sciences III 320: 289–297.
Chikhi, L., M. W. Bruford and M. A. Beaumont, 2001 Estimationof admixture proportions: a likelihood-based approach usingMarkov chain Monte Carlo. Genetics 158: 1347–1362.
Cook, B. D., S. E. Bunn and J. M. Hughes, 2007 Molecular geneticand stable isotope signatures reveal complementary patternsof population connectivity in the regionally vulnerable south-ern pygmy perch (nannoperca australis). Biol. Conserv. 138:60–72.
Cornuet, J., F. Santos, M. Beaumont, C. Robert, J. Marin et al.,2008 Inferring population history with DIY ABC: a user-friendlyapproach to approximate Bayesian computation. Bioinformatics24: 2713–2719.
Cornuet, J. M., and G. Luikart, 1996 Description and poweranalysis of two tests for detecting recent population bottlenecksfrom allele frequency data. Genetics 144: 2001–2014.
Craul, M., L. Chikhi, V. Sousa, G. Olivieri, A. Rabesandratana
et al., 2009 Influence of forest fragmentation on an endangeredlarge-bodied lemur in northwestern Madagascar. Biol. Conserv.142: 2861–2871.
Currat, M., L. Excoffier, W. Maddison, S. P. Otto, N. Ray et al.,2006 Comment on ‘‘ongoing adaptive evolution of ASPM, abrain size determinant in homo sapiens’’ and ‘‘microcephalin,a gene regulating brain size, continues to evolve adaptively inhumans.’’ Science 313: 172.
Currat, M., M. Ruedi, R. Petit and L. Excoffier, 2008 Thehidden side of invasions: massive introgression by local genes.Evolution 62: 1908–1920.
De Iorio, M., R. Griffiths, R. Leblois and F. Rousset,2005 Stepwise mutation likelihood computation by sequentialimportance sampling in subdivided population models. Theor.Popul. Biol. 68: 41–53.
Edmonds, C. A., A. S. Lillie and L. L. Cavalli-Sforza,2004 Mutations arising in the wave front of an expanding pop-ulation. Proc. Natl. Acad. Sci. USA 101: 975–979.
Ewens, W. J., 2004 Mathematical Population Genetics: Theoretical Intro-duction. Springer-Verlag, New York.
Excoffier, L., A. Estoup and J.-M. Cornuet, 2005 Bayesian analy-sis of an admixture model with mutations and arbitrarily linkedmarkers. Genetics 169: 1727–1738.
Fagundes, N. J. R., N. Ray, M. Beaumont, S. Neuenschwander,F. M. Salzano et al., 2007 Statistical evaluation of alternativemodels of human evolution. Proc. Natl. Acad. Sci. USA 104:17614–17619.
Fu, Y. X., and W. H. Li, 1993 Statistical tests of neutrality of muta-tions. Genetics 133: 693–709.
Garza, J., and E. Williamson, 2001 Detection of reduction in pop-ulation size using data from microsatellite loci. Mol. Ecol. 10:305–318.
Geweke, J., 1992 Evaluating the accuracy of sampling-basedapproaches to the calculation of posterior moments, pp. 169–193 in Proceedings of the Fourth Valencia International Meeting onBayesian Statistics, edited by J. Bernado, J. Berger, A. Dawid
and A. Smith, Oxford University Press, Oxford, UK.
Geyer, C. J., 2009 MCMC: Markov Chain Monte Carlo. R packageversion 0.6.
Goldstein, D. B., and L. Chikhi, 2002 Human migrations and pop-ulation structure: what we know and why it matters. Annu. Rev.Genomics Hum. Genet. 3: 129–152.
Goncxalves, H., I. Martınez-Solano, R. J. Pereira, B. Carvalho,M. Garcıa-Parıs et al., 2009 High levels of population subdivi-sion in a morphologically conserved Mediterranean toad (alytescisternasii) result from recent, multiple refugia: evidence fromMtDNA, microsatellites and nuclear genealogies. Mol. Ecol. 18:5143–5160.
Goossens, B., L. Chikhi, M. F. Jalil, M. Ancrenaz, I. Lackman-Ancrenaz et al., 2005 Patterns of genetic diversity and migra-tion in increasingly fragmented and declining orang-utan(pongo pygmaeus) populations from Sabah, Malaysia. Mol. Ecol.14: 441–456.
Goossens, B., L. Chikhi, M. Ancrenaz, I. Lackman-Ancrenaz,P. Andau et al., 2006 Genetic signature of anthropogenic pop-ulation collapse in orangutans. PLoS Biol. 4: 285–291.
Hein, J., M. H. Schierup and C. Wiuf, 2005 Gene Genealogies,Variation and Evolution: A Primer in Coalescent Theory.Oxford University Press, Oxford, UK.
Hey, J., 2005 On the number of new world founders: a populationgenetic portrait of the peopling of the Americas. PLoS Biol. 3:e193.
Hey, J., and R. Nielsen, 2004 Multilocus methods for estimatingpopulation sizes, migration rates and divergence time, with appli-cations to the divergence of Drosophila pseudoobscura and D. persi-milis. Genetics 167: 747–760.
Hirschfeld, L., and H. Hirschfeld, 1919 Serological differencesbetween the blood of different races. Lancet 194: 675–679.
Holsinger, K. E., and B. S. Weir, 2009 Genetics in geographicallystructured populations: defining, estimating and interpretingFST. Nat. Rev. Genet. 10: 639–650.
Hudson, R., 1990 Gene genealogies and the coalescent process,pp. 1–44 in Oxford Surveys in Evolutionary Biology, edited byD. Futuyma and J. Antonovics, Oxford University Press,Oxford, UK.
Johnson, J., R. Tingay, M. Culver, F. Hailer, M. Clarke et al.,2008 Long-term survival despite low genetic diversity in thecritically endangered Madagascar fish-eagle. Mol. Ecol. 18: 54–63.
Jost, L., 2008 G(st) and its relatives do not measure differentiation.Mol. Ecol. 17: 4015–4026.
Kimura, M., and G. Weiss, 1964 The stepping stone model of pop-ulation structure and the decrease of genetic correlation with dis-tance. Genetics 49: 561–576.
Klopfstein, S., M. Currat and L. Excoffier, 2006 The fate ofmutations surfing on the wave of a range expansion. Mol.Biol. Evol. 23: 482–490.
Leblois, R., A. Estoup and R. Streiff, 2006 Genetics of recent hab-itat contraction and reduction in population size: Does isolationby distance matter? Mol. Ecol. 15: 3601–3615.
Loader, C., 2007 locfit: Local Regression, Likelihood and Density Estima-tion. R package version 1.5–4.
Lopes, J., D. Balding and M. Beaumont, 2009 POPABC: a programto infer historical demographic parameters. Bioinformatics 25:2747–2749.
Martin, A. D., K. M. Quinn, and J. H. Park, 2009 MCMCpack:Markov Chain Monte Carlo (MCMC) Package. R package version0.9–6.
Nei, M., T. Maruyama and R. Chakraborty, 1975 The bottleneckeffect and genetic variability in populations. Evolution 29: 1–10.
Nielsen, R., and M. Beaumont, 2009 Statistical inferences in phy-logeography. Mol. Ecol. 18: 1034–1047.
Okello, J., G. Wittemyer, H. Rasmussen, P. Arctander,S. Nyakaana et al., 2008 Effective population size dynamicsreveal impacts of historic climatic events and recent anthro-pogenic pressure in african elephants. Mol. Ecol. 17: 3788–3799.
Olivieri, G. L., V. Sousa, L. Chikhi and U. Radespiel, 2008 Fromgenetic diversity and structure to conservation: genetic signatureof recent population declines in three mouse lemur species(microcebus spp.). Biol. Conserv. 141: 1257–1271.
994 L. Chikhi et al.

Peter, B. M., D. Wegmann and L. Excoffier, 2010 Distinguishingbetween population bottleneck and population subdivision by aBayesian model choice procedure. Mol. Ecol. (in press).
Plummer, M., N. Best, K. Cowles, and K. Vines, 2009 Coda: OutputAnalysis and Diagnostics for MCMC. R package version 0.13–4.
Quemere, E., E. Louis, A. Riberon, L. Chikhi and B. Crouau-Roy,2009 Non-invasive conservation genetics of the critically endan-gered golden-crowned sifaka (propithecus tattersalli): high diver-sity and significant genetic differentiation over a small range.Conserv. Genet. 11: 675–687.
R Development Core Team, 2008 R: A Language and Environmentfor Statistical Computing. R Foundation for Statistical Computing,Vienna, Austria.
Ray, N., M. Currat and L. Excoffier, 2003 Intra-deme moleculardiversity in spatially expanding populations. Mol. Biol. Evol. 20:76–86.
Ray, N., and L. Excoffier, 2009 Inferring past demography using spa-tially explicit population genetic models. Hum. Biol. 81: 141–157.
Rogers, A. R., and H. Harpending, 1992 Population growth makeswaves in the distribution of pairwise genetic differences. Mol. Bi-ol. Evol. 9: 552–569.
Rosel, P. E., L. Hansen and A. A. Hohn, 2009 Restricted dispersalin a continuously distributed marine species: common bottle-nose dolphins tursiops truncatus in coastal waters of the westernNorth Atlantic. Mol. Ecol. 18: 5030–5045.
Slatkin, M., and R. R. Hudson, 1991 Pairwise comparisons ofmitochondrial DNA sequences in stable and exponentiallygrowing populations. Genetics 129: 555–562.
Sousa, V., F. Penha, M. J. Collares-Pereira, L. Chikhi and M. M.Coelho, 2008 Genetic structure and signature of populationdecrease in the critically endangered freshwater cyprinid chon-drostoma lusitanicum. Conserv. Genet. 9: 791–805.
Sousa, V., M. Fritz, M. Beaumont and L. Chikhi, 2009a Approxi-mate Bayesian computation without summary statistics: the caseof admixture. Genetics 181: 187–197.
Sousa, V., F. Penha, I. Pala, L. Chikhi and M. Coelho, 2009b Con-servation genetics of a critically endangered Iberian minnow:evidence of population decline and extirpations. Anim. Conserv.13: 162–171.
Storz, J. F., and M. A. Beaumont, 2002 Testing for genetic evidenceof population contraction and expansion: an empirical analysisof microsatellite DNA variation using a hierarchical Bayesianmodel. Evolution 56: 154–166.
Strasburg, J. L., and L. H. Rieseberg, 2010 How robust are ‘‘iso-lation with migration’’ analyses to violations of the IM model?A simulation study. Mol. Biol. Evol. 27: 297–310.
Stadler, T., B. Haubold, C. Merino, W. Stephan and P.Pfaffelhuber, 2009 The impact of sampling schemes on thesite frequency spectrum in nonequilibrium subdivided popula-tions. Genetics 182: 205–216.
Tajima, F., 1989a The effect of change in population size on DNApolymorphism. Genetics 123: 597–601.
Tajima, F., 1989b Statistical method for testing the neutral mutationhypothesis by DNA polymorphism. Genetics 123: 585–595.
Vitalis, R., and D. Couvet, 2001a Estim 1.0: a computer programto infer population parameters from one-and two-locus geneidentity probabilities. Mol. Ecol. Notes 1: 354–356.
Vitalis, R., and D. Couvet, 2001b Estimation of effective popula-tion size and migration rate from one-and two-locus identitymeasures. Genetics 157: 911.
Wakeley, J., 1999 Nonequilibrium migration in human history.Genetics 153: 1863–1871.
Watterson, G., 1975 On the number of segregating sites in genet-ical models without recombination. Theor. Popul. Biol. 7: 256–276.
Wright, S., 1931 Evolution in Mendelian populations. Genetics 16:97–159.
Communicating editor: H. G. Spencer
Population Structure and Bottleneck Signals 995

GENETICSSupporting Information
http://www.genetics.org/cgi/content/full/genetics.110.118661/DC1
The Confounding Effects of Population Structure, Genetic Diversityand the Sampling Scheme on the Detection and Quantification
of Population Size Changes
Lounes Chikhi, Vitor C. Sousa, Pierre Luisi, Benoit Goossens and Mark A. Beaumont
Copyright � 2010 by the Genetics Society of AmericaDOI: 10.1534/genetics.110.118661

L. Chikhi et al. 2 SI
FIGURE S1.—Convergence analysis. This figure shows the Geweke statistics obtained for the 340 simulated data sets analysed.
The region between the horizontal dashed lines correspond to the 95% confidence interval (2.5% and 97.5% quantiles of the null
distribution [Normal(0,1)]). The region between the solid lines corresponds to the confidence region corrected using the
Bonferroni procedure.

L. Chikhi et al. 3 SI
FIGURE S2.—Distribution of FST values in the n-island and stepping-stone model under the SMM mutation model. The results shown in the left and right panels were obtained with =1 and =10, respectively. In all panels, the vertical dashed lines
correspond to the means of the simulated distributions whereas the vertical solid lines correspond to the expected values for the
infinite island model under the IAM (infinite allele model) hence obtained as FST =1/(1+M), where M=4Nm and N is the effective
size of single demes and m is the migration rate between demes. The distributions were obtained using 1000 simulations. The FST
values were estimated according to COCKERHAM and WEIR 1993. a and b The two top panels show the distribution of the mean
FST values in a 100-island model under the SMM model compared to the expected value under the IAM for the four levels of
gene flow used in this study. The two panels show that the four distributions means are very close to the expected values under
the IAM. One hundred gene copies were sampled in each deme. c and d. The two lower panels show the distribution of the
mean FST values in a two dimensional stepping-stone model, but with samples taken in two neighbour demes. These two panels
show that the expected FST values between neighbouring demes are close, and slightly smaller than expected in the n-island
model, but exhibit a large variance. Here 100 gene copies were sampled corresponding to 50 in each deme.

L. Chikhi et al. 4 SI
FIGURE S3.—Effect of the sampling scheme on the detection of population size changes (with a comparison with a random
mating population). The results shown in the panels were obtained under different sampling schemes. The first panel (a) shows
for =1 and =10 the mean and variances of the posteriors obtained when 50 demes are sampled. The second panel (b)
corresponds to the situation where 100 demes are sampled. The third panel (c) shows the results for a panmictic population.

L. Chikhi et al. 2 S
TABLE S1
Summary of Tests of Inferential Methods
Demographic Model Mutation Model Parameters Algorithm Data Simulation
study Paper
Stable population
sequence
Kimura-2P (2Nμ)
MCMC sampling
Gi ~ P(G|D, 0)
Allele freq.
(mut info)
YES (1200) Kuhner et al. (1995)
Stable population microsat
SMM (2Nμ) MCMC sampling P(G, |D)
Allele freq.
(mut info) YES (140) Wilson and Balding (1998)
Stable population and
Exponential growth
sequence
Kimura-2P (2Nμ) growth rate
MCMC sampling
Gi ~ P(G|D, 0)
Haplotype freq
(mut info) YES (2000) Kuhner et al. (1998)
Exponential and Linear
Population size change
microsat
SMM
(2N0μ); r (N0/N1) ratio current/past
pop size; MCMC sampling P(G, |D)
Allele freq
(mut info) YES (5) Beaumont (1999)
2-island model sequence
Kimura-2P
1, 2, scaled migration
rates M1, M2- (2Nm)
MCMC sampling
Gi ~ P(G|D, 0)
Allele freq
(mut info) YES (2000)
Beerli and Felsenstein
(1999)
4-island model sequence
Kimura-2P
, scaled migration
rate M (2Nm)
MCMC sampling
Gi ~ P(G|D, 0)
Haplotype freq
(mut info) YES (200)
Beerli and Felsenstein
(2001)
Admixture model K allele model scaled time since
admixture ti=T/Ni, i=1,2,3
d i ib i
MCMC sampling P( |D)
IS - L( ) at each MCMC step
Allele freq
(no mut into) YES (120) Chikhi et al. (2001)

L. Chikhi et al. 3 SI
Population split with
isolation with migration
(IM) of two populations
sequence
Inf sites
1, 2, A,time split (t=T/N1), scaled
migration rates M1,M2
MCMC sampling P(G, |D) Haplotype freq
(mut info) YES (300) Nielsen and Wakely 2001
Exponential pop size
change
microsat
SMM
current size N0,
past size N1, MCMC sampling P(G, |D)
Allele freq
(mut used) NO Storz and Beaumont (2002)
Exponential pop size
change K allele model
(2N0μ); r (N0/N1) ratio current/past
pop size;
MCMC sampling P(Param|D)
IS - L( ) at each MCMC step
Allele freq
(no mut info) Beaumont (2003)
Population split with
isolation with migration
(IM) of two populations
SMM, Inf sites
and others
1, 2, A, time split (t=Tμ),
migration rates
M1,M2 (M=mμ)
MCMC sampling P(G, |D) Haplotype freq
(mut info) YES (20) Hey and Nielsen (2004)
n-island model microsat
SMM , scaled migration M Importance sampling
Allele freq
(mut info) YES (30) De Iorio et al. (2005)
Mutation Models: Inf sites – infinite sites model; SMM – Single stepwise mutation model
Algorithm: MCMC – Markov chain Monte Carlo; IS – Importance sampling; P( ) - probability; L( ) - Likelihood; D – observed data; – parameters of the model;
G – gene genealogies;
Simulation Study: YES – simulation study performed and number of simulations
This table summarizes information regarding most full-likelihood coalescent-based methods published between 1995 and 2005. We chose this period because it corresponds to the period during
which most full-likelihood methods were used and because after 2005, many methods not easily summarised were developed using the general ABC approach. Here we summarize the demographic and mutation models assumed, the type of data analysed (sequence or microsatellites), the computational approach, and the number of simulated data sets used to test them. It should be noted that the
number of simulations given here should not be taken at face value as it was sometimes difficult to determine the exact number of data sets generated by the authors. We thus consider this table as a
first attempt to quantify the amount of simulation work carried out to test the validity of highly computational methods in inferring parameters. We note that all simulated data sets analysed in these
studies were simulated under the model. In other words, none of these studies performed a robustness test. We also note that it is still a major improvement over ``network-based'' methods such as
NCPA that have never been shown to work by their authors.