Embed Size (px)
Citation preview

The Conforming Loan Limit
Updated August 2, 2013
Congressional Research Service
https://crsreports.congress.gov
RS22172

The Conforming Loan Limit
Congressional Research Service
Summary Congress is concerned with the pace of the recovery in the housing and mortgage markets. A
series of laws starting with the Economic Stimulus Act of 2008 (ESA; P.L. 110-185) were
designed to increase the availability and affordability of mortgages in “high-cost” areas. This
concern about housing and mortgage markets is balanced by attention being paid to possible
taxpayer financial risks and the desire to minimize government intervention in economic markets.
Two congressionally chartered government-sponsored enterprises (GSEs), Fannie Mae and
Freddie Mac, provide liquidity to the mortgage market by purchasing residential mortgages from
the original lenders and either reselling them as mortgage-backed securities to investors or
holding them as investments in their own portfolios. Their charters include a ceiling on the size of
loans the GSEs can buy.
Since the end of FY2011 (September 30, 2011), the maximum limit in high-cost areas was
reduced to $625,500 from $729,750. The current high-cost limit is calculated as 115% of the area
median house price, but cannot exceed 150% of the national limit or $625,500. The limit in other
areas of the nation remains unchanged since 2006 at $417,000.
Securitization of mortgages that exceed the applicable limit—called non-conforming jumbo
loans—is done by private financial institutions, although in the present financial environment
virtually no jumbo mortgages are being securitized. GSE status allows Fannie and Freddie to
issue debt at lower cost than other private firms; part of this subsidy is passed on to home buyers
in the form of lower interest rates. Interest rates on jumbo mortgages are slightly higher than
those on the conforming loans that the GSEs can purchase. The spread between non-conforming
jumbo and conforming loan rates has been elevated since the start of the financial crisis and is
now about three-fourths of 1%.
According to recent congressional testimony, most recent home purchase mortgages are
guaranteed by FHA and securitized by Ginnie Mae; the majority of mortgages purchased recently
by Fannie Mae and Freddie Mac have refinanced existing mortgages.
S. 1217, the Housing Finance Reform and Taxpayer Protection Act of 2013, would reduce the
maximum high-cost limit from 150% of the national limit ($625,500) to 130% of the national
limit ($542,100). H.R. 2767, the Protecting American Taxpayers and Homeowners (PATH) Act of
2013, could reduce the high-cost limit to $525,500.
This report analyzes the implications of the higher conforming loan limit in high-cost areas. It
will be updated as legislative and market developments warrant.

The Conforming Loan Limit
Congressional Research Service
Contents
Background ..................................................................................................................................... 1
Legislation to Raise the Loan Limits ............................................................................................... 2
The Impact of Raising the Conforming Loan Limit ........................................................................ 4
The Conforming Loan Limit During the Crisis ........................................................................ 5
Policy Issues .................................................................................................................................... 6
Tables
Table 1. Summary of High-Cost Area Limits .................................................................................. 3
Table 2. Current High-Cost Conforming Loan Limits in Selected Areas ........................................ 3
Table A-1. Conforming Loan Limits in Selected Areas .................................................................. 7
Appendixes
Appendix. Previous Conforming Loan Limits ................................................................................ 7
Contacts
Author Information .......................................................................................................................... 8

The Conforming Loan Limit
Congressional Research Service 1
Background Until they were placed under government conservatorship in September 2008, Fannie Mae and
Freddie Mac were stockholder-controlled companies that were chartered by Congress to improve
the nation’s residential mortgage market and are known as government-sponsored enterprises
(GSEs).1 The charters convey special privileges, but also impose certain restrictions on the GSEs’
business activities.
Congress enacted the modern conforming loan limit, which establishes the maximum size
mortgage that the GSEs can purchase, in the Housing and Community Development Act of 1980.2
The initial limit was $93,750 for a single-family home (39% above the Federal Housing
Administration (FHA) ceiling at the time), and the law provided for annual increases in the loan
limit to adjust for rising prices, as reflected in a housing price index published by the Federal
Housing Finance Board (FHFB).3 This loan limit is the maximum value of a mortgage that Fannie
Mae and Freddie Mac can purchase. The loan limit was initially set at a level significantly higher
than the national average home price, and with indexation it has remained higher. In 2007, the
conforming loan limit stood at 145% of the average new home price, and 162% of the average
resale price of an existing home. Since 2006, the basic conforming loan limit has held steady at
$417,000.4 In 2008, the passage of the Economic Stimulus Act of 2008 (ESA; P.L. 110-185)
created a temporary higher loan limit in high-cost areas that was 125% of the area median house
price, but no greater than 175% of the national median house price. This resulted in limits greater
than $417,000 in areas where the median house price exceeded $333,600.5
The Housing and Economic Recovery Act of 2008 (HERA; P.L. 110-289) and the American
Recovery and Reinvestment Act of 2009 (ARRA; P.L. 111-5) made temporary and permanent
changes to the limits for high-cost areas. With the expiration of the Continuing Appropriations
Act of 2011, the conforming loan limit in high-cost areas is determined by the Housing and
Economic Recovery Act of 2008 (P.L. 110-289): 115% of area median house price, but not to
exceed 150% of the national conforming loan limit, which results in a high-cost limit of
$625,500. This results in limits greater than $417,000 in areas where the median house price
exceeds $362,609. According to a study by Federal Reserve economists,6 if the HERA limits had
applied in 2010, 1.3% of home-purchase mortgages and 1.3% of refinance mortgages that were
eligible for GSE purchase would not have been eligible for purchase by Fannie Mae and Freddie
Mac. On the other hand, of those mortgages that would have lost their eligibility, 53.4% of those
used to purchase a home and 59.6% of those used to refinance were purchased by the GSEs.
1 For more information about Fannie Mae and Freddie Mac, see CRS Report RL34661, Fannie Mae’s and Freddie
Mac’s Financial Problems, by N. Eric Weiss.
2 P.L. 96-399, 94 Stat. 1616 et seq.
3 Higher limits were set for home mortgages covering two-, three-, and four-unit dwellings. See 12 U.S.C. 1454 for
Freddie Mac and 12 U.S.C. 1717 for Fannie Mae.
4 The Housing and Community Development Act set a higher limit for mortgages on residences in Alaska, Hawaii, and
Guam, all thought at the time to have higher than normal costs of building and lower than normal access to credit
because of their remoteness. In those areas, the conforming loan limit was set at 150% of the limit that applied to the
rest of the nation. In 1992, the Virgin Islands were added to the list of areas where the 150% limit applied (by §1382(k)
of P.L. 102-550).
5 Mathematically, $333,600 times 125% equals the nationwide limit of $417,000.
6 Robert B. Avery, Neil Bhutta, Kenneth P. Brevoort, and Glenn B. Canner, “The Mortgage Market in 2010: Highlights
from the Data Reported under the Home Mortgage Disclosure Act,” Federal Reserve Bulletin, vol. 97, p. 32. The
research also examined the impact on FHA-insured mortgages.

The Conforming Loan Limit
Congressional Research Service 2
The Consolidated and Further Continuing Appropriations Act of 2012 (P.L. 112-55) set the high-
cost limit for mortgages insured by the Federal Housing Administration (FHA) at 125% of area
median house price, not to exceed 175% of the national limit or $729,750. Prior to this law, the
high-cost FHA mortgage limit was identical to the GSE high-cost conforming loan limit.7 In other
areas, the FHA mortgage limit was and is 65% of the national conforming loan limit or $271,050.
The interaction between the 125% of area median house price and the $271,050 national limit
raises the high-cost limit in areas where the median house price is greater than $216,840.
According to recent congressional testimony, most recent home purchase mortgages are
guaranteed by FHA and securitized by Ginnie Mae; the majority of mortgages purchased recently
by Fannie Mae and Freddie Mac have refinanced existing mortgages.8
Legislation to Raise the Loan Limits Since 2008, Congress has adjusted the conforming loan limit five times. The first bill was ESA,
which enacted a temporary increase in the conforming loan limit.9 For mortgages originated
between July 1, 2007, and December 31, 2008, the loan limit for an area was the greater of (1) the
existing limit of $417,000 or (2) 125% of the area median home price, not to exceed a ceiling of
175% of the statutory limit, or $729,750.10 A total of 71 metropolitan and micropolitan statistical
areas had higher 2008 conforming loan limits, including 224 counties and cities not in counties.
There were 21 counties outside of metropolitan or micropolitan areas with increases in 2008.
HERA permanently removed the single conforming loan limit for the contiguous 48 states.11 The
loan limit is higher in metropolitan statistical areas—defined as “high-cost”—where the median
home sale price exceeds the current conforming loan limit. Under HERA, the conforming loan
limit for those areas was 115% of the median home price in the area, except that increases were to
be capped at 150% of the statutory loan limit (the limit that now applies to Alaska, Hawaii, and
the two island territories). This system for determining the limit took effect when the temporary
limits set by the stimulus act expired on December 31, 2008. Subject to the requirement in their
charters that loans purchased be no more than one year old, the GSEs were able to purchase high-
cost conforming loans after December 31, 2008.
ARRA returned the conforming loan limits for mortgages originated in 2009 in high-cost areas to
the 2008 ESA limit, that is, the high-cost limit was set at 175% of the statutory limit or
$729,750.12 The Federal Housing Finance Agency (FHFA), which is both regulator and
conservator of the GSEs, was authorized to create subarea limits, but has declined to do so. The
FY2010 Department of the Interior Appropriations Act (P.L. 111-88) applies the ESA limits to
mortgages originated in calendar 2010.
7 For more information about FHA-insured mortgages, see CRS Report RS20530, FHA-Insured Home Loans: An
Overview, by Katie Jones. FHA publishes the loan limits at https://entp.hud.gov/idapp/html/hicostlook.cfm.
8 Testimony of Laurie S. Goodman, Amherst Securities Group to the Subcommittee on Housing Transportation, and
Community Development of the Senate Committee on Banking, Housing, and Urban Affairs, September 20, 2011,
available at http://banking.senate.gov/public/index.cfm?FuseAction=Files.View&FileStore_id=dc3d9918-5aca-47b2-
9ce4-b9daaef67957.
9 P.L. 110-185, 122 Stat. 613 et seq.
10 The list of affected areas is available at http://www.ofheo.gov/media/hpi/AREA_LIST.pdf.
11 P.L. 110-289, 122 Stat. 2654 et seq.
12 P.L. 111-5, 123 Stat. 115 et seq.

The Conforming Loan Limit
Congressional Research Service 3
The Continuing Appropriations Act of 2011 (P.L. 111-242) continued the ESA limits to mortgages
originated in FY2011. They were not continued, however, into FY2012. Therefore the current
limits are those set by HERA.
Table 1. Summary of High-Cost Area Limits
Mortgages
Purchased
Dates
Applies to
Mortgages
Originated
Between
Percentage
of Area
Median
Percentage
of National
Limit Applicable Law
Feb. 13, 2008 -
Dec. 31, 2008
July 1, 2007 -
Dec. 31, 2008
125% 175% Economic Stabilization Act of 2008
P.L. 110-185
Jan. 1, 2009 -
Feb. 16, 2009
On or After Jan. 1,
2009
115% 150% Housing and Economic Recovery Act of
2008
P.L. 110-289
Feb. 17, 2009 -
Sept. 30, 2009
On or After Feb. 17,
2009
125% 175% American Recovery and Reinvestment Act
of 2009
P.L. 111-5
Oct. 30, 2009 -
Sept. 30, 2010
On or After Oct.
30, 2009
125% 175% Department of the Interior Appropriations
for FY2010
P.L. 111-88
Oct. 1, 2010 -
Sept. 30, 2011
Oct. 1, 2010 -
Sept. 30, 2011
125% 175% Continuing Resolution for FY2011
P.L. 111-242
On or After Oct.
1, 2011
On or After Jan. 1,
2009
115% 150% Housing and Economic Recovery Act of
2008
P.L. 110-289
Source: LIS.
Notes: Ending date in “Mortgage Purchased Dates” is effective date of superseding amendment.
A look at median prices in various metropolitan areas of the country shows that the conforming
limit is rising in several localities under ESA, and (in fewer areas) has risen under HERA. Table
2 shows the current conforming loan limit for selected areas. Some areas (including Barnstable,
MA; Boulder, CO; Miami, FL; and Riverside, CA) are now subject to the nationwide conforming
loan limit, but under earlier law were high-cost areas.
Table 2. Current High-Cost Conforming Loan Limits in Selected Areas
High-Cost Housing Area Loan Limit
High Cost Area Limit is Lesser of:
—Percentage of Area Median 115%
—Percentage of 2008 Limit ($417,000) 150%
Boston/Quincy/Cambridge, MA $465,750
Bridgeport/Stamford/Norwalk, CT $601,450
Los Angeles/Long Beach/Santa Ana, CA $625,500
New York City/N. NJ/Long Island, NY/NJ $625,500
Newark/Union, NJ $625,500
Sacramento/Arden/Arcade/Rosedale, CA $474,950

The Conforming Loan Limit
Congressional Research Service 4
High-Cost Housing Area Loan Limit
San Diego/Carlsbad/San Marcos, CA $546,250
San Francisco/Oakland, CA $625,500
San Jose/Sunnyvale/Santa Clara, CA $625,500
Seattle/Tacoma/Bellevue, WA $506,000
Washington, DC/MD/VA $625,500
Source: Federal Housing Finance Agency, Maximum Loan Limits that Apply to Loans Acquired in Calendar Year 2013
and Originated after 9/30/2011 or Prior to 7/1/2007, available at http://www.fhfa.gov/webfiles/24674/
FullCountyLoanLimitList2013_HERA-BASED_FINAL.xlsx.
The Impact of Raising the Conforming Loan Limit The existence of high-cost housing areas implies that the benefits of the GSE subsidy are not
distributed uniformly. GSE status allows Fannie and Freddie to borrow at lower interest rates than
non-GSE financial institutions.13 A portion of this subsidy is passed on to home buyers whose
mortgage loans are purchased and securitized by the GSEs. In 2003, Fannie and Freddie
purchased 35.1% of all mortgages (by dollar value) originated nationwide. This percentage varied
from state to state. In three states (California, New York, and Connecticut) and the District of
Columbia, the GSEs purchased less than 30% of new mortgages. In 15 states, on the other hand,
the two GSEs purchased more than 40% of new mortgages.14
In high-cost areas, the GSEs’ mortgage purchase and securitization operations are constrained by
the conforming loan limit. Loans that exceed the conforming loan limits can only be securitized
by non-GSE issuers, and prior to the recent recession, there was a large secondary market for
jumbo mortgage loans. In 2006, total prime jumbo loan originations were estimated at $480
billion, while $219 billion in prime jumbo mortgage-backed securities (MBS) were issued,
implying a securitization rate for jumbo mortgages of 45.6%.15 By contrast, Fannie and Freddie
securitized 83% of loans originated in 2006 in the conventional, conforming mortgage markets
where they are allowed to operate.16
Conforming mortgage loans tend to carry lower interest rates than nonconforming loans. A
number of studies have attempted to measure the spread between conforming mortgage and
jumbo loan rates and the extent to which the rate differential can be attributed to the subsidy
contained in GSE status.17 Most estimates of the spread between conforming and jumbo loans
13 Before conservatorship, the chief financial advantage conveyed to Fannie and Freddie by GSE status was the
“implicit guarantee.” Although GSE debt is not explicitly backed by the full faith and credit of the Treasury, market
participants have long believed that the government will not allow either GSE to become insolvent. Under
conservatorship the GSEs have direct financial support from the federal government and the guarantee on their debt is
all but explicit.
14 The 2006 Mortgage Market Statistical Annual, vol. 1, p. 25.
15 The 2008 Mortgage Market Statistical Annual, vol. 2, p. 3.
16 Ibid.
17 See U.S. Congressional Budget Office, Updated Estimates of the Subsidies to the Housing GSEs, April 8, 2004;
Wayne Passmore, Shane Sherlund, and Gillian Burgess, “The Effect of Government Sponsored Enterprises on
Mortgage Rates,” Real Estate Economics, vol. 33, fall 2005; Joseph A. McKenzie, “A Reconsideration of the
Jumbo/Non-Jumbo Mortgage Rate Differential,” Journal of Real Estate Finance and Economics, vol. 25, September-
December 2002, p. 197; and Brent Ambrose, Michael LaCour-Little, and Anthony Sanders, “The Effect of Conforming
Loan Status on Mortgage Yield Spreads: A Loan Level Analysis,” Real Estate Economics, vol. 32, winter 2004, p. 541.
The Conforming Loan Limit
Congressional Research Service 5
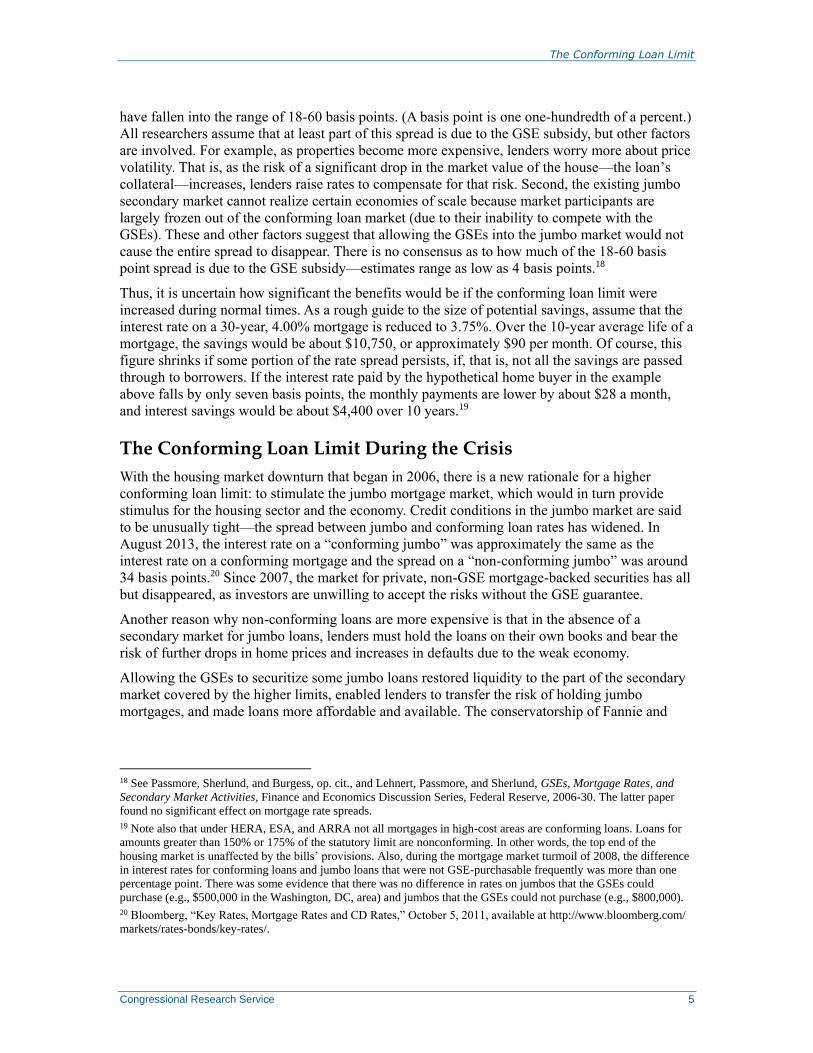
have fallen into the range of 18-60 basis points. (A basis point is one one-hundredth of a percent.)
All researchers assume that at least part of this spread is due to the GSE subsidy, but other factors
are involved. For example, as properties become more expensive, lenders worry more about price
volatility. That is, as the risk of a significant drop in the market value of the house—the loan’s
collateral—increases, lenders raise rates to compensate for that risk. Second, the existing jumbo
secondary market cannot realize certain economies of scale because market participants are
largely frozen out of the conforming loan market (due to their inability to compete with the
GSEs). These and other factors suggest that allowing the GSEs into the jumbo market would not
cause the entire spread to disappear. There is no consensus as to how much of the 18-60 basis
point spread is due to the GSE subsidy—estimates range as low as 4 basis points.18
Thus, it is uncertain how significant the benefits would be if the conforming loan limit were
increased during normal times. As a rough guide to the size of potential savings, assume that the
interest rate on a 30-year, 4.00% mortgage is reduced to 3.75%. Over the 10-year average life of a
mortgage, the savings would be about $10,750, or approximately $90 per month. Of course, this
figure shrinks if some portion of the rate spread persists, if, that is, not all the savings are passed
through to borrowers. If the interest rate paid by the hypothetical home buyer in the example
above falls by only seven basis points, the monthly payments are lower by about $28 a month,
and interest savings would be about $4,400 over 10 years.19
The Conforming Loan Limit During the Crisis
With the housing market downturn that began in 2006, there is a new rationale for a higher
conforming loan limit: to stimulate the jumbo mortgage market, which would in turn provide
stimulus for the housing sector and the economy. Credit conditions in the jumbo market are said
to be unusually tight—the spread between jumbo and conforming loan rates has widened. In
August 2013, the interest rate on a “conforming jumbo” was approximately the same as the
interest rate on a conforming mortgage and the spread on a “non-conforming jumbo” was around
34 basis points.20 Since 2007, the market for private, non-GSE mortgage-backed securities has all
but disappeared, as investors are unwilling to accept the risks without the GSE guarantee.
Another reason why non-conforming loans are more expensive is that in the absence of a
secondary market for jumbo loans, lenders must hold the loans on their own books and bear the
risk of further drops in home prices and increases in defaults due to the weak economy.
Allowing the GSEs to securitize some jumbo loans restored liquidity to the part of the secondary
market covered by the higher limits, enabled lenders to transfer the risk of holding jumbo
mortgages, and made loans more affordable and available. The conservatorship of Fannie and
18 See Passmore, Sherlund, and Burgess, op. cit., and Lehnert, Passmore, and Sherlund, GSEs, Mortgage Rates, and
Secondary Market Activities, Finance and Economics Discussion Series, Federal Reserve, 2006-30. The latter paper
found no significant effect on mortgage rate spreads.
19 Note also that under HERA, ESA, and ARRA not all mortgages in high-cost areas are conforming loans. Loans for
amounts greater than 150% or 175% of the statutory limit are nonconforming. In other words, the top end of the
housing market is unaffected by the bills’ provisions. Also, during the mortgage market turmoil of 2008, the difference
in interest rates for conforming loans and jumbo loans that were not GSE-purchasable frequently was more than one
percentage point. There was some evidence that there was no difference in rates on jumbos that the GSEs could
purchase (e.g., $500,000 in the Washington, DC, area) and jumbos that the GSEs could not purchase (e.g., $800,000).
20 Bloomberg, “Key Rates, Mortgage Rates and CD Rates,” October 5, 2011, available at http://www.bloomberg.com/
markets/rates-bonds/key-rates/.
The Conforming Loan Limit
Congressional Research Service 6
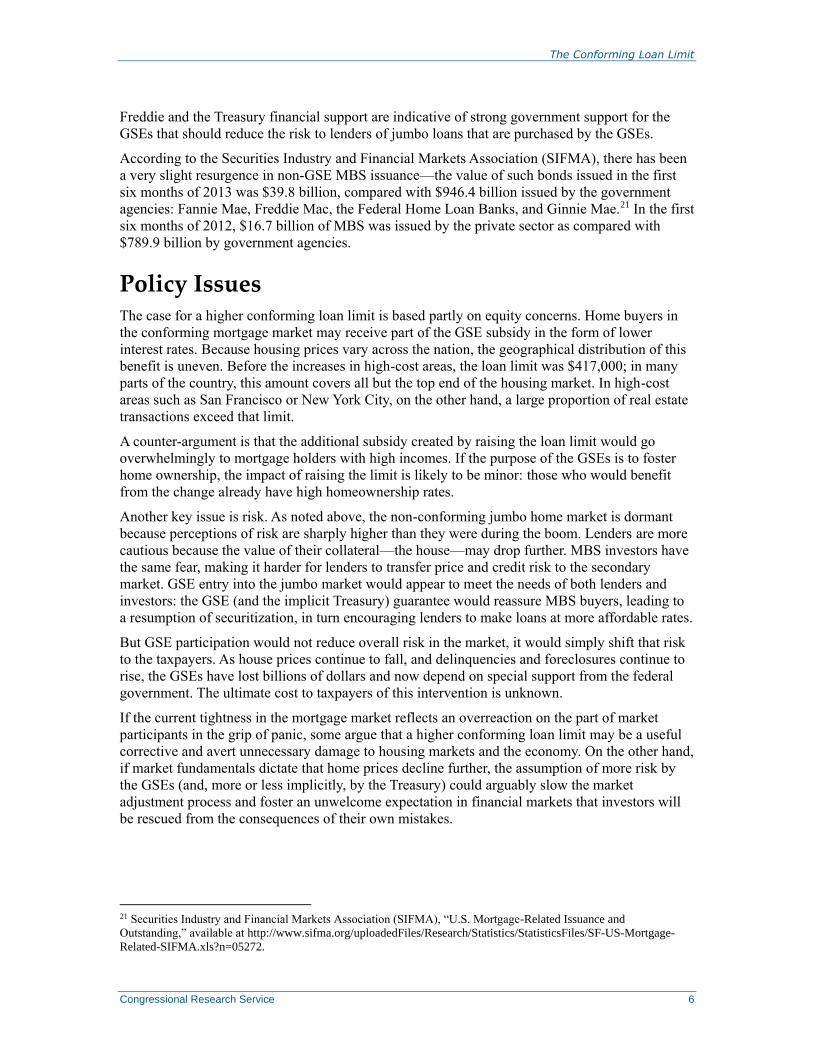
Freddie and the Treasury financial support are indicative of strong government support for the
GSEs that should reduce the risk to lenders of jumbo loans that are purchased by the GSEs.
According to the Securities Industry and Financial Markets Association (SIFMA), there has been
a very slight resurgence in non-GSE MBS issuance—the value of such bonds issued in the first
six months of 2013 was $39.8 billion, compared with $946.4 billion issued by the government
agencies: Fannie Mae, Freddie Mac, the Federal Home Loan Banks, and Ginnie Mae.21 In the first
six months of 2012, $16.7 billion of MBS was issued by the private sector as compared with
$789.9 billion by government agencies.
Policy Issues The case for a higher conforming loan limit is based partly on equity concerns. Home buyers in
the conforming mortgage market may receive part of the GSE subsidy in the form of lower
interest rates. Because housing prices vary across the nation, the geographical distribution of this
benefit is uneven. Before the increases in high-cost areas, the loan limit was $417,000; in many
parts of the country, this amount covers all but the top end of the housing market. In high-cost
areas such as San Francisco or New York City, on the other hand, a large proportion of real estate
transactions exceed that limit.
A counter-argument is that the additional subsidy created by raising the loan limit would go
overwhelmingly to mortgage holders with high incomes. If the purpose of the GSEs is to foster
home ownership, the impact of raising the limit is likely to be minor: those who would benefit
from the change already have high homeownership rates.
Another key issue is risk. As noted above, the non-conforming jumbo home market is dormant
because perceptions of risk are sharply higher than they were during the boom. Lenders are more
cautious because the value of their collateral—the house—may drop further. MBS investors have
the same fear, making it harder for lenders to transfer price and credit risk to the secondary
market. GSE entry into the jumbo market would appear to meet the needs of both lenders and
investors: the GSE (and the implicit Treasury) guarantee would reassure MBS buyers, leading to
a resumption of securitization, in turn encouraging lenders to make loans at more affordable rates.
But GSE participation would not reduce overall risk in the market, it would simply shift that risk
to the taxpayers. As house prices continue to fall, and delinquencies and foreclosures continue to
rise, the GSEs have lost billions of dollars and now depend on special support from the federal
government. The ultimate cost to taxpayers of this intervention is unknown.
If the current tightness in the mortgage market reflects an overreaction on the part of market
participants in the grip of panic, some argue that a higher conforming loan limit may be a useful
corrective and avert unnecessary damage to housing markets and the economy. On the other hand,
if market fundamentals dictate that home prices decline further, the assumption of more risk by
the GSEs (and, more or less implicitly, by the Treasury) could arguably slow the market
adjustment process and foster an unwelcome expectation in financial markets that investors will
be rescued from the consequences of their own mistakes.
21 Securities Industry and Financial Markets Association (SIFMA), “U.S. Mortgage-Related Issuance and
Outstanding,” available at http://www.sifma.org/uploadedFiles/Research/Statistics/StatisticsFiles/SF-US-Mortgage-
Related-SIFMA.xls?n=05272.

The Conforming Loan Limit
Congressional Research Service 7
Appendix. Previous Conforming Loan Limits
Table A-1. Conforming Loan Limits in Selected Areas
High-Cost Housing Area Loan Limit
Applies to Mortgages Originated
Between
July 1, 2007
to Dec. 31,
2008
Jan. 1, 2009
to Feb. 16,
2009
Jan. 1, 2009
to Dec. 31,
2009
(See note)
Jan. 1, 2010
to Sept. 30,
2011
Oct. 1, 2011
to present
Mortgages Purchased Between
Feb. 13, 2008
to Dec. 31,
2009
Jan. 1, 2009
to Feb. 16,
2009
Feb. 17, 2009
to Dec. 31,
2009
Jan. 1, 2010
to Sept. 30,
2011
Oct. 1, 2011
to present
High Cost Area Limit is Lesser of:
—Percentage of Area Median 125% 115% 125% 125% 115%
—Percentage of 2008 Limit 175% 150% 175% 175% 150%
Barnstable Town, MA $462,500 $417,000 $462,500 $462,500 $417,000
Boston/Quincy/Cambridge, MA $523,750 $465,750 $523,750 $523,750 $465,750
Boulder, CO $460,000 $417,000 $460,000 $460,000 $417,000
Bridgeport/Stamford/Norwalk, CT $708,750 $511,750 $708,750 $708,750 $575,000
Los Angeles/Long Beach/Santa Ana,
CA
$729,750 $625,500 $729,750 $729,750 $625,500
Miami/Ft. Lauderdale, FL $423,750 $417,000 $423,750 $423,750 $417,000
New York City/N. NJ/Long Island,
NY/NJ
$729,750 $625,500 $729,750 $729,750 $625,500
Newark/Union, NJ $729,750 $625,500 $729,750 $729,750 $625,500
Riverside/San Bernardino, CA $500,000 $417,000 $500,000 $500,000 $417,000
Sacramento/Arden/Arcade/Rosedale,
CA
$580,000 $474,950 $580,000 $580,000 $580,000
San Diego/Carlsbad/San Marcos, CA $697,500 $546,250 $697,500 $697,500 $546,250
San Francisco/Oakland, CA $729,750 $625,500 $729,750 $729,750 $625,500
San Jose/Sunnyvale/Santa Clara, CA $729,750 $625,500 $729,750 $729,750 $625,500
Seattle/Tacoma/Bellevue, WA $567,500 $506,000 $567,500 $567,500 $506,000
Washington, DC/MD/VA $729,750 $625,500 $729,750 $729,750 $625,500
Source: Loan limits (P.L. 110-185) are from Federal Housing Finance Agency, Conforming Loan Limit, available at
http://www.fhfa.gov/Default.aspx?Page=185.
Notes: ARRA raised the high-cost conforming loan limit on mortgages originated in calendar 2009. The
Continuing Appropriations Act of 2011 (P.L. 111-242) extended the limits that were previously extended in the
FY2010 Interior Appropriations (P.L. 111-88).

The Conforming Loan Limit
Congressional Research Service RS22172 · VERSION 30 · UPDATED 8
Author Information
N. Eric Weiss
Specialist in Financial Economics
Sean M. Hoskins
Analyst in Financial Economics
Acknowledgments
This report depends greatly on previous versions that were written and updated by Mark Jickling, who has
retired from the Congressional Research Service.
Disclaimer
This document was prepared by the Congressional Research Service (CRS). CRS serves as nonpartisan
shared staff to congressional committees and Members of Congress. It operates solely at the behest of and
under the direction of Congress. Information in a CRS Report should not be relied upon for purposes other
than public understanding of information that has been provided by CRS to Members of Congress in
connection with CRS’s institutional role. CRS Reports, as a work of the United States Government, are not
subject to copyright protection in the United States. Any CRS Report may be reproduced and distributed in
its entirety without permission from CRS. However, as a CRS Report may include copyrighted images or
material from a third party, you may need to obtain the permission of the copyright holder if you wish to
copy or otherwise use copyrighted material.