Embed Size (px)
Citation preview

The Condition of College & Career Readiness 2017National
NationalThe Condition of College & Career Readiness 2017
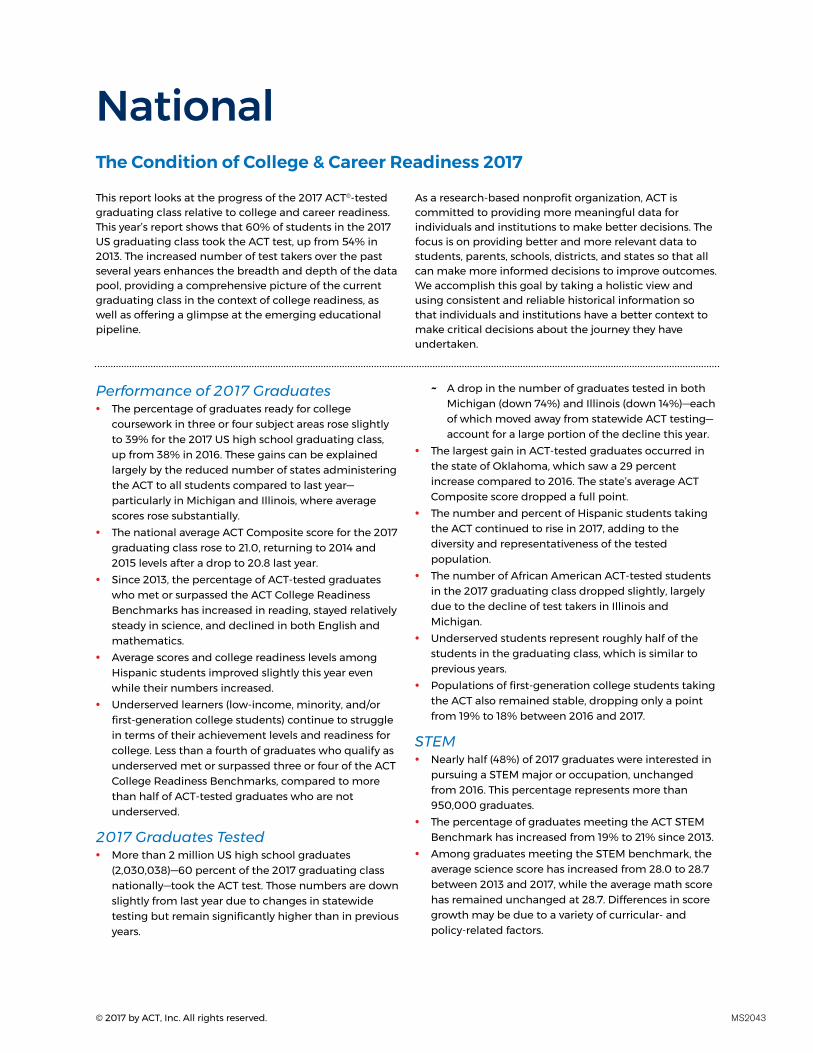
This report looks at the progress of the 2017 ACT®-tested graduating class relative to college and career readiness. This year’s report shows that 60% of students in the 2017 US graduating class took the ACT test, up from 54% in 2013. The increased number of test takers over the past several years enhances the breadth and depth of the data pool, providing a comprehensive picture of the current graduating class in the context of college readiness, as well as offering a glimpse at the emerging educational pipeline.
As a research-based nonprofit organization, ACT is committed to providing more meaningful data for individuals and institutions to make better decisions. The focus is on providing better and more relevant data to students, parents, schools, districts, and states so that all can make more informed decisions to improve outcomes. We accomplish this goal by taking a holistic view and using consistent and reliable historical information so that individuals and institutions have a better context to make critical decisions about the journey they have undertaken.
© 2017 by ACT, Inc. All rights reserved.
Performance of 2017 Graduates• The percentage of graduates ready for college
coursework in three or four subject areas rose slightly to 39% for the 2017 US high school graduating class, up from 38% in 2016. These gains can be explained largely by the reduced number of states administering the ACT to all students compared to last year—particularly in Michigan and Illinois, where average scores rose substantially.
• The national average ACT Composite score for the 2017 graduating class rose to 21.0, returning to 2014 and 2015 levels after a drop to 20.8 last year.
• Since 2013, the percentage of ACT-tested graduates who met or surpassed the ACT College Readiness Benchmarks has increased in reading, stayed relatively steady in science, and declined in both English and mathematics.
• Average scores and college readiness levels among Hispanic students improved slightly this year even while their numbers increased.
• Underserved learners (low-income, minority, and/or first-generation college students) continue to struggle in terms of their achievement levels and readiness for college. Less than a fourth of graduates who qualify as underserved met or surpassed three or four of the ACT College Readiness Benchmarks, compared to more than half of ACT-tested graduates who are not underserved.
2017 Graduates Tested• More than 2 million US high school graduates
(2,030,038)—60 percent of the 2017 graduating class nationally—took the ACT test. Those numbers are down slightly from last year due to changes in statewide testing but remain significantly higher than in previous years.
~ A drop in the number of graduates tested in both Michigan (down 74%) and Illinois (down 14%)—each of which moved away from statewide ACT testing—account for a large portion of the decline this year.
• The largest gain in ACT-tested graduates occurred in the state of Oklahoma, which saw a 29 percent increase compared to 2016. The state’s average ACT Composite score dropped a full point.
• The number and percent of Hispanic students taking the ACT continued to rise in 2017, adding to the diversity and representativeness of the tested population.
• The number of African American ACT-tested students in the 2017 graduating class dropped slightly, largely due to the decline of test takers in Illinois and Michigan.
• Underserved students represent roughly half of the students in the graduating class, which is similar to previous years.
• Populations of first-generation college students taking the ACT also remained stable, dropping only a point from 19% to 18% between 2016 and 2017.
STEM• Nearly half (48%) of 2017 graduates were interested in
pursuing a STEM major or occupation, unchanged from 2016. This percentage represents more than 950,000 graduates.
• The percentage of graduates meeting the ACT STEM Benchmark has increased from 19% to 21% since 2013.
• Among graduates meeting the STEM benchmark, the average science score has increased from 28.0 to 28.7 between 2013 and 2017, while the average math score has remained unchanged at 28.7. Differences in score growth may be due to a variety of curricular- and policy-related factors.
MS2043
NATIONAL 3
• Underserved students lag furthest behind their peers in the area of STEM. Only 2% of students meeting all three underserved criteria met the STEM benchmark, compared to 31% of those who are not considered underserved.
Career Readiness • Fewer than three in 10 ACT-tested 2017 graduates were
likely, based on their ACT Composite score, to attain an ACT WorkKeys® National Career Readiness Certificate® (NCRC®) at the Gold level (ACT Composite score of 25 or higher) or higher. Individuals at the Gold level have demonstrated the foundational work readiness skills needed for 93% of the jobs recently profiled in the ACT JobPro® database.
• Another 49% of 2017 graduates would be likely to earn a Silver-level NCRC, while 22% would be likely to earn a Bronze-level certificate. The remaining 3% would fall into the “Needs Improvement” category and would not be likely to earn an NCRC.
• The ACT Composite scores associated with a 50% chance of earning each ACT WorkKeys NCRC level or higher are: 13 for Bronze, 17 for Silver, 25 for Gold, and 35 for Platinum. Based on those cut scores, students who earned an ACT Composite score of less than 13 would be classified as “Needs Improvement,” 13 to 16 as ”Bronze,” 17 to 24 as ”Silver,” and 25 or above as “Gold or Higher.” For comparison, individual student score reports classify those who scored 12 to 13, 14 to 17, and 18 and higher as making progress toward Bronze, Silver, and Gold certificates.
Behaviors that Impact Access and Opportunity• Of 2017 ACT-tested graduates, 45% took the ACT two or
more times. This is a slight increase from 44% in 2016. On second testing, average ACT Composite scores in recent graduating classes have risen by nearly a point, compared to first testing. Similarly, more than half of all graduates who take the ACT at least twice see a Composite score gain from first to second testing.
• Nationally, 73% of 2017 ACT-tested graduates participated in the Educational Opportunity Service (EOS), thus allowing them to receive information about opportunities and programs available from colleges across the country.
• Among 2017 ACT-tested graduate records, 65% registered to send free score reports to one or more postsecondary institutions. This compares to 67% of 2016 graduates who registered to send free score reports. ACT encourages students to take advantage of free score report requests during registration.
• During the 2016-2017 academic year, 656,061 fee waivers were awarded to prospective ACT examinees. More than a fourth (28%) of these fee waivers were not used, suggesting that more than 180,000 eligible students missed out on an opportunity to take the ACT free of charge during the past year alone. Note: These numbers are based on fee waivers issued nationwide during this academic year, and not specific to the 2017 graduating class.
Pipeline• Among 2017 ACT-tested graduates, 82% aspired to
postsecondary education, slightly lower than 84% in 2016. Among 2016 ACT-tested graduates, only 64% actually did enroll in a postsecondary institution (2017 enrollment data is not yet available). This enrollment gap means that more than 400,000 of the 2016 graduates who aspired to postsecondary education did not end up enrolling.
• Four out of five 2017 graduates aspired to a two-year degree or higher, and three out of four aspired to a four-year degree or higher.
~ Between 2013 and 2017, the percentage of students reporting aspirations of a four-year degree or higher decreased from 80% to 75%.
• Health Sciences and Technologies continues to be the most popular college major choice among ACT-tested US high school graduates, beating the next-highest-named major (Business) by a nearly two-to-one margin.
• Though Business was the second-highest-named major, the number of students specifically indicating being undecided about major exceeded Business by nearly 95,000.
• Only 4 percent of 2017 graduates (80,873 students) expressed interest in an education major, the same percentage as last year. These numbers are aligned with the projected expansion of the current US teacher shortage to more than 100,000 educators by 2021.
College and Career Readiness Workshops• During the 2016-17 school year, ACT conducted 241 free
College and Career Readiness Workshops, registering more than 12,000 educators across the country.
~ Find out more at: http://www.act.org/content/act/en/act-events/college-and-career-readiness-workshops.html
4 THE CONDITION OF COLLEGE & CAREER READINESS 2017
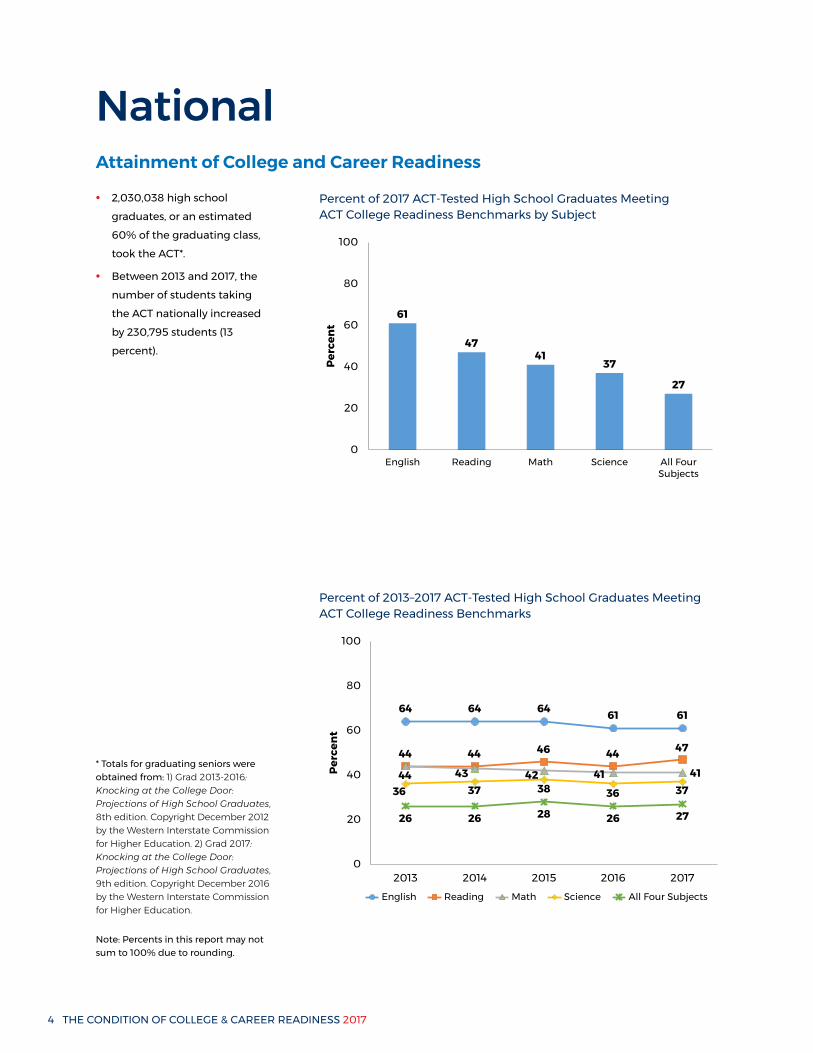
NationalAttainment of College and Career Readiness
Percent of 2017 ACT-Tested High School Graduates Meeting ACT College Readiness Benchmarks by Subject
61
4741
37
27
0
20
40
60
80
100
English Reading Math Science All FourSubjects
Perc
ent
Percent of 2013–2017 ACT-Tested High School Graduates Meeting ACT College Readiness Benchmarks
64 64 64 61 61
44 44 46 44 47
44 43 42 41 4136 37 38 36 37
26 26 28 26 27
0
20
40
60
80
100
2013 2014 2015 2016 2017
Perc
ent
English Reading Math Science All Four Subjects
• 2,030,038 high school graduates, or an estimated 60% of the graduating class, took the ACT*.
• Between 2013 and 2017, the number of students taking the ACT nationally increased by 230,795 students (13 percent).
* Totals for graduating seniors were obtained from: 1) Grad 2013-2016: Knocking at the College Door: Projections of High School Graduates, 8th edition. Copyright December 2012 by the Western Interstate Commission for Higher Education. 2) Grad 2017: Knocking at the College Door: Projections of High School Graduates, 9th edition. Copyright December 2016 by the Western Interstate Commission for Higher Education.
Note: Percents in this report may not sum to 100% due to rounding.
NATIONAL 5
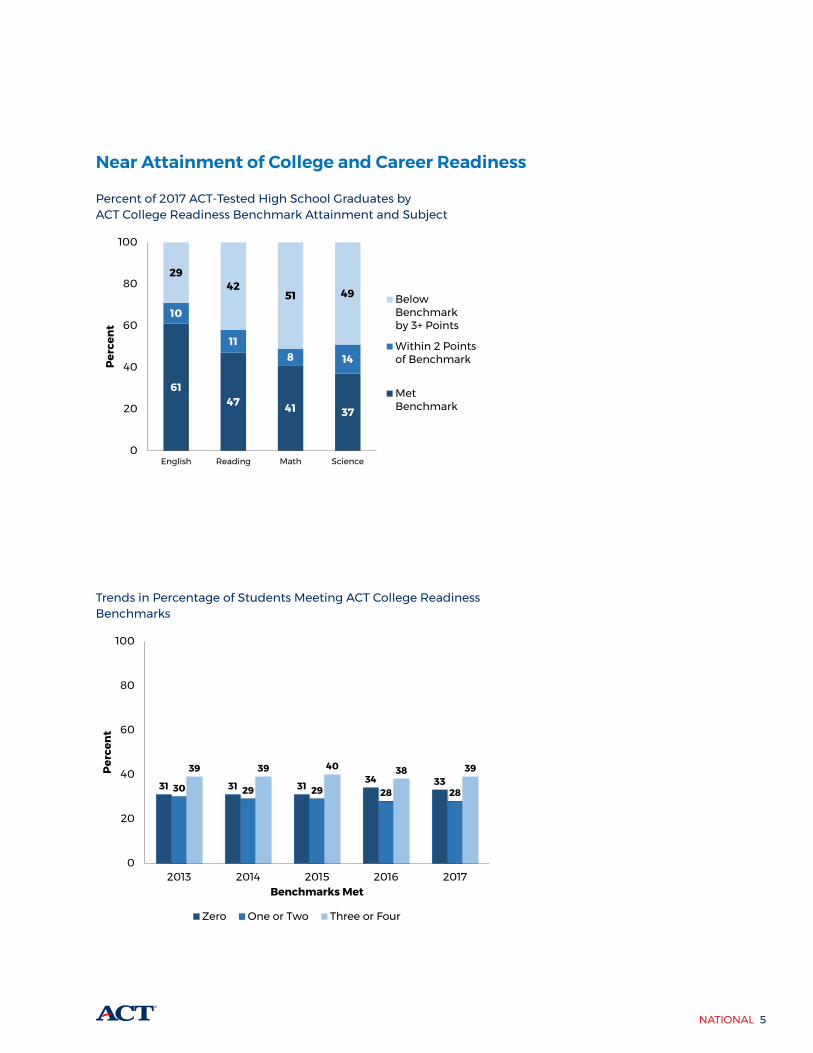
Near Attainment of College and Career Readiness
Percent of 2017 ACT-Tested High School Graduates by ACT College Readiness Benchmark Attainment and Subject
6147 41 37
10
118 14
2942
51 49
0
20
40
60
80
100
English Reading Math Science
Perc
ent
BelowBenchmarkby 3+ Points
Within 2 Pointsof Benchmark
MetBenchmark
Trends in Percentage of Students Meeting ACT College Readiness Benchmarks
31 31 31 34 3330 29 29 28 28
39 39 40 38 39
0
20
40
60
80
100
2013 2014 2015 2016 2017
Perc
ent
Benchmarks Met
Zero One or Two Three or Four
6 THE CONDITION OF COLLEGE & CAREER READINESS 2017
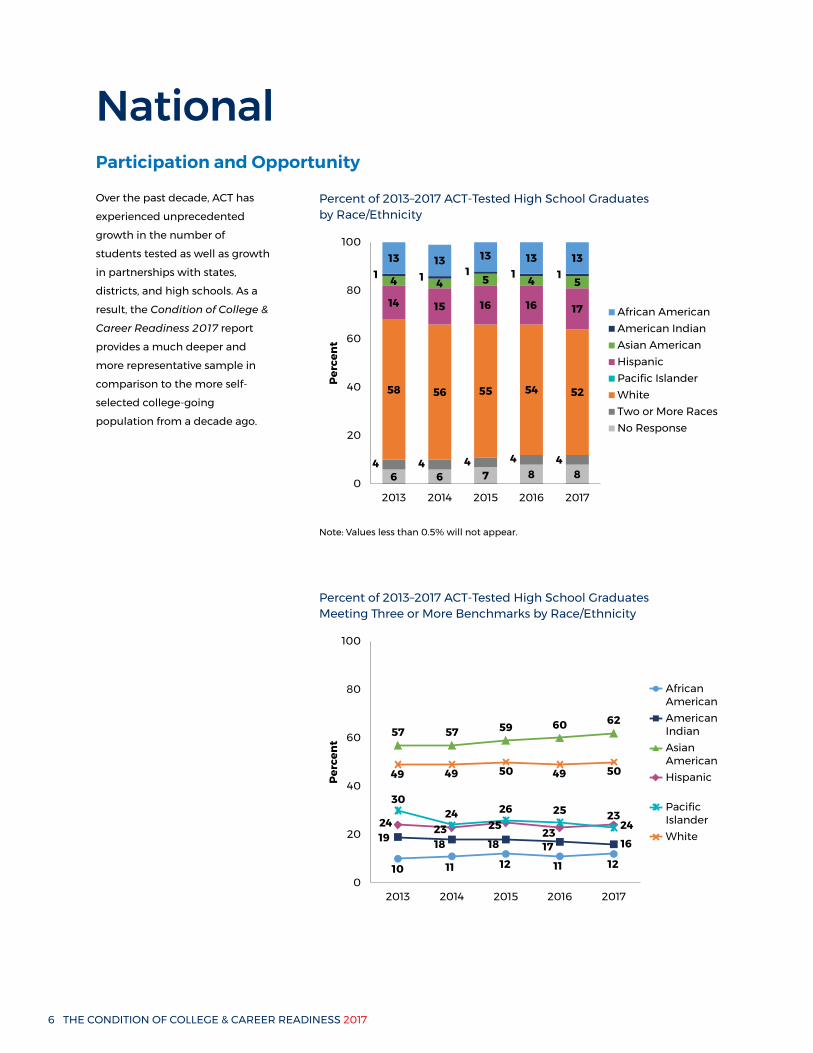
NationalParticipation and Opportunity
Over the past decade, ACT has experienced unprecedented growth in the number of students tested as well as growth in partnerships with states, districts, and high schools. As a result, the Condition of College & Career Readiness 2017 report provides a much deeper and more representative sample in comparison to the more self-selected college-going population from a decade ago.
Percent of 2013–2017 ACT-Tested High School Graduates by Race/Ethnicity
6 6 7 8 84 4 4 4 4
58 56 55 54 52
14 15 16 16 17
4 4 5 4 51 1 1 1 1
13 13 13 13 13
0
20
40
60
80
100
2013 2014 2015 2016 2017
Perc
ent
African AmericanAmerican IndianAsian AmericanHispanicPacific IslanderWhiteTwo or More RacesNo Response
Note: Values less than 0.5% will not appear.
Percent of 2013–2017 ACT-Tested High School Graduates Meeting Three or More Benchmarks by Race/Ethnicity
10 11 12 11 12
19 18 18 17 16
57 57 59 60 62
24 23 2523
24
3024 26 25 23
49 49 50 49 50
0
20
40
60
80
100
2013 2014 2015 2016 2017
Perc
ent
African American American Indian Asian American Hispanic
Pacific Islander White
NATIONAL 7
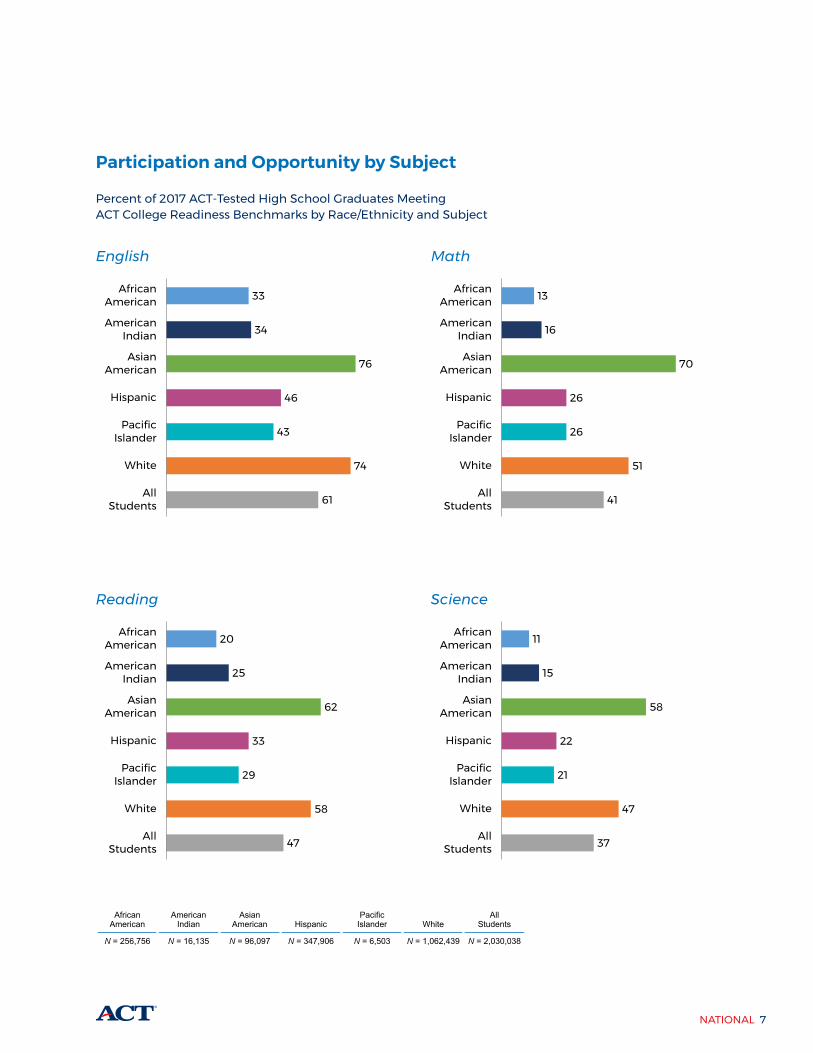
Participation and Opportunity by Subject
Percent of 2017 ACT-Tested High School Graduates Meeting ACT College Readiness Benchmarks by Race/Ethnicity and Subject
English
61
74
43
46
76
34
33
AllStudents
White
PacificIslander
Hispanic
AsianAmerican
AmericanIndian
AfricanAmerican
Math
41
51
26
26
70
16
13
AllStudents
White
PacificIslander
Hispanic
AsianAmerican
AmericanIndian
AfricanAmerican
Reading
47
58
29
33
62
25
20
AllStudents
White
PacificIslander
Hispanic
AsianAmerican
AmericanIndian
AfricanAmerican
Science
37
47
21
22
58
15
11
AllStudents
White
PacificIslander
Hispanic
AsianAmerican
AmericanIndian
AfricanAmerican
African American
American Indian
Asian American
Hispanic
Pacific Islander
White
All Students
N = 256,756 N = 16,135 N = 96,097 N = 347,906 N = 6,503 N = 1,062,439 N = 2,030,038
8 THE CONDITION OF COLLEGE & CAREER READINESS 2017
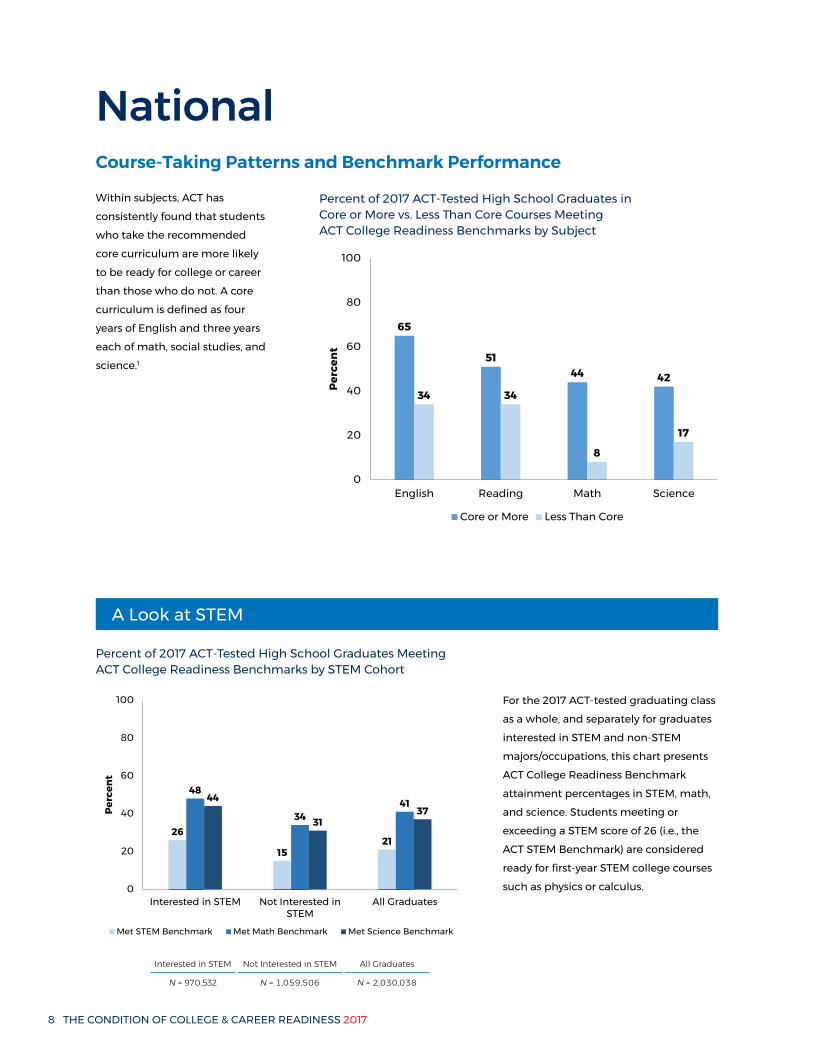
NationalCourse-Taking Patterns and Benchmark Performance
Within subjects, ACT has consistently found that students who take the recommended core curriculum are more likely to be ready for college or career than those who do not. A core curriculum is defined as four years of English and three years each of math, social studies, and science.1
Percent of 2017 ACT-Tested High School Graduates in Core or More vs. Less Than Core Courses Meeting ACT College Readiness Benchmarks by Subject
65
5144 42
34 34
8
17
0
20
40
60
80
100
English Reading Math Science
Perc
ent
Core or More Less Than Core
A Look at STEM
Percent of 2017 ACT-Tested High School Graduates Meeting ACT College Readiness Benchmarks by STEM Cohort
26
1521
48
344144
3137
0
20
40
60
80
100
Interested in STEM Not Interested inSTEM
All Graduates
Perc
ent
Met STEM Benchmark Met Math Benchmark Met Science Benchmark
For the 2017 ACT-tested graduating class as a whole, and separately for graduates interested in STEM and non-STEM majors/occupations, this chart presents ACT College Readiness Benchmark attainment percentages in STEM, math, and science. Students meeting or exceeding a STEM score of 26 (i.e., the ACT STEM Benchmark) are considered ready for first-year STEM college courses such as physics or calculus.
Interested in STEM Not Interested in STEM All Graduates
N = 970,532 N = 1,059,506 N = 2,030,038
NATIONAL 9
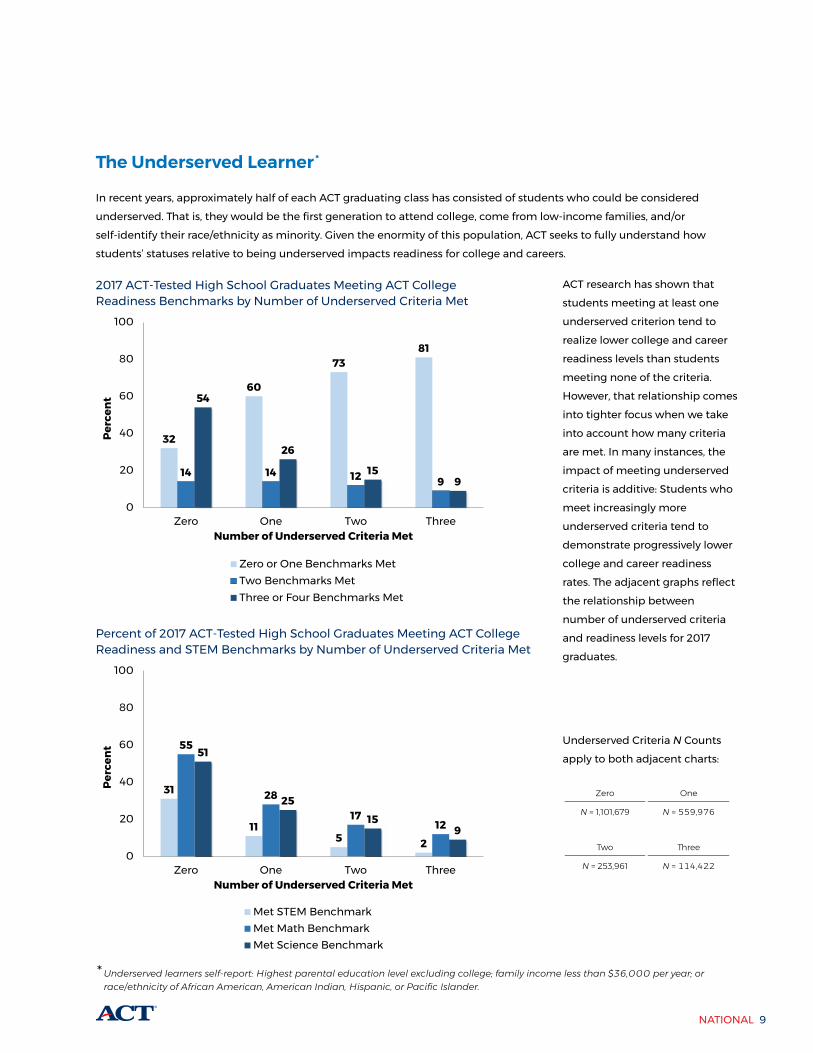
The Underserved Learner*
In recent years, approximately half of each ACT graduating class has consisted of students who could be considered underserved. That is, they would be the first generation to attend college, come from low-income families, and/or self-identify their race/ethnicity as minority. Given the enormity of this population, ACT seeks to fully understand how students’ statuses relative to being underserved impacts readiness for college and careers.
2017 ACT-Tested High School Graduates Meeting ACT College Readiness Benchmarks by Number of Underserved Criteria Met
32
60
7381
14 14 12 9
54
26
159
0
20
40
60
80
100
Zero One Two Three
Perc
ent
Number of Underserved Criteria Met
Zero or One Benchmarks MetTwo Benchmarks MetThree or Four Benchmarks Met
Percent of 2017 ACT-Tested High School Graduates Meeting ACT College Readiness and STEM Benchmarks by Number of Underserved Criteria Met
31
115 2
55
28
1712
51
2515
9
0
20
40
60
80
100
Zero One Two Three
Perc
ent
Number of Underserved Criteria Met
Met STEM BenchmarkMet Math BenchmarkMet Science Benchmark
ACT research has shown that students meeting at least one underserved criterion tend to realize lower college and career readiness levels than students meeting none of the criteria. However, that relationship comes into tighter focus when we take into account how many criteria are met. In many instances, the impact of meeting underserved criteria is additive: Students who meet increasingly more underserved criteria tend to demonstrate progressively lower college and career readiness rates. The adjacent graphs reflect the relationship between number of underserved criteria and readiness levels for 2017 graduates.
Underserved Criteria N Counts apply to both adjacent charts:
* Underserved learners self-report: Highest parental education level excluding college; family income less than $36,000 per year; or race/ethnicity of African American, American Indian, Hispanic, or Pacific Islander.
Zero One
N = 1,101,679 N = 559,976
Two Three
N = 253,961 N = 114,422
10 THE CONDITION OF COLLEGE & CAREER READINESS 2017
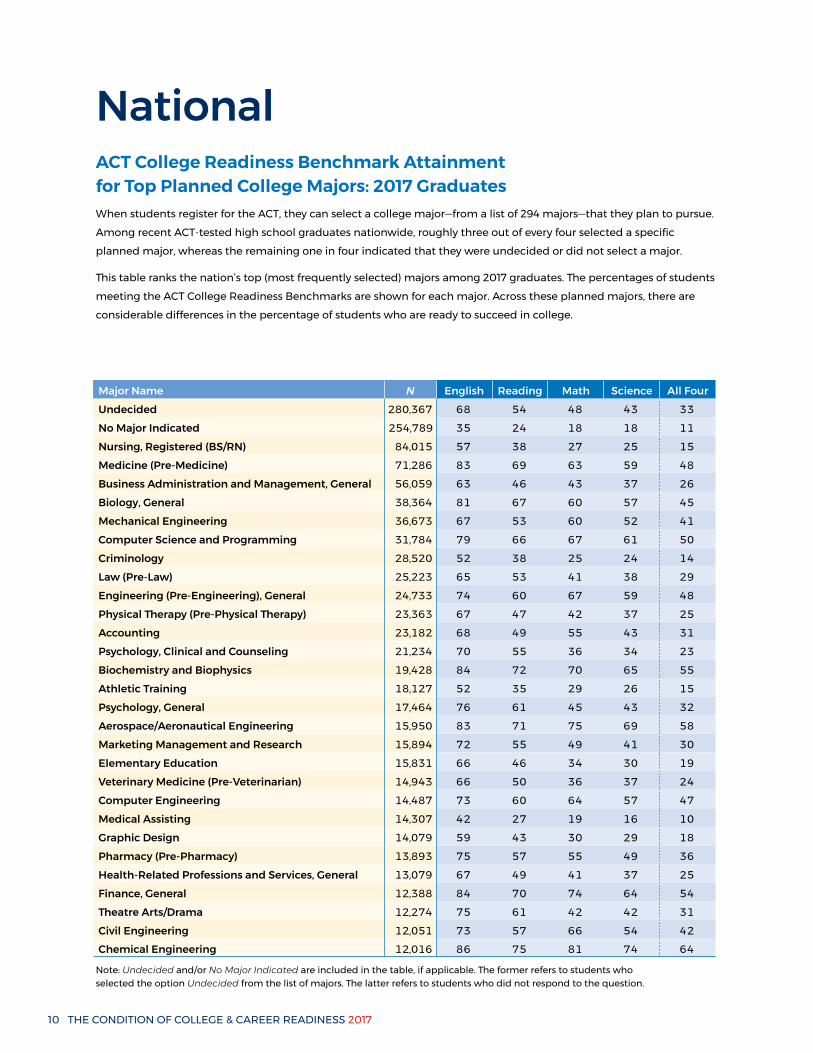
NationalACT College Readiness Benchmark Attainment for Top Planned College Majors: 2017 GraduatesWhen students register for the ACT, they can select a college major—from a list of 294 majors—that they plan to pursue. Among recent ACT-tested high school graduates nationwide, roughly three out of every four selected a specific planned major, whereas the remaining one in four indicated that they were undecided or did not select a major.
This table ranks the nation’s top (most frequently selected) majors among 2017 graduates. The percentages of students meeting the ACT College Readiness Benchmarks are shown for each major. Across these planned majors, there are considerable differences in the percentage of students who are ready to succeed in college.
Major Name N English Reading Math Science All FourUndecided 280,367 68 54 48 43 33No Major Indicated 254,789 35 24 18 18 11Nursing, Registered (BS/RN) 84,015 57 38 27 25 15Medicine (Pre-Medicine) 71,286 83 69 63 59 48Business Administration and Management, General 56,059 63 46 43 37 26Biology, General 38,364 81 67 60 57 45Mechanical Engineering 36,673 67 53 60 52 41Computer Science and Programming 31,784 79 66 67 61 50Criminology 28,520 52 38 25 24 14Law (Pre-Law) 25,223 65 53 41 38 29Engineering (Pre-Engineering), General 24,733 74 60 67 59 48Physical Therapy (Pre-Physical Therapy) 23,363 67 47 42 37 25Accounting 23,182 68 49 55 43 31Psychology, Clinical and Counseling 21,234 70 55 36 34 23Biochemistry and Biophysics 19,428 84 72 70 65 55Athletic Training 18,127 52 35 29 26 15Psychology, General 17,464 76 61 45 43 32Aerospace/Aeronautical Engineering 15,950 83 71 75 69 58Marketing Management and Research 15,894 72 55 49 41 30Elementary Education 15,831 66 46 34 30 19Veterinary Medicine (Pre-Veterinarian) 14,943 66 50 36 37 24Computer Engineering 14,487 73 60 64 57 47Medical Assisting 14,307 42 27 19 16 10Graphic Design 14,079 59 43 30 29 18Pharmacy (Pre-Pharmacy) 13,893 75 57 55 49 36Health-Related Professions and Services, General 13,079 67 49 41 37 25Finance, General 12,388 84 70 74 64 54Theatre Arts/Drama 12,274 75 61 42 42 31Civil Engineering 12,051 73 57 66 54 42Chemical Engineering 12,016 86 75 81 74 64
Note: Undecided and/or No Major Indicated are included in the table, if applicable. The former refers to students who selected the option Undecided from the list of majors. The latter refers to students who did not respond to the question.
NATIONAL 11
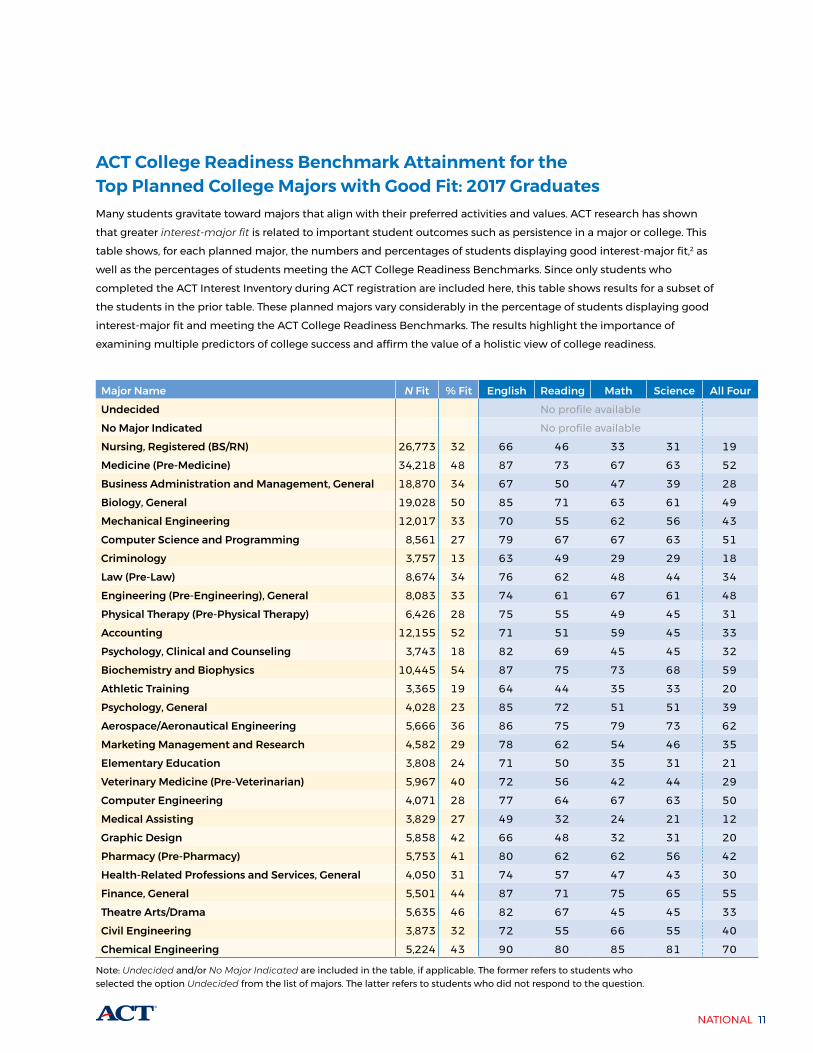
ACT College Readiness Benchmark Attainment for the Top Planned College Majors with Good Fit: 2017 GraduatesMany students gravitate toward majors that align with their preferred activities and values. ACT research has shown that greater interest-major fit is related to important student outcomes such as persistence in a major or college. This table shows, for each planned major, the numbers and percentages of students displaying good interest-major fit,2 as well as the percentages of students meeting the ACT College Readiness Benchmarks. Since only students who completed the ACT Interest Inventory during ACT registration are included here, this table shows results for a subset of the students in the prior table. These planned majors vary considerably in the percentage of students displaying good interest-major fit and meeting the ACT College Readiness Benchmarks. The results highlight the importance of examining multiple predictors of college success and affirm the value of a holistic view of college readiness.
Major Name N Fit % Fit English Reading Math Science All FourUndecided No profile availableNo Major Indicated No profile availableNursing, Registered (BS/RN) 26,773 32 66 46 33 31 19Medicine (Pre-Medicine) 34,218 48 87 73 67 63 52Business Administration and Management, General 18,870 34 67 50 47 39 28Biology, General 19,028 50 85 71 63 61 49Mechanical Engineering 12,017 33 70 55 62 56 43Computer Science and Programming 8,561 27 79 67 67 63 51Criminology 3,757 13 63 49 29 29 18Law (Pre-Law) 8,674 34 76 62 48 44 34Engineering (Pre-Engineering), General 8,083 33 74 61 67 61 48Physical Therapy (Pre-Physical Therapy) 6,426 28 75 55 49 45 31Accounting 12,155 52 71 51 59 45 33Psychology, Clinical and Counseling 3,743 18 82 69 45 45 32Biochemistry and Biophysics 10,445 54 87 75 73 68 59Athletic Training 3,365 19 64 44 35 33 20Psychology, General 4,028 23 85 72 51 51 39Aerospace/Aeronautical Engineering 5,666 36 86 75 79 73 62Marketing Management and Research 4,582 29 78 62 54 46 35Elementary Education 3,808 24 71 50 35 31 21Veterinary Medicine (Pre-Veterinarian) 5,967 40 72 56 42 44 29Computer Engineering 4,071 28 77 64 67 63 50Medical Assisting 3,829 27 49 32 24 21 12Graphic Design 5,858 42 66 48 32 31 20Pharmacy (Pre-Pharmacy) 5,753 41 80 62 62 56 42Health-Related Professions and Services, General 4,050 31 74 57 47 43 30Finance, General 5,501 44 87 71 75 65 55Theatre Arts/Drama 5,635 46 82 67 45 45 33Civil Engineering 3,873 32 72 55 66 55 40Chemical Engineering 5,224 43 90 80 85 81 70
Note: Undecided and/or No Major Indicated are included in the table, if applicable. The former refers to students who selected the option Undecided from the list of majors. The latter refers to students who did not respond to the question.
12 THE CONDITION OF COLLEGE & CAREER READINESS 2017
NationalOther College and Career Readiness Factors
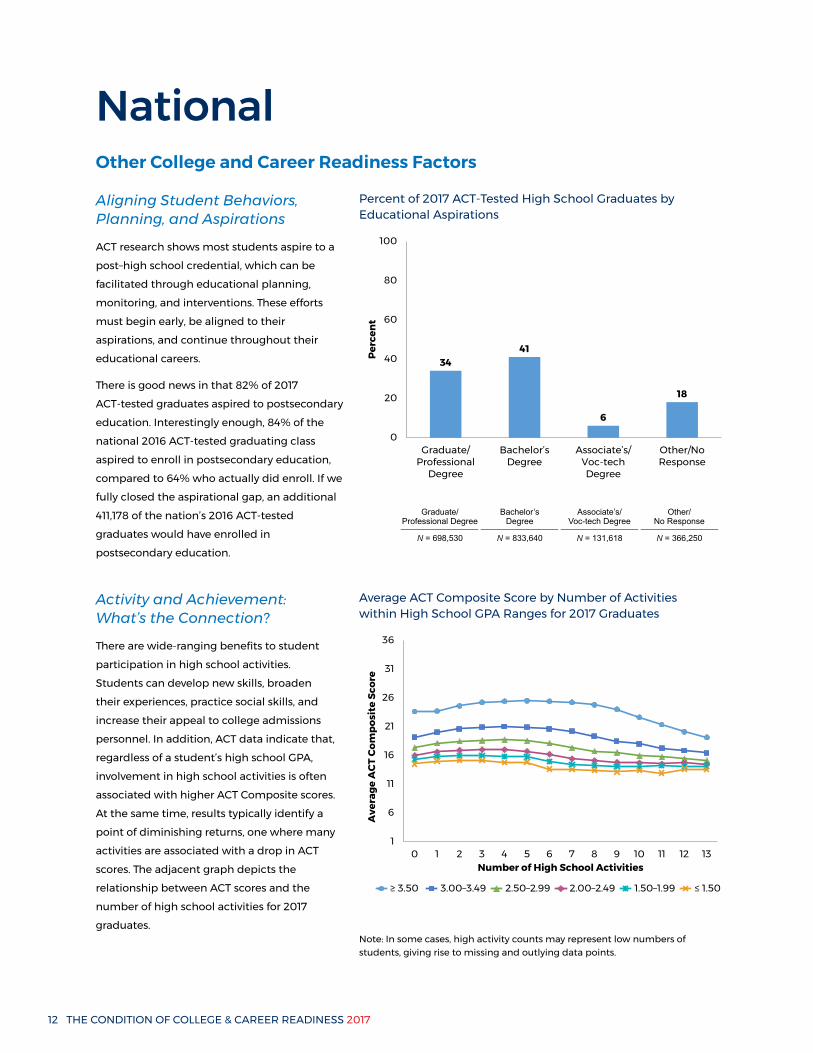
Aligning Student Behaviors, Planning, and Aspirations
ACT research shows most students aspire to a post–high school credential, which can be facilitated through educational planning, monitoring, and interventions. These efforts must begin early, be aligned to their aspirations, and continue throughout their educational careers.
There is good news in that 82% of 2017 ACT-tested graduates aspired to postsecondary education. Interestingly enough, 84% of the national 2016 ACT-tested graduating class aspired to enroll in postsecondary education, compared to 64% who actually did enroll. If we fully closed the aspirational gap, an additional 411,178 of the nation’s 2016 ACT-tested graduates would have enrolled in postsecondary education.
Percent of 2017 ACT-Tested High School Graduates by Educational Aspirations
3441
6
18
0
20
40
60
80
100
Graduate/Professional
Degree
Bachelor’sDegree
Associate’s/Voc-tech Degree
Other/NoResponse
Perc
ent
Graduate/ Professional Degree
Bachelor’s Degree
Associate’s/ Voc-tech Degree
Other/ No Response
N = 698,530 N = 833,640 N = 131,618 N = 366,250
Average ACT Composite Score by Number of Activities within High School GPA Ranges for 2017 Graduates
Note: In some cases, high activity counts may represent low numbers of students, giving rise to missing and outlying data points.
1
6
11
16
21
26
31
36
0 1 2 3 4 5 6 7 8 9 10 11 12 13
Ave
rage
ACT
Com
posi
te S
core
Number of High School Activities
≥ 3.50 3.00–3.49 2.50–2.99 2.00–2.49 1.50–1.99 ≤ 1.50
Activity and Achievement: What’s the Connection?
There are wide-ranging benefits to student participation in high school activities. Students can develop new skills, broaden their experiences, practice social skills, and increase their appeal to college admissions personnel. In addition, ACT data indicate that, regardless of a student’s high school GPA, involvement in high school activities is often associated with higher ACT Composite scores. At the same time, results typically identify a point of diminishing returns, one where many activities are associated with a drop in ACT scores. The adjacent graph depicts the relationship between ACT scores and the number of high school activities for 2017 graduates.
Other College and Career Readiness Factors
Early Prediction of High School Outcomes
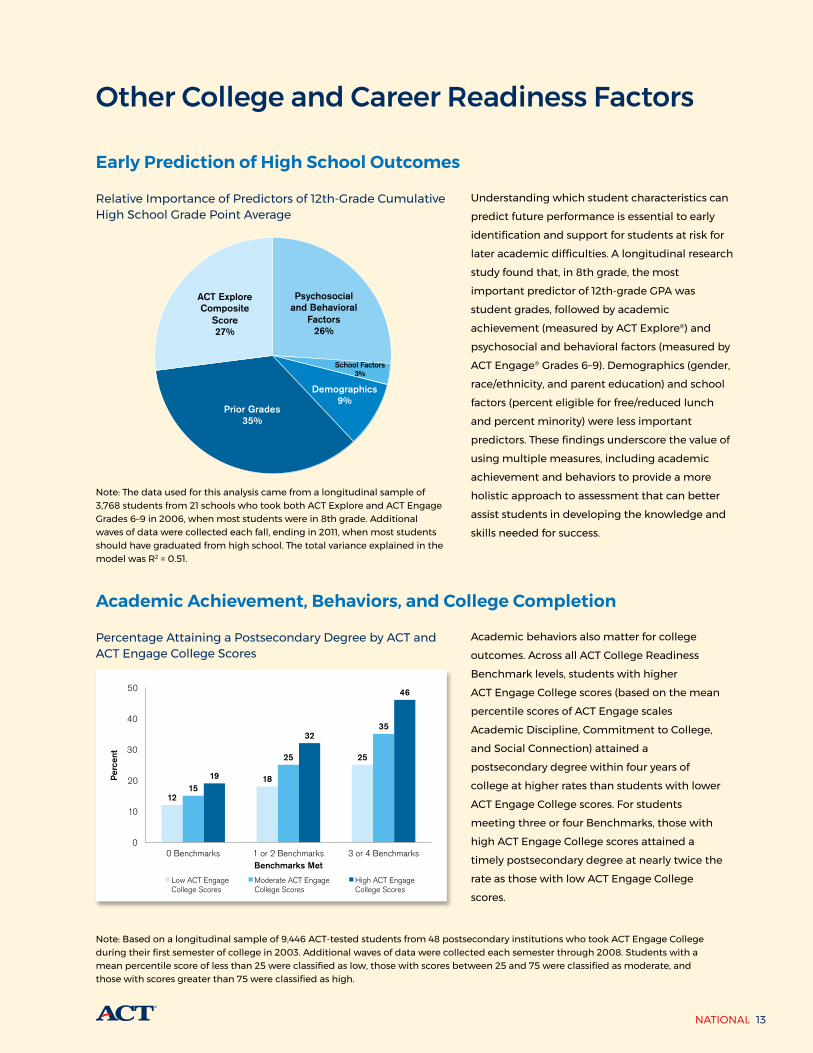
Understanding which student characteristics can predict future performance is essential to early identification and support for students at risk for later academic difficulties. A longitudinal research study found that, in 8th grade, the most important predictor of 12th-grade GPA was student grades, followed by academic achievement (measured by ACT Explore®) and psychosocial and behavioral factors (measured by ACT Engage® Grades 6–9). Demographics (gender, race/ethnicity, and parent education) and school factors (percent eligible for free/reduced lunch and percent minority) were less important predictors. These findings underscore the value of using multiple measures, including academic achievement and behaviors to provide a more holistic approach to assessment that can better assist students in developing the knowledge and skills needed for success.
Relative Importance of Predictors of 12th-Grade Cumulative High School Grade Point Average
Psychosocial and Behavioral
Factors 26%
School Factors 3%
Demographics 9%
Prior Grades 35%
ACT Explore Composite
Score 27%
Note: The data used for this analysis came from a longitudinal sample of 3,768 students from 21 schools who took both ACT Explore and ACT Engage Grades 6–9 in 2006, when most students were in 8th grade. Additional waves of data were collected each fall, ending in 2011, when most students should have graduated from high school. The total variance explained in the model was R2 = 0.51.
Academic Achievement, Behaviors, and College Completion
Academic behaviors also matter for college outcomes. Across all ACT College Readiness Benchmark levels, students with higher ACT Engage College scores (based on the mean percentile scores of ACT Engage scales Academic Discipline, Commitment to College, and Social Connection) attained a postsecondary degree within four years of college at higher rates than students with lower ACT Engage College scores. For students meeting three or four Benchmarks, those with high ACT Engage College scores attained a timely postsecondary degree at nearly twice the rate as those with low ACT Engage College scores.
Percentage Attaining a Postsecondary Degree by ACT and ACT Engage College Scores
12
18
25
15
25
35
19
32
46
0
10
20
30
40
50
0 Benchmarks 3 or 4 Benchmarks
Per
cent
1 or 2 Benchmarks Benchmarks Met
Low ACT Engage College Scores
Moderate ACT Engage College Scores
High ACT Engage College Scores
Note: Based on a longitudinal sample of 9,446 ACT-tested students from 48 postsecondary institutions who took ACT Engage College during their first semester of college in 2003. Additional waves of data were collected each semester through 2008. Students with a mean percentile score of less than 25 were classified as low, those with scores between 25 and 75 were classified as moderate, and those with scores greater than 75 were classified as high.
13NATIONAL
14 THE CONDITION OF COLLEGE & CAREER READINESS 2017
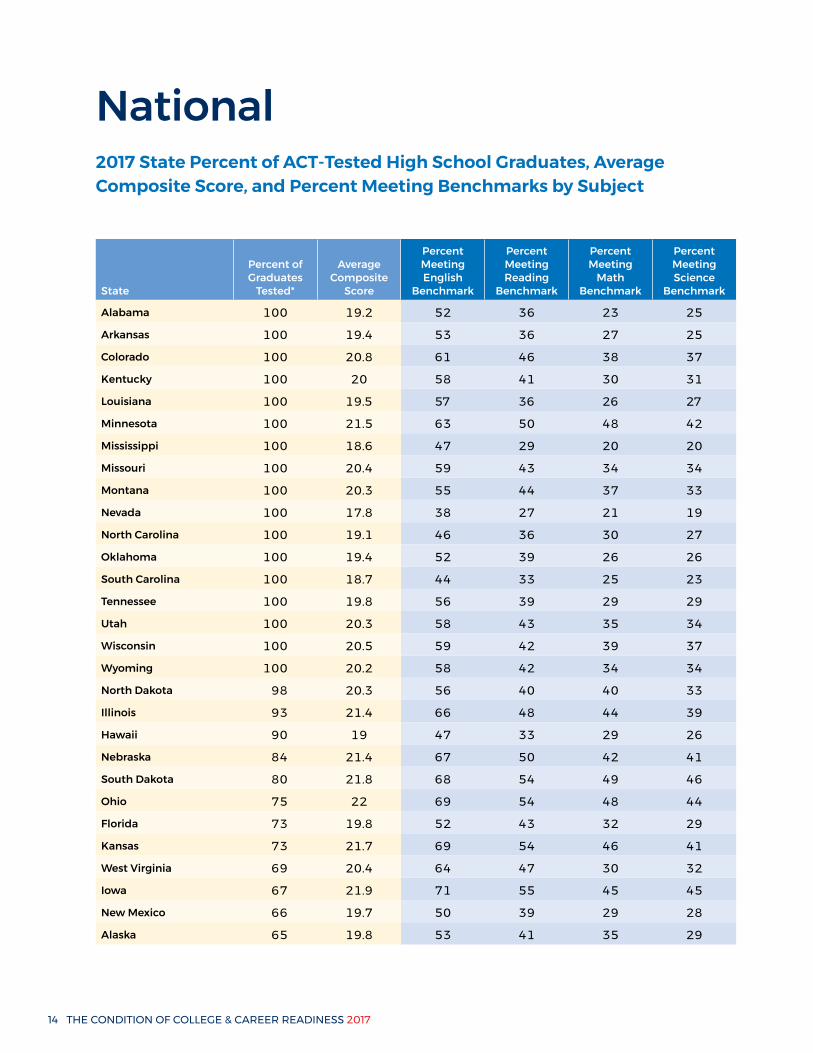
National2017 State Percent of ACT-Tested High School Graduates, Average Composite Score, and Percent Meeting Benchmarks by Subject
State
Percent of Graduates
Tested*
Average Composite
Score
Percent Meeting English
Benchmark
Percent Meeting Reading
Benchmark
Percent Meeting
Math Benchmark
Percent Meeting Science
Benchmark
Alabama 100 19.2 52 36 23 25
Arkansas 100 19.4 53 36 27 25
Colorado 100 20.8 61 46 38 37
Kentucky 100 20 58 41 30 31
Louisiana 100 19.5 57 36 26 27
Minnesota 100 21.5 63 50 48 42
Mississippi 100 18.6 47 29 20 20
Missouri 100 20.4 59 43 34 34
Montana 100 20.3 55 44 37 33
Nevada 100 17.8 38 27 21 19
North Carolina 100 19.1 46 36 30 27
Oklahoma 100 19.4 52 39 26 26
South Carolina 100 18.7 44 33 25 23
Tennessee 100 19.8 56 39 29 29
Utah 100 20.3 58 43 35 34
Wisconsin 100 20.5 59 42 39 37
Wyoming 100 20.2 58 42 34 34
North Dakota 98 20.3 56 40 40 33
Illinois 93 21.4 66 48 44 39
Hawaii 90 19 47 33 29 26
Nebraska 84 21.4 67 50 42 41
South Dakota 80 21.8 68 54 49 46
Ohio 75 22 69 54 48 44
Florida 73 19.8 52 43 32 29
Kansas 73 21.7 69 54 46 41
West Virginia 69 20.4 64 47 30 32
Iowa 67 21.9 71 55 45 45
New Mexico 66 19.7 50 39 29 28
Alaska 65 19.8 53 41 35 29
NATIONAL 15
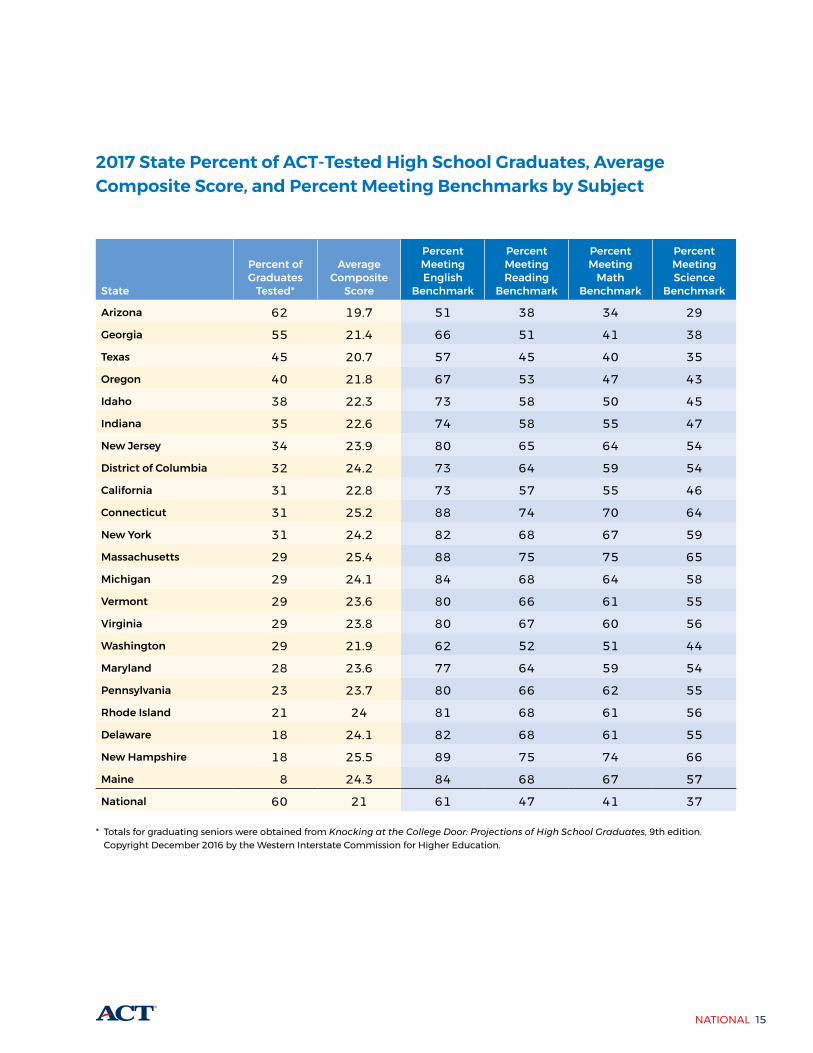
2017 State Percent of ACT-Tested High School Graduates, Average Composite Score, and Percent Meeting Benchmarks by Subject
State
Percent of Graduates
Tested*
Average Composite
Score
Percent Meeting English
Benchmark
Percent Meeting Reading
Benchmark
Percent Meeting
Math Benchmark
Percent Meeting Science
Benchmark
Arizona 62 19.7 51 38 34 29
Georgia 55 21.4 66 51 41 38
Texas 45 20.7 57 45 40 35
Oregon 40 21.8 67 53 47 43
Idaho 38 22.3 73 58 50 45
Indiana 35 22.6 74 58 55 47
New Jersey 34 23.9 80 65 64 54
District of Columbia 32 24.2 73 64 59 54
California 31 22.8 73 57 55 46
Connecticut 31 25.2 88 74 70 64
New York 31 24.2 82 68 67 59
Massachusetts 29 25.4 88 75 75 65
Michigan 29 24.1 84 68 64 58
Vermont 29 23.6 80 66 61 55
Virginia 29 23.8 80 67 60 56
Washington 29 21.9 62 52 51 44
Maryland 28 23.6 77 64 59 54
Pennsylvania 23 23.7 80 66 62 55
Rhode Island 21 24 81 68 61 56
Delaware 18 24.1 82 68 61 55
New Hampshire 18 25.5 89 75 74 66
Maine 8 24.3 84 68 67 57
National 60 21 61 47 41 37
* Totals for graduating seniors were obtained from Knocking at the College Door: Projections of High School Graduates, 9th edition. Copyright December 2016 by the Western Interstate Commission for Higher Education.
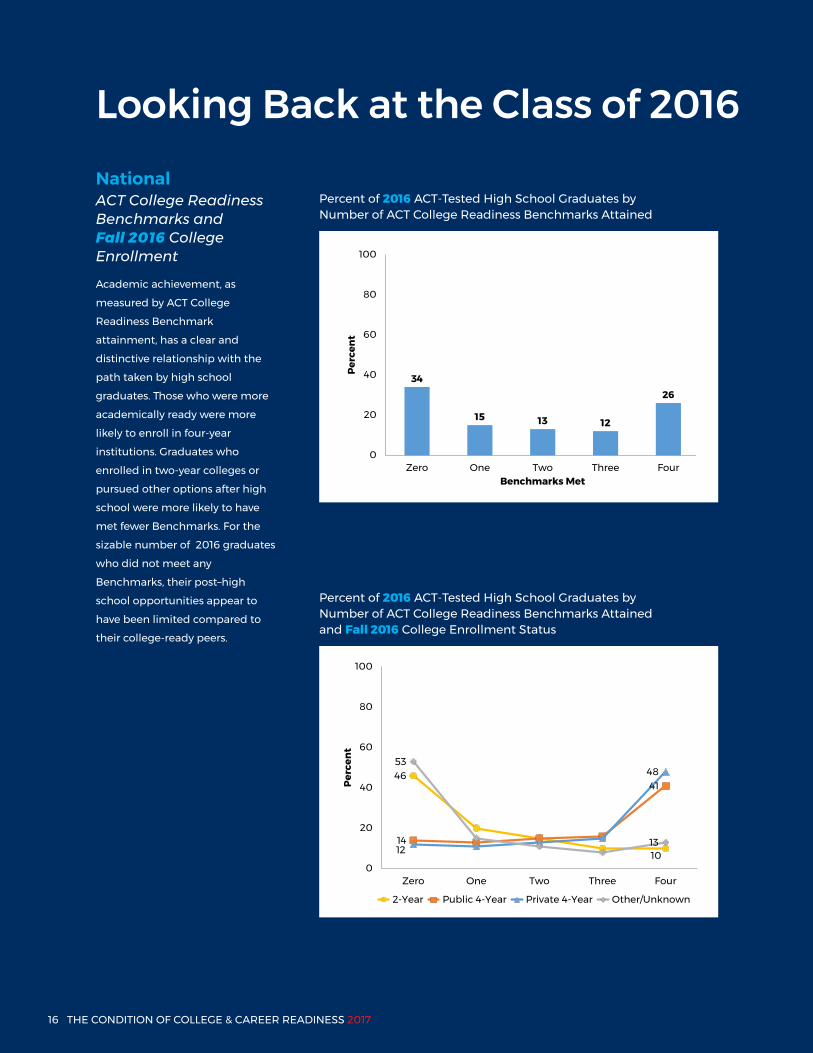
Looking Back at the Class of 2016NationalACT College Readiness Benchmarks and Fall 2016 College Enrollment
Academic achievement, as measured by ACT College Readiness Benchmark attainment, has a clear and distinctive relationship with the path taken by high school graduates. Those who were more academically ready were more likely to enroll in four-year institutions. Graduates who enrolled in two-year colleges or pursued other options after high school were more likely to have met fewer Benchmarks. For the sizable number of 2016 graduates who did not meet any Benchmarks, their post–high school opportunities appear to have been limited compared to their college-ready peers.
Percent of 2016 ACT-Tested High School Graduates by Number of ACT College Readiness Benchmarks Attained
34
15 13 12
26
0
20
40
60
80
100
Zero One Two Three Four
Perc
ent
Benchmarks Met
Percent of 2016 ACT-Tested High School Graduates by Number of ACT College Readiness Benchmarks Attained and Fall 2016 College Enrollment Status
46
1014
41
12
4853
13
0
20
40
60
80
100
Zero One Two Three Four
Perc
ent
2-Year Public 4-Year Private 4-Year Other/Unknown
16 THE CONDITION OF COLLEGE & CAREER READINESS 2017
NATIONAL 17
Recommendations1. Use a holistic assessment model for school accountability that measures student readiness for college and
career across multiple domains. While it is essential to measure students’ academic achievement in assessing college and career readiness, it is not enough. Social and emotional learning skills are important and measurable, and they can be impacted. Assessment models should take into account core academic skills, behavioral skills, cross-cutting capabilities, and education and career navigation skills to provide an integrated picture of college and work readiness.
2. Make special efforts to ensure that underrepresented students have equal access and opportunity to pursue postsecondary education. According to ACT research, most underrepresented students want to continue their education after high school, but they face many barriers. Ensuring they have access to the same rigorous core curriculum as others is just one step. Many also lack the resources, information, and familial and peer support they need to prepare for success after high school. Special efforts must be made to level the playing field for underrepresented students so they have equal opportunity to succeed.
3. Increase emphasis on STEM readiness initiatives, measures, and programs. With technology advancing rapidly, the importance of STEM readiness is only increasing. The threat of robotic and computer-assisted technologies eliminating jobs is growing while the remaining and emerging jobs will likely require higher-level skills. ACT data continue to show that many graduates are not ready. Without improvement in STEM readiness, far too many will be ill-prepared for the future workforce.
4. Focus on fewer, higher, and clearer learning standards in K–12 schools. Far too many students continue to graduate from high school without all of the core skills they will need to ably succeed at the next level. Many will struggle, and many will likely fail to realize their aspirations. The push toward raising the bar on learning standards and focusing on the essential skills necessary for success must continue.
5. Begin assessing learning and implementing intervention strategies early. Early assessment and intervention are critical to improving educational outcomes. If students are not on track for college and career readiness by the time they reach middle school, it may be too late. Assessing learning and implementing intervention strategies to help students get on the right path for college and career readiness must begin in elementary school.
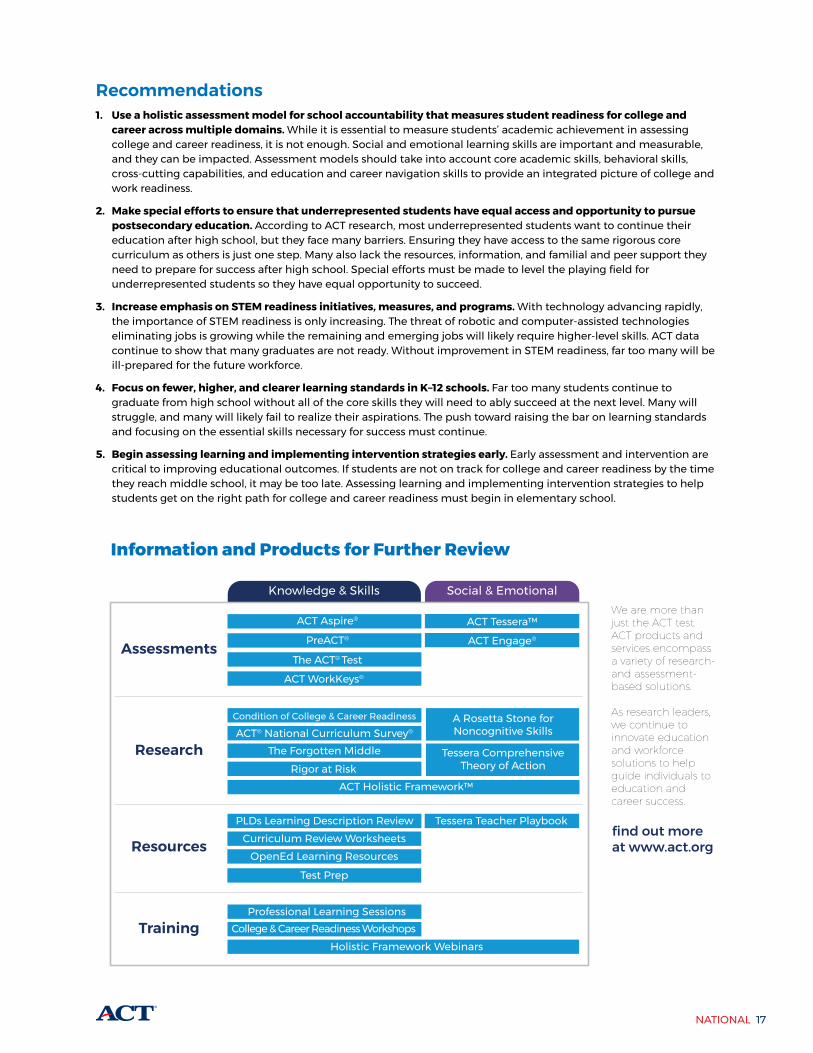
Assessments
Knowledge & Skills Social & Emotional
Research
Resources
Training
Information and Products for Further Review
We are more than just the ACT test. ACT products and services encompass a variety of research- and assessment-based solutions.
As research leaders, we continue to innovate education and workforce solutions to help guide individuals to education and career success.
PreACT®
ACT Aspire®
The ACT® Test
ACT WorkKeys®
ACT Tessera™
ACT Engage®
The Forgotten Middle Tessera Comprehensive Theory of Action
A Rosetta Stone for Noncognitive SkillsACT® National Curriculum Survey®
Condition of College & Career Readiness
Rigor at RiskACT Holistic Framework™
PLDs Learning Description ReviewCurriculum Review Worksheets
Tessera Teacher Playbook
OpenEd Learning Resources
Test Prep
College & Career Readiness WorkshopsHolistic Framework Webinars
Professional Learning Sessions
find out moreat www.act.org
18 THE CONDITION OF COLLEGE & CAREER READINESS 2017
AlabamaArkansasHawaiiWisconsinWyoming
Alabama Kentucky
AlabamaArkansas HawaiiKentuckyLouisianaMinnesotaMississippiMissouriMontanaNebraskaNevadaNorth CarolinaNorth DakotaOklahomaOhioSouth CarolinaTennesseeUtahWisconsinWyoming
AlabamaAlaskaArkansasColoradoIndianaIowaKansasKentuckyLouisianaMassachusettsMichiganMinnesotaMississippiMissouriNevadaNew MexicoNorth CarolinaNorth DakotaOhioOklahomaSouth CarolinaSouth DakotaTennesseeUtahVirginiaWisconsinWyoming
Alabama AlaskaArkansas IndianaIowaKentuckyLouisianaMassachusettsMichiganMinnesotaMississippi MissouriNevadaNew MexicoNorth CarolinaNorth DakotaOklahomaOregonSouth CarolinaSouth DakotaTennesseeUtahVirginia WisconsinWyoming
AlabamaMontanaNebraska
North CarolinaOklahoma
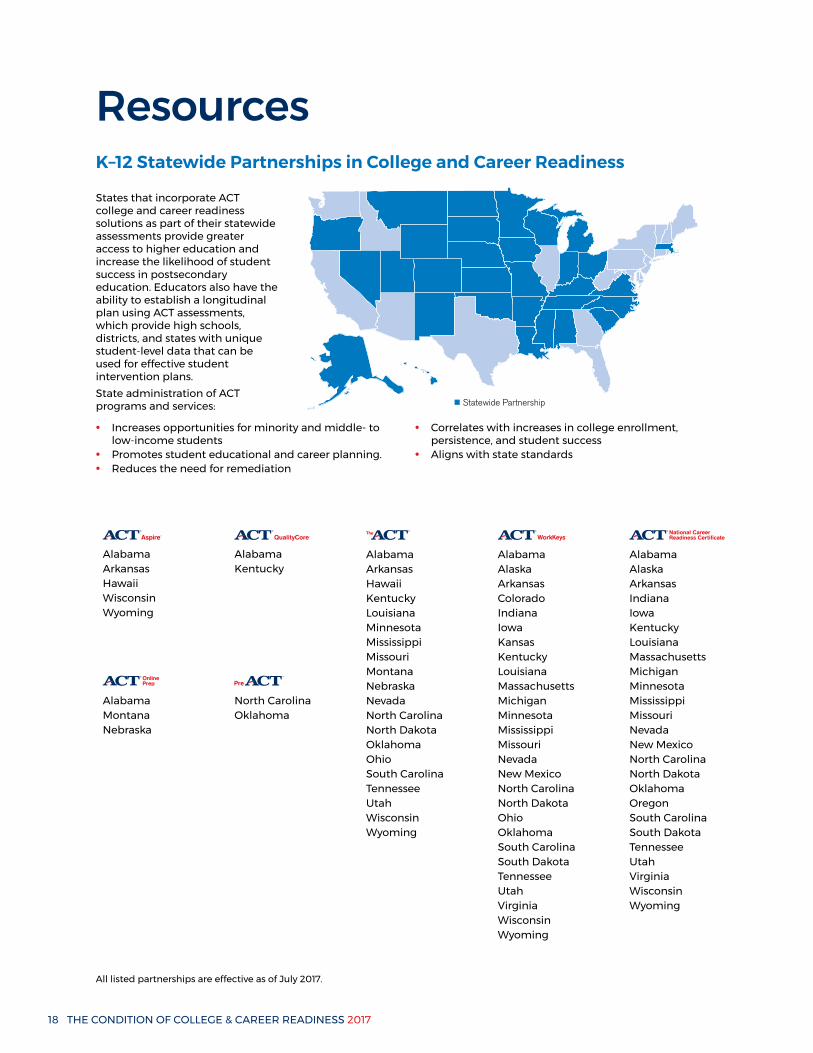
ResourcesK–12 Statewide Partnerships in College and Career Readiness
States that incorporate ACT college and career readiness solutions as part of their statewide assessments provide greater access to higher education and increase the likelihood of student success in postsecondary education. Educators also have the ability to establish a longitudinal plan using ACT assessments, which provide high schools, districts, and states with unique student-level data that can be used for effective student intervention plans.State administration of ACT programs and services:
• Increases opportunities for minority and middle- to low-income students
• Promotes student educational and career planning.• Reduces the need for remediation
• Correlates with increases in college enrollment, persistence, and student success
• Aligns with state standards
All listed partnerships are effective as of July 2017.
NATIONAL 19
ACT ResearchKey ACT ResearchAs students navigate their education and career journeys, it is critical for them to be ready for college and career success. College and career readiness is supported by the ACT Holistic Framework, a research-based, multidimensional model for understanding the essential knowledge and skills needed for success, and the solutions that can meet students’ navigation needs. Visit act.org/condition2017 to access key reports listed below.
• Serving students’ navigation needs from kindergarten to career requires a holistic approach:
~ Beyond Academics: A Holistic Framework for Enhancing Education and Workplace Success
~ The Importance of Behavioral Skills and Navigation Factors for Education and Work Success
• The ACT Holistic Framework is supported by prolific research:
~ Core Academic Skills:• 2017 State and National Condition Reports• Profiles of STEM Students: Persisters, Joiners,
Changers, and Departers • ACT Composite Score by Parental Education
Level, 2012–2016 • Comparisons of Student Achievement Levels by
District Performance and Poverty ~ Behavioral Skills (also called Social and Emotional
Learning): • The Development of Behavioral Performance
Level Descriptors ~ Cross-Cutting Capabilities:
• ACT National Curriculum Survey 2016 ~ Student journeys continue into postsecondary
education and careers:• Higher Education Research Digest • Predicted Attainment of ACT National Career
Readiness Certificates for the 2016 ACT-tested High School Cohort
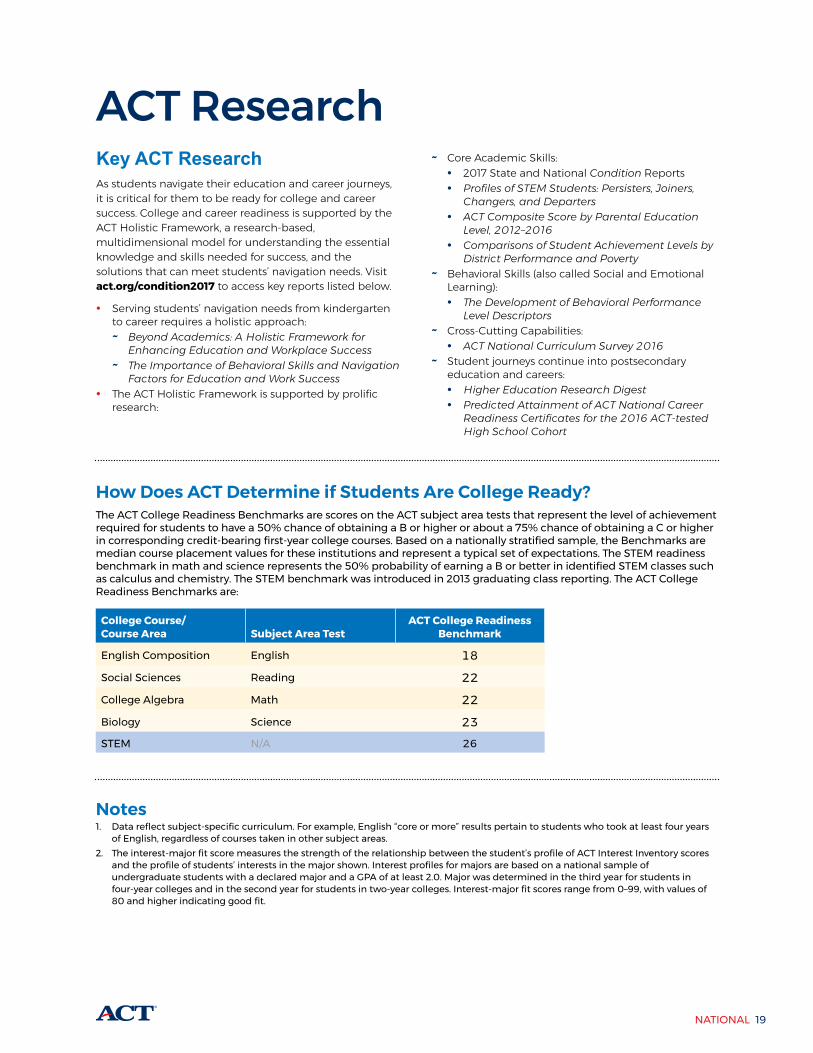
How Does ACT Determine if Students Are College Ready?The ACT College Readiness Benchmarks are scores on the ACT subject area tests that represent the level of achievement required for students to have a 50% chance of obtaining a B or higher or about a 75% chance of obtaining a C or higher in corresponding credit-bearing first-year college courses. Based on a nationally stratified sample, the Benchmarks are median course placement values for these institutions and represent a typical set of expectations. The STEM readiness benchmark in math and science represents the 50% probability of earning a B or better in identified STEM classes such as calculus and chemistry. The STEM benchmark was introduced in 2013 graduating class reporting. The ACT College Readiness Benchmarks are:
College Course/ Course Area Subject Area Test
ACT College Readiness Benchmark
English Composition English 18
Social Sciences Reading 22
College Algebra Math 22
Biology Science 23STEM N/A 26
Notes1. Data reflect subject-specific curriculum. For example, English “core or more” results pertain to students who took at least four years
of English, regardless of courses taken in other subject areas.2. The interest-major fit score measures the strength of the relationship between the student’s profile of ACT Interest Inventory scores
and the profile of students’ interests in the major shown. Interest profiles for majors are based on a national sample of undergraduate students with a declared major and a GPA of at least 2.0. Major was determined in the third year for students in four-year colleges and in the second year for students in two-year colleges. Interest-major fit scores range from 0–99, with values of 80 and higher indicating good fit.
ACT is an independent, mission-driven, nonprofit organization that provides assessment, research, information, and program management services in the broad areas of education and workforce development. Each year, we serve millions of people in high schools, colleges, professional associations, businesses, and government agencies, nationally and internationally. Though designed to meet a wide array of needs, all ACT programs and services have one guiding purpose—helping people achieve education and workplace success.
A copy of this report can be found at
www.act.org/condition2017
*011702170* Rev 2