Embed Size (px)
Citation preview
The Computable Plant: Annual Report, 9/2003-5/2004.Eric Mjolsness, Principal InvestigatorInstitute for Genomics and BioinformaticsUniversity of California, [email protected]
Overview
Major accomplishments of the NSF FIBR Computable Plant project for the partial yearfrom 9/2003 through 5/2004 can be categorized as experimental, computational, andoutreach-related. Experimental accomplishments include the purchase and installation ofa dedicated confocal laser scanning microscope for live plant imaging (Figure 1), thedevelopment of improved imaging techniques including GFP (Green Flourescent Protein)variants and floral meristem primordium markers, the creation of 3D and 4D image datasets bearing on Shoot Apical Meristem (SAM) morphogenesis and cell division, and thediscovery of coordinated patterns of cell division in the floral primorida of the SAM.Computing accomplishments include the creation and maintenance of the web sitewww.computableplant.org, the development of models and simulations exploringmechanisms for phyllotaxis compatible with auxin/PIN1 regulatory interactions and withexpression data, the design and prototyping of new simulation software which will in thefuture allow exchange of developmental models between research groups, and progresstowards the formulation of a next-generation “beveled polyhedron” modeling frameworkfor the interaction of biomechanics and regulatory networks. We have also initiated anoutreach program (www.outreach.caltech.edu/computableplant) that will host its firstteacher workshop at the Huntington Botanical Gardens in August 2004.
Figure 1. Confocal laser scanning microscope setup dedicated to plant developmental imaging inthe Meyerowitz laboratory at Caltech, immediately after installation (photo taken 4/26/04). Thisis a centerpiece and a major investment of the FIBR Computable Plant project and is nowproducing useful imagery.

Imaging technologyMarcus G. Heisler
In order to understand the temporal and spatial relationship between various markers it isnecessary to make full use of the available GFP variants. Previously we have successfullyused ER localized GFP, Histone 2B fused YFP and GFP fused to proteins of interest.However we have discovered a number of limitations so far including:
1) Tissue damage due to bleaching and excessive laser exposure.
2) Excessive detector noise from the Meta spectral analyzer when using suboptimalconfocal pinhole apertures
To address these issues we have been testing new GFP variants and multimerized GFPsin an effort to increase signal strength. Data so far suggests this approach can indeedincrease signal to noise ratios very significantly (see Figure 2). Another strategy is to useGFP variants that do not require the Meta for signal separation. Thus we have tested aGFP/dsRED express combination and shown that this works well even for time lapse (seeFigure 3).
These approaches are also being adapted for use with novel ubiquitous promoters and ourbasic set of nuclear and plasma membrane localization tags in order to significantlyimprove our ability to geometrically map cell positions and sizes over time.
Figure 2. PIN1GFP in combination with pCUC:3XVENUS N7. The pCUC:VENUS N7 signal isthe strongest reporter generated so far suggesting that multimerization of GFPs increases signalstrength.

Figure 3. pPIN1:PIN1GFP in combination with pFIL:dsRED N7. (A) Expression pattern at 0 hrs.(B) Expression patterns at 33 hrs with imaging every 3 hrs in between. Note two new primordiaare expressing the dsRED marker.
Spatio-temporal dynamics of primordial gene expression and growth
Currently a large number of genes are known to be expressed in primordial regions andmany of their functions are at least partially understood. However their relativeexpression domains are poorly characterized both spatially and temporally. The aim ofthis project is to determine the spatial and temporal relationships between such genes inan effort to understand how primordial cells are progressively specified. These markerswill also be combined with a ubiquitous nuclear marker in order to correlate geneexpression dynamics with cell behavior.
So far we have completed the construction of primordial makers including:
pFIL:dsRED Express N7 (N7 is nuclear localized) (see Figure 3)pPID:dsRED Express N7pREV:REV:VENUS translational fusionpCUC:3XVENUS N7 (see Fig. 1)
Markers in progress include:pZLL:dsRED N7pANT:dsRED N7pAS1:dsRED n7pSTM:3XVENUS N7
One of the consequences of this work will be to enable the testing of auxin/PIN1phyllotaxis models (see Modeling Phyllotaxis section below) by monitoring the polarityof pPIN1:PIN1GFP in response to localized auxin sources.

Real-time lineage analysis reveals oriented cell divisions associated withmorphogenesis at the shoot apex of Arabidopsis thalianaG. Venugopala Reddy, Marcus G. Heisler, David W. Ehrhardt and Elliot M. Meyerowitz
Precise knowledge of spatial and temporal patterns of cell division, including number andorientation of divisions, and knowledge of cell expansion, is central to understandingmorphogenesis. Our current knowledge of cell division patterns during plant and animalmorphogenesis is largely deduced from analysis of clonal shapes and sizes. But such ananalysis can only reveal the number, not the orientation or exact rate of cell divisions. Inthis study, we have analyzed growth in real time by monitoring individual cell divisionsin the shoot apical meristems (SAMs) of Arabidopsis thaliana. The live imagingtechnique has led to the development of a spatial and temporal map of cell divisionpatterns. We have integrated cell behavior over time to visualize growth. We haveanalyzed the cell behavior associated with flower primordium development starting froma stage in which the future flower is comprised of four cells in the L1 epidermal layer.Our results show that primordium development is a sequential process linked to distinctcellular behavior. Our analysis reveals that the amount of cell division is comparable inregions of the SAM where successive primordia arise. Changes in cell divisionorientation are associated with initial outgrowth of a flower primordium. These changesare followed by a rapid burst of cell expansion and cell division, which transforms aflower primordium into a three dimensional flower bud.
One of the major limitations in understanding growth in both plants and animals has beenthe inability to monitor cell behavior in real time. Several studies have tried to addressthis issue starting from inference of cell behavior from clonal analysis, to generativemodeling of growth through computer simulations. Our analysis of growth in real timecircumvents the requirements for inference in studies of clonal growth, or for theoreticalgrowth simulations. Once cell positions can be extracted by cell-finding algorithms, itshould be possible to integrate cell coordinates in time-lapse observations. Such effortsare currently in progress. The challenge for the future is to superimpose models of generegulatory networks on such models of growth, and to integrate with these models thecell-cell interactions involved in meristem maintenance and morphogenesis.
Work listed above has been accepted for publication in DEVELOPMENT (Reddy et al.2004).

Figure 4. Spatial distribution of mitotic activity over a period of time. (A), (B) and (C) showreconstructed L1 layer of the same plant separated by 12hours interval. Cells divided in each ofthe 12hours window are differentially color-coded. Red dots represent cells divided in first12hours window, yellow dots the following 12hours and the blue dots the next 12hours. (G), (H),(I) and (J) are individual optical sections from the same plant depicting cells located in L2 andcorpus from the same time point as in (C) and the color code remains the same. (D), (E) and (F)represent reconstructed views of L1 layer of the same SAM followed over 72hours. Elapsed timein individual panels is marked. Different colored sectors represent regions of primordiumdevelopment marked as P-2, P-1, P0, P1 and P2. The number expressed as percentages in (F)represent averaged mitotic index calculated for every 24hours interval over 72hours, in sectorsrepresenting same stage primordium. The numbers in parenthesis indicate the number of cellsdivided over total number of cells. From (Reddy et al., 2004).

Fluorescent cell type specific markers for Shoot apical meristems (SAMs)G. Venugopala Reddy and Elliot M. Meyerowitz
The shoot apical meristem (SAM) is a collection of distinct cell types located in specificpositions with specialized functions. The central zone (CZ) cells harbor initials or stem-cells, while the cells at specialized regions in the peripheral zone (PZ) differentiate intoorgan primordia. The cells in Rib-zone are incorporated into the developing stem. Allthese cell types are located in a dynamic environment and hence they have to constantlyassess their position in order to retain their identity. The dynamics of cell fatespecification can be best studied by combining cell type specific markers and cellbehavior in a single study. In this context, we are developing a set of promoter constructsto direct the expression of fluorescent proteins in distinct cell types. We have designedpromoter-fluorescent protein constructs for CLAVATA3 (CLV3), UNUSUAL FLORALORGANS (UFO), LEAFY (LFY) and WUSCHEL(WUS) to mark cells in CZ, PZ, incipientprimordia and part of the Rib-zone respectively. The plants carrying these constructshave been obtained and their expression patterns are being characterized in detail, intime-lapse experiments.
Cell behavior, cell types and meristem maintenanceG. Venugopala Reddy
The genetic studies have revealed the signaling mechanisms involved in meristemmaintenance. Mutations in CLAVATA genes (CLV1, CLV2 and CLV3) result in biggermeristem, while mutations in WUSCHEL (WUS) results in a failure to maintain afunctional meristem. The nature of gene products, expression domains, geneticinteractions and mis-expression studies have contributed to an elegant model involvingpositive and negative feedback loops operating on each other to maintain meristem size.The function of WUS is required to maintain a constant stem-cell pool in CZ and at thesame time CLV genes function to repress WUS expression domain. However, the studiesaimed at understanding the cell behavior and analyzing cell types in these mutantcontexts are restricted to single time-point observations and mostly restricted toinflorescence meristem, which represents a terminal phenotype. The function of thesegene products can be best understood by analyzing the effects of their transientdysfunction, in real time, on both cell types and cell behavior. Such studies might yieldnew insights into the kinetics of re-organization of cell types in SAM in relation to thealtered cell behavior. Such a system can also be employed to study the effect of alteredcell types on cell division patterns in relation to cell position. We have used the hormoneinducible (dexamethasone) constructs, which result in mis/overexpression of WUS toperturb meristem maintenance function (constructs provided by Frank Wellmer). Theeffect of WUS misexpression was tested on CLV3 expression pattern. This analysis hasrevealed that the expansion of CLV3 expression upon WUS induction is due to the re-specification of PZ cell identity and not due to the additional cell divisions within CLV3expression domain. The detailed analysis of PZ cell identity is being carried out byutilizing the PZ marker gene such as UFO and LFY, which is expressed in developingorgan primordia within the PZ.

Modeling PhyllotaxisHenrik Jönsson, Marcus Heisler, et al.
An important problem connected to the shoot apical meristem is the mechanism ofphyllotaxis. New leaf and flower primordia are initiated from the periphery of the SAMin an amazingly symmetric fashion, which has attracted scientists dating back toantiquity. The plant hormone auxin is believed to play a major role in the initiation of thenew primordia, and recent research shows that membrane proteins involved in auxintransport, such as PIN1, are expressed and polarized in a phyllotactic pattern in theepidermal layer of cells within the SAM (Figure 5A).
A large number of models have been proposed for phyllotaxis, based both on molecularand mechanical ideas. A common factor of many of these models is a regular spacingmechanism in combination with a continuous growth of the apex, but the models havehad no or little connection to molecular experiments in the plant. The recent experimentsdescribed have illuminated a transport mechanism to be essential for the patterns to form.In an ongoing work, we are developing a model based on this data. In vivo imaging of aGFP-fused PIN1 protein is used to explore the expression and polarization of the PIN1protein within cells (Figure 1A). The data indicates that PIN1 is polarized to walls closerto new primordia, which is assumed to be where the auxin concentration is highest.Models taking this into account were developed and resulted in formation of evenlyspaced auxin concentration peaks, resembling phyllotactic patterns (Figure 5). Currentlywe are testing the model in experiments where micro-addition of auxin to the SAM isapplied, followed by analysis of how the PIN1 polarization is affected.
A) B) C) Figure 5: Plant phyllotaxis. A) Top view of a SAM, where a PIN1-GFP protein fusion is used.The membrane protein is expressed in a phyllotactic pattern. B) 2D simulation of the modeldescribed in the text. A spiral phyllotactic pattern is continued from an initial state where five ofthe peaks are present. New peaks appear at the “correct” positions. C) A small auxinconcentration disturbance in one cell at the bottom of the cylinder is sufficient to createphyllotactic patterns in the simulations. Different parameter sets lead to different patterns such aspairwise, spiral, and opposite, all present in different plant species.
Using these techniques, we are developing a set of alternative few-player models toexplain the known expression patterns and to guide discriminating experiments. Thesemodels include auxin gradient and flux models, an internal auxin gradient model, a modelbased on an intermediate signaling molecule “X”, and a model based on an unknown

hysteresis loop with a memory factor “M”. These alternative models can be expressed orreformulated in terms of reaction notation (see Model Generation section, Figure 10).
Inferring Model Parameters
Inference of models from dataAnother important aspect of a modeling approach is to study the inverse problem where amodel is inferred directly from data, with little or no restrictions on the model. In thisreverse engineering scenario an optimization algorithm is used to find the best possiblemodel that describes data, and the tool can be used for computationally inducedhypotheses. In previous work, we have used a simulated annealing approach for a modeldescribing development in Drosophila, and a first application to a growing shoot apicalmeristem has been explored in (Jönsson et.al. 2003).
Our main goal is to find gene network interactions by simulation of different networksand comparing with template data. To be able to measure similarity between a simulationand a template, a quality measure is defined as
E measures the difference of target protein concentrations between a simulation and thetemplate for each cell at each template time point.
Simulations vs. L1-Template ComparisonA 2D template of L1 expression in a growing plant is produced by simulation of the L1-part of the SAM model network.
Figure 6. Template data for an L1 expressed gene at four time points.
Simulations with parameter values similar to those used when creating the template areperformed.

Figure 7. L1 expression pattern network.
The TL 1 ,L1 (self inducing intracellular) and TL1 ,Z (intercellular repression from Z)parameters are varied. In the plot there is a minimum for E at the template parametervalues (1.0,-0.35), but also a “valley” of low values showing that an increased Zrepression can be compensated by an increase of self activation of L1.
A Receptor-Ligand NetworkAnother network that produces an L1 expression similar to the template is shown in thefigure below. It is using a receptor(B) - ligand(A) signal for repressing the L1 expression.
Figure 8. L1 expression pattern network with receptor-ligand interactions.
The TL1,L1 (self inducing intracellular) and hB (the default B expression) parameters arevaried. In this case there is a “plateau” of values that produce a good result. Theparameter space can be searched, and good networks can be extracted from low Esimulations. Instead of an exhaustive search, we plan to use an optimizing schema suchas Lam-Delosme simulated annealing to find good parameter sets.

Model generation software developmentBruce Shapiro and Victoria Gor
We have undertaken the design and prototyping of new simulation software that will inthe future allow exchange of developmental models between research groups, byaugmenting the Systems Biology Markup Language (SBML). Our software architecturewill also will allow the large and expanding collection of biological mechanism modelsavailable in Cellerator (using computer-algebra manipulation) to be applied as needed todevelopmental modeling. It is illustrated in Figure 9. A prototype of this architecturenow runs, and a near-term goal is to create and disseminate a simple reference applicationinvolving our previous models of CLV3 expression domain constancy.
Figure 9. Software architecture and data flow for sharable developmental simulations. Theautomatic code generator is central to this architecture. It consists of an inferencer, a rulesegmenter and optimizer, and application code writer modules (Fig. 1). It queries the parser forSBML structures and produces efficient C++ application code. The resulting C++ code is thencompiled into object code optimized for the desired application. The first two modules of theautomatic code generator – the inferencer and rule segmenter – are pre-processors. They arecalled once for each SBML model, independent of the application software to be generated. Theinferencer receives parsed SBML structures from the parser and infers element attributes giventhe element name. This reflects the inverse relationships between SBML elements and theirattributes. For example, the extended SBML has a parameter attribute “foreach” that indicates thecompartment; the inferencer creates a list of inferred elements, such as the list of parameters ineach compartment. Details in (Gor et al. 2004).
The newest component of our architecture is the Automatic Code Generator. It queriesthe parser for various SBML structures and produces efficient application code in C++.Required modifications to the SBML parser were made in routines that handle “Rule”,“ASTNode”, “Model”, “Compartment”, “Species”, “Parameter”, “Connection”,“Dimension” and “Index” elements. The various rule elements of SBML-V2 werecombined into one “Rule” element with five SBML-specified attributes: “variable”,“formula”, “math”, “type” and “ListOfIndices”. The resulting C++ code, compiled intoan executable program, is the efficient adaptation of the indicated solver to the givenSBML model.
Thus, the following have been achieved:- Creation and maintenance of web site www.computableplant.org- Extension of current SBML language to handle array formats- Automatic simulator and optimizer code generation
In support of this architecture, numerous enhancements to our Cellerator computer-algebra based biological model generator have also been made:
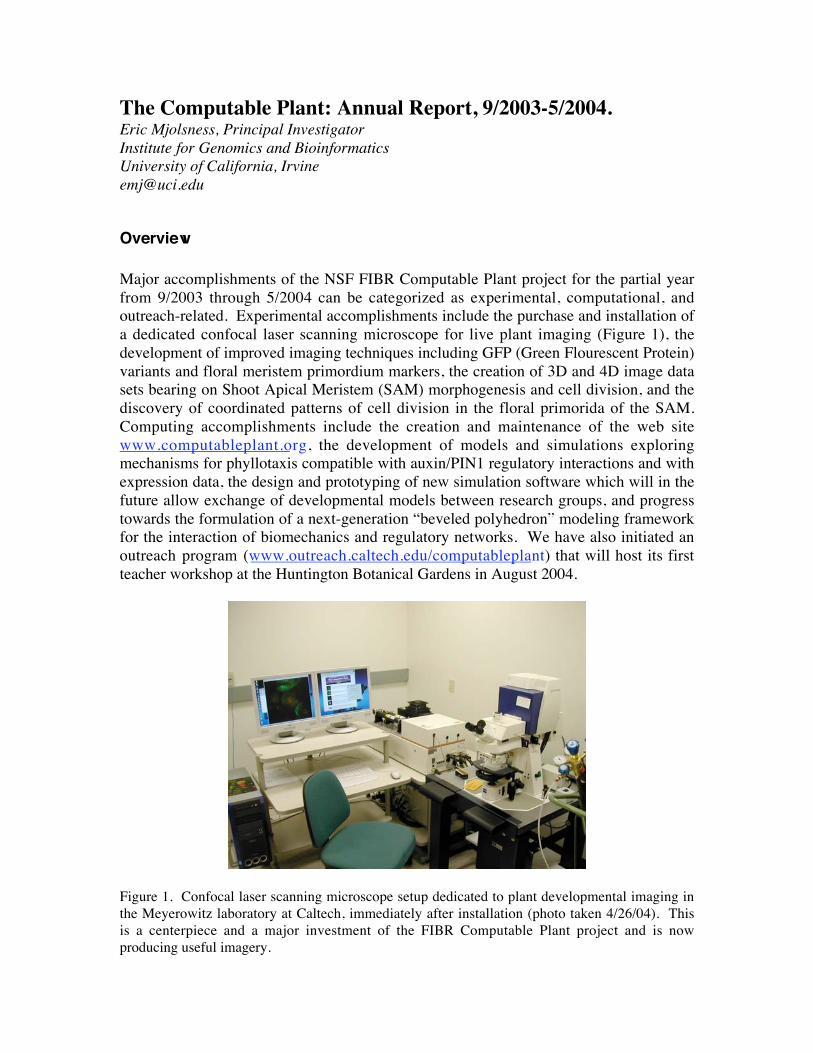
- Updates to Cellerator: GMWC, SSystem, Michaelis-Menten, Numerous bug fixes- Updates to MathSBML to support Arrays in SBML- Cellerator plugin to write SBML file with GRN network using MathSBML- Cellerator plugin to perform simulations on a tissue (cell) array- Various simulations on internal web page at Caltech
Figure 10. Cellerator input and output for highly simplified auxin/PIN1 model on a hexagonalgrid. Note the use of wall/membrane compartments [i,j]: wall/membrane of cell i adjacent to cellj. Observed behaviors are diverse (including solitons) and not yet biologically satisfactory.
Publications and presentations on the software architecture are listed in the referencesection of this report as (Mjolsness et al. 2004), (Gor et al. 2004), (Shapiro et al. 2004),and (Shapiro 2004). Although they weren't funded by this project, our papers fromBGRS-2002 and ICSB-2002 have now been published in two collections: (Jönsson et al.2003, Mjolsness et al. 2004).

BiomechanicsEric Mjolsness and Alexey Vorobyov
We have begun to formulate a new biomechanical model, to refine the previous mass-spring model. Both models can be integrated with regulatory network models. Theassumptions of the new model are that plant cell geometry is approximately that of“beveled polyhedra” with strong thin walls made of anisotropically oriented cellulose, arelatively weak cytoplasm, and strong spherical nuclei inside. The wall/membranecompartments are also the loci for PIN1 in sub-cellular compartmental regulatory models.We are investigating finite element discretizations for such anisotropic models that wouldallow for growth and cell division. A likely starting place is a 3D triangulation of thepolyhedral cell compartments, with an affine deformation in each tetrahedron, andnonlinear anistropic incompressible stress/strain relationships similar to those used in(Teran et al. 2003) for muscle tissue.
Figure 11. Visualization screenshot is from a program that allows visualization of 3D collectionsof cells that have a shape of polyhedra. It is possible to look at every cell or every combination ofcells from any point of view in 3D, allowing rotation, shift, zoom operations. One can drawsections by arbitrary plane (left pane).
ICG Visit and WorkshopE. Mjolsness
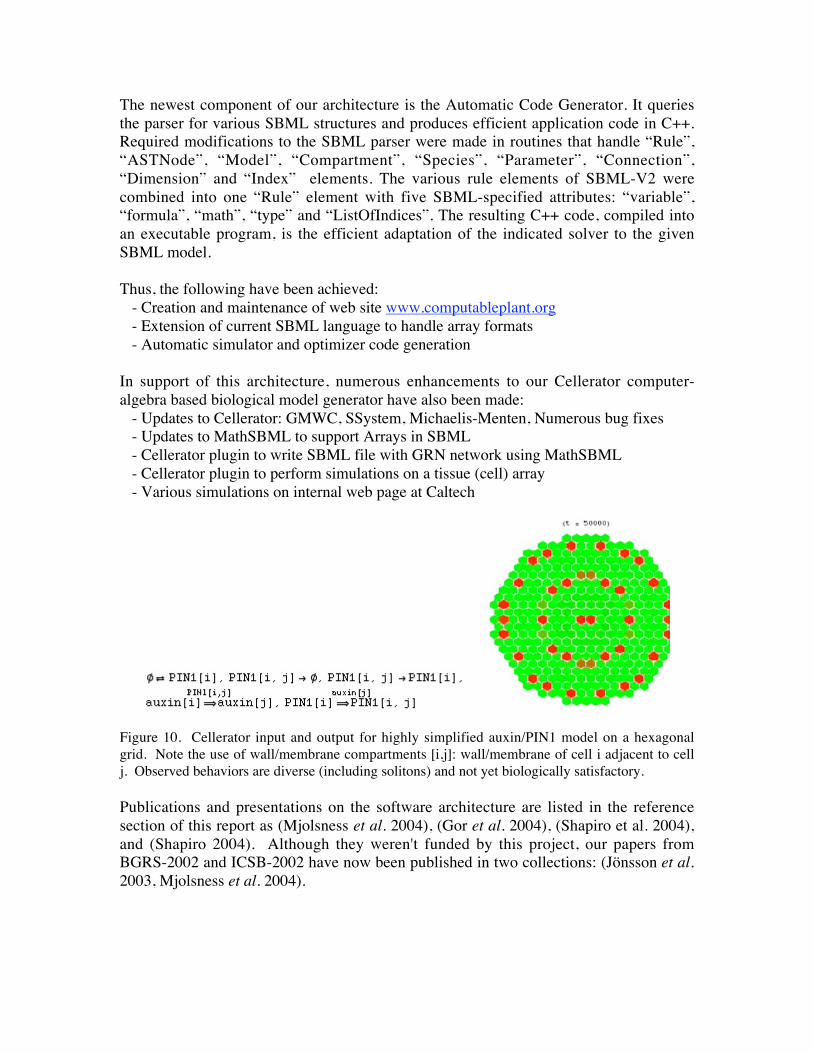
Five visitors from the Institute for Cytology and Genetics came to UCI in April for aproductive two-week visit. They included Nikolay Kolchanov (Deputy Director ICG),Nadejda Omelianchuk, Nikolay Podkolodny, Sergei Nikolaevich, and Vitali Likoshvai.Their expertise includes computing, mathematical modeling, biological databases, andbioinformatics software. On April 14 there was an all-day workshop for all projectscientists at Caltech’s Keck Marine Laboratory at Corona del Mar, 3 miles from the UCIcampus. Highlights from this visit included presentation of ICG’s relevant work on anArabidopsis phenotype database (see Figure), convergent evolution to a pathwaydatabase and pathway modeling environment similar to those associated with Cellerator,and the intersection of mathematical modeling efforts relating stochastic grammars,Colored Petri Nets, network connectivity statistics, and reaction mechanism libraries.
Plans are underway to make the ICG plant phenotype database available to theComputable Plant project.
MA wild type [Fletcher J.C. et al.,1999]
RT mRNA, ARRD floweringRO SAM, the central zone, L1RO SAM, the central zone, L2RO SAM, the central zone, L3RL presentRC expressed in the L1 and L2 cell
layers, and in a few underlyingL3 cells [Fletcher J.C. et al.,1999]
XX
MA clv1-4 [Fletcher J.C. et al., 1999]MA clv2-3 [Fletcher J.C. et al., 1999]MA clv3-2 [Fletcher J.C. et al., 1999]MA shd [Ishiguro S. et al., 2002]MA CLV3::CLV3-GFP; clv3-1 [Lenhard M. and Laux T., 2003]RT mRNA, ARRD floweringRO SAM, the central zone, L1RO SAM, the central zone, L2RO SAM, the central zone, L3FL enlarged domainRC domain is enlarged in accordance with the SAM central zone
enlargement [Fletcher J.C. et al., 1999] [Lenhard M. and LauxT., 2003]
RC CLV3::CLV3-GFP; clv3-1, mGFP4 was used as AR probe,expression was found solely in a three- to four-cells high,wedge-shaped domain in the SAM centre, this expressiondomain was larger than that of the endogenous CLV3 gene inwild type, yet much smaller than in non-transgenic clvmutants [Lenhard M. and Laux T., 2003]
XXMA CLV3::CLV3-GFP; clv3-1 [Lenhard M. and Laux T., 2003]RT protein, GFPRD floweringRO SAM, the central zone, L1RO SAM, the central zone, L2RO SAM, the central zone, L3RL presentFL enlarged domainRC GFP fluorescence was detectable not only in the region
corresponding to the mRNA also in cells towards theperiphery of the meristem in the outer layers, extendingfarthest in the L1 [Lenhard M. and Laux T., 2003]
XX
Figure 12. Example entry in ICG Arabidopsis phenotype database.

OutreachMartha Kirouac and Jill Andrews
Dr. Martha Kirouac is coordinating outreach and instructing our first week-longworkshop, “The ABCs of Developmental Botany: Integrating plants into the classroom”.Fifteen high school teachers will participate in the class from August 23 – 27, at TheHuntington Library, Art Collections, and Botanical Gardens. Topics will include:fundamentals of plant development, plant cell biology, classification, mutation, variation,adaptation, cell differentiation, genetically modified crops, and use of dissecting andcompound microscopes. A follow-up three-day workshop will be scheduled for winter.The Los Angeles Unified School District has approved the course for three salary pointcredits, and is advertising it on their site.
Additionally, Caltech’s Educational Outreach program has established a course web site(see http://www.outreach.caltech.edu/computableplant/, where a tentative agenda can befound), and is advertising the course through its Local Educator’s Network and SanFrancisco’s Exploratorium. We are currently in discussion with Dr. David Drew, JosephB. Platt Chair in Management of Technology at the Claremont Graduate University, overassessment of the baseline knowledge of participating teachers.
Summary
The accomplishments enumerated in the Overview section have been substantiated indetail. Plans for the coming year include the commencement of serious work in imageprocessing, as well as further development in all areas covered above.
References
Gor V., Shapiro B.E., Jönsson H., Heisler M., Reddy G.V., Meyerowitz EM, andMjolsness E, A Software Architecture for Developmental Modeling in Plants: TheComputable Plant Project. Abstract accepted for BGRS (Bioinformatics of GenomeRegulation and Structure, Novosibirsk Russia 2004):
Jönsson H, Shapiro BE, Meyerowitz EM, Mjolsness E (2003). Signaling in MulticellularModels of Plant Development, in On Growth, Form, and Computers, ed. Bentley P andKumar S, Academic Press, pages 156-161.
Mjolsness E, Jönnson H, Shapiro BE, Meyerowitz EM (2004). Modeling plantdevelopment with gene regulation networks including signaling and cell division, inBioinformatics of Genome Regulation and Structure, ed. N. A. Kolchanov, KluwerPublications.

Mjolsness E, Shapiro B, Gor V, Jönsson H, Reddy GV, Heisler M, Meyerowitz EM(2004) The Computable Plant: A Software Architecture for Developmental Modeling inPlants. Poster presentation at the Pacific Symposium on Biocomputing (PSB-2004) BigIsland, Hawai'i, USA.
Reddy, G.V., Heisler, M.G., Ehrhardt, D.W., and Meyerowitz, E.M. (2004). Real-timelineage analysis reveals oriented cell divisions associated with morphogenesis at theshoot apex of Arabidopsis thaliana (Manuscript accepted, DEVELOPMENT).
Bruce E Shapiro, Eric Mjolsness and Elliot Meyerowitz, The Computable Plant: AMathematical Framework for Developmental Modeling in Plants. Abstract accepted forSIAM Meeting on Life Sciences 2004.
Bruce E Shapiro, 2004: "Using Computer Algebra for Developmental Modeling:Introduction to Signal Transduction, Cellerator, and the Computable Plant". Invitedtutorial at the International School on Complex Systems in Computer Science andBiology, Rovereto, Italy, in coordination with the University of Trento. (No expense tothe Computable Plant project was required for this event.)
Teran J., Blemker S., Ng V., Hing T., and Fedkiw R. (2003). Finite Volume Methods forthe Simulation of Skeletal Muscle. Eurographics/SIGGRAPH Symposium on ComputerAnimation D. Breen, M. Lin (Editors).