Embed Size (px)
Citation preview

167166
integritas - JuRnAl MAnAJeMen BiSniS | vol. 3 no. 2 | Agustus - november 2010 (145 - 166)
The CoMPleMenTARy nATuRe of fundAMenTAl And TeChniCAl AnAlySiSevidence from indonesia
Fundamental analysis and technical analysis has been used independently to predict the stock price movement. Both type of analysis usually used without interacting each other. This study was intended to test the complementary nature of fundamental and technical analysis as to whether it will increase the explanatory power to explain the stock price movement in Indonesia LQ45 market. The result shows that fundamental or technical analysis alone in isolation have the ability to predict future prices. But, by integrating both factors together in a single model will give the superior explanatory power to the prediction. However, in Indonesia stock market, technical analysis plays the biggest role in determining future price movements, while technical data was widely available in the market rather than the fundamental data such as analyst’s forecasted EPS. These findings prove that fundamental analysis can be used in determining which stocks or portfolio is prosperous in the future, and technical analysis can be used in determining the right time to buy or sell the stocks. By integrating both type of analysis, investors could have superior profit than the buy and hold strategy. The result should also enrich the knowledge of stock traders in gaining more profit.
Analisis fundamental dan teknikal sudah digunakan sejak lama oleh para analis untuk dapat memperkirakan pergerakan harga saham. Kedua bentuk analisis ini seringkali digunakan secara independen tanpa interaksi satu dengan lainnya. Studi yang dilakukan ini bertujuan untuk dapat melihat hubungan antara analisis teknikal dan fundamental, apakah dengan menggabungkan kedua bentuk analisis ini dapat menghasilkan sebuah prediksi yang lebih tepat terhadap pergerakan pasar saham di Indonesia. Studi ini mencakup seluruh saham yang tercantum dalam LQ45 di Bursa saham Indonesia. Hasil riset menunjukkan bahwa, baik analisis fundamental maupun teknikal secara terpisah memiliki kemampuan untuk dapat memperkirakan pergerakan harga saham. Namun dengan menggabungkan kedua analisis ini dalam sebuah model, dapat memberikan kemampuan prediksi yang lebih kuat. Pada pasar saham Indonesia, analisis teknikal memiliki kemampuan yang lebih baik dalam memperkirakan harga saham kedepannya, karena data teknikal lebih mudah diakses dan tersedia secara umum dibandingkan dengan data fundamental seperti Prediksi EPS dari Analis, yang hanya tersedia bagi pelanggan dalam jumlah kecil. Dengan menggabungkan kedua bentuk analisis ini , Investor dapat memperoleh laba yang lebih besar dibandingkan hanya menggunakan strategi beli dan simpan. Cara penggabungan kedua analisis ini adalah dimana analisis fundamental dapat digunakan untuk menentukan saham mana yang cukup baik, dan analisis teknikal dapat digunakan untuk menentukan momentum kapan untuk membeli dan menjual saham tersebut. Hasil studi ini diharapkan dapat menambah pengetahuan dari para pemain saham agar bisa memperoleh keuntungan yang maksimal.
Keywords: Technical Analysis, Fundamental Analysis , Momentum, Book Value, Earnings per Share.
Hendra SuryantoBINUS Business School - BINUS University, [email protected]
Stephanus Remond WaworuntuBINUS Business School - BINUS University, [email protected]
Abstract
The Complementary nature of fundamental and Technical Analysis - Stephanus Remond Waworuntu, Hendra Suryanto
Ostroff, Cheri.(1995). The Relationship Between Satisfaction Attitudes and Performance on Organizational Level Analysis, Journal of Applied Psychology, 77(6), 963 – 974.
Peraturan Pemerintah Nomor 29 tahun 2000, tentang Penyelenggaraan Jasa Konstruksi.
Peraturan Pemerintah Nomor 30 tahun 2000, tentang Penyelenggaraan Jasa Konsultan
Poznanski, Peter J.(1997). Using Structural Equation Modeling for Investigate The Causal Ordering of Job Satisfaction and Organizational Commitment Among Staff Acountants, Printed in USA : Vol. 9, pp. 249 – 37.
Rabinowitz, S., and D., Hall.(1977). Organizational Research on Job Involvement, Psychological Bulletin, 84, 265-288.
Robbins, S.P.(2002). Perilaku Organisasi : Konsep, Kontroversi, Aplikasi, Alih Bahasa oleh Adyana Pujaasmaka, Jakarta : PT. Prenhalindo.
Rousseau, Denise M.(1978). Characteristics of Departements, Positions, and Individuals : Context for Attitudes and Behavior, Administrative Science Quarterly, 23, 521 – 540.
Singh, H.P., Jagdip, Willem Verbeke and Gary Rhoads. (1996). Do Organizational Practice Matter in Role Stress Processes? A Study of Direct and Moderating Effects for Marketing Oriented Boundary Spanners, Journal of Marketing, 60, 69-86.
Smith, P.C., Kendall, L.M., and Hulin, C.L. (1969). The Measurement of Satisfaction in Work Retirement. Chicago, IL : Rand Mc Nally.
Sneed, Jeannie and Carole M., Herman.(1990). Influence of Job Characteristics and Organizational Commitment on Job Satisfaction of Hospital Foodservice Employees, Journal of The American Dietetic Association, 90(8), 1072-1083.
Soenarno. (2003). Daya Saing Jasa Konstruksi Nasional di Era Globalisasi, Konstruksi, 319, 22-29.
Steers, Richard M, and D.G., Spencer. (1977). The Role of Achievement Notivation in Job Design, Journal of Applied Psychology, 62, 472 – 479.
Stoner, James, A.F., R., Edward Freeman, Daniel R., Gielbert. (1996), Management, New Jersey : Prentice Hall.
Suryono, Yoyon. (2004). Strategi Peningkatan Profesionalitas Sumber Daya Manusia Konstruksi. Makalah pada Seminar Nasional Membangun Industri Konstruksi Nasional menjadi Kelas Dunia : Tantangan Dan Prioritas”, UNDIP, Semarang : 1 – 9.
Undang-Undang Repulik Indonesia No. 18 tahun 1999 tentang Jasa Konstruksi.
Vroom, V.H.. (1964). Work and Motivation, New York : Willey & Sons.

The Complementary nature of fundamental and Technical Analysis - Stephanus Remond Waworuntu, Hendra Suryanto
168 169
integritas - JuRnAl MAnAJeMen BiSniS | vol. 3 no. 2 | Agustus - november 2010 (167 - 184)
more than a dollar of market value. Finally in
his theory, Ohlson (1995) expresses the price
or the value of a firm’s equity as a function of
both earnings and book value of equity on
his theory of clean surplus valuation. In this
theory, the accounting format requires to
earnings minus dividends should be equal
to the change in book value. Ohlson (1995)
also stated that the change in book value
because of all changes in assets or liability
which was not related to dividends should
pass through the balance sheet and income
statements.
These research was supported by Collins et
al (1997), who also concludes that earnings
and book values act as substitutes for each
other in explaining prices, while they also
function as complements by providing
explanatory power incremental to one
another. Collins et al (1997) stated the
two explanations which are not mutually
exclusive have been given for these findings,
which book values serve as better predictor
for future earnings when current earnings
contain large temporary adjustment
components, and book values serve as a
proxy for the firm’s abandonment option.
In his research, Collins et al (1997) estimates
yearly cross sectional regressions for a 41-
year period spanning 1953 to 1993. He uses
R2 as the primary method to measure value
relevance and decompose the combined
explanatory power of earnings and book
values into three components:
1. Incremental explanatory power of
earnings
2. The incremental explanatory power of
book values
3. The explanatory power common to both
earnings and book values
Further research was done by Dechow et al
(1999) which augmented the Ohlson(1995)
and Collins et al (1997) research of book
value and earnings as future price predictor.
Dechow et al (1999) founds that book value
provides very little additional information
about stock prices beyond that contained
in analysts’ forecasts of next year’s earnings.
Dechow et al (1999) valuation model
incorporates the other information in the
conditional forecast of the next period’s
abnormal earnings.
Dechow et al (1999) founds out that both
book value and earnings load positively
and significant in regressions. Dechow et
al (1999) also noted the fact that the book
value loads in addition to earnings indicates
that book value contains value relevant
information beyond those already covered
in earnings. And in addition to book value
and earnings, these regressions which also
include the consensus analyst forecast of
the next period’s earnings has an increased
explanatory power than only using only
Ohlson’s two factor model. In this research,
earnings loads with a small and statistically
insignificant coefficient, suggesting that
analysts’ forecast of next year’s earnings
has the same value relevant information in
current earnings.
Dechow’s three factor model was also
supported by Ely and Waymire (1999) with
the same findings that the earnings variable
is more strongly associated with stock price
than book value. Ely and Waymire (1999)
also found that the mean and median
incremental relevance for earnings exceeds
those of book value. From the findings
in Ely and Waymire (1999) research, the
explanatory power of univariate regressions
based solely on earnings exceed those of
People try to predict which stocks
should give them the highest
return by analyzing the stock price
movement. The search for the best valuation
model in forecasting the movement of stock
price has been an interesting topic for many
researchers. Reffering to Bettman et al (2009),
there are two distinct types of widely used
analysis. The first one is fundamental analysis
and the other one is technical analysis. Both
type of analysis were trying to answer the
same question, but entirely different in
nature).
Fundamental analyst believe that they can
create profitable opportunities by isolating
and quantifying information about the
market, industries, and also individual
companies that was not yet utilized and
discovered. Technical analysts are usually
short run traders, whose interests are on
the capital gain. The factors and conditions
observed in the market are different than
those of fundamentalists. From the research
done by Oberlechner (2001), technical
analysis is more popular, most of them use
only limited data of only lagged price and
volume because these data are easily and
quickly acquired, stored, and also utilized.
Bettman et al (2009) stated that
Fundamental analysis and technical analysis
were used independently by most stock
market analyst. However, there are very few
literature which integrates both measures
into a single powerful model.
With the facts above about fundamental
and technical analysis, the author was
interested in building a valuation model
integrating both type of analysis to
recognize their ability to provide higher
explanatory power in explaining the
stock price. This research was focused on
building a valuation model which consists
of both fundamental and technical factors,
and testing the complementary nature in
explaining the stock price movement in
Indonesia.
Fundamental Analysis
Fundamental analysis was first formally
argued in the share valuation exercises by
Graham and Dodd (1934), which focuses
the analysis on the value investing using PE,
book value, and EPS ratios. The relationship
of stock price and fundamental factors is
also strengthened on the dividend discount
model by Gordon and Shaphiro (1956),
which values the stock price through the
dividend paid by the company. In further
studies by Ohlson(1995), dividends are not
the only predictor relevant to the market
value, because of one dollar of dividends
displaces one dollar market value on the
same date. This finding was consistent
with Modigliani and Miller (1958). In this
research, Ohlson (1995) finds that the
core of the valuation function expresses
value as weighted average of capitalized
current earnings and current book value.
Ohlson (1995) stated that the book values
are unbiased estimators of market values
in that the expected goodwill equals zero,
and book value alone predicts earnings, and
thus book value now suffices to determine
market value.
Ohlson (1995) wrote that expected earnings
for the next period alone provide sufficient
information for the present value of all future
expected dividends. He also wrote that firm
value equals its book value adjusted for
the present value of anticipated abnormal
earnings. This means that additional dollar in
the book value or earnings generally added
The Complementary nature of fundamental and Technical Analysis - Stephanus Remond Waworuntu, Hendra Suryanto
170 171
integritas - JuRnAl MAnAJeMen BiSniS | vol. 3 no. 2 | Agustus - november 2010 (167 - 184)
Technical analysis is also emphasized in
an important study Jegadeesh and Titman
(1993) has documented the existence of a
momentum effect. Jegadeesh and Titman
(1993) attribute this effect to the fact that
investors underreact to the release of firm-
specific information. In this research, they
write, stocks that perform the best (worst)
over 3 to 12 months period tend to continue
to perform well (poorly) over the next 3 to
12 months. Jegadeesh and Titman (1993)
found that this evidence happened in US
and Europe. Prior research proves that Japan
is the only largely developed stock market
which did not show this phenomenon.
Seasonal changes in the trend like the
January effect also hurts the momentum
effect.
Further studies by Moskowitz and Grinblatt
(1999) evaluate momentum in industry
returns. They form several value weighted
industry portfolios and rank stocks based
on past industry returns. Moskowitz
and Grinblatt (1999) found that high
momentum industry should outperform
low momentum industries in the six month
after portfolio formation. In these studies,
Jegadeesh and Titman (1993) stated that
the profits from momentum strategies have
generated consistently positive returns
for at least the last 60 years in the United
States. In momentum research, Jegadeesh
and Titman (2001) exclude stocks with low
liquidity by screening the stocks priced
less than $5 and at the smallest market cap
deciles, based on the NYSE size deciles cut
off. Jegadeesh and Titman (2001) also stated
that momentum profits have also been
found in most major developed markets
throughout the world except Japan, with
a statistically insignificant evidence of
momentum.
Based on prior researches above, for this
research, the factors used to predict future
price movements were historical prices
taken from the period of 3 months or more
and also momentum factors, which shows
the extreme momentum condition. From
prior research regarding this by Bettman
et al (1999), it is concluded that technical
analysis was proven to significantly
increases the return from trading activity.
Integration of Fundamental
and Technical Analysis
Bettman et al (2009) says that both
fundamental analysis and technical analysis
was used independently by most stock
market analyst, but there are very few
literature which integrates both measures
into a single powerful model. One of the
research done on the complementary nature
of fundamental and technical analysis was
done by Taylor and Allen (1992). In this
research, they conducted a survey to over
400 chief foreign exchange dealers in the
London market in 1988 with 60% response
rate. The result is that 90% respondents uses
inputs from the chartist on technical analysis
while forming their trading decisions, and
60% of the respondents judging charts as
least important than fundamental analysis.
Finally the research perceives that both
fundamental and technical analysis is
complementary.
The latest research regarding fundamental
and technical analysis was done by
Oberlechner (2001) with 59% of the traders
are using chartist or technical analysis,
17% of the traders are using fundamental
analysis, and 23% traders switch between
both type of analysis.
The prior research in Bettman et al. (2009)
book value concludes the importance of
earnings for equity valuation.
From the research and findings above, a
fundamental analysis model which was
done and tested in this research consists of
three factors which was the current book
value, current earnings per share. To increase
the explanatory power of the fundamental
analysis in explaining future price, we will
also include forecasted earnings per share.
From the literature above, the base of this
analysis is strong because it was based on
prior released journals.
Technical Analysis
Schwager (2009) mentioned “While the
fundamental analyst seeks the intrinsic
value of the stocks and interested in the
total return over a relatively long period
by carefully considering dividend returns
as well as expected price appreciation,
technical analyst believe that those methods
are inefficient”. From their perspective,
market conditions are complex, and analysts
should also deal with market reactions.
Schwager (2009) also stated that people did
not always buy on good earnings reports,
and did not always sell on bad news.
Technical analysis has an important role
in the analyst’s research for the stock
price movement. Technical analysis is
often discussed as it is utilized apart from
fundamental analysis. It is difficult to
isolate one approach entirely from the
other. Technicians are usually aware of
fundamental factors, and fundamentalists
are also aware of market conditions, trends,
and also trading volume, and also use these
factors to make decisions.
The recognition of the ability of past prices
and movements to predict future value was
first written on the Dow Theory, published
in The Wall Street Journal by Charles Dow,
1900–1902 as written by Szabo (2004),
which implicitly state that past prices and
movement can forecast future prices.
Because of the significance of technical
analysis in its ability to predict future
price, this will counter the random walk
hypothesis.
In his research, Levy (1966) reports the
results of tests of the profitability of some 68
variations of various trading rules of which
very few that were based only on past
information yielded returns higher than
that given by a buy and hold policy.
In Fama’s (1970), the vast majority of
technical analysis studies were unable to
reject the efficient market hypothesis for
common stocks. There are several well-
documented anomalies in the efficient
market hypothesis, but many financial
economists would agree with Jensen
(1970) who believes that there is no other
proposition in economics which has more
solid empirical evidence supporting it than
the efficient market hypothesis. (Lo and
MacKinlay, 1999)
From the research of Jensen and Bennington
(1970), random walk and efficient market
theories of security price behavior imply
that stock market trading rules based
solely on the past price series cannot earn
profits greater than those generated by
a simple buy-and-hold policy. Jensen
and Bennington (1970) also quoted that
technical analysts insisted that this evidence
does not imply their methods are invalid
and argued that their rules are too complex
to be captured by a simple statistical test.
The Complementary nature of fundamental and Technical Analysis - Stephanus Remond Waworuntu, Hendra Suryanto
172 173
integritas - JuRnAl MAnAJeMen BiSniS | vol. 3 no. 2 | Agustus - november 2010 (167 - 184)
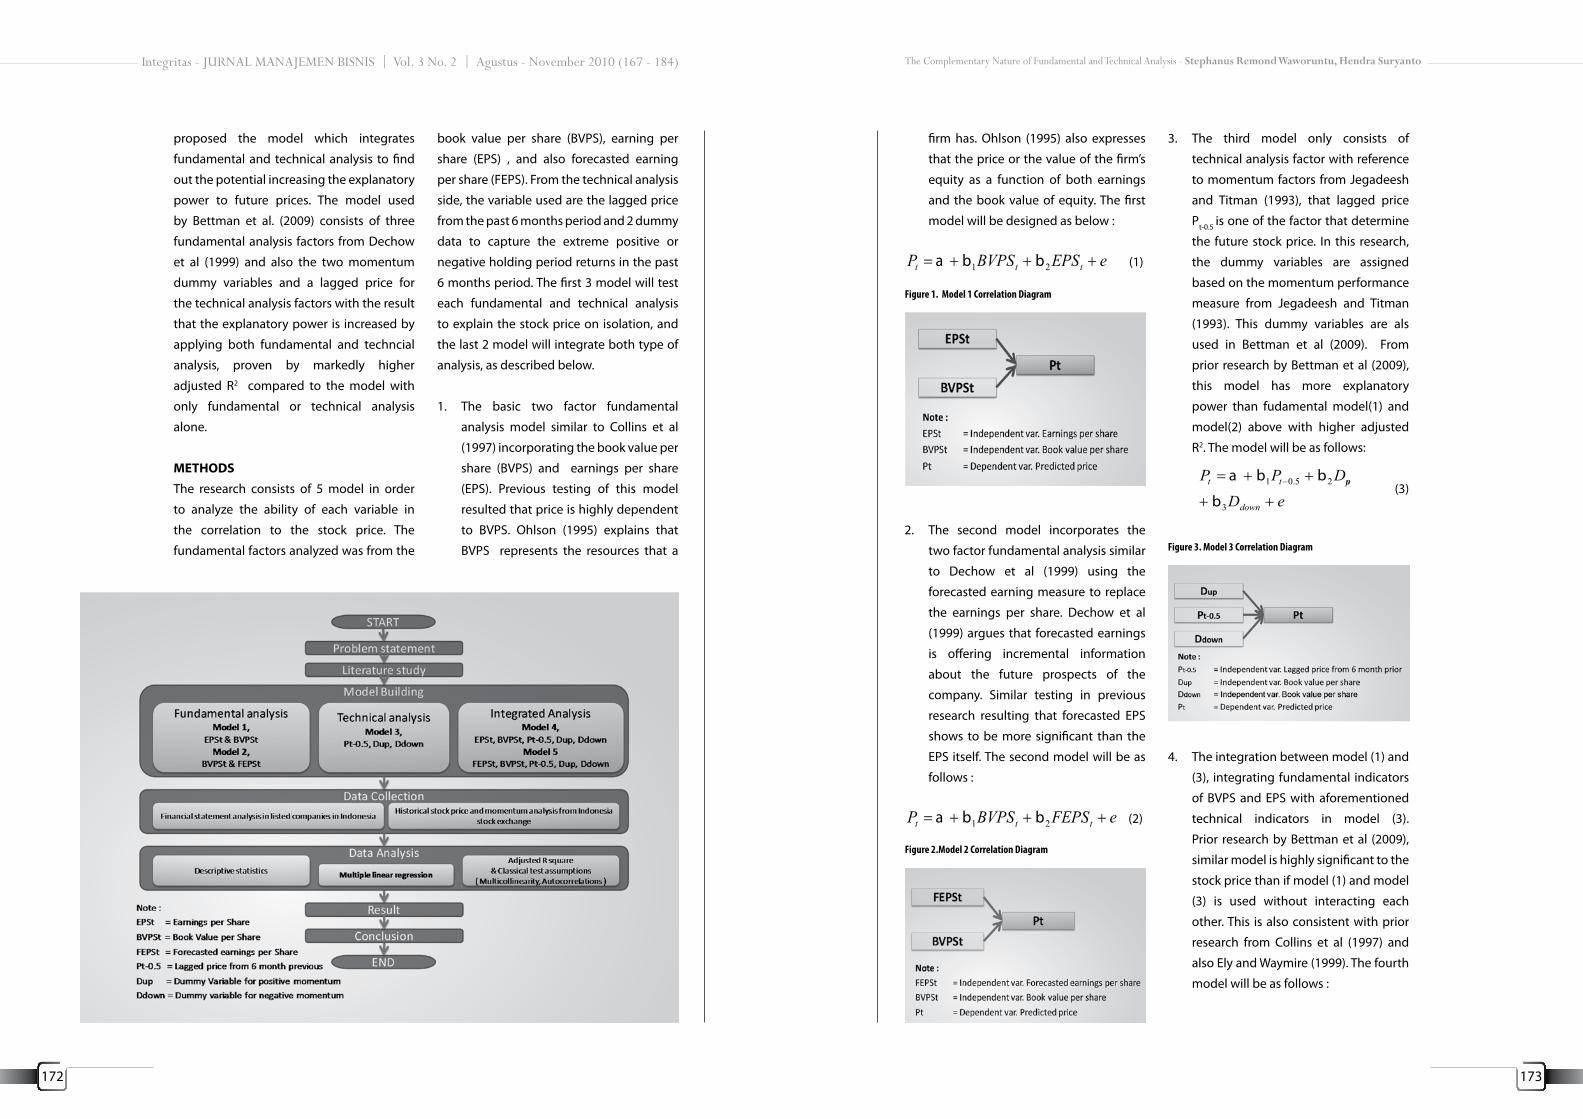
firm has. Ohlson (1995) also expresses
that the price or the value of the firm’s
equity as a function of both earnings
and the book value of equity. The first
model will be designed as below :
eEPSBVPSP ttt +++= 21 bba (1)
2. The second model incorporates the
two factor fundamental analysis similar
to Dechow et al (1999) using the
forecasted earning measure to replace
the earnings per share. Dechow et al
(1999) argues that forecasted earnings
is offering incremental information
about the future prospects of the
company. Similar testing in previous
research resulting that forecasted EPS
shows to be more significant than the
EPS itself. The second model will be as
follows :
eFEPSBVPSP ttt +++= 21 bba (2)
3. The third model only consists of
technical analysis factor with reference
to momentum factors from Jegadeesh
and Titman (1993), that lagged price
Pt-0.5 is one of the factor that determine
the future stock price. In this research,
the dummy variables are assigned
based on the momentum performance
measure from Jegadeesh and Titman
(1993). This dummy variables are als
used in Bettman et al (2009). From
prior research by Bettman et al (2009),
this model has more explanatory
power than fudamental model(1) and
model(2) above with higher adjusted
R2. The model will be as follows:
eD
DPP
down
uptt
++
++= −
3
25.01
b
bba (3)
4. The integration between model (1) and
(3), integrating fundamental indicators
of BVPS and EPS with aforementioned
technical indicators in model (3).
Prior research by Bettman et al (2009),
similar model is highly significant to the
stock price than if model (1) and model
(3) is used without interacting each
other. This is also consistent with prior
research from Collins et al (1997) and
also Ely and Waymire (1999). The fourth
model will be as follows :
Figure 1. Model 1 Correlation Diagram
Figure 2.Model 2 Correlation Diagram
Figure 3. Model 3 Correlation Diagram
proposed the model which integrates
fundamental and technical analysis to find
out the potential increasing the explanatory
power to future prices. The model used
by Bettman et al. (2009) consists of three
fundamental analysis factors from Dechow
et al (1999) and also the two momentum
dummy variables and a lagged price for
the technical analysis factors with the result
that the explanatory power is increased by
applying both fundamental and techncial
analysis, proven by markedly higher
adjusted R2 compared to the model with
only fundamental or technical analysis
alone.
METHODS
The research consists of 5 model in order
to analyze the ability of each variable in
the correlation to the stock price. The
fundamental factors analyzed was from the
book value per share (BVPS), earning per
share (EPS) , and also forecasted earning
per share (FEPS). From the technical analysis
side, the variable used are the lagged price
from the past 6 months period and 2 dummy
data to capture the extreme positive or
negative holding period returns in the past
6 months period. The first 3 model will test
each fundamental and technical analysis
to explain the stock price on isolation, and
the last 2 model will integrate both type of
analysis, as described below.
1. The basic two factor fundamental
analysis model similar to Collins et al
(1997) incorporating the book value per
share (BVPS) and earnings per share
(EPS). Previous testing of this model
resulted that price is highly dependent
to BVPS. Ohlson (1995) explains that
BVPS represents the resources that a

The Complementary nature of fundamental and Technical Analysis - Stephanus Remond Waworuntu, Hendra Suryanto
174 175
integritas - JuRnAl MAnAJeMen BiSniS | vol. 3 no. 2 | Agustus - november 2010 (167 - 184)
=0) or bearish (Dup=0, Ddown =1) market
condition.
The data used here has already been
tested several times with the consistent
output using SPSS Statistics 17 and SPSS
Amos Graphics 18. The final data used
for the research includes 183 firm – year
observations .
The population for this research was all the
listed company in Indonesia stock exchange,
consisting 398 listed issuers based on IDX
statistics launched in august 2009.
For the research data, the stocks were filtered
using the member of LQ45 investment
grade stocks as listed every second quarter
of 2004 - 2009 based on Indonesian Stock
exchange commitee’s announcement letter.
The sample stocks used in this research
should have positive book value.
RESULTS AND DISCUSSION
Descriptive Statistics & Correlation
Matrix
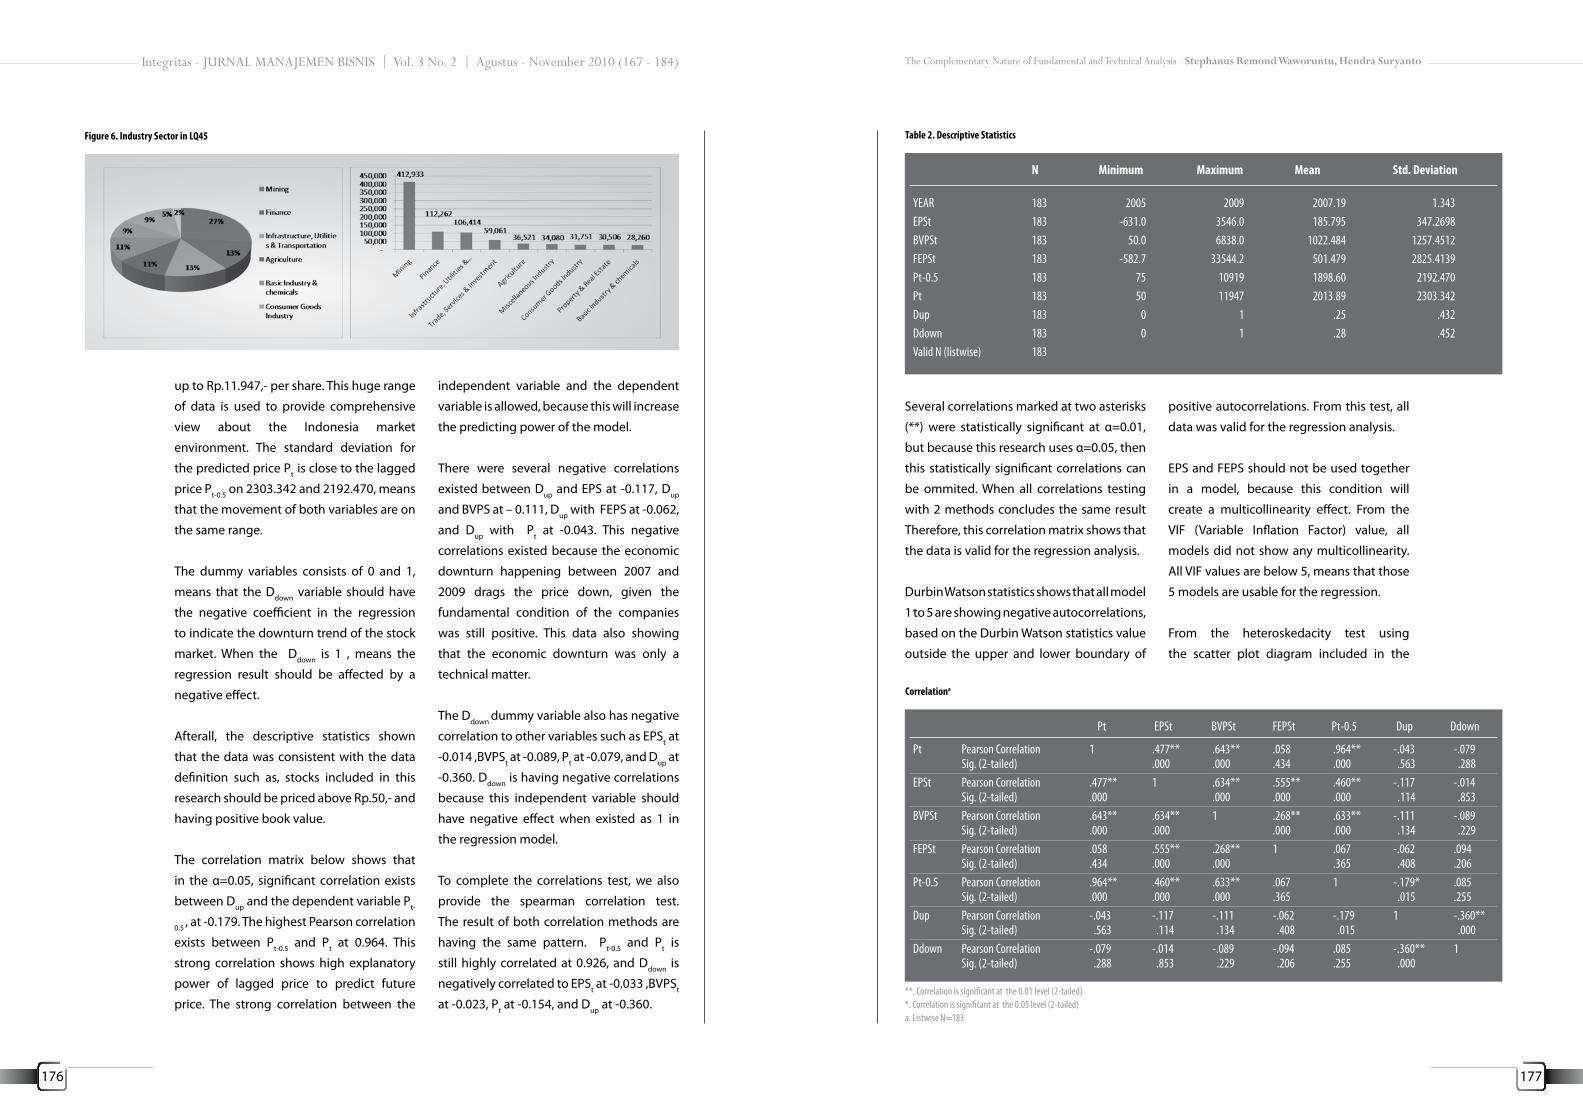
From the whole sample of LQ45 listed
companies, the composition is as depicted
below. The pie chart on the left side is the
company sector composition in Indonesia.
The right side bar chart shows the trading
value composition of LQ45 listed companies.
The highest trading value and number of
companies are in the mining sector with 27%
of total companies, followed by the finance
at 13% and also infrastructure. This condition
is due to the bullish oil price and also the
large market cap of PT. Bumi Resources. This
coal mining company alone covers 20%
more of the total transaction in 2009.
Provided the descriptive statistics below,
the range of price in Indonesia stock market
is very broad. The price of stocks included in
this sample is ranging from Rp.50 per share
Variable Usage Definition
Pt Dependent VariableForecasted Data
The Stock price after the earnings report was released for year t. The stock price is adjusted for capitalization changes , using the adjusted close price.
Pt-0.5 Independent VariableTechnical analysis
The stock price at the beginning of month of 6 month prior to the date of Pt, The stock price is also adjusted for capitalization changes, using the adjusted close price.
BVPSt Independent VariableFundamental analysis
The book value of the outstanding shares and adjusted with capitalization changes, the data was taken from annual report of the most recent year t.
EPSt Independent VariableFundamental analysis
The diluted earnings per share data of the outstanding shares and adjusted with capitalization changes. Data was taken from the annual report of the most recent year t.
FEPSt Independent VariableFundamental analysis
The forecast earnings per share which was forecasted by the author using the EPS t which could be used as the company performance forecast for period t.
Dup Independent VariableTechnical analysis
The dummy variable for the momentum analysis purpose. Equal to 1 when the stock holding period return of 6 month before month t compared to 5 year before is extremely positive and placed in the highest performance quarter. Otherwise, it will be set to 0.
Ddown Independent VariableTechnical analysis
The dummy variable for the momentum analysis purpose. Equal to 1 when the stock holding period return of 6 month before month t compared to 5 year before is extremely negative and placed in the highest performance quarter, otherwise , it will be set to 0.
Table 1. Variable Description
eDDPEPSBVPSP
downupt
ttt
++++++=
− 545.03
21
bbb
bba (4)
5. Model 5 is the integration between
model (2) and (3) as researched by
Bettman et al (2009) with the result
that the more variable with additional
forecasted EPS does not increase the
significance level of the explanatory
power of the share price. This is
consistent with Dechow et al (1999)
comments that the book value adds
very little additional information about
stock prices beyond that contained
in analysts’ forecasts of next year’s
earnings. Prior research shows that this
model had a little bit better explanatory
power. the model will be as follows :
eDDPFEPSBVPSP
downupt
ttt
++++++=
− 545.03
21
bbb
bba (5)
The book value per share and earnings per
share was taken from the most recently
ended fiscal year. To be consistent with prior
research by Bettman et al (2009), these data
were excluded from the research :
- Selected stocks with BVPS less than 0
- Invalid data which was late disclosed
over 90 days and not recorded on the
IDX database
- All data which quality is questionable
- Stock with price less than Rp.50 as the
minimum listed price
To ensure the accuracy of the data, all data
was downloaded from the indonesia stock
exchange database. The Dummy Variables
in this research was derived from the lagged
price. The use of 2 dummy variable was to
reflect the extremely positive or negative
stock return or the extremely negative
market return as used by Bettman et al
(2009). The Dup variable was used to flag
the extremely positive momentum. The
value is set to 1 when the stock holding
period return in the 6 months prior is higher
than the highest performance quarter
of the historical 5 years stock return. This
reflects the extremely bullish momentum
of the stock. When the market condition is
sideways or downturn, the value is set to
0. The Ddown variable was used to flag the
extremely negative momentum. The value is
set to 1 when stock holding period return in
the 6 months prior is lower than the lowest
performance quarter of the historical 5 years
stock return. This reflects the extremely
bearish momentum of the stock. When the
market condition is sideways or bullish, the
value is set to 0.
Given the condition above, Dup and Ddown
variable has three conditions, either both
values are 0 when the market is sideways,
or either one is 1 in the bullish (Dup=1, Ddown
Figure 4. Model 4 Correlation Diagram
Figure 5. Model 5 Correlation Diagram
The Complementary nature of fundamental and Technical Analysis - Stephanus Remond Waworuntu, Hendra Suryanto
176 177
integritas - JuRnAl MAnAJeMen BiSniS | vol. 3 no. 2 | Agustus - november 2010 (167 - 184)
Several correlations marked at two asterisks
(**) were statistically significant at α=0.01,
but because this research uses α=0.05, then
this statistically significant correlations can
be ommited. When all correlations testing
with 2 methods concludes the same result
Therefore, this correlation matrix shows that
the data is valid for the regression analysis.
Durbin Watson statistics shows that all model
1 to 5 are showing negative autocorrelations,
based on the Durbin Watson statistics value
outside the upper and lower boundary of
positive autocorrelations. From this test, all
data was valid for the regression analysis.
EPS and FEPS should not be used together
in a model, because this condition will
create a multicollinearity effect. From the
VIF (Variable Inflation Factor) value, all
models did not show any multicollinearity.
All VIF values are below 5, means that those
5 models are usable for the regression.
From the heteroskedacity test using
the scatter plot diagram included in the
N Minimum Maximum Mean Std. Deviation
YEAREPStBVPStFEPStPt-0.5PtDupDdownValid N (listwise)
183183183183183183183183183
2005-631.0
50.0-582.7
7550
00
20093546.06838.0
33544.21091911947
11
2007.19185.795
1022.484501.4791898.602013.89
.25
.28
1.343347.2698
1257.45122825.4139
2192.4702303.342
.432
.452
Table 2. Descriptive Statistics
Pt EPSt BVPSt FEPSt Pt-0.5 Dup Ddown
Pt
EPSt
BVPSt
FEPSt
Pt-0.5
Dup
Ddown
Pearson CorrelationSig. (2-tailed)Pearson CorrelationSig. (2-tailed)Pearson CorrelationSig. (2-tailed)Pearson CorrelationSig. (2-tailed)Pearson CorrelationSig. (2-tailed)Pearson CorrelationSig. (2-tailed)Pearson CorrelationSig. (2-tailed)
1
.477**
.000
.643**
.000
.058
.434
.964**
.000-.043 .563-.079 .288
.477**
.0001
.634**
.000
.555**
.000
.460**
.000-.117 .114-.014 .853
.643**
.000
.634**
.0001
.268**
.000
.633**
.000-.111 .134-.089 .229
.058
.434
.555**
.000
.268**
.0001
.067
.365-.062 .408-.094 .206
.964**
.000
.460**
.000
.633**
.000
.067
.3651
-.179 .015.085.255
-.043 .563-.117 .114-.111 .134-.062 .408-.179* .0151
-.360** .000
-.079 .288-.014 .853-.089 .229.094.206.085.255-.360** .0001
Correlationa
**. Correlation is significant at the 0.01 level (2-tailed) *. Correlation is significant at the 0.05 level (2-tailed)a. Listwise N=183
up to Rp.11.947,- per share. This huge range
of data is used to provide comprehensive
view about the Indonesia market
environment. The standard deviation for
the predicted price Pt is close to the lagged
price Pt-0.5 on 2303.342 and 2192.470, means
that the movement of both variables are on
the same range.
The dummy variables consists of 0 and 1,
means that the Ddown variable should have
the negative coefficient in the regression
to indicate the downturn trend of the stock
market. When the Ddown is 1 , means the
regression result should be affected by a
negative effect.
Afterall, the descriptive statistics shown
that the data was consistent with the data
definition such as, stocks included in this
research should be priced above Rp.50,- and
having positive book value.
The correlation matrix below shows that
in the α=0.05, significant correlation exists
between Dup and the dependent variable Pt-
0.5 , at -0.179. The highest Pearson correlation
exists between Pt-0.5 and Pt at 0.964. This
strong correlation shows high explanatory
power of lagged price to predict future
price. The strong correlation between the
independent variable and the dependent
variable is allowed, because this will increase
the predicting power of the model.
There were several negative correlations
existed between Dup and EPS at -0.117, Dup
and BVPS at – 0.111, Dup with FEPS at -0.062,
and Dup with Pt at -0.043. This negative
correlations existed because the economic
downturn happening between 2007 and
2009 drags the price down, given the
fundamental condition of the companies
was still positive. This data also showing
that the economic downturn was only a
technical matter.
The Ddown dummy variable also has negative
correlation to other variables such as EPSt at
-0.014 ,BVPSt at -0.089, Pt at -0.079, and Dup at
-0.360. Ddown is having negative correlations
because this independent variable should
have negative effect when existed as 1 in
the regression model.
To complete the correlations test, we also
provide the spearman correlation test.
The result of both correlation methods are
having the same pattern. Pt-0.5 and Pt is
still highly correlated at 0.926, and Ddown is
negatively correlated to EPSt at -0.033 ,BVPSt
at -0.023, Pt at -0.154, and Dup at -0.360.
Figure 6. Industry Sector in LQ45

The Complementary nature of fundamental and Technical Analysis - Stephanus Remond Waworuntu, Hendra Suryanto
178 179
integritas - JuRnAl MAnAJeMen BiSniS | vol. 3 no. 2 | Agustus - november 2010 (167 - 184)
value also not significant at p value of 0.056
and 0.870. While forecasted earnings and
book values in model 5 is also insignificant
with p value of 0.259 and 0.808. These
numbers are higher than the α= 0.05 value,
meaning that in model 4 and 5, book values
are no longer significant when integrated
with the technical factors. The other p
values are significant. Given these numbers,
the high significance of lagged price and
momentum dummy variables dismisses
the book value, earnings, and forecasted
earnings.
Ddown coefficient was always negative,
shown in model 3 for -669.860, model 4
for -653.083, and for model 5 for -652.361.
These numbers indicates that when Ddown
dummy variable existed in the model, and
the value is set to 1, this variable will provide
negative effect in the whole model.
From the regression result shown below,
model 1 with EPS and BVPS fundamental
factors has an adjusted R2 for 0.415. Model
2 with FEPS increased the predictive power
with an adjusted R2 for 0.421. Model 3
which consists only technical factors of
lagged price Pt-0.5, Ddown, and Dup had sharply
increased the predictive power much higher
than the previous models with the adjusted
R2 value up to 0.961.
By integrating the fundamental factor
of BVPS and EPS with technical factor of
lagged price Pt-0.5, Ddown, and Dup in model 4,
the predictive power was higher than the
previous models with the adjusted R2 value
Regression Statistics Model 1 Model 2 Model 3 Model 4 Model 5
Constant
BVPSt
EPSt
FEPSt
Pt-0.5
Ddown
Dup
CoefficientStandard Errorp value
CoefficientStandard Errorp value
CoefficientStandard Errorp value
CoefficientStandard Errorp value
CoefficientStandard Errorp value
CoefficientStandard Errorp value
CoefficientStandard Errorp value
804.559168.063-
1.0420.134-
0.7720.4860.114**
798.418167.266-
1.2380.107-
0.1000.0480.038
113.891 58.5810.053**
1.0410.016-
(669.880) 19.563-
463.654 84.393-
91.98960.5830.131**
0.0070.0400.870**
0.2400.1250.056**
1.0210.020-
(653.083) 80.418-
476.824 83.858-
1.0250.0200.134**
0.0420.0370.259**
0.0030.0130.808**
1.0250.020-
(652.361)82.056-
470.96984.664-
* All values are calculated on 95% Confidence level**= Insignificant oefficient
appendix, the heteroskedastic pattern is not
existed. By this finding, the test data is free
from heteroskedacity, and valid for testing.
From the regression result below, for the
fundamental analysis model, only model 2
shows that book value and forecasted EPS
was significant. In the technical analysis
model 3, All variables are highly significant
in explaining the stock price. But for the
integrated model, only earnings per share as
the fundamental factor in model 4 that was
still positively significant when integrated
with the technical factors.
Using α= 0.05 and degree of freedom of
183, in model 1, earnings was not significant
at p=0.114. In model 4, earnings and book
Pt EPSt BVPSt FEPSt Pt-0.5 Dup Ddown
Spearman’s rho
Pt
EPSt
BVPSt
FEPSt
Pt-0.5
Dup
Ddown
Correlation CoefficientSig. (2-tailed)Correlation CoefficientSig. (2-tailed)Correlation CoefficientSig. (2-tailed)Correlation CoefficientSig. (2-tailed)Correlation CoefficientSig. (2-tailed)Correlation CoefficientSig. (2-tailed)Correlation CoefficientSig. (2-tailed)
1.000..750**.000.754**.000.659**.000.926**.000.043.563-.154 .037
.750**
.0001.000..767**.000.733**.000.713**.000-.005 .947-.033 .653
.754**
.000
.767**
.0001.000..677**.000.735**.000-.069 .356-.023 .760
.659**
.000
.733**
.000
.677**
.0001.000..621**.000.008.910.017.820
.926**
.000
.713**
.000
.735**
.000
.621**
.0001.000.-.182 .014.074.317
.043
.563-.005 .947-.069 .356.008.910-.182* .0141.000.-.360** .000
-.154 .037-.033 .653-.023 .760.017.820.074.317-.360** .0001.000.
Correlationa
**. Correlation is significant at the 0.01 level (2-tailed) *. Correlation is significant at the 0.05 level (2-tailed)
a. Listwise N=183
Data Testing Model 1 Model 2 Model 3 Model 4 Model 5
AutocorrelationDurbin Watson
Multi CollinearityVIF Value
BVPStEPStFEPStPt-0.5DdownDup
Heteroskedacitypattern exists?
0.698
1.6731.673
No
0.672
1.077
1.077
No
2.025
1.0341.1491.179
No
1.999
2.2971.694
1.7491.1961.186
No
1.985
1.923
1.1231.7831.2201.184
No
Data validation & Regression Testing
= Multicollinearity exists

The Complementary nature of fundamental and Technical Analysis - Stephanus Remond Waworuntu, Hendra Suryanto
180 181
integritas - JuRnAl MAnAJeMen BiSniS | vol. 3 no. 2 | Agustus - november 2010 (167 - 184)
explanatory power than only using Ohlson’s
(1995 ) two factor model. The testing result
shows that the forecasted earnings variable
is still statistically significant in this model.
The small increase of explanatory power
when we replace EPS with forecasted EPS
seen from the increased adjusted R2 value
from 41.50% to 42.10% is consistent to
Dechow et al (1999). He stated that analyst
forecast of next year’s earnings has the
same value relevant information in current
earnings. This is why the significance only
increased a bit in model 2. Ely and Waymire
(1999) research shows the same findings
that the additional of earnings variable will
have an increased explanatory power than
only using book value alone.
Model 3 is purely using technical analysis
to predict the future price. Consistent with
prior research by Bettman et al. (2009), all
technical factors are significant. This result
is consistent with the Charles Dow theory,
that past prices can predict future price.
The momentum effect in indonesia is highly
clear in the charting. It can be easily seen
from the sharp upturn and downturn of
the market recently. For example, in the
bullish market at 2007, the composite index
can climb from around 1.000 up to 2.500
just in one year. But in the bearish market
at 2009, the composite falls from 2.700 to
1.200 just in 4 months. This proves the great
momentum effect in Indonesia.
The previous model 1 to 3 analyzes the
explanatory power of the fundamental
and technical factors in isolation without
any interaction. When both factors were
combined in model 4 without including the
forecasted earnings in the model proves to
increase the explanatory power with the
higher adjusted R2 value at 96.20%.
When the price is integrated with the
momentum effect from Jegadeesh and
Titman (1993), this finding also showing
the momentum effect that stocks which
performs well at the last 3 to 12 months will
tend to perform the same for the next 3 to
12 months. The ability of technical analysis
alone in model 3 to predict future prices is
a lot higher than the fundamental analysis
from model 1 and 2, shown with the higher
adjusted R2 value up to 96.10 %.
The result in model 5 is that the book value
and forecasted earnings are being the
positive explanator to the future price. The
use of forecasted earnings merely decrease
the explanatory power than model 4. This is
also consistent with the findings in model 2
and also with Dechow et al (1999) who says
the information in the forecasted earnings
is the same as contained in earnings itself.
However, the adjusted R2 value was still
around 96.10%.
When fundamental factors were integrated
with technical factors, the price is no longer
positively dependent with the book value.
All the other factors are still statistically
significant to price. The high predictive
power of technical factors dismisses the
explanatory power of book value per share.
This result is consistent with prior research
from Bettman et al ( 2009 ) which consists of
several fundamental factors combined with
lagged price and two dummy momentum
variables.
Technical analysis itself plays major role in
Indonesian trading environment, shown
from the huge difference of adjusted R2
up to 0.962, with EPS as the only significant
fundamental factor. The last model 5 with
FEPS replacing EPS does not increase the
predictive power higher than model 4, but
this model was still statistically significant
with the adjusted R2 value up to 0.961.
The F-test result shows that the most
significant factor in these models are model
3, consisting only technical factors with the
F significance value of 1510.089. All F values
are significant which concludes that all
models are statistically valid for predictions.
Discussion
The first model 1 and model 2 only uses
fundamental factors to explain prices. From
model 1, the testing with the IDX data
resulted that price is positively dependent
on book value per share, which is consistent
with the theory of clean surplus by Ohlson
(1995) who stated that book value as the
main estimators for share price.
When the book value per share was
combined with earnings per share, earnings
per share is less significant to price because
of the high correlation between book
value and earnings at 0.634, which should
be significant with α=0.01. The finding is
consistent with Dechow et al (1999) which
states that the book value contains value
relevant information beyond that already
contained in earnings, but they load
positively and significantly in regressions.
From model 1, the adjusted R2 value is
statistically significant at 41.50% means that
this model is still able to predict the future
price.
It seems that book value is the most
significant predictor in the fundamental
analysis model 1 and 2, this condition is
consistent with Ohlson (1995) which stated
that book value are unbiased estimators of
market values in that the expected goodwill
equals zero, and book value alone predicts
earnings, thus it suffices to determine market
value. This statement from Ohlson (1995) is
consistent with the findings in model 1 and
2, which book value has the highest t value
at 7.761 and 11.543. This t value is much
higher than the other fundamental factors
such as EPS and also forecasted EPS. In
model 1, the high significance of book value
merely dismisses the significance of EPS in
determining the stock price with the t value
of only 1.587.
The result of model 1 also confirms the
research of Collins ( 1997 ) who concluded
that earnings and book values act as
substitutes for each other in explaining price,
while they also function as complements by
providing explanatory power incremental
to one another.
The use of forecasted earnings per share
to replace earnings per share on model 2
increases the explanatory power shown by
the higher adjusted R2 value up to 42.10%.
This is also consistent with Dechow et al
(1999) which also states that the addition of
forecasted earnings per share increases the
Regression Statistics Model 1 Model 2 Model 3 Model 4 Model 5 Model 6
Value of R2
Adjusted R2
F SignificanceF table
0.4210.415
65.5603.000
0.4270.421
67.1502.600
0.9620.961
1.510.0892.370
0.9630.962
924.1862.210
0.9620.961
904.7782.210
0.9630.962
1.161.5762.210

The Complementary nature of fundamental and Technical Analysis - Stephanus Remond Waworuntu, Hendra Suryanto
182 183
integritas - JuRnAl MAnAJeMen BiSniS | vol. 3 no. 2 | Agustus - november 2010 (167 - 184)
Indonesia stock market , technical analysis
takes much greater role in determining
future prices than the fundamental analysis
alone. The availablility of momentum
effect dismisses random walk hypothesis.
Integrating fundamental and technical
analysis in the model will provide superior
explanatory power than fundamental or
technical analysis alone. This was shown
by higher adjusted R2 values from the
integrated model.
Finally, fundamental analysis can be used
in determining which stocks or portfolio
is prosperous in the future, and technical
analysis can be used in determining the
right time to buy or sell the stocks. By
integrating both type of analysis, investors
can get superior profit than the buy and
hold strategy.
This research is only using samples from
LQ45, and only done with 5 years time
period and for further research, can be
expanded up to the whole Indoensian stock
exchange member for longer time period,
so the data will be more representative and
more complete than current research.
This research can also be enriched by
adding more factors which are statistically
significant when integrated in each
fundamental or technical analysis, to find
the best fit for Indonesian stock market.
Beaver, W., R. Lambert, & D. Morse. (1980). The Information content of Security prices. Journal of Financial Economics, 42, 257 – 297.
Bettman, Jenni L., Sault Stephen J., & Schultz, Emma L. (2009). Fundamental and Technical Analysis, Substitutes or complements. AFAANZ Journal of Accounting and Finance, 49, 21 - 36 .
Brown, Keith C. & Reilly, Frank K.. (2009). Analysis of Investments and Management of Portfolios. (9 ed.). South Western, a part of Cengage Learning, Canada.
Collins, D., E. Maydew, & I. Weiss. (1997). Changes in the value relevance of earnings and book values over the past forty years. Journal of Accounting and Economics, 24, 39 – 68.
Damodaran, Aswath. (2007). Investment Valuation, Tools and Techniques for
Determining the Value of Any Asset. USA: John Wiley & Sons
Dechow, P., A. Hutton, & R. Sloan. (1999). An empirical assessment of the residual income model. Journal of Accounting and Economics, 26, 1-34.
Ely, K., & G. Waymire. (1999). Accounting standard-setting organizations and earnings relevance: Longitudinal evidence from NYSE common stocks. 1927 – 93. Journal of Accounting Research, 37, 293 – 317.
Fama, E., & K. French. (1993). Common risk factors in the returns on stocks and bonds. Journal of Financial Economics, 33, 3 – 56.
Gordon, M., & E. Shapiro. (1956). Capital equipment analysis: the required rate of profit. Management Science, 3, 102-110.
Graham, B., & D. Dodd. (1934). Security Analysis: The Classic 1934 Edition. New York:
References
value from 42.10% with fundamental factors
alone up to 96.10 % with the technical
analysis alone. The most significance
explanator is the lagged price itself, shown
by the highest correlation between lagged
price and predicted price up to 0.964 in the
correlation matrix.
MANAGERIAL IMPLICATIONS
This study shows that in Indonesia, for the
fundamental analysis alone, book value is
the best predictor in explaining the stock
price with the highest significance among
the forecasted EPS and EPS variable. The
addition of EPS as complement increases
the explanatory power of book value.
Forecasted EPS also has a significant effect
in explaining stock price, but because it is
not publicly available, the forecasted EPS
didn’t load much in the model’s predictive
power.
In Indonesia, most of the stock broker
service provide charting service on their
portal, so many investors can see the
movement of stock prices and the trend
beyond it. This condition promotes the
usage of technical analysis based on charts
and price movements alone. With more
people responds to the price movements,
the lagged price became a very significant
factor in determining their trading
decisions. For example, when one stock had
ever reaches a new high price level, people
tend to believe that the price will try to
break that level somewhere in the future.
This condition make people rely heavily on
the past price level to determine the buy or
sell time.
The research result shows that fundamental
or technical analysis alone in isolation
can give enough explanatory power to
predict future prices, but in Indonesia,
technical analysis plays the biggest role in
determining future price movements. These
findings dismisses the random walk theory
and also prove that momentum factor is
existed in the Indonesian stock market.
By having the information that the technical
analysis can give higher explanatory
power, traders in Indonesia can get a high
momentum profits by using technical
analysis alone, and this also as a proof that
momentum effect which was found in most
major developed markets throughout the
world except Japan, also works in Indonesia
stock exchange.
The low explanatory power of forecasted
EPS in this model is because forecasted EPS
is not available to public in Indonesia. In
normal condition, when general investors
didn’t have any access to this data, they
didn’t made their trading decisions based
on this data.
Adjusted R2 values in this study also
concludes that the integrated fundamental
and technical analysis model provides
greater explanatory power than those
in isolation. This complementary nature
of technical and fundamental analysis is
consistent with a survey from Taylor and
Allen ( 1992 ) that traders can use both
chartist input from technical analysis for
the good timing to enter or exit the market,
and also fundamental analysis to select the
good portfolio.
CONCLUSION
This research was focused in the ability
of integrated fundamental and technical
factors in determining the future prices.
The result of this research concludes that in

185184
integritas - JuRnAl MAnAJeMen BiSniS | vol. 3 no. 2 | Agustus - november 2010 (167 - 184)
PeRAnAn fAKToR-fAKToR individuAl dAlAM MengeMBAngKAn uSAhAStudi Kuantitatif pada Wirausaha Kecil di Salatiga
The enormous number of micro enterprises contributes relatively low to the aggregate economy. This is due to the fact that many small businesses do not grow although it has been run for years. Reluctance to grow may be due to, for instance, the desire to retain ownership or avoidance of loss of satisfaction. This study aims to examine the influence of several individual factors that may affect growth intention. Those factors are the start-up motivation, self-efficacy and risk taking propensity of the business owners. The sample of this study were 50 pedagang kreatif lapangan in Salatiga who are the founder of his/her business. Multiple-regression analyses reveal that start-up motivation and self-efficacy significantly affect growth intention. This means that entrepreneurs who start their business because of some positive reasons and faith have greater intention to grow. The result also indicates that although a micro-entrepreneur has a high degree of risk taking propensity, his/her intention to grow may be low when he/she lacks of neither positive start-up motivation nor a high degree of self-efficacy.
Kontribusi usaha mikro terhadap perekonomian di Indonesia masih relatif kecil. Hal ini disebabkan oleh banyaknya usaha yang tidak berkembang walau telah dijalankan selama bertahun-tahun. Hambatan dalam mengembangkan usaha dapat disebabkan oleh faktor individu si pengusaha, misalnya hasrat untuk mempertahankan kepemilikan atau menghindari kehilangan kenyamanan menjalankan usaha dalam skala kecil. Studi ini bertujuan untuk mempelajari pengaruh dari beberapa faktor individual yang dapat mempengaruhi keinginan untuk mengembangkan usaha. Faktor-faktor yang dimaksud adalah motivasi positif (pull factor) saat mendirikan usaha, self-efficacy dan risk taking propensity dari pendiri yang masih menjalankan usaha. Sampel dalam studi ini adalah 50 pedagang kreatif lapangan di kota Salatiga yang juga merupakan pendiri usaha. Untuk mengetahui pengaruh faktor individu terhadap keinginan untuk mengembangkan usaha dilakukan analisis regresi berganda. Hasilnya menunjukkan bahwa semakin tinggi derajat pull factor saat mendirikan usaha dan self-efficacy pengusaha, semakin besar pula derajat keinginan untuk mengembangkan usaha. Namun demikian, studi ini tidak dapat membuktikan pengaruh risk taking propensity terhadap keinginan untuk mengembangkan usaha.
Keywords: growth intention, start-up motivation, entrepreneurial self-efficacy, risk taking propensity.
Komala InggarwatiUniversitas Kristen Satya Wacana, [email protected]
Arnold KaudinPrasetiya Mulya Business School, Jakarta [email protected]
Abstract
Peranan faktor-faktor individual dalam Mengembangkan usaha - Komala Inggarwati, Arnold Kaudin
McGraw-hill.
Jegadeesh, N., & S. Titman. (1993). Returns to buying winners and selling losers. Journal of Finance, 25, 469 – 482.
Jegadeesh, N., & S. Titman. (2001). Profitability of momentum strategies and evaluation of alternative explanations. Journal of Finance, 56, 599–720.
Jensen, M., & G. Bennington. (1970). Random walks and technical theories: some additional evidence. Journal of Finance, 25, 469 – 482.
Levine, David M, Stephan, David F., Krehbiel, Timothy C., & Berenson, Mark L.. (2008). Statistics for Managers using Microsoft Excel. New Jersey: Pearson Education.
Levy, Robert A. ( January – February, 1968). Random Walks: Reality of Myth-Reply. Financial Analysts Journal, 129 – 132.
Lo, A., & A. Mackinlay. (1999). A Non Random Walk down Wall Street. Princeton, NJ: Princeton University Press.
Moskowitz, Tobias J. & Grinblatt, Mark. (1999). Does Industry Explain Momentum. Journal of Finance, 54, 1249-1290.
Navarro, Peter. (2004). When The Market Moves Will You Be Ready. USA: McGraw Hill. Page 130 – 131.
Oberlechner, Thomas. (2001). Fundamental Analysis in the European Foreign Exchange Market. International Journal of Finance and Economics, 6, 81-93.
Ohlson, J. (1995). Earnings, Book Values and dividends in security valuation. Contemporary Accounting Research, 11, 661 – 687.
Petersen, M. (2008). Estimating standard errors in finance panel data sets: comparing approaches. Review of Financial Studies. Forthcoming
Pring, Martin J.. (2002). Technical Analysis Explained (4th ed.). USA: McGraw Hill. Page 36 - 45
Schwager, Jack D. (1995). Schwager on Futures : Fundamental Analysis. Canada: Wiley & Sons Inc. Page 228
Schwager, Jack D.. (1999). Getting Started in Technical Analysis. Canada: Wiley & Sons Inc. Page 3
Shim, Jae K., Ph. D, Siegel, Joel G., Ph. D, CPA. (2007). Handbook of Financial Analysis, Forecasting, And Modeling (3rd ed.). O.CCH. United States. Page 202.
Szabo, Andy CFA. (2004). Timing the Stock Market, Charles Dow and His Theory. Greenwich Financial Management Inc.
Taylor, M., & H. Allen. (1992). The use of technical analysis in the foreign exchange market. Journal of International Money and Finance, 11, 304–314.
Teweles, Richard J., & Bradley, S. Bradley. (1998). The Stock Market (7th ed.). Canada: Wiley and Sons, Inc.
Thomsett, Michael C. (1998). Mastering Fundamental Analysis. USA: Dearborn Financial Publishing. Page 3.
Thornsett, Michael C. (2006). Getting Started in Fundamental Analysis. Canada: Wiley. Page 34.
White, Gerald I., Sondhi, Ashwinpaul C., & Fried, Dov. (2003). The Analysis and Use of Financial Statement (3rd ed.). USA: Wiley & Sons.