Embed Size (px)
Citation preview
www.ccsenet.org/jas Journal of Agricultural Science Vol. 3, No. 3; September 2011
ISSN 1916-9752 E-ISSN 1916-9760 202
The Competitiveness of Sugar Cane Production: A Study of Kenana Sugar Company, Sudan
Abda Abdalla Emam (Corresponding author)
Sudan University of Science and Technology, Faculty of Agricultural Studies
Department of Agricultural Economics
PO box71, Khartoum North, Khartoum, Sudan
Tel: 2491-2281-2551 Email: [email protected]
Osman Mohamed Musa
Kenana Sugar Company, Sudan
Tel: 2491-2256-6707
Received: November 16, 2010 Accepted: November 30, 2010 doi:10.5539/jas.v3n3p202
Abstract
The study aimed to measure the competitiveness of sugar cane in Kenana Sugar Company as the major objective covering the seasons 2004/05, 2005/06, and 2006/07. Specific objectives are to measure the hard currency revenue gained, the quantity of local resources used to gain hard currency, efficiency of local resources used and to see whether Kenana Sugar Company is taxed or subsidized. The study depended mainly on secondary data which was collected from different sources. The data was analyzed using Policy Analysis Matrix (PAM). Also, sensitivity analysis was used. The study revealed that, sugar production appeared highly competitive in the national and international level under study period and government policies are taxing sugar cane production. The sensitivity analysis results summarized that: increasing in yield and world price result in improving sugar DRC and vice versa while increasing in exchange rate results in worsening DRC and vice versa. The study recommended that, the government should exempt sugar cane production from taxes, induce incentives to encourage sugar industry production and secure sustainable and steadiness foreign exchange.
Keywords: Sugar cane, Profitability, Competitiveness
1. Introduction
From the total cultivable area of the Sudan which is 200 million Fadden only 41 million Fadden are under crop production (Bank of Sudan, 2007). Agriculture contributes directly to the Gross Domestic Product (GDP) by 36.8 percent and indirectly by influencing other sectors activities (Bank of Sudan, 2006).The plant sector contributes with 56.5 percent of total agricultural sector (Bank of Sudan, 2006). The sugar industry contributes to the GDP as its role in achieving food security and indirectly in its diverse products for connecting industries as raw materials. Sugar processed by-product such as biogases which can be used for timber manufacture and mainly in generating electricity. Also, molasses can be used in yeast manufacturing, ethanol fuel and vinasse production. Sugar produces from either sugar beet or sugar cane and in the Sudan it was produced from sugar cane. There are five sugar factories four of them are governmental which are successively Elguneid, New Halfa, North East Sinnar and Assalaya where as the fifth one is private sector which is Kenana Sugar Company. The four public factories established from 1962 to 1980. In November 1976 the foundation stone of Kenana Sugar Company was laid and it starts its production in March 1981. It located on the eastern bank of the White Nile near Rabak town about 300 Km south of Khartoum and 1200 Km from Port Sudan. It is an investment between the Sudan government, government of Kuwait, Kingdom of Saudi Arabia the Arab investment Company, Sudan Development, the Arab Authority for Agric. Investment and Development, Sudanese Commercial Banks, Nissho Iwai Corporation, and Gulf Fisheries (Kenana Sugar Company, 2007). The main objective of Kenana Sugar Company with the other Sudan sugar factories is to contribute to self sufficiency in sugar in the Sudan and the Arab world. From table (1) the sugar produced from Kenana Sugar Company is fluctuated from season 2000/01 to season 2006/07. The broad objective of this study is to measure the competitiveness of sugarcane in Kenana Sugar Company; where as the specific objectives of the study can be summarized as follows: To analyze the competitiveness indicator measure as follow; is the sugar cane production has positive revenue of hard currency?,
www.ccsenet.org/jas Journal of Agricultural Science Vol. 3, No. 3; September 2011
Published by Canadian Center of Science and Education 203
is the sugar cane production use less local resources to gain foreign currency?, is the local resources allocated efficiently? And is the sugar suffering from taxes? According to the objectives the followings hypothesis are put; the sugar cane production generates hard currency, the sugar cane production use less local resources to gain foreign currency, the local resources allocated efficiently and the sugar suffering from taxes.
2. Research Methodology
2.1 Data Collection
The study depends mainly on secondary data which was collected from many sources; Published reports, theses of graduate studies and experience of the study writer for a long time in sugar cane management, central Bank of the Sudan annual reports, Kenana Sugar Company annual and periodic reports and other miscellaneous reports documents.
2.2 Method of analysis
The data was analyzed using Policy Analysis Matrix. It is designed to measure the divergence between actual market prices and efficiency prices. Efficiency prices are those prices that would have existed if all markets were perfectly competitive and the economy was in a state of general equilibrium.
The PAM is based on the simple equation:
Profits = Revenues – Costs
2.2.1 Construction of the PAM
In PAM, cost is broken down into tradable and non-tradable inputs. Profit, revenue and the two types of costs are then calculated using both the actual and efficiency prices (table 2).
The measures of social, private profitability and the net policy impact on output and input are shown in Table 3.
The PAM frame defines a commodity system to include four activities: farm production, delivery from farm to processor, processing and delivery from processor to the wholesale market (Pearson and Monke, 1987).
2.2.2 Measurement of shadow prices
In order to correct for the distortions caused by monopolistic practices, lack of information, institutional rigidities, tax levies etc, market prices are replaced by efficiency accounting or shadow prices.
Prices of all inputs and outputs are measured at their international price (when available), or in terms of equivalents for goods for which international price can be identified.
Tradable goods: tradable goods have border prices and an international price for them can be identified and measured at the border price (taking into account the quality if there are differences in quality). If the final price has to be expressed at different levels, for example, at the farm-gate, the local cost of handling, transport, marketing, etc must be deducted from border price. The local costs of handling, marketing etc. are usually non-traded, and have to be adjusted through some conversion factors into their shadow price. A conversion factor is the ratio of the alternative output value at border price to the actual output value at market prices.
Non-tradable goods: non- tradable goods have no readily available border prices by which social value can be measured. Non- tradable goods can be broken down into tradable and primary factors of production. Primary factors refer basically to labor and land, the essential domestic resources.
Labor: labor cost is obtained by multiplying the number of man-day by the average wage paid. The labor market evaluation involves recognition of the many types of labor and the choices of the market prices to represent the difference in sex, age and skill levels. The market wage rate often differs from the opportunity cost, because of the minimum wage legislation, powerful trade unions and other elements of imperfect competition in the society (Brown, 1983).
The economic wage rate (EWR) is estimated as follows:
EWR = M *AR
Where; M is the marginal output in domestic prices; and AR is the accounting ratio which converts M into foreign exchange equivalent.
Marginal productivity can be calculated by dividing the value of total agricultural output at economic prices by the total agricultural labor force the problem here is that the output from the withdrawal of a unit of labor may be less than the average productivity of labor because the remaining labor may work harder (Little and Mirrless, 1988). The other drawback is that the output from the other method for estimating marginal productivity is to estimate the number of days in which labor is more or less fully employed in the year, multiplied by the per-day
www.ccsenet.org/jas Journal of Agricultural Science Vol. 3, No. 3; September 2011
ISSN 1916-9752 E-ISSN 1916-9760 204
marginal productivity. Any payments in kind should be added to the cost of labor. Estimation of (M) is difficult, for the unavailability of information. The shadow wage rate (SWR) can be estimated for each category of labor by multiplying the market wage by the appropriate conversion factor (Gittinger, 1982).
SWR = market wage rate of a particular category multiplied by the conversion factor of that category.
Skilled labor is short in supply and expected to be fully employed. So, skilled labor will be assigned a conversion factor equal to one.
For unskilled labor, the situation is more complicated due to seasonal and regional employment variation. So, the conversion factor was taken from appendix A.
The shadow price of land is calculated by its opportunity cost. The opportunity cost of land is the output by using land for producing the commodity. The shadow exchange rate is estimated according to the World Bank methodology as a weighted average of official and black market exchange rates. In case where exchange rates implies an overvaluation of the domestic currency, the free market rate implies an under-valuation, since it bears a risk premium. The shadow exchange rate is estimated by the formula:
SER = AOSR (X) + ABMER (1-X)
Where; SER = Shadow exchange rate
AOER = Weighted average of official exchange rate.
ABMER = Weighted average of black market exchange rate
X = the share of foreign exchange transacted through the
official exchange rate.
1-X = is the share of foreign transactions priced at the
weighted average of the black market exchange rate.
Financial analysis equations:
For local commercial inputs (which are having no international prices) can be calculated by transferring it into local currency by using official exchange rate using the following equations:
FPti = Fxi × total cost (pound//ton) × AOER
Whereas: FPti = the financial price of the ith tradable input
Fxi = foreign component of the ith tradable inputs.
AOER = Average official exchange rate
For non-commercial inputs using the following equation:
FPni = (1- Fxi) × total cost (SDG/ton) × AOER
FPni = financial price of the ith non-tradable input.
Ready calculated foreign component and conversion factors are used according to Kenana Sugar Company. Appendix (A) summarizes the conversion factors for different items.
Economic analysis equations:
For transferring the financial prices into economic prices the following equations are used:
For tradable: EPti = FPti × SER ÷ AOER
Whereas: EPti = economic price of the ith tradabe input.
FPti = financial price of the same input
SER = shadow exchange rate.
For non-tradable inputs: EPni = FPni × Oi
Whereas FPni = economic price of ith non-tradable input.
Oi = conversion factor of ith non-tradable input.
2.2.3 Interpretation of policy analysis matrix results:
PAM is used to measure profitability, international competitiveness and incentives.
www.ccsenet.org/jas Journal of Agricultural Science Vol. 3, No. 3; September 2011
Published by Canadian Center of Science and Education 205
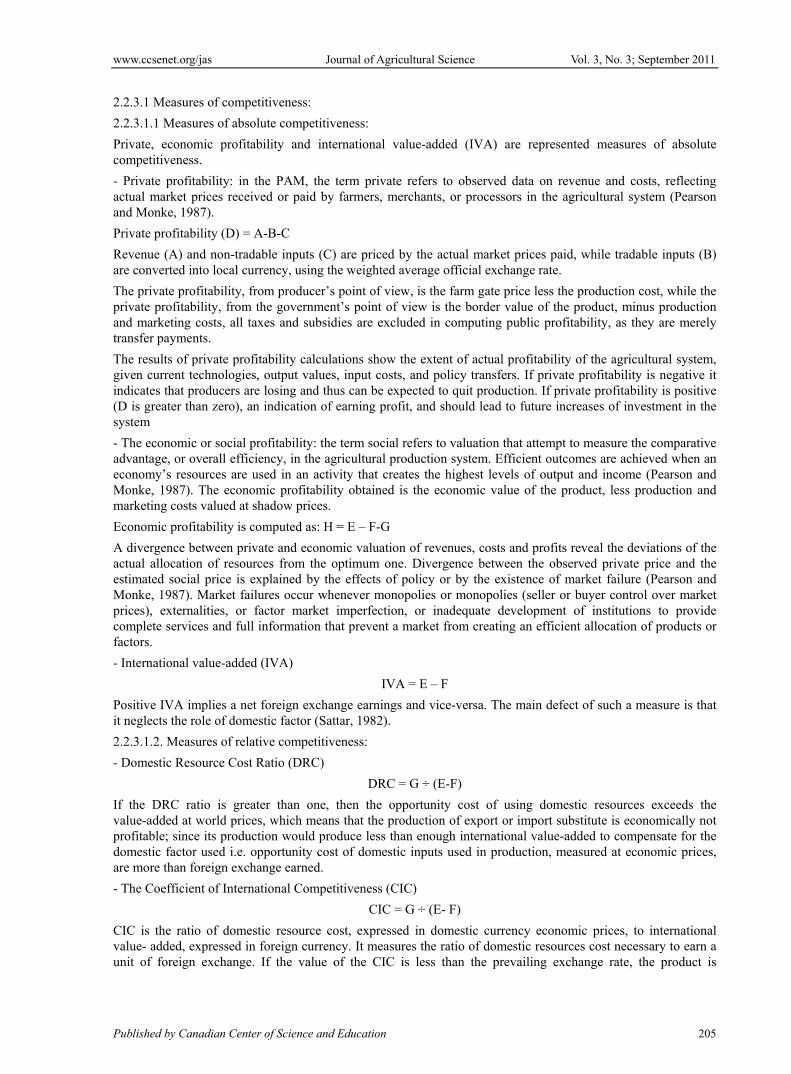
2.2.3.1 Measures of competitiveness:
2.2.3.1.1 Measures of absolute competitiveness:
Private, economic profitability and international value-added (IVA) are represented measures of absolute competitiveness.
- Private profitability: in the PAM, the term private refers to observed data on revenue and costs, reflecting actual market prices received or paid by farmers, merchants, or processors in the agricultural system (Pearson and Monke, 1987).
Private profitability (D) = A-B-C
Revenue (A) and non-tradable inputs (C) are priced by the actual market prices paid, while tradable inputs (B) are converted into local currency, using the weighted average official exchange rate.
The private profitability, from producer’s point of view, is the farm gate price less the production cost, while the private profitability, from the government’s point of view is the border value of the product, minus production and marketing costs, all taxes and subsidies are excluded in computing public profitability, as they are merely transfer payments.
The results of private profitability calculations show the extent of actual profitability of the agricultural system, given current technologies, output values, input costs, and policy transfers. If private profitability is negative it indicates that producers are losing and thus can be expected to quit production. If private profitability is positive (D is greater than zero), an indication of earning profit, and should lead to future increases of investment in the system
- The economic or social profitability: the term social refers to valuation that attempt to measure the comparative advantage, or overall efficiency, in the agricultural production system. Efficient outcomes are achieved when an economy’s resources are used in an activity that creates the highest levels of output and income (Pearson and Monke, 1987). The economic profitability obtained is the economic value of the product, less production and marketing costs valued at shadow prices.
Economic profitability is computed as: H = E – F-G
A divergence between private and economic valuation of revenues, costs and profits reveal the deviations of the actual allocation of resources from the optimum one. Divergence between the observed private price and the estimated social price is explained by the effects of policy or by the existence of market failure (Pearson and Monke, 1987). Market failures occur whenever monopolies or monopolies (seller or buyer control over market prices), externalities, or factor market imperfection, or inadequate development of institutions to provide complete services and full information that prevent a market from creating an efficient allocation of products or factors.
- International value-added (IVA)
IVA = E – F
Positive IVA implies a net foreign exchange earnings and vice-versa. The main defect of such a measure is that it neglects the role of domestic factor (Sattar, 1982).
2.2.3.1.2. Measures of relative competitiveness:
- Domestic Resource Cost Ratio (DRC)
DRC = G ÷ (E-F)
If the DRC ratio is greater than one, then the opportunity cost of using domestic resources exceeds the value-added at world prices, which means that the production of export or import substitute is economically not profitable; since its production would produce less than enough international value-added to compensate for the domestic factor used i.e. opportunity cost of domestic inputs used in production, measured at economic prices, are more than foreign exchange earned.
- The Coefficient of International Competitiveness (CIC)
CIC = G ÷ (E- F)
CIC is the ratio of domestic resource cost, expressed in domestic currency economic prices, to international value- added, expressed in foreign currency. It measures the ratio of domestic resources cost necessary to earn a unit of foreign exchange. If the value of the CIC is less than the prevailing exchange rate, the product is
www.ccsenet.org/jas Journal of Agricultural Science Vol. 3, No. 3; September 2011
ISSN 1916-9752 E-ISSN 1916-9760 206
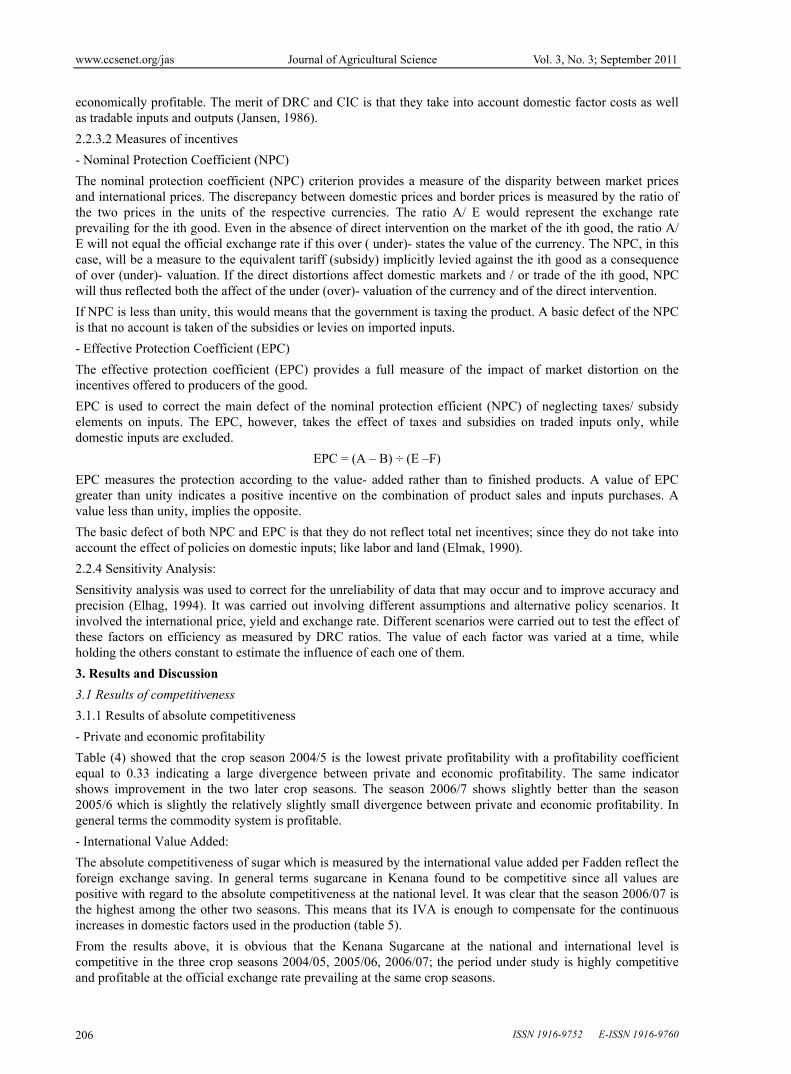
economically profitable. The merit of DRC and CIC is that they take into account domestic factor costs as well as tradable inputs and outputs (Jansen, 1986).
2.2.3.2 Measures of incentives
- Nominal Protection Coefficient (NPC)
The nominal protection coefficient (NPC) criterion provides a measure of the disparity between market prices and international prices. The discrepancy between domestic prices and border prices is measured by the ratio of the two prices in the units of the respective currencies. The ratio A/ E would represent the exchange rate prevailing for the ith good. Even in the absence of direct intervention on the market of the ith good, the ratio A/ E will not equal the official exchange rate if this over ( under)- states the value of the currency. The NPC, in this case, will be a measure to the equivalent tariff (subsidy) implicitly levied against the ith good as a consequence of over (under)- valuation. If the direct distortions affect domestic markets and / or trade of the ith good, NPC will thus reflected both the affect of the under (over)- valuation of the currency and of the direct intervention.
If NPC is less than unity, this would means that the government is taxing the product. A basic defect of the NPC is that no account is taken of the subsidies or levies on imported inputs.
- Effective Protection Coefficient (EPC)
The effective protection coefficient (EPC) provides a full measure of the impact of market distortion on the incentives offered to producers of the good.
EPC is used to correct the main defect of the nominal protection efficient (NPC) of neglecting taxes/ subsidy elements on inputs. The EPC, however, takes the effect of taxes and subsidies on traded inputs only, while domestic inputs are excluded.
EPC = (A – B) ÷ (E –F)
EPC measures the protection according to the value- added rather than to finished products. A value of EPC greater than unity indicates a positive incentive on the combination of product sales and inputs purchases. A value less than unity, implies the opposite.
The basic defect of both NPC and EPC is that they do not reflect total net incentives; since they do not take into account the effect of policies on domestic inputs; like labor and land (Elmak, 1990).
2.2.4 Sensitivity Analysis:
Sensitivity analysis was used to correct for the unreliability of data that may occur and to improve accuracy and precision (Elhag, 1994). It was carried out involving different assumptions and alternative policy scenarios. It involved the international price, yield and exchange rate. Different scenarios were carried out to test the effect of these factors on efficiency as measured by DRC ratios. The value of each factor was varied at a time, while holding the others constant to estimate the influence of each one of them.
3. Results and Discussion
3.1 Results of competitiveness
3.1.1 Results of absolute competitiveness
- Private and economic profitability
Table (4) showed that the crop season 2004/5 is the lowest private profitability with a profitability coefficient equal to 0.33 indicating a large divergence between private and economic profitability. The same indicator shows improvement in the two later crop seasons. The season 2006/7 shows slightly better than the season 2005/6 which is slightly the relatively slightly small divergence between private and economic profitability. In general terms the commodity system is profitable.
- International Value Added:
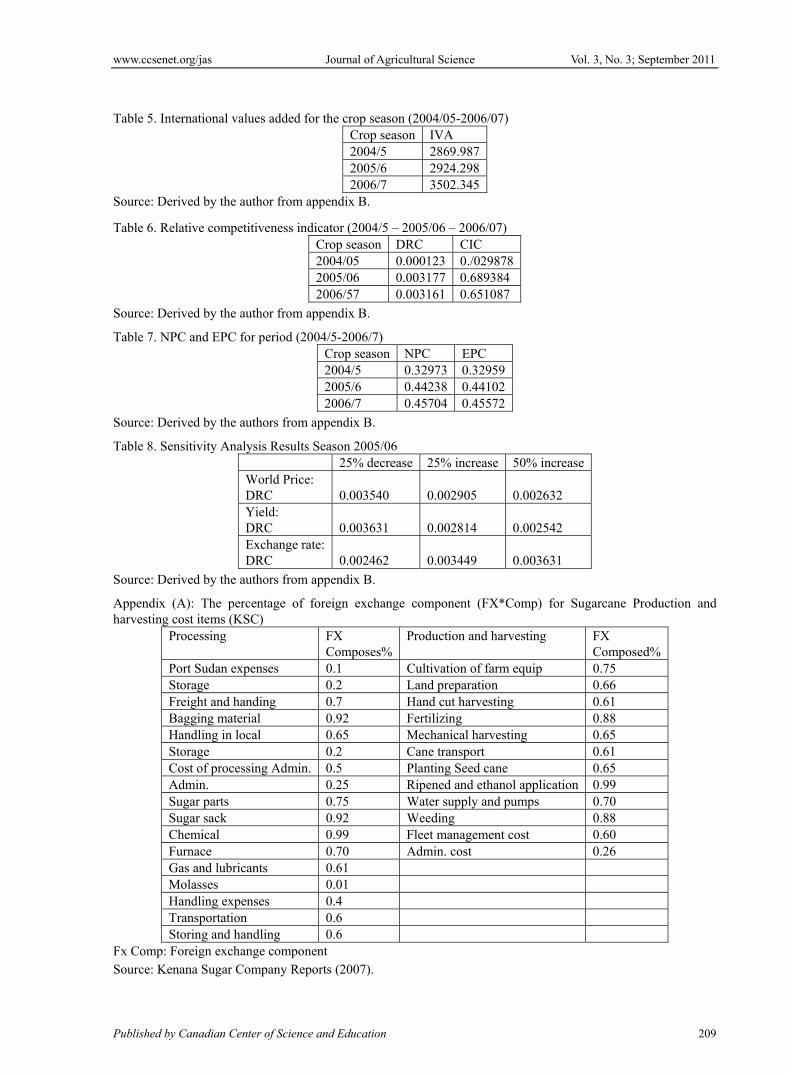
The absolute competitiveness of sugar which is measured by the international value added per Fadden reflect the foreign exchange saving. In general terms sugarcane in Kenana found to be competitive since all values are positive with regard to the absolute competitiveness at the national level. It was clear that the season 2006/07 is the highest among the other two seasons. This means that its IVA is enough to compensate for the continuous increases in domestic factors used in the production (table 5).
From the results above, it is obvious that the Kenana Sugarcane at the national and international level is competitive in the three crop seasons 2004/05, 2005/06, 2006/07; the period under study is highly competitive and profitable at the official exchange rate prevailing at the same crop seasons.
www.ccsenet.org/jas Journal of Agricultural Science Vol. 3, No. 3; September 2011
Published by Canadian Center of Science and Education 207
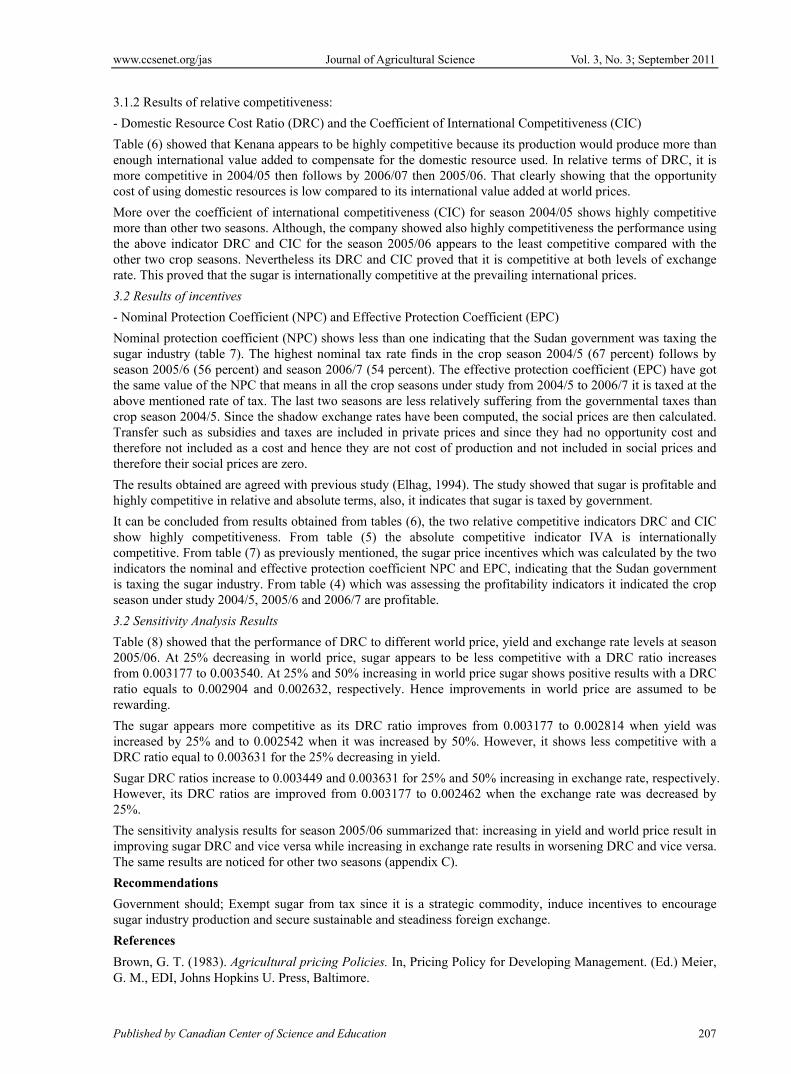
3.1.2 Results of relative competitiveness:
- Domestic Resource Cost Ratio (DRC) and the Coefficient of International Competitiveness (CIC)
Table (6) showed that Kenana appears to be highly competitive because its production would produce more than enough international value added to compensate for the domestic resource used. In relative terms of DRC, it is more competitive in 2004/05 then follows by 2006/07 then 2005/06. That clearly showing that the opportunity cost of using domestic resources is low compared to its international value added at world prices.
More over the coefficient of international competitiveness (CIC) for season 2004/05 shows highly competitive more than other two seasons. Although, the company showed also highly competitiveness the performance using the above indicator DRC and CIC for the season 2005/06 appears to the least competitive compared with the other two crop seasons. Nevertheless its DRC and CIC proved that it is competitive at both levels of exchange rate. This proved that the sugar is internationally competitive at the prevailing international prices.
3.2 Results of incentives
- Nominal Protection Coefficient (NPC) and Effective Protection Coefficient (EPC)
Nominal protection coefficient (NPC) shows less than one indicating that the Sudan government was taxing the sugar industry (table 7). The highest nominal tax rate finds in the crop season 2004/5 (67 percent) follows by season 2005/6 (56 percent) and season 2006/7 (54 percent). The effective protection coefficient (EPC) have got the same value of the NPC that means in all the crop seasons under study from 2004/5 to 2006/7 it is taxed at the above mentioned rate of tax. The last two seasons are less relatively suffering from the governmental taxes than crop season 2004/5. Since the shadow exchange rates have been computed, the social prices are then calculated. Transfer such as subsidies and taxes are included in private prices and since they had no opportunity cost and therefore not included as a cost and hence they are not cost of production and not included in social prices and therefore their social prices are zero.
The results obtained are agreed with previous study (Elhag, 1994). The study showed that sugar is profitable and highly competitive in relative and absolute terms, also, it indicates that sugar is taxed by government.
It can be concluded from results obtained from tables (6), the two relative competitive indicators DRC and CIC show highly competitiveness. From table (5) the absolute competitive indicator IVA is internationally competitive. From table (7) as previously mentioned, the sugar price incentives which was calculated by the two indicators the nominal and effective protection coefficient NPC and EPC, indicating that the Sudan government is taxing the sugar industry. From table (4) which was assessing the profitability indicators it indicated the crop season under study 2004/5, 2005/6 and 2006/7 are profitable.
3.2 Sensitivity Analysis Results
Table (8) showed that the performance of DRC to different world price, yield and exchange rate levels at season 2005/06. At 25% decreasing in world price, sugar appears to be less competitive with a DRC ratio increases from 0.003177 to 0.003540. At 25% and 50% increasing in world price sugar shows positive results with a DRC ratio equals to 0.002904 and 0.002632, respectively. Hence improvements in world price are assumed to be rewarding.
The sugar appears more competitive as its DRC ratio improves from 0.003177 to 0.002814 when yield was increased by 25% and to 0.002542 when it was increased by 50%. However, it shows less competitive with a DRC ratio equal to 0.003631 for the 25% decreasing in yield.
Sugar DRC ratios increase to 0.003449 and 0.003631 for 25% and 50% increasing in exchange rate, respectively. However, its DRC ratios are improved from 0.003177 to 0.002462 when the exchange rate was decreased by 25%.
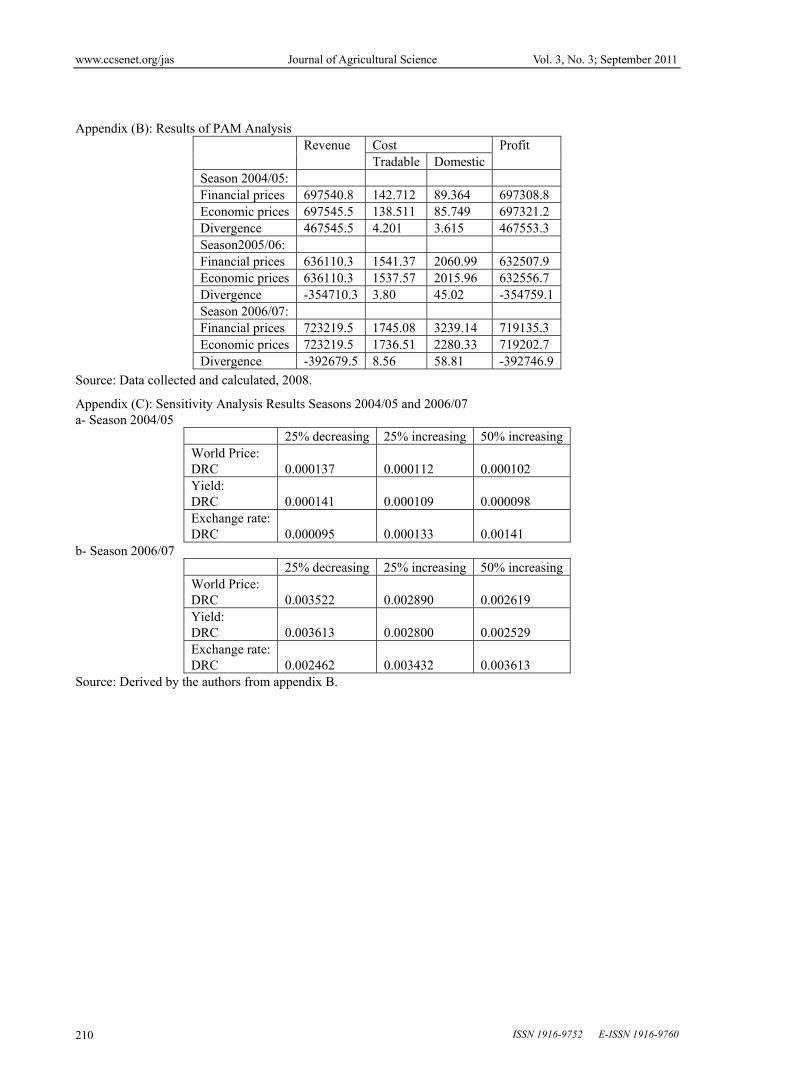
The sensitivity analysis results for season 2005/06 summarized that: increasing in yield and world price result in improving sugar DRC and vice versa while increasing in exchange rate results in worsening DRC and vice versa. The same results are noticed for other two seasons (appendix C).
Recommendations
Government should; Exempt sugar from tax since it is a strategic commodity, induce incentives to encourage sugar industry production and secure sustainable and steadiness foreign exchange.
References
Brown, G. T. (1983). Agricultural pricing Policies. In, Pricing Policy for Developing Management. (Ed.) Meier, G. M., EDI, Johns Hopkins U. Press, Baltimore.
www.ccsenet.org/jas Journal of Agricultural Science Vol. 3, No. 3; September 2011
ISSN 1916-9752 E-ISSN 1916-9760 208
Central Bank of Sudan. (2006). Annual Report, Khartoum, Sudan.
Central Bank of Sudan. (2007). Annual Report, Khartoum Sudan.
Elhag, H. E. (1994). The Impact of Agricultural Price Policy on Sugar Production in Sudan: A Case Study of Kenana Sugar Company. M.Sc. Thesis. University of Khartoum Faculty of Agriculture, Department of Agriculture Economics.
Elmak, E. M. (1990). International Competitiveness of Major Crops in Sudan. MA Dissertation, Institute of Special Studies, the Hague. Khartoum.
Gittinger, J. P. (1982). Economics Analysis of Agricultural Projects. EDI, World Bank, Washington, D. C.
Jansen, D. (1986). The Economic and Financial Analysis of Sudan’s Major Crops 1984-1987. World Bank Office, Khartoum, Sudan.
Kenana Sugar Company. (2007). Brain Storming Session Agricultural Paper. www.kenana.com.
Little, I. M. D. and Mirrless J. A. (1988). Project Appraisal and Planning for Developing Countries. Grower Publishing Company Ltd., Grower House.
Pearson and Monke. (1987). The Policy Analysis Matrix: A manual for Practitioner. The Pragma Corporation, Falls Chuch, Washington, D. C.
Sattar, A. (1982). The Study of Cost of Production and Comparative Advantage, UNDP/ IBRO Planning Assistance and Training Project. MEFP, Government Printing Office, Khartoum.
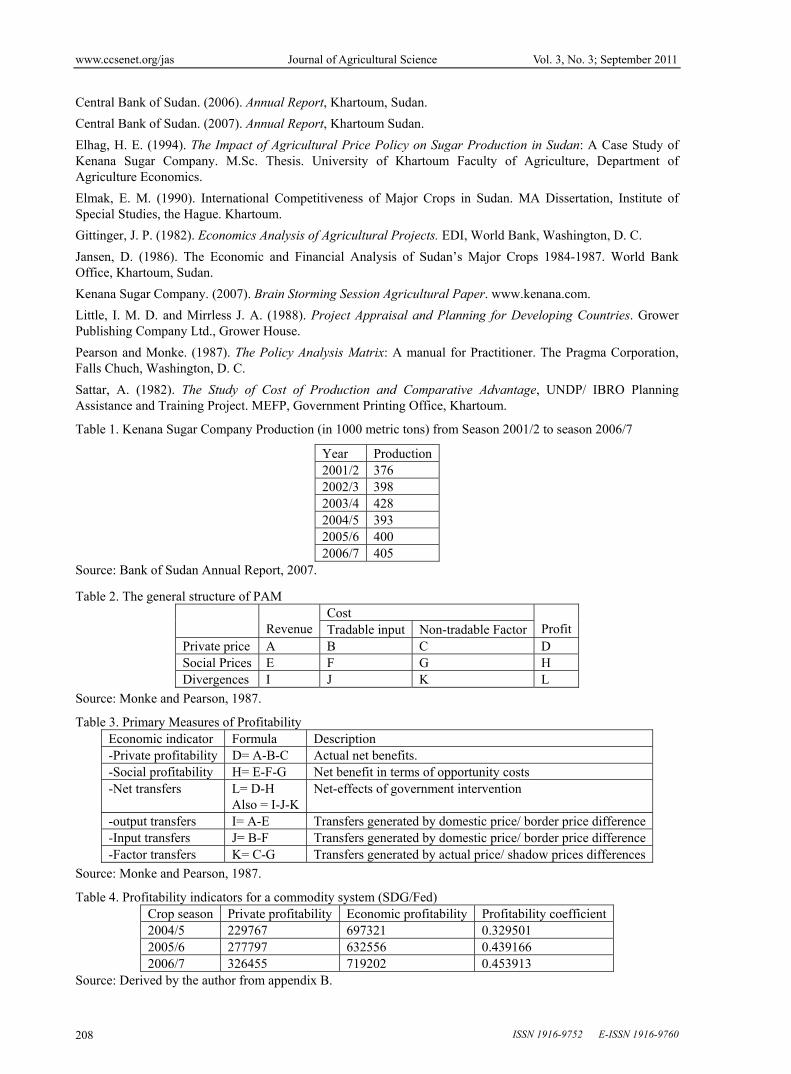
Table 1. Kenana Sugar Company Production (in 1000 metric tons) from Season 2001/2 to season 2006/7
Year Production2001/2 376 2002/3 398 2003/4 428 2004/5 393 2005/6 400 2006/7 405
Source: Bank of Sudan Annual Report, 2007.
Table 2. The general structure of PAM
Revenue Cost
Profit Tradable input Non-tradable FactorPrivate price A B C D Social Prices E F G H Divergences I J K L
Source: Monke and Pearson, 1987.
Table 3. Primary Measures of Profitability Economic indicator Formula Description -Private profitability D= A-B-C Actual net benefits. -Social profitability H= E-F-G Net benefit in terms of opportunity costs -Net transfers L= D-H
Also = I-J-K Net-effects of government intervention
-output transfers I= A-E Transfers generated by domestic price/ border price difference -Input transfers J= B-F Transfers generated by domestic price/ border price difference -Factor transfers K= C-G Transfers generated by actual price/ shadow prices differences
Source: Monke and Pearson, 1987.
Table 4. Profitability indicators for a commodity system (SDG/Fed) Crop season Private profitability Economic profitability Profitability coefficient 2004/5 229767 697321 0.329501 2005/6 277797 632556 0.439166 2006/7 326455 719202 0.453913
Source: Derived by the author from appendix B.
www.ccsenet.org/jas Journal of Agricultural Science Vol. 3, No. 3; September 2011
Published by Canadian Center of Science and Education 209
Table 5. International values added for the crop season (2004/05-2006/07)
Crop season IVA 2004/5 2869.9872005/6 2924.2982006/7 3502.345
Source: Derived by the author from appendix B.
Table 6. Relative competitiveness indicator (2004/5 – 2005/06 – 2006/07) Crop season DRC CIC 2004/05 0.000123 0./0298782005/06 0.003177 0.6893842006/57 0.003161 0.651087
Source: Derived by the author from appendix B.
Table 7. NPC and EPC for period (2004/5-2006/7) Crop season NPC EPC 2004/5 0.32973 0.329592005/6 0.44238 0.441022006/7 0.45704 0.45572
Source: Derived by the authors from appendix B.
Table 8. Sensitivity Analysis Results Season 2005/06 25% decrease 25% increase 50% increase World Price: DRC
0.003540
0.002905
0.002632
Yield: DRC
0.003631
0.002814
0.002542
Exchange rate: DRC
0.002462
0.003449
0.003631
Source: Derived by the authors from appendix B.
Appendix (A): The percentage of foreign exchange component (FX*Comp) for Sugarcane Production and harvesting cost items (KSC)
Processing FX Composes%
Production and harvesting FX Composed%
Port Sudan expenses 0.1 Cultivation of farm equip 0.75 Storage 0.2 Land preparation 0.66 Freight and handing 0.7 Hand cut harvesting 0.61 Bagging material 0.92 Fertilizing 0.88 Handling in local 0.65 Mechanical harvesting 0.65 Storage 0.2 Cane transport 0.61 Cost of processing Admin. 0.5 Planting Seed cane 0.65 Admin. 0.25 Ripened and ethanol application 0.99 Sugar parts 0.75 Water supply and pumps 0.70 Sugar sack 0.92 Weeding 0.88 Chemical 0.99 Fleet management cost 0.60 Furnace 0.70 Admin. cost 0.26 Gas and lubricants 0.61 Molasses 0.01 Handling expenses 0.4 Transportation 0.6 Storing and handling 0.6
Fx Comp: Foreign exchange component Source: Kenana Sugar Company Reports (2007).
www.ccsenet.org/jas Journal of Agricultural Science Vol. 3, No. 3; September 2011
ISSN 1916-9752 E-ISSN 1916-9760 210
Appendix (B): Results of PAM Analysis Revenue Cost Profit
Tradable DomesticSeason 2004/05: Financial prices 697540.8 142.712 89.364 697308.8Economic prices 697545.5 138.511 85.749 697321.2Divergence 467545.5 4.201 3.615 467553.3Season2005/06: Financial prices 636110.3 1541.37 2060.99 632507.9Economic prices 636110.3 1537.57 2015.96 632556.7Divergence -354710.3 3.80 45.02 -354759.1Season 2006/07: Financial prices 723219.5 1745.08 3239.14 719135.3Economic prices 723219.5 1736.51 2280.33 719202.7Divergence -392679.5 8.56 58.81 -392746.9
Source: Data collected and calculated, 2008.
Appendix (C): Sensitivity Analysis Results Seasons 2004/05 and 2006/07 a- Season 2004/05
25% decreasing 25% increasing 50% increasing World Price: DRC
0.000137
0.000112
0.000102
Yield: DRC
0.000141
0.000109
0.000098
Exchange rate: DRC
0.000095
0.000133
0.00141
b- Season 2006/07 25% decreasing 25% increasing 50% increasing World Price: DRC
0.003522
0.002890
0.002619
Yield: DRC
0.003613
0.002800
0.002529
Exchange rate: DRC
0.002462
0.003432
0.003613
Source: Derived by the authors from appendix B.