Embed Size (px)
Citation preview

The Competition between Liquid and VaporTransport in Transpiring Leaves1[W][OPEN]
Fulton Ewing Rockwell*, N. Michele Holbrook, and Abraham Duncan Stroock
School of Chemical and Biomolecular Engineering, Cornell University, Ithaca, New York 14853 (F.E.R., A.D.S.);and Department of Organismic and Evolutionary Biology, Harvard University, Cambridge, Massachusetts02138 (N.M.H.)
In leaves, the transpirational flux of water exits the veins as liquid and travels toward the stomata in both the vapor and liquidphases before exiting the leaf as vapor. Yet, whether most of the evaporation occurs from the vascular bundles (perivascular), fromthe photosynthetic mesophyll cells, or within the vicinity of the stomatal pore (peristomatal) remains in dispute. Here, a one-dimensional model of the competition between liquid and vapor transport is developed from the perspective of nonisothermalcoupledheat andwatermolecule transport in a compositemediumof airspace and cells.Ananalytical solution to themodel is foundin terms of the energy and transpirational fluxes from the leaf surfaces and the absorbed solar energy load, leading tomathematicalexpressions for the proportions of evaporation accounted for by the vascular,mesophyll, and epidermal regions. Thedistribution ofevaporation in a given leaf is predicted to be variable, changing with the local environment, and to range from dominantlyperivascular to dominantly peristomatal depending on internal leaf architecture, with mesophyll evaporation a subordinatecomponent. Usingmature red oak (Quercus rubra) trees,we show that themodel can be solved for a specific instance of a transpiringleaf by combining gas-exchange data, anatomical measurements, and hydraulic experiments. We also investigate the effect ofradiation load on the control of transpiration, the potential for condensation on the inside of an epidermis, and the impact of vaportransport on the hydraulic efficiency of leaf tissue outside the xylem.
During steady-state transpiration, the evaporativeflux from the cell surfaces lining a leaf’s intercellularairspaces balances the flux of water vapor exiting thestomatal pores. The question of how the phase changefrom liquid to vapor is distributedwithin a leaf pertainsto many aspects of leaf function, including isotopic en-richment of leaf water (Farquhar et al., 1993; Gillon andYakir, 2000; Cernusak and Kahmen, 2013), the hydro-mechanics of stomatal control (Buckley, 2005; Franksand Farquhar, 2007; Peak and Mott, 2011), and hy-draulic constraints on maximum transpiration rates(Brodribb et al., 2007; Boyce et al., 2009; Brodribb et al.,2010). Experimental work with apoplastic tracers(Tanton and Crowdy, 1972; Byott and Sheriff, 1976),physical analogs (Meidner, 1976), and mathematicalmodeling (Tyree and Yianoulis, 1980; Yianoulis andTyree, 1984) has challenged the idea that evaporationoccurs more or less uniformly from the mesophyll,
converging on the view that evaporationwill be heavilyskewed toward the internalwetted surfaces closest to thestomata (hereafter, peristomatal evaporation; Buckley andMott, 2013). However, the interpretation of tracer accu-mulation as indicative of a local evaporative flux has beenquestioned (Yianoulis and Tyree, 1984), and calculation ofthe expected pressure drop for flow across the bundlesheath cells alone suggests a short liquid flow path, withevaporation from the vascular bundle directly to the air-space (hereafter, perivascular evaporation; Boyer, 1985).
At the same time, a variety of experimental approachesfor characterizing the hydraulic efficiency with whichleaves replace the water lost to transpiration have beendeveloped, of which evaporative flux measurement(EFM) of transpiring leaves is considered to be the mostnaturalistic (Sack et al., 2002). The location and waterpotential of the sites of evaporation in a leaf are unknownin EFM. Instead, a whole-leaf hydraulic conductance (Kleaf)is defined as the transpirational flux (E) divided by thedifference between the water potential of a source at thepetiole (e.g. the main stem, or a reservoir in the laboratory)and leaf water potential, as typically estimated from apressure chamber measurement (xylem sap osmolality isassumed to be negligible; Sack et al., 2002). As a result,Kleaf is not physically well defined and bears an ambigu-ous relationship to the real hydraulic properties of leafxylem and tissues (Rockwell et al., 2014b). Hydraulicstudies that have sought to correlate Kleaf with internal leafstructure have further assumed peristomatal evaporationand neglected the possibility that the phase change for someportion of the flux occurs deeper inside the leaf (Brodribbet al., 2007; Brodribb et al., 2010; Buckley et al., 2011).
1 This work was supported by the National Science Foundation(grant no. DBI 1103664 to F.E.R.), the Air Force Office of SponsoredResearch (grant no. FA9550–09–1–0188 to A.D.S. and N.M.H.), andHarvard Materials Research Science and Engineering Center (grantno. NSF DMR–0820484 to N.M.H.).
* Address correspondence to [email protected] author responsible for distribution of materials integral to the
findings presented in this article in accordance with the policy de-scribed in the Instructions for Authors (www.plantphysiol.org) is:Fulton Ewing Rockwell ([email protected]).
[W] The online version of this article contains Web-only data.[OPEN] Articles can be viewed online without a subscription.www.plantphysiol.org/cgi/doi/10.1104/pp.114.236323
Plant Physiology�, April 2014, Vol. 164, pp. 1741–1758, www.plantphysiol.org � 2014 American Society of Plant Biologists. All Rights Reserved. 1741

Recently however, the possibility that internal vaportransport dominates liquid phase transport from the vas-cular bundles to a transpiring epidermis has receivedrenewed attention, particularly in relation to stomatalbehavior (Pieruschka et al., 2010; Peak andMott, 2011). Assaturated vapor pressure has a strong temperature de-pendence, modeling internal vapor transport requires anaccounting of internal energy fluxes. In energy terms, thecompetition between liquid and vapor transport within aleaf can be viewed as a competition between thermalconduction and latent heat transport, as for peristomatalevaporation to occur both liquid water and thermal en-ergy must be conducted to the transpiring epider-mis. Taking a modified leaf energy balance approach,Pieruschka et al. (2010) interpreted observed stomatalopening in response to increased radiation load as evi-dence that latent heat transport serves as the dominantmode of energy transport from the mesophyll to theepidermis. In this model, internal vapor transport typ-ically exceeds transpiration, with water condensing onthe epidermis (peristomatal condensation) and flowingback toward the sites of short-wave energy absorptionand evaporation in the mesophyll. Increasing the en-ergy load is thought to increase condensation on theepidermis, allowing stomata to open hydropassively.
Here, we provide amodel of the competition betweeninternal liquid and vapor transport that treats the leafmesophyll as a homogenous composite effective me-dium of air and cells (Rockwell et al., 2014a) and theepidermis (including stomata) as a boundary characterizedby temperature, water potential, and conductance towatervapor (Fig. 1). Like Pieruschka et al. (2010), we do not at-tempt to model stomatal mechanics, although we willassume at some points in the analysis of steady-statetranspiration a phenomenological linkage between
epidermal water potential and stomatal conductance (gs).Themost important difference between our approach andprior work is that our model allows the competition be-tween the vapor and liquid phase transport of water, andthe associated competition between latent and sensibletransport of heat energy, to emerge from general conser-vation lawsandtheconstraintof local thermalandchemicalequilibrium between phases in mesophyll airspaces. Bycontrast, Pieruschka et al. (2010) fix the balance of internalheat transport between latent transfer and heat conductioninairbasedonaresult for steadyevaporation into saturatedair (equilibrium evaporation). This result says that theproportion of an absorbed solar short-wave energy loaddissipated as latent heat transport assumes a characteristicvalue that depends only on the temperature sensitivity ofsaturated vapor pressure, the latent heat of vaporization,and the heat capacity of air (Raupach, 2001). Another wayof expressing this result is to say that, in the absence oflateral convection (i.e.wind), the Bowen ratio (sensible heatflux/latent heat flux) for an evaporating surface assumes avalue that depends only on thephysical properties ofwaterand air and not on the properties of the evaporating bodyitself (Bowen, 1926; Lambers et al., 1998; Raupach, 2001). Itis important tonote that this equilibriumevaporation resultapplies to a one-dimensional (1D) systemof transport fromwater to air in series, rather than in parallel, as in the cellsand airspaces of leaf mesophyll tissue.
As noted by Pieruschka et al. (2010), assuming theequilibrium evaporation result to describe energyfluxesinside a leaf affords an enormous simplification of thephysical detail that must be represented in their model,yet it comes at the cost of neglecting the possibility ofheat conduction in the liquid phase. As liquid phasethermal conductivity may be expected to be 1 order ofmagnitude larger than that of the gas phase (Tyree and
Figure 1. Model overview: conservation of heatand molecules at transpiring and nontranspiringsurfaces and in a representative volume elementof mesophyll (air and cells). At steady state, globalmolecular conservation requires that the numberof molecules entering in the liquid phase, Jx,equals the number leaving in the gas phase, Eb,such that the difference in the enthalpies of thetwo phases leads to the net consumption of en-ergy as latent heat equivalent to lEb. Thermal en-ergy conservation requires that the total absorbedshort-wave radiation load SR balances the totalnet surface latent and sensible (long-wave radiativeand conductive) fluxes.
1742 Plant Physiol. Vol. 164, 2014
Rockwell et al.

Yianoulis, 1980), and as there exists continuous cell-to-cellcontact through the leaf thickness in parallel with the in-tercellular airspaces, the actual balance of latent and sen-sible heat within a leaf may be quite different from theequilibrium evaporation case. Our goal, then, is to un-derstand how the balance of vapor and liquid trans-port, as well as latent and sensible heat transport,depends on leaf and physical properties after relaxingthe assumption that the liquid and vapor phases arearrayed in series. To do so, we account for liquid phasethermal conduction in the context of the simplest pos-sible transport model that remains consistent with theprinciples of nonisothermal transport phenomena(Bird et al., 1960; Deen, 1998).In a general way, our approach has been anticipated
by effective media formulations of liquid and vaportransport in unsaturated soils, most clearly in terms ofthe assumption of local equilibrium between wet sur-faces and the vapor in the gas-filled pores, as well as thedecomposition of the mole fraction gradients drivingvapor transport into gradients in temperature andwater status (De Vries, 1958; Philip and De Vries, 1957;Whitaker, 1977). Our own analysis adds elements impor-tant for leaves: a volumetric energy source representingshort-wave solar energy absorbed in the cells, liquid(cell) and air fractions continuously connected throughthe leaf thickness, a source ofwater at the vascular plane(Rockwell et al., 2014a, 2014b), and bounding epidermalsurfaces either with or without stomata. With this ap-proach, the combination of local equilibrium betweenphases and energy and mass conservation for a com-posite medium leads to a linkage between water po-tential and temperature gradients. This linkage allowsus to separate the coupled equations describing heatand molecular fluxes and find analytic solutions for thetemperature and water potential fields inside a leaf. Wethen analyze these solutions todescribe the effects of leafstructural properties and surface fluxes on the distri-bution of evaporation between perivascular, peri-stomatal, and mesophyll compartments. However, thelack of a general model for the dependence of stomatalaperture on the local temperature and water potential(aswell as chemical signaling) prevents us fromarrivingat a completely general model with which to study en-vironmental effects. Instead, we are restricted to ex-ploring a few cases where the gs realized for a particularset of environmental conditions is known. In the courseof these analyses, we reanalyze the control of transpi-ration by radiation (Pieruschka et al., 2010). In exploringenvironmentally driven shifts in the distribution ofevaporation within a particular leaf, we also clarifythe relationship between Kleaf and the actual hy-draulic conductivity of leaf tissue and show that thisrelationship is sensitive to the energy regime experi-enced by a leaf. Finally, we consider the possiblefunctional significance of the distribution of evapo-ration in a leaf in terms of its impact on hydraulicefficiency, the response of transpiration to environ-mental forcings, stomatal control, and minimum leafwater potentials.
RESULTS
Analytical Results
We start by providing an overview of some of theimportant physical ideas in our model: local thermaland chemical equilibrium in leaf airspaces, water vapormole fraction as a function of both water potential andtemperature, and the decomposition of the vapor molefraction gradient driving the diffusion of vapor intoits corresponding water potential and temperaturegradients. The derivation of the model follows inSupplemental Text S1, with additional details given inSupplemental Text S2. We then analyze the model re-sults for the distribution of evaporation between peri-vascular, peristomatal, and mesophyll fractions in ageneral way, before turning to solutions for the internaltransport behavior of particular transpiring leaves forwhich the environmental conditions and gs could beadequately constrained.
Local Equilibrium in an Unsaturated Porous Compositeof Cells and Air
We consider a representative volume of leaf tissuethrough the thickness composed of two domains, oneupper (adaxial) and one lower (abaxial), each extend-ing from the plane of the vasculature to an epidermis(Fig. 1) and characterized by separate area fractions forthe gas phase, Av (vapor fraction), and cells, Al (liquidfraction). Within this volume of leaf tissue, we adoptthe standard boundary condition of thermal andchemical equilibrium between liquid and vapor at aninterface (i.e. where the cell walls contact the intercel-lular airspace; Deen, 1998). In the palisade mesophyll,the expectation that airspace diameters are small rel-ative to the leaf thickness motivates the approximationthat lateral gradients are negligible, limiting the anal-ysis to the z dimension. In the spongy mesophyll,airspaces can be considerably larger, yet as long aslocal evaporation within the spongy mesophyll issmall relative to the total flux in the leaf, the extra re-sistance associated with lateral gradients will again benegligible. With the above conditions, we extend theinterfacial boundary condition (i.e. local equilibriumbetween phases) across all x,y planes, such that thetemperature T (Table I) and chemical potential of wa-ter m describe the state of both phases and are func-tions of z only through the entire leaf thickness. Thus,our composite medium is composed of cells and air-space in parallel, in local equilibrium at each pointthrough the thickness (Fig. 1).
To complete the 1D model, we treat the vascular planeas a uniform (continuous, homogenous) source of water(Boyer, 1969) and the epidermal surfaces as either im-permeable or characterized by a uniform gs. Finally, wefollow the convention in plant water relations and divideliquid phase chemical potential by the molar volume ofliquid water v to define water potential, c(z) = m(z)/v(Table II).
Plant Physiol. Vol. 164, 2014 1743
Liquid and Vapor Transport in Transpiring Leaves

The Dependence of Water Vapor Mole Fraction onTemperature and Water Potential
The depression of saturated water vapor pressureabove a salt solution or a curved meniscus is a familiarphenomenon in plant physiology. From a thermody-namic perspective, salts reduce the chemical potential ofthe liquid phase by lowering the activity of the water,while a curvedmeniscus acts on the pressure term of thechemical potential. A general expression that integratesall such effects can be written in terms of chemical po-tential, or more conveniently, water potential, as:
pvðT;cÞ ¼ pvðTÞexp cvRT
ð1Þ
where pv(T,c) is the vapor pressure, pv(T) is the vaporpressure above pure water at atmospheric pressurewith a flat interface, v is the molar volume of water,R is the ideal gas constant, and T is the temperature (K;Pickard, 1981; Nobel, 2005). For gas-exchange mea-surements, the difference between pv(T,Patm) and pv(T,c) is typically trivial relative to the difference in va-por pressure between the leaf and the unsaturated sur-rounding air. For studying vapor transport inside theleaf, we will see that we must maintain the distinction.
Vapor pressure as a function of temperature T (K)can be represented by the Clausius-Clapeyron equa-tion (Whitaker, 1977; Kittel and Kroemer, 1980):
pvðTÞ ¼ pv;oðToÞ exp�2
l
R
�1T2
1To
��ð2Þ
where l is the latent heat of vaporization evaluated atthe reference temperature To and pv,o(To) is the reference
vapor pressure when the liquid phase is at atmosphericpressure (e.g. as tabulated byNobel [2005]). CombiningEquations 1 and 2 yields an expression for vapor pres-sure as a function of temperature and water potential.As the appropriatedriving force for nonisothermalvapordiffusion is themole fraction ofwater vapor, x = pv/Patm(Bird et al., 1960), we divide by atmospheric pressurePatm to arrive at an expression for the mole fraction ofwater vapor in local equilibrium with a liquid phase attemperature T and water potential c:
xðT;cÞ ¼ xoðToÞ exp�2
l
R
�1T2
1To
�þ cvRT
�ð3Þ
Description of the Fluxes of Heat and Molecules
Fourier’s law for the flux of thermal energy due toconduction q, with l and v referencing the liquid andvapor phases and kT a thermal conductivity, takes thefollowing forms:
ql ¼2 kTl∂T∂z
; qv ¼2 kTv∂T∂z
ð4Þ
To describe the flux of molecules in the liquid phase Jl,we adopt a form of Darcy’s law:
Jl ¼2kl∂c∂z
ð5Þ
where kl is the hydraulic conductivity of the cells (in-clusive of the apoplast and symplast; Molz and Ferrier,1982; Rockwell et al., 2014a).
Table I. Mathematical symbols
Quantity Symbol Unitsa
Kelvin temperature T KTemperature, dimensionless Q –Water potential c PaWater potential, dimensionless C –Water vapor mole fraction x –∂x=∂T xT K21
∂x=∂c xc Pa21
Conductive heat flux qc J m22 s21
Radiative heat flux qr J m22 s21
Absorbed short-waveradiation per volume
_Q J m23 s21
Transpirational flux E mol m22 s21
Internal vapor flux Jv mol m22 s21
Internal liquid flux Jl mol m22 s21
Hydraulic conductivity, leaf kℓ mol m21 Pa21 s21
Stomatal conductance gs mol m22 s21
Boundary layer conductance gbl mol m22 s21
Boundary layer thickness d mEmissivity, long wave eIR –Absorptance, long wave aIR –Absorptance, short wave asw –
aDashes indicate a dimensionless (unitless) quantity.
Table II. Physical quantities and constants used in the analyses
Quantity Symbol Value (25oC) Unitsa
Latent heat, molar l 44 3 103 J mol21
Molar enthalpyof water, liquid
Hl 1.88 3 103 J mol21
Molar enthalpyof water, vapor
Hv 45.88 3 103 J mol21
Thermal conductivityair
kTv 0.026 J m21 K21 s21
Molar volume ofwater, liquid
v 1.807 3 1025 m3 mol21
Diffusivity, water in air Dv 2.5 3 1025 m2 s21
Molar concentrationof air
c 40.86 mol m23
Gas constant R 8.3145 J mol21 K21
Stefan-Boltzmannconstant
s 5.67 3 1028 J m22 s21 K24
Atmospheric pressure Patm 101.3 3 103 PaReference temperature To 298.15 KReference vapor mole
fractionxo 0.0313 –
Reference vaporpressure
po 3.173 3 103 Pa
aDashes indicate a dimensionless (unitless) quantity.
1744 Plant Physiol. Vol. 164, 2014
Rockwell et al.

For nonisothermal vapor diffusion, neglecting a smallamount of convection set in motion by the additionof water molecules to the gas phase (SupplementalText S2), Fick’s law for the vapor flux Jv takes the form(Bird et al., 1960):
Jv ¼2cDv∂x∂z
ð6Þ
Here, c is the total number of moles of molecules in thegas phase and Dv is the diffusivity of vapor in air. WithEquation 3, the gradient in the water vapor mole frac-tion can be expressed in terms of the water potential ofthe liquid phase and temperature, such that Fick’s lawcan be written:
Jv ¼2cDv
�xc
∂c∂z
þ xT∂T∂z
�ð7Þ
where xc and xT are the partial derivatives of the molefraction of water vapor (Eq. 3) and, along with cDv, areevaluated numerically at a temperature and water po-tential that characterizes the leaf; here, we use the tem-perature and water potential of the vascular plane. Thislinearization results in errors of less than 1% in calculat-ing changes in vapor mole fraction over changes in tem-perature and water potential inside a leaf of less than2°Cand2MPa, respectively.Whilexc/xT; 0.12KMPa21,given that expected internal temperature differences areon the order of 0.1°C andwater potential differences areon the order of 1 MPa for leaf tissue (Yianoulis andTyree, 1984), both temperature and water potential ap-pear likely to have important effects on the internalwatervapor mole fraction gradient in leaves (the term inbrackets on the right side of Eq. 7).
Analysis of the Competition of Heat Conduction and LatentTransport in Leaf Tissue
Combining conservation of thermal energy andwater molecules in two phases (gas and liquid) for leaftissue subject to a volumetric load of absorbed solarshort-wave radiation, _Q, the description of the fluxes(Eqs. 4, 5, and 7), and local equilibrium between theliquid and gas phases (Eq. 3) leads directly to gov-erning equations for the water potential and temper-ature profiles (Supplemental Text S1, Equations 1.5and 1.7). The water potential profile is governed by asteady diffusion equation with a source (Crank, 1957):
0 ¼2Pc Al lkl∂2c∂z2
þ _Q ð8Þ
where Pc is a dimensionless parameter we call the ther-mal dissipation modulus. In words, Equation 8 says:
0 ¼ Pc3 energy into local evaporationþ local energy load ð9Þ
This modulus describes the tendency of internal leaftissue toward dissipating a thermal load, _Q, by internal
latent heat transport (dominant when Pc is close to 1)versus internal heat conduction (dominant when Pc islarge). In its definition, Pc integrates all of the effects ofthe thermal, hydraulic, and diffusive properties of thetissue on the local evaporative process into a singleparameter:
Pc ≡ 1þAlkTl þAvkTvAvlcDvxT
þAlkTl þAvkTvAllkl
xc
xT
¼ total thermal conductivitylatent heat conductivity
ð10Þ
The two ratios that appear in Pc describe total thermalconductivity over particular components of latent heattransport, and Pc is thus analogous to the Bowen ratio.The first ratio:
total thermal conductivitytemperature driven latent heat
¼ AlkTl þAvkTvAvlcDvxT
ð11Þ
compares thermal conductivity with latent heat trans-port due to temperature-dependent gradients in thevapor mole fraction. The second ratio in Pc:
total thermal conductionlocal evaporation
¼ AlkTl þAvkTvAllkl
xc
xTð12Þ
compares the relative magnitudes of the heat movedby conduction versus the evaporation of a liquid flux,as driven by the temperature and water potentialdifferences that result in equal changes in the vapormole fraction, xc/xT.
As the temperature and water potential profiles arelinked by both the process of evaporation and theireffects on the vapor mole fraction gradients (Eq. 7), thegoverning equation for temperature follows the sameform as for water potential (Eq. 8):
0 ¼ PT �AlkTl þAvkTv
� ∂2T∂z2
þ _Q ð13Þ
where again the behavior depends on a second di-mensionless parameter, PT. This equation says that alocal energy load will be dissipated by thermal con-duction when PT approaches 1; however, there is nonew information in this parameter, as they are not in-dependent (Pc
21 + PT21 = 1), and we restrict our anal-
ysis here to Pc.The composition of Pc as two independent ratios
(Eq. 10), each representing a competition betweenthermal conduction and an aspect of latent transport,is such that thermal conduction need only win one toserve as the dominant sink for absorbed radiation.Physically, this structure arises from the fact thatwithin a representative volume being loaded withenergy, thermal conduction and latent transport are
Plant Physiol. Vol. 164, 2014 1745
Liquid and Vapor Transport in Transpiring Leaves

parallel processes, but local evaporation depends onproperties of the liquid phase (cell fraction, hydraulicconductivity) and vapor phase (air fraction, diffusivity)that, with respect to a change of phase from liquid tovapor, are arrayed in series. Thus, the transportproperties of either phase can independently create abottleneck, reducing the competitiveness of local vaporproduction (and so latent heat transport) as a sink forthe absorbed energy load.
With respect to the value of Pc expected forleaves, if the thermal conductivity of the cells isassumed to be, in general, close to that of water(Tyree and Yianoulis, 1980), with low variabilitybetween plants, then this first ratio (Eq. 11) will varybetween the palisade and spongy tissues, as well asbetween leaves, mostly as a function of the liquidand air fractions, Av and Al, as the other parametersare all material properties. On the other hand, theratio in Equation 12 is only weakly affected by areafractions, with the hydraulic conductivity of thecells, kl, likely the most important source of varia-tion between (and possibly within) leaves. Giventhat pressure probe data suggest that leaf cellmembrane permeability spans 2 orders of magni-tude, the potential exists for this term to range fromnear zero to more than 10 (Kramer and Boyer, 1995;Rockwell et al., 2014a). Thus, a domain of leaf tissuemight have very large air fractions, favoring latentheat transport in the first ratio, but if the hydraulicconductivity of the cells is at the low end of theexpected values, it could limit vapor production tothe extent that heat conduction emerges as thedominant local mode for the dissipation of absorbedradiation.
Analytical Results for the Distribution of Evaporation
Evaluating Pc provides important information re-garding the characteristic behavior of a representativevolume of mesophyll, yet it cannot tell us the over-all distribution of evaporation within a whole leaf:the environmental conditions and fluxes at the leafsurfaces are also important. Solving the governingequations (Eqs. 8 and 13) with the appropriate tran-spiring or nontranspiring boundary conditions at theepidermal surfaces (Supplemental Text S1, Equations1.15, 1.16, 1.21, and 1.22) leads to general solutions forc(z) and T(z) (Supplemental Text S1, Equations 1.17,1.18, 1.23, and 1.24). These solutions can then be an-alyzed to find expressions for the proportion oftranspiration that originates in a mesophyll, peri-vascular, or peristomatal region as functions of thetissue properties and surface fluxes. We define peri-stomatal evaporation as the liquid flux (2Alkl∂c=∂z, apositive quantity) arriving at a transpiring epidermis(z = L), where it consumes energy to change phase andcontribute to E. As a proportion of transpiration froman epidermal surface, the peristomatal fraction isfound by evaluating with parameter values specific tothe particular domain:
Peristomatal fraction: 2AlklE
∂c∂z
����z¼L
¼2qc þ qrPc lE
þ"1þ lAvcDvxT
AlkTl þAvkTvþAvcDvxc
Alkl
#2 1
ð14Þ
Here, qc is heat conduction to the surrounding air andqr is net long-wave radiation to the environment. Peri-stomatal evaporation has two contributions, againboth analogous to Bowen ratios. The first contributionrelates to the external environment:
sensible heat flux from surfacescaled latent heat flux from surface
¼2qc þ qrPc lE
ð15Þ
and represents the Bowen ratio of the surface fluxes,scaled by Pc in the denominator, such that when in-ternal thermal conduction is dominant, the effects ofenergy exchange with the environment are muted. Thesecond contribution to the peristomatal fraction (inbrackets) is composed of two ratios involving materialproperties. The inverse of the first ratio was discussedabove (Eq. 11), describing the competition betweentemperature-driven latent heat transport and thermalconduction. The second ratio:
vapor transport due to water potentialliquid transport
¼ AvcDvxc
Alklð16Þ
describes the isothermal competition between liquidand vapor. Thus, the bracketed material property ratioscapture the fact that for peristomatal evaporation tooccur, both thermal energy and water must flow to atranspiring surface. Notably, both ratios are sensitive tothe amount of airspace, making the air fraction a criticalparameter for the peristomatal fraction.
It will be noted that for leaves much warmer thanthe surroundings, and/or when transpiration is sup-pressed by high humidity or stomatal closure, the en-tire peristomatal fraction (Eq. 14) can evaluate asnegative. Physically, this describes condensation onthe inner epidermal surface and flow back towardevaporating sites in the mesophyll (i.e. the internalvapor flux exceeds E). A test for the existence of sucha condensing flux can then be derived from Equation14 as:
qc þ qr
lE
.
�AlkTl þAvkTv
�lAvcDvxT
ð17Þ
This emphasizes that condensation occurs wheneverthe sensible heat transport is more important exter-nally than internally, as this requires that some of the
1746 Plant Physiol. Vol. 164, 2014
Rockwell et al.

internally transported latent heat become available bycondensation to balance the external sensible flux.It will also be noted that the peristomatal fraction
can evaluate to more than 1. For transpiring leavescooler than the surrounding air (as may occur in theshade or subcanopy), the sensible heat flux is negative(i.e. toward the leaf), and Equation 15 adds to theperistomatal fraction. A fraction greater than 1 corre-sponds physically to an evaporative flux from the in-ner face of the epidermis to the mesophyll. Within themesophyll, evaporation is energy limited, and evapo-ration is favored near the surfaces where sensible heatfrom the surrounding air is warming the leaf.The proportion of E originating as evaporation
within the mesophyll of either the adaxial or abaxialmesophyll is found by integrating the change in theliquid flux through the mesophyll thickness:
Mesophyll fraction:AlklE
Z L
0
∂2c∂z2
dz ¼_QL
Pc lEð18Þ
Mesophyll evaporation, then, is the sum of the localevaporation that occurs within a domain due to thetotal thermal load absorbed in that domain, as deter-mined by Pc. The expected behavior is that, in thepalisade where the absorbed load is large (favoring alarge mesophyll fraction), Pc will also tend to be large(and local evaporation will be small), as the tight pack-ing of cells leads to a large liquid phase fraction and,therefore, efficient heat conduction. In the spongy me-sophyll, airspaces tend to be more extensive, reducingthe efficiency of thermal conduction and favoring localevaporation, but the locally absorbed radiation loadwill be much smaller (Vogelmann and Evans, 2002).Therefore, here again, total local evaporation mayamount to a minor component of E.The remaining fraction ofEoriginatingwithin a single
domain is perivascular evaporation. As the vapor fluxfrom the vascular plane into, for example, the spongymesophyll may include vapor originating in the pali-sade, both domains must be considered together. Totalperivascular evaporation (i.e. unnormalized by E) forboth domains can be found by evaluating the vaporfluxes into each domain (abaxial [b] and adaxial [d])from the vascular plane:
Perivascular fraction:
2
�AvcDv
�xc
∂c∂z
þxT∂T∂z
�����z¼0
�b2
�AvcDv
�xc
∂c∂z
þxT∂T∂z
�����z¼0
�d
ð19Þ
If both fluxes are positive (i.e. into their respectivedomains), then within each domain, perivascular evap-oration is indeed equal to the vapor flux at that bound-ary. In the event that one of them is negative (i.e. out ofits domain), then the sum in Equation 19 gives theperivascular vapor flux of the other (positive flux)domain. As no energy is absorbed at the vascular plane(it has infinitesimal volume), the energy to evaporate avapor flux comes from the difference between heat
conduction into the perivascular plane from the pali-sade versus that out into the spongy. A large differencein the cell area fraction Al between palisade and spongycreates a drop in total thermal conductivity across theperivascular plane, which then helps push energy fromconduction intoperivascular evaporation at thepalisade-spongy boundary.
Numerical Results
The above analysis has examined the factors influ-encing the distribution of evaporation in leaves in ageneral way. In the following, we next consider spe-cific instances, red oak (Quercus rubra) and sunflower(Helianthus annuus), based on experimental data, aswell as additional model simulations to explore par-ticular phenomena.
Distribution of Evaporation in a TranspiringRed Oak Leaf
Solution for a Within-Cuvette Energy Balance. We firstconsider transpiring red oak leaves, for which all thesurface fluxes as well as gs are known. Using gas-exchange measurements (LI-6400; Li-Cor) of five uppercanopy transpiring oak leaves under sunny summerconditions (Table III) with additional hydraulic andanatomical measurements on adjacent leaves, wesolved the temperature and water potential profilesthrough the leaf thickness, both for surface energybalances within the gas-exchange cuvette and forsurface energy balances for epidermal surfaces exposedto the environment. The latter solutions for the internalandexternalfluxesof heat andwater are shown inFigure 2;aswe considered the exposed leaf closer to the state of anoak leaf in nature, we chose to present those data in thefigure rather than the within-cuvette results. Aftermeasurement of gas exchange, the five leaves werethen collected to determine the average water potentialof each leaf imposed by transpiration, cleaf (e.g.transpiring potential). This water potential providedan independent check for the within-cuvette solutionas well as a required constraint for the exposed-leafsolution, made necessary because leaf absorptance andenvironmental reflectance were not measured directly.
The within-cuvette distribution of evaporation yieldeda dominant peristomatal fraction (74.5%), with most ofthe balance perivascular (21.3%) and only minor contri-butions from evaporation in the mesophyll tissues (1.5%and 2.7%). The water potential drop from the branch(21.29 MPa, as measured by covered leaves) to the vas-cular plane (21.69) was estimated at 0.4 MPa, with theupper domain sitting close to the vascular plane waterpotential. A steep drop to the transpiring surface (at22.51 MPa) put the lower epidermis close to the whole-leaf turgor loss point, as estimated from pressure volumecurves measured previously for these trees (Rockwellet al., 2011).
Plant Physiol. Vol. 164, 2014 1747
Liquid and Vapor Transport in Transpiring Leaves

Based on a simple 1D volume-weighted averagewater potential (Eq. 22), the predicted average waterpotential for these leaves Æcæwas21.81 MPa, while thevalue predicted by an equation accounting for the ef-fect of the three-dimensional (3D) geometry of thevein-tissue interface on water potential gradients (Eq. 23)was 21.72 MPa. This latter value was within themeasurement error (60.034 MPa; Rockwell, 2010) ofthe actual average water potential cleaf measured withthe pressure chamber, 21.73 MPa (n = 5, 60.14 SD); weregard this agreement as partial validation of themodel. As a point of reference, the apparent Kleaf, ortranspiration divided by the difference between cov-ered (cr) and transpiring leaf water potentials [Kleaf =E/(cr 2 cleaf)], was 13.3 mmol m22 MPa21 s21, withinthe range of values reported by Sack et al. (2002).
Solution for an Exposed-Leaf Energy Balance. The solution ofthe model for an exposed leaf (i.e. with an environ-mental rather than within-cuvette energy balance)yielded nearly identical results for the distribution ofevaporation (Fig. 2).With theaverage leafwaterpotentialas a constraint, the solution implies values of absorptance(aSR = 0.4) and reflectance (r = 0.15) at the low end of theexpected range (Nobel, 2005) but reasonable consideringthat leaf angles were assumed to be ideal.
With no vapor flux leaving the upper epidermis, wefind that the palisade remains close to the waterpotential of the transpiration stream where it exits theveins,whereas there is a largewater potential drop fromthe vascular plane to the stomata in the lower epidermis(Fig. 2A). The spongy mesophyll, therefore, represents
the dominant hydraulic resistance to E. As the palisadehas a larger volume and is denser in cells than thespongy mesophyll, we further found that the averagewater potential of the whole leaf remains close to thewater potential at the vascular plane, 21.68 MPa. As aresult, Kleaf reports the effective vascular conductancefrom the petiole to the vascular plane, §hA, rather thanthe extravascular tissue hydraulic resistance dominantin transpiration. This scaling of Kleaf with vascular,rather than mesophyll, hydraulic conductance is likelyto be the general case for hypostomatous leaves.
Leaf temperature peaked in the palisade (Fig. 2B),with a small drop toward the upper nontranspiringepidermis. In accordance with this temperature droptoward the upper surface, the model predicts a smallflux of vapor that condenses at the nontranspiringepidermal surface (Fig. 2, C and D) and flows backtoward the palisade as liquid (Fig. 2, A and D). Thiscircular flow above the temperature peak is interest-ing, as it acts as a heat pump (Chen et al., 2014),moving energy absorbed in the palisade to the upper(adaxial) epidermis, although here the effect is small: amolecular flux less than 1% of transpiration carryingless than 1% of the energy load in the upper domain.With larger air fractions in the palisade, this effect willbecome more important.
In both domains, we found a strong tendency towardheat conduction over local evaporation and latenttransport, as indicated by values ofPcmuch larger than1 (8.9 and 55.2 in the lower and upper domains, re-spectively). The larger value of Pc in the palisade isdriven by the lower air fraction (0.05) versus the spongy
Table III. Leaf and environmental parameter values used in the various solutions reported in the figures
Quantity SymbolRed Oak
(Fig. 2)
Sunflower
(Fig. 3)
Condensing Leaf
(Fig. 4)
EFM Leaf
(Fig. 5)Unitsa
Leaf thickness, adaxial Ld 167.7 3 1026 200 3 1026 167.7 3 1026 167.7 3 1026 mLeaf thickness, abaxial Lb 94.3 3 1026 200 3 1026 94.3 3 1026 94.3 3 1026 mLiquid area fraction, adaxial Ald 0.95 0.8 0.8 0.8 –Liquid area fraction, abaxial Alb 0.7 0.2 0.15 0.4 –Vapor area fraction, adaxial Avd 0.05 0.2 0.2 0.2 –Vapor area fraction, abaxial Avb 0.3 0.8 0.85 0.6 –Palisade absorbed radiation _QdLd 0.8 SR 0.9 SR 0.8 SR 0.8 SR J m22 s21
Spongy absorbed radiation _QbLb 0.2 SR 0.1 SR 0.2 SR 0.2 SR J m22 s21
Leaf hydraulic capacity cℓ 9.3 3 1024 – – – mol m23 Pa21
Vascular conductance hA 2.1 3 1028 1 3 1027 2.1 3 1028 2.1 3 1028 mol m22 Pa21 s21
Vascular conductance scaling factor § 0.67 – – 0.6 - 0.8 –Root and stem conductance Krs – – 6 3 1029 – mol m22 Pa21 s21
Hydraulic conductivity cells kl 6.97 3 10213 1 3 10212 6.97 3 10213 6.97 3 10213 mol m21 Pa21 s21
Thermal conductivity cells kTl 0.286 0.2 0.286 0.286 J m21 K21 s21
Stomatal conductance, total gs 0.3 0.71 0.34 0.3 mol m22 s21
Characteristic leaf length lc 0.1 – 0.1 0.1 mEmissivity, long-wave, leaf eIR 0.96 0.96 0.96 0.96 –Boundary layer conductance
(one side, cuvette)gbl 1.42 1.42 – – mol m22 s21
Wind speed uw 3.86 – 3.86 3.86 m s21
Relative humidity RH 44% 84% 85% 44% –Temperature, air (base) Tair 301.5 298.15 301.5 301.5 KPhotosynthetic photon flux density PPFD 1,700 – 1,700 50–2,000 mmol m22 s21
aDashes indicate a dimensionless (unitless) quantity.
1748 Plant Physiol. Vol. 164, 2014
Rockwell et al.
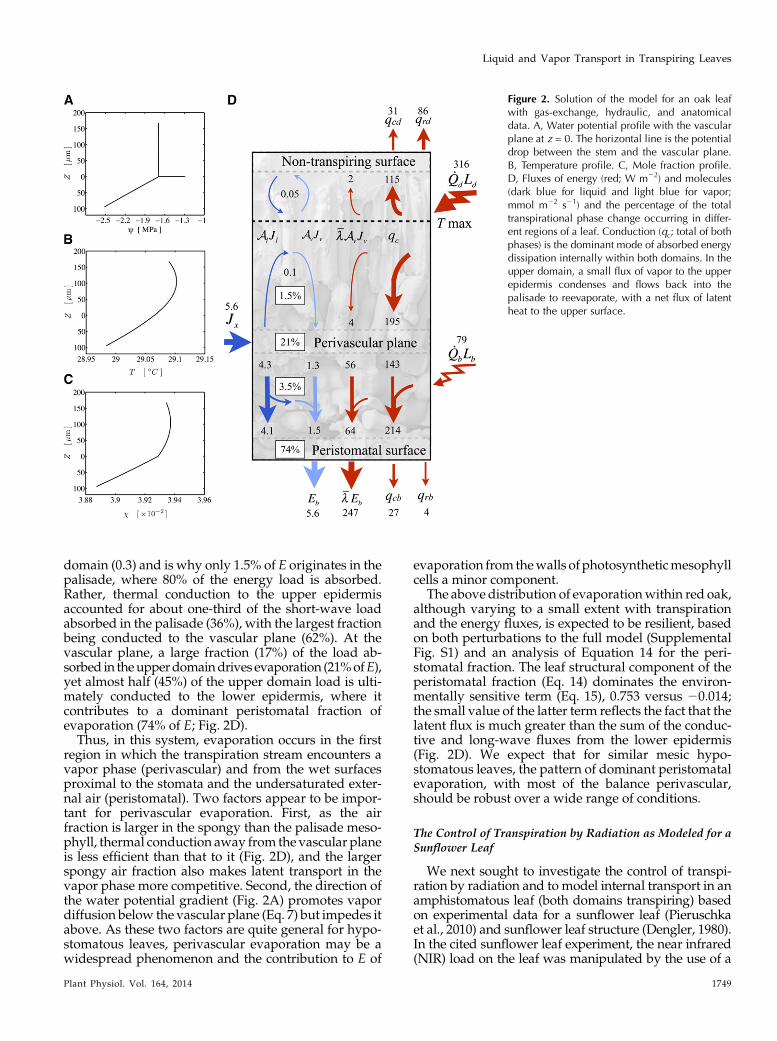
domain (0.3) and is why only 1.5% of E originates in thepalisade, where 80% of the energy load is absorbed.Rather, thermal conduction to the upper epidermisaccounted for about one-third of the short-wave loadabsorbed in the palisade (36%), with the largest fractionbeing conducted to the vascular plane (62%). At thevascular plane, a large fraction (17%) of the load ab-sorbed in theupperdomaindrives evaporation (21%ofE),yet almost half (45%) of the upper domain load is ulti-mately conducted to the lower epidermis, where itcontributes to a dominant peristomatal fraction ofevaporation (74% of E; Fig. 2D).Thus, in this system, evaporation occurs in the first
region in which the transpiration stream encounters avapor phase (perivascular) and from the wet surfacesproximal to the stomata and the undersaturated exter-nal air (peristomatal). Two factors appear to be impor-tant for perivascular evaporation. First, as the airfraction is larger in the spongy than the palisade meso-phyll, thermal conduction away from the vascular planeis less efficient than that to it (Fig. 2D), and the largerspongy air fraction also makes latent transport in thevapor phase more competitive. Second, the direction ofthe water potential gradient (Fig. 2A) promotes vapordiffusion below the vascular plane (Eq. 7) but impedes itabove. As these two factors are quite general for hypo-stomatous leaves, perivascular evaporation may be awidespread phenomenon and the contribution to E of
evaporation from thewalls of photosyntheticmesophyllcells a minor component.
The above distribution of evaporationwithin red oak,although varying to a small extent with transpirationand the energy fluxes, is expected to be resilient, basedon both perturbations to the full model (SupplementalFig. S1) and an analysis of Equation 14 for the peri-stomatal fraction. The leaf structural component of theperistomatal fraction (Eq. 14) dominates the environ-mentally sensitive term (Eq. 15), 0.753 versus 20.014;the small value of the latter term reflects the fact that thelatent flux is much greater than the sum of the conduc-tive and long-wave fluxes from the lower epidermis(Fig. 2D). We expect that for similar mesic hypo-stomatous leaves, the pattern of dominant peristomatalevaporation, with most of the balance perivascular,should be robust over a wide range of conditions.
The Control of Transpiration by Radiation as Modeled for aSunflower Leaf
We next sought to investigate the control of transpi-ration by radiation and to model internal transport in anamphistomatous leaf (both domains transpiring) basedon experimental data for a sunflower leaf (Pieruschkaet al., 2010) and sunflower leaf structure (Dengler, 1980).In the cited sunflower leaf experiment, the near infrared(NIR) load on the leaf was manipulated by the use of a
Figure 2. Solution of the model for an oak leafwith gas-exchange, hydraulic, and anatomicaldata. A, Water potential profile with the vascularplane at z = 0. The horizontal line is the potentialdrop between the stem and the vascular plane.B, Temperature profile. C, Mole fraction profile.D, Fluxes of energy (red; W m22) and molecules(dark blue for liquid and light blue for vapor;mmol m22 s21) and the percentage of the totaltranspirational phase change occurring in differ-ent regions of a leaf. Conduction (qc; total of bothphases) is the dominant mode of absorbed energydissipation internally within both domains. In theupper domain, a small flux of vapor to the upperepidermis condenses and flows back into thepalisade to reevaporate, with a net flux of latentheat to the upper surface.
Plant Physiol. Vol. 164, 2014 1749
Liquid and Vapor Transport in Transpiring Leaves

cold mirror, such that absorbed short-wave radiationcould be increased from 160 to 200 W m22 with nochange in photosynthetic photon flux density (PPFD;Fig. 1 in Pieruschka et al., 2010). Following the increasein NIR, gs and transpiration were both observed to in-crease by approximately 10%, a phenomenon describedby those authors as control of transpiration by radia-tion, and we were interested to see whether our mixedtransport model could produce a similar result. As wecould not constrain all the model parameters with theavailable data, some parameters had to be assumed;leaf thicknesses, tissue thermal and hydraulic conduc-tivities, area fractions, the distribution of absorbed en-ergy between the two domains, and leaf vascularconductance were chosen within a plausible range thatreproduced the transpiration rate, gs, and leaf-to-air molefraction gradient reported by Pieruschka et al. (2010).
We first assumed a simple linear relation betweensteady-state gs and epidermal water potential for smallperturbations around an observed value (hydraulicmodel) based on the form of turgor and aperturecurves described by Franks and Farquhar (2007); thisstep was taken to relax the assumption in the model ofPieruschka et al. (2010) that stomata adjust to conservea fixed target water potential. With the parameters inTable III, the amphistomatal model for the initial stateof absorbed shortwave radiation (SR) = 160 W m22
predicts a slight dominance of internal vapor transport(56% of total E) over total peristomatal evaporation(44%), with the dominant fraction (42%) occurring asperivascular evaporation and diffusion toward thelower epidermis (Fig. 3D). As for oak, we find evap-oration in either mesophyll contributes only in a minorway to the evolution of E (14% in aggregate). Inter-estingly, the evaporative flux in the palisade is almostequally split in its contributions to E from the lowerand upper surfaces (4% and 6% of total E, respec-tively), as the water potential gradient toward theupper epidermis is not strong enough to drive vaporacross the temperature maximum (Fig. 3D).
Following an increase in NIR such that SR = 200 Wm22 and an adjustment to air temperature to holdthe lower epidermis at nearly constant temperature(Pieruschka et al., 2010), the hydraulic model (i.e. in-cluding a hydraulic stomatal response) predicted abouthalf the observed response in total gs (6% versus ap-proximately 10%), with all of the increase occurring for thelower epidermis (Fig. 3E). This increase in gs wasdriven by an increase in lower epidermal water po-tential (from 20.9 to 20.82 MPa), which in turn oc-curred due to a decrease in the liquid flux (and theproportion of peristomatal evaporation) even as tran-spiration increased (by 4.4%). Liquid transport de-creased in absolute terms because the increase in theinternal temperature gradients that accompanied thehigher energy load drove an increase in vapor trans-port sufficient to displace part of the initial liquid flux;in terms of the percentage of E, total peristomatalevaporation decreased (from 44% to 38% of E) whileinternal vapor transport increased (from 56% to 62% of E).
We did, however, find that with a hydraulic feed-back model for stomatal aperture, the positive effect ofthe higher energy load on stomatal aperture was de-pendent on the 0.4°C reduction in air temperature re-quired to conserve lower epidermal temperature,which otherwise saw a small increase in lower gs offsetby a decrease in upper gs. However, Pieruschka et al.(2010) state that the observed response was not en-tirely dependent on such temperature adjustment.A second series of analyses of the cold-mirror experi-ment, following Pieruschka et al. (2010) in assumingthat stomata adjust to conserve a fixed target epider-mal water potential, confirmed that this was possiblein our model as well (Supplemental Fig. S2, A and B).
To understand what influences the magnitude of thestomatal response in a conserved epidermal waterpotential model, we start with the proposition that anincrease in transpiration can occur in one of two ways:an increase in gs or an increase in epidermal temper-ature and, therefore, the leaf-to-air vapor mole fractiondifference, Dx. At the same time, dissipating an in-creased energy load requires an increase in the internaltemperature gradient from the sites of short-wave ab-sorption to the leaf surface, such that both the flux ofinternal vapor and thermal conduction increase. Tohave an increase in internal vapor transport that ispassed through to E via an increase in gs, therefore,requires that the extra energy conducted to the epi-dermis be transmitted to the environment as efficientlyas possible, minimizing the increase in surface tem-perature and Dx that would compete with gs to explainan observed increase in E.
Formally, considering a single domain subject to aradiative load SR, holding the epidermal water po-tential and, therefore, the liquid flux constant leads toan expression for the change in total conductance, dgT(inclusive of stomatal and boundary layer effects),that results from an additional radiative load dSR(Supplemental Text S2) as:
dgTgT
¼ dSRlE
"12
AlkTl þAvkTvAlkTl þAvkTv þAvlcDvxT
1þ lgTxT
kTs
!#
kTs ¼ qr þ qsDTea
ð20Þ
The ratio of the increase in thermal load (dSR) to theinitial latent flux (lE) sets the maximum positive re-sponse. The second ratio ranges from 1:1 to a plausiblelimit of 1:3 as internal latent transport due to thermalgradients becomes important relative to internal ther-mal conduction; the third and final ratio describes thesensitivity of latent transport from the leaf to temper-ature, lgTxT, relative to sensible conductivity kTs (inclu-sive of net long-wave radiation and conduction). Thislast ratio says that stomatal opening in response toincreased energy load is aided by low initial gs valuesand confirms the importance of efficient conductive
1750 Plant Physiol. Vol. 164, 2014
Rockwell et al.

and radiative energy transfer to the environment thatminimize increases in leaf surface temperatures.Interestingly, while both condensation (Eq. 17) and a
positive stomatal response (Eq. 20) are favored by adominance of latent transport due to thermal gradientsover heat conduction inside the leaf and a dominance ofsensible heat over latent heat at the surface, their ex-pressions are not identical. Leaves that achieve a con-densing state on the inner face of a transpiring epidermisare likely also to be in a regimewhere stomatal apertureincreases for a higher short-wave load, but the converseis not true. The more restrictive condition for conden-sation requires that the sensible flux from the surface beat least more than half as large as the latent flux, giventhat, even for the extreme case of a 90%air fraction in thelower domain and a thermal conductivity for the cellsone-third that of water, the ratio of thermally inducedlatent to sensible internal heat transport inEquation 17 isless than 2.A final result of the model containing a hydraulic
feedback on stomatal aperture underscores the pointthat average leaf water potentials (as measured by a
pressure chamber or psychrometer) cannot be expectedto follow a simple relationship with the water potentialof a transpiring epidermis. For example, in the hydraulicfeedback analyses (Fig. 3), lower epidermal water po-tential increasedby 0.08MPawith the increase in energyload, even as the average water potential of the leaf in-creased by only 0.015 MPa. In addition, these problemsextend to measures of hydraulic transport efficiency thatdepend on average leaf water potential, such as Kleaf,which increased in the hydraulic feedback model by12.5% (8.2–9.2 mmol m22 MPa21 s21) between the cold-and full-mirror treatments, despite constant parametervalues for the hydraulic conductivity of the xylemor cells.
Condensation and Energy Overload in an Oak-Like Leaf
We next sought to understand the implications for trans-port efficiency and stomatal control of a hypostomatousleaf pushed by increasing energy loading into a con-densing state at its transpiring epidermis. We startedwith a leaf characterized by parameter values for redoak and increased the air fraction to 85% in the spongy
Figure 3. Model results for a sunflower leaf illuminated by a cold mirror (SR = 160 W m22; solid lines) and a full mirror(SR = 200 W m22; dashed lines), as in the experiments of Pieruschka et al. (2010). A, Water potential profile through the leafthickness (upper = adaxial, lower = abaxial) with the vascular plane at z = 0. The horizontal line is the potential drop betweenthe stem and the vascular plane. B, Temperature profile. C, Mole fraction profile. D and E, Fluxes of energy (red; W m22) andmolecules (dark blue for liquid and light blue for vapor; mmol m22 s21) and the percentage of the total transpirational phasechange occurring in different regions of a leaf, under illumination by a cold mirror (SR = 160; D) or a full mirror (SR = 200; E).Under the higher thermal load, an increase in internal temperature gradients shifts more of the water flux from liquid to vapor.
Plant Physiol. Vol. 164, 2014 1751
Liquid and Vapor Transport in Transpiring Leaves

and 20% in the palisade (43.4% overall) to produce a leafwith Pc of 12.6 in the palisade and 3.5 in the spongy(Table III). For this leaf, internal vapor transportaccounted for 103.8% of E (condensing flux = 3.8% of E)under conditions of 85% relative humidity and1,700 mmol m22 s21 PPFD (SR = 394.9 Wm22). The highrelative humidity was necessary to suppress lE and soincrease the magnitude of the first term in the peri-stomatal Equation 14 over the second (20.236 versus0.198); as a result, even for a large spongy air fraction,reaching a condensing state at the lower epidermis re-quired a leaf surface temperature more than 2°C aboveambient. We then compared the effects on internaltransport of dropping or increasing the energy load by100 W m22: the high- and low-load final states areshown in Figure 4 (initial state not shown).
Dropping the energy load by 100 W m22 pushed theleaf out of the condensing regime, with peristomatalevaporation at 2% (Fig. 4D); the leaf-to-air temperaturedifference fell to 1.5°C, but the change in epidermalwater potential (+0.03 MPa) resulted in no materialchange in gs (Fig. 4D). Nor did the opposite pertur-bation, adding 100 W m22, result in an increase in gs ashypothesized by Pieruschka et al. (2010), despite theexistence of a condensing flux equivalent to 8% of E(Fig. 4E). The smaller total vascular-to-epidermal wa-ter potential difference in the lower domain was offsetby the increased drop through the leaf vasculature andstem accompanying the increased flux. The differencefrom the sunflower simulations is not only the lack ofcompensatory changes in air temperature but that herewe account for hydraulic feedbacks due to larger waterpotential drops through the root and stem arising fromhigher fluxes at the whole-plant level as well.
Considered from the perspective of stomatal pro-tection of either the leaf tissue or xylem from exces-sively low water potentials, the model results suggestthat condensing steady states may be maladaptive tothe extent that stomata are influenced by epidermalwater status. While the water potential at the tran-spiring surface dropped by 0.06 MPa between the low-and high-energy loads in Figure 4, the water potentialat the vascular plane fell 0.24 MPa and the averagewater potential of the mesophyll by 0.21 MPa. This sortof uncoupling, increasing with higher energy loadsand E, indicates that condensing states, although ap-parently hydraulically efficient in the sense that Kleafincreased from 14.2 to 17.1 mmol m22 MPa21 s21 be-tween SR = 295 and 495, could lead to the loss of tightstomatal control of xylem tensions.
Modeling Evaporative Flux Experiments on Detached Leaves
In the condensing leaf simulation (Fig. 4), the increasein apparent Kleaf found for a 200 W m22 increase inenergy load, equivalent to about an 800 mmol m22 s21
increase in PPFD, amounted to a 20% increase over theinitial value, with only a 1.5°C change in epidermaltemperature that, from the perspective of viscosity
corrections, might be considered nonsignificant. As anexperimental result, this might easily be mistaken asevidence of an increase in the permeability of the cells.Therefore, we sought to understand to what extentevaporative flux measures of Kleaf are sensitive not justto leaf temperature but also to the balance of sensibleand latent fluxes from the surface, which can change thelength of the flow path by changing the peristomatalfraction, as in Equation 17.
At any particular epidermal surface temperature,average leaf water potential is sensitive to a shift in thebalance of internal liquid versus vapor transport, suchthat leaves with more internal vapor transport have ahigher apparent Kleaf. The problem for experiments ondetached leaves is exacerbated by the fact that stomatamay be difficult to open under conditions of high waterpotential due to the mechanical advantage of the epi-dermis (Brodribb and Holbrook, 2006; Franks andFarquhar, 2007). Tomake thepoint concrete,wemodeledadetached leafwith thehydraulic and thermalpropertiesof oak leaves, and a volumetric air fraction of 34% morerepresentative of leaves broadly (Byott, 1976), in shadeand full sun (50 and 2,000 mmol m22 s21 PPFD, respec-tively), with gs constrained to 50 and 100 mmol m22 s21,respectively (Fig. 5).Kleaf increased 55%between the tworadiation levels, even when air temperature was ad-justed to conserve epidermal temperature. Therefore,we caution that the apparentKleaf can change dependingon the details of the energy regime, despite negligiblechanges in surface temperatures, even as the hydraulicconductivity of the cells remains unchanged. This effectis expected to be particularly pronounced when a leafshifts from a cool leaf regime (energy loading domi-nated by conduction to the epidermal surfaces, favoringperistomatal evaporation) to a warm leaf regime (en-ergy loading dominated by short-wave absorption inthe mesophyll), as shown here (Fig. 5, D and E).
DISCUSSION
Our analysis of evaporation in leaf tissue found that asingle nondimensional parameter group, Pc, describesthe competition of sensible and latent heat transport.This parameter group depends not only on the physicalproperties of air and water, as in the equilibrium evap-oration case (Raupach, 2001), but also on the sensitivityof vapor pressure to liquid phasewater potential withinthe mesophyll and the hydraulic and thermal conduc-tivities of leaf tissue as well. Unless the chemical po-tentials of the vapor and liquid phases of water inmesophyll airspaces and cells are far out of local equi-librium, as for example due to an extensive internalcuticle in the mesophyll, our analysis should provide areasonable guide to thinking about the coupling of heatandmolecular transport in leaves. And, in any case, ouranalysis demonstrates the importance of accounting forliquid phase thermal conduction.
Indeed, liquid phase thermal conduction appears tobe not only important but inevitable. Under local
1752 Plant Physiol. Vol. 164, 2014
Rockwell et al.

equilibrium, both vapor and liquid tend to move downgradients in water potential; however, the vapor fluxhas an additional tendency to move down temperaturegradients, as can be seen in Equation 7. For water toevaporate locally, thewater potential gradient out of thelocal volume must be less steep than the gradient in,such that more liquid water moves in than out. But thisalso means that the component of the vapor flux due towater potential is greater in than out, the opposite ofwhat is required tohave anet increase invapor out of thelocal volume.Molecular conservation then requires thatthe component of vapor diffusion due to the tempera-ture gradient be greater out than in, such that theresulting vapor mole fraction gradient is greater outthan in. This constraint ofmolecular conservation on thetemperature gradient means that thermal conductionwill also be greater out than in, such that the absorbedenergy load can never be dissipated solely by latenttransport; some energy will also flow out by thermalconduction.
Our subsequent analyses of particular cases are notintended as definitive descriptions of the distribution ofevaporation in transpiring leaves; rather, they are putforward as a first-order framework for organizingthinking about both the competition between liquid andvapor transport and the competition between latentheat and thermal conduction. For example, the 1Dmodel structure is clearly violated by the discreteplacement of veins and stomata in leaves. While the is-sues of vein spacing can be addressed by way of a cor-rection factor, based on simulation of the full 3Dgeometry of an areole (Rockwell et al., 2014b), as donehere for oak, understanding the effects of discrete sto-matal spacing and the geometry of substomatal cavities(Pickard 1982), as well as internal cuticle (Pesacretaand Hasenstein, 1999), on the water potential andtemperature of the peristomatal region requires furtherwork. Finer scale physical detail, such as volume frac-tions for specific tissues, rather than averaged overwhole domains, as well as independent estimates of a
Figure 4. The shift at higher short-wave radiation loads to a condensing state at the lower epidermis in an oak-like leaf with anair fraction of 0.434. For A to C, solid lines are for the low load (SR = 295 W m22) and dotted lines are for the high load(SR = 495), with the scale on the top x axis in B and C. A, Water potential profile through the leaf thickness (upper = adaxial,lower = abaxial) with the vascular plane at z = 0. The horizontal line is the potential drop between the stem and the vascularplane. B, Temperature profile. C, Mole fraction profile. D and E, Fluxes of energy (red; W m22) and molecules (dark blue forliquid and light blue for vapor; mmol m22 s21) and the percentage of the total transpirational phase change occurring in dif-ferent regions of a leaf under a low short-wave load (SR = 295; D) and a high load (SR = 495; E). The high load pushes theinternal face of the lower epidermis into a condensing state (the internal evaporative flux exceeds transpiration), such that thereis a small liquid flux back into the spongy mesophyll, where it reevaporates.
Plant Physiol. Vol. 164, 2014 1753
Liquid and Vapor Transport in Transpiring Leaves

tortuosity for the vapor path, could further fine-tunethese analyses. More detailed short-wave absorptionfunctions could also be incorporated (Knipling, 1970),yet given the apparent strength of thermal conduction inleaf tissue, the exact pattern of absorption within a do-main seems unlikely to have a strong effect on the re-sults. The assertion of a well-defined steady state fortranspiring leaves might also be questioned. Philip(1966) estimated, based on the characteristic times forthe propagation of water potential changes in planttissue versus the typical period of environmentalvariation, that as long as gs is stable, leaves attainphysically well-defined steady states, although atransient analysis may be necessary to understandbehavior at the wilting point. Here, if we accept theapparent stability of gas-exchange measurements,the argument of Philip (1966) supports steady waterpotential and temperature profiles through the leaftissue as well.
With all of the above caveats, a number of generalpoints pertaining to leaf structure and function emerge
from our analysis. The distribution of evaporationfound here for oak provides a general model for hypo-stomatous leaves with smaller airspaces in the palisadethan spongy mesophyll: due to the high thermal con-ductivity of leaf tissue and small airspaces, heat con-duction is more efficient than latent heat transport fordissipating the large absorbed radiation load in thepalisade. At the transition to the spongy mesophyll (i.e.the perivascular plane), the increase in air fraction in-creases the competitiveness of vapor transport, so someof the conducted heat flux switches to latent transport,creating perivascular evaporation. Local evaporation inthe spongy mesophyll is low, as the local radiation loadis small. The remainder of the heat conduction fluxthat originated in the palisade (and was not consumedby perivascular evaporation) ultimately arrives atthe lower epidermis, where it provides the energy forperistomatal evaporation and for the surface sensiblefluxes. For such leaves, mesophyll evaporation willbe a subordinate component, with the dominance ofeither perivascular or peristomatal evaporation strongly
Figure 5. Distribution of evaporation for a simulated low-light (PPFD = 50 mmol m22 s21) evaporative flux experiment on anoak-like leaf but with an air fraction of 0.34. For A to C, solid lines are for the low load (SR = 12 W m22) and dotted lines are forthe high load (SR = 466), with the scale on the top x axis in B and C. A, Water potential profile through the leaf thickness(upper = adaxial, lower = abaxial) with the vascular plane at z = 0. The horizontal line is the potential drop between the stemand the vascular plane. B, Temperature profile. C, Mole fraction profile. D and E, Fluxes of energy (red; W m22) and molecules(dark blue for liquid and light blue for vapor; mmol m22 s21) and the percentage of the total transpirational phase changeoccurring in different regions of a leaf under two different energy regimes, driven by low (D) and high (E) light levels (mmol m22 s21).The transition from a dominant surface load of sensible heat at low light to a dominant short-wave load at high light results in alarge change in Kleaf (mmol m22 MPa21 s21).
1754 Plant Physiol. Vol. 164, 2014
Rockwell et al.

influenced by the amount of airspace in the spongymesophyll.More broadly, given that the hydraulic conductivity
of the cells may span 1 order of magnitude larger andsmaller than found here for oak (Kramer and Boyer,1995), that volumetric air fractions span 2% to 55% oftotal leaf volume and may reach 70% in the spongymesophyll of some leaves (Pieruschka et al., 2010), andthat the thermal conductivity of the cells is not likely tobe much less than that of water (Tyree and Yianoulis,1980), we should expect that leaves span nearly the fullrange of peristomatal fractions. The crucial role of theextent of spongy mesophyll airspace in shifting evap-oration between peristomatal and perivascular regionsmay then reconcile evidence for a dominant role ofvapor transport in plants that have extensive airspaces(Boyer, 1985; Mott, 2007) versus evidence for thedominance of peristomatal evaporation in plants withdenser spongy mesophyll (Byott and Sheriff, 1976).Indeed, given the importance we find for heat con-duction in the liquid phase, most of the variation in thedistribution of evaporation between leaves may occuras differences in perivascular evaporation (evaporationinto the first available airspaces) versus peristomatalevaporation (evaporation from the wetted surfacesclosest to the unsaturated external air). Nevertheless,mesophyll evaporation will be somewhat higher inleaves with a lower peristomatal fraction, as lowvalues of Pc favor both local evaporation and vaportransport from the vascular plane.The distribution of evaporation within a given leaf,
however, is not static. As the tendency toward vaportransport increases (Pc approaches 1, and the bracketedterm in the peristomatal Eq. 14 goes to 0), the internaldistribution of evaporation becomes more sensitive tothe surface fluxes and environmental conditions. Anincrease in transpiration due to a decrease in ambientmole fraction pulls the distribution of evaporation to-ward the stomata. On the other hand, an increase intranspiration due to an increase in the energy loadabsorbed in the mesophyll reduces the peristomatalfraction, as the resulting increase in the temperaturegradient shifts the balance of molecular transport to-ward the vapor phase. As the latter effect is more likelyto be important in driving E on diurnal time scales, theresulting shifts in evaporation sitesmayhelp explain theinverse relationship in oxygen isotope studies of leafwater between transpiration and the effective path-length from the veins to the sites of evaporation (Songet al., 2013).Another importantpoint that emerges from the analysis
is that experiments to characterize hydraulic transportproperties of transpiring leaves need to account for theenergy-loading regime and not simply leaf surface tem-peratures. Even for the transpiring oak leaves mod-eled here, with a strong dominance of the liquid path at74% peristomatal evaporation, temperature-induced va-por movement explained 11% of the internal flux, suchthat accurate characterization of leaf-averaged hydrau-lic parameters based on transpiration (nonisothermal)
experiments requires accounting for internal tempera-ture gradients. Comparisons of Kleaf between heavilyshaded leaves, below ambient air temperaturewhen theexternal latent heat flux exceeds the solar short-waveload, and an identical illuminated leaf for which theopposite is truemay be expected to be problematic. Thiswill be especially true for leaves with large air fractions,as these can shift from a dominantly peristomatal to adominantly perivascular evaporative regime betweencool and warm states.
A final point, pertaining to stomatal behavior, is thatourmodel concurswith the core hypothesis of Pieruschkaet al. (2010) that, under some circumstances, increases inshort-wave radiative loading that drive a larger internalvapor flux could lead to increased stomatal apertures.However, we find that it is not necessary for the internalsurface of the leaf to be in a condensing state for this effectto occur. To the extent that stomatal regulation empha-sizes water over energy balance, such condensing statesmay indeed be pathological.
The specific cases examinedhere are just thefirst stepsin elucidating the adaptive significance of internalvapor versus liquid transport. While the theoreticalanalyses presented here provide a broad outline,reconstructing the distribution of evaporation (i.e. asdone here for red oak) for a variety of leaves withvarying internal architectures, characteristic environ-ments, and growth habits will be required to fill in thepicture. With respect to water use efficiency, therewould not appear to be any obvious first-order effects ofinternal vapor versus liquid transport. The most im-portant factor for transport influences on water use ef-ficiency are leaf-to-air temperature differences (a coolerleaf will be more water use efficient), and these do notseem particularly sensitive to which mode of internaltransport is dominant.
In contrast, the hydraulic efficiencyof the leaf, definedas E divided by the vascular-to-epidermal water po-tential drop, will be very sensitive to the amount ofvapor phase transport. Themore the internal E is drivenby temperature-induced gradients in the mole fraction,the shallower the water potential gradient from veins totranspiring epidermis will be. As seen in the sunflowersimulations, such temperature effects mean that in-creases in energy loading are accompanied by increasesin hydraulic efficiency, such that the water potentialgradientmay change little as Efluctuateswith a varyingsolar load. A large perivascular fraction of E could thensave the construction costs associatedwith building stifftissues capable of maintaining volume homeostasisover large swings in water potential.
What, then, might be the risks of, or constraints on,using temperature-induced vapor transport to movewater to the stomata? The temperature sensitivity ofvapor phase transport may helpmitigate solar load-drivendemand shocks butwill not helpwith supply shocks dueto soil drying. Where leaves must function over a widerange of soil water potentials during their lifetime, itmay be more advantageous to invest in stiff epidermaltissues capable of sustaining the water potentials
Plant Physiol. Vol. 164, 2014 1755
Liquid and Vapor Transport in Transpiring Leaves

necessary to extractwater fromdrying soils. In addition,the condensing leaf simulation (Fig. 5) points to a possibleconstraint in that if a leafwith a high perivascular fractionis pushed into a state where condensation occurs at thetranspiring epidermis, protection of the vasculature fromexcessive tensions could be compromised.
A final hypothesis suggested by the energy compo-nent of this analysis relates to the functional signifi-cance of bundle sheath extensions. A role for thesestructures in providing a low-resistance path for flowto a transpiring epidermis has long been suggested(Wylie, 1952). The fact that they have been found to bemore prevalent in upper canopy (high-energy) ratherthan subcanopy (low-energy) strata (Kenzo et al., 2007)suggests a role in aiding thermal conduction of energyabsorbed in the upper epidermis and palisade to whatwe find to be the dominant sites of evaporation, theperivascular and peristomatal regions.
The theoretical and experimental analyses presentedhere demonstrate that consideration of the competitionbetween liquid and vapor, as well as thermal conduc-tion and latent heat, provides an essential perspectivefor understanding leaf structure and function. The de-scriptions of leaf structure that enter into the 1D analysisare still very rudimentary, however. Fortunately, themodeling approach taken here is sufficiently generalthat more detailed descriptions of leaf architecture (e.g.the locations of internal cuticles, veins, and stomata) canbe realized in the future by relaxing local equilibriumand implementing the model in a numerical simulationpackage. Even so, the analytical results presented herefor the distribution of evaporation, and the parameterPc, will likely retain their value for developing an in-tuitive understanding ofwhere the transpiration streamchanges phase inside leaves.
MATERIALS AND METHODS
Parameterization and Solution of the Transpiring OakLeaf Model
Solution for a Section of Leaf Enclosed in a Cuvette
For leaves of northern red oak (Quercus rubra), we estimated hA, kl, Al, andAv based on hydraulic and anatomical experiments. To estimate the liquidphase hydraulic conductivity for red oak, we used data from rehydrationexperiments conducted on bagged leaves initially attached to a tree on thecampus of Harvard University (Rockwell et al., 2011). The results of theserehydration experiments, conducted on bagged leaves initially attached to thetree, were reported in terms of the ratio of final to initial water potential(C ¼ cf=co) and the hydration time t. From these data, estimates of the totalhydraulic conductivity of leaf tissue kℓ were calculated according to:
kℓ ¼ j4p2 ln
�8
Cp2
�c1Dℓ L2
tþ hln ðCÞ 2cℓLhA
ð21Þ
where cℓ is the volumetric hydraulic capacity of the leaf, L is the half-thickness(i.e. the average length of the upper and lower domains), hA is the hydraulicconductance of the vascular network normalized to the leaf area, and j and h
are scaling factors that map the 1D solution form to a numerical solution of thetransient hydration in a 3D domain that respects the discrete placement of thevasculature (Rockwell et al., 2014b).
Flux measurements of transpiring leaves with a LI-6400 (Li-Cor Biosciences)provided the estimates of E, abaxial epidermal temperature (TLb), environmental
air temperature (Tair), and boundary layer thickness (d). We then foundthe sensible heat flux qcb (Supplemental Text S1, Equation 1.28). In addition,taking the LI-6400 output TBlk as Tsur with aIR = 0.95 allowed estimation of theradiative flux qrb (Supplemental Text S1, Equation 1.25). The thermal conduc-tivity of the liquid phase was estimated from a lateral thermal conductivity ofoak leaves of 0.25 J m22 s21 K21 as reported previously (Vogel, 1983), yielding0.286 J m22 s21 K21 after accounting for the air fraction. Volumetric air fractionwas estimated from the weight gain observed for leaves submerged inwater in acolumn subject to alternating cycles of pressurization at 0.1 MPa and vacuumuntil no further weight gain occurred (Byott, 1976). For comparison with themeasured value cleaf, the average water potential of the cells of a leaf (negligibledensity in the airspace), once at internal equilibrium, is given by:
Æcæ ¼ AldR Ld0 cdðzÞdzþAlb
R Lb0 cbðzÞdz
AldLd þAlbLbð22Þ
An estimate that takes into account the effects of vein spacing onwater potentialgradients is given by:
Æcæ ¼ ÆCæðcr 2ceÞ þ ce; ÆCæ ¼ fþ v
ℬð23Þ
where f and v can be predicted based on a leaf’s internal geometry and ℬ isthe ratio of the vascular and tissue path conductances (Rockwell et al., 2014b).
In the initial iteration of the model (Supplemental Text S3), qrd and qcd wereestimated assuming TLd = TLb, with the total absorbed short-wave load SRthen given by (Supplemental Text S1, Equation 1.35). The initial estimate of _Qb
followed from (Supplemental Text S1, Equation 1.33). The physical propertiesl;xc; xT; cDv were then calculated at Tair and cr. To find co for a hypo-stomatous leaf for which the vascular geometry is known, global molecularconservation (Supplemental Text S1, Equation 1.36) can be written in the form:
E ¼ §hAðcr 2coÞ ð24Þwhere § is a correction factor that maps a 1D solution with a continuousvascular plane approximation to the numerical simulation of the full 3Dproblem with discrete vein placement, based on an analysis of the isothermal(linear) flow problem (Rockwell et al., 2014b). Essentially, § accounts for theresistance to the lateral (x,y) movement of water molecules in the vicinity ofthe vascular bundles, a resistance neglected in making a continuous vascularplane approximation that spreads vascular conductance smoothly over thewhole vascular plane. For a hypostomatous leaf, the factor § can be predictedfrom the vascular and tissue geometry that determines z and h as well as theBiot number ℬ, the ratio of hydraulic conductance to the total conductance ofthe tissue between a vascular plane and the transpiring surface:
§ ¼ ðzℬ þ eÞ2 1; ℬ ¼ hALbkℓ
ð25Þ
For the first iteration, to find an appropriate value of §, we used the total ef-fective hydraulic conductance of the tissue (the composite of air and cells)from the isothermal problem:
kℓ ¼ Alkl þAvcDvxc ð26Þ
With this, the solution for the lowerwater potential field (Supplemental Text S1,Equation 1.23) was complete. Evaluating the solution for the lower temperaturefield (Supplemental Text S1, Equation 1.24) at z = L with TLb given by thetemperature measured by the LI-6400 leaf thermocouple (Tleaf) provided anequation for To. Everything was then known.
For the second iteration, physical properties were recalculated at the firstsolution’s values of To and co. The upper surface heat fluxes qrd and qcd wererecalculated for TLd, and the estimate of SR was adjusted. In addition, thevalue of § was updated from the first iteration of the solution by adjustingthe effective hydraulic conductance of the tissue to account for the portion ofthe flux driven by temperature gradients:
kℓ ¼ Alkl þAvcDvxc þAvcDvxT
�To 2TLb
co 2cLb
�ð27Þ
This process may be repeated for a third iteration to verify the stability of thesolution, but this was not necessary for the red oak leaves studied here. Finalparameter values are given in Table III.
Solution for an Exposed Leaf
We took gs as given (as measured in the cuvette), with gbl estimated fromSupplemental Text S1, Equations 1.31 and 1.29 and with lc taken as 10 cmand uw = 1 m s21. The mole fraction of the external air (xair) was calculated
1756 Plant Physiol. Vol. 164, 2014
Rockwell et al.

from the air temperature and humidity of the reference stream (bypass fullyopen) reported by the LI-6400. The transpiration rate was not imposed butdepended on x(TLb, cLb) as given (Supplemental Text S1, Equation 1.30). Thetotal solar load SR was estimated from the energy per mole of incident pho-tosynthetically active radiation (PAR), for the solar spectrum 2.35 3 105 Wmol21, based on the observation that PAR contains about half the energy in thesolar spectrum and that about half of incident solar short-wave radiation (PARand NIR) is absorbed by leaves (Campbell and Norman, 1998). The sourceterms _Qb;
_Qd were then set by assuming a distribution of the solar load be-tween spongy and palisade tissues, as in Supplemental Text S1, Equations 1.32and 1.33. To calculate the net long-wave radiative fluxes on the upper andlower leaf surfaces, we let Tsur = Tsky on the upper epidermis and Tsur = Tair onthe lower. With this, the solutions Supplemental Text S1, Equations 1.17 and1.18 for the upper nontranspiring domain could be evaluated at Ld and thesolutions Supplemental Text S1, Equations 1.23 and 1.24 for the transpiringdomain at Lb, to find four equations with six unknowns: TLd, cLd, To, co, TLb,and cLb. With Ed = 0 for no transpiration from the upper surface and the sourcewater potential (cr) given, co was found from global molecular conservation(Supplemental Text S1, Equation 1.36), and global energy conservation (Sup-plemental Text S1, Equation 1.35) provided the required constraints on TLd,TLb, and cLb that closed the system of equations for the five remaining un-knowns. We then solved the system using the FindRoot command of Math-ematica 8 (Wolfram Research). As before, for the first iteration of the solution,the physical properties l; xc; xT; cDv were evaluated at Tair, and the vascularscaling factor § was defined by Equation 25 and leaf hydraulic conductivity byEquation 26. For the second iteration, these properties were recalculated at Toand co, and § was reestimated using the effective nonisothermal kl fromEquation 27. Finally, a check of the neglected enthalpy transport terms (due tomolecular fluxes through a temperature field) described in Supplemental TextS1 verified that they were indeed negligible relative to the retained latent andconductive fluxes (Supplemental Text S4).
Sunflower Cold-Mirror Experiment Model
As not all model inputs were available from the data of Pieruschka et al.(2010), some parameters had to be estimated from previous reports or as-sumed (Table III). Specifically, the original data contained no information onhydraulic parameters or variables, so values had to be assumed, and thus theabsolute water potentials reported are arbitrary values; a constant water po-tential of 20.2 MPa was assumed to exist at the petiole/stem junction. Assunflower (Helianthus annuus) is amphistomatous, the solution was sought fortwo transpiring domains, with total gs partitioned arbitrarily but in a mannerconsistent with a larger flux from the abaxial side (Foster, 1986). Radiativeboundary conditions were set for a laboratory with all surfaces at Tair, thepartitioning of SR between the upper and lower domain was set at 90% and10%, respectively, and the thermal conductivity of the cells was assumed to be0.2 W mol21 K21.
After solution of the model for the cold-mirror initial state, SR = 160,we then constructed equations to describe the linear response of gs tosmall perturbations in water potential (Supplemental Text S5) when atapproximately 80% of maximum aperture, based on the shape of re-sponses described by Franks and Farquhar (2007). We then changed SR toits full-mirror value of 200 and resolved the model based on environ-mental inputs with both gs and surface temperatures as variables. Tocapture the effect of the temperature compensation described by Pieruschkaet al. (2010), ambient air temperature in the model was adjusted iteratively tobring lower epidermal temperature to within 0.01°C of its initial at SR = 160.
The explore the effect of air fraction and upper and lower domainsymmetry on the magnitude of stomatal opening at the higher radiationlevel, we modeled the cold-mirror experiment for three different total airfractions (0.3, 0.5, and 0.7), employing the assumption of Pieruschka et al.(2010) that stomata change aperture to hold epidermal water potentialconstant (Supplemental Text S6).
Condensing Leaf and Evaporative Flux Meter Models
To construct a condensing leaf model (Supplemental Text S7), we startedwith the exposed leaf solution for an oak leaf and then varied the air fractionin each domain and external humidity as guided by Equation 17 to bring thelower epidermis into a condensing state, with final values of 0.75 in thespongy and 0.2 in the palisade domains and relative humidity of 85%. Otherleaf parameters were left unchanged. As we were not concerned with the
absolute values of the water potentials, and because the temperature gradientsare nonlinear in the condensing limit, we neglected the vascular scaling factor.In addition, to capture the effect of a whole-plant canopy responding to en-vironmental forcing, we allowed the stem water potential cr to vary by as-suming a soil water reservoir potential and per leaf whole plant conductance,such that:
cr ¼ cg þ cs 2EKrs
ð28Þ
where cg is the standing gravitational potential and Krs is the effective con-ductance of the root and stem to the modeled leaf. To allow gs to respond in amanner consistent with steady-state hydraulic feedbacks, an arbitrary modelbased on the form of aperture and turgor relations described by Franks andFarquhar (2007) was adopted:
gs ¼ gmax
�12 exp
�2 5:23106 2cLb
1:53106
��ð29Þ
where gmax was estimated as 0.36 mol m22 s21 based on data from oak trees atHarvard Forest (Williams et al., 1996). For the evaporative flux meter model,we set cr to a small but nonzero value to avoid division by zero errors, with anair fraction of 0.3, and adopted radiative boundary conditions suitable for alaboratory of Tsur = Tair (Supplemental Text S8).
Supplemental Data
The following materials are available in the online version of this article.
Supplemental Figure S1. Oak leaf humidity and energy perturbations.
Supplemental Figure S2. Sunflower air fraction and stomatal symmetryvariations.
Supplemental Text S1. Model description and overview of derivation.
Supplemental Text S2. Detailed model derivation and appendices.
Supplemental Text S3. Oak model code.
Supplemental Text S4. Evaluation of enthalpy convection terms code.
Supplemental Text S5. Sunflower model code.
Supplemental Text S6. Sunflower epidermal potential set-point model code.
Supplemental Text S7. Condensing oak-like leaf model code.
Supplemental Text S8. Evaporative flux meter model code.
Received January 20, 2014; accepted February 21, 2014; published February 26,2014.
LITERATURE CITED
Bird RB, Stewart WE, Lightfoot EN (1960) Transport Phenomena. JohnWiley & Sons, New York
Bowen IS (1926) The ratio of heat losses by conduction and by evaporationfrom any wet surface. Phys Rev 27: 779–787
Boyce CK, Brodribb TJ, Feild TS, Zwieniecki MA (2009) Angiosperm leafevolution was physiologically and environmentally transformative. ProcRoyal Soc B 276: 1771–1776
Boyer JS (1969) Free-energy transfer in plants. Science 163: 1219–1220Boyer JS (1985) Water transport. Annu Rev Plant Physiol 36: 473–516Brodribb TJ, Feild TS, Jordan GJ (2007) Leaf maximum photosynthetic rates
and venation are linked by hydraulics. Plant Physiol 144: 1890–1898Brodribb TJ, Feild TS, Sack L (2010) Viewing leaf structure and evolution
from a hydraulic perspective. Functional Plant Biol 37: 488–498Brodribb TJ, Holbrook NM (2006) Declining hydraulic efficiency as transpiring
leaves desiccate: two types of response. Plant Cell Environ 29: 2205–2215Buckley TN (2005) The control of stomata by water balance. New Phytol
168: 275–292Buckley TN, Mott KA (2013) Modeling stomatal conductance in response
to environmental factors. Plant Cell Environ 36: 1691–1699Buckley TN, Sack L, Gilbert ME (2011) The role of bundle sheath exten-
sions and life form in stomatal responses to leaf water status. PlantPhysiol 156: 962–973
Plant Physiol. Vol. 164, 2014 1757
Liquid and Vapor Transport in Transpiring Leaves
Byott GS (1976) Leaf air space systems in C3 and C4 species. New Phytol76: 295–299
Byott GS, Sheriff DW (1976) Water movement into and through Trades-cantia virginiana (L.) leaves. II. Liquid flow pathways and evaporatingsites. J Exp Bot 27: 634–639
Campbell GS, Norman JM (1998) An Introduction to Environmental Bio-physics. Springer-Verlag, New York
Cernusak LA, Kahmen A (2013) The multifaceted relationship between leaf water18O enrichment and transpiration rate. Plant Cell Environ 36: 1239–1241
Chen IT, Pharkya A, Stroock AD (2014) Analysis of superheated loop heatpipes exploiting nanoporous wick membranes. AIChE J 60: 762–777
Crank J (1957) The Mathematics of Diffusion. Oxford University Press,New York
Deen WM (1998) Analysis of Transport Phenomena. Oxford UniversityPress, New York
Dengler NG (1980) Comparative histological basis of sun and shade leafdimorphism in Helianthus annuus. Can J Bot 58: 717–730
DeVries DA (1958) The simultaneous transfer of heat and moisture inporous media. Trans Am Geophys Union 39: 909–916
Farquhar GD, Lloyd J, Taylor JA, Flanagan LB, Syvertsen JP, Hubick KT,Wong SC, Ehleringer JR (1993) Vegetation effects on the isotope com-position of oxygen in atmospheric CO2. Nature 363: 439–443
Foster JR, Smith WK (1986) Influence of stomatal distribution on transpi-ration in low wind environments. Plant Cell Environ 9: 751–759
Franks PJ, Farquhar GD (2007) The mechanical diversity of stomata and itssignificance in gas-exchange control. Plant Physiol 143: 78–87
Gillon JS, Yakir D (2000) Naturally low carbonic anhydrase activity in C4and C3 plants limits discrimination against C18OO during photosyn-thesis. Plant Cell Environ 23: 903–915
Kenzo T, Ichie T, Watanabe Y, Hiromi T (2007) Ecological distribution ofhomobaric and heterobaric leaves in tree species of Malaysian lowlandtropical rainforest. Am J Bot 94: 764–775
Kittel C, Kroemer H (1980) Thermal Physics. Freeman, New YorkKnipling EB (1970) Physical and physiological basis for the reflectance of
visible and near-infrared radiation from vegetation. Remote Sens Envi-ron 1: 155–159
Kramer PJ, Boyer JS (1995) Water Relations of Plants and Soils. AcademicPress, San Diego
Lambers H, Chapins FS, Pons TL (1998) Plant Physiological Ecology.Springer, New York
Meidner H (1976) Water vapour loss from a physical model of a sub-stomatal cavity. J Exp Bot 27: 691–694
Molz FJ, Ferrier JM (1982) Mathematical treatment of water movement inplant cells and tissues: a review. Plant Cell Environ 5: 191–206
Mott KA (2007) Leaf hydraulic conductivity and stomatal responses tohumidity in amphistomatous leaves. Plant Cell Environ 30: 1444–1449
Nobel PS (2005) Physicochemical and Environmental Plant Physiology.Elsevier Academic Press, Burlington, MA
Peak D, Mott KA (2011) A new, vapour-phase mechanism for stomatalresponses to humidity and temperature. Plant Cell Environ 34: 162–178
Pesacreta TC, Hasenstein KH (1999) The internal cuticle of Cirsium hor-ridulum (Asteraceae) leaves. Am J Bot 86: 923–928
Philip JR (1966) Plant water relations: some physical aspects. Annu RevPlant Physiol 17: 245–268
Philip JR, DeVries DA (1957) Moisture movement in porous materialsunder temperature gradients. Trans Am Geophys Union 38: 222–232
Pickard WF (1981) The ascent of sap in plants. Prog Biophys Mol Biol 37:181–229
Pickard WF (1982) Why is the substomatal chamber as large as it is? PlantPhysiol 69: 971–974
Pieruschka R, Huber G, Berry JA (2010) Control of transpiration by radi-ation. Proc Natl Acad Sci USA 107: 13372–13377
Raupach MR (2001) Combination theory and equilibrium evaporation. Q JR Meteorol Soc 127: 1149–1181
Rockwell FE (2010) Leaf water transport. PhD thesis. Harvard University,Cambridge, MA
Rockwell FE, Holbrook NM, Stroock AD (2014a) Leaf hydraulics. I. Scalingtransport properties from single cells to tissues. J Theor Biol 340: 251–266
Rockwell FE, Holbrook NM, Stroock AD (2014b) Leaf hydraulics. II.Vascularized tissues. J Theor Biol 340: 267–284
Rockwell FE, Holbrook NM, Zwieniecki MA (2011) Hydraulic conduc-tivity of red oak (Quercus rubra L.) leaf tissue does not respond to light.Plant Cell Environ 34: 565–579
Sack L, Melcher PJ, Zwieniecki MA, Holbrook NM (2002) The hydraulicconductance of the angiosperm leaf lamina: a comparison of threemeasurement methods. J Exp Bot 53: 2177–2184
Song X, Barbour MM, Farquhar GD, Vann DR, Helliker BR (2013)Transpiration rate relates to within- and across-species variations ineffective path length in a leaf water model of oxygen isotope enrich-ment. Plant Cell Environ 36: 1338–1351
Tanton TW, Crowdy SH (1972) Water pathways in higher plants. III. Thetranspiration stream within leaves. J Exp Bot 23: 619–625
Tyree MT, Yianoulis P (1980) The site of water evaporation from sub-stomatal cavities, liquid path resistances, and hydroactive stomatalclosure. Ann Bot (Lond) 46: 175–193
Vogel S (1983) The lateral thermal conductivity of leaves. Can J Bot 62:741–744
Vogelmann TC, Evans JR (2002) Profiles of light absorption and chloro-phyll within spinach leaves from chlorophyll fluorescence. Plant CellEnviron 25: 1313–1323
Whitaker S (1977) Simultaneous heat, mass, and momentum transfer inporous media: a theory of drying. In JP Hartnett, TF Irvine, eds, Ad-vances in Heat Transfer, Vol 13. Academic Press, New York, pp 119–203
Williams M, Rastetter EB, Fernandes DN, Goulden ML, Wofsy SC,Shaver GR, Melillo JM, Munger JW, Fan SM, Nadelhoffer KJ (1996)Modeling the soil-plant-atmosphere continuum in a Quercus-Acer standat Harvard Forest: the regulation of stomatal conductance by light, ni-trogen and soil/plant hydraulic properties. Plant Cell Environ 19:911–927
Wylie RB (1952) The bundle sheath extension in leaves of dicotyledons. AmJ Bot 39: 645–651
Yianoulis P, Tyree MT (1984) A model to investigate the effect of evapo-rative cooling on the pattern of evaporation in sub-stomatal cavities.Ann Bot (Lond) 53: 189–206
1758 Plant Physiol. Vol. 164, 2014
Rockwell et al.


![Liquid-Vapor Separation Efficiency [envp0102].doc](https://img.pdfslide.us/doc/110x75/577cc4171a28aba711981830/liquid-vapor-separation-efficiency-envp0102doc.jpg)