Embed Size (px)
Citation preview

The Compelling Display of Health & Safety
Information to Achieve
Desired Decision Making
Robert Emery, DrPH, CHP, CIH, CSP, RBP, CHMM, CPP, ARMAssistant Vice President for Safety, Health, Environment & Risk Management
The University of Texas Health Science Center at HoustonAssociate Professor of Occupational Health
The University of Texas School of Public Health
Why Training on Data Presentation ?
• An interesting dilemma:
– EH&S programs thrive on data
– Virtually every important EH&S decision is based on data to some extent
– Formal training in the area of compelling data presentations is rare for EH&S professionals
– The ability to compellingly display data is the key to desired decision making
Why Training on Data Presentation (cont.)?
• The EH&S profession is awash in bad examples of data presentations!
• We’ve all endured them at some point in our careers!
• Commentary: This may be the reason for repeated encounters with upper management who do not understand what their EH&S programs do.
Evolution of EH&S Measures and Metrics
• First step: – ultimate outcomes – OSHA 300 log,
inspection non-compliance
• Second step: – EH&S activities prior to first order events –
injuries and non-compliance
Evolution of EH&S Measures and Metrics (cont.)
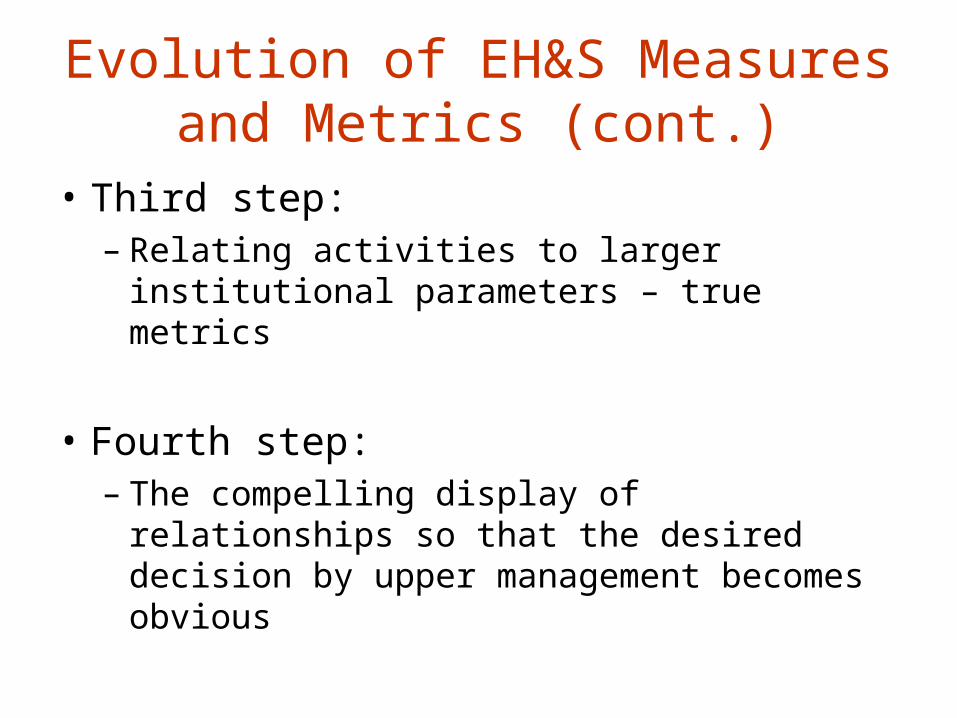
• Third step: – Relating activities to larger institutional
parameters – true metrics
• Fourth step: – The compelling display of relationships so that
the desired decision by upper management becomes obvious

Achieving EH&S Data Display Excellence
• The presentation of complex ideas and concepts in ways that are– Clear– Precise– Efficient
• How do we go about achieving this?
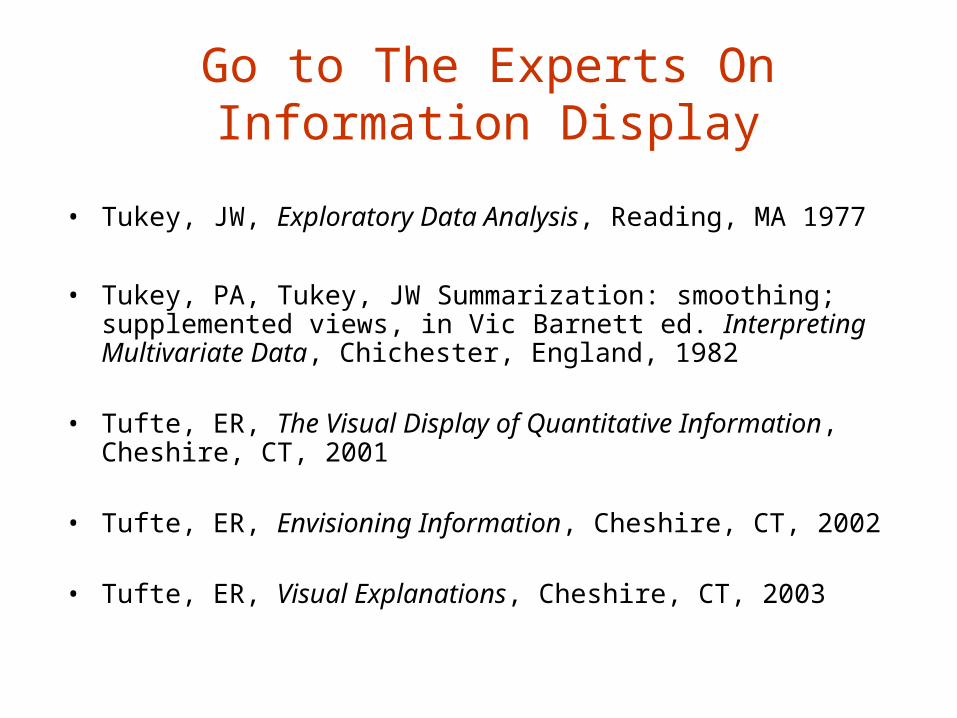
Go to The Experts On Information Display
• Tukey, JW, Exploratory Data Analysis, Reading, MA 1977
• Tukey, PA, Tukey, JW Summarization: smoothing; supplemented views, in Vic Barnett ed. Interpreting Multivariate Data, Chichester, England, 1982
• Tufte, ER, The Visual Display of Quantitative Information, Cheshire, CT, 2001
• Tufte, ER, Envisioning Information, Cheshire, CT, 2002
• Tufte, ER, Visual Explanations, Cheshire, CT, 2003
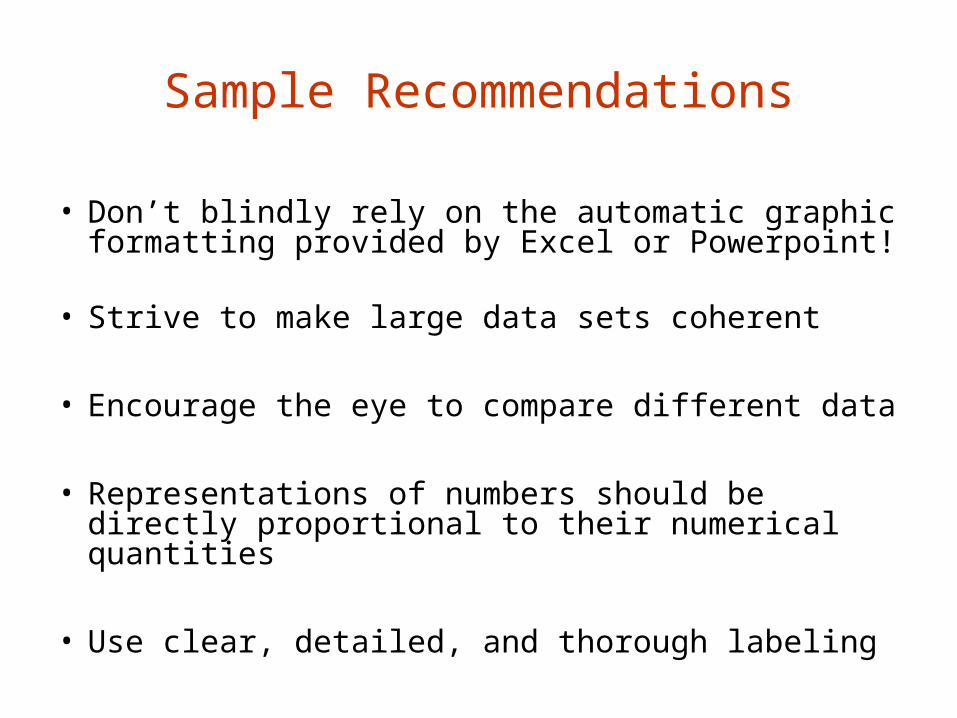
Sample Recommendations
• Don’t blindly rely on the automatic graphic formatting provided by Excel or Powerpoint!
• Strive to make large data sets coherent
• Encourage the eye to compare different data
• Representations of numbers should be directly proportional to their numerical quantities
• Use clear, detailed, and thorough labeling
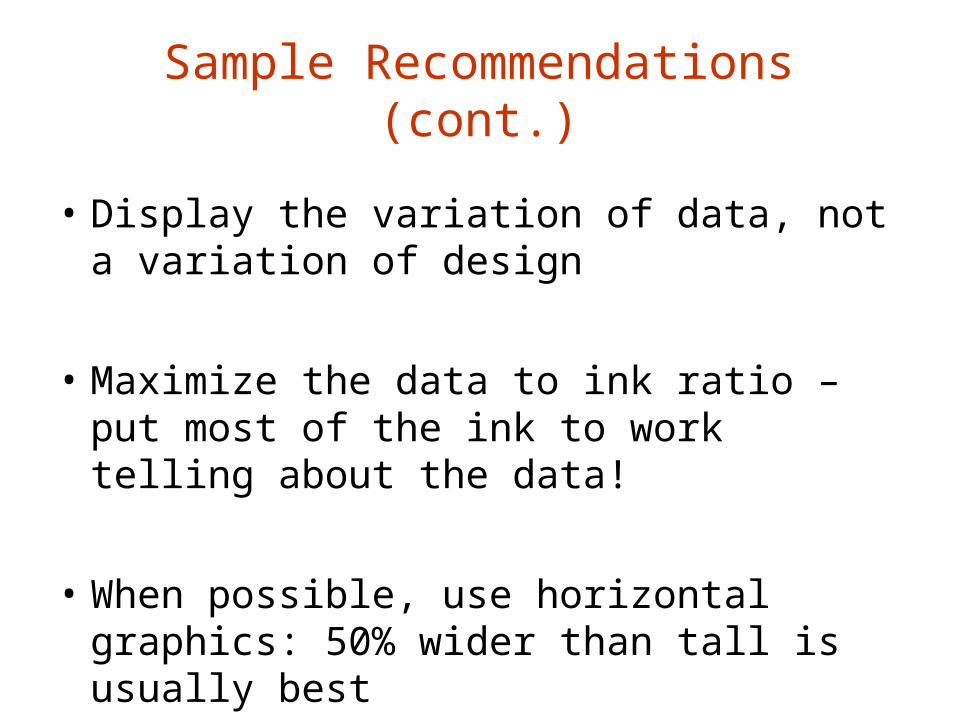
Sample Recommendations (cont.)
• Display the variation of data, not a variation of design
• Maximize the data to ink ratio – put most of the ink to work telling about the data!
• When possible, use horizontal graphics: 50% wider than tall is usually best
Compelling Remark by Tufte
• Visual reasoning occurs more effectively when relevant information is shown adjacent in the space within our eye-span
• This is especially true for statistical data where the fundamental analytical act is to make comparisons
• The key point: “compared to what?”
Four UTHSCH “Make Over” Examples
• Data we accumulated and displayed on:– Nuisance Fire Alarms– Workers compensation experience modifiers– First reports of injury– Corridor clearance
• But first, 2 quick notes:– The forum to be used:
• The “big screen” versus the “small screen”?• In what setting are most important decisions made?
– Like fashion, there are likely no right answers – individual tastes apply, but some universal rules will become apparent

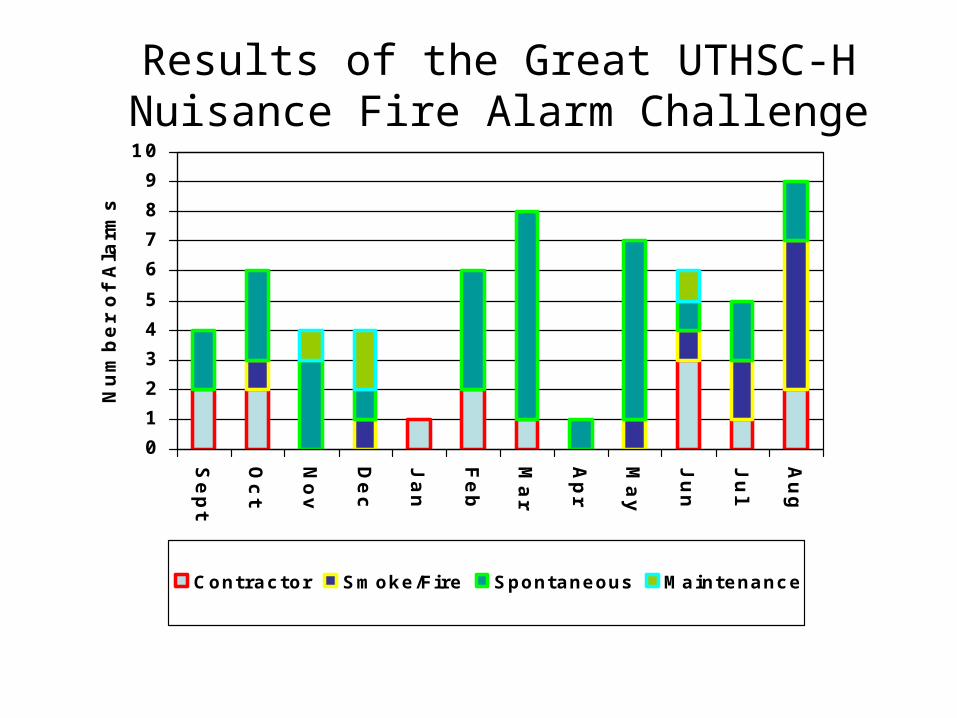
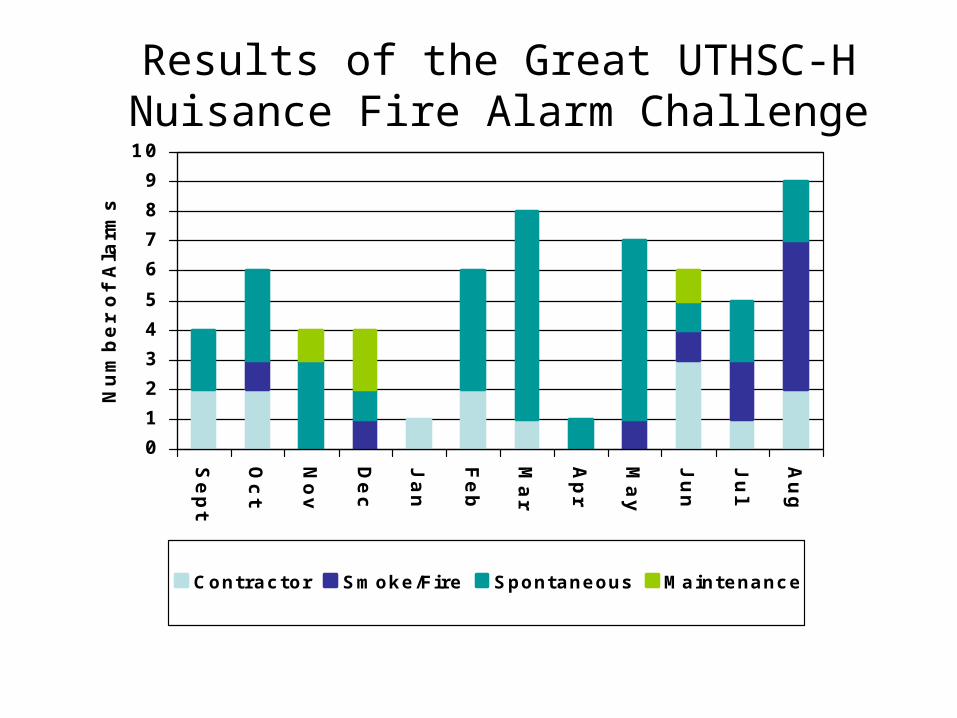
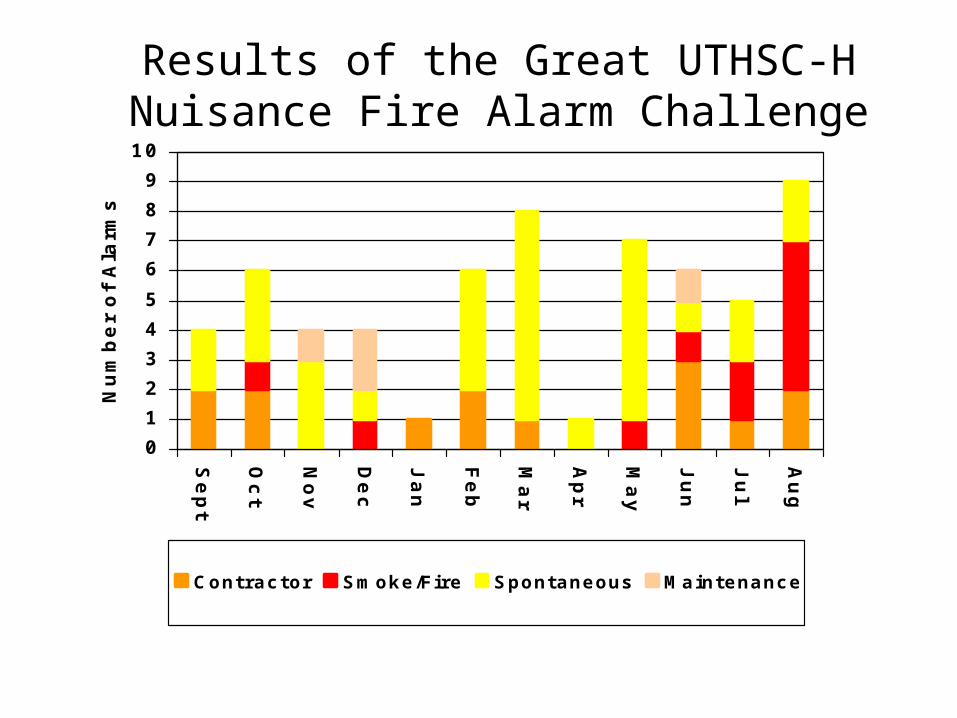
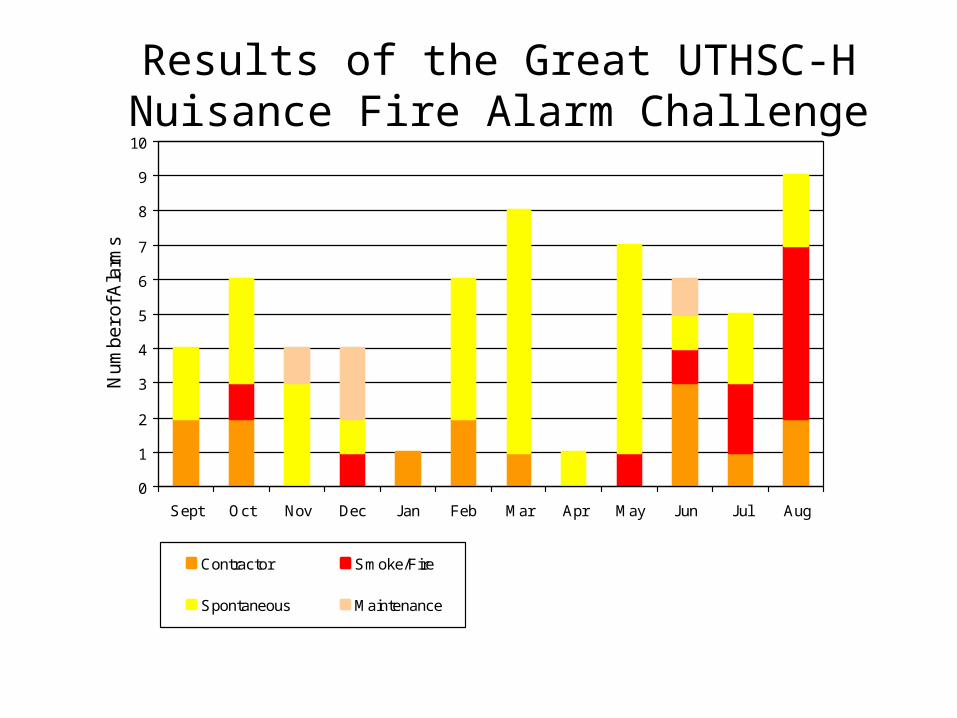
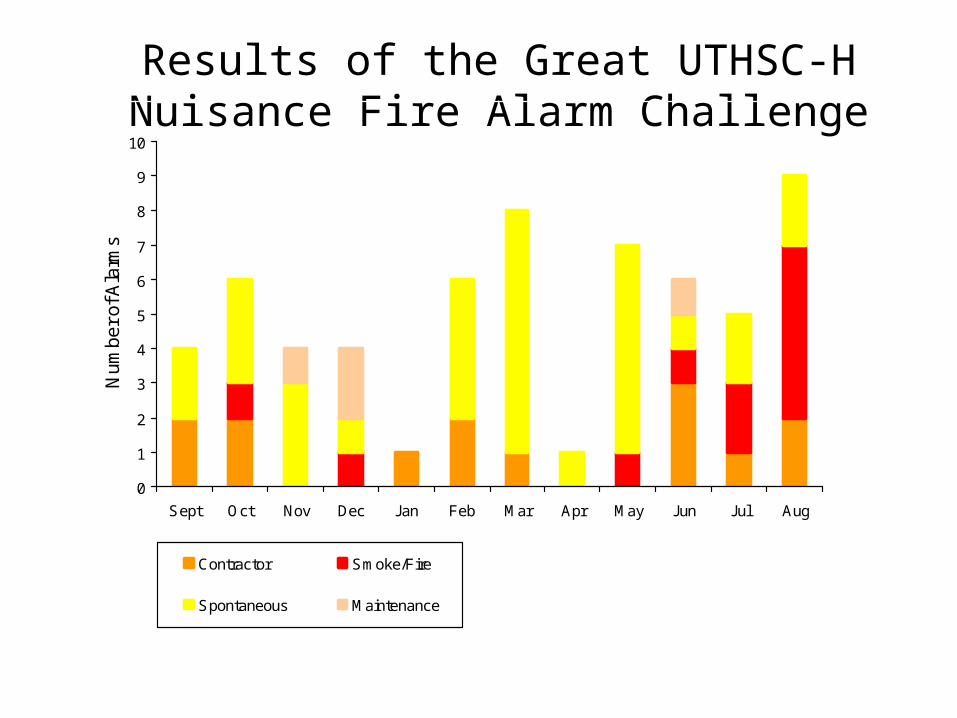
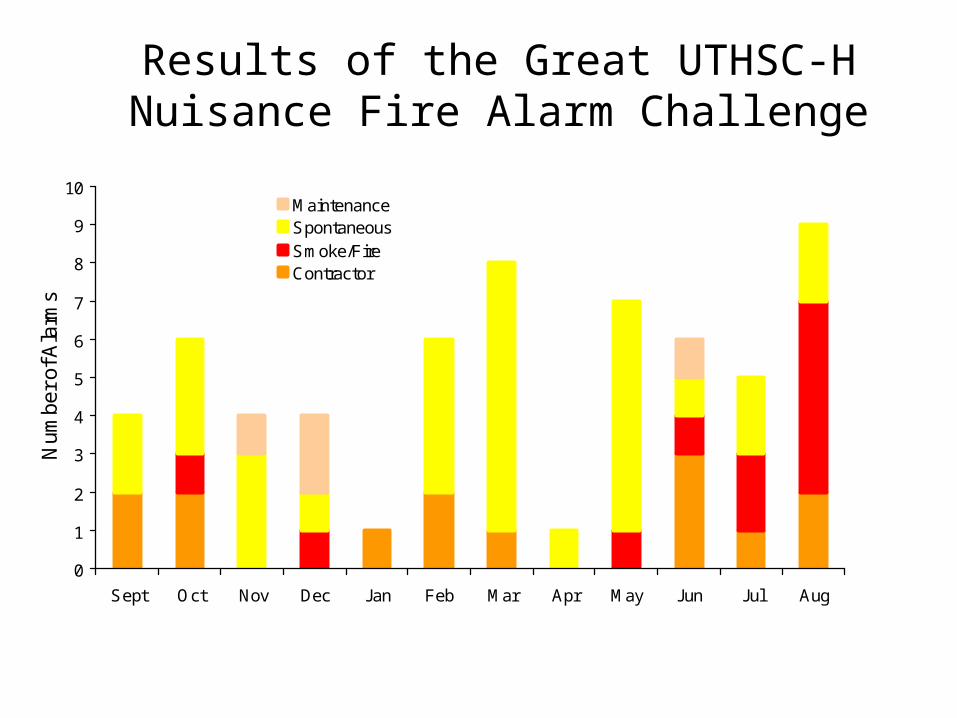
Results of the Great UTHSC-H Nuisance Fire Alarm Challenge
0
1
2
3
4
5
6
7
8
Se
pt
Oc
t
No
v
De
c
Ja
n
Fe
b
Ma
r
Ap
r
Ma
y
Ju
n
Ju
l
Au
g
Nu
mb
er
of
Ala
rms
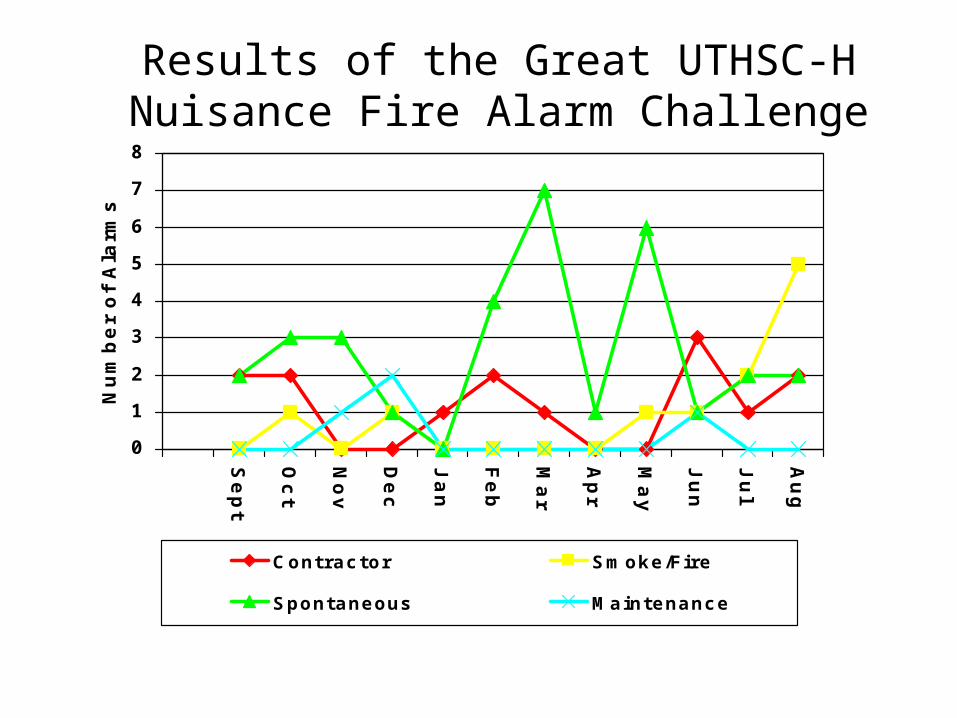
Contractor Smoke/Fire
Spontaneous Maintenance
Results of the Great UTHSC-H Nuisance Fire Alarm Challenge
0
1
2
3
4
5
6
7
8
9
10
Se
pt
Oc
t
No
v
De
c
Ja
n
Fe
b
Ma
r
Ap
r
Ma
y
Ju
n
Ju
l
Au
g
Nu
mb
er
of
Ala
rms
Contractor Smoke/Fire Spontaneous Maintenance
Results of the Great UTHSC-H Nuisance Fire Alarm Challenge
0
1
2
3
4
5
6
7
8
9
10
Se
pt
Oc
t
No
v
De
c
Ja
n
Fe
b
Ma
r
Ap
r
Ma
y
Ju
n
Ju
l
Au
g
Nu
mb
er
of
Ala
rms
Contractor Smoke/Fire Spontaneous Maintenance
Results of the Great UTHSC-H Nuisance Fire Alarm Challenge
0
1
2
3
4
5
6
7
8
9
10
Se
pt
Oc
t
No
v
De
c
Ja
n
Fe
b
Ma
r
Ap
r
Ma
y
Ju
n
Ju
l
Au
g
Nu
mb
er
of
Ala
rms
Contractor Smoke/Fire Spontaneous Maintenance
Results of the Great UTHSC-H Nuisance Fire Alarm Challenge
0
1
2
3
4
5
6
7
8
9
10
Sept Oct Nov Dec Jan Feb Mar Apr May Jun Jul Aug
Nu
mb
er
of A
larm
s
Contractor Smoke/Fire
Spontaneous Maintenance
Results of the Great UTHSC-H Nuisance Fire Alarm Challenge
0
1
2
3
4
5
6
7
8
9
10
Sept Oct Nov Dec Jan Feb Mar Apr May Jun Jul Aug
Nu
mb
er
of A
larm
s
Contractor Smoke/Fire
Spontaneous Maintenance
Results of the Great UTHSC-H Nuisance Fire Alarm Challenge
0
1
2
3
4
5
6
7
8
9
10
Sept Oct Nov Dec Jan Feb Mar Apr May Jun Jul Aug
Nu
mb
er
of A
larm
s
MaintenanceSpontaneousSmoke/FireContractor
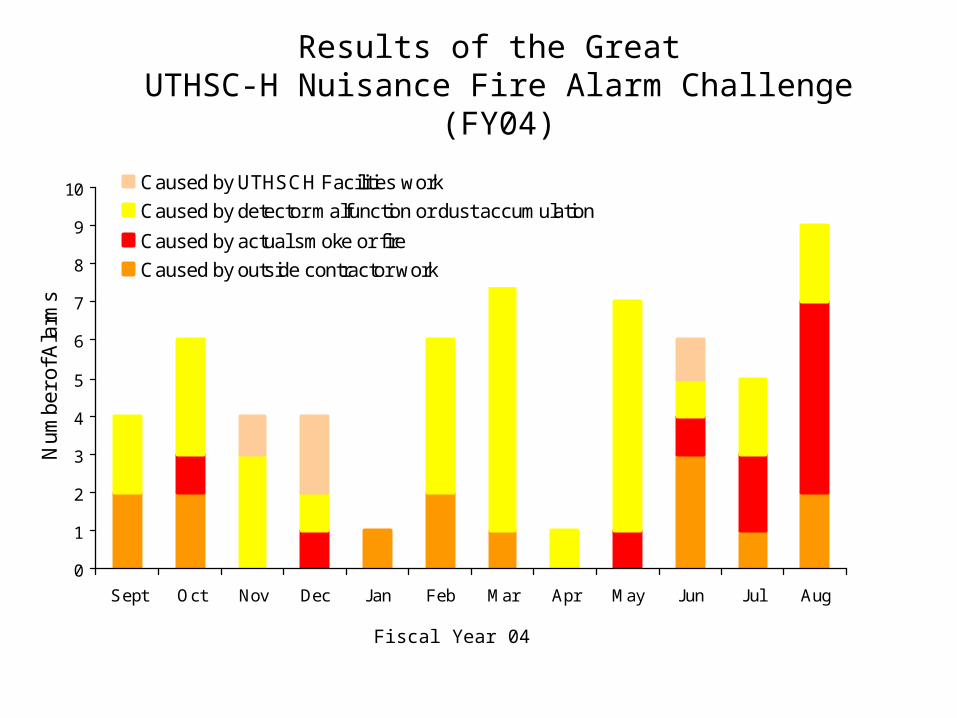
Results of the Great UTHSC-H Nuisance Fire Alarm Challenge (FY04)
0
1
2
3
4
5
6
7
8
9
10
Sept Oct Nov Dec Jan Feb Mar Apr May Jun Jul Aug
Nu
mb
er
of A
larm
s
Caused by UTHSCH Facilities work
Caused by detector malfunction or dust accumulation
Caused by actual smoke or fire
Caused by outside contractor work
Fiscal Year 04
Results of the Great UTHSC-H Nuisance Fire Alarm Challenge
0
1
2
3
4
5
6
7
8
Se
pt
Oc
t
No
v
De
c
Ja
n
Fe
b
Ma
r
Ap
r
Ma
y
Ju
n
Ju
l
Au
g
Nu
mb
er
of
Ala
rms
Contractor Smoke/Fire
Spontaneous Maintenance
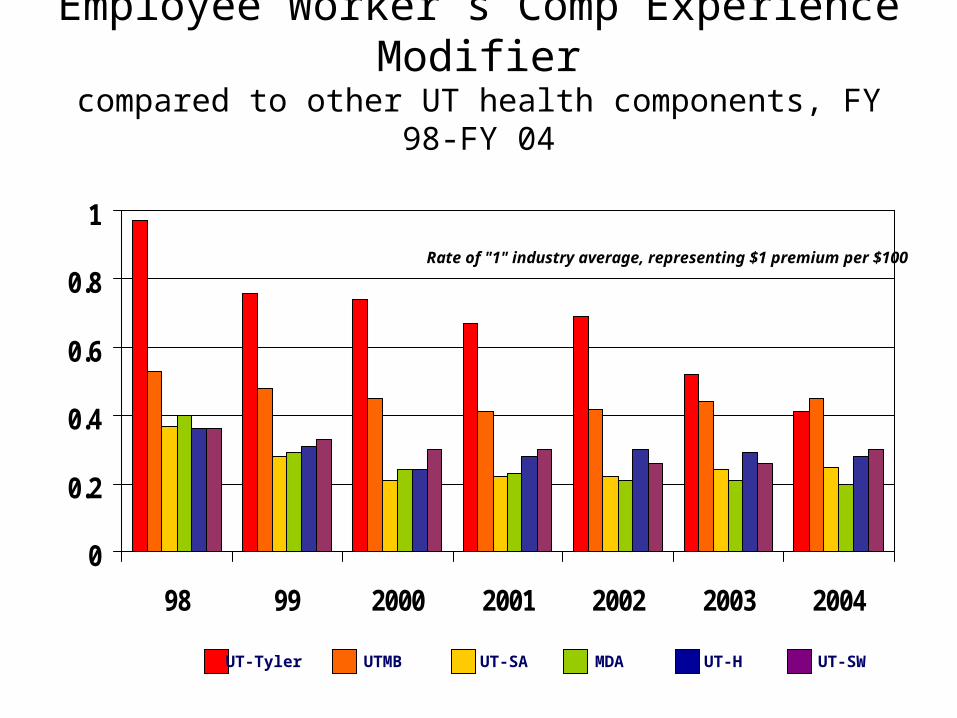
Employee Worker’s Comp Experience Modifier
compared to other UT health components, FY 98-FY 04
0
0.2
0.4
0.6
0.8
1
98 99 2000 2001 2002 2003 2004
UT-Tyler UTMB UT-SA MDA UT-H UT-SW
Rate of "1" industry average, representing $1 premium per $100
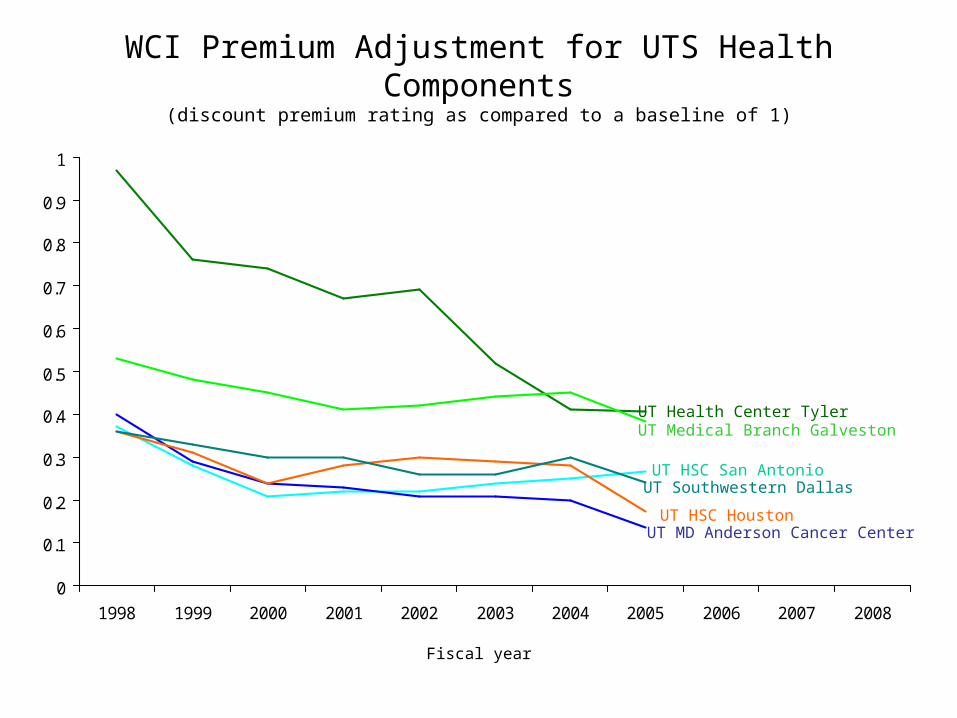
WCI Premium Adjustment for UTS Health Components(discount premium rating as compared to a baseline of 1)
0
0.1
0.2
0.3
0.4
0.5
0.6
0.7
0.8
0.9
1
1998 1999 2000 2001 2002 2003 2004 2005 2006 2007 2008
Fiscal year
UT Health Center TylerUT Medical Branch Galveston
UT HSC San AntonioUT Southwestern Dallas
UT HSC HoustonUT MD Anderson Cancer Center

Losses – PersonnelReported Injuries by Population
0
200
400
600
800
98 99 00 01 02 03 04
Employee Resident Student
690 694 715 675623 608 511
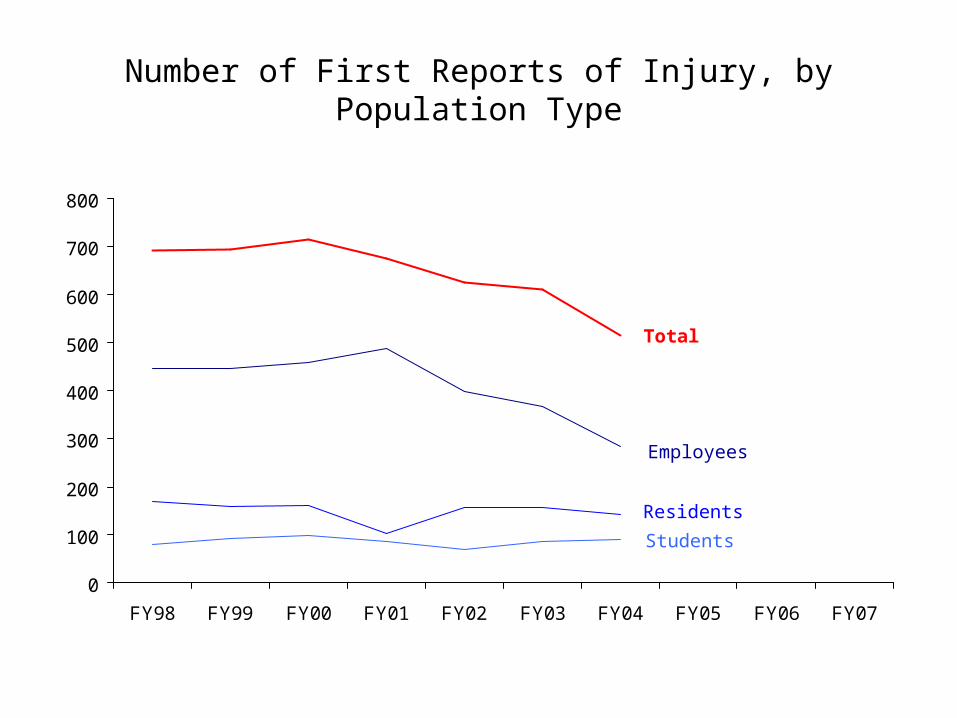
Number of First Reports of Injury, by Population Type
0
100
200
300
400
500
600
700
800
FY98 FY99 FY00 FY01 FY02 FY03 FY04 FY05 FY06 FY07
Total
Employees
Residents
Students
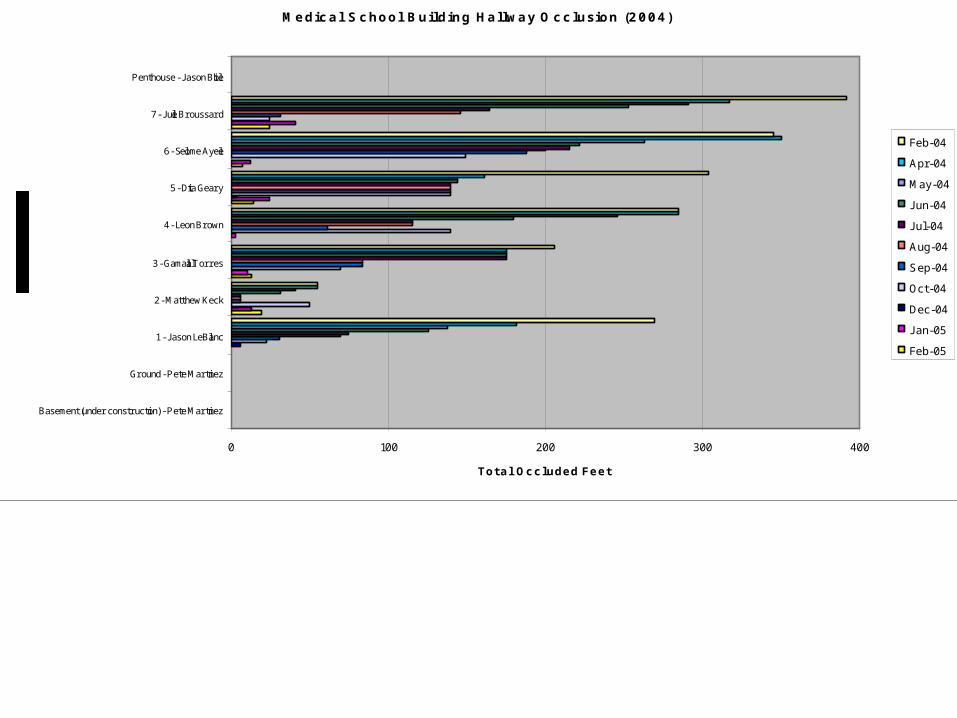
Medical School Building Hallway Occ lusion (2004)
0 100 200 300 400
Basement (under construction) - Pete Martinez
Ground - Pete Martinez
1 - J ason LeBlanc
2 - Matthew Keck
3 - Gamalial Torres
4 - Leon Brown
5 - Dita Geary
6 - Selome Ayele
7 - J ulie Broussard
Penthouse - J ason Bible
Total Occluded Feet
Feb-04
Apr-04
May-04
J un-04
J ul-04
Aug-04
Sep-04
Oct-04
Dec-04
J an-05
Feb-05
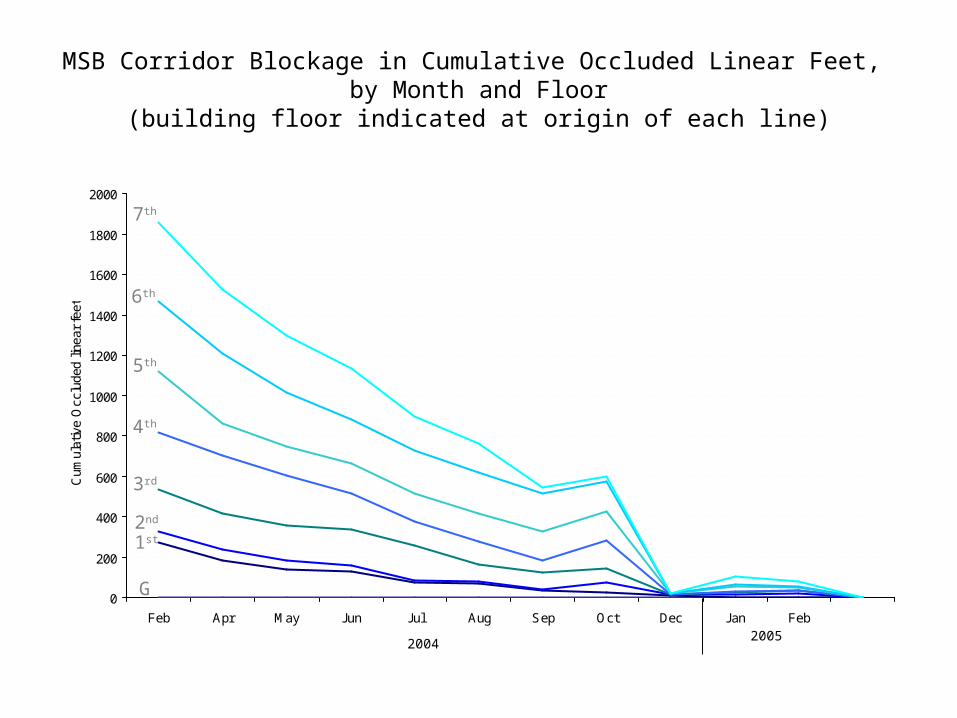
MSB Corridor Blockage in Cumulative Occluded Linear Feet, by Month and Floor
(building floor indicated at origin of each line)
0
200
400
600
800
1000
1200
1400
1600
1800
2000
Feb Apr May Jun Jul Aug Sep Oct Dec Jan Feb
Cum
ulat
ive
Occ
lude
d lin
ear
feet
20042005
7th
6th
5th
4th
3rd
2nd
1st
G

Important Caveats• Although the techniques displayed here are
powerful, there are some downsides to this approach– Time involved to create assemble data and create non-
standard graphs may not mesh with work demands– Relentless tinkering and artistic judgment
• Suggested sources for regular observations to develop an intuitive feel for the process– Suggested consistent source of good examples:
• Wall Street Journal
– Suggested consistent source of not-so-good examples: • USA Today “char-toons”
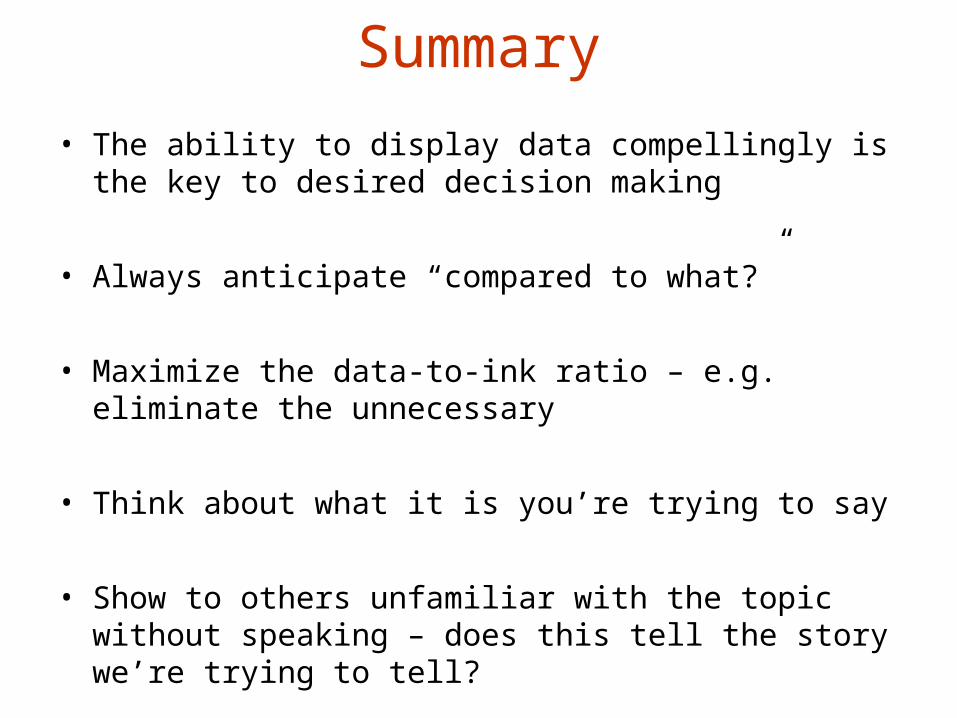
Summary
• The ability to display data compellingly is the key to desired decision making
• Always anticipate “compared to what?”
• Maximize the data-to-ink ratio – e.g. eliminate the unnecessary
• Think about what it is you’re trying to say
• Show to others unfamiliar with the topic without speaking – does this tell the story we’re trying to tell?
Your Questions at This Point?
Now Let’s Look at Some Other Examples
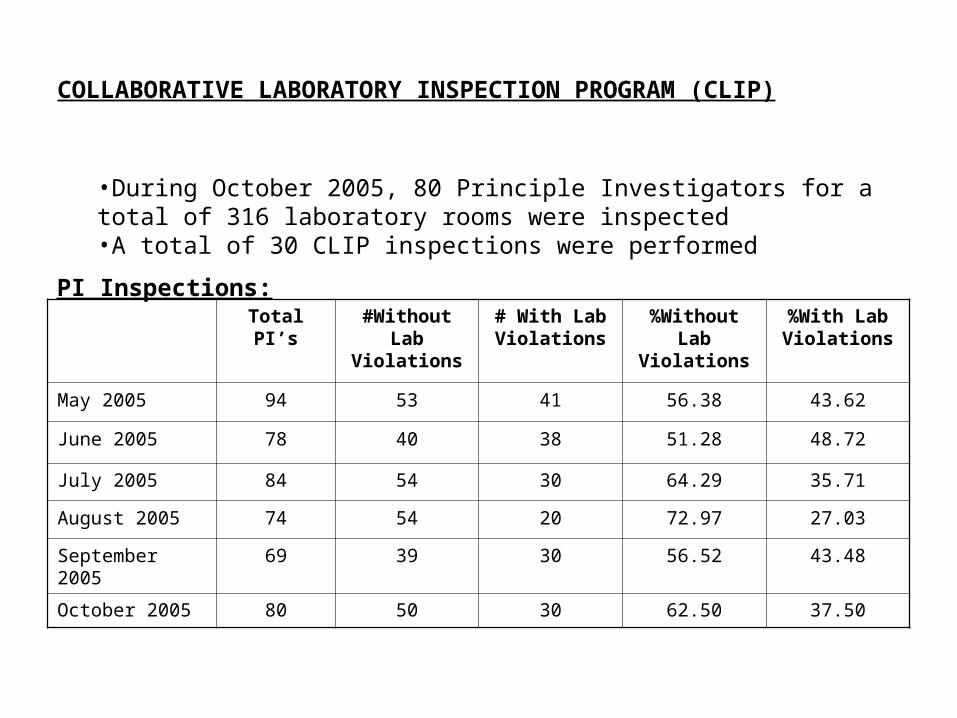
COLLABORATIVE LABORATORY INSPECTION PROGRAM (CLIP)
Total PI’s #Without Lab Violations
# With Lab Violations
%Without Lab Violations
%With Lab Violations
May 2005 94 53 41 56.38 43.62
June 2005 78 40 38 51.28 48.72
July 2005 84 54 30 64.29 35.71
August 2005 74 54 20 72.97 27.03
September 2005 69 39 30 56.52 43.48
October 2005 80 50 30 62.50 37.50
•During October 2005, 80 Principle Investigators for a total of 316 laboratory rooms were inspected•A total of 30 CLIP inspections were performed
PI Inspections:
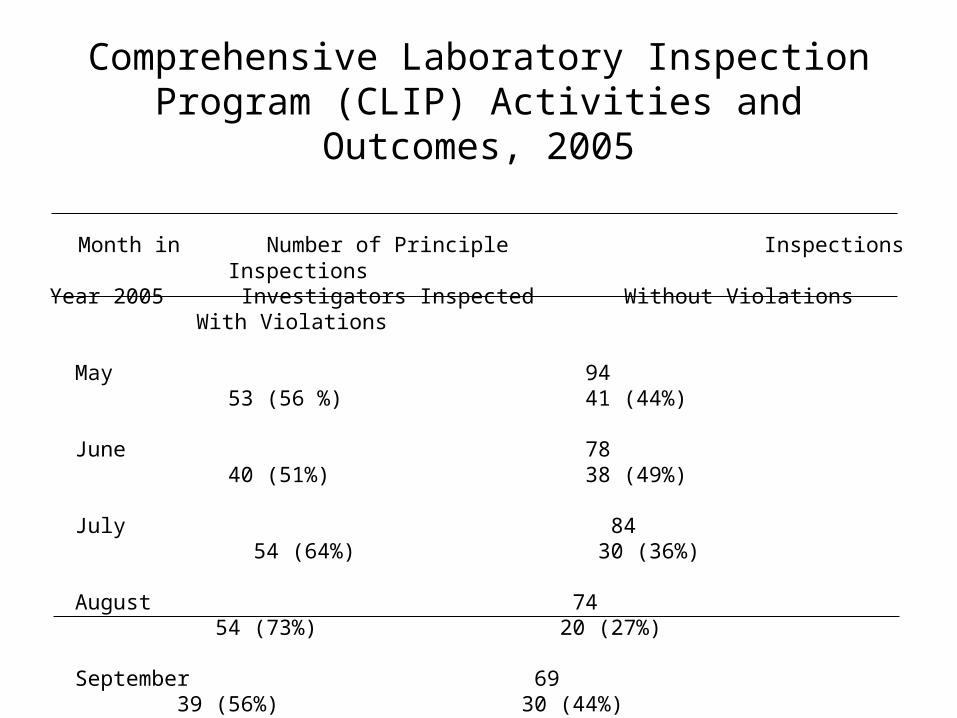
Comprehensive Laboratory Inspection Program (CLIP) Activities and Outcomes, 2005
Month in Number of Principle Inspections InspectionsYear 2005 Investigators Inspected Without Violations With Violations
May 94 53 (56 %) 41 (44%)
June 78 40 (51%) 38 (49%)
July 84 54 (64%) 30 (36%)
August 74 54 (73%) 20 (27%)
September 69 39 (56%) 30 (44%)
October 80 50 (62%) 30 (38%)
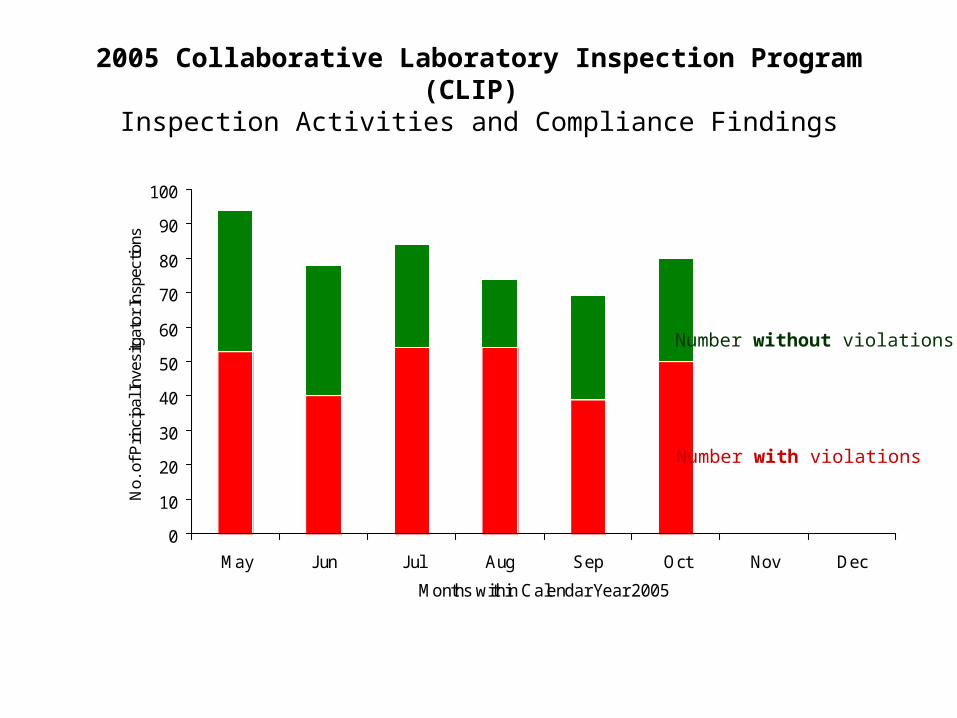
2005 Collaborative Laboratory Inspection Program (CLIP) Inspection Activities and Compliance Findings
0
10
20
30
40
50
60
70
80
90
100
May Jun Jul Aug Sep Oct Nov Dec
Months within Calendar Year 2005
No.
of P
rinci
pal I
nves
itgat
or In
spec
tions
Number without violations
Number with violations

2005 Collaborative Laboratory Inspection Program (CLIP) Inspection Activities and Compliance Findings
0
10
20
30
40
50
60
70
80
90
100
May Jun Jul Aug Sep Oct Nov Dec
Months within Calendar Year 2005
No.
of P
rinci
pal I
nves
itgat
or In
spec
tions
Number without violations
Number with violations
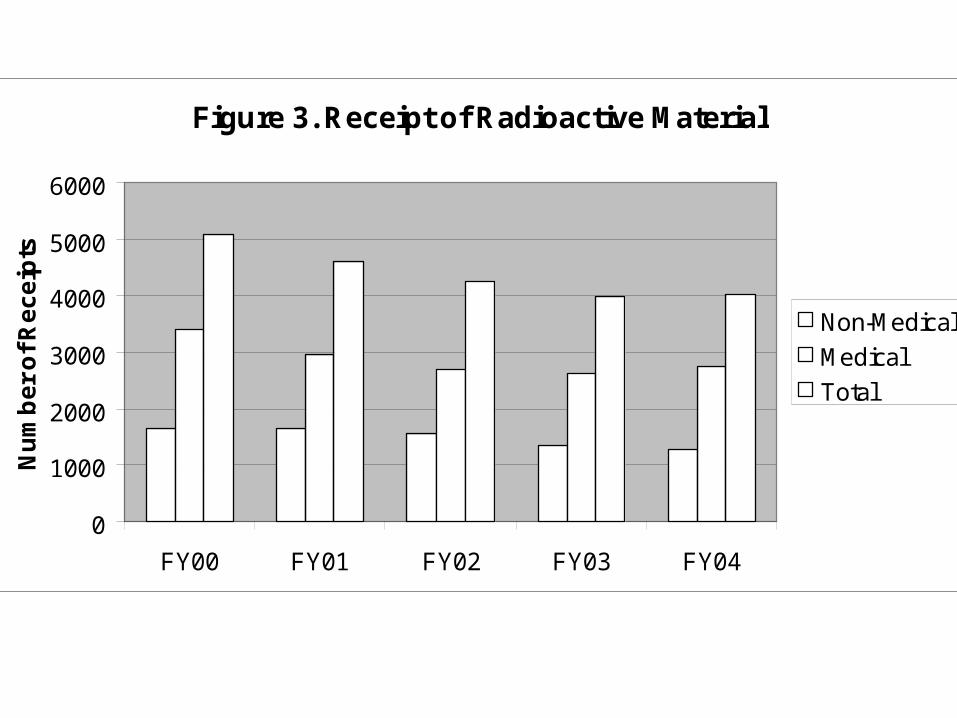
Figure 3. Receipt of Radioactive Material
0
1000
2000
3000
4000
5000
6000
FY00 FY01 FY02 FY03 FY04
Nu
mb
er
of
Re
ce
ipts
Non-Medical
Medical
Total
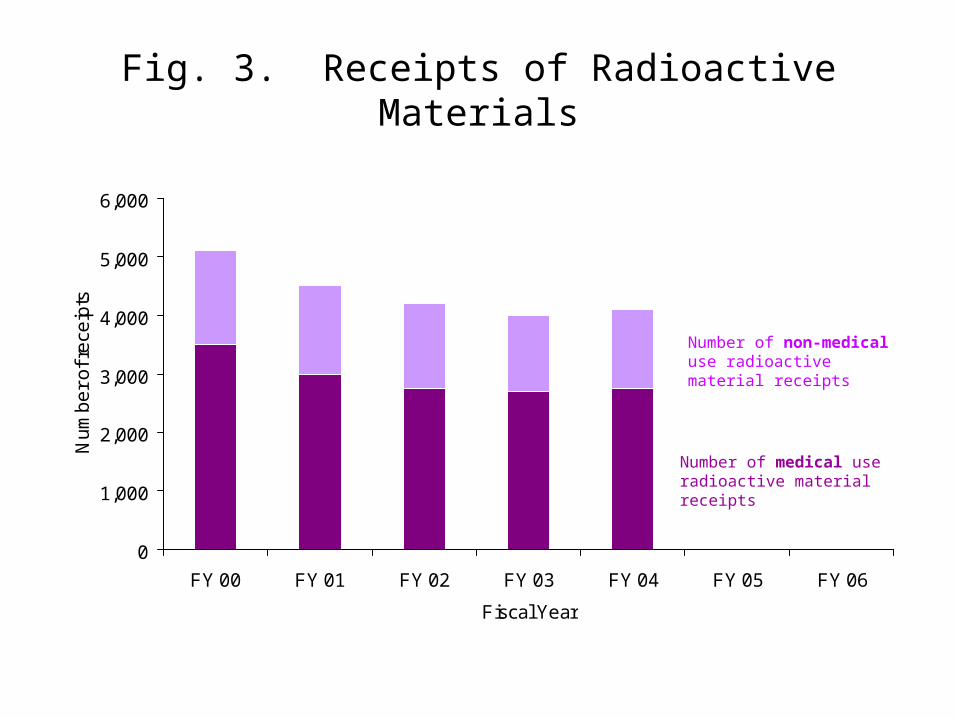
Fig. 3. Receipts of Radioactive Materials
0
1,000
2,000
3,000
4,000
5,000
6,000
FY 00 FY 01 FY 02 FY 03 FY 04 FY 05 FY 06
Fiscal Year
Nu
mb
er
of r
ece
ipts
Number of medical use radioactive material receipts
Number of non-medical use radioactive material receipts
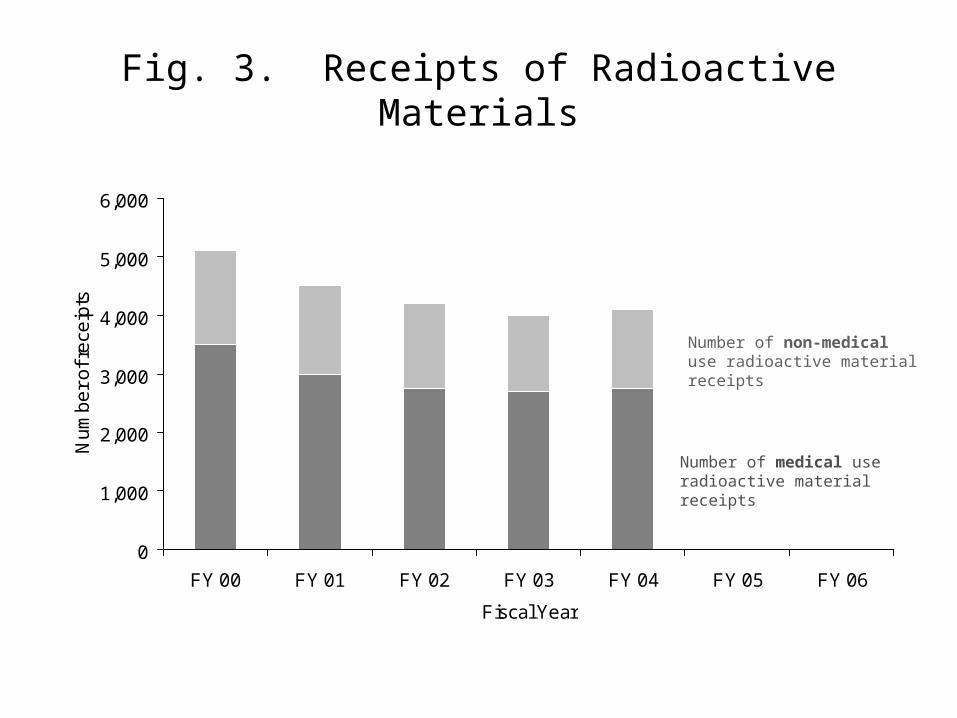
Fig. 3. Receipts of Radioactive Materials
0
1,000
2,000
3,000
4,000
5,000
6,000
FY 00 FY 01 FY 02 FY 03 FY 04 FY 05 FY 06
Fiscal Year
Nu
mb
er
of r
ece
ipts
Number of medical use radioactive material receipts
Number of non-medical use radioactive material receipts
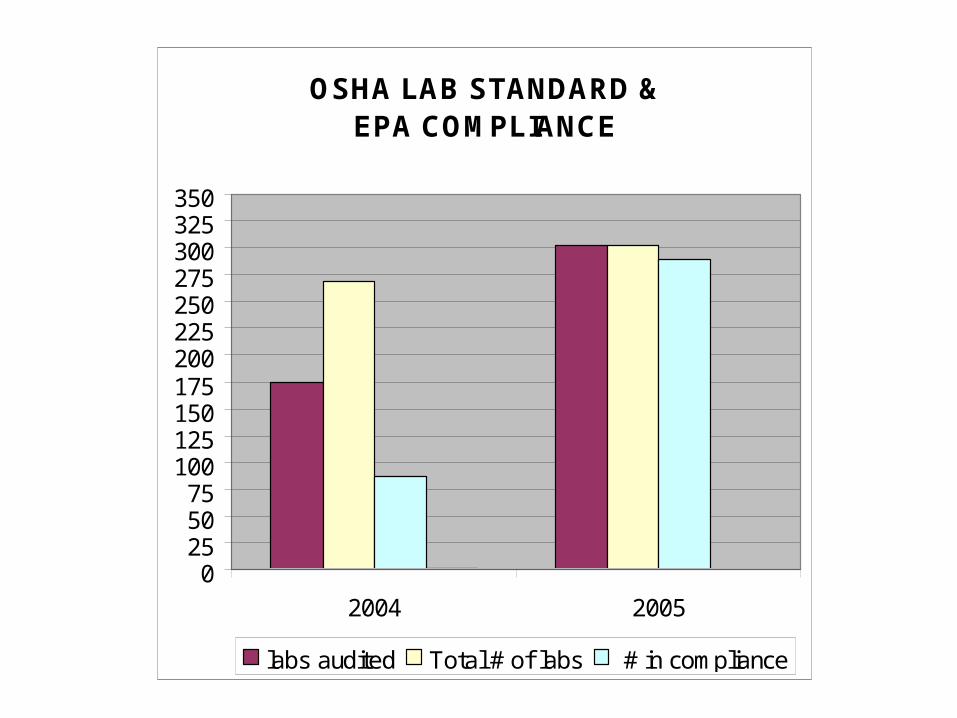
OSHA LAB STANDARD & EPA COMPLIANCE
0255075
100125150175200225250275300325350
2004 2005
labs audited Total # of labs # in compliance

Results of University EH&S Lab Inspection Program, 2003 to 2005
0
50
100
150
200
250
300
350
2003 2004 2005 2006 2007
Calendar Year
Num
ber o
f Lab
s
Number of labs inspected and no violations detected
Number of labs inspected and one or more violation detected
Number of labs existing but not inspected
Note: 33 labs added to campus in 2005, increasing total from
269 to 302.
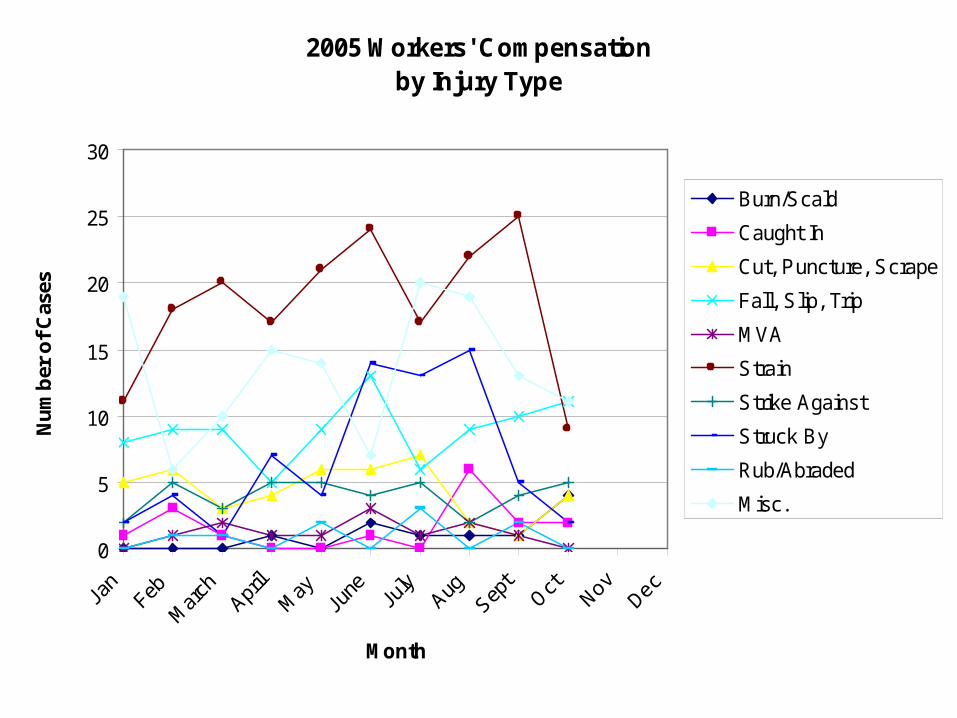
2005 Workers' Compensation by Injury Type
0
5
10
15
20
25
30
Month
Nu
mb
er o
f C
ases
Burn/Scald
Caught In
Cut, Puncture, Scrape
Fall, Slip, Trip
MVA
Strain
Strike Against
Struck By
Rub/Abraded
Misc.
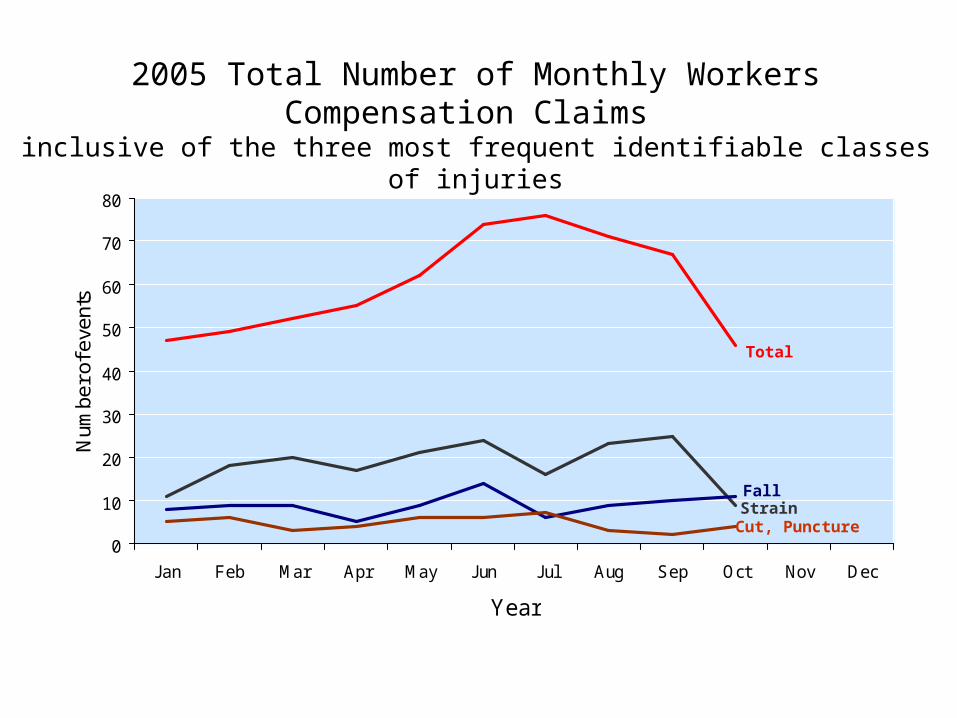
2005 Total Number of Monthly Workers Compensation Claims inclusive of the three most frequent identifiable classes of injuries
0
10
20
30
40
50
60
70
80
Jan Feb Mar Apr May Jun Jul Aug Sep Oct Nov Dec
Year
Num
ber o
f eve
nts
Total
FallStrainCut, Puncture

Building Related Programs
-100
0
100
200
300
400
500
1986 1996 1998 2003
Years
Perc
en
t G
row
th
Fire Ext. Systems
Fire Extinguishers
Fire Related Incidents
Asbestos Projects
Fire Extinguisher Systems
Fire Extinguishers Fire Related Incidents
Asbestos Projects
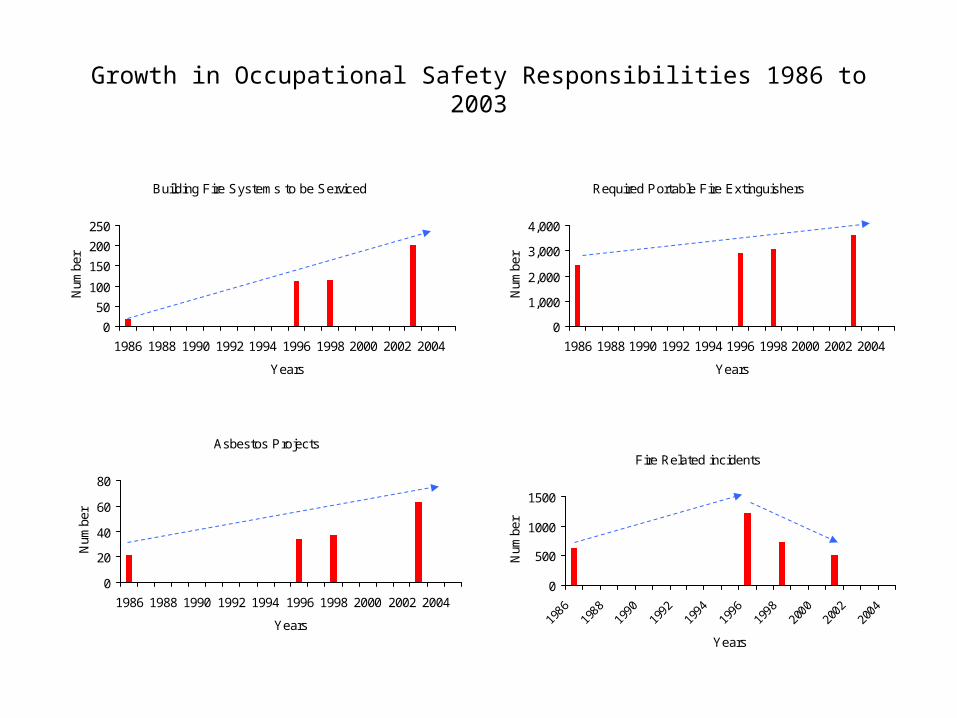
1986 0 0 0 0
1996 203 19 91 55
1998 208 25 15 68
2003 437 46 -18 191

Growth in Occupational Safety Responsibilities 1986 to 2003
Building Fire Systems to be Serviced
0
50
100
150
200
250
1986 1988 1990 1992 1994 1996 1998 2000 2002 2004
Years
Num
ber
Required Portable Fire Extinguishers
0
1,000
2,000
3,000
4,000
1986 1988 1990 1992 1994 1996 1998 2000 2002 2004
Years
Num
ber
Fire Related incidents
0
500
1000
1500
1986
1988
1990
1992
1994
1996
1998
2000
2002
2004
Years
Num
ber
Asbestos Projects
0
20
40
60
80
1986 1988 1990 1992 1994 1996 1998 2000 2002 2004
Years
Num
ber
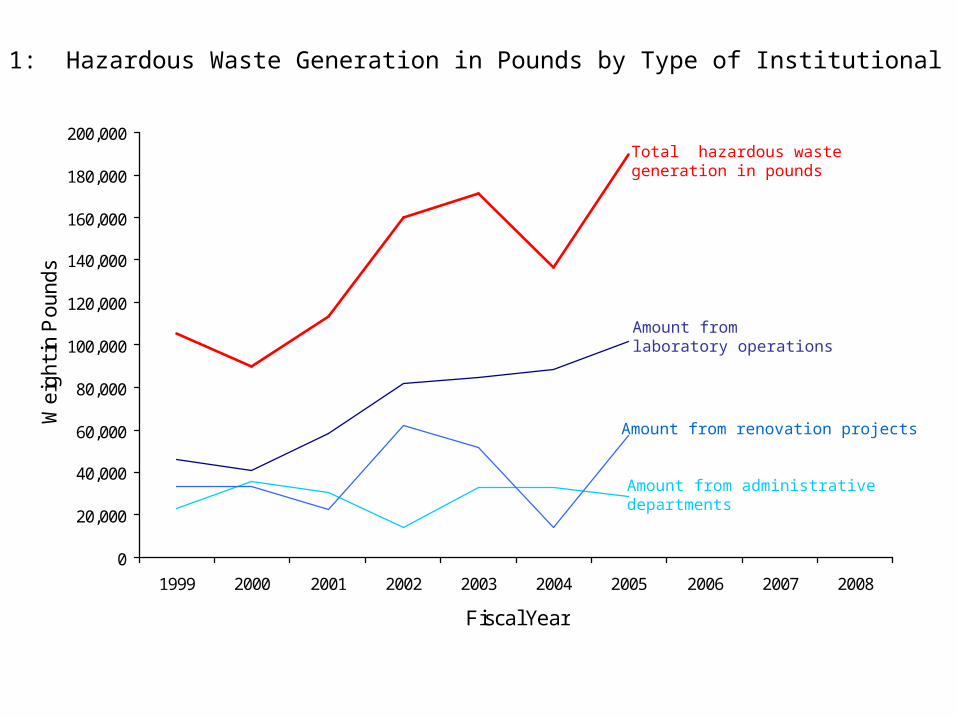
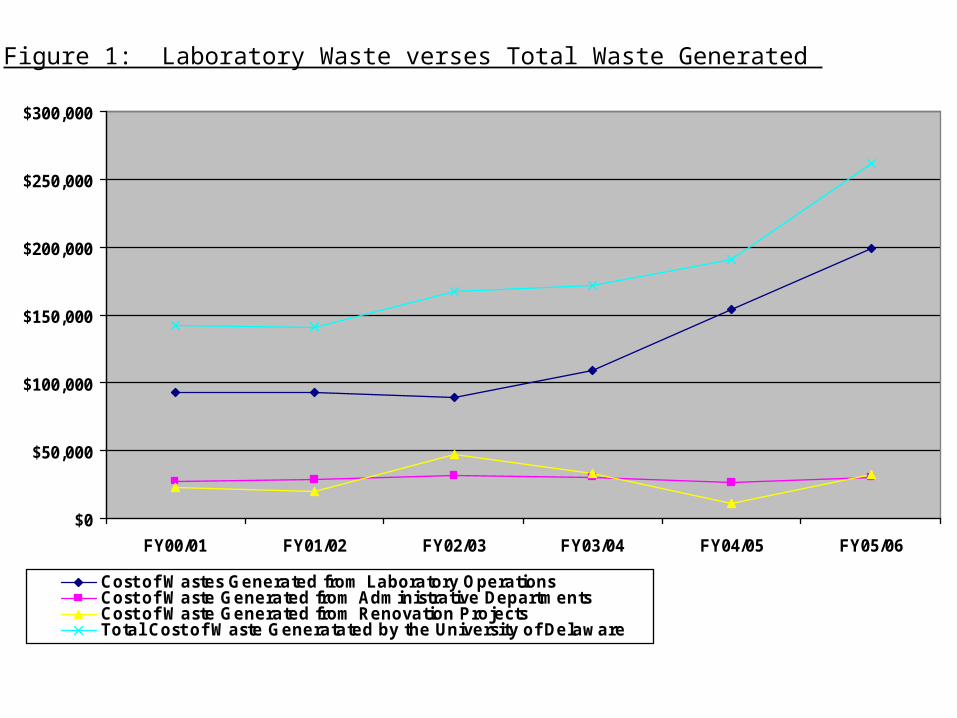
0
20,000
40,000
60,000
80,000
100,000
120,000
140,000
160,000
180,000
200,000
1999 2000 2001 2002 2003 2004 2005
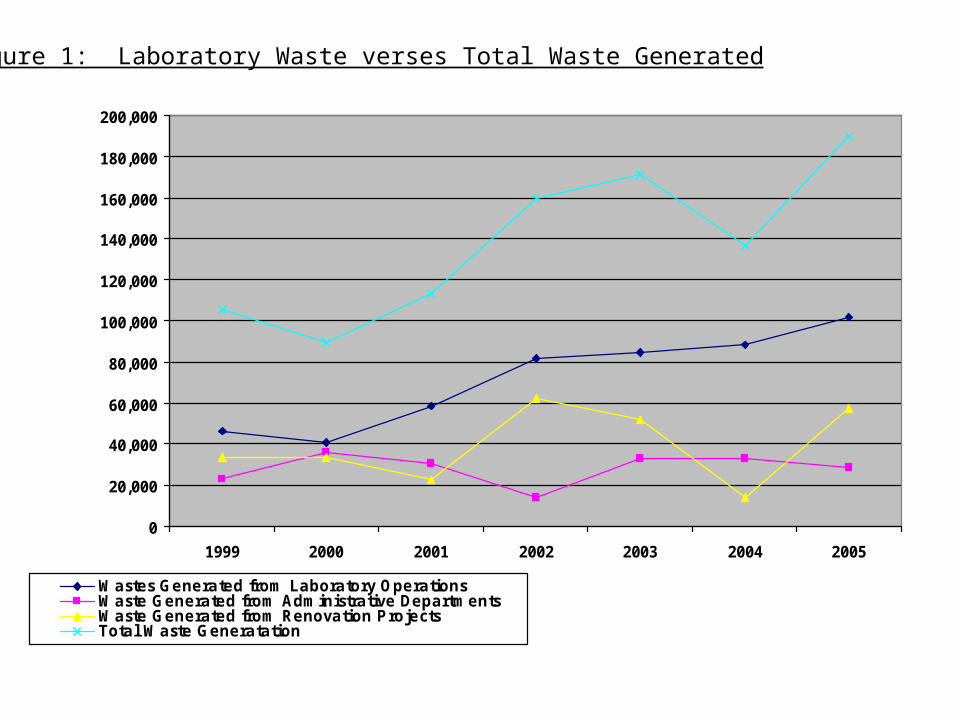
Wastes Generated from Laboratory OperationsWaste Generated from Administrative DepartmentsWaste Generated from Renovation ProjectsTotal Waste Generatation
Figure 1: Laboratory Waste verses Total Waste Generated
0
20,000
40,000
60,000
80,000
100,000
120,000
140,000
160,000
180,000
200,000
1999 2000 2001 2002 2003 2004 2005 2006 2007 2008
Fiscal Year
We
igh
t in
Po
un
ds
Amount from administrative departments
Amount from renovation projects
Total hazardous waste generation in pounds
Amount from laboratory operations
Figure 1: Hazardous Waste Generation in Pounds by Type of Institutional Activity
$0
$50,000
$100,000
$150,000
$200,000
$250,000
$300,000
FY00/01 FY01/02 FY02/03 FY03/04 FY04/05 FY05/06
Cost of Wastes Generated from Laboratory OperationsCost of Waste Generated from Administrative DepartmentsCost of Waste Generated from Renovation ProjectsTotal Cost of Waste Generatated by the University of Delaware
Figure 1: Laboratory Waste verses Total Waste Generated
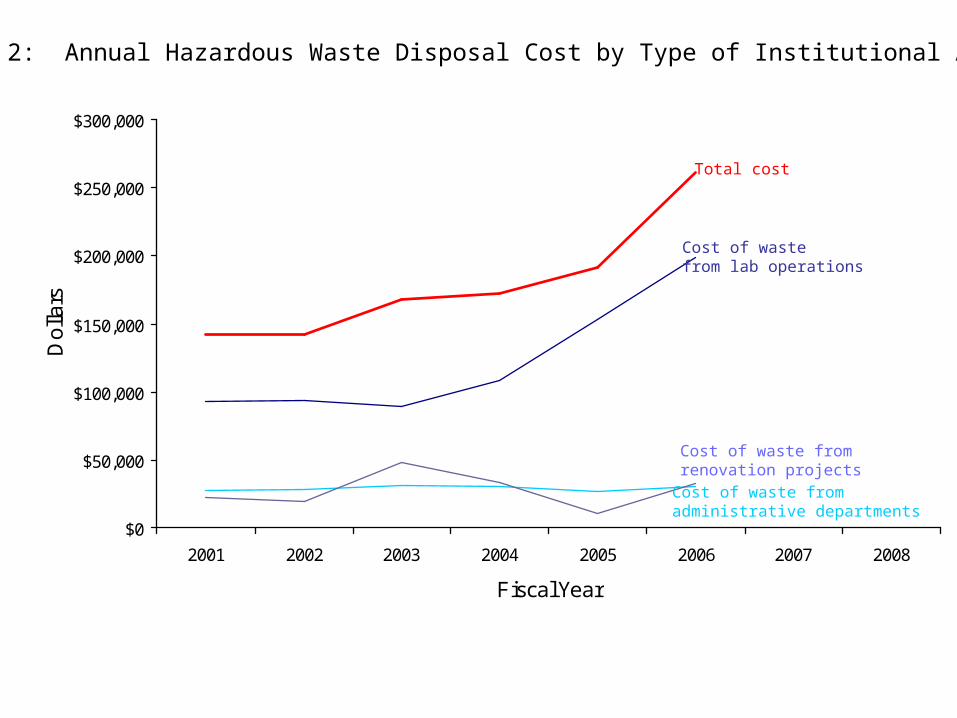
$0
$50,000
$100,000
$150,000
$200,000
$250,000
$300,000
2001 2002 2003 2004 2005 2006 2007 2008
Fiscal Year
Do
llars
Figure 2: Annual Hazardous Waste Disposal Cost by Type of Institutional Activity
Total cost
Cost of waste from lab operations
Cost of waste from administrative departments
Cost of waste from renovation projects
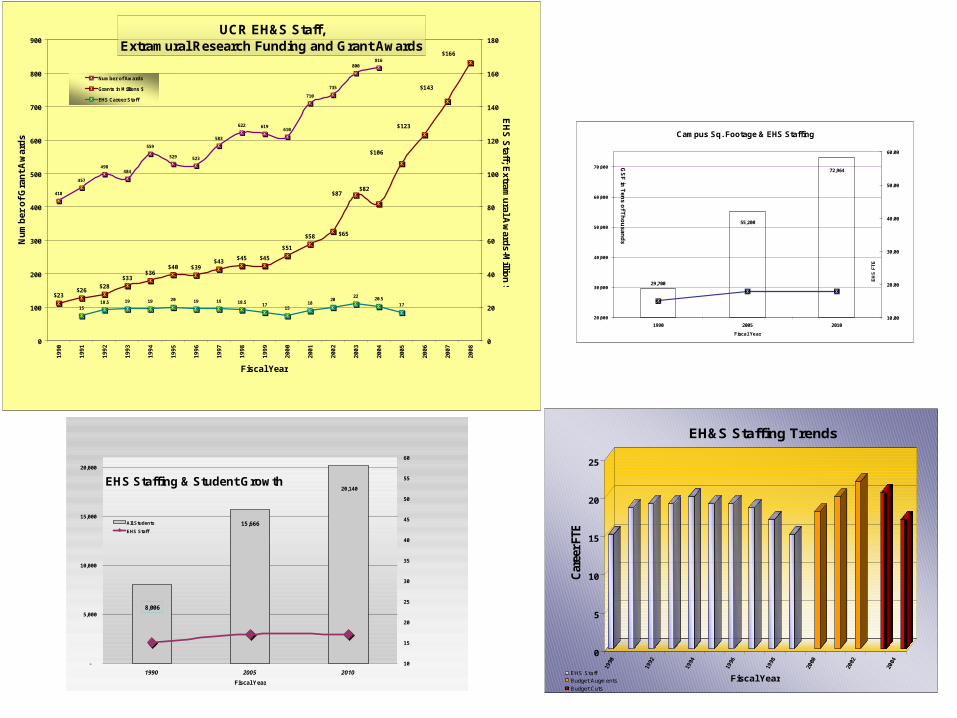
0
5
10
15
20
25
Car
eer
FTE
Fiscal Year
EH&S Staffing Trends
EHS StaffBudget Augments
Budget Cuts
UCR EH&S Staff, Extramural Research Funding and Grant Awards
418
457
498484
559
529 523
583
622 619610
710
735
800816
$23$26
$28
$33$36
$40 $39$43
$45 $45
$51
$58
1518.5 19 19 20 19 19 18.5 17
1518
2022 20.5
17
$65
$143
$166
$87$82
$106
$123
0
100
200
300
400
500
600
700
800
900
19
90
19
91
19
92
19
93
19
94
19
95
19
96
19
97
19
98
19
99
20
00
20
01
20
02
20
03
20
04
20
05
20
06
20
07
20
08
Fiscal Year
Nu
mb
er o
f G
ran
t A
war
ds
0
20
40
60
80
100
120
140
160
180
EH
S S
taff; Extram
ural A
ward
s-Millio
n $
Number of Awards
Grants in Millions $
EHS Career Staff
Campus Sq. Footage & EHS Staffing
72,964
55,200
29,700
20,000
30,000
40,000
50,000
60,000
70,000
1990 2005 2010
Fiscal YearG
SF
in T
en
s o
f Th
ou
sa
nd
s
10.00
20.00
30.00
40.00
50.00
60.00
EH
S F
TE
EHS Staffing & Student Growth
8,006
15,666
20,140
-
5,000
10,000
15,000
20,000
1990 2005 2010
Fiscal Year
10
15
20
25
30
35
40
45
50
55
60
All Students
EHS Staff
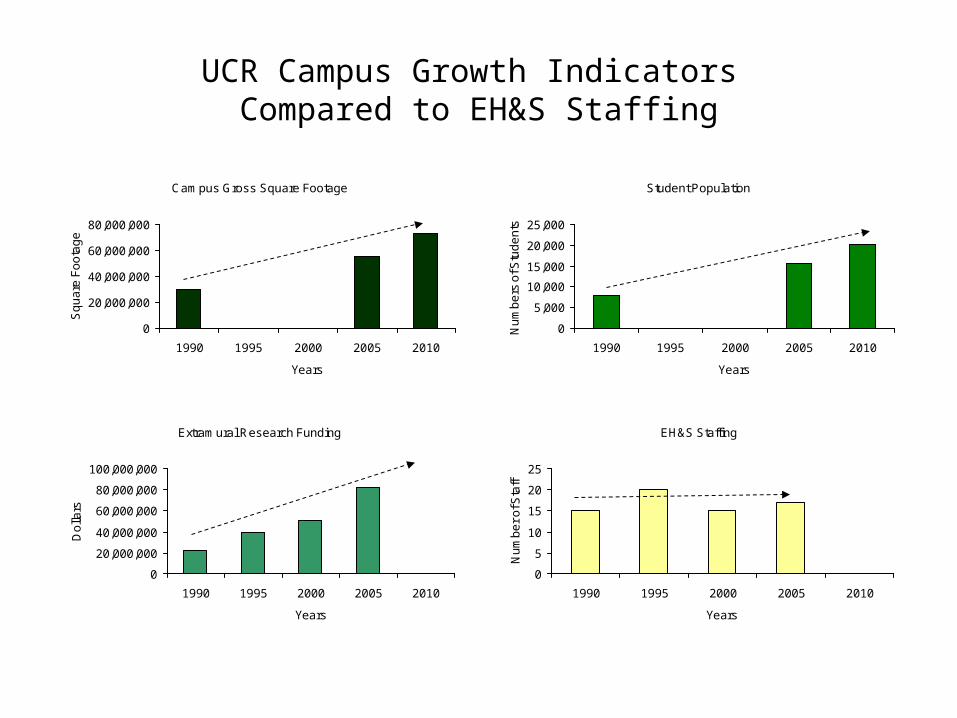
UCR Campus Growth Indicators Compared to EH&S Staffing
Campus Gross Square Footage
0
20,000,000
40,000,000
60,000,000
80,000,000
1990 1995 2000 2005 2010
Years
Sq
ua
re F
oo
tag
e
Student Population
0
5,000
10,000
15,000
20,000
25,000
1990 1995 2000 2005 2010
Years
Nu
mb
ers
of S
tud
en
ts
Extramural Research Funding
0
20,000,000
40,000,000
60,000,000
80,000,000
100,000,000
1990 1995 2000 2005 2010
Years
Do
llars
EH&S Staffing
0
5
10
15
20
25
1990 1995 2000 2005 2010
Years
Nu
mb
er
of S
taff
6
7
8
9
10
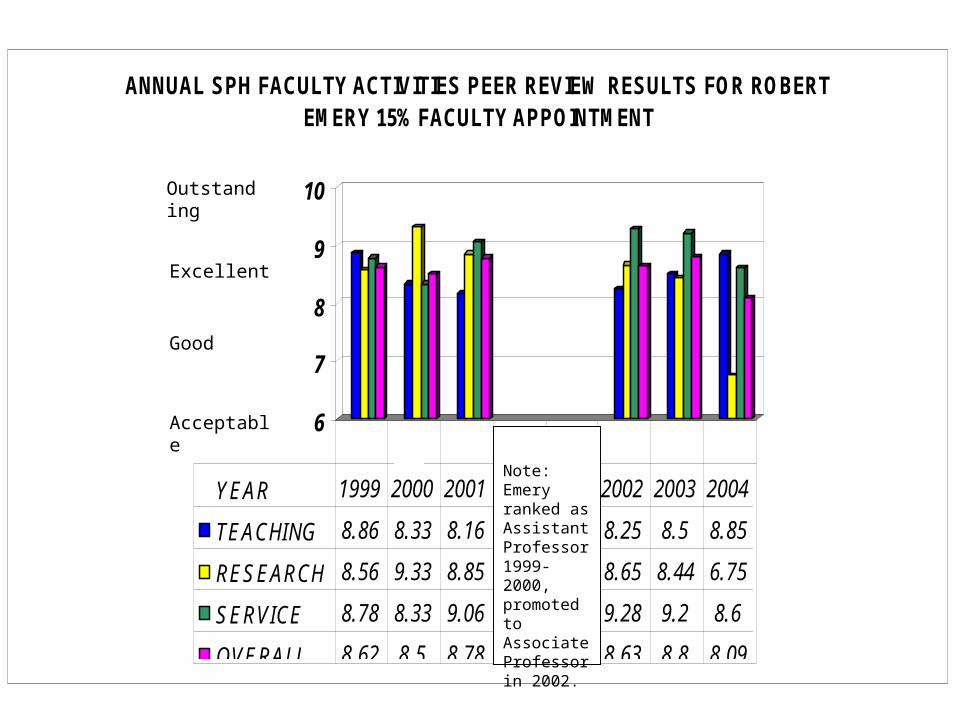
ANNUAL SPH FACULTY ACTIVITIES PEER REVIEW RESULTS FOR ROBERT EMERY 15% FACULTY APPOINTMENT
YEAR 1999 2000 2001 2002 2003 2004
TEACHING 8.86 8.33 8.16 8.25 8.5 8.85
RESEARCH 8.56 9.33 8.85 8.65 8.44 6.75
SERVICE 8.78 8.33 9.06 9.28 9.2 8.6
OVERALL 8.62 8.5 8.78 8.63 8.8 8.09
1 2 3 4 5 6 7 8Note:Emery ranked as Assistant Professor 1999-2000, promoted to Associate Professor in 2002.
Outstanding
Excellent
Good
Acceptable
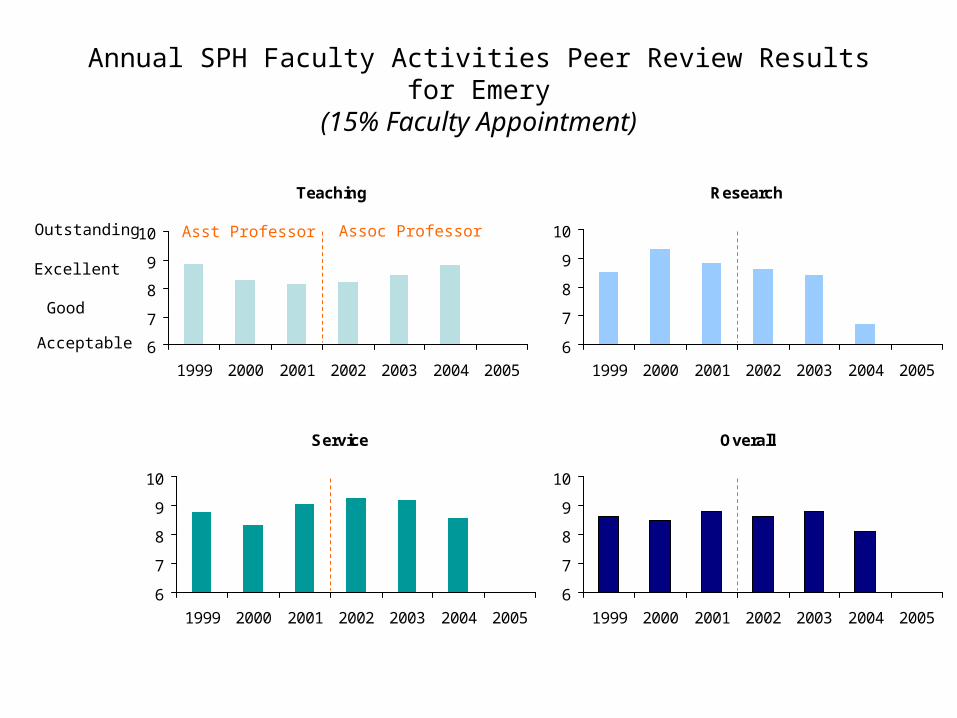
Annual SPH Faculty Activities Peer Review Results for Emery(15% Faculty Appointment)
Teaching
6
7
8
9
10
1999 2000 2001 2002 2003 2004 2005
Service
6
7
8
9
10
1999 2000 2001 2002 2003 2004 2005
Overall
6
7
8
9
10
1999 2000 2001 2002 2003 2004 2005
Research
6
7
8
9
10
1999 2000 2001 2002 2003 2004 2005
Outstanding
Excellent
Acceptable
Good
Asst Professor Assoc Professor