Embed Size (px)
Citation preview
UNIVERSITY OF LJUBLJANA
SCHOOL OF ECONOMICS AND BUSINESS
MASTER’S THESIS
THE COMPARISON OF THE US AND THE EU RESPONSES TO
THE 2008 CRISIS
Ljubljana, April 2019 LUKA NIKOLIĆ

AUTHORSHIP STATEMENT
The undersigned Luka Nikolić, a student at the University of Ljubljana, School of Economics and Business,
(hereafter: SEB LU), author of this written final work of studies with the title “The Comparison of the US and
the EU Responses to the Crisis”, prepared under supervision of prof. dr. Dušan Mramor.
D E C L A R E
1. this written final work of studies to be based on the results of my own research;
2. the printed form of this written final work of studies to be identical to its electronic form;
3. the text of this written final work of studies to be language-edited and technically in adherence with the
SEB LU’s Technical Guidelines for Written Works, which means that I cited and / or quoted works and
opinions of other authors in this written final work of studies in accordance with the SEB LU’s Technical
Guidelines for Written Works;
4. to be aware of the fact that plagiarism (in written or graphical form) is a criminal offence and can be
prosecuted in accordance with the Criminal Code of the Republic of Slovenia;
5. to be aware of the consequences a proven plagiarism charge based on this written final work could have
for my status at the SEB LU in accordance with the relevant SEB LU Rules;
6. to have obtained all the necessary permits to use the data and works of other authors which are (in written
or graphical form) referred to in this written final work of studies and to have clearly marked them;
7. to have acted in accordance with ethical principles during the preparation of this written final work of
studies and to have, where necessary, obtained permission of the Ethics Committee;
8. my consent to use the electronic form of this written final work of studies for the detection of content
similarity with other written works, using similarity detection software that is connected with the SEB LU
Study Information System;
9. to transfer to the University of Ljubljana free of charge, non-exclusively, geographically and time-wise
unlimited the right of saving this written final work of studies in the electronic form, the right of its
reproduction, as well as the right of making this written final work of studies available to the public on the
World Wide Web via the Repository of the University of Ljubljana;
10. my consent to publication of my personal data that are included in this written final work of studies and in
this declaration, when this written final work of studies is published.
Ljubljana, April 15th, 2019 Author’s signature: _________________________
(Month in words / Day / Year,
e. g. June 1st, 2012
i
TABLE OF CONTENTS
INTRODUCTION ............................................................................................................... 1
1 OVERVIEW OF THE CRISIS IN THE UNITED STATES ................................... 3
1.1 Legislative Overview ............................................................................................. 3
1.1.1 The New Deal .................................................................................................. 6
1.1.2 The Great Society ............................................................................................ 6
1.1.3 The 1970s and the 1980s ................................................................................. 7
1.1.4 The 1990s ........................................................................................................ 9
1.1.5 The 2000s ...................................................................................................... 11
1.1.6 Summary ........................................................................................................ 13
1.2 The Actions of the Federal Reserve ................................................................... 14
1.2.1 Monetary Policy During the 1990s ................................................................ 14
1.2.2 The Bursting of the Technology Bubble ....................................................... 15
1.2.3 Monetary Policy During the 2000s ................................................................ 15
2 OVERVIEW OF THE CRISIS IN THE EUROPEAN UNION ............................ 17
2.1 Unsustainable Economic Policies ...................................................................... 17
2.1.1 Portugal .......................................................................................................... 19
2.1.2 Ireland ............................................................................................................ 21
2.1.3 Italy ................................................................................................................ 22
2.1.4 Greece ............................................................................................................ 24
2.1.5 Spain .............................................................................................................. 25
2.1.6 Summary ........................................................................................................ 27
2.2 Structural Problems of the Euro ....................................................................... 28
2.2.1 Heterogeneity and Labor Mobility ................................................................ 28
2.2.2 Competition Policy ........................................................................................ 29
2.2.3 Monetary Policy ............................................................................................ 30
3 POST-CRISIS ASSESSMENT ................................................................................. 31
3.1 Overview .............................................................................................................. 31
3.2 Government Bailouts .......................................................................................... 33
3.3 Regulatory Responses ......................................................................................... 37
ii
3.4 Austerity Measures ............................................................................................. 42
3.5 Monetary Policy .................................................................................................. 45
CONCLUSION .................................................................................................................. 48
REFERENCE LIST .......................................................................................................... 50
APPENDICES ................................................................................................................... 59
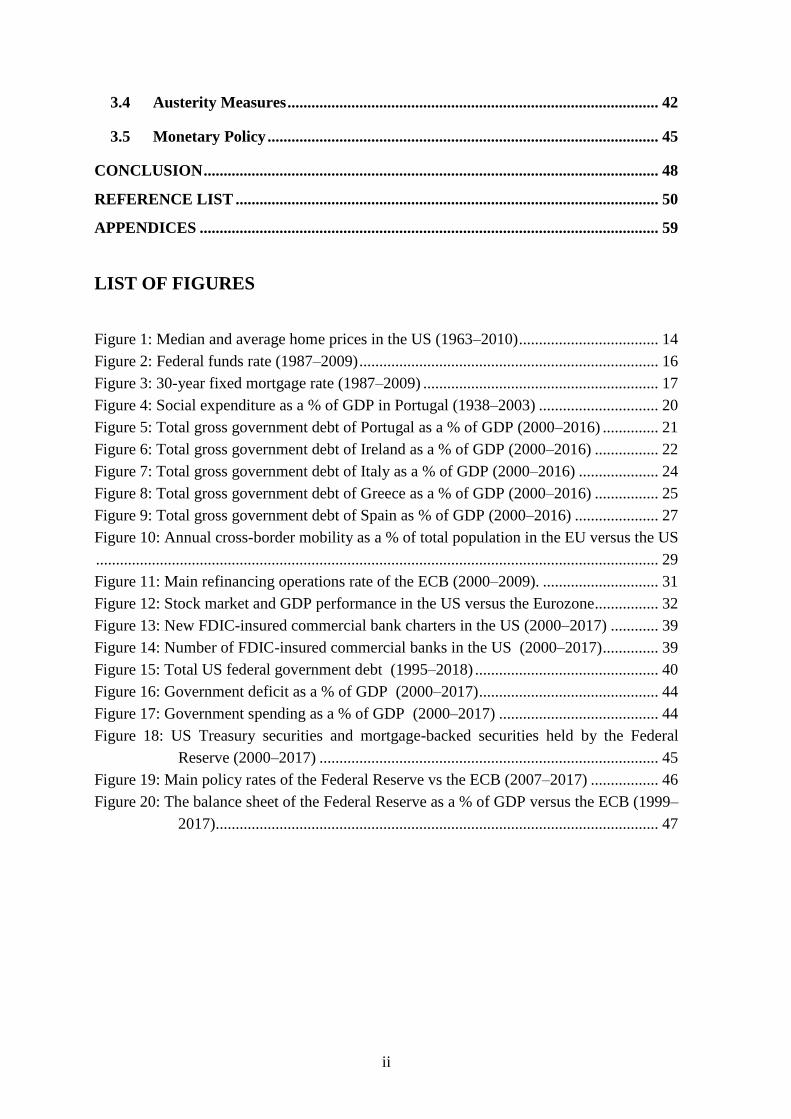
LIST OF FIGURES
Figure 1: Median and average home prices in the US (1963–2010) ................................... 14
Figure 2: Federal funds rate (1987–2009) ........................................................................... 16
Figure 3: 30-year fixed mortgage rate (1987–2009) ........................................................... 17
Figure 4: Social expenditure as a % of GDP in Portugal (1938–2003) .............................. 20
Figure 5: Total gross government debt of Portugal as a % of GDP (2000–2016) .............. 21
Figure 6: Total gross government debt of Ireland as a % of GDP (2000–2016) ................ 22
Figure 7: Total gross government debt of Italy as a % of GDP (2000–2016) .................... 24
Figure 8: Total gross government debt of Greece as a % of GDP (2000–2016) ................ 25
Figure 9: Total gross government debt of Spain as % of GDP (2000–2016) ..................... 27
Figure 10: Annual cross-border mobility as a % of total population in the EU versus the US
............................................................................................................................................. 29
Figure 11: Main refinancing operations rate of the ECB (2000–2009). ............................. 31
Figure 12: Stock market and GDP performance in the US versus the Eurozone ................ 32
Figure 13: New FDIC-insured commercial bank charters in the US (2000–2017) ............ 39
Figure 14: Number of FDIC-insured commercial banks in the US (2000–2017) .............. 39
Figure 15: Total US federal government debt (1995–2018) .............................................. 40
Figure 16: Government deficit as a % of GDP (2000–2017) ............................................. 44
Figure 17: Government spending as a % of GDP (2000–2017) ........................................ 44
Figure 18: US Treasury securities and mortgage-backed securities held by the Federal
…………….Reserve (2000–2017) ..................................................................................... 45
Figure 19: Main policy rates of the Federal Reserve vs the ECB (2007–2017) ................. 46
Figure 20: The balance sheet of the Federal Reserve as a % of GDP versus the ECB (1999–
…………….2017) ............................................................................................................... 47
iii
LIST OF TABLES
Table 1: Overview of legislative acts under the Presidents of the United States .................. 4
Table 2: Overview of unsustainable policies by peripheral countries in the EU ................ 18
Table 3: Description of problems of the Euro ..................................................................... 28
Table 4: Comparison of the responses between the US and the EU ................................... 32
Table 5: Index of economic freedom ranking ..................................................................... 42
LIST OF APPENDICES
Appendix 1: Povzetek (Summary in Slovene language) ....................................................... 1
LIST OF ABBREVIATIONS
CRA – Community Reinvestment Act
ECB – European Central Bank
EU – European Union
FDIC – Federal Depository Insurance Corporation
GDP – Gross Domestic Product
HUD – Housing and Urban Development
SIV – Structured Investment Vehicle
TARP – Troubled Asset Relief Program
US – United States

iv

1
INTRODUCTION
The following master thesis will look at the responses to the 2008 financial crisis in the
United States (hereafter, US) and the European Union (hereafter, EU). Given that both of
these economic powerhouses constitute the foundation of the world economy, their policy
making usually serves as a blueprint for others. The purpose of the thesis is to serve as a
guide for future policy decisions. The thesis will focus on two key aspects of economic
policy in the post-crisis period.
Firstly, it will assess why the US recovered faster from the crisis than the EU. A comparison
of the policies enacted by the US vis-à-vis the EU will be analyzed to assess the discrepancy
in recovery (Schnabl & Stratmann, 2019).
Secondly, regardless of the faster recovery, the thesis will assess whether the US or the EU
fully addressed the real issues behind the crisis. The thesis will demonstrate that neither of
the two responded correctly and that the policies of both were largely harmful. The
discussion will be to what extent was the US correct in its policy response which allowed it
to recover faster.
In order to fully understand why certain policy was appropriate or not, it is important to
address the real causes of the crisis and look at the events leading up to the crisis. The origins
of the crisis in both the US and the EU differ, but both are centered around government
intervention. The crisis in the US largely stemmed from government intervention in the
housing sector, whereas the EU’s problems were mostly due to government debt
concentrated in several peripheral countries (Norberg, 2009).
To illustrate the impact that government had, the following is a brief overview of several
policies of both the US and the EU. It is impossible to assess the response to the crisis unless
the causes are entirely known. The thesis will argue that the causes of the crisis were the
following:
During the 1990s, the US government aggressively pursued a policy of home ownership
for members of the lower class. This was done through the expansion of the Community
Reinvestment Act (hereafter, CRA), several government-sponsored enterprises such as
the Federal Home Loan Mortgage Corporation and the Federal National Mortgage
Association, as well as numerous other legislative pieces. The government forced banks
to issue subprime mortgages to individuals with low credit ratings which they would sell
to government-sponsored enterprises and get their money back instantly. This would
allow them to issue more mortgages (Sowell, 2009).
The peripheral countries of Portugal, Italy and Greece all had enormous welfare states
with large amounts of government employees and expensive government benefits. In
order to finance many of these policies, these governments had to borrow at alarming

2
rates. Ireland, on the other hand, only saw an increase in debt levels when it needed to
bailout its banking sector. It was a fairly liberal and competitive economy. Spain also did
not have as big of a welfare state. Its problems largely came due to the housing bubble,
which the government helped to create to a certain extent (BBC, 2012).
Following the technology bubble crash of 2001 and the September 11 terrorist attacks of
the same year, the Federal Reserve cut interest rates to historic lows of 1 % in order to
stimulate the economy (Woods Jr., 2009, 79–82). This made borrowing money much
more affordable which allowed the aforementioned homeownership campaign to flourish
as mortgages became much cheaper. Furthermore, many of the mortgages issued were
issued with variable rates, meaning that they were tied to rates such as the federal funds
rate. When the Federal Reserve deemed the economy to be overheating and raised
interest rates to 4.25 %, a 3.25 percentage point increase, people with the aforementioned
variable rate policies began to default (La Monica, 2005).
The Euro suffers from structural problems that the US Dollar does not have. It is spread
over a heterogeneous area with no shared culture and no shared economic system. This
makes labor mobility as well as the overall coordination of monetary policy difficult
(Friedman, 1997).
On the other hand, the following is a list of the policies enacted as a response to the crisis.
As evident, no policy addressed the above-listed causes of the crisis.
The United States pursued a program of bailouts called the Troubled Asset Relief
Program (hereafter, TARP), as well as fostering the sale of distressed institutions such
as Merrill Lynch (Palumbo, 2015). Bailouts of banks were present in the EU as well, but
on national levels. The most notable case was the bailout of the Irish banking system.
The EU initiated a series of bailouts of entire economies, most notably in Greece, Ireland,
Portugal and other countries (Bagus, 2010).
Several EU countries created stimulus packages for infrastructure development and
similar projects. The United States created a stimulus package called the American
Recovery and Reinvestment Act of 2009 worth $787 billion (Sowell, 2009).
The response of the United States mostly centered on stimulus, whereas several EU
countries, most notably Greece and Italy, instituted a series of austerity measures aimed
at curbing government spending and in order to create more stability in the future (Loren
Friedman, 2010).
Although the initial response of the European Central Bank (hereafter, ECB) was
contractionary, in the end both the ECB and the Federal Reserve responded similarly
(Look, 2018). Both central banks cut interest rates in order to stimulate the economy via
an expansionary monetary policy.

3
The responses did not address the issue of home ownership advocacy in the US. Although
the EU has taken austerity measures, they are countered by the monetary policy of the ECB.
The monetary response of the US has been identical to its response to the technology bubble
crash, which greatly helped expand the housing bubble in the first place. By fostering an
environment of such monetary expansion, the US has set the stage for a potential new
economic downturn in the future.
The thesis will employ a historical analysis and historical overview of events while providing
qualitative commentary, rather than use quantitative models. The reason is that such an
analysis will be more sufficient for assessing these events as they involve a mixture of
politics, economics and history. The thesis will make economic arguments from an Austrian
Economics School point of view, which focuses on logic and deduction to explain economic
phenomena, rather than Keynesian quantitative models that involve statistics and
mathematics (Callahan, 2011).
A total of four research questions will be checked to see whether they are true. There will be
a research question to uncover the cause of the crisis, followed by two research questions
dealing with the responses in the US and in the EU, respectively, and finally one dealing
with the faster recovery of the US vis-à-vis the EU. The research questions are as follows:
Was the crisis caused due to government actions, both in the US and the EU?
Did the Keynesian response give negative results in the US?
Did the contrary responses of monetary and fiscal policy give negative results in the
EU?
Did the US recover faster than the EU due to faster liquidity injections?
1 OVERVIEW OF THE CRISIS IN THE UNITED STATES
The following will be an overview of the pre-crisis period in the United States. It will look
at the specific policies which fostered the housing bubble and the monetary policy of the
Federal Reserve. The chapter will conclude that government intervention in the economy
fostered the creation of the housing bubble as it forced banks to issue loans to individuals
who were not creditworthy. These mortgages were later bought by government-sponsored
enterprises. Such a policy allowed banks to have cash on hand to issue more loans, allowing
the cycle to repeat itself. All of this was exacerbated by the low-interest rate policies of the
Federal Reserve (Sowell, 2009).
1.1 Legislative Overview
The following list of laws and regulations up until the crisis is not exhaustive, mainly
because there were policies such as slum-clearance which affected the housing market, but
did not necessarily have an impact on the creation of the housing bubble itself. Therefore,
4
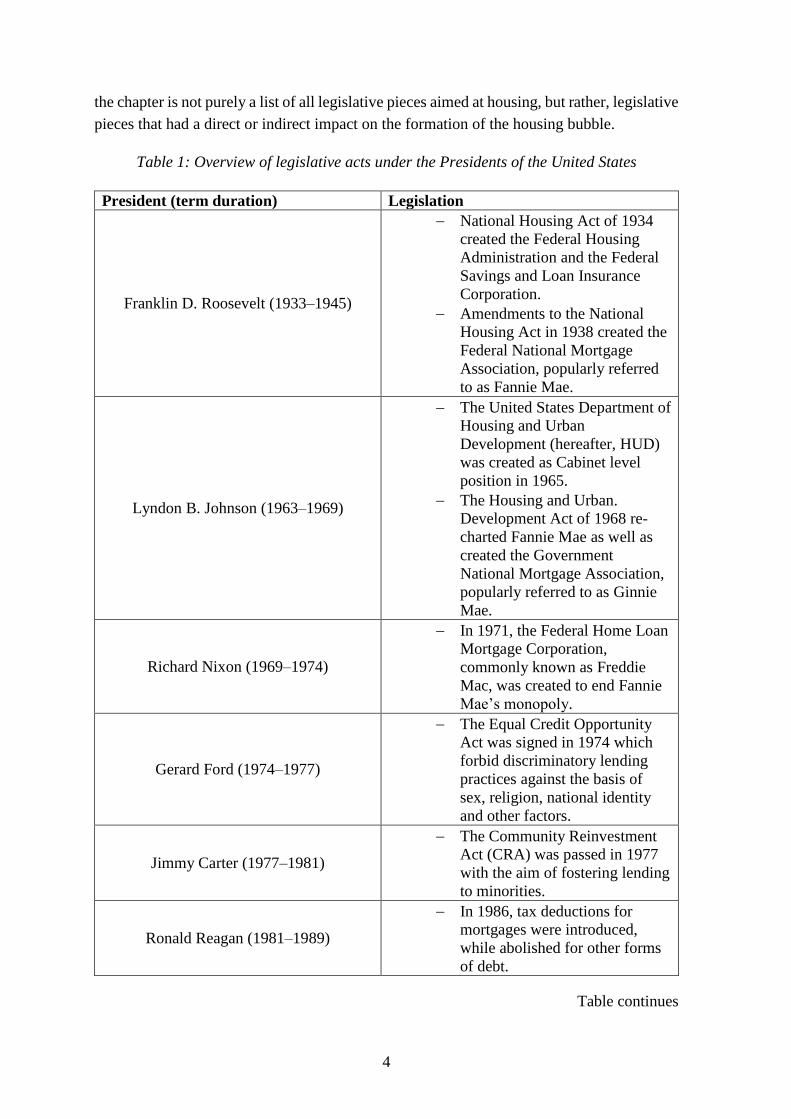
the chapter is not purely a list of all legislative pieces aimed at housing, but rather, legislative
pieces that had a direct or indirect impact on the formation of the housing bubble.
Table 1: Overview of legislative acts under the Presidents of the United States
President (term duration) Legislation
Franklin D. Roosevelt (1933–1945)
National Housing Act of 1934
created the Federal Housing
Administration and the Federal
Savings and Loan Insurance
Corporation.
Amendments to the National
Housing Act in 1938 created the
Federal National Mortgage
Association, popularly referred
to as Fannie Mae.
Lyndon B. Johnson (1963–1969)
The United States Department of
Housing and Urban
Development (hereafter, HUD)
was created as Cabinet level
position in 1965.
The Housing and Urban.
Development Act of 1968 re-
charted Fannie Mae as well as
created the Government
National Mortgage Association,
popularly referred to as Ginnie
Mae.
Richard Nixon (1969–1974)
In 1971, the Federal Home Loan
Mortgage Corporation,
commonly known as Freddie
Mac, was created to end Fannie
Mae’s monopoly.
Gerard Ford (1974–1977)
The Equal Credit Opportunity
Act was signed in 1974 which
forbid discriminatory lending
practices against the basis of
sex, religion, national identity
and other factors.
Jimmy Carter (1977–1981)
The Community Reinvestment
Act (CRA) was passed in 1977
with the aim of fostering lending
to minorities.
Ronald Reagan (1981–1989)
In 1986, tax deductions for
mortgages were introduced,
while abolished for other forms
of debt.
Table continues

5
Table 1: Overview of legislative acts under the Presidents of the United States (continued)
Ronald Reagan (1981–1989)
Deregulation of the savings and
loan industry led to excessive
risk taking due to the presence
of the Federal Depository
Insurance Corporation
(hereafter, FDIC).
George Bush (1989–1993)
The Financial Institutions
Reform, Recovery, and
Enforcement Act of 1989 was
signed. It required federal
agencies to give CRA ratings
and also encouraged Fannie and
Freddie to support more
mortgages for low-income
individuals.
The Federal Reserve Bank of
Boston published a report that
resurged support for the CRA.
The Federal Housing
Enterprises Financial Safety
and Soundness Act of 1992 was
introduced, setting official
targets for Fannie and Freddie.
Bill Clinton (1993–2001)
Amendments to the CRA
regulation were introduced in
1995.
The Taxpayer Relief Act of
1997 encouraged purchases of
more expensive homes as well
as a second home.
The Gramm-Leach-Bliley Act
of 1999 allowed investment
banking and commercial
banking to function under the
same roof.
HUD created additional targets
for Fannie Mae and Freddie
Mac.
George W. Bush (2001–2009)
Sought to provide home
ownership to at least 5.5
million people by 2010.
The American Dream
Downpayment Assistance Act
of 2003 sough to provide
financial assistance to push
home ownership.
Source: Kagan (2018a); Norberg (2009); Sowell (2009); Woods Jr. (2009); Wickell (2018).
6
1.1.1 The New Deal
Although the housing bubble is a 21st century problem, a great deal of the legislation that
fostered its creation stems from several decades ago. President Franklin D. Roosevelt
initiated the New Deal as a response to the stock market crash of 1929 and the subsequent
economic downturn, the Great Depression, which followed it. The set of laws that comprised
the New Deal were aimed at increasing government intervention in the economy and as such
housing was also affected. The National Housing Act of 1934 was passed with the aim of
making housing and home mortgages more affordable. The act also created the Federal
Housing Administration, as well as the Federal Savings and Loan Insurance Corporation.
The role of the Federal Housing Administration was to foster the improvement of housing
standards. It set the rules for construction and underwriting, while at the same time insuring
loans made by banks for building houses. On the other hand, the Federal Savings and Loan
Insurance Corporation was focused on administrating deposit insurance for savings and loan
institutions, which are financial institutions that focus primarily on issuing mortgages
(Kagan, 2018a).
Another key aspect of the New Deal which had a direct influence on the formation of the
housing bubble was the creation of a secondary mortgage market by the government. In
order to have constant funds readily available for making new mortgage loans the
aforementioned National Housing Act was amended in 1938 in order to create the Federal
National Mortgage Association, popularly referred to as Fannie Mae. Its purpose was to
purchase mortgages directly from banks and securitize them, thereby allowing banks to have
funds readily available to issue new mortgages (Ginnie Mae, no date).
Beginning in the 1930s, the United States government expanded control over rating
agencies. In 1936, the Office of the Comptroller of the Currency banned banks from
investing in speculative investment securities. These speculative securities were identified
by recognizable rating agencies. Government intervention in the rating agencies industry
would be expanded later and would have a direct impact on cementing the monopoly of the
big three rating agencies. The big three rating agencies were Standard and Poor's, Fitch and
Moody’s (White, 2009).
Although these policies seem irrelevant at first as they were close to seventy years old at the
time of the housing bubble, the Federal Housing Administration would go on to play a major
role as part of a bigger cabinet program. On the other hand, Fannie Mae would be at the
center of the housing bubble due to its role in the secondary market for mortgages.
1.1.2 The Great Society
President Lyndon B. Johnson launched a series of programs that have been dubbed The Great
Society. These included the expansion of medical care, ending racial injustice and an overall
attempt to end poverty in America. Just like the New Deal, these policies also greatly
7
affected housing (Johnson, 1983, 638–640). In 1965, the United States Department of
Housing and Urban Development was created as a Cabinet department in the executive
branch of the government. Its goal was to focus on developing policies pertaining to housing.
The aforementioned Federal Housing Administration of the New Deal became part of HUD
(HUD, no date). Furthermore, the Housing and Urban Development Act was passed in 1968
which re-chartered Fannie Mae. However, it converted it into a government-sponsored
enterprise. It also split the Government National Mortgage Association, popularly referred
to as Ginnie Mae, from it (Ginnie Mae, no date).
1.1.3 The 1970s and the 1980s
In order to end Fannie Mae’s monopoly on the second-hand mortgage market, the Federal
Home Loan Mortgage Corporation, popularly referred to as Freddie Mac, was introduced in
1971 (Pickert, 2008). The aforementioned HUD presided over both Fannie and Freddie and
thus indirectly over home owners and home buyers. What made institution such as Fannie
and Freddie problematic is the fact that they were neither fully privately owned nor fully
publicly owned. As government-sponsored enterprises, they were privately owned but
implicitly backed by a government guarantee. This created a very large incentive issue. This
is due to the fact that private owners would take risk and profit the additional money such
risk would earn them. At the same time, if the risk were to be too large, the government
would step in with a bailout. Both Fannie Mae and Freddie Mac would go on to play a crucial
role in the formation of the housing bubble (Sowell, 2009, 15).
In 1974, the Equal Credit Opportunity Act was enacted. It forbade creditors to discriminate
against race, gender, religion, nationality, marital status, age as well as other factors
(Kreiswirth & Tabor, 2016). At first glance, such legislation might seem positive, however,
it creates further costs for financial institutions as they are forced to prove compliance.
Furthermore, certain factors which may be deemed discriminatory by such an act could be
used to filter non-creditworthy applicants and result in fewer write-offs for the bank. Three
years after this act was signed, perhaps the most important legislative piece was passed. In
1977, Congress passed the Community Reinvestment Act (CRA) with the aim of increasing
home ownership amongst low-income individuals in the United States, whom were mostly
minorities. The act assessed whether financial institutions were issuing enough mortgages
to such groups. The act forced banks to make loans to individuals to whom they would not
have lent money to otherwise, had it not been mandated by the Government (Woods Jr.,
2009, 31). The act was introduced with the supposed belief that banks were actively
engaging in discriminatory lending practices and because of this banks were forced to engage
in a form of “affirmative lending”. Despite the fact that CRA did not initially gain much
prominence, it would be resurrected in the 1990s following a report with similar findings on
racial injustice in mortgage issuances (Howard, 2000).

8
In 1975, the Securities and Exchange Commission cemented the monopoly of the big three
rating agencies by requiring that the minimum reserve requirement of broker-dealers be
based on the riskiness of their bond portfolios. An issue arose with the fact that a broker-
dealer could approach a rating agency and pay a premium to get an AAA rating, despite their
portfolio being loaded with high-yield bonds. As a result, the Securities and Exchange
Commission created Nationally Recognized Statistical Rating Organizations, which were
select few agencies whose ratings the Securities and Exchange Commission endorsed.
Despite having designated four additional agencies as Nationally Recognized Statistical
Rating Organizations, a series of mergers in the 1990s reduced the number to the
contemporary big three. Furthermore, as financial institutions needed rating agencies to
survive, the business model on which the agencies functioned was changed from an “investor
pays” model of the early 20th century to the “issuer pays” model. This allowed for a serious
conflict of interest to occur given the profit incentives of an agency (White, 2009).
Furthermore, in 1986, tax deductions for mortgage payments were introduced, while tax
deductions for other loans such as auto and credit card ones were abolished. Not only did
such an act push up the demand for housing, but it also increased home loans overall,
regardless of their intended use. For example, as late as 1994, close to two thirds of all home
loans were used to pay down other debts, such as auto and credit card ones. It was precisely
these same loans that were no longer tax deductible (Norberg, 2009, 5).
The most significant economic downturn of the 1980s was the savings and loan crisis. As
aforementioned, savings and loans institutions were a crucial player in the mortgage market.
During the 1980s, Ronald Reagan’s administration loosened restrictions on savings and loan
institutions. However, the Federal Depository Insurance Corporation remained in place and
as such, any losses incurred by savings and loan institutions would have been covered by the
FDIC. Deregulating the savings and loan industry and thereby letting them make riskier
investments was the only way to stop the industry from going bankrupt. Such deregulation,
accompanied by a safety net from the government, eventually led to a serious economic
downturn that would last from 1985 to 1991. Overall, the deregulatory measures taken by
Ronald Reagan were welcoming, however, the incentives given by the FDIC created a
serious conflict of interests (Woods Jr., 2009, 61).
The savings and loan crisis is incredibly important due to the fact that it had a great impact
on housing, as construction dropped greatly. For example, during 1986, 1.8 million housing
units were created, whereas five years afterwards, by 1991, only around 1 million homes
were started (Diamond Jr. & Lea, 1992). Furthermore, in 1993, the overall number of banks
fell below the number of banks during the height of the Great Depression for the first time
in a century (Ferguson, 2009). In order to boost the housing market, the government enacted
several legislative pieces and regulatory bodies to aid in recovery. In addition to the already-
present political sentiments regarding minorities and housing, this would have serious effects
on the formation of the housing bubble. Namely, the Financial Institutions Reform,
Recovery, and Enforcement Act of 1989 was introduced, creating the Resolution Trust
9
Corporation. The Resolution Trust Corporation closed hundreds of insolvent savings and
loan institutions. This legislation also abolished the Federal Savings and Loan Insurance
Corporation. Perhaps the most important aspect of this legislative piece was the fact that
more responsibility was given to Fannie Mae and Freddie Mac to support the issuance of
mortgages to low-income families. These low-income families would otherwise fail to
obtain a mortgage in the open market without the help of the government. In addition,
regulatory agencies were required to rate financial institutions based on how well they were
following CRA guidelines. Federal agencies were required to publicly rate financial
institutions on a four-tiered scale, thereby further fostering lending to individuals who would
not get a mortgage in an open market (Kagan, 2018b).
1.1.4 The 1990s
The discussion hitherto had focused on some of the historical aspects of legislation which
would go on to have an impact on the formation of the housing bubble. The political push
for home ownership that would culminate in the formation of housing bubble itself began in
the 1990s and reached its climax in the 2000s.
As aforementioned, the CRA did not gain much notoriety initially. However, things changed
when in 1992, the Federal Reserve Bank of Boston issued a report claiming minorities were
getting mortgage loans at lower rates than white applicants. This re-affirmed the sentiment
that was behind the creation of the CRA in the first place. The Federal Reserve Bank of
Boston proceeded to issue a manual instructing how banks could end this racial injustice.
None of the rules that the manual contained were focused on risk or profit, the former rising
for the bank if extending loans to non-creditworthy individuals, with the latter decreasing
due to larger defaults. At one point the manual stated that CRA loans do not fit into the
standard credit score framework and as such cannot be viewed in the same risk and profit
manner (Woods Jr., 2009, 17–18). There are several problems with this report. Firstly, even
if it were true that minorities were rejected more often than whites due to racism or other
injustices, despite having a good-enough credit score, then by all laws of economics, a
financial institution would have taken advantage of this plain arbitrage opportunity.
Secondly, empirical mortgage data shows that whites are also discriminated against, as
mortgage applicants of Asian descent have the highest approval rating (Sowell, 2010, 156).
The social aspects that cause the disparities in mortgage applications in such a free and
competitive economy as the United States are a complicated topic itself. Racial and ethnic
groups have varied since the founding of America in terms of their attitude towards work,
leisure, education and other factors. Such differing attitudes are naturally reflected in one’s
credit rating as well (Sowell, 1981).
The Federal Housing Enterprises Financial Safety and Soundness Act was passed in 1992
which gave even more power to Fannie Mae and Freddie Mac (Jackson, 2006). This
legislation allowed HUD secretary Henry Cisneros to set a target for Fannie Mae and Freddie

10
Mac. It required 42 % of all mortgages traded by Fannie Mae and Freddie Mac to go to
households with low income. Cisneros’ successor Andre Cuomo raised the bar eight
percentage points to 50 % in 1999. President George W. Bush subsequently raised it to 58
% (Norberg, 2009, 29–37).
To solve the issue of limited money for mortgages, the government sought to have banks
sell their mortgages to institutions such as Fannie Mae and Freddie Mac. They further pooled
several mortgages together and sold them as a standardized instrument on the market. These
instruments were often referred to as collateralized debt obligations or asset-backed
securities. The investor buying such an instrument gets a share of a pool of income that is
combined of mortgages of different quality, thereby diversifying the overall risk he is
exposed to (Woods Jr., 2009, 12). In addition, both Fannie and Freddie guaranteed investors
repayment of interest and principal in case the original borrower defaulted on their mortgage,
for which they charged a premium (Norberg, 2009, 25–26). By having such enterprises
purchase 30-year mortgages, banks can essentially re-lend again as they do not have to wait
thirty years to get their money back. As the purpose of the entire government scheme for
housing was more home ownership, this eventually created a vicious cycle (Sowell, 2009,
15).
The CRA regulation was tightened in 1995, which led to more standardized compliance on
whether banks were fulfilling their requirements of lending to low income individuals. One
such metric that was observed by regulators was whether banks were lending enough to
individuals earning 80 % less than the national median income. If banks failed to comply,
they would be prevented from expanding their operations, whether in their home state or in
other states (Norberg, 2009, 27–28). From an economic point of view, the chances of
someone repaying a mortgage despite earning 80 % less than the national median income
are very slim. Homes are considered a luxury and it is the case in all societies that they are
purchased by individuals or couples once they have settled down. Settling down in most
cases also means having an income that is above the national median. Therefore, from a
purely economic point of view, such regulation greatly stifled a bank’s lending abilities as
most individuals qualifying for mortgages under this new legislation had much higher
chances of defaulting. However, this issue was solved by the second-hand mortgage market,
which was dominated by Fannie Mae and Freddie Mac.
Furthermore, the Taxpayer Relief Act of 1997 encouraged the purchase of more expensive
homes, as well as a second home. This was due to the exclusion from capital gains tax in the
case of a sale of a home. The amount was $500,000 for married couples and $250,000 for
single people, available every two years. This further increased demand for housing
(Norberg, 2009, 6).
In July of 1999, HUD secretary Andrew Cuomo announced an action to provide $2.4 trillion
in mortgage loans to 28.1 million families. Although Andrew Cuomo did not specify where
the money was going to come from, the government can either tax, print or borrow in order

11
to raise that amount of capital. All three measures translate into bad economic policy as they
hinder economic growth (HUD, 1999). Later that same year, there was a regulatory
revolution with the end of the Glass-Steagall Act, which banned investment banking and
commercial banking from operating under the same roof. The act that ended this piece of
legislative history was the Gramm-Leach-Bliley Act of 1999. However, the push for home
ownership was so strong that even such deregulation came with strings attached. Namely,
the government excluded banks that were not fulfilling the desired goals in terms of lending
to low-income individuals, as demanded by the CRA, the Federal Reserve Bank of Boston
and a myriad of other government agencies (Sowell, 2009, 74). That same year, Fannie Mae
also lowered credit requirements to boost mortgages to low-income individuals even further
(Holmes, 1999).
1.1.5 The 2000s
Despite the bursting of the technology bubble in the early 2000s, the push for home
ownership was so strong that the sector was barely affected by the economic downturn.
Namely, housing prices rose 8.8 % from August 2000 to August 2001 (Norberg, 2009, 6).
Nonetheless, the political push for home ownership continued well into the new millennium.
In March of 2000, HUD issued several goals for Fannie and Freddie that they should realize
in the period from 2001 until 2003. Namely, at least 50 % of houses financed by each
government-sponsored enterprise should be for low-income individuals, whilst 20 % for
very low-income individuals. Furthermore, at least 31 % of all dwelling units financed
should be in specific underserved areas (HUD, 2001).
Furthermore, later that same year, the Commodity Futures Modernization Act was passed.
The act, amongst other things, deregulated the financial industry and allowed credit default
swaps to be traded by investment banks, hedge funds and insurance companies (Chen, 2018).
It was stated that the act had an impact in the eventual collapse of the insurance company
AIG (Davidson, 2008). Although it is without a doubt that exposure to credit default swaps
was their eventual downfall, it was not because there was not enough oversight over this
market nor the fact that credit default swaps, as financial instruments, were inherently
unsound. The problem was that credit default swaps were sold for mortgage-backed
securities and as evident so far throughout this chapter, it was the government that was
responsible for creating a bubble for that underlying security.
In 2002, President George W. Bush continued the political push for home ownership. He set
out the goal of increasing the amount of minority home owners by at least 5.5 million by
2010. He aimed to achieve this via tax credits, subsidies and by giving $440 billion to various
organizations that fostered community development (CNN, 2002). Furthermore, the next
year, president Bush signed the American Dream Downpayment Assistance Act with the
aim of helping forty thousand families a year by providing a grant of $10,000 or 6 % of the
home’s total value. The act also sought to lower closing costs (Wickell, 2018).

12
Between 2004 and 2006, Fannie Mae and Freddie Mac purchased $434 billion in securities
backed by subprime loans and thereby fostered a new market. Firms such as Lehman
Brothers, Citibank and Merrill Lynch hired experts in the field in order to enter the market
as well (Leonnig, 2008). For example, in 2006, Merrill Lynch created the most collateralized
debt obligations in the world. The amount of risk Merrill Lynch was taking forced the
insurance company AIG to state that they would stop insuring Merrill Lynch (Norberg, 2009,
56–58).
Many of the problems were exacerbated by the shadow banking sector which was created as
a response to the Basel accords that made banking under normal conditions more expensive.
The Basel accords created a price list for risk-taking and banks sought to take risks which
were the cheapest for them in terms of capital. They did this by creating a structured
investment vehicle (hereafter, SIV), which is essentially a special company controlled by the
bank. The SIV makes investments rather than the bank. The SIV can also borrow from the
market, but if not able to, could always be financed by its mother company. Because it is the
SIV which holds the risky investments and not the bank, it is not required to hold as much
capital to cover those investments. This way the SIV saves millions and even billions when
investments are made on a large scale (Norberg, 2009, 52).
It was not only low-income individuals who were fueling the demand for housing,
speculators also played a role in the crisis. The fact that the crisis is dubbed as a subprime
mortgage crisis obscures the whole picture of the actions of all the players in the markets.
Naturally, as lending standards loosened for low-income earners, the standards loosened
even further for prime borrowers. This led to an array of speculators buying up property
housing and attempting to sell them at a profit as housing prices surged due to the increased
demand. Foreclosures were highly susceptible to movements in housing prices and as such
both groups were affected. For example, a 1.6 % drop in housing prices in late 2006 caused
foreclosures to increase by 43 % overall. From 2006 to 2007, the increase in foreclosures
started was higher for prime borrowers than subprime ones, although the absolute numbers
were still much higher for subprime borrowers (Woods Jr., 2009, 22–23).
A common problem during the governmental push for housing was that low-income
individuals often failed to meet the prerequisites for a mortgage. Mortgages require a certain
down payment, proof that an individual will have future income to pay off his mortgage and
a few other things to ensure the bank that they are lending to a creditworthy individual. All
such problems were solved with financial innovation in the lending sector, which introduced
adjustable-rate mortgages, low or no down payments, interest-only mortgages and a myriad
of other new ways of financing a mortgage (Sowell, 2009, 37–50).
Another issue that is pertinent to this discussion is the size of government deficit spending
during the presidency of George W. Bush. All of the aforementioned government agencies
and programs related to housing had to be financed somehow. Furthermore, the Bush
administration enacted expansions of other government programs which were unrelated to

13
housing. One such example was the 2003 Medicare Modernization Act which further
increased government spending on healthcare. In addition, the US declared war on Iraq and
Afghanistan as a result of the 9/11 terrorist attacks which further exacerbated the issue of
government spending. The Bush administration managed to turn a $127 billion surplus into
a $158 billion deficit by George W. Bush’s second year in office. Furthermore, despite
promises of enormous tax cuts of over $1 trillion, no such cuts were proposed for
government spending (Norberg, 2009, 19).
The dangers that Fannie and Freddie posed were expressed by several government officials,
but largely ignored. For example, Armando Falcon Jr. of the Office of Federal Housing
Enterprise Oversight, an agency whose job was it to monitor Fannie and Freddie, issued a
report warning that the risks undertaken by the agencies would lead them to insolvency.
Falcon Jr. was fired the same day he published his report. He was reinstated after a scandal
exposed some of the dubious accounting practices conducted by the two enterprises, re-
affirming sceptics’ concerns regarding the two enterprises (Norberg, 2009, 36–56). Similar
concerns were expressed by Secretary of Treasury John W. Snow in 2003, as he stated that
additional oversight over Fannie and Freddie was needed (Sowell, 2009, 84). An attempt to
provide further oversight over the government-sponsored enterprises by creating a new
agency within the Department of the Treasury was blocked by Congress (Labaton, 2003).
1.1.6 Summary
There is a myriad of other instances of government pushing to increase mortgages and
homeownership amongst the lower classes of society, but the bulk of it rests on the
Community Reinvestment Act and what succeeded it. The 1990s saw a resurgence in the
political push for home ownership that started with the Community Reinvestment Act.
As evidenced, it was government that sought to push banks into the risky field of subprime
mortgages, rather than banks entering this market themselves. It is questionable whether
banks would have entered the market themselves given the credit profiles of the individuals
that banks were forced to lend to by the government.

14
Figure 1: Median and average home prices in the US (1963–2010)
Source: U.S. Census Bureau (no date.).
1.2 The Actions of the Federal Reserve
The Federal Reserve’s discretionary monetary policy is aimed at soothing economic cycles.
However, it has usually made matters worse. The chapter will argue that the actions of the
Federal Reserve contributed to the housing bubble and its final crash.
1.2.1 Monetary Policy During the 1990s
Following the mild economic downturn in the beginning of the 1990s, the US economy
seemed to be recovering and by 1994, the Federal Reserve was raising interest rates to halt
a potential boom. The federal funds rate in September 1994 was 4.73 %, whereas in January
of 1995 it was 5.53 %. However, economic distress reemerged with the Mexican crisis and
the subsequent Japanese crisis. Not wanting to repeat the bailouts that occurred during the
Mexican peso crisis, the governments of Germany and the US sought to subsidize purchases
of Japanese goods and to reverse the exchange rate in favor of a strong Yen. Such an action
would require an increase in liquidity, which had to go somewhere. This time the liquidity
went to the stock market. As the federal funds rate was beginning to decrease, there was an
increase in the NASDAQ Composite, which crossed the 1000-point mark for the first time
in history. The federal funds rate in June of 1995 was 6 % with the NASDAQ standing at
933, while in April of 1996 it was 5.22 % with the NASDAQ standing at 1190 points. This
coincided with a general awareness of the powers of the internet, as some of the more
powerful technology companies, such as the Netscape browser, were looking to do an initial
$0
$50,000
$100,000
$150,000
$200,000
$250,000
$300,000
$350,000
19
63
19
65
19
67
19
69
19
71
19
73
19
75
19
77
19
79
19
81
19
83
19
85
19
87
19
89
19
91
19
93
19
95
19
97
19
99
20
01
20
03
20
05
20
07
20
09
Median Average
15
public offering. When they did go public, the stock increased over 100 % on the first day
(Callahan & Garrison, 2003). There is a myriad of other companies that went public that had
even higher first-day returns, such as Linux of 697.5 %, TheGlobe.com of 606 %, Foundry
Networks of 525 % and more(Krantz & Johnson, 2014, 318).
1.2.2 The Bursting of the Technology Bubble
The NASDAQ rose at an alarming pace, reaching almost 2200 points in January of 1999. In
order to stop the economy from overheating, the federal funds rate was raised six times from
June 1999 to May 2000. Unfortunately, despite attempts to cool down the economy, such a
stock market frenzy on the NASDAQ had already left an economic mark, as it collapsed at
the turn of the millennium followed by a mild recession. The NASDAQ Composite fell from
3966 in June of 2000 to 2471 in December of the same year and by September of 2001 it
was down to 1498 (Callahan & Garrison, 2003). In addition to the crash, the United States
was struck by the September 11 terrorist attacks. This the worst terrorist attack on US soil,
which had a death toll of more than 3000. Such a macroeconomic shock greatly affected the
market, as the New York Stock Exchange dropped 14 % the first day it opened after the
attacks (Norberg, 2009, 3).
As a response to these two economic shocks, Federal Reserve Chairman Alan Greenspan
decided to cut rates to 1 % starting in 2001 in order to stimulate the economy. Expansionary
policy was pursued by Greenspan in the past. He was praised for saving the United States
from several crises by using the same policy (Norberg, 2009, 1–2). After eleven federal funds
rate cuts, the federal funds rate was 1 % from June 2003 to June 2004 (Woods Jr., 2009, 79–
82).
1.2.3 Monetary Policy During the 2000s
Due to the federal funds rate being so low, most individuals were encouraged by Greenspan
himself to take adjustable-rate mortgage loans as opposed to the traditional fixed rate
mortgage rates (Woods Jr., 2009, 22). A Federal Reserve report at the time indicated that
Americans could save well into the tens of thousands if they opted for an adjustable-rate
mortgage, which allowed interest rates on their mortgages to move freely. Trusting the report
and given the appealing conditions of paying an adjustable-rate mortgage at such a low
federal funds rate, Americans began to take out adjustable-rate mortgages. In 2004, a report
revealed that the number of adjustable-rate mortgages soared from 5 % to 40 % in a single
year (Norberg, 2009, 7).
However, problems began to occur when the Federal Reserve began increasing the federal
funds rate as it witnessed the emergence of a new bubble. The federal funds rate was 4.25 %
by the end of 2005, having been raised a quarter of a point for each of the thirteen Federal
Reserve meetings held since June 2004 (La Monica, 2005). People began to miss mortgage

16
payments as their monthly burdens had been increased by 3.25 percentage points in a little
over a year, with many defaulting on their mortgages due to the adjustable-rates that they
were encouraged by the government to undertake. In addition, many of the individuals who
qualified for mortgages had little income, let alone savings to fall back on. This further
hampered their situation and ability to save their homes from foreclosure.
As Alan Greenspan was at the helm of the Federal Reserve during the turbulent period which
led to the crisis, it is perhaps most ideal to illustrate the federal funds rate from 1987, when
he took office, to 2009. Many of the events discussed are highly visible on Figure 2 as the
rate fluctuates several times.
Figure 2: Federal funds rate (1987–2009)
Source: Board of Governors of the Federal Reserve System (US) (2009).
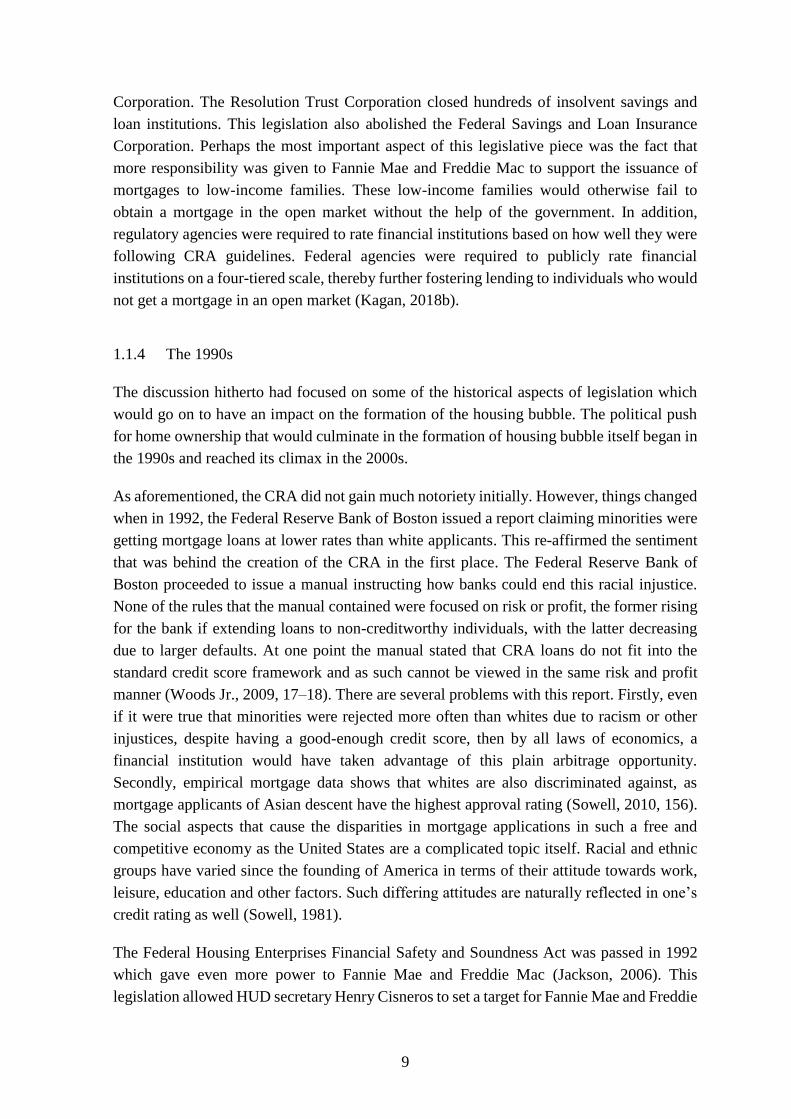
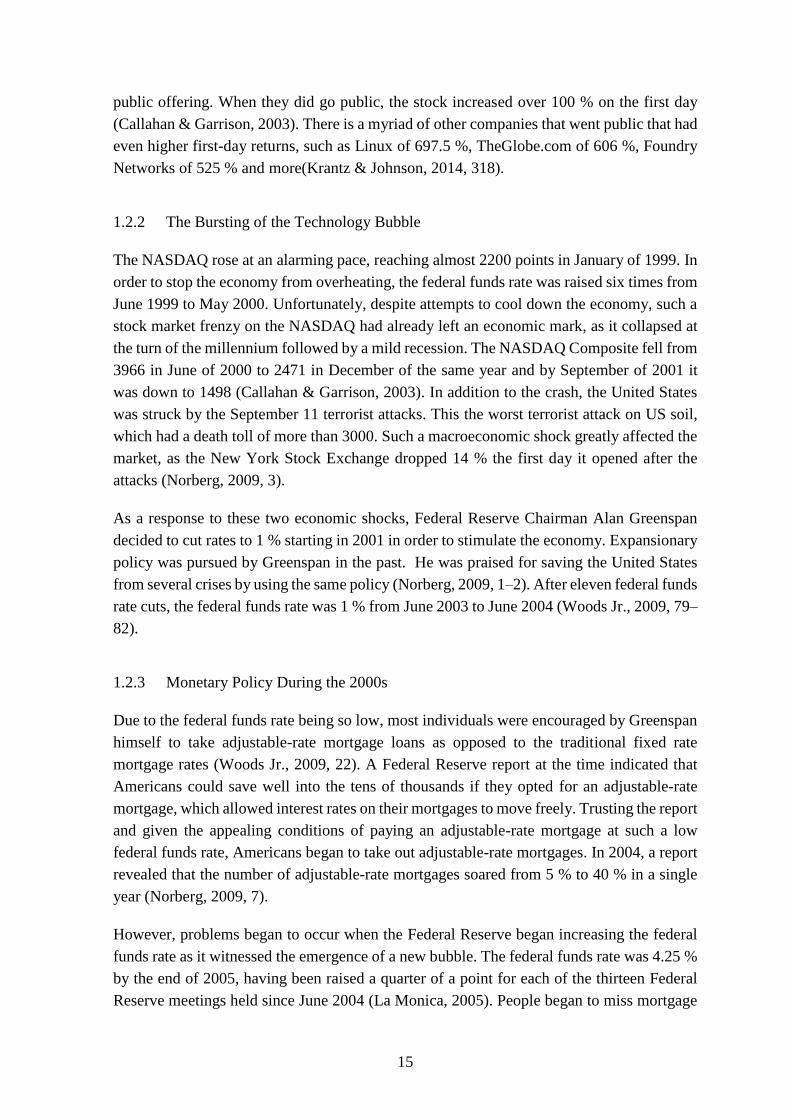
Figure 3 depicts the 30-year fixed mortgage rate from 1987 to 2009. As evident, the rates
during the early 2000s are lower compared to the previous two decades.
0%
2%
4%
6%
8%
10%
12%
Jan
uar
y-8
7
Oct
ober
-87
July
-88
Ap
ril-
89
Jan
uar
y-9
0
Oct
ober
-90
July
-91
Ap
ril-
92
Jan
uar
y-9
3
Oct
ober
-93
July
-94
Ap
ril-
95
Jan
uar
y-9
6
Oct
ober
-96
July
-97
Ap
ril-
98
Jan
uar
y-9
9
Oct
ober
-99
July
-00
Ap
ril-
01
Jan
uar
y-0
2
Oct
ober
-02
July
-03
Ap
ril-
04
Jan
uar
y-0
5
Oct
ober
-05
July
-06
Ap
ril-
07
Jan
uar
y-0
8
Oct
ober
-08
July
-09
Federal Funds Rate
17
Figure 3: 30-year fixed mortgage rate (1987–2009)
Source: Freddie Mac (2009).
2 OVERVIEW OF THE CRISIS IN THE EUROPEAN UNION
The following is an outline of how the governments of various EU countries contributed to
the crisis. It is a continuation of the discussion on the role of government involvement in
fostering the 2008 crisis.
2.1 Unsustainable Economic Policies
The discussion here will focus on the main culprits behind the Eurozone crisis, namely the
peripheral countries of Portugal, Ireland, Italy, Greece and Spain. The overall issue in the
Eurozone pre-crisis were the artificially low interest rates that were created by the adoption
of the Euro. This made financing fiscal policy much easier. Unlike in the United States, there
was not as much backing for housing, although the government did intervene by giving
various incentives such as tax breaks. The underlying economies of the peripheral states for
which such a high level of debt was needed in the first place will be discussed in more detail
in this chapter. It will be evident that the borrowing was used for a huge welfare state as well
as other government activities (Bagus, 2011).
Other authors have emphasized more some of the structural problems that led to the crisis,
rather than focusing solely on the irresponsible behavior of the peripheral countries. Namely,
the Eurozone was designed to meet the needs of the core countries such as Germany.
Peripheral countries differed largely from core countries. The peripheral countries are much
more prone to asymmetric shocks and serve as a buffer zone for the core countries. As a
3%
4%
5%
6%
7%
8%
9%
10%
11%
12%
13%Ja
n-8
7
No
v-8
7
Sep
-88
Jul-
89
May
-90
Mar
-91
Jan
-92
No
v-9
2
Sep
-93
Jul-
94
May
-95
Mar
-96
Jan
-97
No
v-9
7
Sep
-98
Jul-
99
May
-00
Mar
-01
Jan
-02
No
v-0
2
Sep
-03
Jul-
04
May
-05
Mar
-06
Jan
-07
No
v-0
7
Sep
-08
Jul-
09
Federal Funds Rate
18
result, problems in one peripheral country are spread to others. Afterwards, they also reach
the core countries as well. Peripheral countries do not have the means to respond to these
shocks in a proper manor before they reach others (Mramor, 2019).
In addition to fiscal policy issues, the peripheral countries, with the exception of Ireland, all
ranked extremely low on the Institutions Quality Index during the 2001 to 2008 period.
Namely, Italy ranked worst, followed by Greece, Spain and Portugal. Ireland was ranked
above countries such as the United Kingdom, but still below-average and on the lower end
of the scale. The ranking is based on the judiciary system, regulative institutions, institutions
protecting market competition, anti-corruption institutions and public sector institutions
(Jurlin & Čučković, 2010).
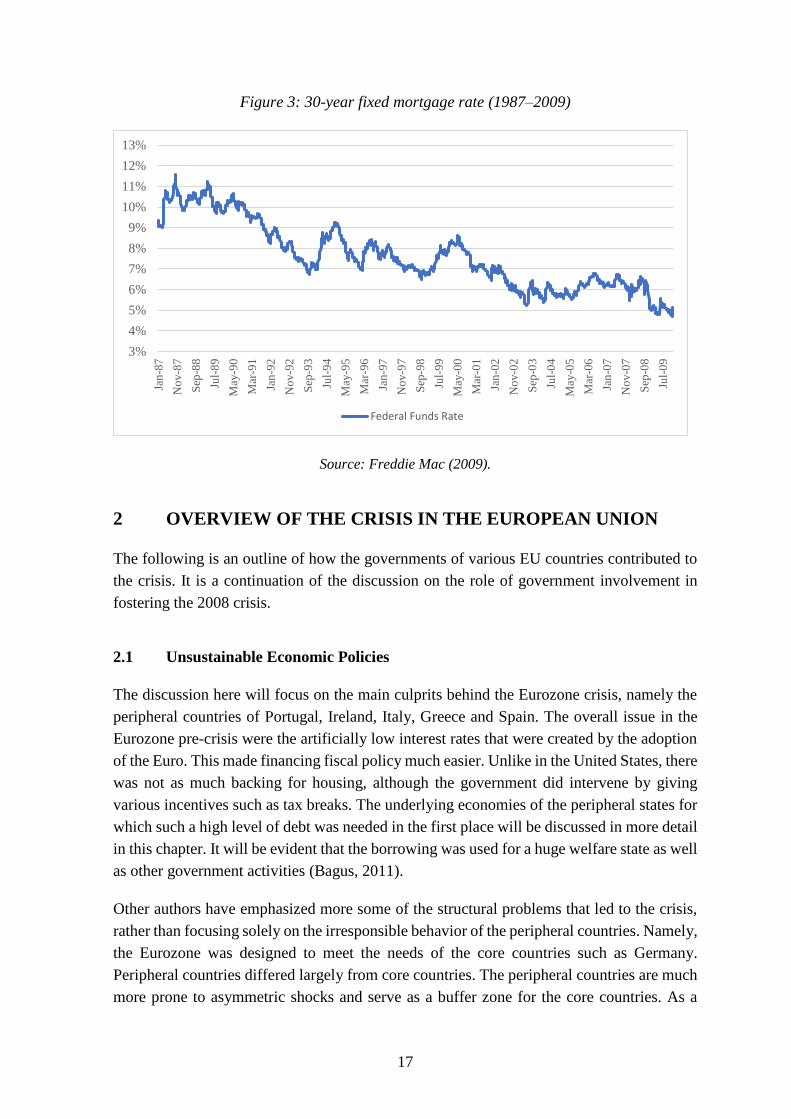
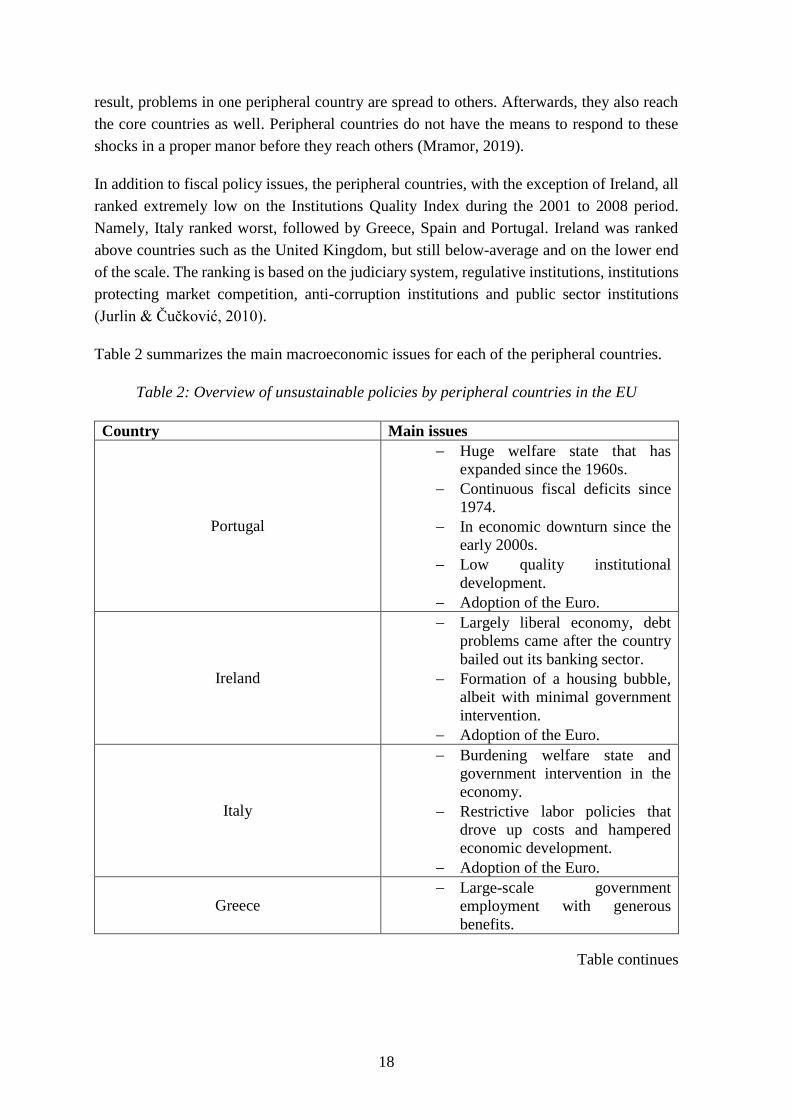
Table 2 summarizes the main macroeconomic issues for each of the peripheral countries.
Table 2: Overview of unsustainable policies by peripheral countries in the EU
Country Main issues
Portugal
Huge welfare state that has
expanded since the 1960s.
Continuous fiscal deficits since
1974.
In economic downturn since the
early 2000s.
Low quality institutional
development.
Adoption of the Euro.
Ireland
Largely liberal economy, debt
problems came after the country
bailed out its banking sector.
Formation of a housing bubble,
albeit with minimal government
intervention.
Adoption of the Euro.
Italy
Burdening welfare state and
government intervention in the
economy.
Restrictive labor policies that
drove up costs and hampered
economic development.
Adoption of the Euro.
Greece Large-scale government
employment with generous
benefits.
Table continues

19
Table 2: Overview of unsustainable policies by peripheral countries in the EU (continued)
Greece
Welfare state and overall
government control of the
economy.
Uncompetitive economy,
undeveloped institutions,
widespread corruption.
Adoption of the Euro.
Spain
Formation of a housing bubble,
with government involvement.
Low quality institutional
development.
Adoption of the Euro.
Source: Bagus (2010); Carolo & Pereirinha (2010); Concheiro (2012); Jurlin & Čučković (2010);
Picardo (2018).
2.1.1 Portugal
Portugal suffered from a burdening welfare state, coupled with an economy that was based
on government intervention. In 1962, the Social Welfare Reform was undertaken, creating a
unified social welfare scheme. This reform exacerbated social spending, which reached 4 %
of Gross Domestic Product (hereafter, GDP) in 1969. At the time this seemed a non-
negligible increase, however, the increase was even greater from 1969 to 1974. The increase
during this five-year period was mainly due to additional coverage being provided to hitherto
unprotected groups, as well as providing benefits such as pension and family allowance. As
a result of all of these new people that were taken under the government’s umbrella, between
1971 and 1974 social expenditure rose at a rate of around 36 %per year. Around 64 % of this
increase represented a rise in spending on pensions. Even with all of these new trends and
the overall expansion, prior to the 1974 revolution, social expenditure as a percentage of
GDP in Portugal never exceeded 6 %. However, things began to change following the fall
of Estado Novo regime. Social expenditure surpassed 10 % in the decade of the 1980s and
by 1995 it was at around 15 %. It finally climbed above 20 % after the new millennium
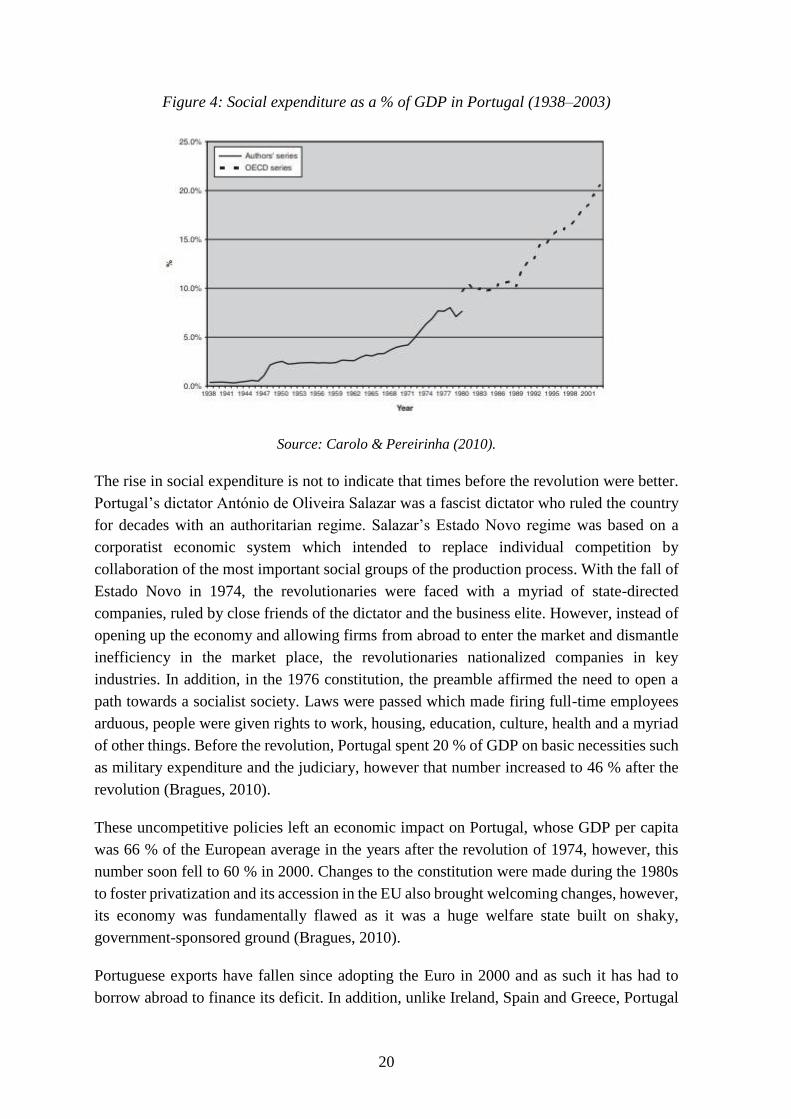
(Carolo & Pereirinha, 2010).
20
Figure 4: Social expenditure as a % of GDP in Portugal (1938–2003)
Source: Carolo & Pereirinha (2010).
The rise in social expenditure is not to indicate that times before the revolution were better.
Portugal’s dictator António de Oliveira Salazar was a fascist dictator who ruled the country
for decades with an authoritarian regime. Salazar’s Estado Novo regime was based on a
corporatist economic system which intended to replace individual competition by
collaboration of the most important social groups of the production process. With the fall of
Estado Novo in 1974, the revolutionaries were faced with a myriad of state-directed
companies, ruled by close friends of the dictator and the business elite. However, instead of
opening up the economy and allowing firms from abroad to enter the market and dismantle
inefficiency in the market place, the revolutionaries nationalized companies in key
industries. In addition, in the 1976 constitution, the preamble affirmed the need to open a
path towards a socialist society. Laws were passed which made firing full-time employees
arduous, people were given rights to work, housing, education, culture, health and a myriad
of other things. Before the revolution, Portugal spent 20 % of GDP on basic necessities such
as military expenditure and the judiciary, however that number increased to 46 % after the
revolution (Bragues, 2010).
These uncompetitive policies left an economic impact on Portugal, whose GDP per capita
was 66 % of the European average in the years after the revolution of 1974, however, this
number soon fell to 60 % in 2000. Changes to the constitution were made during the 1980s
to foster privatization and its accession in the EU also brought welcoming changes, however,
its economy was fundamentally flawed as it was a huge welfare state built on shaky,
government-sponsored ground (Bragues, 2010).
Portuguese exports have fallen since adopting the Euro in 2000 and as such it has had to
borrow abroad to finance its deficit. In addition, unlike Ireland, Spain and Greece, Portugal

21
did not see the positive effects of the long period of growth which was reflected in low
interest rates during the early 2000s. This is mainly because it did not see a housing or
consumer boom and as such no improvements were made in its GDP (Thomas Jr., 2010).
Portugal’s gross government debt to GDP ratio rose from 62 % of GDP to 82.8 % of GDP
in 2008 to 104.1 % of GDP in 2010 (OECD, 2016). In addition, Portugal has achieved a
fiscal deficit every single year since the revolution of 1974 (Bragues, 2010). In 2018, it was
estimated to still be around 1 % due to an injection in its troubled banking system (Khalip,
2018).
Figure 5: Total gross government debt of Portugal as a % of GDP (2000–2016)
Source: OECD (2016).
2.1.2 Ireland
Ireland is perhaps the most liberal economy of all of the peripheral countries and among the
freest overall in the EU. Because of this, it is at first difficult to see why it is in the same
category as the other four countries, whose economies were not as liberal. Ireland's economy
was, to an extent, too competitive. It had the lowest corporate tax rate in the Eurozone at the
time at 12.5 %, which attracted many banks to come to the island. In addition, these banks
had access to cheap credit due to the low interest rates that were mentioned throughout the
thesis as well as the implicit backing of the Euro by the political community. This essentially
meant that banks could lend great amounts, knowing that the government will bail them out.
This is much similar to what has happened in the United States with the FDIC scheme at
several points in history (Bagus, 2010). Therefore, it is quite difficult to talk of Ireland in the
same light as with all other countries. Although Ireland surely must have had certain policies
that were not ideal in a laissez-faire economy, but the overall economy was resting on a
fairly sound basis. There was, however, government intervention in the housing sector
through various tax breaks which fueled the property bubble (Creaton, 2011). By giving out
0%
20%
40%
60%
80%
100%
120%
140%
160%
2000 2001 2002 2003 2004 2005 2006 2007 2008 2009 2010 2011 2012 2013 2014 2015 2016
Debt % of GDP

22
tax breaks for only one certain good, this distorts the market by making other investments,
which would have been more profitable otherwise, look more expensive.
The Euro played a huge part in the Irish bubble. The growth of Irish banking assets jumped
from a 7.4 % in 2002 to 31 % in 2005, a quadruple increase. The yearly growth in the money
supply also jumped, from a negative 6.7 % in 2003 to 22 % in 2006 (Shostak, 2012). Total
gross government debt as a percentage of GDP was 38.7 % at the start of the millennium,
steadily reducing to a low of 27.7 % in 2007. Therefore, it is evident that government fiscal
policy was not the issue here, it only became an issue after the crash. Total gross government
debt as a percentage of GDP almost doubled in 2008 to 47.5 % and by the end of the decade
it was 83.5 %. Total gross government debt only rose when Ireland decided to bail out its
banking system (OECD, 2016).
Figure 6: Total gross government debt of Ireland as a % of GDP (2000–2016)
Source: OECD (2016).
2.1.3 Italy
In sharp contrast to today, Italy initially had an economic miracle. It posted growth rates of
7.7 % per year from 1946 to 1962 and outpaced in industrial growth countries such as France,
West Germany and other Western nations. This transformation from a long period of fascism
and state control was rightly dubbed an economic miracle. At least a fifth of its then-50
million population moved from the backward and poor south to the more developed and
prosperous north. The rapid growth also put an end to Italian migration as over 20 million
had left the country in less than a century. The person to thank for this miracle was a classical
liberal economist by the name of Luigi Einaudi, who served as the Governor of the Central
Bank, Minister of Finance and later as President throughout his political career. He was a
fervent supporter of low taxes, free trade and deregulating a country in which the remnants
0%
20%
40%
60%
80%
100%
120%
140%
2000 2001 2002 2003 2004 2005 2006 2007 2008 2009 2010 2011 2012 2013 2014 2015 2016
Debt % of GDP

23
of fascist state control were still evident. Italy’s success was hailed by US president John F.
Kennedy in a speech and the Financial Times also dubbed the Italian lira as the most stable
Western Currency in 1959 (Falasca, 2012, 15–17).
However, during the 1960s, several programs were developed with the aim of redistributing
wealth and increasing equality in society. Such measures often translate to higher taxes and
increased government spending. In 1962, unions demanded shorter work weeks and more
vacation time to be mandated by the state. Soon thereafter Italy got its first left-of-center
government as the Partito Socialista Italiano started to gain power. Several other changes
were undertaken such as ignoring the constitutionality of a balanced budget and by the
1970s, Italy’s budget deficit was around 8 % of GDP. The Bradolini Act was passed in 1969
which reformed the pension system by allowing people to retire much earlier and also greatly
lowered the standard for disability pensions. Furthermore, a Workers’ Statue was passed
during the 1970s in which one article required a long and arduous process of establishing
evidence that a worker has to be fired, or otherwise he must remain in the firm. The
engineering and metal sectors also received mandatory working times, thereby disallowing
individuals who would like to work more to do so. The healthcare system, which was
completely funded by taxes, was also nationalized in the 1970s. As evident, the policies
undertaken by Italy from the 1960s thereafter were in sharp contrast to how its economy
looked in the years right after the war (Falasca, 2012, 17–19).
The anti-business climate continued well into the 1980s as more and more regulations began
to be introduced combined with increased fiscal spending that created an uncertain
environment. As a result, there was widespread unemployment in the private sector,
especially in the south. To solve the unemployment issue, the government began employing
more and more civil servants, increasing public expenditure by massive amounts – rising
from 32.7 % of GDP in 1970 to 56.3 % in 1993. Funding for all of this public expenditure
was made possible with high taxes, which caused the aforementioned unemployment
problems, the constant printing of the Lira and lastly, with debt. The printing of the Lira
made Italian firms competitive in the export market but this soon came to an end by the
1980s. Debt as a percentage of GDP was around 30 % during the 1950s and 1960s, but had
reached a massive 121.8 % of GDP in 1994. Although attempts were made during the 1990s
to introduce privatization and liberal reforms, Italy’s economy was based on government
control and as such was fundamentally flawed (Falasca, 2012, 15–20). As a result, going
into the new millennium, Italy was burdened by a heavy welfare state, combined with
corruption and without fiscal discipline. Total government gross debt as a percentage of GDP
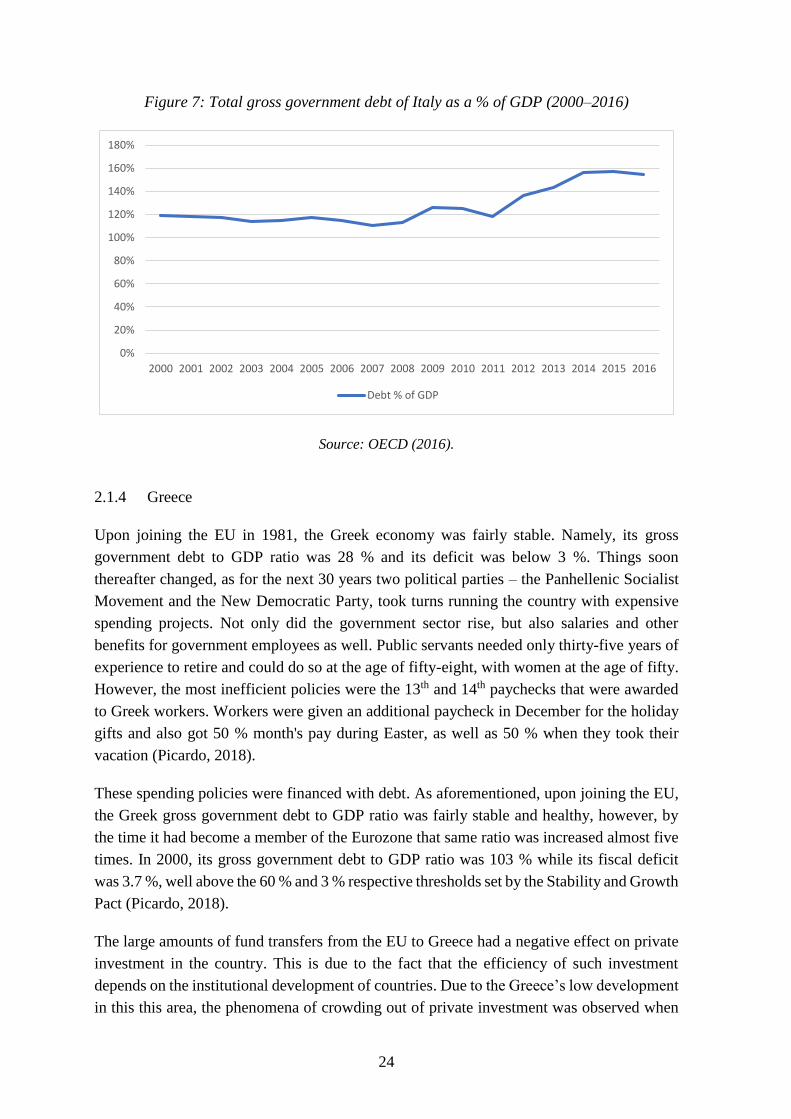
was 119 % in 2000, however, by the end of the decade it had risen to 126 % of GDP (OECD,
2016).
24
Figure 7: Total gross government debt of Italy as a % of GDP (2000–2016)
Source: OECD (2016).
2.1.4 Greece
Upon joining the EU in 1981, the Greek economy was fairly stable. Namely, its gross
government debt to GDP ratio was 28 % and its deficit was below 3 %. Things soon
thereafter changed, as for the next 30 years two political parties – the Panhellenic Socialist
Movement and the New Democratic Party, took turns running the country with expensive
spending projects. Not only did the government sector rise, but also salaries and other
benefits for government employees as well. Public servants needed only thirty-five years of
experience to retire and could do so at the age of fifty-eight, with women at the age of fifty.
However, the most inefficient policies were the 13th and 14th paychecks that were awarded
to Greek workers. Workers were given an additional paycheck in December for the holiday
gifts and also got 50 % month's pay during Easter, as well as 50 % when they took their
vacation (Picardo, 2018).
These spending policies were financed with debt. As aforementioned, upon joining the EU,
the Greek gross government debt to GDP ratio was fairly stable and healthy, however, by
the time it had become a member of the Eurozone that same ratio was increased almost five
times. In 2000, its gross government debt to GDP ratio was 103 % while its fiscal deficit
was 3.7 %, well above the 60 % and 3 % respective thresholds set by the Stability and Growth
Pact (Picardo, 2018).
The large amounts of fund transfers from the EU to Greece had a negative effect on private
investment in the country. This is due to the fact that the efficiency of such investment
depends on the institutional development of countries. Due to the Greece’s low development
in this this area, the phenomena of crowding out of private investment was observed when
0%
20%
40%
60%
80%
100%
120%
140%
160%
180%
2000 2001 2002 2003 2004 2005 2006 2007 2008 2009 2010 2011 2012 2013 2014 2015 2016
Debt % of GDP
25
it came to EU funds (Katsaitis & Doulos, 2009). As aforementioned, Greece, along with
several other peripheral countries, suffered from institutional quality levels which is a likely
explanation for this (Jurlin & Čučković, 2010). The Institutional Quality Index also
deteriorated greatly since 2006, which further exacerbated the issue (Kouretas & Vlamis,
2010). Overall, the Greek economy was not based on a fundamental free-market platform.
Rather, it was based on government intervention. In the post-crisis period, the initial 50 basis
point spread had turned into a 3300 basis point spread between the Greek and the German
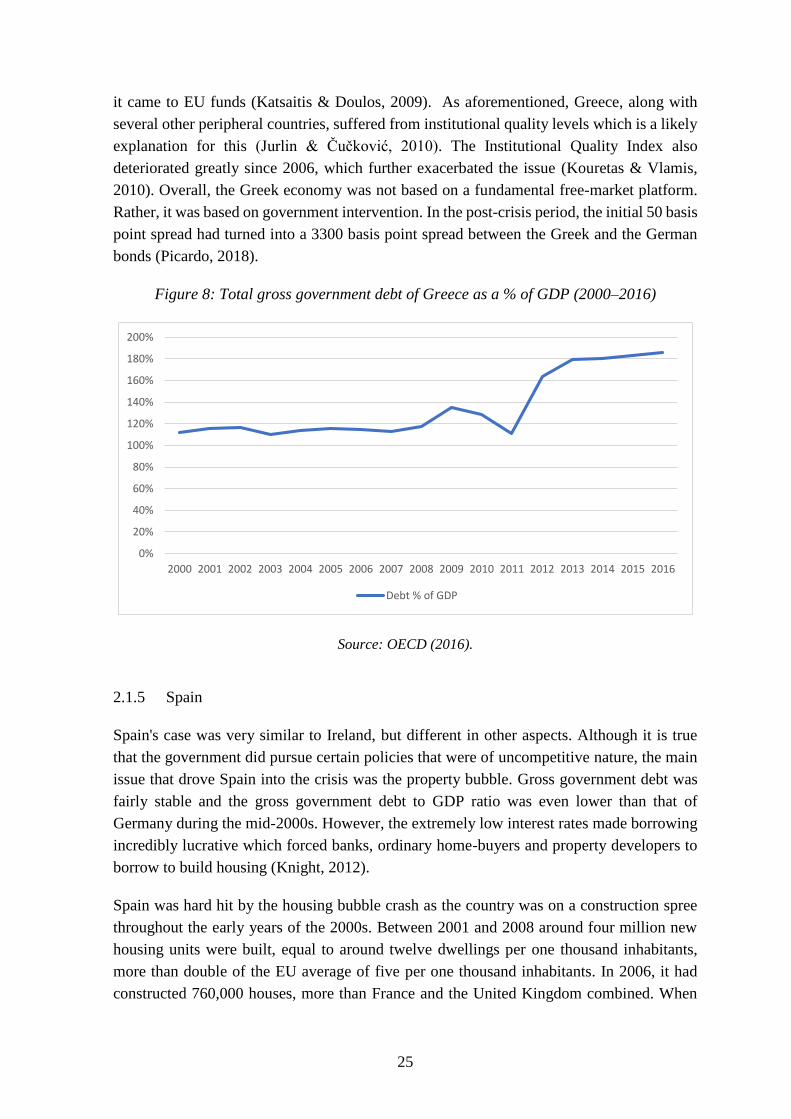
bonds (Picardo, 2018).
Figure 8: Total gross government debt of Greece as a % of GDP (2000–2016)
Source: OECD (2016).
2.1.5 Spain
Spain's case was very similar to Ireland, but different in other aspects. Although it is true
that the government did pursue certain policies that were of uncompetitive nature, the main
issue that drove Spain into the crisis was the property bubble. Gross government debt was
fairly stable and the gross government debt to GDP ratio was even lower than that of
Germany during the mid-2000s. However, the extremely low interest rates made borrowing
incredibly lucrative which forced banks, ordinary home-buyers and property developers to
borrow to build housing (Knight, 2012).
Spain was hard hit by the housing bubble crash as the country was on a construction spree
throughout the early years of the 2000s. Between 2001 and 2008 around four million new
housing units were built, equal to around twelve dwellings per one thousand inhabitants,
more than double of the EU average of five per one thousand inhabitants. In 2006, it had
constructed 760,000 houses, more than France and the United Kingdom combined. When
0%
20%
40%
60%
80%
100%
120%
140%
160%
180%
200%
2000 2001 2002 2003 2004 2005 2006 2007 2008 2009 2010 2011 2012 2013 2014 2015 2016
Debt % of GDP

26
the stock market crashed there were around 700,000 housing units in 2009 which were
completed but remained unsold. Many of the houses built were not primary residences, but
rather secondary ones aimed at being tourist villas and hotels. Spain had been actively
promoting its tourist markets for decades as more competitive locations were opened to
tourists in the 1980s. Not only was housing pushed, but also theme parks and other
attractions for foreigners (Concheiro, 2012).
Much of this was made easy by the aforementioned cheap credit policies that made
government debt also very lucrative, however, Spain’s gross government debt as a
percentage of GDP was not such a big issue (Bagus, 2011, 48). On the other hand, between
1996 and 2007, property prices in Spain tripled (Knight, 2012). Gross government debt was
65.2 % of GDP in 2000, dropping to a low of 41.8 % in 2008. As the housing bubble was so
enormous, there was widespread unemployment after its crash, which led to massive fiscal
stimulus. Debt as a percentage of GDP began to rise and by the end of the decade had
increased to 66.6 % (OECD, 2016). Although it is true that the country had run budget
surpluses prior to the crash, indicating that it might not have been as fiscal irresponsible as
neighboring Portugal, the reality is wholly different. The budget surpluses were due to the
increased tax revenues from the housing bubble, government spending increased at an
average rate of 7.6 % from 2000 to 2009 (Hidaglo, 2012). Furthermore, although government
spending was 39.2 % of GDP in 2000 and exactly the same figure in 2007 – indicating fiscal
prudency, this was partly due to the high GDP growth rate that Spain experienced as a result
of the housing bubble. Once the economy came to a stop in 2008, government spending
jumped 2.3 percentage points. Therefore, government spending did not remain constant
because the government was pursing liberal policies and thereby spending little, but due to
the artificially high GDP growth rates (Rallo, Oro, & Marti, 2012).
Although much of the boom was attributed to the private sector, the government did have a
hand in fostering it to an extent. Most of these instances were related to laws pertaining
banking which impacted the housing bubble. Laws allowed banks to loan up to 100 % of the
cost of the home, therefore not requiring any down payment. This allowed individuals with
no stable income to borrow homes on 30 or even 50-year mortgages. Furthermore, banks
were permitted to collect a defaulted mortgage loan even after seizing one’s property.
Politicians also heavily fostered borrowing as there were more kilometers of high speed rail
built and under construction than in any other country apart from China. Governments, both
local and central, also backed the building of airports, bridges and other projects with
subsidies. Many of these projects remained abandoned such as the airports in Ciudad Real
and Castellon (Alvarez, 2018).
Furthermore, apart from the housing bubble, Spain suffered a labor market bubble as well,
as wages rose at an alarming pace. Labor costs rose 40 % to relative levels in Germany from
2000 to 2010. This made exports incredibly expensive and further deteriorated Spain’s
competitiveness. Due to the fact that Spain partakes in the Euro, it can no longer print money
and further devaluate it to boost exports. The unemployment levels post-crisis, reaching as
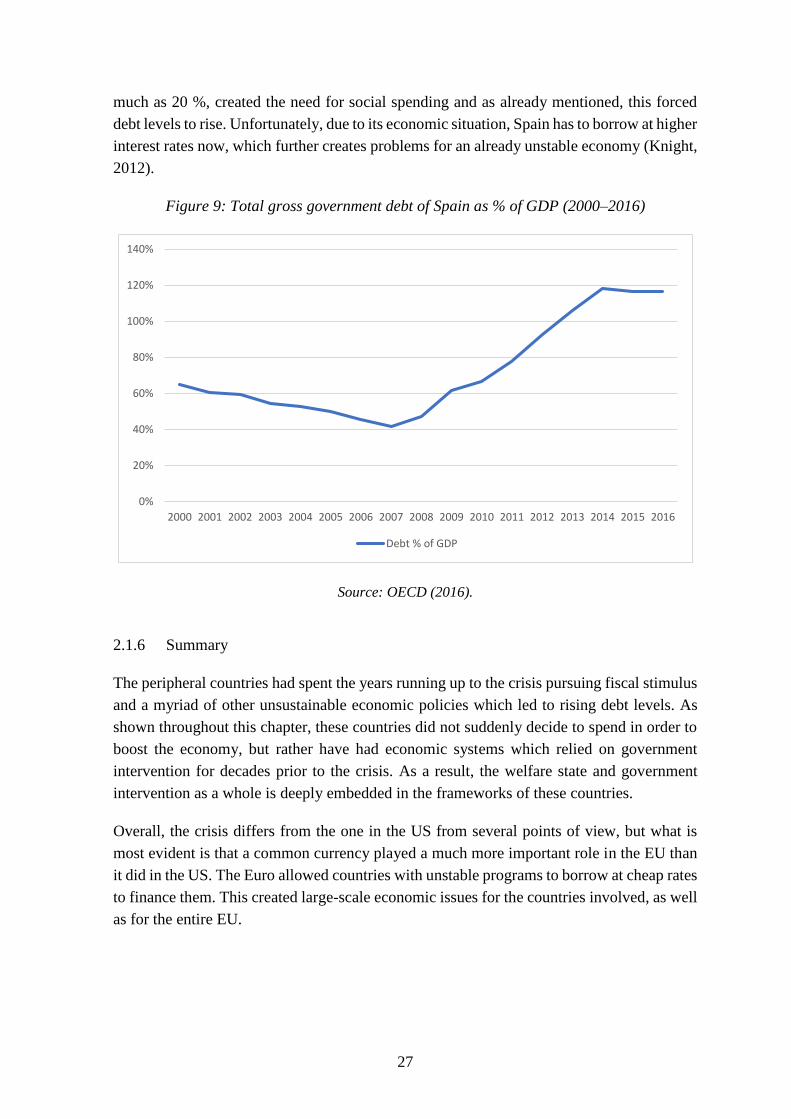
27
much as 20 %, created the need for social spending and as already mentioned, this forced
debt levels to rise. Unfortunately, due to its economic situation, Spain has to borrow at higher
interest rates now, which further creates problems for an already unstable economy (Knight,
2012).
Figure 9: Total gross government debt of Spain as % of GDP (2000–2016)
Source: OECD (2016).
2.1.6 Summary
The peripheral countries had spent the years running up to the crisis pursuing fiscal stimulus
and a myriad of other unsustainable economic policies which led to rising debt levels. As
shown throughout this chapter, these countries did not suddenly decide to spend in order to
boost the economy, but rather have had economic systems which relied on government
intervention for decades prior to the crisis. As a result, the welfare state and government
intervention as a whole is deeply embedded in the frameworks of these countries.
Overall, the crisis differs from the one in the US from several points of view, but what is
most evident is that a common currency played a much more important role in the EU than
it did in the US. The Euro allowed countries with unstable programs to borrow at cheap rates
to finance them. This created large-scale economic issues for the countries involved, as well
as for the entire EU.
0%
20%
40%
60%
80%
100%
120%
140%
2000 2001 2002 2003 2004 2005 2006 2007 2008 2009 2010 2011 2012 2013 2014 2015 2016
Debt % of GDP

28
2.2 Structural Problems of the Euro
Table 3 outlines some of the key issues with regards to the Euro.
Table 3: Description of problems of the Euro
Problem Description
Heterogeneity & Labor Mobility
The Euro covers a wide area where
people do not speak the same
language nor share the same culture,
therefore impairing real labor
mobility when crises occur.
Competition Policy
Countries are not able to compete on
monetary policy. Purposeful
devaluations by the Central Bank,
for example, could be useful for a
country’s exports.
Monetary Policy
The ECB pursued an expansionary
monetary policy at the beginning of
the 2000s. This is similar to what
happened in the United States as
well.
Source: Bagus (2011); Friedman (1997).
2.2.1 Heterogeneity and Labor Mobility
Socio-economic factors of the EU reveal the fragility of the Euro. Because it covers such a
wide array of people and regions, it is difficult for them to make mobility adjustments at the
onset of a crisis. It would become increasingly difficult for someone from a northern
European country to move to a southern one due to various socio-economic reasons, the
most important one being language and culture. In addition, there are other factors in play
that prevent mobility such as labor laws, some cultural patterns surrounding employment,
licenses and a myriad of other hindrances to achieve the same labor mobility in the EU that
exists in the US. The United States also has a single currency, the US Dollar. Although the
states may vary in their individual policies, they all speak the same language and state
policies are more alike than those of the EU – meaning that a New Yorker can travel easily
to Los Angeles to find a job, despite the two of them being several time zones apart. As a
result, a common currency in Europe would be better suited amongst countries such as
Germany, Austria or even the Netherlands due to their shared historical heritage and more-
or-less even economic standing (Friedman, 1997). Protestant countries in the north have
been historically more in favor of capitalism and free markets rather than government control
(Weber, 1930). Many of the countries in Western Europe had the foundation of the Roman
Empire to build on, whereas Eastern European countries had their economies ruined by fifty
years of communist rule (Sowell, 2016). Overall, the cultural differences between the EU

29
are much larger than those in the United States, hence why a common currency would not
be as effective.
Upon consulting empirical data from 2010 regarding labor mobility in the EU in the post-
crisis period it is evident that the numbers are striking vis-à-vis the United States. Mobility
between the EU member states is only around 0.25 % of the total EU population. Even
mobility between 15 member states which are considered to be older ones is low, roughly 1
%. On the other hand, labor mobility in the United States as a whole trumps the mobility in
the EU – standing at almost 2.5 %, around ten times higher than the mobility between EU
states. Even if only looking at the mobility in the United States just as mobility between the
four main regions (West, Midwest, South and Northeast), rather than mobility between all
of the 50 states, the number comes to slightly above 1 %. – still above what the EU stands
at. Even later data, namely from 2011 to 2012 revealed that United States labor mobility was
2.7 %, whereas in the EU it was only 0.2 %. In fact, intra-EU labor mobility is lower than
the percentage of non-EU migrant workers in the EU labor force which stands at 4.3 %.
During 2000 to 2010 labor mobility fell 41 % when compared to the previous years. Labor
outflows to other EU countries right afterwards were most prominent in countries with the
highest economic distress – such as Spain and Greece (Andor, 2014). These numbers prove
that the EU cannot ease a crisis by transferring employment from one area to the other as
efficiently as the United States can.
Figure 10: Annual cross-border mobility as a % of total population in the EU versus the
US
Source: Andor (2014).
2.2.2 Competition Policy
The Euro also does not allow member states to compete on monetary policy. As discussed
throughout the paper, it has become evident that central banks are the culprit behind some
serious economic downturns and if a country could avoid such trouble by managing its
central bank better, it would attract more investments and capital because investors know
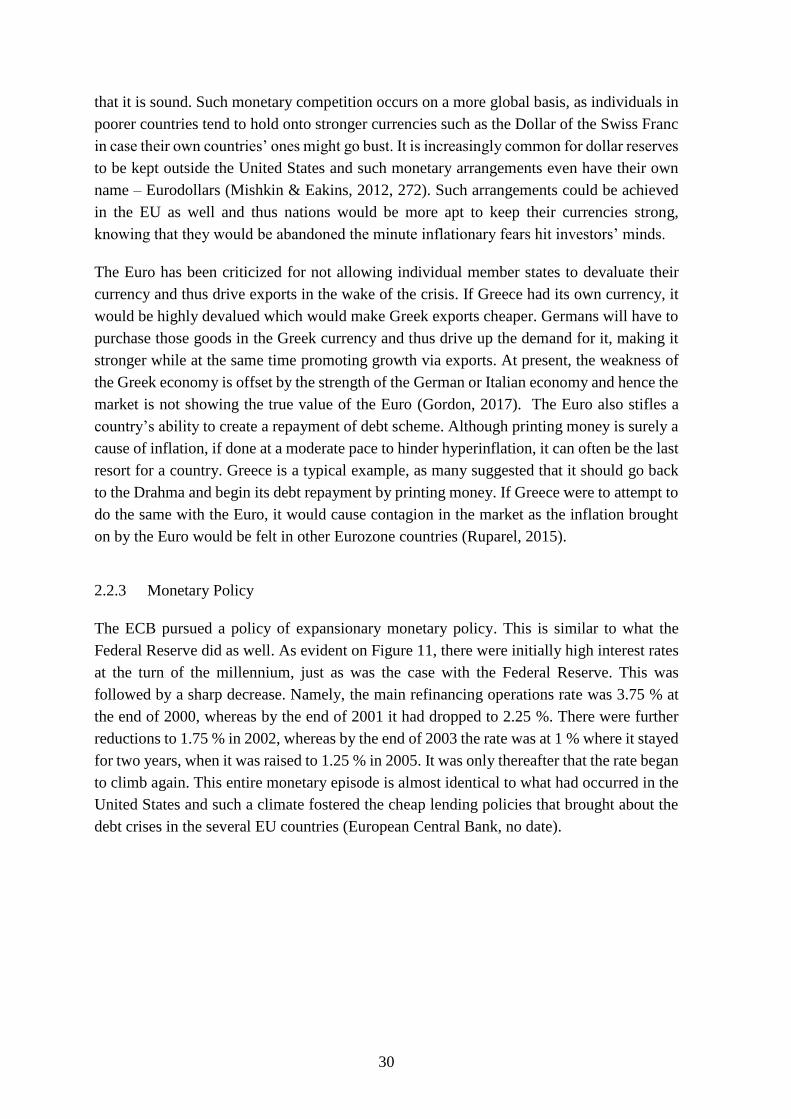
30
that it is sound. Such monetary competition occurs on a more global basis, as individuals in
poorer countries tend to hold onto stronger currencies such as the Dollar of the Swiss Franc
in case their own countries’ ones might go bust. It is increasingly common for dollar reserves
to be kept outside the United States and such monetary arrangements even have their own
name – Eurodollars (Mishkin & Eakins, 2012, 272). Such arrangements could be achieved
in the EU as well and thus nations would be more apt to keep their currencies strong,
knowing that they would be abandoned the minute inflationary fears hit investors’ minds.
The Euro has been criticized for not allowing individual member states to devaluate their
currency and thus drive exports in the wake of the crisis. If Greece had its own currency, it
would be highly devalued which would make Greek exports cheaper. Germans will have to
purchase those goods in the Greek currency and thus drive up the demand for it, making it
stronger while at the same time promoting growth via exports. At present, the weakness of
the Greek economy is offset by the strength of the German or Italian economy and hence the
market is not showing the true value of the Euro (Gordon, 2017). The Euro also stifles a
country’s ability to create a repayment of debt scheme. Although printing money is surely a
cause of inflation, if done at a moderate pace to hinder hyperinflation, it can often be the last
resort for a country. Greece is a typical example, as many suggested that it should go back
to the Drahma and begin its debt repayment by printing money. If Greece were to attempt to
do the same with the Euro, it would cause contagion in the market as the inflation brought
on by the Euro would be felt in other Eurozone countries (Ruparel, 2015).
2.2.3 Monetary Policy
The ECB pursued a policy of expansionary monetary policy. This is similar to what the
Federal Reserve did as well. As evident on Figure 11, there were initially high interest rates
at the turn of the millennium, just as was the case with the Federal Reserve. This was
followed by a sharp decrease. Namely, the main refinancing operations rate was 3.75 % at
the end of 2000, whereas by the end of 2001 it had dropped to 2.25 %. There were further
reductions to 1.75 % in 2002, whereas by the end of 2003 the rate was at 1 % where it stayed
for two years, when it was raised to 1.25 % in 2005. It was only thereafter that the rate began
to climb again. This entire monetary episode is almost identical to what had occurred in the
United States and such a climate fostered the cheap lending policies that brought about the
debt crises in the several EU countries (European Central Bank, no date).

31
Figure 11: Main refinancing operations rate of the ECB (2000–2009).
Source: European Central Bank (no date).
3 POST-CRISIS ASSESSMENT
3.1 Overview
As stated in the beginning of the thesis, the US recovered faster than the EU. Several EU
countries have been experiencing harsher economic conditions than the US due this overall
slower recovery process. The unemployment rate in the US in 2009 hit 10 %, but has
declined since by over 5 %. On the other hand, Eurozone unemployment rates have been in
double digits during the same time frame (Invstr, 2017). It was only in 2017 that rates fell
below those of 2009. However, some peripheral countries, which were hardest hit by the
crisis, still had unemployment rates that were in double digits. Namely, Greece’s
unemployment rate was at 21.7 %, Spain’s unemployment rate was at 17.1 % and Italy’s
unemployment rate was at 11 % (Bowman, 2017). On the other hand, it was 2014 when US
unemployment fell below 6 % for the first time since 2008. This means that it took essentially
six years for unemployment numbers to recover in the United States, compared to eight years
in the Eurozone. This is provided that the start of the US crisis is viewed to be 2008 and in
the Eurozone 2009 (Moore, 2014).
0.00%
1.00%
2.00%
3.00%
4.00%
5.00%
Fixed rate tenders Variable rate tenders (minimum bid rate)

32
Figure 12: Stock market and GDP performance in the US versus the Eurozone
Source: Kang, Ligthart & Mody (2016).
In order to asses these differences as well as to evaluate the responses overall, several
policies must be analyzed in detail:
Table 4: Comparison of the responses between the US and the EU
Policy US vs EU
Government Bailouts
The US instituted the TARP
(Troubled Asset Relief
Program), fostered the sale of
several troubled financial
institutions such as Merrill
Lynch.
EU had bailouts of banking
systems such as those in Ireland,
but the primary response was
bailing out the economies of
several countries such as Greece
and Portugal.
Legislation
US instituted the Dodd-Frank
Act to overhaul the workings of
Wall Street.
Deeping of the Eurozone through
the European Banking Union,
European Stability Mechanism,
European Systemic Risk as well
as other measures.
Table continues

33
Table 4: Comparison of the responses between the US and the EU (continued)
Stimulus Packages
US instituted a stimulus package
under President Barack Obama
in 2009 worth $787 billion.
Several EU countries underwent
stimulus packages, such as
Germany, France, the United
Kingdom. However, policy
response was centered on
austerity in the peripheral
countries.
Austerity Measures
US focused on stimulus
programs, rather than austerity
measures.
In the EU austerity measures
were largely taken in peripheral
countries.
Monetary Policy
The Federal Reserve and the
ECB pursued an expansionary
monetary policy, although the
initial policy pursued by the
ECB was contractionary.
US instituted quantitative easing
(QE) program much earlier and
brought the policy rate much
lower than the ECB.
Source: Bagus (2012); BBC (2012); Sowell (2009); Melander (2010); Schnabl & Stratmann,
(2019); The Economist (2017); Tumpel-Gugerell (2009).
3.2 Government Bailouts
An economist may object to bailouts on several points. Firstly, individuals and businesses
should be responsible for their business and financial mistakes. Secondly, if government
wants to bail anyone out, it has to get this money either through higher debt, higher taxes or
by monetizing it. All three instances increase the overall economic distress in a country.
There is a myriad of other ways to refute the idea of bailouts, but the primary concern with
them is the fact that they give the wrong incentive structure, as players in the financial market
know that the government will step in to save them from bad decisions. However, even the
staunchest classical liberal can make a case for bailouts if the initial incentives given to
players in the market were essentially the workings of the government. Therefore, it is the
government’s fault that those same companies that now need bailouts are in financial distress
in the first place. As noted throughout the thesis, it was to the government that urged banks
to issue mortgages to people with low credit scores or face repercussions. Therefore, as
evident, the debate surrounding bailouts is not very simple. Because of this, the thesis will

34
treat the issue of bailouts as a necessary evil. Instead of focusing on whether bailouts were
needed or not, the thesis will rather asses as to how the United States and the European Union
dealt with this necessity and how they administered these bailouts.
The United States initiated the Troubled Asset Relief Program (TARP) which was arguably
the core of its policy response. The US government enacted the Emergency Economic
Stabilization Act of 2008, which authorized the Secretary of Treasury to purchase distressed
assets such as mortgage-backed securities as well as supply banks, both domestic and
foreign, with cash injections through the Troubled Asset Relief Program. The original
amount of $700 billion was later reduced to $426.4bn. The program lasted six years and it
ended with the government’s sale of its stake in Ally Financial in 2015. Although the plan
did bring stability, it also paved the way for further government intervention that was created
during the administration of President Barack Obama. One of the reasons why the program
led to a call for further government intervention is its supposed success in the rate of profit
it has achieved. The Treasury has stated that tax payers have recovered $441.7 billion,
implying a profit of slightly more than $15 billion. This number is expressed nominally,
however, the rate of return on an annualized basis is 0.6 %. This number is lower than the
returns on most Treasury Bills. Furthermore, when taking into account inflation, the 2015
value of $441.7 billion translates to $402.71 billion in 2008 dollars, implying a net loss of
$24 billion. Due to the fact that TARP amounts were paid at different times, an average
inflation rate of 2 % was used over the period (Palumbo, 2015). Another failure of the
program is that the recipients of TARP returned what they did only by taking additional
loans from the government. Namely, during the first phase of TARP, the Capital Purchase
Program, banks repaid $211.5 billion from the $204.9 that they received originally.
However, almost a half of the banks that repaid this money did so by borrowing from other
TARP programs. The most prominent program from which they borrowed was the
Community Development Capital Initiative (Gongloff, 2012). More than $2 billion of
federal money that was handed out with the intention of spurring lending to small businesses
was used by banks to repay the Troubled Asset Relief Program (Maltby & Loten, 2011).
Some of the key financial institutions in the US were highlighted during the bailout
proceedings, namely Lehman Brothers, Bear Sterns, Merrill Lynch and AIG. All of them
shared different faiths in the end, however, all but Lehman Brothers were not allowed to fail.
Bear Steans was bought out by rival bank JP Morgan at a stock-for-stock valuation for just
$2 a share. This is a discount price of higher than 90 % when applied to its closing price just
two days earlier. The total deal was worth $236 million, in sharp contrast to Bear Stearns’
pre-crisis market capitalization of $140 billion. However, JP Morgan does not deserve all of
the credit, the Federal Reserve backed the deal with $30 billion to fund Bear Stearns’ less-
liquid assets (Clark, 2008). AIG, the giant of the American insurance industry, was hard hit
due to its exposure to credit default swaps and thus exposing itself to the mortgage-backed
securities market. The Federal Reserve helped the company out with a $85 billion emergency

35
loan to keep the company afloat. The investment banking giant Merrill Lynch was handed
to Bank of America to form Bank of America Merrill Lynch (Mathiason, 2008)
The ad hoc policy of letting one institutional fail, while others remain afloat may appear to
be controversial. However, Lehman Brothers simply did not have enough collateral to cover
the loans, according to Secretary of Treasury Henry Paulson. This statement was affirmed
by former Federal Reserve Chairman Ben Bernanke and President of the New York Federal
Reserve Bank Timothy Geithner, all of whom had the power to administer the loan (Ball,
2018). The failure of Lehman is in fact a positive aspect of the controversial bailout process
and one in which the US allowed itself to differ from the EU. As discussed, a bailout is
essentially allowing tax payers to pay for the failures of a company. Financial distress is a
scenario that happens on a daily basis amongst small and medium size enterprises. Therefore,
there should be no reason why a firm, regardless of how large it is, should not be allowed to
go bankrupt. It also cemented the fact that the US, although was willing to administer certain
bailouts, was not pursuing such a cheap money program as would go on to happen in the EU
with multiple bailouts of the Greek economy.
Bailout programs in the EU were of similar nature, but albeit slightly different. Although the
EU did suffer from the housing bubble crash, the true economic downturns started coming
about in 2009 when the EU began ordering countries such as France, Spain, Ireland and
Greece to reduce their deficits. Soon thereafter it was revealed that Greece’s debts have
surpassed €300 billion, the highest in modern history (BBC, 2009). The Greek government
initially promised that it will not need to be bailed out. However, the sheer size of the
economic distress that the Greek economy was involved in was soon shown. It was revealed
that due to accounting irregularities, Greece’s budget deficit from 2009 was revised from 3.7
% to 12.7 % (Barber, 2010). Despite austerity measures and other political backing, Greece
ended up getting bailed out in May of 2010 with a €110 billion package from the
International Monetary Fund and the EU (Hope, 2010). The aforementioned measures of
attempting to forestall the eventual collapse of the Greek economy did not work as the
overall system that the Greek economy was based on was flawed. Greece’s economy has not
been sound for decades and therefore a program that is intended to last only a few months
will not change it.
The economic help that was extended to Greece by the International Monetary Fund and the
EU set the stage for further bailouts of troubling economies in the EU. Furthermore, even
this initial bailout of Greece, despite its size and political backing, would not be enough. The
next country to be bailed out was Ireland, as investors became worried about the country’s
ability to repay its debts following the Greek turmoil. Ireland rested on a fairly liberal
economy. Its debt levels became unsustainable purely out of bailing out out its own banking
system following the housing bubble collapse. The country was given €85 billion in
November of 2010. However, the most striking fact was the fact that the average interest
rate that was to be paid was 5.8 %, which is slightly higher than Greece’s 5.2 %. Had this
difference occurred between Greece and Italy, two countries with similar unsustainable
36
policies that included a huge welfare state as well as a historic tendency towards debt, there
would be no surprise. Ireland, as aforementioned, was a more liberal economy compared to
Greece and as such its recovery time was expected to come much sooner. Therefore,
charging both countries very similar rates seemed controversial. However, upon closer
scrutiny, it would appear as if the higher rate was charged purely out of scaring away other
countries from taking what was considered to be cheap debt. In fact, Germany had initially
pushed for a 7 % interest rate on Ireland’s debt (Hume, 2010).
Realizing the imminent dangers of the economic downturn that the EU has entered, a
permanent bailout fund was created of €500 billion called the European Stability Mechanism
in February of 2011. It replaced two earlier programs which were the European Financial
Stabilization Mechanism and the European Financial Stability Facility. Both of these
programs had similar purposes and at the time were allowed to continue the already-
administered bailout packages (Pignal, 2011). Another Eurozone bailout was initiated in
May of 2011. Portugal received €78 billion, cementing the notion that the peripheral
economies were the most vulnerable. Despite the largest bailout of the three countries, the
Greek economy was still in trouble a year after the initial bailout. Because of this, a set of
strict austerity measures were undertaken in the country in hopes of getting the country back
on its track. However, these measures had little success as even talks began to spread
surrounding Greece exiting the Eurozone. Soon after the last tranche of Greece’s initial
bailout was administered, a second bailout was imposed worth €109 billion. The European
Central Bank also began buying Italian and Spanish government bonds, with Italy passing
austerity measures. A myriad of other political as well as economic measures were taken
with the same context, such as the ECB buying bonds from banks (BBC, 2012). Furthermore,
countries who were exposed to the debt of peripheral countries were just as exposed to their
economic downturns and required bailouts themselves. The most prominent example is
Cyprus, which had great exposure to Greek government debt and as such it, too, greatly
suffered during the crisis in Greece. The country received a €10 billion bailout in 2013
(Spiegel, 2013).
When discussing the issue of bailouts, speed is a key factor. Although the United States has
had its fair share of problems, the government and the Federal Reserve stepped in quickly
and took measures that, although unpopular, tried to get the financial system back into shape
as soon as possible. Several banks were sold off to others, such as Merrill Lynch, while
others received injections from the government. All of this was, objectively speaking,
achieved in a very short time span. The Eurozone is different, with problems being present
many years after the crisis. For example, as late as 2016, the Italian bank Monte dei Paschi
di Siena was filled with hundreds of billions of Euros in bad loans and needed a massive
bailout. This further cemented the fact that many European banks faced structural problems
almost a decade after the crisis. Portuguese banks faced similar issues as a Moody’s report
stated that the mild economic recovery of two years was not enough to make Portuguese
banks worthy prospects in 2016. The report also mentioned that Portuguese banks were

37
among the worst capitalized and the prospects over the next short period were very grim.
Such problems would not be occurring had the issue of banking been handled more quickly
and efficiently, as was the case in the US (Invstr, 2017).
More specifically, one of the reasons for the faster recovery of US banks has been the
Troubled Asset Relief Program which forced equity injections by the US government for
companies in difficulty. What is most important is the speed by which the injection was
administered, the majority being in 2009, whilst 2008 and 2010 saw their fair share as well.
The years following only saw minimal injections. On the other hand, the EU has injected
capital at a much slower pace, only injecting substantial blocks in 2008 and 2009 (The
Economist, 2017).
3.3 Regulatory Responses
One of the most important issues after every crisis is to assess whether the country has
realized what the actual causes of said crisis were. In this case, government intervention was
the deciding factor in kicking off the housing bubble in the US, while fiscal irresponsibility
triggered the debt crisis in Europe. Therefore, the only way to stop a future crisis from
happening is to end all such interventions which contributed to the crisis and build an
economy that rests on a free market, rather than government intervention. Although the EU
and the US did implement certain changes that were on a positive note, such as austerity
measures, the majority of the causes of the crisis have not been addressed. As a result, a
series of legislative actions have been taken to increase government oversight of the
economy, rather than decrease it.
The initial legislative response in the United States was the Emergency Economic
Stabilization Act of 2008, signed under president George W. Bush. This act brought about
the Troubled Asset Relief Program. As TARP was discussed at length in a previous sub-
chapter, the focus will now be on subsequent legislation that followed the TARP program.
The first significant act, passed in February of 2009 under president Barack Obama, was the
American Recovery and Reinvestment Act. It was a stimulus package with the aim of saving
existing jobs, providing relief and creating as many new jobs as possible. The aim was to
put $787 billion into the American economy, especially focusing on small businesses. The
number was revealed to be much higher in 2012 at $831 billion (Amadeo, 2018). The idea
of a stimulus package is flawed. Firstly, the US had just spent a substantial amount bailing
out its troubled banks. This was itself a largely unpopular plan due the fact that taxpayers
bore the cost. Secondly, such a plan is a sure downfall for the economy as it was precisely
due to government intervention that the economy entered into downturn in the first place.
Any recovery packages ought to have been primarily focused on ending government
intervention in the housing market, rather than creating more government programs. In fact,
the complete opposite happened with regards to government intervention in the housing
sector. For example, in 2009, the Federal Housing Administration expanded business by four

38
times compared to 2006. At the same time, more than one in six borrowers who had taken
mortgages under various Federal Housing Administration programs were missing payments.
Congress also made several regulatory changes that favored the Federal Housing
Administration such as giving tax breaks for first-time home buyers (Higgs, 2009).
Some specific measures that the American Recovery and Reinvestment Act introduced were
an additional $250 to recipients of various Social Security programs, as well other benefits
such as extending unemployment benefits. Close to $100 billion was spent on public works
projects. Namely, $46 billion was spent on transportation and transit, $31 billion to
modernize federal buildings and $6 billion on water projects. A report stated that such
projects created close to twenty thousand jobs for each billion spent. However true this may
be, there is a difference between working for the sake of statistics and efficient work, with
the latter issue not being assessed. The program might have created twenty thousand jobs,
however, if the same could have been accomplished by employing only ten thousand people
then the program was a failure from a profit-based analysis. Other programs, whose costs
ran into the tens of billions, were also undertaken to fund education, healthcare and small
businesses (Amadeo, 2018). Such stimulus programs, especially healthcare related ones, are
dangerous in the sense that they set the precedent for future expansion in these areas. It
creates a permanent government program, rather than just a temporary stimulus.
Apart from the American Recovery and Reinvestment Act of 2009, other legislative acts
were passed with the most prominent one being the Dodd–Frank Wall Street Reform and
Consumer Protection Act of 2010. This act attempted to overhaul the entire financial system
of the United States and increase government oversight over it. The problem with the Dodd-
Frank bill is its nature. The act blames the crisis on the financial players in the market which
is evident in its primary objective, which is, as aforementioned, to increase oversight over
the economy. The string of regulations imposed by the Dodd-Frank Act affected smaller
banks via increased costs. These regulations forced consumers to pay higher costs as banks
were required to follow stricter regulatory guidelines. For example, the threshold of $50
billion over which banks were exposed to more regulatory scrutiny was incredibly low (a
recent reform has set the number to $250 billion) (Vartahan, 2018). Costs were raised in
general via a string of regulations that increased the compliance costs per customer. Caps on
interchange fees, among other restrictions, have increased the usage costs of debit cards for
banks. These costs are among the main ones that institutions have transferred onto the
consumer. Such increased costs also protect already-established banks from outside
competition, as new entrants find it costly to enter the market (Bishop, 2017a). Namely, only
six new banks have been chartered from 2011 to 2017, compared to more than one hundred
per year in the years prior to the crisis, as evident on Figure 13.

39
Figure 13: New FDIC-insured commercial bank charters in the US (2000–2017)
Source: Statista (2017b).
Furthermore, the overall number of banks has also been going down, from 7061 in 2008 to
4909 in 2017, as evident on Figure 14.
Figure 14: Number of FDIC-insured commercial banks in the US (2000–2017)
Source: Statista (2017a).
188
125
90
110120
167177 175
90
24
50 0 1 0 1 0
5
0
20
40
60
80
100
120
140
160
180
200
2000 2001 2002 2003 2004 2005 2006 2007 2008 2009 2010 2011 2012 2013 2014 2015 2016 2017
New FDIC-insured banks
7870 7750 7612 7507 7380 7262 70616813
65066263 6061 5836
55965330
5102 4909
0
1000
2000
3000
4000
5000
6000
7000
8000
9000
2002 2003 2004 2005 2006 2007 2008 2009 2010 2011 2012 2013 2014 2015 2016 2017
Number of FDIC-insured banks

40
Due to high costs imposed by such regulations, it is simply not profitable to run a business
and in addition, the high costs of entering the industry deter potential new entrants. A
common objection may be that the number of banks might have decreased, but it was simply
due to banks being involved in mergers and acquisitions (M&A) themselves. However, the
number of bank consolidations has in fact gone down since the crisis (McLannahan, 2018).
Dodd-Frank also imposed the controversial Volcker Rule which banned banks from
proprietary trading and limited investments in hedge funds as well as private equity. The
logic behind passing the Volcker rule was an attempt to construct a division in banking,
much similar to the one made by the Glass-Stegall Act of 1933. The act wanted to separate
the risky operations of a bank from the safe ones. However, despite its original intentions, it
painted certain financial instruments, which are incredibly safe when used properly, as
speculative and unsafe. The primary example are derivatives, which could be used to hedge
risks for a business and thereby greatly aid a business in avoiding financial trouble (Bishop,
2017b).
Figure 15 depicts the rise in the total federal government debt of the United States. As
evident, it has been rising ever since the revival of Keynesianism in the post-crisis period.
Debt levels rose at an almost unprecedented historical level during the post-crisis period.
Additional debt hinders economic growth due to increased debt payments as well as creating
an aura of uncertainty in the economy (U.S. Department of the Treasury, no date).
Figure 15: Total US federal government debt (1995–2018)
Source: U.S. Department of the Treasury (no date).
EU governments introduced an increase in deposit insurance ceilings, guarantees for bank
liabilities and guarantees for bank recapitalizations. The extent of all of these regulations
depended on a country to country basis. On the EU level as a whole, the European Systemic
Risk Board was introduced in 2010 with the aim of increasing oversight and monitoring risk
0
5,000,000
10,000,000
15,000,000
20,000,000
25,000,000
Jan
-66
Jul-
68
Jan
-71
Jul-
73
Jan
-76
Jul-
78
Jan
-81
Jul-
83
Jan
-86
Jul-
88
Jan
-91
Jul-
93
Jan
-96
Jul-
98
Jan
-01
Jul-
03
Jan
-06
Jul-
08
Jan
-11
Jul-
13
Jan
-16
Total Public Debt (millions)

41
in the financial system (Tumpel-Gugerell, 2009). Furthermore, the European Banking Union
was formed with the aim of making banks more resilient. It involved a set of initiatives that
aimed at strengthening regulatory measures, as well as rules for managing failing banks
(European Commission, no date a). Other measures, such as the European Stability
Mechanism were introduced. It played a key role during the bailouts (Pignal, 2011).
However, the overall issue in the EU was that legislative actions were aimed at banks, rather
than constitutional amendments to stop the amount of debt, as that is what caused the EU
crisis in the first place. Although the housing bubble impacted the EU, the main issue was a
string of unsustainable macroeconomic policies in several peripheral countries.
Another prominent regulatory framework that impacted both the European Union and the
United States were the Basel III accords. The issue that the Basel accords wanted to address
was the over-leverage of certain banks, which was an important factor during the crisis.
Basel aimed to solve this issue by a capital adequacy ratio, Tier 1 and Tier 2 capital.
Furthermore, Basel sought to rate the riskiness of certain assets that banks held. For example,
debt issued by Germany is bound to be safer than that of Greece and as such, this needs to
be reflected in banks’ ratios. Basel III failed to address some of the risk-weights of some of
the riskiest assets, which was a great criticism also of its predecessor Basel II. Basel II
encouraged banks to accumulate risky capital, whilst punishing lending to risky businesses.
The impacts of Basel translate, as all regulation do, to increased costs. It forbids competition
to enter into the market and thus drives costs up (The Economist, 2010). The problem with
Basel is that it encourages the building of a risk-free buffer through government bonds,
whose risk weights are close to zero. By promoting such a policy, all banks will essentially
have a very similar capital base and as such, they will be all exposed to the same problems.
This is contrary to having banks with diverse bases of capital and as such if there is trouble,
only banks who have invested in that troubled area will be affected. This could even be the
majority of banks, of course, but unlike with the Basel regulations, it will not certainly be
the entire system (Norberg, 2012).
Regulatory measures were developed with regards to speculation on the financial market,
more specifically short selling. The Securities and Exchange Commission banned short-
selling on 799 stocks. The financial authorities of several EU countries did the same, albeit
it was an uncoordinated policy that varied from state to state. The main reason behind such
a policy was that investors targeted the stocks of institutions which were in distress due to
the stock market crash (European Commission, no date b). However, such measures create
distortions in the market place. Short sellers are a valuable asset to the economy. By
analyzing data on companies privately, they can gather certain implications which the market
hitherto has not revealed. By banning short selling, authorities are effectively protecting
companies from their downturns and thereby artificially keeping their value up. Had they
left the market to itself, it would have allowed investors to short sell companies in distress
and buy stocks of companies which managed to implement risk measures ahead of time.
Many investors were already foretelling the economic troubles of various companies’
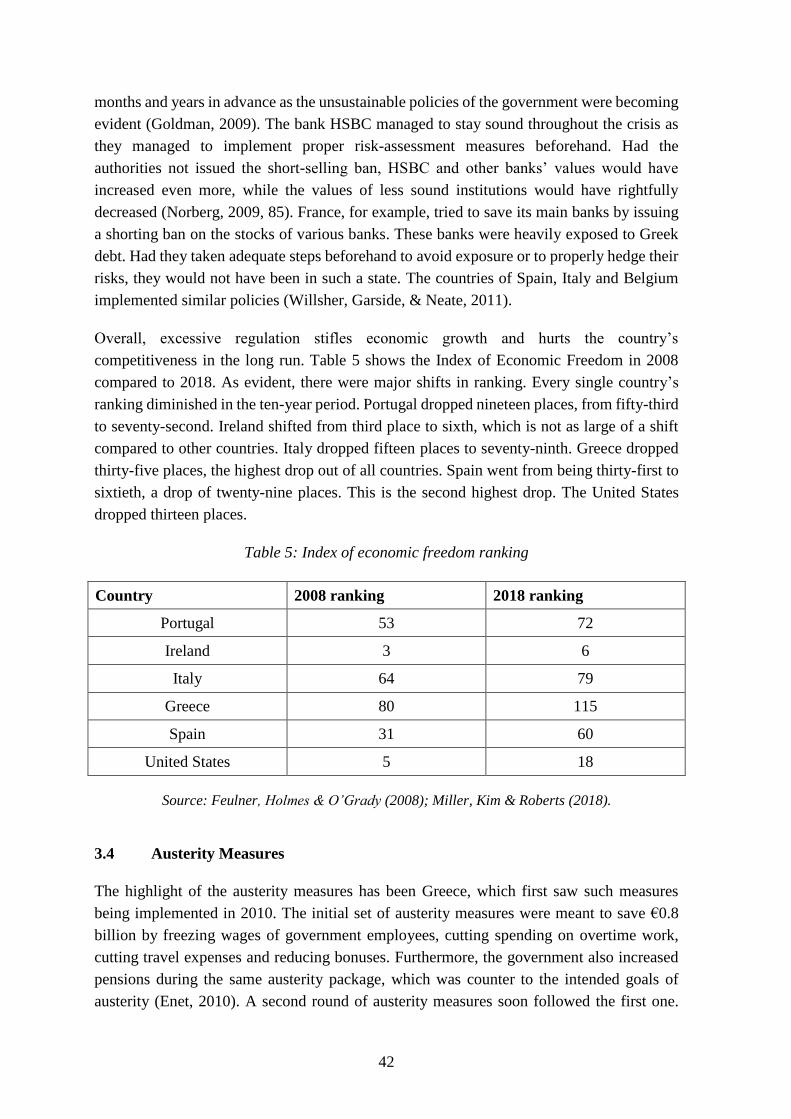
42
months and years in advance as the unsustainable policies of the government were becoming
evident (Goldman, 2009). The bank HSBC managed to stay sound throughout the crisis as
they managed to implement proper risk-assessment measures beforehand. Had the
authorities not issued the short-selling ban, HSBC and other banks’ values would have
increased even more, while the values of less sound institutions would have rightfully
decreased (Norberg, 2009, 85). France, for example, tried to save its main banks by issuing
a shorting ban on the stocks of various banks. These banks were heavily exposed to Greek
debt. Had they taken adequate steps beforehand to avoid exposure or to properly hedge their
risks, they would not have been in such a state. The countries of Spain, Italy and Belgium
implemented similar policies (Willsher, Garside, & Neate, 2011).
Overall, excessive regulation stifles economic growth and hurts the country’s
competitiveness in the long run. Table 5 shows the Index of Economic Freedom in 2008
compared to 2018. As evident, there were major shifts in ranking. Every single country’s
ranking diminished in the ten-year period. Portugal dropped nineteen places, from fifty-third
to seventy-second. Ireland shifted from third place to sixth, which is not as large of a shift
compared to other countries. Italy dropped fifteen places to seventy-ninth. Greece dropped
thirty-five places, the highest drop out of all countries. Spain went from being thirty-first to
sixtieth, a drop of twenty-nine places. This is the second highest drop. The United States
dropped thirteen places.
Table 5: Index of economic freedom ranking
Country 2008 ranking 2018 ranking
Portugal 53 72
Ireland 3 6
Italy 64 79
Greece 80 115
Spain 31 60
United States 5 18
Source: Feulner, Holmes & O’Grady (2008); Miller, Kim & Roberts (2018).
3.4 Austerity Measures
The highlight of the austerity measures has been Greece, which first saw such measures
being implemented in 2010. The initial set of austerity measures were meant to save €0.8
billion by freezing wages of government employees, cutting spending on overtime work,
cutting travel expenses and reducing bonuses. Furthermore, the government also increased
pensions during the same austerity package, which was counter to the intended goals of
austerity (Enet, 2010). A second round of austerity measures soon followed the first one.

43
They focused on tax increases as well as cuts in spending. For example, Value Added Tax
rates were increased from 4.5 % to 5 %, 9 % to 10 % and 19 % to 21 %, whilst the tax on
petrol was increased by 15 %. The spending cuts were mostly related to the bonuses that
were received by public employees for holidays and time-off. Although the spending cuts
were welcomed, the tax increases further stifled growth. Greece needed investors to come
into the country and not be driven away by high taxes (Melander, 2010).
Further austerity measures were taken. The Greek government was focused on cutting
spending on public employees, rather than shifting towards an economic system which did
not have as many public employees to begin with. However, there were positive steps taken
even in regards to government intervention in the economy. The number of publicly owned
companies was reduced from 6000 to 2000 and the number of certain government bodies,
namely municipalities, was reduced. These measures were largely taken due to pressure from
the EU, rather than the inherent belief in limited government by the Greek government
(Loren Friedman, 2010). The fact that protesters rallied for days in an attempt to counter the
austerity measures taken by the government in the streets of Athens is evident of the public
sentiment towards state control (Smith, 2010).
Greece was perhaps the most publicized case of austerity measures. However, other
countries also implemented austerity measures such as Italy, Spain and others. For example,
Italy announced spending cuts totaling €24 billion over a period of two years whilst
increasing oversight over the tax system as well (Flynn, 2010). On the other hand, Spain
introduced a cut in public spending of €6 billion, a pension payments freeze, childbirth
allowance abolitions and several other measures (Mallet, 2010). The media’s focus on the
US response has mostly been related to the bankruptcies and bailouts of the more prominent
banks, whereas the austerity measures in the United States have largely been ignored and
rightfully so. The crisis in the US was not due to government spending, but rather
government intervention. Furthermore, the United States implemented a stimulus package
as a response measure.
Despite austerity being under criticism by Keynesian economists such as Krugman (2015),
austerity may not even be taking place, at least on the scale portrayed. Namely, the argument
is that although measures are taken that resemble austerity, as certain budget deficits have
decreased over the years, the budget deficit of no country has actually gone down to zero.
Figure 16 shows the budget deficits of the peripheral countries from 2007 till 2018 (OECD,
2017a). As evident, these countries have reduced deficits from what they were during the
beginning of the crisis, but have not really made much progress since. This indicates that
much of the deficit reduction was political, as in demanded by the central authorities of the
EU rather than being due to shifts in the political sentiments of these countries (Thornton,
2014). The United States, as evident on Figure 18 as well, has not managed to create a budget
surplus. The most likely explanation is due to the increase in government spending and
government debt.

44
Figure 16: Government deficit as a % of GDP (2000–2017)
Source: OECD (2017a).
With regards to spending, it appears that no country, apart from Ireland, has taken any
significant steps from reducing spending from a structural point of view, as Figure 17 shows.
They have all kept within the bounds of a certain level since the crisis. Even if pre-crisis data
is analyzed, it is evident that apart from Ireland, some countries are spending more as a
percentage of GDP post-crisis. Ireland, as aforementioned in the thesis, was one of the most
liberal economies in the Eurozone and was also very competitive. The United States has also
kept spending constant throughout the years, rather than reducing it (OECD, 2017b).
Figure 17: Government spending as a % of GDP (2000–2017)
Source: OECD (2017b).
-35.00%
-30.00%
-25.00%
-20.00%
-15.00%
-10.00%
-5.00%
0.00%
5.00%
10.00%
Portugal Ireland Italy Greece Spain United States
0.00%
10.00%
20.00%
30.00%
40.00%
50.00%
60.00%
70.00%
2000 2001 2002 2003 2004 2005 2006 2007 2008 2009 2010 2011 2012 2013 2014 2015 2016
Portugal Ireland Italy Greece Spain United States

45
3.5 Monetary Policy
The Federal Reserve initially decreased the federal funds rate from 5.25 % in September
2007 to an all-time low of 0.25 % by the end of 2008. Much of the reduction occurred in the
first and last quarters of 2008 (Rich, 2013). Apart from the traditional expansionary policy
of lowering the interest rate, the Federal Reserve also pursued an unconventional monetary
policy called quantitative easing. Quantitative easing is the purchase of government
securities by a central bank in order to lower interest rates and increase the money supply.
During quantitative easing, the money supply was increased by roughly $4 trillion. This
greatly raised the Federal Reserve’s assets side of the balance sheet. The Federal Reserve’s
liabilities side also grew as the reserves of banks kept increasing. The Federal Reserve
thought that they would be used to stimulate growth. However, the problem was that the
majority of the money injected in the economy was kept by US banks as reserves. This
number was $2.7 trillion at its peak (Kenton, 2019). Figure 18 indicates all treasury securities
as well as mortgage-backed securities held by the Federal Reserve.
Figure 18: US Treasury securities and mortgage-backed securities held by the Federal
Reserve (2000–2017)
Source: Board of Governors of the Federal Reserve System (US) (no date).
Initially, the European Central Bank raised their main policy rate, the main refinancing
operations rate, from 4 % to 4.25 % in July of 2008. This decision was made under ECB
president Jean-Claude Trichet in order to curb inflationary pressures. However, the policy
of the ECB was soon reversed, as an expansionary monetary policy was introduced which
would dominate the post-crisis period (Look, 2018). There was another increase in 2011 in
the same policy rate, from 1 % to 1.25 % and then finally to 1.5 %. However, this policy was
0
500,000
1,000,000
1,500,000
2,000,000
2,500,000
3,000,000
3,500,000
4,000,000
4,500,000
2002 2003 2004 2005 2006 2007 2008 2009 2010 2011 2012 2013 2014 2015 2016 2017
US Treasury and Mortgage-Backed Securities
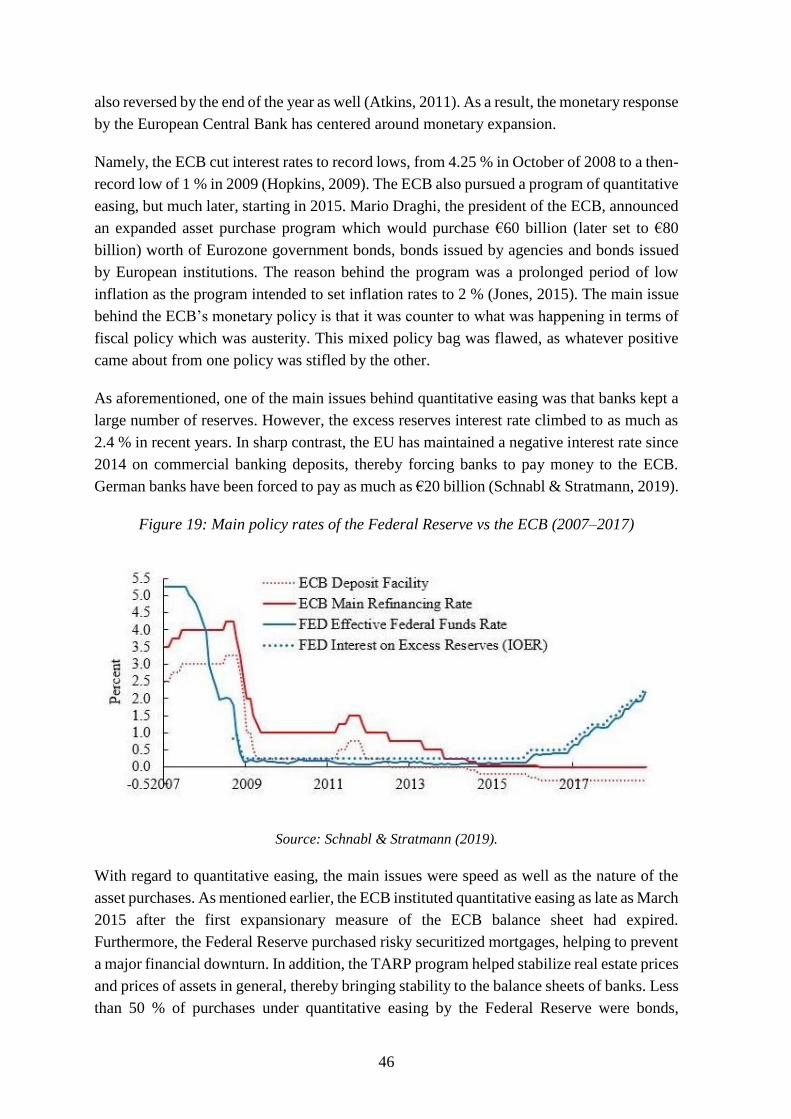
46
also reversed by the end of the year as well (Atkins, 2011). As a result, the monetary response
by the European Central Bank has centered around monetary expansion.
Namely, the ECB cut interest rates to record lows, from 4.25 % in October of 2008 to a then-
record low of 1 % in 2009 (Hopkins, 2009). The ECB also pursued a program of quantitative
easing, but much later, starting in 2015. Mario Draghi, the president of the ECB, announced
an expanded asset purchase program which would purchase €60 billion (later set to €80
billion) worth of Eurozone government bonds, bonds issued by agencies and bonds issued
by European institutions. The reason behind the program was a prolonged period of low
inflation as the program intended to set inflation rates to 2 % (Jones, 2015). The main issue
behind the ECB’s monetary policy is that it was counter to what was happening in terms of
fiscal policy which was austerity. This mixed policy bag was flawed, as whatever positive
came about from one policy was stifled by the other.
As aforementioned, one of the main issues behind quantitative easing was that banks kept a
large number of reserves. However, the excess reserves interest rate climbed to as much as
2.4 % in recent years. In sharp contrast, the EU has maintained a negative interest rate since
2014 on commercial banking deposits, thereby forcing banks to pay money to the ECB.
German banks have been forced to pay as much as €20 billion (Schnabl & Stratmann, 2019).
Figure 19: Main policy rates of the Federal Reserve vs the ECB (2007–2017)
Source: Schnabl & Stratmann (2019).
With regard to quantitative easing, the main issues were speed as well as the nature of the
asset purchases. As mentioned earlier, the ECB instituted quantitative easing as late as March
2015 after the first expansionary measure of the ECB balance sheet had expired.
Furthermore, the Federal Reserve purchased risky securitized mortgages, helping to prevent
a major financial downturn. In addition, the TARP program helped stabilize real estate prices
and prices of assets in general, thereby bringing stability to the balance sheets of banks. Less
than 50 % of purchases under quantitative easing by the Federal Reserve were bonds,

47
whereas the ECB’s government bond purchases constituted 80 %. Such differences imply
that the ECB was focused on saving various EU governments, rather than the banking system
(Schnabl & Stratmann, 2019).
Furthermore, regardless of the initial size of the Federal Reserve’s balance sheet, there has
been a reduction in recent years as well as an overall halt to the expansionary policy. The
Federal Reserve has been pushing up the federal funds rate, as well as loading off its balance
sheet. It began such measures much earlier than the ECB did. Figure 20 indicates these
disparities.
Figure 20: The balance sheet of the Federal Reserve as a % of GDP versus the ECB
(1999–2017)
Source: Schnabl & Stratmann (2019).
It is evident that the United States was quicker in its response than the ECB and thus brought
much-needed stability to the system. However, the issue at hand is whether by doing so the
Federal Reserve set the foundation for another economic downturn. The Federal Reserve’s
response is almost identical to previous crises. The Federal Reserve decreased interest rates
as a response to the technology bubble crash and this decrease helped form the housing
bubble itself. The technology bubble was also a product of expansionary monetary policy as
a response to the economic downturn during the 1990s. Such expansionary policies create a
surplus of cash in the economy, allowing investments to be pursued which otherwise would
not have been undertaken. The Federal Reserve has officially ended its expansionary policies
by selling off its balance sheet. However, at the announced rate of around $50 billion per
month, it will take several years until the contraction is fully implemented. This is due to the
fact that it wants to reduce its balance sheet size to pre-crisis levels of $1 trillion (Chambers,
2018).

48
CONCLUSION
The research questions, which were set up at the beginning, will be addressed to see to what
extent has the thesis demonstrated them to be true or false.
Was the crisis caused due to government actions, both in the US and the EU?
The facts outlined in this thesis support this.
The US government developed several government-run policies as well as government-run
agencies that exacerbated the crisis. In short, with the help of legislative acts such as the
Community Reinvestment Act, as well as other legislative pieces which came about during
the 1990s, the United States government forced banks to issue mortgages to individuals who
were not credit worthy. These mortgages were later repurchased by government agencies
such as Fannie Mae and Freddie Mac, which allowed banks to have money on hand to issue
more mortgages. These mortgages were converted into financial securities and often
mortgages of all type were bumped together in order to diversify risk. This greatly
exacerbated the housing bubble (Sowell, 2009).
With regards to the Federal Reserve, it pursued a low interest policy following the
technology bubble crash as well as the 9/11 terrorist attacks, which shook the US economy.
Such practices made variable-interest mortgages favorable. However, as soon the economy
was overheating, the Federal Reserve proceeded to raise interest rates and thus forcing many
of the people who had taken variable rate mortgages to default as their monthly obligations
became bigger (La Monica, 2005).
The EU and the ECB behaved in a similar manner. Several EU countries pursued
government policies which created deficits and accumulated debt. The peripheral countries
of Greece, Portugal and Italy had welfare states for several decades and were not very
competitive economies. Financing all of these government programs was made easy by the
low rates that the Euro offered. Spain also had its fair share of troubles, but it did not have
such a huge welfare state as the other economies. Ireland was such a competitive economy
that it drove investors from all over the world to it. Furthermore, the policy of the ECB was
almost identical to that of the Federal Reserve, as it pursued lower interest rates at the
beginning of the millennium and continued to raise them afterwards (Bagus, 2012).
Did the Keynesian response give negative results in the US?
The facts outlined in this thesis support this.
The stimulus package resulted in more debt, wasteful spending and essentially laid the
foundation for a new economic downturn. Those resources should have been used by the
private market. The government does not know as well as the private sector does as to what
is most profitable to pursue. Debt has risen as a result of all of these policies at unprecedented

49
levels. This creates further economic distress. Furthermore, as mentioned throughout the
text, nothing critical was done about the agencies that created the crisis in the first place,
namely, Fannie Mae, Freddie Mac, HUD and others. Any government response should have
centered around shutting such agencies down and allowing banks to issue mortgages to
whomever they want (Norberg, 2009).
Did the contrary responses of monetary and fiscal policy give negative results in the
EU?
The facts outlined in this thesis support this.
Several EU countries responded with austerity measures in order to cut back spending in the
economy. Greece was at the forefront of these measures in the media. The ECB responded
in a much different fashion – lowering interest rates in order to pump money into the
economy to stimulate it. This meant that the policies were contradicting each other and thus
stifling recovery as there was no clear path. The policy of the EU during the early 2000s was
also a policy of low interest rates and it was this policy that helped fuel the debt crisis, as
stated in the thesis (European Central Bank, no date).
Lastly, the EU has not shifted away from government control of economy and its government
control over the economy has further expanded. No peripheral country has made any
structural shifts and even the most liberal economy, Ireland, has decreased in its economic
freedom ranking, as demonstrated in the thesis (Miller, Kim, & Roberts, 2018).
Did the US recover faster than the EU due to faster liquidity injections?
The facts outlined in this thesis support this.
The US was much quicker in implementing bailouts, regardless of how controversial they
may have been. The EU never injected large amounts of capital into the economy, thereby
continuing the trend of uncertainty. The US had two large injections, whereas the EU had
smaller injections for several years to come (The Economist, 2010).
The Federal Reserve cut its rate much lower than the ECB and was also willing to purchase
distressed assets more than the ECB, thereby preventing a total collapse. The ECB has been
reluctant on lowering its rate to that that of the Fed. There are further coordination problems
with regards to the Euro which make monetary policy in the EU much more difficult than in
the US (Schnabl & Stratmann, 2019).
The main reason behind the malfunctioning of the Euro is the vast region over which it is
spread – a region that does not share a common culture, language or identity. As such, the
economies of each of these countries differ greatly and have been impacted by the crisis all
in a different manner. On the other hand, the US Dollar is used in a country that is

50
homogenous in language, history and other factors. As a result, conducting monetary policy
is vastly more complicated in the EU, than in the US (Friedman, 1997).
Lastly, the response of the Federal Reserve has been similar to its response to the technology
bubble crash in 2001. It was precisely due to such an increased supply of money in the
economy that the housing bubble was formed. Prior to this, the response to the economic
downturn of the 1990s was also an expansionary monetary policy. This led to the formation
of the technology bubble in the first place. Therefore, it is evident that, if analyzed
historically, expansionary policy has caused economic instability in the longer term
(Callahan & Garrison, 2003).
REFERENCE LIST
1. Alvarez, A. (2018, January 14). The Creation Of The Spanish Real Estate Bubble.
Retrieved December 14, 2018, from https://seekingalpha.com/article/4137457-
creation-spanish-real-estate-bubble
2. Amadeo, K. (2018, November 9). ARRA, Its Details, With Pros and Cons. Retrieved
December 15, 2018, from https://www.thebalance.com/arra-details-3306299
3. Andor, L. (2014, June 24). Labour mobility in the EU: challenges and perspectives
for a genuine European labour market. Retrieved December 29, 2018, from
http://europa.eu/rapid/press-release_SPEECH-14-
491_en.htm?fbclid=IwAR1UYS17iz-984vwEN5uYgBZoqtXC9oQB-
sKcloP1mWgKVtomhMC_kJr2Ro
4. Atkins, R. (2011, April 7). ECB raises rates for first time since 2008. Retrieved April
3, 2019, from https://www.ft.com/content/b7f5ae80-60fe-11e0-8899-00144feab49a
5. Bagus, P. (2010, November 11). The Irish Subjugation. Retrieved December 10,
2018, from https://mises.org/library/irish-subjugation
6. Bagus, P. (2011). The Tragedy of the Euro (2nd ed.). United States: Terra Libertas.
7. Bagus, P. (2012, April 17). The Eurozone: A Moral-Hazard Morass. Retrieved
December 11, 2018, from https://mises.org/library/eurozone-moral-hazard-morass
8. Ball, L. M. (2018, September 3). Ten years on, the Fed’s failings on Lehman
Brothers are all too clear. Retrieved December 27, 2018, from
https://www.theguardian.com/commentisfree/2018/sep/03/federal-reserve-lehman-
brothers-collapse
9. Barber, T. (2010, January 12). Greece condemned for falsifying data. Retrieved
January 10, 2019, from https://www.ft.com/content/33b0a48c-ff7e-11de-8f53-
00144feabdc0
10. BBC. (2009, December 10). Greece's debt reaches 300bn euros. Retrieved
December 20, 2018, from http://news.bbc.co.uk/2/hi/business/8406665.stm
11. BBC. (2012, June 13). Timeline: The unfolding eurozone crisis. Retrieved December
30, 2018, from https://www.bbc.com/news/business-13856580

51
12. Bishop, T. (2017a, November 2). Obama Administration's Bank Regulation Still
Widening Gap Between Rich and Poor. Retrieved December 14, 2018, from
https://mises.org/wire/obama-administrations-bank-regulation-still-widening-gap-
between-rich-and-poor
13. Bishop, T. (2017b, February 7). Why Not Replace Dodd-Frank With Glass-Steagall?
Retrieved December 28, 2018, from https://mises.org/wire/why-not-replace-dodd-
frank-glass-steagall
14. Board of Governors of the Federal Reserve System (US). (2009). Effective Federal
Funds Rate. Retrieved December 30, 2018, from
https://fred.stlouisfed.org/series/FEDFUNDS
15. Board of Governors of the Federal Reserve System (US). (no date). U.S. Treasury
securities held by the Federal Reserve. Retrieved December 27, 2018, from
https://fred.stlouisfed.org/graph/?g=qHw
16. Bowman, R. (2017, August 3). Unemployment in the Eurozone has fallen to its lowest
level since 2009. Retrieved January 15, 2019, from
https://www.weforum.org/agenda/2017/08/unemployment-falls-optimism-rises-in-
eu/
17. Bragues, G. (2010, November 30). Welfare state crack-up. Retrieved December 30,
2018, from https://business.financialpost.com/opinion/welfare-state-crack-up
18. Callahan, G. (2011). Economics for Real People: An Introduction to the Austrian
School. United States: Mises Institute.
19. Callahan, G. & Garrison, R. (2003). Does Austrian Businses Cycle Theory Help
Explain the Dot-Com Boom and Bust? The Quarterly Journal of Austrian
Economics, 6(2), 67–98.
20. Carolo, D. F. & Pereirinha, J. A. (2010). The Development of the Welfare State in
Portugal: Trends in Social Expenditure Between 1938 and 2003. Journal of lberian
and Latin American Economic History, 28(3), 469–501.
21. Chambers, C. (2018, December 11). How Long Will The Fed's Reverse-Quantitative
Easing Last? Retrieved January 5, 2019, from
https://www.forbes.com/sites/investor/2018/12/11/how-long-will-the-feds-reverse-
quantitative-easing-last/#1dccd83135a9
22. Chen, J. (2018, May 28). Commodity Futures Modernization Act (CFMA). Retrieved
December 29, 2018, from https://www.investopedia.com/terms/c/cfma.asp
23. Clark, A. (2008, March 16). Bear Stearns saved by rock-bottom JP Morgan bid.
Retrieved December 22, 2018, from
https://www.theguardian.com/business/2008/mar/16/creditcrunch.useconomy3
24. CNN. (2002, June 17). Bush aims to boost minority home ownership. Retrieved
December 30, 2018, from
http://edition.cnn.com/2002/ALLPOLITICS/06/17/bush.minority.homes/index.html
25. Concheiro, I. (2012, July 4). Spain Interrupted - On the Form of the Financial
Bubble. Retrieved January 10, 2019, from
https://www.architecturalpapers.ch/index.php?ID=4
52
26. Creaton, S. (2011, February 24). FF-PD policy to blame for economic ills, claims
report. Retrieved December 30, 2018, from
https://archive.vn/20130218004009/http:/www.independent.ie/business/irish/ffpd-
policy-to-blame-for-economic-ills-claims-report-2554051.html#selection-2417.0-
2446.0
27. Davidson, A. (2008, September 18). How AIG fell apart. Retrieved December 20,
2018, from https://www.reuters.com/article/us-how-aig-fell-apart/how-aig-fell-
apart-idUSMAR85972720080918
28. Diamond Jr., D. & Lea, M. (1992). United States. Journal of Housing Research, 3(1),
145–169.
29. Enet. (2010, February 9). Wage freezes and allowance cuts announced by the
government. Retrieved April 3, 2019, from Enet:
http://www.enet.gr/?i=news.el.article&id=130472
30. European Central Bank. (no date). Key ECB interest rates. Retrieved December 30,
2018, from
https://www.ecb.europa.eu/stats/policy_and_exchange_rates/key_ecb_interest_rate
s/html/index.en.html
31. European Commission. (no date a). A rulebook for all financial actors in the EU.
Retrieved April 3, 2019, from https://ec.europa.eu/info/business-economy-
euro/banking-and-finance/banking-union/what-banking-union_en
32. European Commission. (no date b). Short Selling. Retrieved December 22, 2018,
from https://ec.europa.eu/info/business-economy-euro/banking-and-
finance/financial-markets/securities-markets/short-selling_en#eu-rules-on-short-
selling
33. Falasca, P. (2012). How the Welfare State Sank the Italian Dream. In T. Palmer, After
the Welfare State (15–21). United States: Atlas Network & Jameson Books, Inc.
34. Ferguson, N. (2009). The Ascent of Money: A Financial History of the World. United
States: Penguin Books.
35. Feulner, E., Holmes, K. & O'Grady, M. (2008). 2008 Index of Economic Freedom.
United States: The Heritage Foundation and Dow Jones & Company, Inc.
36. Flynn, D. (2010, May 25). Italy joins Europe's austerity club with deep cuts.
Retrieved December 20, 2018, from https://www.reuters.com/article/us-italy-
austerity/italy-joins-europes-austerity-club-with-deep-cuts-
idUSTRE64O36T20100525
37. Freddie Mac. (2009). 30-Year Fixed Rate Mortgage Average in the United States.
Retrieved February 17, 2019, from
https://fred.stlouisfed.org/series/MORTGAGE30US
38. Friedman, M. (1997, August 28). The Euro: Monetary Unity or Political Disunity?
Retrieved December 10, 2018, from https://www.project-
syndicate.org/commentary/the-euro--monetary-unity-to-political-disunity
39. Ginnie Mae. (no date). Our History. Retrieved January 5, 2019, from
https://www.ginniemae.gov/about_us/who_we_are/Pages/our_history.aspx

53
40. Goldman, D. (2009, September 19). SEC bans short-selling. Retrieved December 27,
2018, from https://money.cnn.com/2008/09/19/news/economy/sec_short_selling/
41. Gongloff, M. (2012, March 9). Banks Repaid Fed Bailout With Other Fed Money:
Government Report. Retrieved December 19, 2018, from
https://www.huffpost.com/entry/bank-tarp_n_1335006
42. Gordon, D. (2017). The Euro Might Destroy Europe. The Austrian, 3(6), 12–14.
43. Higgs, R. (2009, November 22). Government Responds to Economic Woes by
Making More Bad Mortgage Loans. Retrieved December 15, 2018, from
http://blog.independent.org/2009/11/22/government-responds-to-economic-woes-
by-making-more-bad-mortgage-loans/
44. Holmes, S. (1999, September 30). Fannie Mae Eases Credit To Aid Mortgage
Lending. Retrieved December 15, 2018, from
https://www.nytimes.com/1999/09/30/business/fannie-mae-eases-credit-to-aid-
mortgage-lending.html?pagewanted=1
45. Hope, K. (2010, May 3). Eurozone agrees €110bn Greece loans. Retrieved
December 30, 2018, from https://www.ft.com/content/a3307762-5616-11df-b835-
00144feab49a
46. Hopkins, K. (2009, May 7). Eurozone economy: European Central Bank cuts rates
to historic low of 1%. Retrieved December 19, 2018, from
https://www.theguardian.com/business/2009/may/07/european-central-bank-
interest-rates
47. Howard, H. (2000). The Trillion-Dollar Bank Shakedown That Bodes Ill for Cities.
Retrieved January 10, 2019, from https://www.city-journal.org/html/trillion-dollar-
bank-shakedown-bodes-ill-cities-12096.html
48. HUD. (1999, July 29). Cuomo Announces Action T Provide $2.4 Trillion In
Mortgages for Affordable Housing for 28.1 Million Families. Retrieved December
30, 2018, from https://archives.hud.gov/news/1999/pr99-131.html
49. HUD. (2001). HUD's Affordable Lending Goals for Fannie Mae and Freddie Mac.
Retrieved December 19, 2018, from
https://www.huduser.gov/portal/Publications/PDF/gse.pdf
50. HUD. (no date). HUD History. Retrieved December 28, 2018, from
https://www.hud.gov/about/hud_history
51. Hume, N. (2010, November 28). EU/IMF Irish bailout – the details. Retrieved
December 27, 2018, from https://ftalphaville.ft.com/2010/11/28/418271/euimf-
irish-bailout-unveiled/
52. Invstr. (2017, January 10). Why has the US recovered faster than the Eurozone?
Retrieved December 30, 2018, from https://invstr.com/us-recovered-faster-
eurozone/
53. Jackson, P. (2006, December 28). OFHEO: Fannie Significantly Undercapitalized
During 2002, 2003. Retrieved March 30, 2019, from
https://www.housingwire.com/articles/ofheo-fannie-significantly-undercapitalized-
during-2002-2003

54
54. Johnson, P. (1983). Modern Times. United Kingdom: Weidenfeld & Nicolson.
55. Jones, C. (2015, January 22). European Central Bank unleashes quantitative easing.
Retrieved 30 2018, December, from https://www.ft.com/content/aedf6a66-a231-
11e4-bbb8-00144feab7de
56. Jurlin, K. & Čučković, N. (2010). Comparative analysis of the quality of European
institutions 2003-2009: convergence or divergence? Financial Theory and Practice,
34(1), 71-98.
57. Kagan, J. (2018a, February 28). Federal Housing Administration (FHA). Retrieved
December 30, 2018, from https://www.investopedia.com/terms/f/federal-housing-
administration.asp
58. Kagan, J. (2018b, March 24). Financial Institutions Reform, Recovery And
Enforcement Act. Retrieved January 20, 2019, from
https://www.investopedia.com/terms/f/financial-institutions-reform-recovery-
enforcement.asp
59. Kang, W. D., Ligthart, N. & Mody, A. (2016, January 16). The ECB and the Fed: A
comparative narrative. Retrieved December 21, 2018, from
https://voxeu.org/article/ecb-and-fed-comparative-narrative
60. Katsaitis, O. & Doulos, D. (2009). The Impact of EU Structural Funds on FDI.
Kyklos, 62(4).
61. Kenton, W. (2019, February 18). Quantitative Easing. Retrieved February 25, 2019,
from https://www.investopedia.com/terms/q/quantitative-easing.asp
62. Khalip, A. (2018, March 26). Portugal says 2017 budget gap halves with bank
injection discounted. Retrieved December 30, 2018, from
https://www.reuters.com/article/us-portugal-budget-deficit/portugal-says-2017-
budget-gap-halves-with-bank-injection-discounted-idUSKBN1H218K
63. Knight, L. (2012, May 18). Spanish economy: What is to blame for its problems?
Retrieved December 23, 2018, from https://www.bbc.com/news/business-17753891
64. Kouretas, G. & Vlamis, P. (2010). The Greek Debt Crisis: Origins and Implications.
Panoeconomicus, 57(4), 391–404.
65. Kreiswirth, B. & Tabor, A. (2016, October 31). What you need to know about the
Equal Credit Opportunity Act and how it can help you. Retrieved December 29,
2018, from https://www.consumerfinance.gov/about-us/blog/what-you-need-know-
about-equal-credit-opportunity-act-and-how-it-can-help-you-why-it-was-passed-
and-what-it/
66. Krugman, P. (2015, April 29). The case for cuts was a lie. Why does Britain still
believe it? The austerity delusion. Retrieved January 27, 2019, from
https://www.theguardian.com/business/ng-interactive/2015/apr/29/the-austerity-
delusion
67. La Monica, P. (2005, December 13). Fed raises rates again. Retrieved December 1,
2018, from https://money.cnn.com/2005/12/13/news/economy/fed_rates/
68. Labaton, S. (2003, September 11). New Agency Proposed to Oversee Freddie Mac
and Fannie Mae. The New York Times. Retrieved December 1, 2018, from

55
https://www.nytimes.com/2003/09/11/business/new-agency-proposed-to-oversee-
freddie-mac-and-fannie-mae-249432.html?pagewanted=print
69. Leonnig, C. (2008, June 10). How HUD Mortgage Policy Fed the Crisis. The
Washington Post. Retrieved December 15, 2018, from
http://www.washingtonpost.com/wp-
dyn/content/article/2008/06/09/AR2008060902626.html
70. Look, C. (2018, July 3). ECB's 2008 Rate Hike Revisited: The Crisis It Didn't See
Coming. Retrieved April 3, 2019, from https://www.bloomberg.com/markets/fixed-
income
71. Loren Friedman, T. (2010, May 11). Greece's Newest Odyssey. Retrieved January
20, 2019, from
https://www.nytimes.com/2010/05/12/opinion/12friedman.html?mtrref=www.goog
le.com
72. Mallet, V. (2010, May 13). Tough new Spanish austerity measures. Retrieved
December 13, 2018, from https://www.ft.com/content/91ca42de-5d9e-11df-b4fc-
00144feab49a
73. Maltby, E. & Loten, A. (2011, October 20). Tale of Two Loan Programs. Retrieved
December 17, 2018, from
https://www.wsj.com/articles/SB1000142405297020413820457660310046992970
0
74. Mathiason, N. (2008, December 28). Three weeks that changed the world. Retrieved
December 27, 2018, from
https://www.theguardian.com/business/2008/dec/28/markets-credit-crunch-
banking-2008
75. McLannahan, B. (2018, May 23). US has more than 5,600 banks. Consolidation is
coming. Retrieved December 17, 2018, from https://www.ft.com/content/41af5986-
5e05-11e8-9334-2218e7146b04
76. Melander, I. (2010, March 5). Greek parliament passes austerity bill. Retrieved
December 28, 2018, from https://www.reuters.com/article/greece-vote/greek-
parliament-passes-austerity-bill-idUSATH00527020100305?type=usDollarRpt
77. Miller, T., Kim, A. & Roberts, J. (2018). 2018 Index of Economic Freedom. United
States: Heritage Foundation.
78. Mishkin, F. & Eakins, S. (2012). Financial Markets and Institutions. United States:
Prentice Hall.
79. Moore, H. (2014, November 7). US unemployment rate falls to lowest level since
2008. Retrieved December 22, 2018, from
https://www.theguardian.com/business/2014/nov/07/us-unemployment-rate-falls-
economy
80. Mramor, D. (2019). Faces of Transition: Dusan Mramor. Brussels: European
Commission.
81. Norberg, J. (2009). Financial Fiasco. United States: Cato Institute.

56
82. Norberg, J. (2012, April 17). Financial Crisis II. Retrieved December 27, 2018, from
http://reason.com/archives/2012/04/17/financial-crisis-ii
83. OECD. (2016). General government debt. Retrieved December 15, 2018, from
https://data.oecd.org/gga/general-government-debt.htm
84. OECD. (2017a). General government deficit. Retrieved December 15, 2018, from
https://data.oecd.org/gga/general-government-deficit.htm
85. OECD. (2017b). General government spending. Retrieved December 15, 2018, from
https://data.oecd.org/gga/general-government-spending.htm
86. Palumbo, M. (2015, January 6). Overselling TARP: The Myth of the $15 Billion
Profit. Retrieved December 30, 2018, from
https://www.nationalreview.com/2015/01/overselling-tarp-myth-15-billion-profit-
matt-palumbo/
87. Picardo, E. (2018, October 8). The Origins of Greece's Debt Crisis. Retrieved
December 21, 2018, from https://www.investopedia.com/articles/personal-
finance/061115/origins-greeces-debt-crisis.asp
88. Pickert, K. (2008, July 14). A Brief History of Fannie Mae and Freddie Mac.
Retrieved December 19, 2018, from
http://content.time.com/time/business/article/0,8599,1822766,00.html
89. Pignal, S. (2011, February 14). Deal reached to boost eurozone bail-out fund.
Retrieved January 2, 2019, from https://www.ft.com/content/26960ece-386a-11e0-
959c-00144feabdc0
90. Rallo, J. R., Oro, A. M. & Marti, A. P. (2012, February 29). Spain Becomes One of
Europe’s Highest Taxed Countries. Retrieved December 19, 2018, from
https://www.cato.org/publications/economic-development-bulletin/spain-becomes-
one-europes-highest-taxed-countries
91. Rich, R. (2013, November 22). The Great Recession. Retrieved January 20, 2019,
from https://www.federalreservehistory.org/essays/great_recession_of_200709
92. Ruparel, R. (2015, July 6). Why Greece is going to have to start printing its own
money. Retrieved December 20, 2018, from
https://www.telegraph.co.uk/finance/11721322/Why-Greece-is-going-to-have-to-
start-printing-its-own-money.html
93. Schnabl, G. & Stratmann, T. (2019, March 6). Fed Policy vs. ECB Policy: A
Comparison. Retrieved March 10, 2019, from https://mises.org/wire/fed-policy-vs-
ecb-policy-comparison?fbclid=IwAR2auCiHAJB2Q-
DWomhXWJG6n4Cht3u0Y_bLX_5Ev8ZcZb6Z3GUpFA_9YQg
94. Shostak, F. (2012, November 22). Ire and Ice: A Tale of Two PIIIGS. Retrieved
December 30, 2018, from https://mises.org/library/ire-and-ice-tale-two-piiigs
95. Smith, H. (2010, May 9). The Greek spirit of resistance turns its guns on the IMF.
Retrieved December 29, 2018, from
https://www.theguardian.com/world/2010/may/09/greece-debt-crisis-euro-imf
96. Sowell, T. (1981). Ethnic America. New York: Basic Books.
97. Sowell, T. (2009). The Housing Boom and Bust. New York: Basic Books.
57
98. Sowell, T. (2010). Dismantling America and Other Controversial Essays. New York:
Basic Books.
99. Sowell, T. (2016). Wealth, Povery and Politics: An International Perspective. New
York: Basic Books.
100. Spiegel, P. (2013, March 25). Cyprus rescue signals new line on bailouts.
Retrieved April 5, 2019, from https://www.ft.com/content/68c9c18e-955e-11e2-
a151-00144feabdc0
101. Statista. (2017a). Number of FDIC-insured commercial banks in the United
States from 2002 to 2017. Retrieved January 19, 2019, from Statista:
https://www.statista.com/statistics/184536/number-of-fdic-insured-us-commercial-
bank-institutions/
102. Statista. (2017b). Number of new FDIC-insured commercial bank charters in
the United States from 2000 to 2017. Retrieved January 19, 2019, from Statista:
https://www.statista.com/statistics/193052/change-in-number-of-new-fdic-insured-
us-commercial-bank-charters/
103. The Economist. (2010, September 13). Third time's the charm? Retrieved
December 19, 2018, from https://www.economist.com/free-
exchange/2010/09/13/third-times-the-charm
104. The Economist. (2017, May 6). American banks have recovered well; many
European ones much less so. Retrieved December 28, 2018, from
https://www.economist.com/special-report/2017/05/06/american-banks-have-
recovered-well-many-european-ones-much-less-so
105. Thomas Jr., L. (2010, April 15). Debt Worries Shift to Portugal, Spurred by
Rising Bond Rates. Retrieved December 27, 2018, from
https://www.nytimes.com/2010/04/16/business/global/16escudo.html?_r=2&ref=eu
rope
106. Thornton, M. (2014, February 27). An End to Austerity? Retrieved December
19, 2018, from https://mises.org/library/end-austerity
107. Tumpel-Gugerell, G. (2009, October 16). The European response to the
financial crisis. Retrieved December 19, 2018, from
https://www.ecb.europa.eu/press/key/date/2009/html/sp091016_1.en.html
108. U.S. Census Bureau. (no date). Median Sales Price of Houses Sold for the
United States. Retrieved December 19, 2018, from
https://fred.stlouisfed.org/series/MSPUS
109. U.S. Department of the Treasury. (no date). Federal Debt: Total Public Debt.
Retrieved December 10, 2018, from https://fred.stlouisfed.org/series/GFDEBTN
110. Weber, M. (1930). The Protestant Ethic and the Spirit of Capitalism. United
States: Allen and Unwin.
111. White, L. (2009). A Brief History of Credit Rating Agencies: How Financial
Regulation Entrenched this Industry's Role in the Subprime Mortgage Debacle of
2007 - 2008. Retrieved December 21, 2018, from

58
https://www.mercatus.org/publication/brief-history-credit-rating-agencies-how-
financial-regulation-entrenched-industrys-role
112. Wickell, J. (2018, November 4). Facts About the American Dream
Downpayment Initiative. Retrieved December 22, 2018, from
https://www.thebalance.com/facts-about-the-american-dream-downpayment-act-
1797732
113. Willsher, K., Garside, J. & Neate, R. (2011, August 12). Four countries ban
short-selling to ease market pressure. Retrieved December 17, 2018, from
https://www.theguardian.com/business/2011/aug/11/short-selling-ban-europe-
france
114. Woods Jr., T. E. (2009). Meltdown. United States: Regnery Publishing.

APPENDICES


1
Appendix 1: Povzetek (Summary in Slovene language)
V magistrski nalogi želim preučiti odzive Združenih držav Amerike (v nadaljevanju, ZDA)
in Evropske Unije (v nadaljevanju, EU) na finančno krizo leta 2008. Tako ZDA kot EU
predstavljata pomemben del svetovnega gospodarstva, njihove ekonomske politike pa so v
marsikaterem pogledu zgled ostalim državam. Namen magistrske naloge je ponuditi
usmeritve pri oblikovanju prihodnjih ekonomskih politik in se pri tem osredotočiti na dva
ključna vidika oblikovanja politik v obdobju finančne krize leta 2008.
Najprej želim ugotoviti razloge, ki so ZDA omogočili hitrejše okrevanje v primerjavi z EU.
S primerjavo in analizo sprejetih ekonomskih politik ZDA na eni in EU na drugi strani bom
preučil razlike v hitrosti okrevanja teh dveh držav (Schnabl & Stratmann, 2019).
Nadalje želim v magistrski nalogi ugotoviti, ali so ZDA in EU v okviru politik za reševanje
finančne in ekonomske krize naslovile prave težave, ki so povzročile nastanek krize. Pokazal
bom, da se niti ZDA niti EU niso odzvale ustrezno, in da so bile njihove politike škodljive,
hkrati pa želim ugotoviti, kaj je ZDA omogočilo, da so iz krize izstopile hitreje.
Da lahko celostno razumemo in analiziramo učinke določenih politik, je potrebno ugotoviti
in nasloviti prave vzroke za nastanek finančne krize, ki se med ZDA in EU pomembno
razlikujejo, kljub razlikam pa lahko ugotovimo, da so povezani z intervencijami države v
gospodarstvo. Razlogi za pojav finančne krize v ZDA namreč izhajajo iz poseganja države
v nepremičninski sektor, medtem ko so vzroki za nastanek krize v EU povezani z
naraščajočim javnim dolgom perifernih članic EU (Norberg, 2009).
Ustreznost odziva na finančno krizo lahko presojamo šele, ko identificiramo prave vzroke
za njen nastanek. V magistrski nalogi trdim, da so razlogi za nastanek finančne krize leta
2008 naslednji:
V devetdesetih letih prejšnjega stoletja so ZDA zasledovale politiko, ki bi nižjemu
sloju omogočila lažji nakup lastniških stanovanj. Z opiranjem na zakon Community
Reinvestment Act (Zakon za povečanje dostopnosti posojil prebivalstvu, v
nadaljevanju CRA) in v sodelovanju s finančnimi institucijami kot sta Freddie Mac
in Fannie Mae ter drugimi zakonskimi akti so ZDA prisilile komercialne banke, da
so izdale drugorazredna hipotekarna posojila posameznikom z nizkimi ocenami
kreditne sposobnosti. Fannie Mae in Freddie Mac sta drugorazredna hipotekarna
posojila odkupovali od komercialnih bank, ki so tako lahko izdajale še več posojil
(Sowell, 2009).
Za Portugalsko, Italijo in Grčijo sta bila značilna visok delež zaposlenih javnem
sektorju in močna vloga države v gospodarstvu. Države so si za financiranje državnih
programov in politik izposojale sredstva po visokih obrestnih merah (BBC, 2012).

2
Po terorističnem napadu 11. septembra in poku tehnološkega mehurčka v istem letu
je ameriška centralna banka (FED) z namenom spodbuditve gospodarske aktivnosti
znižala obrestne mere na zgodovinsko nizko raven 1 % (Woods Jr., 2009, 79–82). S
tem je postalo zadolževanje ugodnejše, kar je omogočilo zalet prej omenjeni politiki
spodbujanja nakupa lastniških stanovanj. Hkrati je bilo mnogo posojil v tem obdobju
izdanih po variabilnih obrestnih merah, ki so bile vezane na referenčne obrestne mere
ameriške centralne banke. Ko je FED zaradi skrbi pred pregrevanjem gospodarstva
zvišal obrestno mero iz 1 % na 4,25 %, so posojilojemalci z variabilnimi obrestnimi
merami postali nezmožni odplačevati posojilne obveznosti (La Monica, 2005).
Valuta evro temelji na monetarnem sistemu heterogenih držav, ki nimajo skupne
kulture in homogenega ekonomskega sistema, kar zmanjšuje mobilnost delovne sile
in otežuje koordinacijo monetarnih politik. Euro ima tako strukturni problem, ki pa
ga ameriški dolar nima (Friedman, 1997).
ZDA in EU so sprejele različne ukrepe za zajezitev finančne krize, vendar spodnji seznam
ukrepov priča o tem, da niti ZDA niti EU nista naslovili izvornih razlogov za nastanek krize.
ZDA so zasledovale Troubled Asset Relief Program (Program reševanja finančnih
institucij s slabimi terjatvami, v nadaljevanju TARP) in spodbujale nakup finančnih
institucij v težavah. Tudi za EU so bili značilni programi reševanja finančnih
institucij z najbolj odmevnim programom reševanja irskega bančnega sistemu.
Hkrati je EU reševala celotne ekonomije držav kot so Grčija, Irska, Portugalska in
druge (Bagus, 2010).
Mnoge države EU so pripravile sheme za spodbujanje infrastrukturnih projektov,
medtem ko so ZDA v letu 2009 sprejele paket ukrepov za okrevanje imenovan
American Recovery and Reinvestment Act vreden 787 milijard ameriških dolarjev
(Sowell, 2009).
ZDA so v odzivu na finančno krizo sprejele ukrepe za spodbudo gospodarstva,
medtem ko so države članice EU, še posebej Španija in Grčija, sprejele varčevalne
ukrepe, s katerimi so želele obrzdati državno potrošnjo z namenom povečanja
stabilnosti v prihodnosti (Loren Friedman, 2010).
Kljub temu, da je se je Evropska Centralna Banka (ECB) sprva odzvala z
restriktivnimi ukrepi, sta tako FED kot ECB kasneje zasledovali podobno
ekspanzivno monetarno politiko, saj sta obe centralni banki znižali obrestne mere z
nameon spodbuditve gospodarstva (Look, 2018).
V magistrski nalogi ugotavljam, da je bil odziv ZDA na finančno krizo mnogo hitrejši kot
odziv EU. ZDA so se enako odzvale tudi v primeru tehnološkega mehurčka leta 2001, ki je
kasneje pripeljal še do nepremičninskega mehurčka. Prav tako so bili programi reševanja
finančnih institucij v težavah izvedeni hitreje, s čimer so ZDA stabilnost trgov zagotovile

3
prej kot EU. Nadalje ugotavljam, da niti ZDA niti EU niso naslovile pravih vzrokov za
finančno krizo leta 2008. ZDA niso dopustile stečaja Fannie Mae, Freddie Mac in drugih
državnih družb kot je United States Department of Housing and Urban Development (Urad
za stanovanjski in mestni razvoj, v nadaljevanju HUD) (Sowell, 2009). Države članice EU
niso reševale makroekonomskih neravnovesij v perifernih državah, kakor tudi niso sprejele
zakonskih aktov za omejevanje zadolževanja (Bagus, 2012).
Sprejeti ukrepi za spodbujanje gospodarstva v ZDA so utrdili vlogo države gospodarstvu.
Varčevalni ukrepi v EU so do neke mere pripomogli k zmanjšanju državne potrošnje, vendar
niso dosegli zmanjšanja proračunskih primanjkljajev. V splošnem lahko trdim, da sta se
tako ZDA kot tudi EU na finančno krizo odzvale z državnimi intervencijami, ki so bile
glavni razlog za njen nastanek. To ima pomembne posledice za prihodnost in lahko vodi
celo v naslednjo gospodarsko krizo.