Embed Size (px)
Citation preview
The Communications Market:Digital Radio Report
Ofcom’s seventh annual digital progress report
Research Document
Publication date: 29 November 2016

About this document This report is Ofcom’s seventh annual publication on the progress of digital radio in the UK. It is intended to provide an update on the availability, take-up, listening patterns, and attitudes towards digital radio, as originally requested by Government in 2010 as part of its Digital Radio Action Plan.
This report primarily uses data from RAJAR and Ofcom’s own consumer research; it serves as a reference tool for industry, stakeholders and consumers.

Digital Radio Report 2016
Contents
Section Page 1 Executive summary 1
2 Availability of digital radio services 4
3 Take-up of devices and platforms 9
4 Radio listening through digital platforms 15
5 Consumer awareness of, and attitudes towards, digital radio 23
Annex Page 1 DAB take-up and share of digital listening, by multiplex area 28
Digital Radio Report 2016
1
Section 1
1 Executive summary 1.1 Basis of report publication
In July 2010 the Government launched its Digital Radio Action Plan. As part of this, it requested that Ofcom produce an annual review of the digital radio market. The Action Plan was launched to ensure that if and when digital switchover occurs in radio, it can be delivered at a time when the market is ready, and in a way that protects the needs of listeners. The Government stated that it would consider a decision on whether to set a date for digital radio switchover when the following criteria were met:
when 50% of all radio listening is via digital platforms; and
when national DAB1 coverage is comparable to FM, and local DAB reaches 90% of the population and all major roads.
The Action Plan was finalised in November 2013, and on 16 December 2013 the DCMS announced that while there had been steady growth in digital listening, it was not yet the time to commit to a switchover. The last version of the Digital Radio Action Plan was published in January 2014.
Although the Action Plan has concluded, Ofcom continues to monitor digital radio coverage, take-up and attitudes. This is Ofcom's seventh Digital Radio Report. It serves as an update to the data points in the previous reports that were produced as part of the Action Plan. Section 2 looks at availability and coverage, Sections 3 and 4 outline current take-up and listening patterns, and Section 5 draws on Ofcom's consumer research to cover attitudes to, and awareness of, digital radio. In this report ‘digital radio’ is used in its broadest sense to include all platforms and technologies that allow listeners to access digital radio services. This includes DAB, internet-delivered radio services and radio services available via primarily television platforms (e.g. Freeview, Sky and Virgin).
1.2 Survey methodology
This report uses a range of data drawn from the following research sources:
Ofcom licensing data;
retail equipment sales and pricing statistics (from an external agency, GfK);
Ofcom Technology Tracker research data2;
1 DAB stands for digital audio broadcasting, which is the digital radio broadcast technology adopted in the UK. 2 The Ofcom Technology Tracker is conducted across varying waves of research, referred to in this report as Q2 for 2012-2014 (conducted May-July), and H2 for 2015 and 2016 (conducted July-September).
Digital Radio Report 2016
data on the number of DAB radios in newly-registered cars, from the Society of Motor Vehicle Manufacturers and Traders (SMMT); and
RAJAR radio listening analysis.
As with any survey data, Ofcom’s Technology Tracker data is subject to an error margin of up to +/- 2 percentage points. Note that this report supersedes its predecessor.
In 2016, RAJAR – the industry body for the measurement of radio listening – implemented a new methodology which essentially re-allocated unspecified listening previously categorised as ‘analogue/digital not stated’ and ‘digital not stated’. This change in methodology means that new data are not entirely comparable with historical data.
The questions in the radio section of Ofcom’s Technology Tracker were re-ordered this year. It is likely that this has had some impact on trend data, so year-on-year comparisons have not always been shown.
1.3 Key points
Availability Digital radio services are available through a number of platforms: DAB, television and internet, but coverage varies. Local DAB services are estimated to reach around 90% of homes and around 76% of major roads. National BBC DAB services are now available to 97.3% of UK households and 87.3% of major roads. National commercial DAB services are available to 91.5% of UK homes via the Digital One network, and 76.5% of UK homes via the new Sound Digital Limited network which was launched in March this year. Television services which also carry digital radio services are available to 99% of households. The number of local DAB digital radio services available varies across the UK. In total there are 339 radio stations broadcasting on DAB. Of these, 32 are UK-wide commercial services and 11 are BBC UK-wide stations.
Take-up Nearly all households are able to receive digital radio services. 95% of households have televisions which give them the ability to listen to digital radio, compared to 86% through their internet connection, and more than half (57%) have a DAB radio set in the home.
The number of digital radios sold in the year to Q3 2016 has remained broadly similar to last year. Of the total number of radio sets sold, 1.6 million (34.8%) were capable of receiving DAB signals.
The highest level of DAB radio ownership was in Swindon and West Wiltshire (70%). The lowest take-up was in the Ceredigion area of Wales and in Northern Ireland (both 39%).
85% of newly-registered cars are now fitted with DAB as standard. This represents a year-on-year increase of 12 percentage points.
Digital listening Digital radio accounted for 45.5% of total listening hours in Q3 2016. This is a year-on-year increase of 3.6 percentage points in digital radio’s share of total listening hours.
Digital Radio Report 2016
3
Digital share of listening exceeded 50% in six local areas. Sussex had the highest share of radio listening via a digital platform, at 53.4%, followed by Berkshire and north Hampshire (53.2%), Swindon and west Wiltshire (51.4%), London (51.3%), Gloucestershire (50.2%) and Hertfordshire, Bedfordshire and Buckinghamshire (50.1%). DAB is the most popular platform for digital listening. In Q3 2016 it accounted for 70.3% of digital listening, while 11.9% was through a television and 17.8% was via the internet. BBC stations accounted for over half of all listening via a digital platform (52.8%); simulcasts of analogue BBC radio services made up the largest proportion of this. Seven digital-only stations had an average weekly reach of more than a million listeners in the 12 months to Q3 2016. BBC 6 Music was the most popular digital-only service, with an average of 2.2 million listeners per week. Absolute 80s was the most popular commercial digital-only station, with an average weekly reach of 1.6 million listeners. Radio listeners in the AB socio-economic group were the most likely to listen via digital radio. Nearly seven in ten (69.9%) in this group listened to digital radio on a weekly basis. By age group, digital radio listening on a weekly basis was highest for 35-44s (66.3%).
Consumer awareness and attitudes Eighty-three per cent of UK adults claimed in H2 2016 to have heard of digital radio.
‘Clear and high-quality sound’ and ‘a wider choice of stations’ were the most popular attributes associated with digital radio. Just under three-quarters (73%) of DAB owners said that they associated ‘clear and high quality sound’ with digital radio, and 70% said that they associated it with ‘a wider choice of stations’.
Thirteen per cent of radio listeners without a DAB set in the home said they were likely to buy one in the next year. Three in ten (30%) said that they didn’t know if they would buy a DAB set in the next year, and nearly six in ten (58%) said that they were unlikely to purchase one in the next year.
Digital Radio Report 2016
Section 2
2 Availability of digital radio services In November 2013 the Digital Radio Action Plan was finalised, and the DCMS announced that while there had been steady growth in digital listening, it was not yet the time to commit to a switchover.
The Government stated that it would consider a decision on whether to set a date for digital radio switchover when the following criteria were met:
when 50% of all radio listening is via digital platforms; and
when national DAB coverage is comparable to FM, and local DAB reaches 90% of the population and all major roads.
This chapter focuses on the availability of digital services.
2.1 Digital platforms on which radio services can be received
Radio services can be accessed on a range of digital platforms, and on devices such as a DAB digital radio, a TV set, and devices that connect to the internet. These include dedicated radios incorporating Wi-Fi connectivity, laptop and desktop computers, and mobile devices such as tablets and smartphones.
Consumers therefore have a range of options for receiving digital radio, each with different features and considerations. DAB has the benefit of being free to receive and portable, like analogue radio, but does require a specific receiver. Digital television switchover brought about the widespread adoption of DTV sets, so no additional investment in equipment is needed to receive radio services, although this platform does not generally offer portability or the same range of services. Listening through an internet-enabled device offers the widest range of audio services, including international content, and archive and on-demand content. However, using a computer, a radio with a Wi-Fi connection, or a smartphone or tablet, will usually require a paid-for broadband or 3G/4G connection, and data limits on some contracts can potentially impede significant consumption of radio on these devices.
2.2 Coverage of digital platforms
Internet access
Broadband internet access is available via ADSL to all UK homes, while 3G services are available to 99.6% of UK homes, and 4G services to 97.8%.3
Television services
Digital satellite television is available to 98% of UK households4, digital cable to 44%5 of homes and digital terrestrial television to 99% of households6, according to the latest estimates.
3 The Communications Market Report 2016 https://www.ofcom.org.uk/__data/assets/pdf_file/0024/26826/cmr_uk_2016.pdf 4 The Communications Market Report 2016 https://www.ofcom.org.uk/__data/assets/pdf_file/0024/26826/cmr_uk_2016.pdf
Digital Radio Report 2016
5
DAB coverage
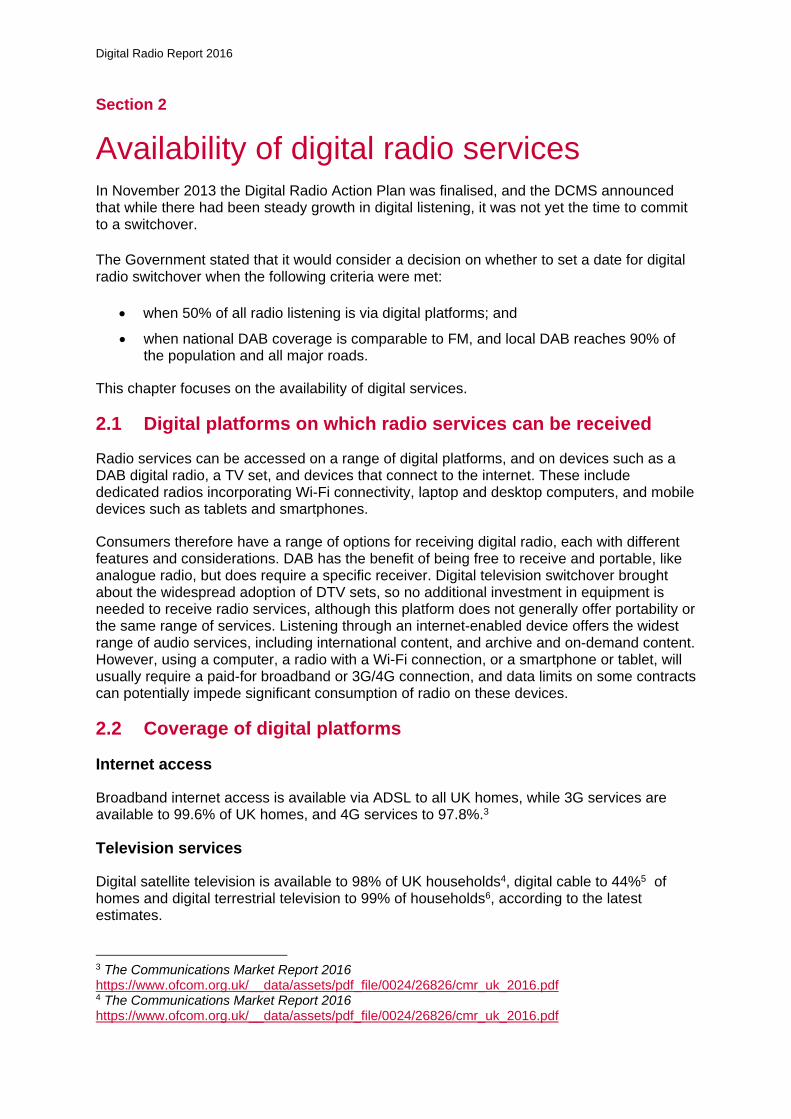
Estimated DAB coverage is shown in Figure 1. For local DAB services, household coverage has increased to around 90% and coverage on major roads has increased to around 76%. The BBC’s national multiplex is now available to 97.3% of households and covers 87.3% of major roads. National commercial DAB services are available to 91.5% of UK homes via the Digital One network and 76.5% of UK homes via the Sound Digital Limited network.
Figure 1: Estimated DAB coverage
Source: Ofcom, Arqiva, BBC, November 2016 Note: ‘National’ means UK-wide. Road coverage refers to motorways and A-roads. The network is in the process of being built out and the figures represent what we expect coverage to be when the current phase has been completed.
For comparison, the figures for FM coverage are outlined in Figure 2. However, these are not directly comparable with the DAB coverage figures, mainly because although it is possible to receive FM reception (albeit in poorer quality) with a low signal strength, DAB reception is either good or completely absent. These figures have not changed since last year.
Figure 2: Existing FM coverage
Source: Ofcom, November 2016 Note: ‘variable’ indicates that reception may be less than perfect quality; some artefacts will be present on the audio signal or there may be occasional short drop-outs.
2.3 Services available, by platform
Broadcast radio
As of October 2016, there were 584 analogue radio services available in the UK. This was made up of 98 broadcasting on AM, and 518 broadcasting on FM. There is some duplication
5 Virgin Media is currently extending its cable network http://www.virginmedia.com/corporate/about-us/our-key-projects.html 6 The Communications Market Report 2016 https://www.ofcom.org.uk/__data/assets/pdf_file/0024/26826/cmr_uk_2016.pdf
Digital Radio Report 2016
of services across AM and FM as some stations, such as the BBC’s local and nations’ services, simulcast on both wavebands.
The number of analogue stations continues to increase each year as Ofcom issues new community radio licences. There were 234 community radio stations in September 2015; in October 2016 this had grown to 244. There are currently only a very small number of community stations broadcasting on DAB.
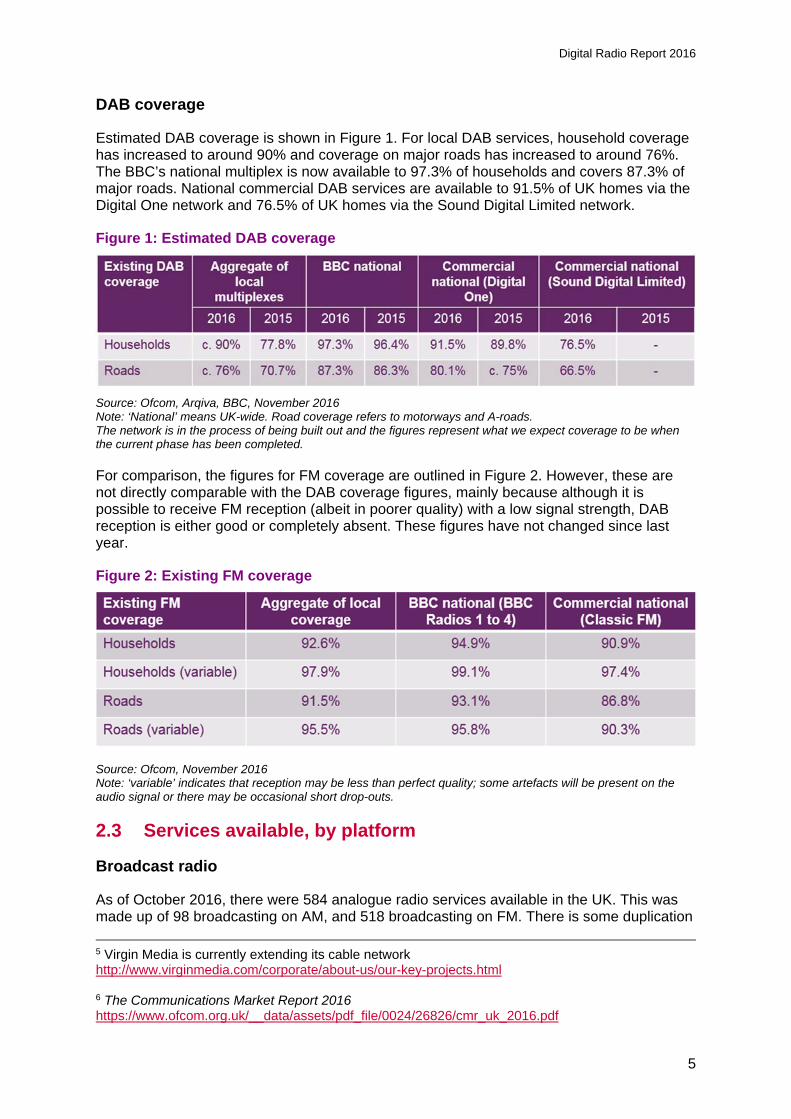
Figure 3: Number of UK radio stations broadcasting on analogue, October 2016
Source: Ofcom, October 2016. Note: the conditions of each licence will determine the amount of programming that may be shared between these licensed services. Here we have taken the view that a service providing at least four hours a day of separate programming (even if the same brand has other services) equals one service. As of October 2016, there were 339 radio stations broadcasting on DAB. Of these, 32 commercial radio services were broadcast by the two national DAB operators, Digital One and Sound Digital Limited. Eleven further services were BBC UK-wide stations. Both the BBC and the commercial sector simulcast some services on DAB and analogue. There were 136 local commercial services available, 95 of which were solely on DAB, and 19 were broadcasting to different geographical regions while broadcasting on analogue in another smaller area. The total number of UK radio stations broadcasting on DAB has also increased year on year; from 283 in September 2015 to 339 in October 2016.
Ofcom is currently undertaking a technical trial of a new software-based platform for DAB, intended for use by small-scale community and commercial radio services. Ten trials, carrying around 80 services, are currently taking place. These have been licensed until mid-2018, by which time it is expected that a permanent licensing regime will be in place to enable many more to be licensed.
Digital Radio Report 2016
7
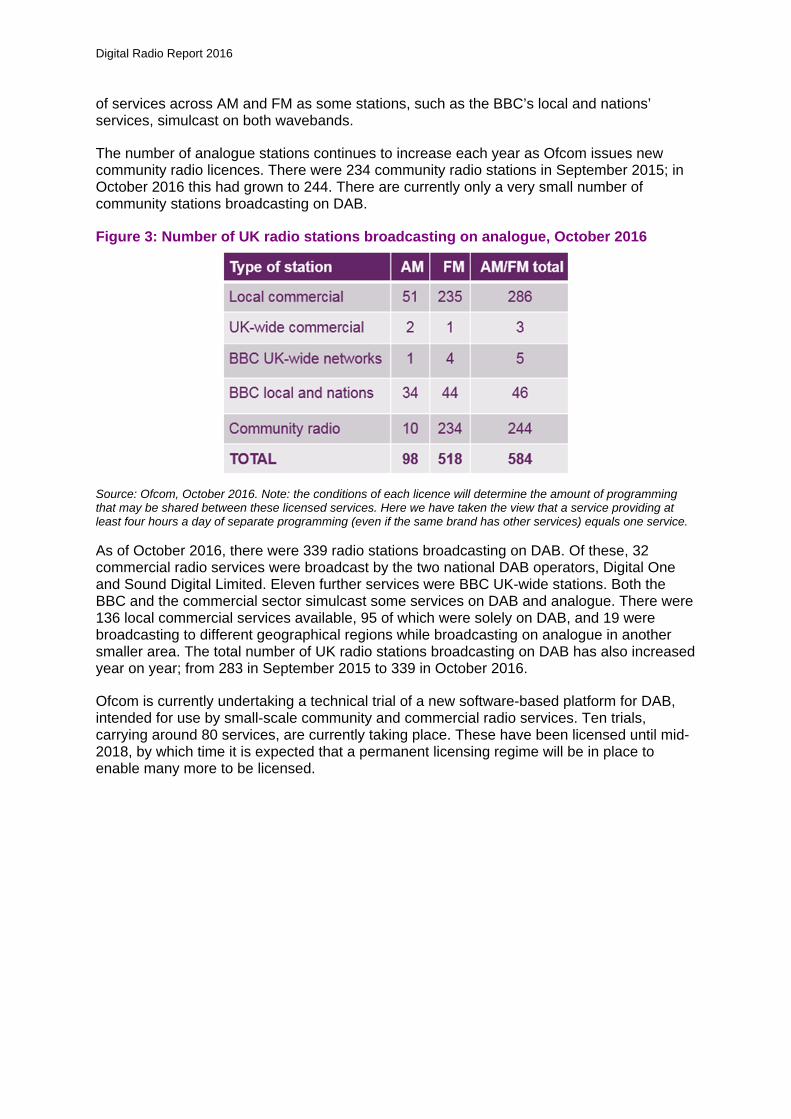
Figure 4: Number of UK radio stations broadcasting on DAB: October 2016
Source: Ofcom, October 2016
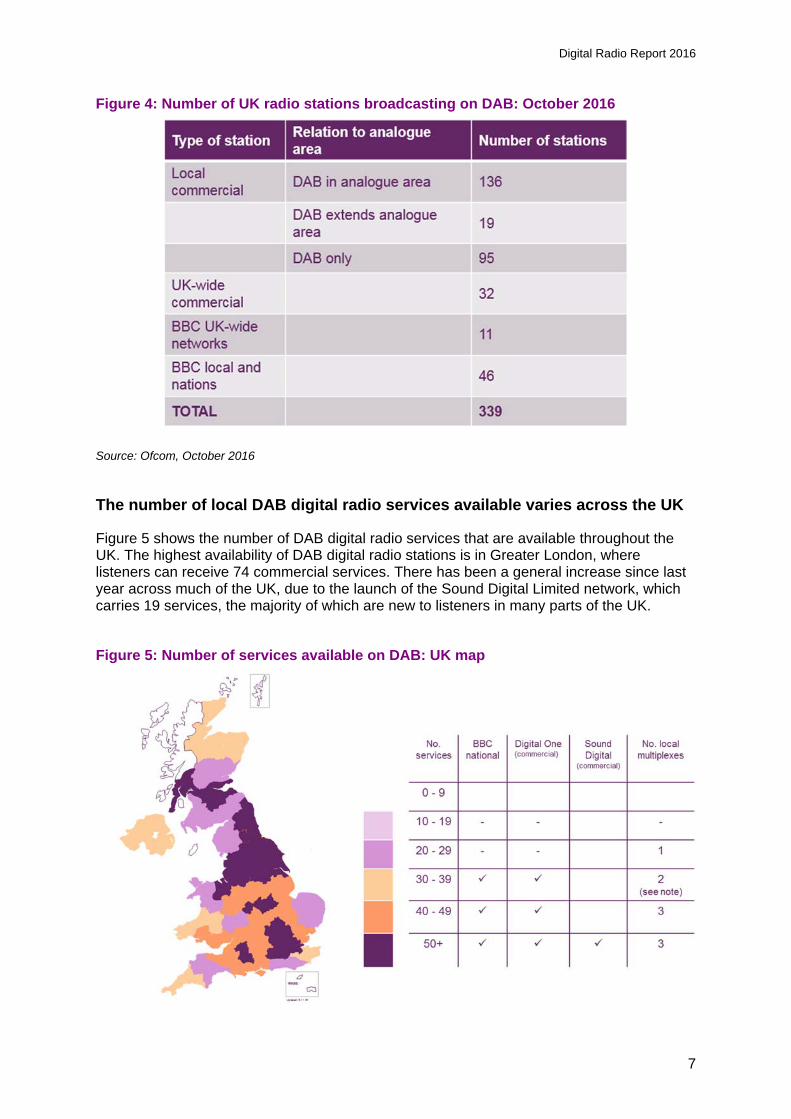
The number of local DAB digital radio services available varies across the UK
Figure 5 shows the number of DAB digital radio services that are available throughout the UK. The highest availability of DAB digital radio stations is in Greater London, where listeners can receive 74 commercial services. There has been a general increase since last year across much of the UK, due to the launch of the Sound Digital Limited network, which carries 19 services, the majority of which are new to listeners in many parts of the UK.
Figure 5: Number of services available on DAB: UK map
Digital Radio Report 2016
Source: Ofcom, November 2016. Note: the Tyne and Wear and Teesside areas have one multiplex each, but each of these multiplexes carry more services than most other local multiplexes
Television
There are 57 radio stations broadcasting on digital satellite (available on the Sky EPG), 37 on cable (carried by Virgin Media) and more than 30 on Freeview7. Most of these are simulcasts of AM/FM/DAB services.
Internet
It is not within Ofcom’s remit to license radio stations on the internet, and therefore we keep no record of the number of services available. As an indication, however, the database of stations available on TuneIn (an online service which streams live radio content through a browser or app), included over 100,000 internationally accessible stations in November 2016. Radioplayer, a partnership set up with the BBC and UK commercial radio, currently carries over 400 stations (including some community stations) through its website and app.
7 This number depends on location.
Digital Radio Report 2016
9
Section 3
3 Take-up of devices and platforms 3.1 Ownership of digital radio-enabled devices
Fifty-seven per cent of UK adults have a DAB set in their home
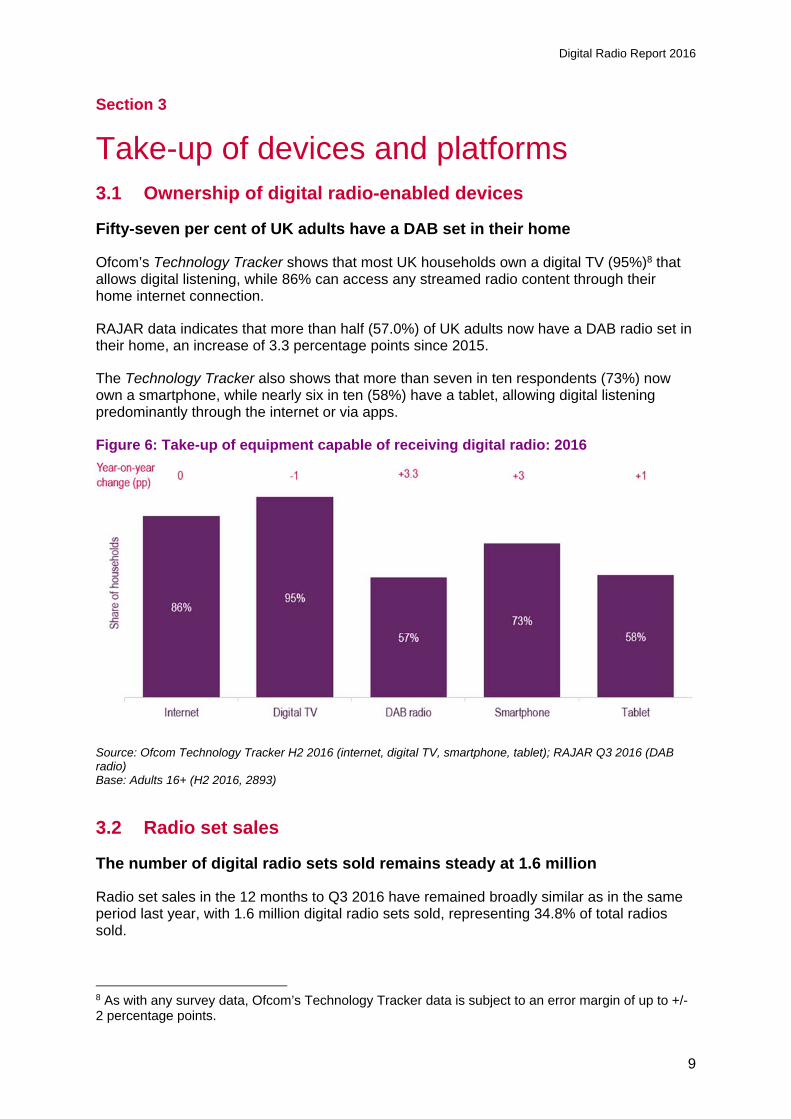
Ofcom’s Technology Tracker shows that most UK households own a digital TV (95%)8 that allows digital listening, while 86% can access any streamed radio content through their home internet connection.
RAJAR data indicates that more than half (57.0%) of UK adults now have a DAB radio set in their home, an increase of 3.3 percentage points since 2015.
The Technology Tracker also shows that more than seven in ten respondents (73%) now own a smartphone, while nearly six in ten (58%) have a tablet, allowing digital listening predominantly through the internet or via apps.
Figure 6: Take-up of equipment capable of receiving digital radio: 2016
Source: Ofcom Technology Tracker H2 2016 (internet, digital TV, smartphone, tablet); RAJAR Q3 2016 (DAB radio) Base: Adults 16+ (H2 2016, 2893)
3.2 Radio set sales
The number of digital radio sets sold remains steady at 1.6 million
Radio set sales in the 12 months to Q3 2016 have remained broadly similar as in the same period last year, with 1.6 million digital radio sets sold, representing 34.8% of total radios sold.
8 As with any survey data, Ofcom’s Technology Tracker data is subject to an error margin of up to +/- 2 percentage points.
Digital Radio Report 2016
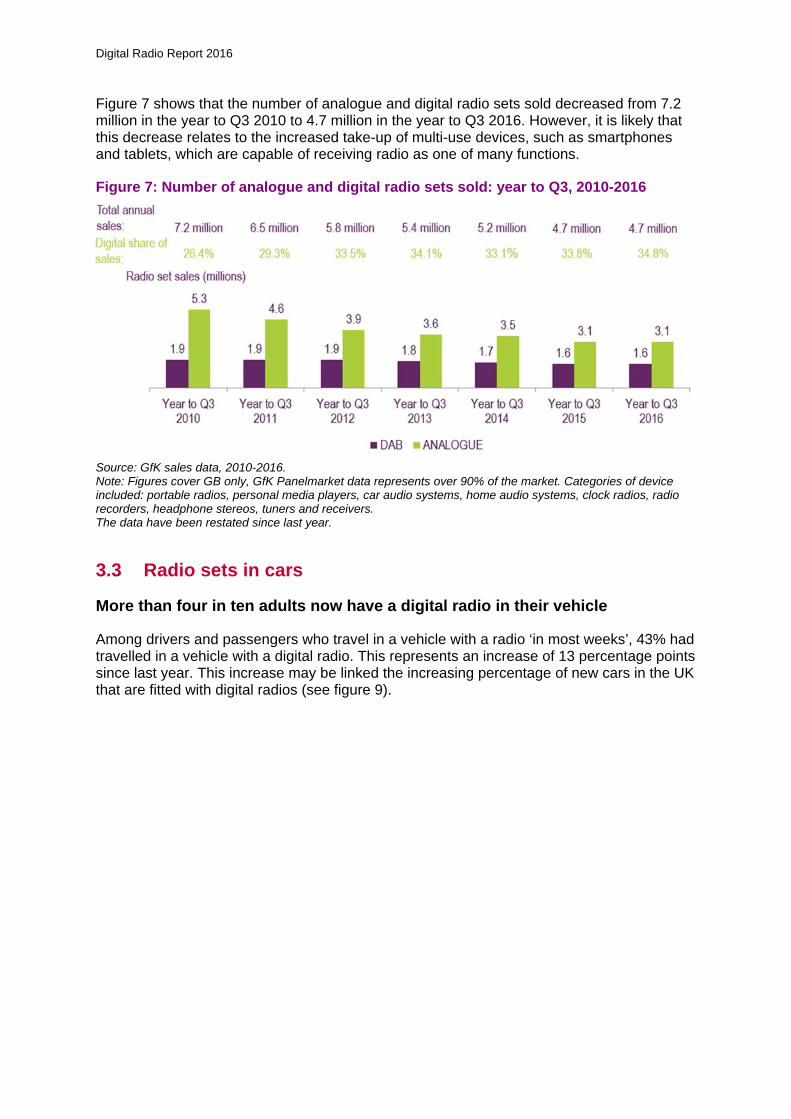
Figure 7 shows that the number of analogue and digital radio sets sold decreased from 7.2 million in the year to Q3 2010 to 4.7 million in the year to Q3 2016. However, it is likely that this decrease relates to the increased take-up of multi-use devices, such as smartphones and tablets, which are capable of receiving radio as one of many functions.
Figure 7: Number of analogue and digital radio sets sold: year to Q3, 2010-2016
Source: GfK sales data, 2010-2016. Note: Figures cover GB only, GfK Panelmarket data represents over 90% of the market. Categories of device included: portable radios, personal media players, car audio systems, home audio systems, clock radios, radio recorders, headphone stereos, tuners and receivers. The data have been restated since last year.
3.3 Radio sets in cars
More than four in ten adults now have a digital radio in their vehicle
Among drivers and passengers who travel in a vehicle with a radio ‘in most weeks’, 43% had travelled in a vehicle with a digital radio. This represents an increase of 13 percentage points since last year. This increase may be linked the increasing percentage of new cars in the UK that are fitted with digital radios (see figure 9).
Digital Radio Report 2016
11
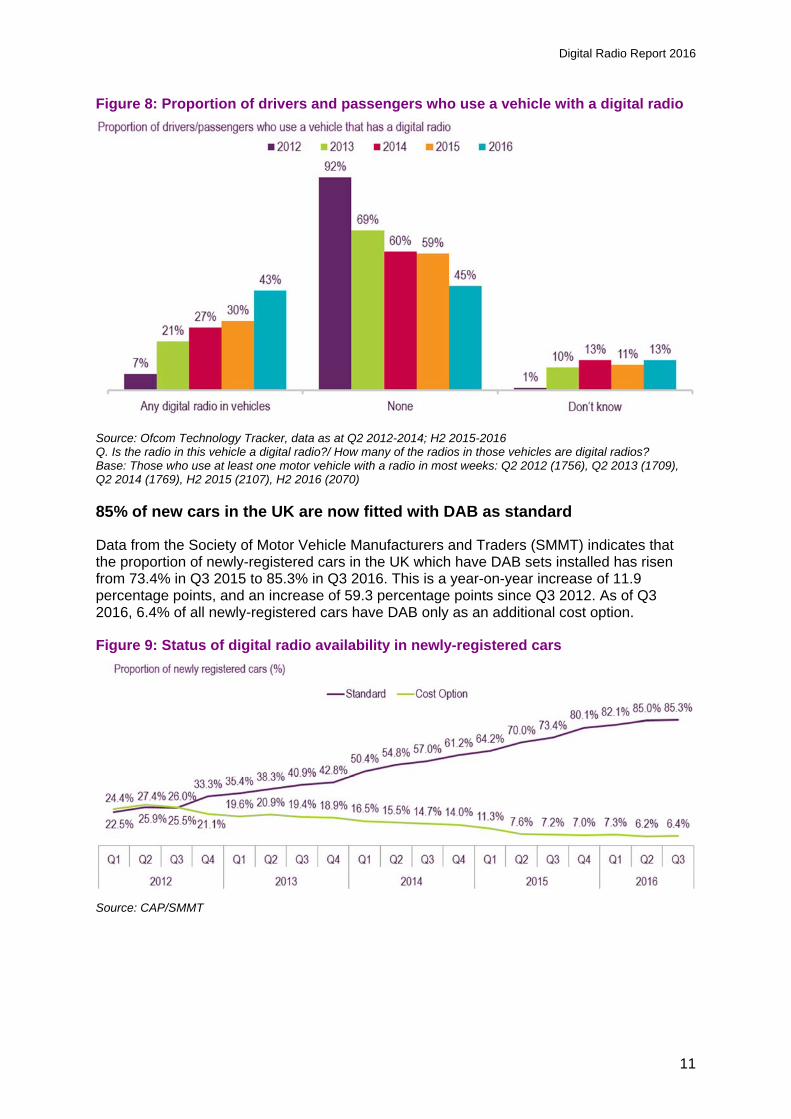
Figure 8: Proportion of drivers and passengers who use a vehicle with a digital radio
Source: Ofcom Technology Tracker, data as at Q2 2012-2014; H2 2015-2016 Q. Is the radio in this vehicle a digital radio?/ How many of the radios in those vehicles are digital radios? Base: Those who use at least one motor vehicle with a radio in most weeks: Q2 2012 (1756), Q2 2013 (1709), Q2 2014 (1769), H2 2015 (2107), H2 2016 (2070)
85% of new cars in the UK are now fitted with DAB as standard
Data from the Society of Motor Vehicle Manufacturers and Traders (SMMT) indicates that the proportion of newly-registered cars in the UK which have DAB sets installed has risen from 73.4% in Q3 2015 to 85.3% in Q3 2016. This is a year-on-year increase of 11.9 percentage points, and an increase of 59.3 percentage points since Q3 2012. As of Q3 2016, 6.4% of all newly-registered cars have DAB only as an additional cost option.
Figure 9: Status of digital radio availability in newly-registered cars
Source: CAP/SMMT
Digital Radio Report 2016
3.4 Radio sets at home
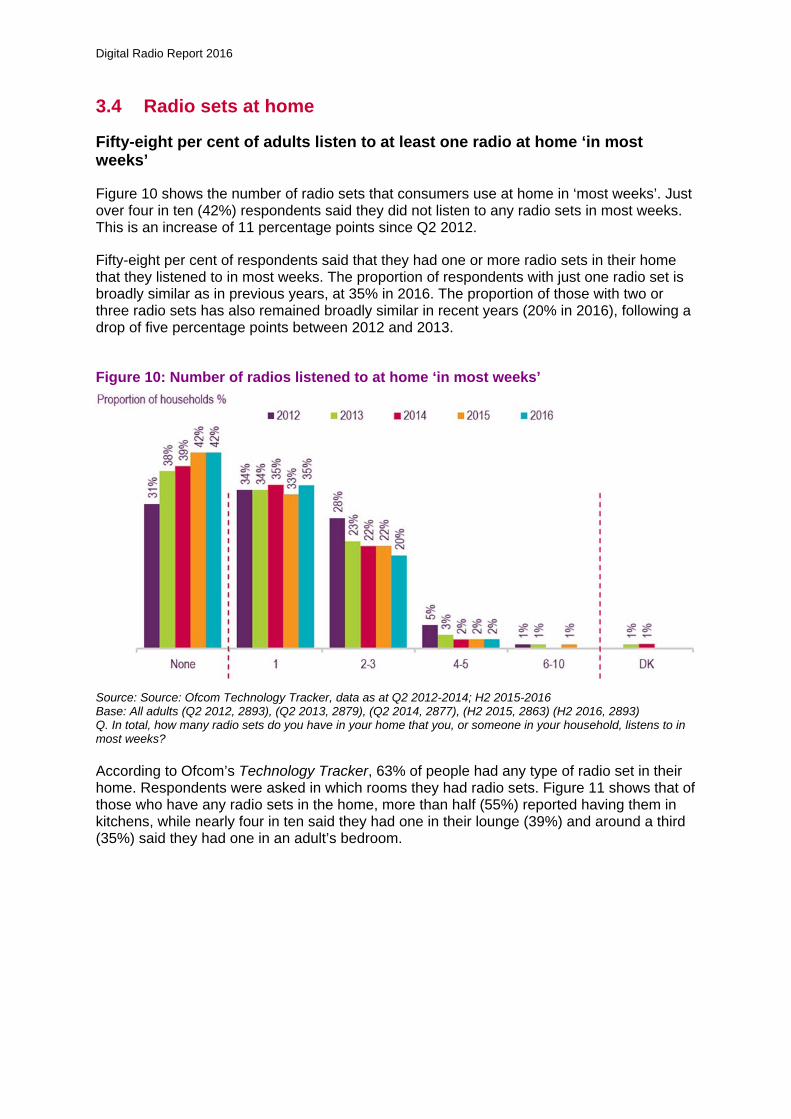
Fifty-eight per cent of adults listen to at least one radio at home ‘in most weeks’
Figure 10 shows the number of radio sets that consumers use at home in ‘most weeks’. Just over four in ten (42%) respondents said they did not listen to any radio sets in most weeks. This is an increase of 11 percentage points since Q2 2012.
Fifty-eight per cent of respondents said that they had one or more radio sets in their home that they listened to in most weeks. The proportion of respondents with just one radio set is broadly similar as in previous years, at 35% in 2016. The proportion of those with two or three radio sets has also remained broadly similar in recent years (20% in 2016), following a drop of five percentage points between 2012 and 2013.
Figure 10: Number of radios listened to at home ‘in most weeks’
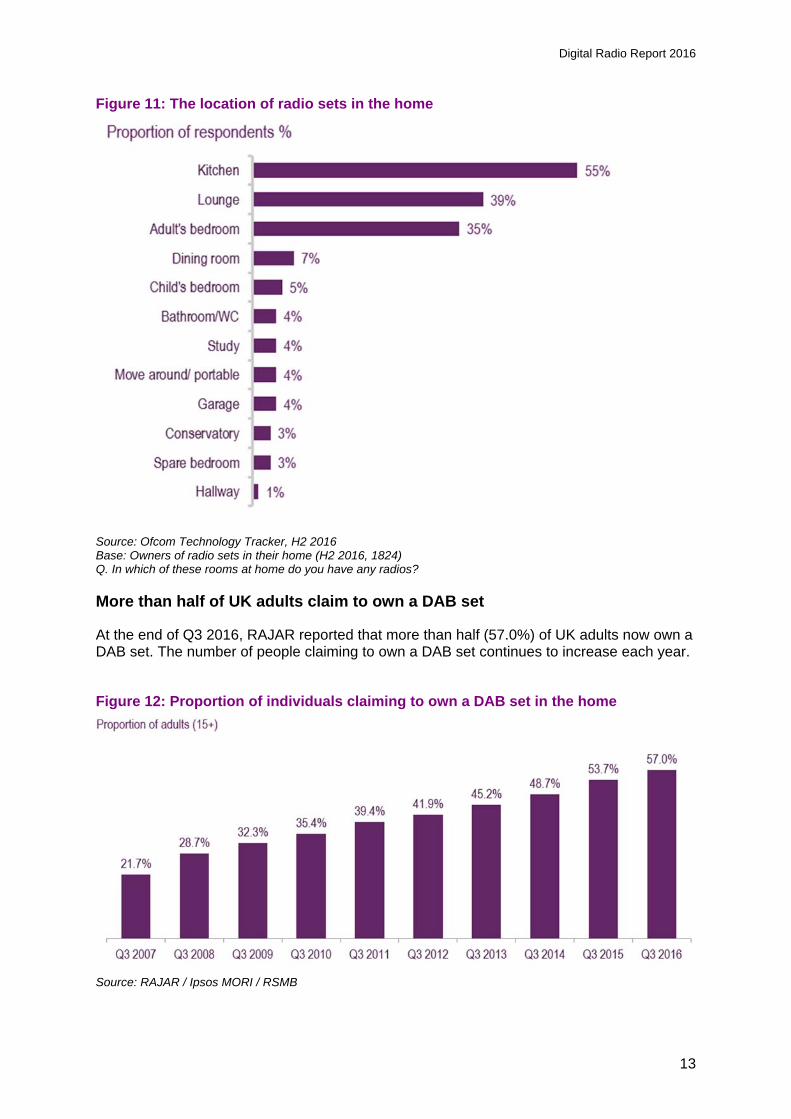
Source: Source: Ofcom Technology Tracker, data as at Q2 2012-2014; H2 2015-2016 Base: All adults (Q2 2012, 2893), (Q2 2013, 2879), (Q2 2014, 2877), (H2 2015, 2863) (H2 2016, 2893) Q. In total, how many radio sets do you have in your home that you, or someone in your household, listens to in most weeks? According to Ofcom’s Technology Tracker, 63% of people had any type of radio set in their home. Respondents were asked in which rooms they had radio sets. Figure 11 shows that of those who have any radio sets in the home, more than half (55%) reported having them in kitchens, while nearly four in ten said they had one in their lounge (39%) and around a third (35%) said they had one in an adult’s bedroom.
Digital Radio Report 2016
13
Figure 11: The location of radio sets in the home
Source: Ofcom Technology Tracker, H2 2016 Base: Owners of radio sets in their home (H2 2016, 1824) Q. In which of these rooms at home do you have any radios?
More than half of UK adults claim to own a DAB set
At the end of Q3 2016, RAJAR reported that more than half (57.0%) of UK adults now own a DAB set. The number of people claiming to own a DAB set continues to increase each year.
Figure 12: Proportion of individuals claiming to own a DAB set in the home
Source: RAJAR / Ipsos MORI / RSMB
Digital Radio Report 2016
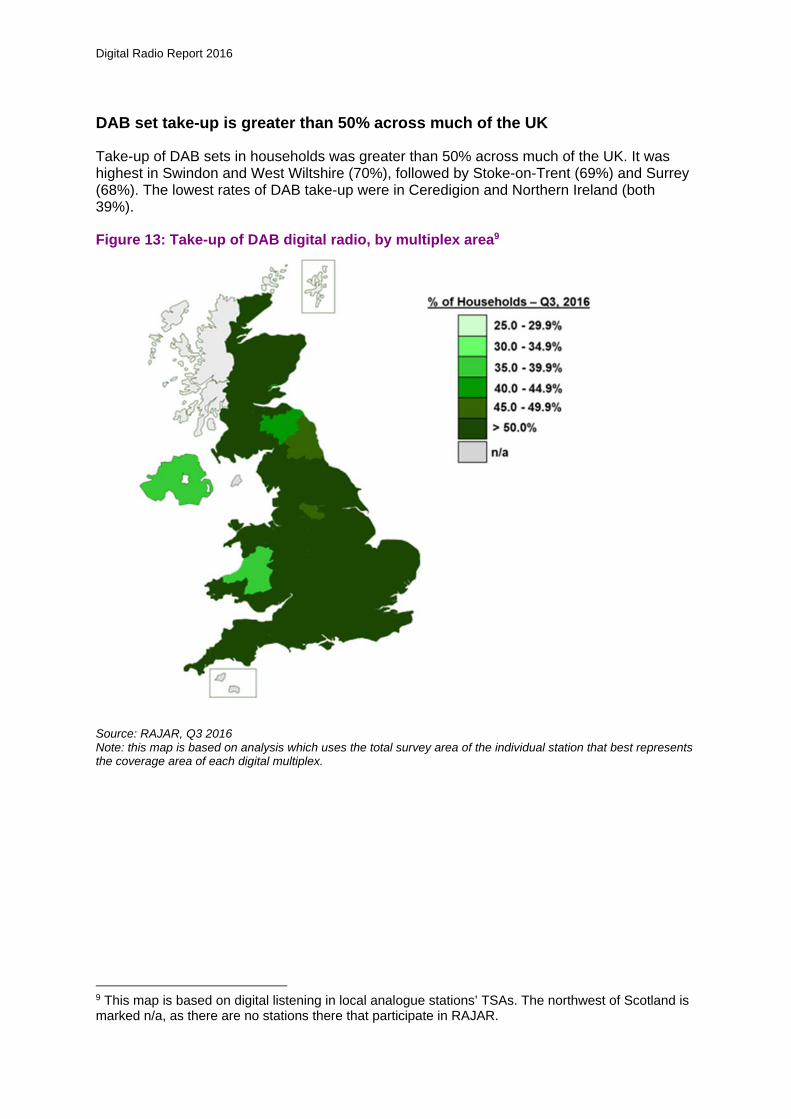
DAB set take-up is greater than 50% across much of the UK
Take-up of DAB sets in households was greater than 50% across much of the UK. It was highest in Swindon and West Wiltshire (70%), followed by Stoke-on-Trent (69%) and Surrey (68%). The lowest rates of DAB take-up were in Ceredigion and Northern Ireland (both 39%).
Figure 13: Take-up of DAB digital radio, by multiplex area9
Source: RAJAR, Q3 2016 Note: this map is based on analysis which uses the total survey area of the individual station that best represents the coverage area of each digital multiplex.
9 This map is based on digital listening in local analogue stations’ TSAs. The northwest of Scotland is marked n/a, as there are no stations there that participate in RAJAR.
Digital Radio Report 2016
15
Section 4
4 Radio listening through digital platforms As noted earlier in this report, one of the Government’s stated criteria for considering a possible switchover is when 50% of all radio listening is via digital platforms.
This section focuses on digital radio listening.
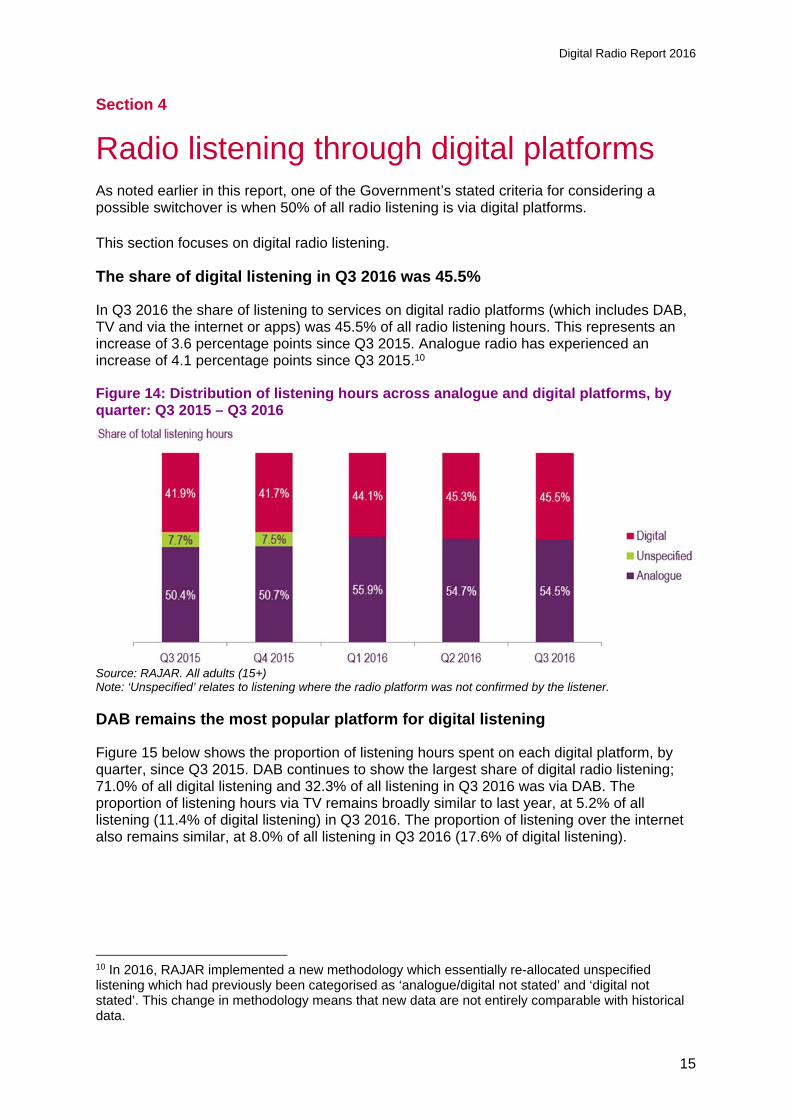
The share of digital listening in Q3 2016 was 45.5%
In Q3 2016 the share of listening to services on digital radio platforms (which includes DAB, TV and via the internet or apps) was 45.5% of all radio listening hours. This represents an increase of 3.6 percentage points since Q3 2015. Analogue radio has experienced an increase of 4.1 percentage points since Q3 2015.10
Figure 14: Distribution of listening hours across analogue and digital platforms, by quarter: Q3 2015 – Q3 2016
Source: RAJAR. All adults (15+) Note: ‘Unspecified’ relates to listening where the radio platform was not confirmed by the listener.
DAB remains the most popular platform for digital listening
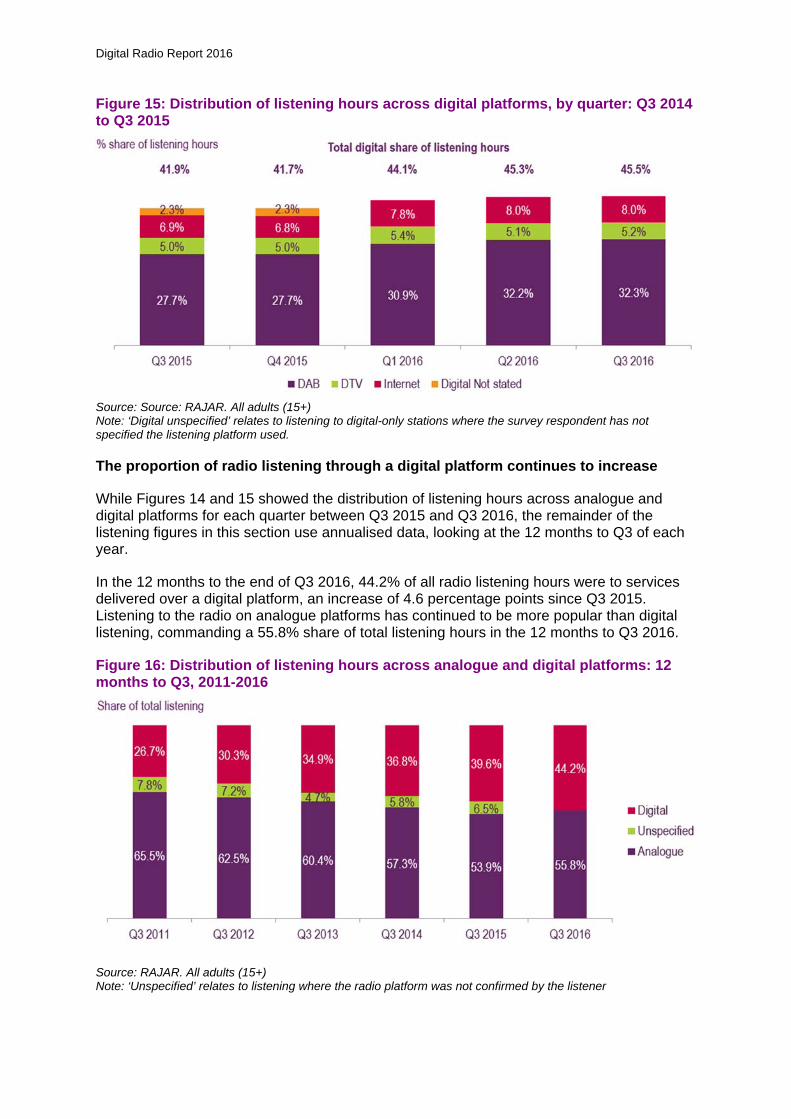
Figure 15 below shows the proportion of listening hours spent on each digital platform, by quarter, since Q3 2015. DAB continues to show the largest share of digital radio listening; 71.0% of all digital listening and 32.3% of all listening in Q3 2016 was via DAB. The proportion of listening hours via TV remains broadly similar to last year, at 5.2% of all listening (11.4% of digital listening) in Q3 2016. The proportion of listening over the internet also remains similar, at 8.0% of all listening in Q3 2016 (17.6% of digital listening).
10 In 2016, RAJAR implemented a new methodology which essentially re-allocated unspecified listening which had previously been categorised as ‘analogue/digital not stated’ and ‘digital not stated’. This change in methodology means that new data are not entirely comparable with historical data.
Digital Radio Report 2016
Figure 15: Distribution of listening hours across digital platforms, by quarter: Q3 2014 to Q3 2015
Source: Source: RAJAR. All adults (15+) Note: ‘Digital unspecified’ relates to listening to digital-only stations where the survey respondent has not specified the listening platform used.
The proportion of radio listening through a digital platform continues to increase
While Figures 14 and 15 showed the distribution of listening hours across analogue and digital platforms for each quarter between Q3 2015 and Q3 2016, the remainder of the listening figures in this section use annualised data, looking at the 12 months to Q3 of each year.
In the 12 months to the end of Q3 2016, 44.2% of all radio listening hours were to services delivered over a digital platform, an increase of 4.6 percentage points since Q3 2015. Listening to the radio on analogue platforms has continued to be more popular than digital listening, commanding a 55.8% share of total listening hours in the 12 months to Q3 2016.
Figure 16: Distribution of listening hours across analogue and digital platforms: 12 months to Q3, 2011-2016
Source: RAJAR. All adults (15+) Note: ‘Unspecified’ relates to listening where the radio platform was not confirmed by the listener
Digital Radio Report 2016
17
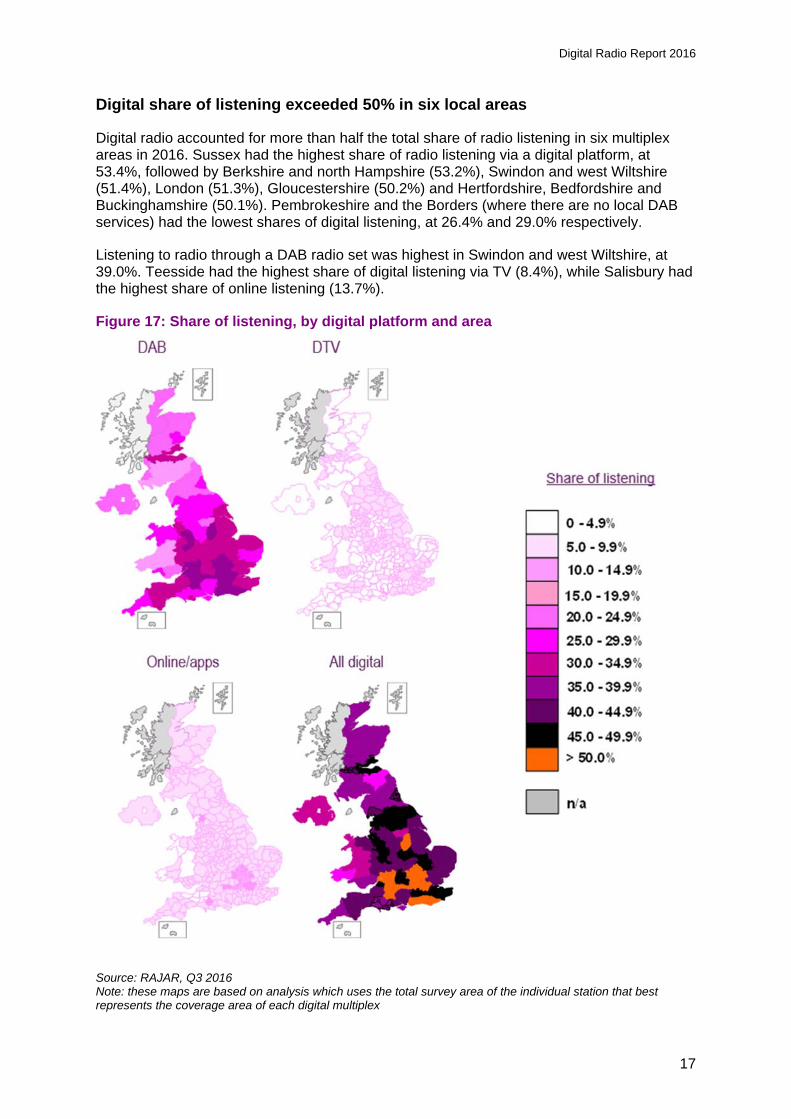
Digital share of listening exceeded 50% in six local areas
Digital radio accounted for more than half the total share of radio listening in six multiplex areas in 2016. Sussex had the highest share of radio listening via a digital platform, at 53.4%, followed by Berkshire and north Hampshire (53.2%), Swindon and west Wiltshire (51.4%), London (51.3%), Gloucestershire (50.2%) and Hertfordshire, Bedfordshire and Buckinghamshire (50.1%). Pembrokeshire and the Borders (where there are no local DAB services) had the lowest shares of digital listening, at 26.4% and 29.0% respectively.
Listening to radio through a DAB radio set was highest in Swindon and west Wiltshire, at 39.0%. Teesside had the highest share of digital listening via TV (8.4%), while Salisbury had the highest share of online listening (13.7%).
Figure 17: Share of listening, by digital platform and area
Source: RAJAR, Q3 2016 Note: these maps are based on analysis which uses the total survey area of the individual station that best represents the coverage area of each digital multiplex
Digital Radio Report 2016
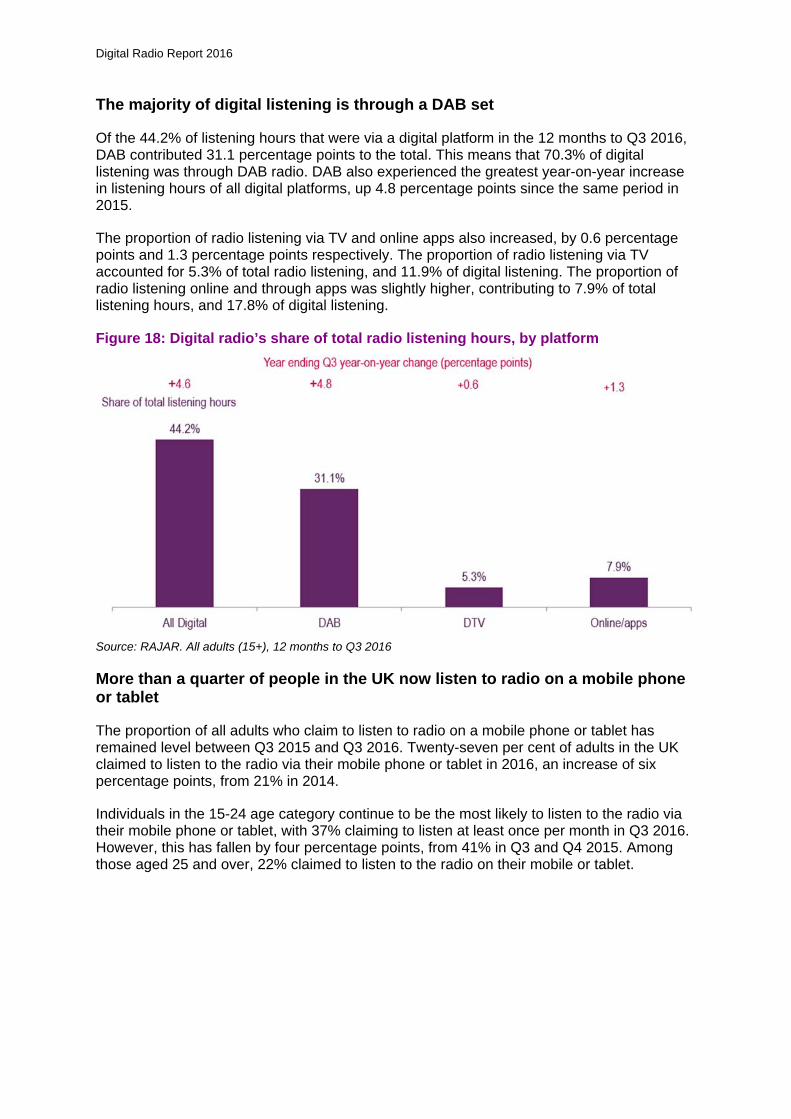
The majority of digital listening is through a DAB set
Of the 44.2% of listening hours that were via a digital platform in the 12 months to Q3 2016, DAB contributed 31.1 percentage points to the total. This means that 70.3% of digital listening was through DAB radio. DAB also experienced the greatest year-on-year increase in listening hours of all digital platforms, up 4.8 percentage points since the same period in 2015.
The proportion of radio listening via TV and online apps also increased, by 0.6 percentage points and 1.3 percentage points respectively. The proportion of radio listening via TV accounted for 5.3% of total radio listening, and 11.9% of digital listening. The proportion of radio listening online and through apps was slightly higher, contributing to 7.9% of total listening hours, and 17.8% of digital listening.
Figure 18: Digital radio’s share of total radio listening hours, by platform
Source: RAJAR. All adults (15+), 12 months to Q3 2016
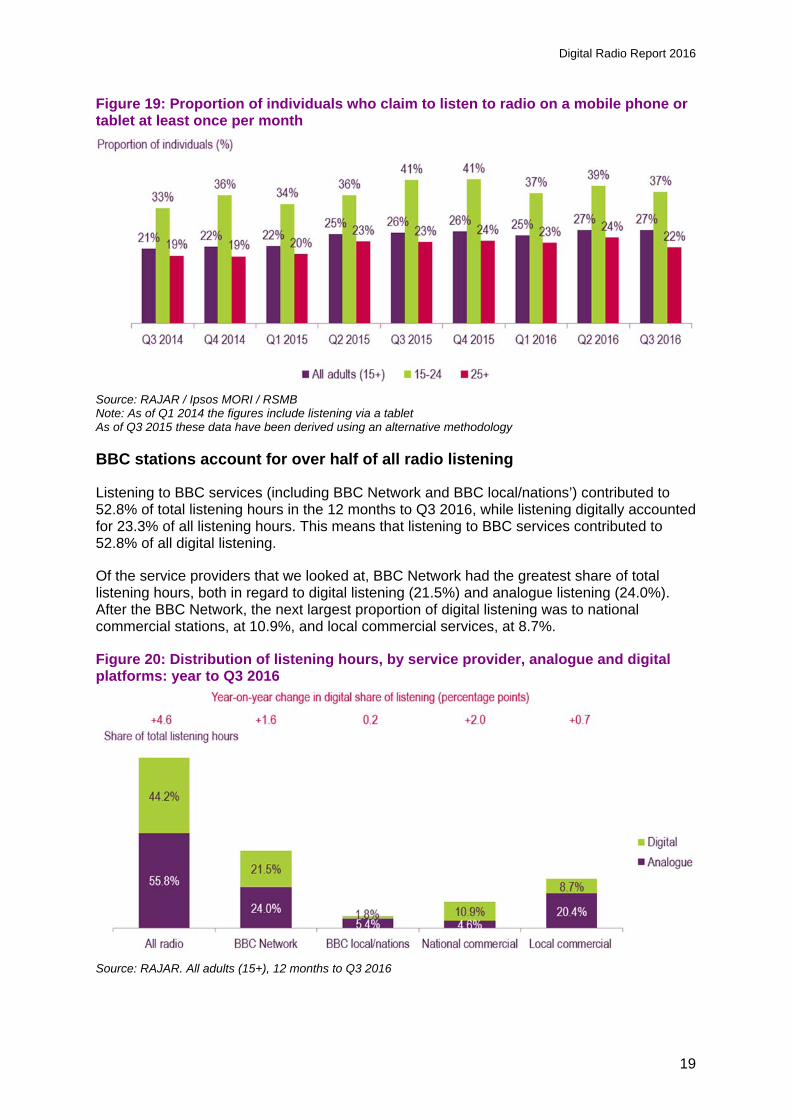
More than a quarter of people in the UK now listen to radio on a mobile phone or tablet
The proportion of all adults who claim to listen to radio on a mobile phone or tablet has remained level between Q3 2015 and Q3 2016. Twenty-seven per cent of adults in the UK claimed to listen to the radio via their mobile phone or tablet in 2016, an increase of six percentage points, from 21% in 2014.
Individuals in the 15-24 age category continue to be the most likely to listen to the radio via their mobile phone or tablet, with 37% claiming to listen at least once per month in Q3 2016. However, this has fallen by four percentage points, from 41% in Q3 and Q4 2015. Among those aged 25 and over, 22% claimed to listen to the radio on their mobile or tablet.
Digital Radio Report 2016
19
Figure 19: Proportion of individuals who claim to listen to radio on a mobile phone or tablet at least once per month
Source: RAJAR / Ipsos MORI / RSMB Note: As of Q1 2014 the figures include listening via a tablet As of Q3 2015 these data have been derived using an alternative methodology
BBC stations account for over half of all radio listening
Listening to BBC services (including BBC Network and BBC local/nations’) contributed to 52.8% of total listening hours in the 12 months to Q3 2016, while listening digitally accounted for 23.3% of all listening hours. This means that listening to BBC services contributed to 52.8% of all digital listening.
Of the service providers that we looked at, BBC Network had the greatest share of total listening hours, both in regard to digital listening (21.5%) and analogue listening (24.0%). After the BBC Network, the next largest proportion of digital listening was to national commercial stations, at 10.9%, and local commercial services, at 8.7%.
Figure 20: Distribution of listening hours, by service provider, analogue and digital platforms: year to Q3 2016
Source: RAJAR. All adults (15+), 12 months to Q3 2016
Digital Radio Report 2016
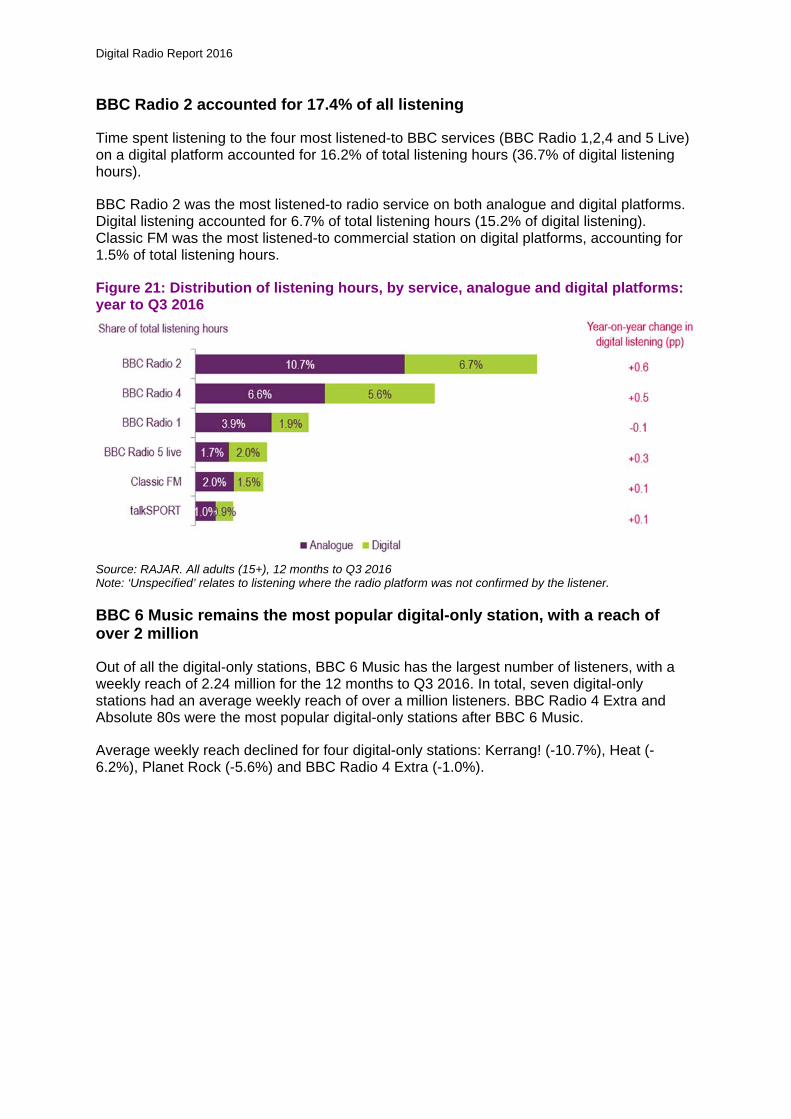
BBC Radio 2 accounted for 17.4% of all listening
Time spent listening to the four most listened-to BBC services (BBC Radio 1,2,4 and 5 Live) on a digital platform accounted for 16.2% of total listening hours (36.7% of digital listening hours).
BBC Radio 2 was the most listened-to radio service on both analogue and digital platforms. Digital listening accounted for 6.7% of total listening hours (15.2% of digital listening). Classic FM was the most listened-to commercial station on digital platforms, accounting for 1.5% of total listening hours.
Figure 21: Distribution of listening hours, by service, analogue and digital platforms: year to Q3 2016
Source: RAJAR. All adults (15+), 12 months to Q3 2016 Note: ‘Unspecified’ relates to listening where the radio platform was not confirmed by the listener.
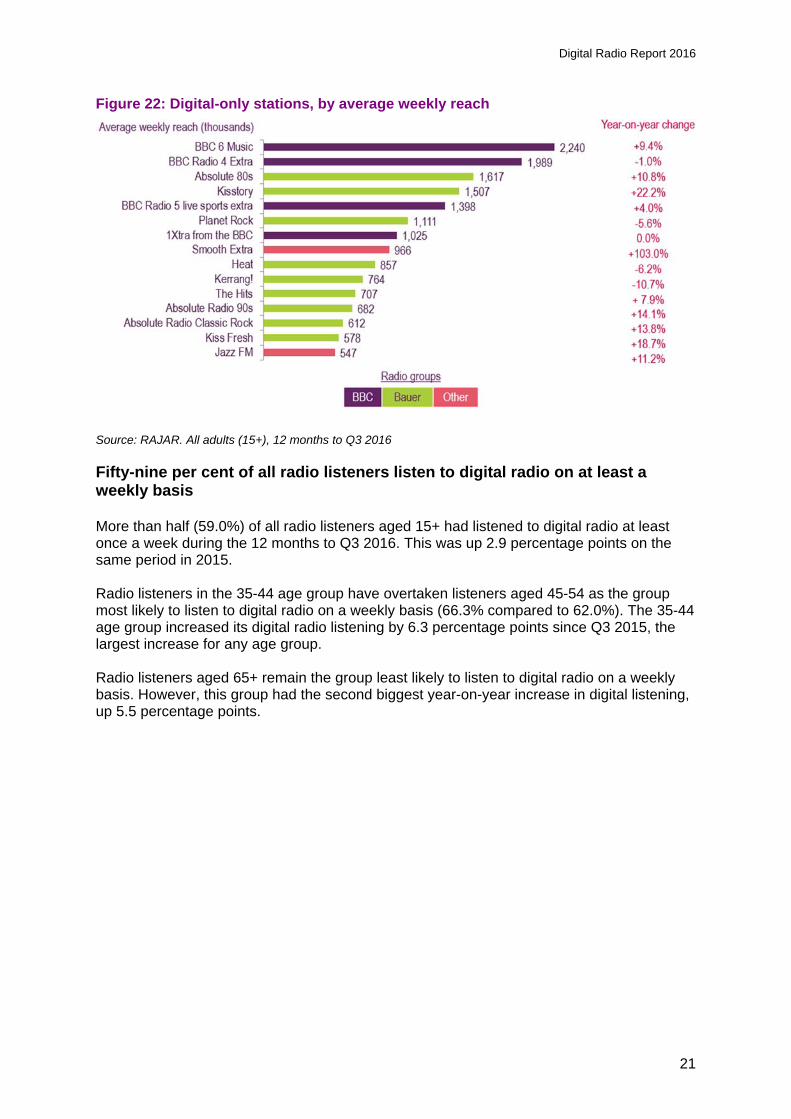
BBC 6 Music remains the most popular digital-only station, with a reach of over 2 million
Out of all the digital-only stations, BBC 6 Music has the largest number of listeners, with a weekly reach of 2.24 million for the 12 months to Q3 2016. In total, seven digital-only stations had an average weekly reach of over a million listeners. BBC Radio 4 Extra and Absolute 80s were the most popular digital-only stations after BBC 6 Music.
Average weekly reach declined for four digital-only stations: Kerrang! (-10.7%), Heat (-6.2%), Planet Rock (-5.6%) and BBC Radio 4 Extra (-1.0%).
Digital Radio Report 2016
21
Figure 22: Digital-only stations, by average weekly reach
Source: RAJAR. All adults (15+), 12 months to Q3 2016
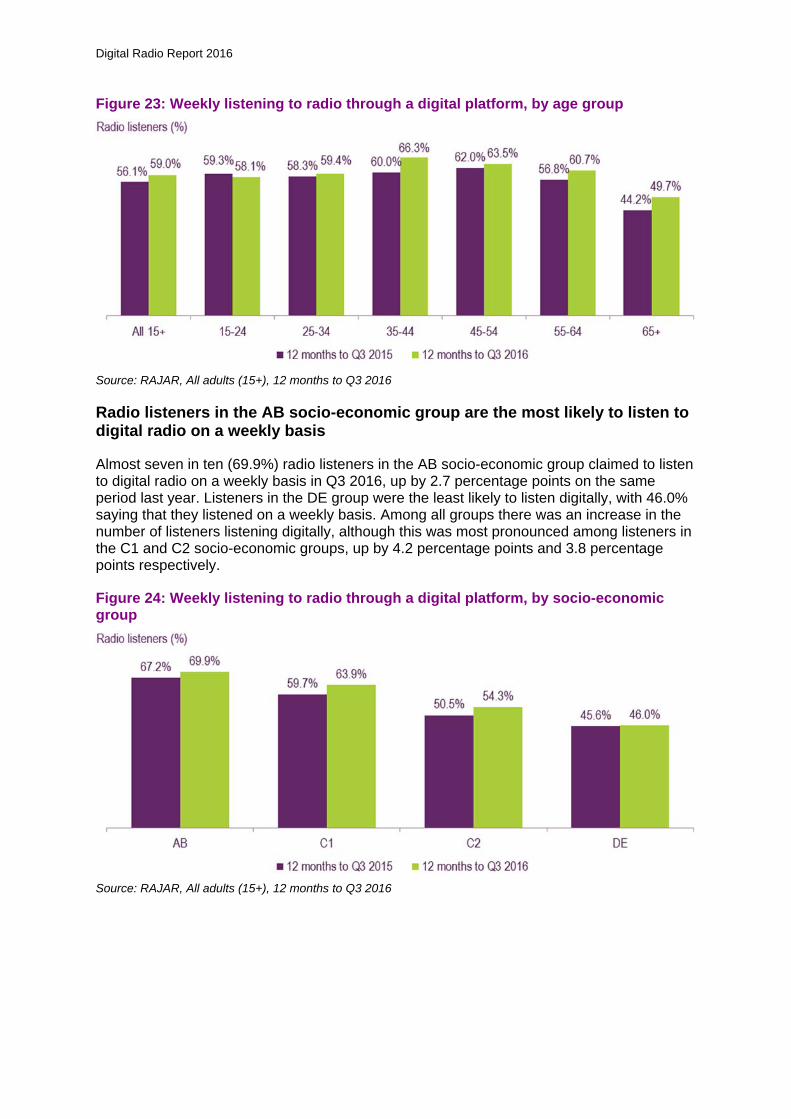
Fifty-nine per cent of all radio listeners listen to digital radio on at least a weekly basis More than half (59.0%) of all radio listeners aged 15+ had listened to digital radio at least once a week during the 12 months to Q3 2016. This was up 2.9 percentage points on the same period in 2015. Radio listeners in the 35-44 age group have overtaken listeners aged 45-54 as the group most likely to listen to digital radio on a weekly basis (66.3% compared to 62.0%). The 35-44 age group increased its digital radio listening by 6.3 percentage points since Q3 2015, the largest increase for any age group. Radio listeners aged 65+ remain the group least likely to listen to digital radio on a weekly basis. However, this group had the second biggest year-on-year increase in digital listening, up 5.5 percentage points.
Digital Radio Report 2016
Figure 23: Weekly listening to radio through a digital platform, by age group
Source: RAJAR, All adults (15+), 12 months to Q3 2016
Radio listeners in the AB socio-economic group are the most likely to listen to digital radio on a weekly basis
Almost seven in ten (69.9%) radio listeners in the AB socio-economic group claimed to listen to digital radio on a weekly basis in Q3 2016, up by 2.7 percentage points on the same period last year. Listeners in the DE group were the least likely to listen digitally, with 46.0% saying that they listened on a weekly basis. Among all groups there was an increase in the number of listeners listening digitally, although this was most pronounced among listeners in the C1 and C2 socio-economic groups, up by 4.2 percentage points and 3.8 percentage points respectively.
Figure 24: Weekly listening to radio through a digital platform, by socio-economic group
Source: RAJAR, All adults (15+), 12 months to Q3 2016
Digital Radio Report 2016
23
Section 5
5 Consumer awareness of, and attitudes towards, digital radio 5.1 Consumer awareness of digital radio
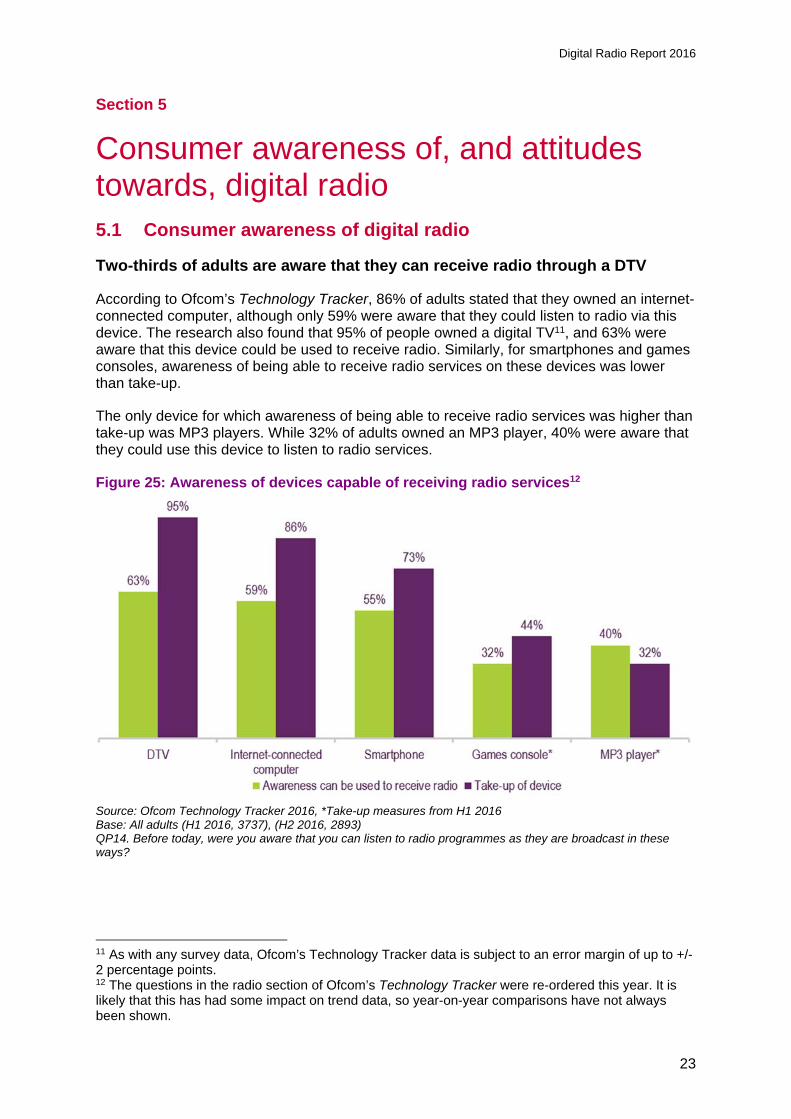
Two-thirds of adults are aware that they can receive radio through a DTV
According to Ofcom’s Technology Tracker, 86% of adults stated that they owned an internet-connected computer, although only 59% were aware that they could listen to radio via this device. The research also found that 95% of people owned a digital TV11, and 63% were aware that this device could be used to receive radio. Similarly, for smartphones and games consoles, awareness of being able to receive radio services on these devices was lower than take-up.
The only device for which awareness of being able to receive radio services was higher than take-up was MP3 players. While 32% of adults owned an MP3 player, 40% were aware that they could use this device to listen to radio services.
Figure 25: Awareness of devices capable of receiving radio services12
Source: Ofcom Technology Tracker 2016, *Take-up measures from H1 2016 Base: All adults (H1 2016, 3737), (H2 2016, 2893) QP14. Before today, were you aware that you can listen to radio programmes as they are broadcast in these ways?
11 As with any survey data, Ofcom’s Technology Tracker data is subject to an error margin of up to +/- 2 percentage points. 12 The questions in the radio section of Ofcom’s Technology Tracker were re-ordered this year. It is likely that this has had some impact on trend data, so year-on-year comparisons have not always been shown.
Digital Radio Report 2016
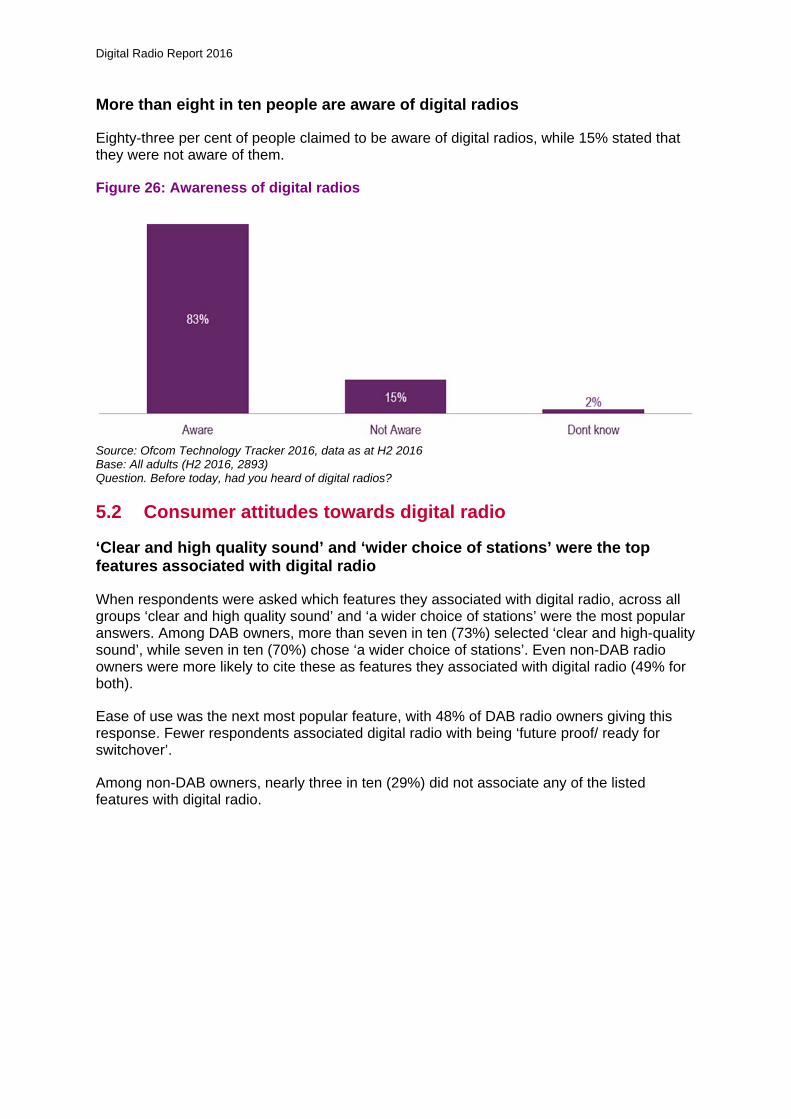
More than eight in ten people are aware of digital radios
Eighty-three per cent of people claimed to be aware of digital radios, while 15% stated that they were not aware of them.
Figure 26: Awareness of digital radios
Source: Ofcom Technology Tracker 2016, data as at H2 2016 Base: All adults (H2 2016, 2893) Question. Before today, had you heard of digital radios?
5.2 Consumer attitudes towards digital radio
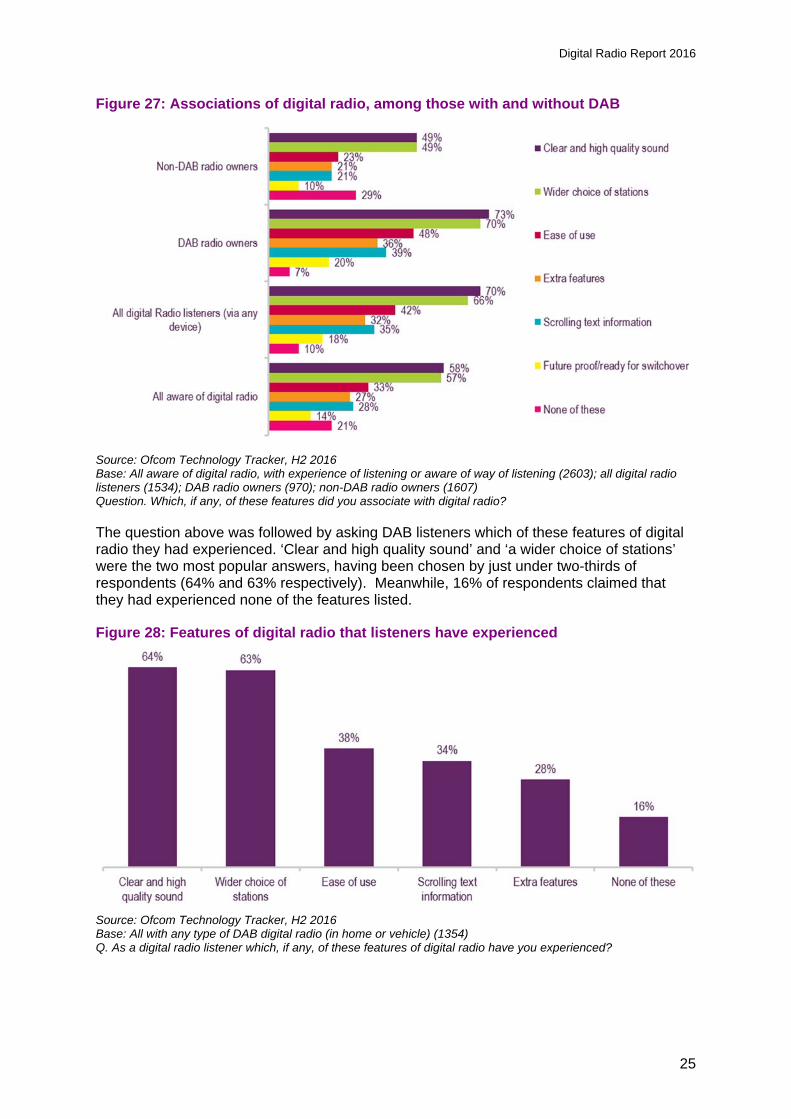
‘Clear and high quality sound’ and ‘wider choice of stations’ were the top features associated with digital radio
When respondents were asked which features they associated with digital radio, across all groups ‘clear and high quality sound’ and ‘a wider choice of stations’ were the most popular answers. Among DAB owners, more than seven in ten (73%) selected ‘clear and high-quality sound’, while seven in ten (70%) chose ‘a wider choice of stations’. Even non-DAB radio owners were more likely to cite these as features they associated with digital radio (49% for both).
Ease of use was the next most popular feature, with 48% of DAB radio owners giving this response. Fewer respondents associated digital radio with being ‘future proof/ ready for switchover’.
Among non-DAB owners, nearly three in ten (29%) did not associate any of the listed features with digital radio.
Digital Radio Report 2016
25
Figure 27: Associations of digital radio, among those with and without DAB
Source: Ofcom Technology Tracker, H2 2016 Base: All aware of digital radio, with experience of listening or aware of way of listening (2603); all digital radio listeners (1534); DAB radio owners (970); non-DAB radio owners (1607) Question. Which, if any, of these features did you associate with digital radio?
The question above was followed by asking DAB listeners which of these features of digital radio they had experienced. ‘Clear and high quality sound’ and ‘a wider choice of stations’ were the two most popular answers, having been chosen by just under two-thirds of respondents (64% and 63% respectively). Meanwhile, 16% of respondents claimed that they had experienced none of the features listed.
Figure 28: Features of digital radio that listeners have experienced
Source: Ofcom Technology Tracker, H2 2016 Base: All with any type of DAB digital radio (in home or vehicle) (1354) Q. As a digital radio listener which, if any, of these features of digital radio have you experienced?
Digital Radio Report 2016
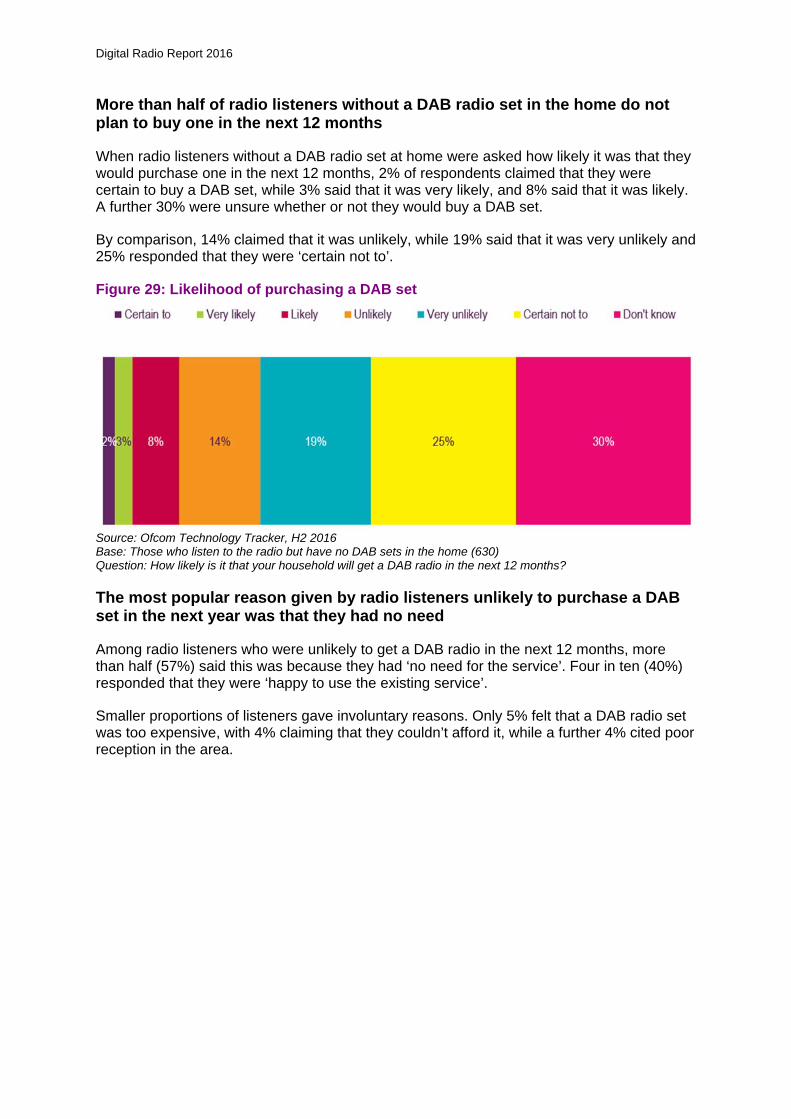
More than half of radio listeners without a DAB radio set in the home do not plan to buy one in the next 12 months
When radio listeners without a DAB radio set at home were asked how likely it was that they would purchase one in the next 12 months, 2% of respondents claimed that they were certain to buy a DAB set, while 3% said that it was very likely, and 8% said that it was likely. A further 30% were unsure whether or not they would buy a DAB set.
By comparison, 14% claimed that it was unlikely, while 19% said that it was very unlikely and 25% responded that they were ‘certain not to’.
Figure 29: Likelihood of purchasing a DAB set
Source: Ofcom Technology Tracker, H2 2016 Base: Those who listen to the radio but have no DAB sets in the home (630) Question: How likely is it that your household will get a DAB radio in the next 12 months?
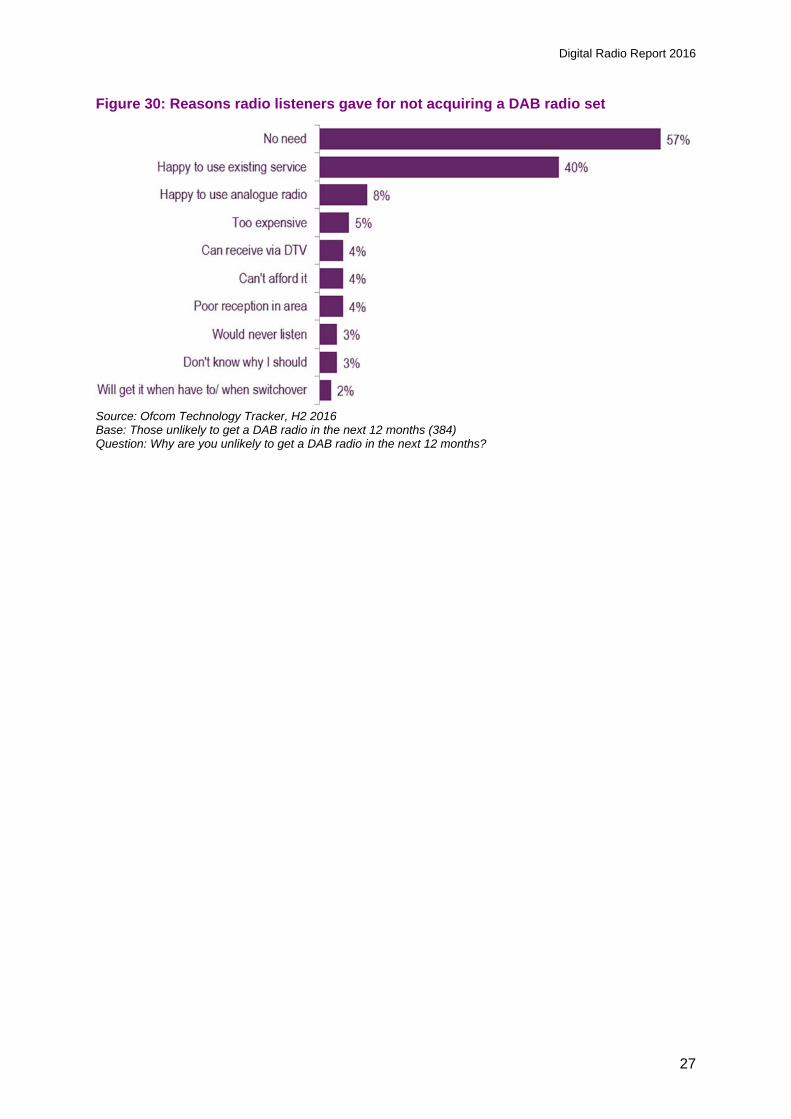
The most popular reason given by radio listeners unlikely to purchase a DAB set in the next year was that they had no need
Among radio listeners who were unlikely to get a DAB radio in the next 12 months, more than half (57%) said this was because they had ‘no need for the service’. Four in ten (40%) responded that they were ‘happy to use the existing service’.
Smaller proportions of listeners gave involuntary reasons. Only 5% felt that a DAB radio set was too expensive, with 4% claiming that they couldn’t afford it, while a further 4% cited poor reception in the area.
Digital Radio Report 2016
27
Figure 30: Reasons radio listeners gave for not acquiring a DAB radio set
Source: Ofcom Technology Tracker, H2 2016 Base: Those unlikely to get a DAB radio in the next 12 months (384) Question: Why are you unlikely to get a DAB radio in the next 12 months?
Digital Radio Report 2016
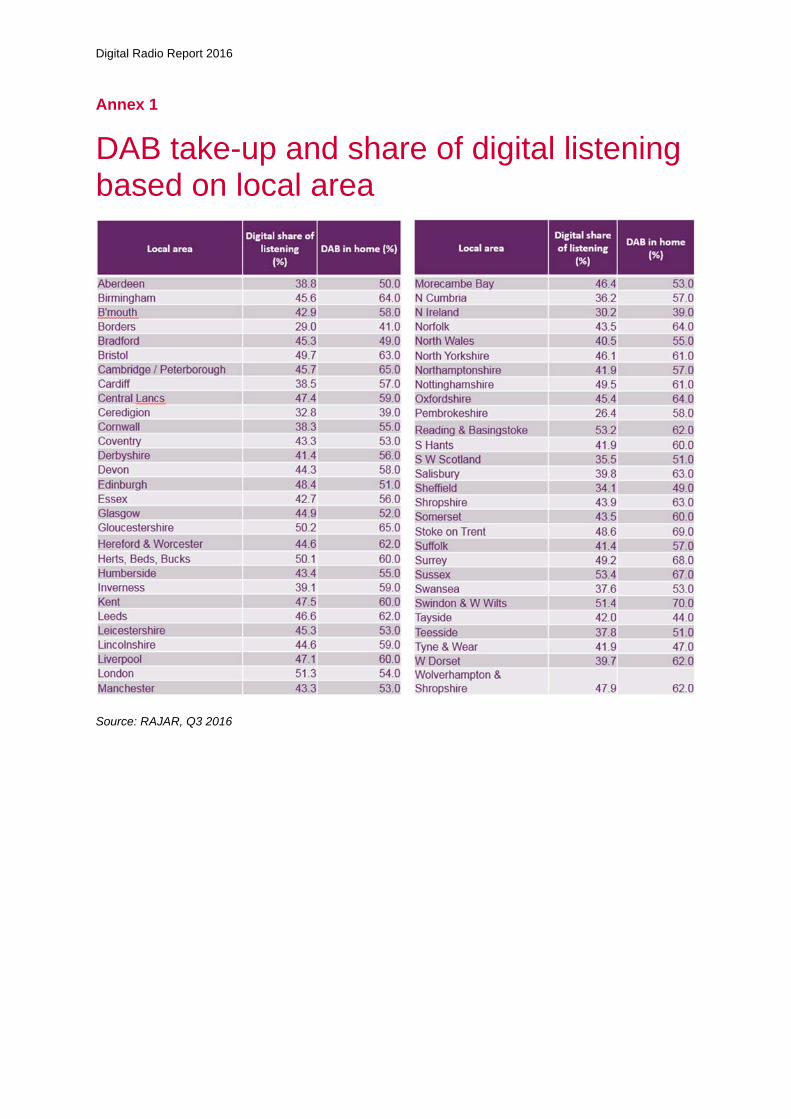
Annex 1
2 DAB take-up and share of digital listening based on local area
Source: RAJAR, Q3 2016