Embed Size (px)
Citation preview

The Communications Market 2016
3
3 Radio and audio
109

Contents 3.1 Key market developments in radio and audio 111
3.1.1 Sector overview 111 3.1.2 Radio resistance 112
3.2 The radio industry 119
3.2.1 Introduction 119 3.2.2 Radio revenue and expenditure 119 3.2.3 Radio consumption 121 3.2.4 The radio market 122 3.2.5 Community radio 123
3.3 Radio and the audio listener 129
3.3.1 Introduction 129 3.3.2 Weekly radio listening in the UK 129 3.3.3 Digital radio listening trends 131
110
3.1 Key market developments in radio and audio 3.1.1 Sector overview Radio remains resilient. As the oldest broadcast medium, since its creation at the turn of the 20th century, radio has witnessed each technological development that has brought different and competing media to consumers’ media diets. The reach of radio is still high – almost 90% of adults tune in on a weekly basis – and time spent listening to radio increased in 2015.
But there are differences across age groups. While for all UK adults the majority of time spent listening to any audio is accounted for by live radio (71%), 16-24s spend similar amounts of time with live radio (29%), personal digital audio (26%) and streaming services (25%).
Sector revenues are also in good health. Overall, commercial stations increased their revenue in 2015, with overall growth of 1.4% to £519m, as national advertising offset overall declines in local advertising revenue. The two largest commercial radio groups both increased their numbers of listeners, and together now reach over 38 million UK adults each week.
BBC and commercial radio, community and short-term restricted service radio, broadcast across the UK, with most services broadcasting on the FM waveband. However, in 2015 over 40% of all reported radio listening was via a digital device. A second national DAB network of transmitters was switched on in March this year, bringing 15 unique radio services to 75% of the UK’s population.
Community radio can now be heard in many parts of the UK, with 239 unique non-profit distributive radio services on air. The average annual cost of running one of these services is £55,000; typically half this expenditure is on staff costs. On average less than a third (30%) of income comes from on-air advertising and sponsorship.
111

Figure 3.1 UK radio industry: key metrics
Sources: RAJAR (all adults age 15+), Ofcom calculations, based on figures in BBC Annual Report and Accounts 2015-16 note 2c (www.bbc.co.uk/annualreport), AA/Warc, broadcasters. Revenue figures are nominal. DAB take-up: Q1 of the following year. *Commercial and total revenue figures for 2010-2013 are not wholly comparable to 2014 and 2015 due to an amendment to the data collection methodology. Digital listening share 12 months to December.
3.1.2 Radio resistance 120 years of technological advances have shaped radio broadcasting
Radio’s history has been shaped by technological developments which, in some cases, have led to increased competition in the oldest broadcast medium. Over this time, radio has proved to be resilient in retaining audience. Even in a digital world, the rise in internet-based activity – streaming and downloading in particular – has not materially affected broadcast radio’s listening reach as a whole, in the same way that the internet, for example, has affected the national, regional and local press.
How radio got to where it is
In the late 1800s, divergence occurred when electronic communications, in the form of wireless one-to-one messaging, using Morse code and later speech, developed into a wireless one-to-many entertainment medium.
In the UK in the 1940s, when sound broadcasting was the only electronic mass medium, many assumed that new technologies would have the effect of displacing radio as a mass audience medium, an assumption that has continued to the present day. But, despite the advent of television and now the internet, radio remains popular; as each advance is made, radio audiences have by-and-large remained tuned to broadcast radio. However, the listening habits of the 16-24s are showing signs of change.
UK radio industry 2010 2011 2012 2013 2014 2015
Weekly reach of radio (% of population) 90.6% 90.8% 89.5% 90.4% 89.5% 89.6%
Average weekly hours per listener 20.1 20.5 22.2 21.5 21.4 21.4
BBC share of listening 55.2% 54.7% 54.7% 54.6% 53.8% 53.6%
Total industry revenue* £1,137m £1,164m £1,203m £1,177m £1,248m £1,248m
Commercial revenue* £452m £457m £475m £461m £512m £519m
BBC expenditure £675m £697m £717m £705m £725m £717m
Community radio revenue £10.0m £10.5m £10.8m £10.9m £11.5m £11.6m
Radio share of advertising spend 3.3% 3.3% 3.3% 3.1% 3.2% 3.0%
DAB digital radio take-up (households) 38.2% 42.6% 44.3% 47.9% 49.0% 55.7%
Digital radio listening share 24.6% 27.8% 31.2% 35.6% 37.3% 40.7%
112

Figure 3.2 A radio timeline
One of radio’s strengths is that much of it, even to this day, is live, so the medium remains capable of easily updating listeners with key elements of information such as news. Speech content remains important; BBC Radio 4 has a 12% share of all radio listening and delivers a mixed speech service which includes in-depth news and current affairs programming. But radio also has value as an entertainment medium, which includes the provision of music.
Another strength of radio is its portability and accessibility, allowing listeners to listen on a range of devices in different locations, and to accompany them on most journeys. Twenty-two per cent of all radio listening is done in a motor vehicle. The link between cars and radio listening is strong; a RadioPlayer study conducted by Proteus Research in November 2015 identified that eight in ten car buyers would not consider buying a car without a radio.
113

Many listeners treat radio as a dependable companion in a way often not seen on the same scale for other media. Ofcom’s qualitative research found that a key benefit of radio was companionship, providing relationships with the presenters and personalities, and radio can also be used as a background while listeners focus on other tasks.48
Audio consumption of live radio, personal digital audio and streamed music differs by age, with 16-24s spending the least amount of time with radio
Today’s world of audio incorporates live and on-demand radio, personal digital audio and streamed music, together with listening to spoken word content and music on physical formats and videos. Ofcom’s Digital Day research is a study of over 1,500 consumers’ behaviour as they spend time watching, listening, communicating, playing and browsing content over a given period. This research allows us to see how consumers’ listening time is shared between different audio activities.
Total live radio accounts for 71% of all audio activities. Streaming, the current audio growth area, accounts for 7% of time spent listening. But the picture is very different for the 16-24s. This age group in particular spent almost equal amounts of time listening to live radio (29%), personal digital audio (26%), and streamed music (25%). According to RAJAR audience figures, since 2006 the numbers of 16-24s reached by radio has fallen by 4.9%, while the total time spent listening to live radio for this age group is 70% of what it was ten years ago. As seen below, the greatest proportion of radio listening is among those aged over 35, and this is likely to affect the overall resilience of radio, as younger people’s audio habits change.
Figure 3.3 Proportion of time spent listening, by age group
Source: Ofcom Digital Day 2016, Data book 1: C2. Adult diary: Chart shows the proportion of all listening time (B2) attributed to each activity (D) by age group. The average week ly minutes figure is among those who did any listening activity across their diary week and also includes simultaneous activity. Base: Adults aged 16+ (1512) 16-24s (129) 25-34s (189) 34-44s (282) 45-54s (299) 55-64s (259) 65+s (354).
48 http://stakeholders.ofcom.org.uk/binaries/research/radio-research/radio_deregulation/Local_Commercial_Radio_Content_Research.pdf
71
2959 71
85 84 88
3
2
52
310
26
1611
3 37
258 8 66
58 5 4 8 63 12 4 3
0%
20%
40%
60%
80%
100%
Adults16+
16-24 25-34 35-44 45-54 55-65 65+
Music videosCD/vinylStreamed musicPersonal digitalOn-demand radioLive radio
Proportion of listening time (%)
945 883 817 931 1062 1116 879
Average weekly minutes listening:
114

Figure 3.4 Radio accounts for a large slice of people’s time
Radio peaks in the early morning
According to RAJAR, listeners spend an average of 21 hours per week listening to radio, but the level of consumption varies by the time of day - most people listen in the morning. Radio’s peak period of listening is at the start of the day, in contrast to television viewing, which peaks in the evening, as our Digital Day research in section 1.4 shows.
As Figure 3.5 below shows, the radio audience peaks in the morning between 7am and 9.30am, and steadily tails off throughout the day before climbing again around drive-time (4pm to 6.00pm). BBC radio services, which include BBC Radio 4 and BBC Radio 5 Live, and the BBC local radio services, all of which are speech-led during the breakfast period, as well as the BBC’s most popular network, BBC Radio 2, appeal more to listeners in the morning than commercial radio offerings as a whole. With a few exceptions, e.g. LBC, commercial radio is more reliant on music than on substantive speech content at this time. Figure 3.5 BBC and commercial radio listening, by day part
Source: RAJAR, all adults (15+), 12 months to Q1 2016, Monday-Sunday, average audience. Base: National Total Survey Area.
Breakfast Morning Afternoon Evening Night
Ave
rage
list
enin
g au
dien
ce (%
)
0
5
10
15
20
0600
-063
006
30-0
700
0700
-073
007
30-0
800
0800
-084
008
40-0
900
0900
-093
009
30-1
000
1000
-103
010
30-1
100
1100
-113
011
30-1
200
1200
-123
012
30-1
300
1300
-133
013
30-1
400
1400
-143
014
30-1
500
1500
-153
015
30-1
600
1600
-163
016
30-1
700
1700
-173
017
30-1
800
1800
-183
018
30-1
900
1900
-193
019
30-2
000
2000
-203
020
30-2
100
2100
-213
021
30-2
200
2200
-223
022
30-2
300
2300
-233
023
30-0
000
BBC
Commercial
115
Live radio listening leads over other media during its early morning peak
Digital Day research shows a pattern of listening over a 24-hour period and, as the analysis in Figure 1.15 in section 1.4.5 shows, radio listening steals an early lead, reaching more of the available audience between 7am and 8am than any other medium. Not until 9am does radio lose this position to television.
A decline in music sales is balanced by an increase in music streaming
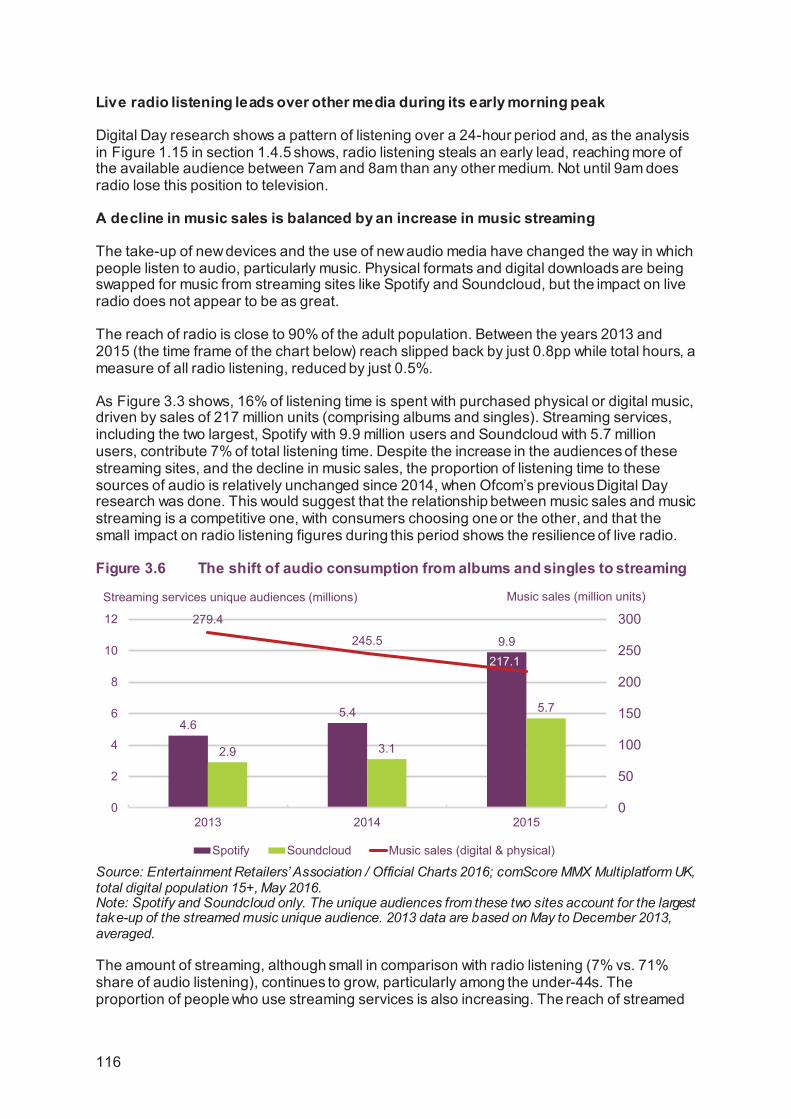
The take-up of new devices and the use of new audio media have changed the way in which people listen to audio, particularly music. Physical formats and digital downloads are being swapped for music from streaming sites like Spotify and Soundcloud, but the impact on live radio does not appear to be as great.
The reach of radio is close to 90% of the adult population. Between the years 2013 and 2015 (the time frame of the chart below) reach slipped back by just 0.8pp while total hours, a measure of all radio listening, reduced by just 0.5%.
As Figure 3.3 shows, 16% of listening time is spent with purchased physical or digital music, driven by sales of 217 million units (comprising albums and singles). Streaming services, including the two largest, Spotify with 9.9 million users and Soundcloud with 5.7 million users, contribute 7% of total listening time. Despite the increase in the audiences of these streaming sites, and the decline in music sales, the proportion of listening time to these sources of audio is relatively unchanged since 2014, when Ofcom’s previous Digital Day research was done. This would suggest that the relationship between music sales and music streaming is a competitive one, with consumers choosing one or the other, and that the small impact on radio listening figures during this period shows the resilience of live radio.
Figure 3.6 The shift of audio consumption from albums and singles to streaming
Source: Entertainment Retailers’ Association / Official Charts 2016; comScore MMX Multiplatform UK, total digital population 15+, May 2016. Note: Spotify and Soundcloud only. The unique audiences from these two sites account for the largest take-up of the streamed music unique audience. 2013 data are based on May to December 2013, averaged.
The amount of streaming, although small in comparison with radio listening (7% vs. 71% share of audio listening), continues to grow, particularly among the under-44s. The proportion of people who use streaming services is also increasing. The reach of streamed
Streaming services unique audiences (millions)
4.65.4
9.9
2.9 3.1
5.7
279.4
245.5
217.1
0
50
100
150
200
250
300
0
2
4
6
8
10
12
2013 2014 2015
Spotify Soundcloud Music sales (digital & physical)
Music sales (million units)
116

music was highest among the 16-24s, as shown in our Digital Day research (51%); this was double that of the next two age demographics, 25-34s (26%) and 35-44s (25%).
Figure 3.7 Weekly reach of streamed music, by age group: 2016 vs. 2014
Source: Ofcom Digital Day 2016, Data book 1: A1. Adult diary: Chart shows the proportion of adults who recorded activity (D) at any point across their diary week. Base: 2016: Adults aged 16+ (1512), 16-24 (129), 25-34 (189), 35-44 (282), 45-54 (299), 55-64 (259), 65+ (354); 2014: Adults aged 16+ (1644), 16-24 (101), 25-34 (225), 35-44 (348), 45-54 (400), 55-64 (311), 65+ (259)
Listening to radio on a radio set has increased by seven minutes per day
Considering the changes between 2014 and 2016 in time spent consuming audio in a day, all audio activities across the board increased, while time spent with television viewing, voice and text communications all fell. Between 2014 and 2016 average listening on a radio set grew by seven minutes per day, listening to other audio grew by two minutes, and listening to radio on another device (e.g. smartphone) by one minute per day.
Figure 3.8 Average time spent on grouped activities per day: UK adults 16+
Source: Ofcom Digital Day 2016, Data book 1: B4(2). Adult diary: Data are taken from a combination of activities (D) and devices (E) recorded. The calculations are made by netting all grouped activities together and averaging the time spent. Zeros are included so as to reflect the whole UK population. Base: Adults aged 16+ in UK (1512)
13
38
14 11 117
2
19
51
26 25
8 83
0
10
20
30
40
50
60
Adults 16+ 16-24 25-34 35-44 45-54 55-64 65+
2014 2016
3h 47m
0h 18m
0h 7m
1h 14m
0h 14m
0h 31m
0h 25m
1h 30m
0h 28m
TV Or Films On A TV Set
TV Or Films On AnotherDevice
Other Video
Radio On Radio Set
Radio On Another Device
Other Audio
Voice Comms
Text Comms
Games
Change from 2014
- 9 mins
+ 5 mins
+ 2 mins
+ 7 mins
+ 1 mins
+ 2 mins
- 7 mins
- 9 mins
- 2 mins
117

3.2 The radio industry 3.2.1 Introduction In this section we examine the characteristics of the UK radio industry, focusing on commercial and community radio station revenue and BBC expenditure, together with the audience shares of the main players.
3.2.2 Radio revenue and expenditure Radio industry revenue and spend
Commercial radio is funded purely from radio advertising and sponsorship, unlike BBC radio which is funded from the licence fee. Commercial radio revenue per listener is £14.33, up from £14.14 in 2014. Taken as an average, £29.08 of the annual £145.50 licence fee is allocated to BBC Radio. Total BBC expenditure on radio has been cut by £8.0m over the period 2013/14 and 2015/16.
UK advertising overall continues to grow, led mainly by internet advertising spend. Based on Advertising Association/ Warc reported figures for 2015, although radio advertising has grown by £16.9m (3%) year on year to £592.3m, this rate of increase falls short of that achieved by other advertising markets in the UK such as television. In 2015, radio advertising represented 3.0% of all advertising (3.2% in 2014).
Commercial advertising revenue up by 1.4%, or £7m
Commercial revenues reported to Ofcom by operators grew by £7.0m in 2015, an increase of 1.4% year on year. This growth was driven by national advertising revenue, up by £6.0m (2.3%) to £267m in 2015. Local advertising revenue was down by £3.0m (2.2%) in 2015. For commercial stations whose national and local revenues is broadly equal, the gains made by national advertising were sufficient to offset this loss. Broadcasters which sell advertising across a range of stations/brands receive a greater proportion of revenue from national advertising, but smaller stations tend to rely more on local advertising.
Revenue from commercial sponsorship grew by £1.0m (1.1%) in 2015, to £95.0m. This recovered the £1.0m loss in revenues incurred in 2014. National commercial advertising remains the largest single source of income for UK commercial radio.
119

Figure 3.9 Radio industry revenue: 2010-2015
Source: Ofcom / operator data / BBC Annual Report 2009-2016. Note: BBC expenditure figures are estimated by Ofcom based on figures from the BBC Annual Report (www.bbc.co.uk/annualreport); figures in the chart are rounded and are nominal. Total includes community radio, but community radio is not shown on the chart. Total commercial includes all sources of revenue - national, local, sponsorship and ‘other’, but ‘other’ is not shown on the chart.
BBC cuts £8m from radio content expenditure
BBC Radio 1, 1Xtra and 4 Extra had the largest expenditure cuts in percentage terms (-10.6%, -25.8% and -20.5% respectively, 2014/15 to 2015/16). Other services had annual cuts in the range of -1.3% to -7.3%. The exceptions were Radio 5 live Sports Extra, which had no cuts at all, while two stations had increased expenditure: BBC Asian Network, up by 6.5% and Radio 4, up by 0.9%. Overall, the 40 BBC local radio services had an annual increase of 3.6%.
In monetary terms, the 25.8% cut for 1Xtra equated to £1.6m, as did the 3.5% cut for Radio 2. Local radio received an extra £4.2m.
Figure 3.10 Radio expenditure and revenue percentage change, year on year
Source: Ofcom / operator data
Revenue (£m)
1,137 1,164 1,203 1,1771,248 1,248
675 697 717 705 725 717
452 457 475 461 512 519
211 220 222 207 261 267
136 130 139 141 136 13392 92 98 95 94 950
200
400
600
800
1000
1200
1400
2010 2011 2012 2013 2014 2015
Total
BBC expenditure(estimated)
Total commercial
Nationalcommercial
Local commercial
Commercialsponsorship
120
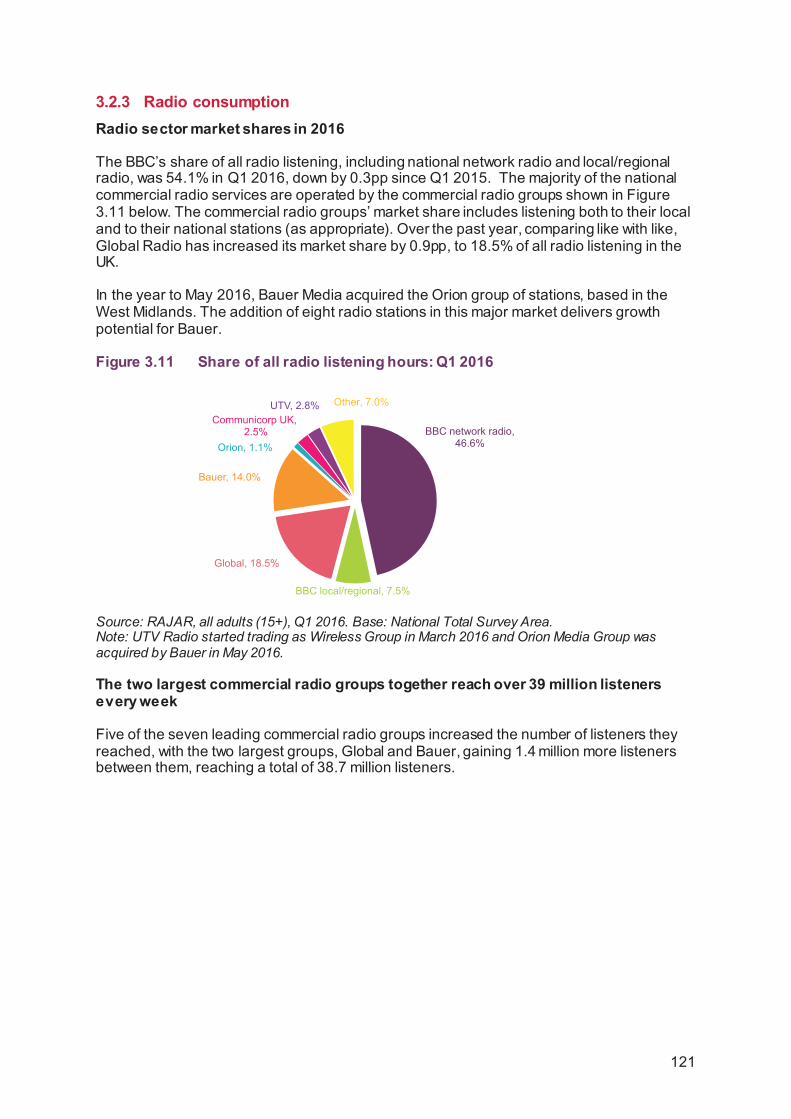
3.2.3 Radio consumption Radio sector market shares in 2016
The BBC’s share of all radio listening, including national network radio and local/regional radio, was 54.1% in Q1 2016, down by 0.3pp since Q1 2015. The majority of the national commercial radio services are operated by the commercial radio groups shown in Figure 3.11 below. The commercial radio groups’ market share includes listening both to their local and to their national stations (as appropriate). Over the past year, comparing like with like, Global Radio has increased its market share by 0.9pp, to 18.5% of all radio listening in the UK.
In the year to May 2016, Bauer Media acquired the Orion group of stations, based in the West Midlands. The addition of eight radio stations in this major market delivers growth potential for Bauer.
Figure 3.11 Share of all radio listening hours: Q1 2016
Source: RAJAR, all adults (15+), Q1 2016. Base: National Total Survey Area. Note: UTV Radio started trading as Wireless Group in March 2016 and Orion Media Group was acquired by Bauer in May 2016.
The two largest commercial radio groups together reach over 39 million listeners every week
Five of the seven leading commercial radio groups increased the number of listeners they reached, with the two largest groups, Global and Bauer, gaining 1.4 million more listeners between them, reaching a total of 38.7 million listeners.
BBC network radio, 46.6%
BBC local/regional, 7.5%
Global, 18.5%
Bauer, 14.0%
Orion, 1.1%
Communicorp UK,2.5%
UTV, 2.8% Other, 7.0%
121
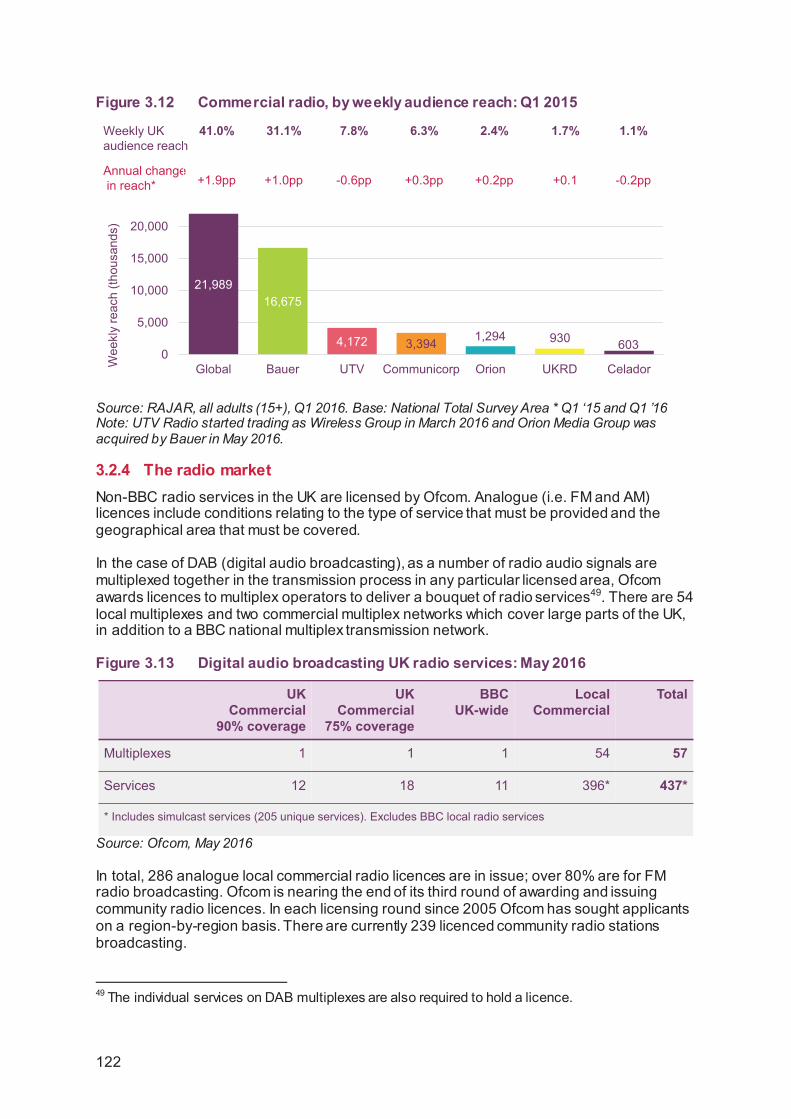
Figure 3.12 Commercial radio, by weekly audience reach: Q1 2015
Source: RAJAR, all adults (15+), Q1 2016. Base: National Total Survey Area * Q1 ‘15 and Q1 ’16 Note: UTV Radio started trading as Wireless Group in March 2016 and Orion Media Group was acquired by Bauer in May 2016.
3.2.4 The radio market Non-BBC radio services in the UK are licensed by Ofcom. Analogue (i.e. FM and AM) licences include conditions relating to the type of service that must be provided and the geographical area that must be covered.
In the case of DAB (digital audio broadcasting), as a number of radio audio signals are multiplexed together in the transmission process in any particular licensed area, Ofcom awards licences to multiplex operators to deliver a bouquet of radio services49. There are 54 local multiplexes and two commercial multiplex networks which cover large parts of the UK, in addition to a BBC national multiplex transmission network.
Figure 3.13 Digital audio broadcasting UK radio services: May 2016
Source: Ofcom, May 2016
In total, 286 analogue local commercial radio licences are in issue; over 80% are for FM radio broadcasting. Ofcom is nearing the end of its third round of awarding and issuing community radio licences. In each licensing round since 2005 Ofcom has sought applicants on a region-by-region basis. There are currently 239 licenced community radio stations broadcasting.
49 The individual services on DAB multiplexes are also required to hold a licence.
21,98916,675
4,172 3,394 1,294 930 6030%
5%
10%
15%
20%
25%
30%
35%
40%
45%
0
5,000
10,000
15,000
20,000
Global Bauer UTV Communicorp Orion UKRD CeladorWee
kly
reac
h (th
ousa
nds)
Annual changein reach*
Weekly UK audience reach
41.0% 31.1% 7.8% 6.3% 2.4% 1.7% 1.1%
+1.9pp +1.0pp -0.6pp +0.3pp +0.2pp +0.1 -0.2pp
UK Commercial
90% coverage
UK Commercial
75% coverage
BBC UK-wide
LocalCommercial
Total
Multiplexes 1 1 1 54 57
Services 12 18 11 396* 437*
* Includes simulcast services (205 unique services). Excludes BBC local radio services
122
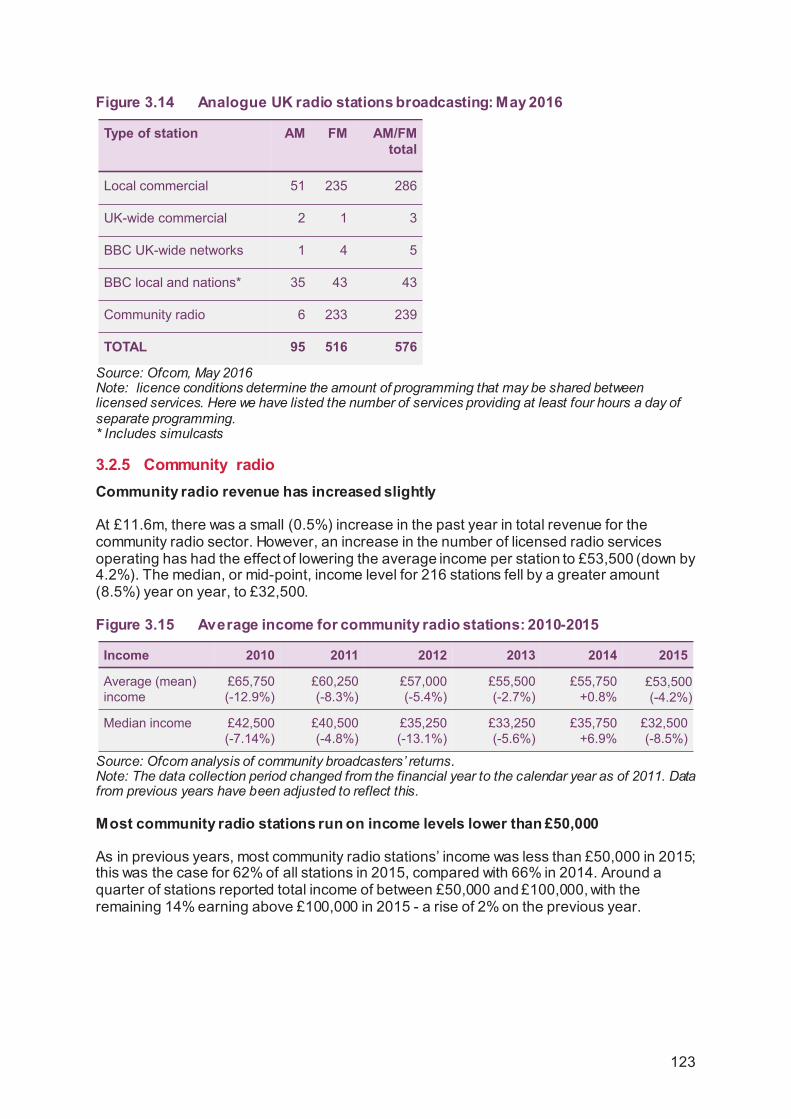
Figure 3.14 Analogue UK radio stations broadcasting: May 2016
Source: Ofcom, May 2016 Note: licence conditions determine the amount of programming that may be shared between licensed services. Here we have listed the number of services providing at least four hours a day of separate programming. * Includes simulcasts
3.2.5 Community radio Community radio revenue has increased slightly
At £11.6m, there was a small (0.5%) increase in the past year in total revenue for the community radio sector. However, an increase in the number of licensed radio services operating has had the effect of lowering the average income per station to £53,500 (down by 4.2%). The median, or mid-point, income level for 216 stations fell by a greater amount (8.5%) year on year, to £32,500.
Figure 3.15 Average income for community radio stations: 2010-2015
Source: Ofcom analysis of community broadcasters’ returns. Note: The data collection period changed from the financial year to the calendar year as of 2011. Data from previous years have been adjusted to reflect this.
Most community radio stations run on income levels lower than £50,000
As in previous years, most community radio stations’ income was less than £50,000 in 2015; this was the case for 62% of all stations in 2015, compared with 66% in 2014. Around a quarter of stations reported total income of between £50,000 and £100,000, with the remaining 14% earning above £100,000 in 2015 - a rise of 2% on the previous year.
Type of station AM FM AM/FM total
Local commercial 51 235 286
UK-wide commercial 2 1 3
BBC UK-wide networks 1 4 5
BBC local and nations* 35 43 43
Community radio 6 233 239
TOTAL 95 516 576
Income 2010 2011 2012 2013 2014 2015
Average (mean) income
£65,750(-12.9%)
£60,250 (-8.3%)
£57,000(-5.4%)
£55,500(-2.7%)
£55,750+0.8%
£53,500(-4.2%)
Median income £42,500 (-7.14%)
£40,500 (-4.8%)
£35,250(-13.1%)
£33,250(-5.6%)
£35,750+6.9%
£32,500(-8.5%)
123

Figure 3.16 Distribution of total income levels across the community radio sector
Source: Ofcom analysis of community broadcasters’ returns. Figures rounded.
Half of community radio’s income is from grants and sources other than on-air advertising
The largest single source of income for a community radio station (30%) in 2015 was on-air advertising and sponsorship, bringing the sector back into line with its 2013 reported share. Grant funding and income from donations appears broadly flat, with both down by 1pp over the year. ‘Other’ income, which includes revenue from the provision of training, fundraising and events, and merchandising income, reduced over the year from 28% to 25% of total income.
Figure 3.17 Community radio income, by source
Source: Ofcom analysis of community broadcasters’ returns
Religious stations rely most on grants for income
Religious and minority ethnic community radio services attracted the highest levels of income, with donations representing the largest single income source for religious stations (37%) and on-air advertising (45%) being the largest income category for minority ethnic
Proportion of stations (%)
11
17 21
13
85 6 5
2 3 41 3
1
13
23
9 9 8 8
47
3 37
3 41
1518
12 129
6 7 62 1
62 2 2
16 18
11 13
4
97
52 2
8
2 2 20
10
20
30
2012 2013 2014 2015
Income by source (%)
26 29 30 26 30
33 29 25 26 25
10 7 6 4 5
13 1413 15 14
18 20 26 28 25
0%
20%
40%
60%
80%
100%
2011 2012 2013 2014 2015
Other income
Donations
SLAs
Grants
On airadvertising andsponsorship
124

stations. Smaller geographic town/rural area services received the smallest level of income per station, an average of £37,057 per station, down by £1,000 from 2014’s £38,000 figure.
Figure 3.18 Average income, by type of community served
Source: Ofcom analysis of community broadcasters’ returns
Community radio expenditure by station is up
In 2015, average expenditure per community radio service was £54,800, an increase of 2.3%. The median spend remained flat between 2014 and 2015, following growth in income for community radio reported in 2013-2014. We see that the average expenditure per station is greater than average income per station, a difference of £1,300. Expenditure totals do not always correlate directly with broadcast operating costs, as some community radio services receive revenue to provide aspects of social gain, such as providing training.
Figure 3.19 Average expenditure of community radio stations: 2010-2015
Source: Ofcom analysis of community broadcasters’ returns. Note: The data collection period changed from the financial year to the calendar year as of 2011. Data from previous years have been adjusted to reflect this.
Types of expenditure by community radio have changed little over time
Taken as a whole, the areas in which a typical community radio station might spend its income have changed little over time. Staff costs remain the largest area of expenditure, reaching 50% in 2015. There was a slight decline in technical and admin/marketing costs over the year, but this was matched by a slight increase in premises costs.
30%45%
37% 24%
0
30% 29%
25%
24%
27%35% 33%
14%
11%
8%
8% 37%25%
15%
22%
24%
100%
23%
22%
£53,558
£69,860
£37,057
£57,796 £59,638
£73,035
£50,579
£0
£20,000
£40,000
£60,000
£80,000
£100,000
Sectoraverage
(216stations)
Minorityethnic (28)
Geographic- town/rural
(102)
Geographic- urban (28)
Military (9) Religious(12)
Youth (22)
Other
Donations
SLAs
Grants
On-air ads
12%
Expenditure 2010 2011 2012 2013 2014 2015
Average (mean) expenditure
£67,000(-12.3%)
£64,250(-4.1%)
£58,000(-9.7%)
£55,000(-5.0%)
£53,500(-2.7%)
£54,8002.3%
Median expenditure
£43,000 (-17.5%)
£41,000 (-4.9%)
£35,500(-15.4%)
£35,750(2.7%)
£33,250(-6.8%)
£33,2500%
125

Figure 3.20 Community radio station expenditure, by type
Source: Ofcom analysis of community broadcasters’ returns
Spend by religious community radio stations is up by 14%
When considering total expenditure by type of community served, the largest year-on-year increases are among religious (14.1%), military (13.1%) and youth-oriented (12.5%) community radio stations. The cost of staffing these stations, as a proportion of total expenditure, ranges from 44% for geographical town-rural services to 80% for military services.
Figure 3.21 Average expenditure, by type of community served
Source: Ofcom analysis of community broadcasters’ returns
The number of volunteers working in community radio has fallen over the year
In a full 168-hour week, community radio, on average, broadcasts original (live and pre-recorded output) programming for 54% of this time. Each community station is required to deliver on its ‘key commitments’ which ensures a focus on community benefits, such as training, and community access – most stations are largely run by volunteers. In 2014 a typical community radio station enlisted support from 87 volunteers, and trained 60 volunteers.
Expenditure by source (%)
47 49 51 49 50
12 13 13 13 1411 12 11 12 119
9 9 11 1021 17 15 15 15
0%
20%
40%
60%
80%
100%
2011 2012 2013 2014 2015
Other
Technical
Admin andmarketing
Premises
Staff
50% 40%44%
53%80%
45% 52%
14% 19%
14%
10%0
15%10%
11%14%
13%
9%5% 17%
9%10%
8%
10%
9% 10% 6%
13%15%
20%
19%
19%17%
16%
£54,817
£66,831
£36,862
£66,180 £59,638
£71,061
£53,731
£0
£20,000
£40,000
£60,000
£80,000
£100,000
Sectoraverage
(216stations)
Minorityethnic (28)
Geographic- town/rural
(102)
Geographic- urban (28)
Military (9) Religious(12)
Youth (22)
Other
Technical costs
Admin andmarketing
Premises
Staff
126
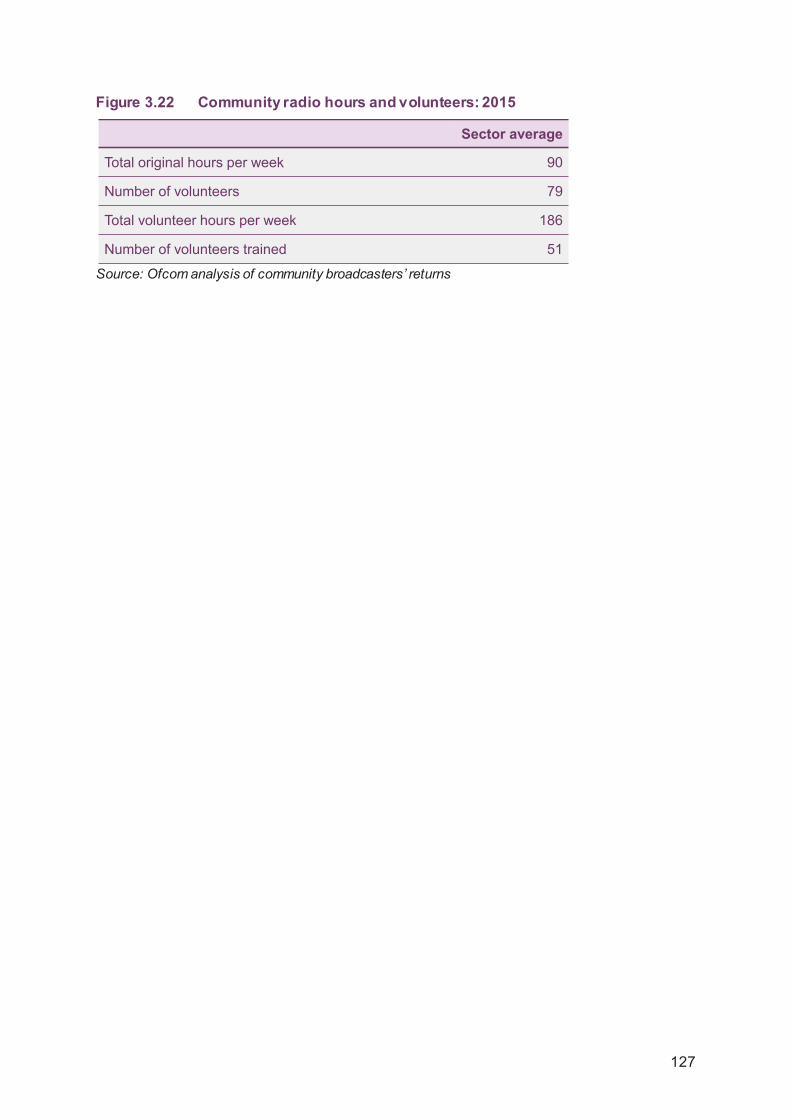
Figure 3.22 Community radio hours and volunteers: 2015
Source: Ofcom analysis of community broadcasters’ returns
Sector average
Total original hours per week 90
Number of volunteers 79
Total volunteer hours per week 186
Number of volunteers trained 51
127


3.3 Radio and the audio listener 3.3.1 Introduction The following section examines how patterns of radio and audio listening have changed in the UK, both in the past year and over the longer term. It uses audience data to analyse listening by sector and by age group, as well as drawing on consumer research.
3.3.2 Weekly radio listening in the UK Radio reach remains high
Apart from variance by sector, such as the growth in national commercial radio or the slight decline in local BBC and commercial radio listening, the overall picture of radio listening changed little between 2011 and 2015, fluctuating around the 90% level (a 1.2pp difference over five years). Over this period, national commercial radio, helped by the increased number of stations broadcasting on the DAB platform, has increased its reach from 30.5% to 34.0%.
Figure 3.23 Reach of radio, by sector
Source: RAJAR, All adults (15+), calendar years 2011-2015, Q1 2016
National radio services continue to gain in popularity
The shares shown in Figure 3.24 are calculated from the total listening time of all the services in each sector. Although local commercial radio has lost share over five years (by 2.7pp), as noted above, national commercial radio services combined were up by 2.6pp over the same period. BBC national network services remained broadly level, while the BBC local and nations’ radio services lost a 1.7pp share of UK radio listening between 2011 and 2015.
90.8% 89.5% 90.4% 89.5% 89.6% 89.3%
67.6% 66.4% 67.1% 65.6% 65.3% 65.1%64.9% 63.5% 64.9% 63.9% 64.5% 64.0%
61.3% 60.3% 61.1% 59.9% 59.8% 59.8%52.0% 50.5% 51.4% 50.8% 49.7% 49.7%30.5% 30.9% 32.5% 31.6% 33.3% 34.0%
18.7% 17.8% 17.8% 16.8% 15.1% 15.3%
6.0% 6.2% 6.2% 7.6% 7.3% 7.1%
0%
20%
40%
60%
80%
100%
2011 2012 2013 2014 2015 Q1 2016
All radio
All BBC
All commercial
BBC network
Local commercial
NationalcommercialBBC nations /localOther
Percent of population
129
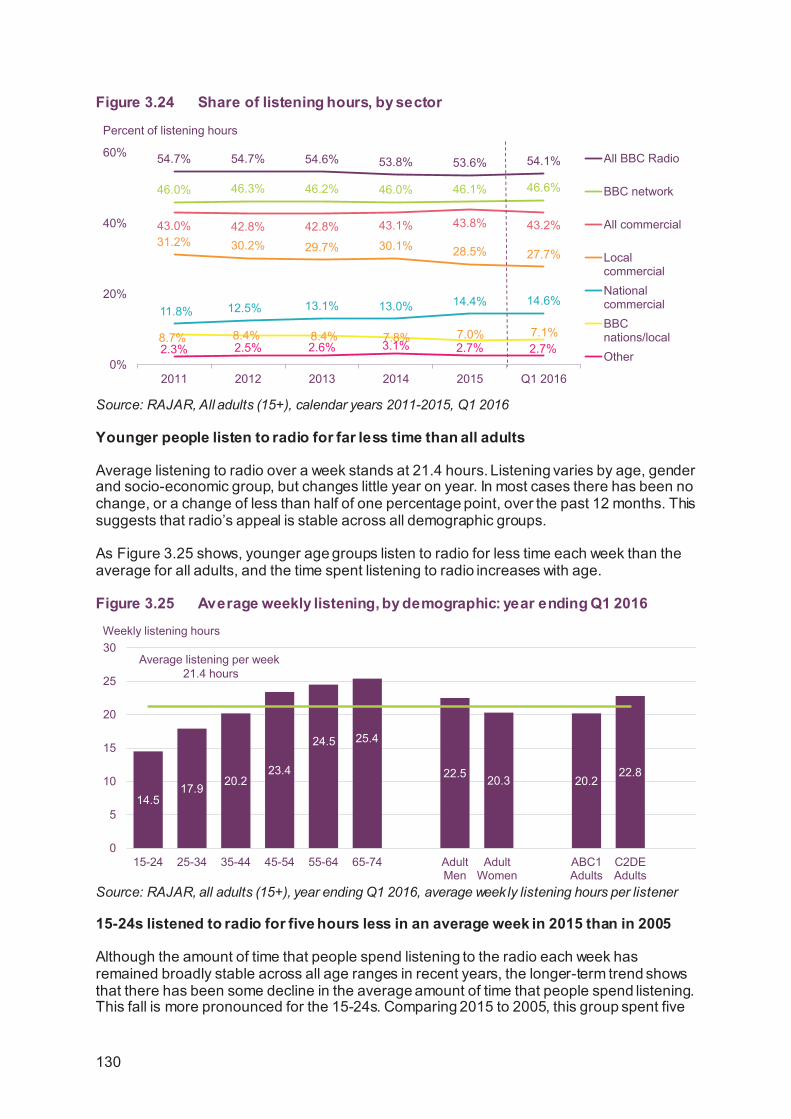
Figure 3.24 Share of listening hours, by sector
Source: RAJAR, All adults (15+), calendar years 2011-2015, Q1 2016
Younger people listen to radio for far less time than all adults
Average listening to radio over a week stands at 21.4 hours. Listening varies by age, gender and socio-economic group, but changes little year on year. In most cases there has been no change, or a change of less than half of one percentage point, over the past 12 months. This suggests that radio’s appeal is stable across all demographic groups.
As Figure 3.25 shows, younger age groups listen to radio for less time each week than the average for all adults, and the time spent listening to radio increases with age.
Figure 3.25 Average weekly listening, by demographic: year ending Q1 2016
Source: RAJAR, all adults (15+), year ending Q1 2016, average week ly listening hours per listener
15-24s listened to radio for five hours less in an average week in 2015 than in 2005
Although the amount of time that people spend listening to the radio each week has remained broadly stable across all age ranges in recent years, the longer-term trend shows that there has been some decline in the average amount of time that people spend listening. This fall is more pronounced for the 15-24s. Comparing 2015 to 2005, this group spent five
54.7% 54.7% 54.6% 53.8% 53.6% 54.1%
46.0% 46.3% 46.2% 46.0% 46.1% 46.6%
43.0% 42.8% 42.8% 43.1% 43.8% 43.2%31.2% 30.2% 29.7% 30.1% 28.5% 27.7%
11.8% 12.5% 13.1% 13.0% 14.4% 14.6%
8.7% 8.4% 8.4% 7.8% 7.0% 7.1%2.3% 2.5% 2.6% 3.1% 2.7% 2.7%
0%
20%
40%
60%
2011 2012 2013 2014 2015 Q1 2016
All BBC Radio
BBC network
All commercial
LocalcommercialNationalcommercialBBCnations/localOther
Percent of listening hours
14.517.9 20.2
23.4
24.5 25.4
22.5 20.3 20.222.8
0
5
10
15
20
25
30
15-24 25-34 35-44 45-54 55-64 65-74 AdultMen
AdultWomen
ABC1Adults
C2DEAdults
Average listening per week21.4 hours
Weekly listening hours
130
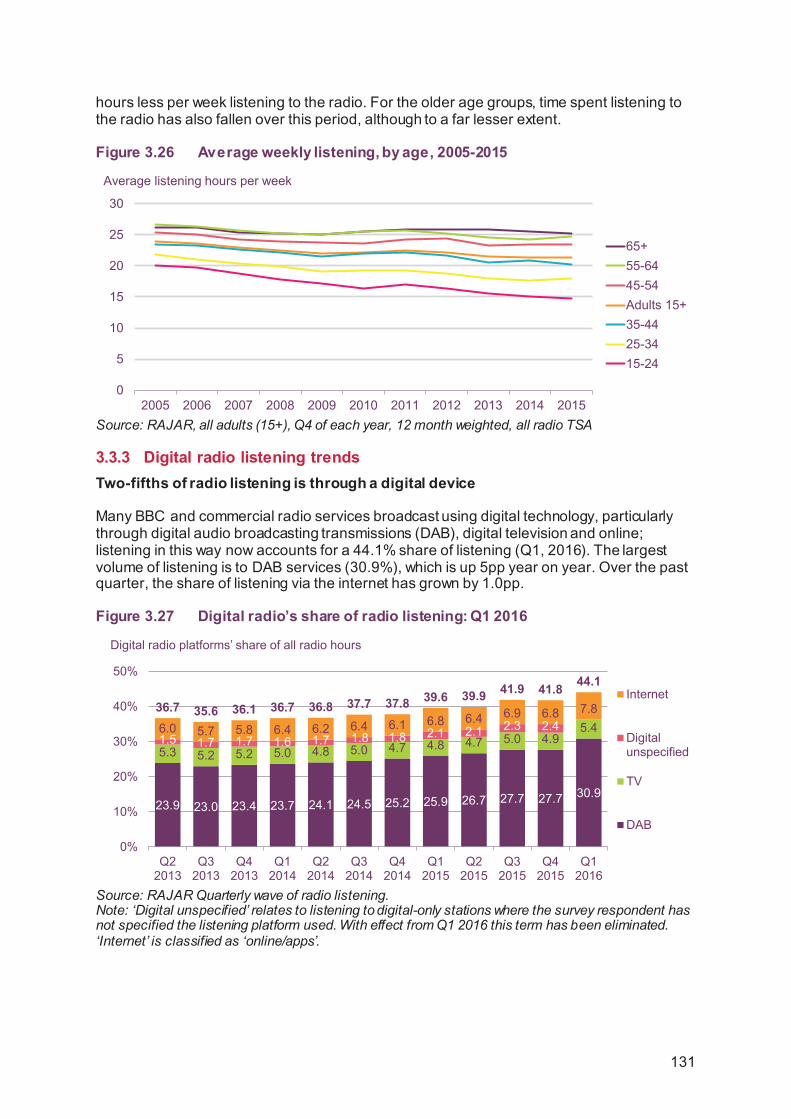
hours less per week listening to the radio. For the older age groups, time spent listening to the radio has also fallen over this period, although to a far lesser extent.
Figure 3.26 Average weekly listening, by age, 2005-2015
Source: RAJAR, all adults (15+), Q4 of each year, 12 month weighted, all radio TSA
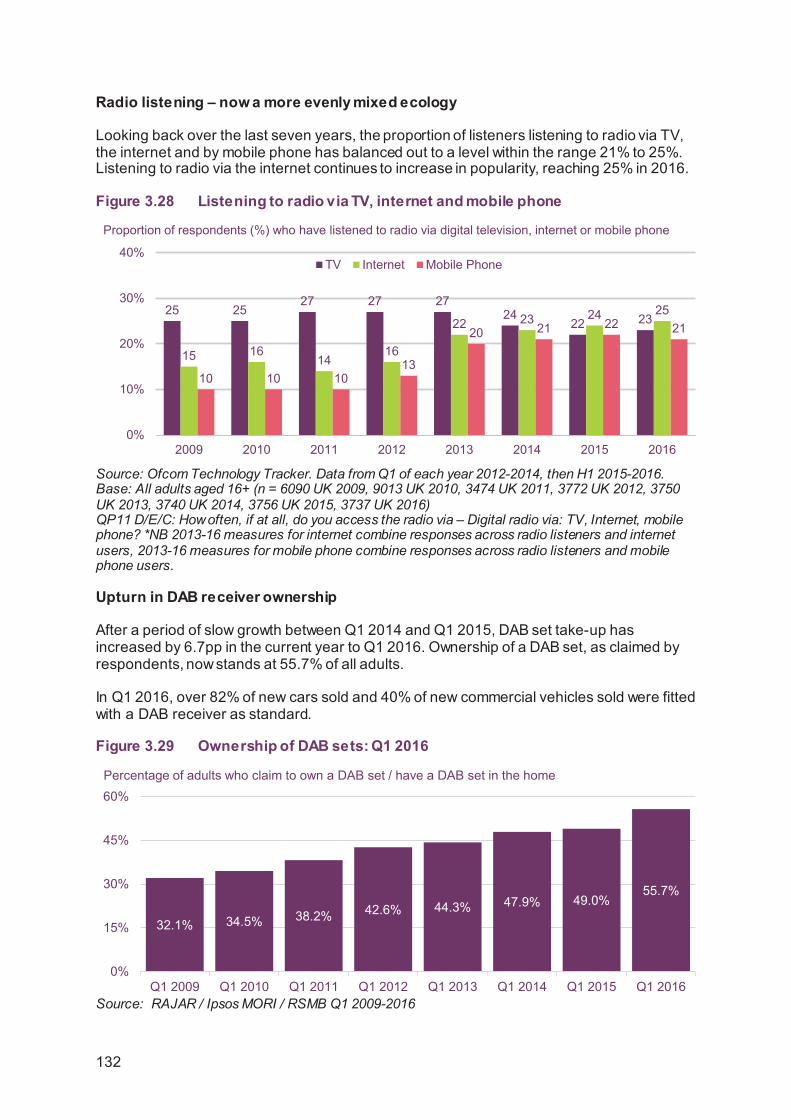
3.3.3 Digital radio listening trends Two-fifths of radio listening is through a digital device
Many BBC and commercial radio services broadcast using digital technology, particularly through digital audio broadcasting transmissions (DAB), digital television and online; listening in this way now accounts for a 44.1% share of listening (Q1, 2016). The largest volume of listening is to DAB services (30.9%), which is up 5pp year on year. Over the past quarter, the share of listening via the internet has grown by 1.0pp.
Figure 3.27 Digital radio’s share of radio listening: Q1 2016
Source: RAJAR Quarterly wave of radio listening. Note: ‘Digital unspecified’ relates to listening to digital-only stations where the survey respondent has not specified the listening platform used. With effect from Q1 2016 this term has been eliminated. ‘Internet’ is classified as ‘online/apps’.
0
5
10
15
20
25
30
2005 2006 2007 2008 2009 2010 2011 2012 2013 2014 2015
65+55-6445-54Adults 15+35-4425-3415-24
Average listening hours per week
23.9 23.0 23.4 23.7 24.1 24.5 25.2 25.9 26.7 27.7 27.7 30.9
5.3 5.2 5.2 5.0 4.8 5.0 4.7 4.8 4.7 5.0 4.95.4
1.5 1.7 1.7 1.6 1.7 1.8 1.8 2.1 2.1 2.3 2.46.0 5.7 5.8 6.4 6.2 6.4 6.1 6.8 6.4 6.9 6.8 7.836.7 35.6 36.1 36.7 36.8 37.7 37.8 39.6 39.9 41.9 41.8 44.1
0%
10%
20%
30%
40%
50%
Q22013
Q32013
Q42013
Q12014
Q22014
Q32014
Q42014
Q12015
Q22015
Q32015
Q42015
Q12016
Internet
Digitalunspecified
TV
DAB
Digital radio platforms’ share of all radio hours
131
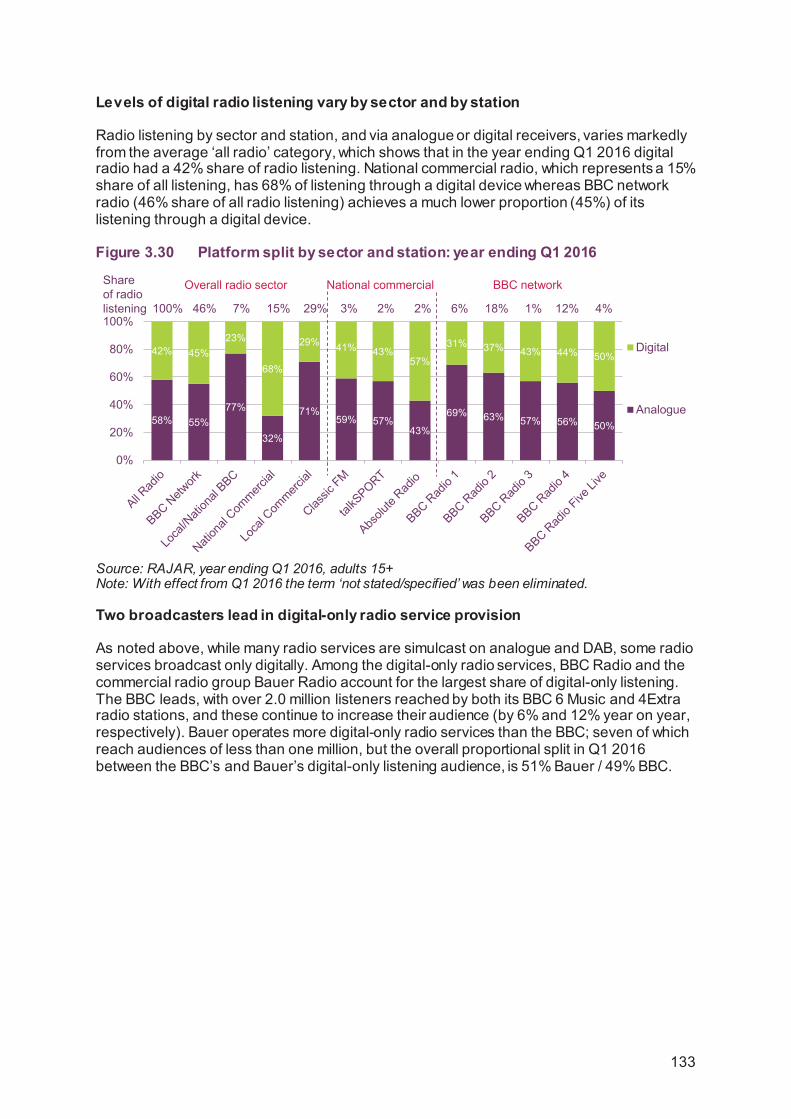
Radio listening – now a more evenly mixed ecology
Looking back over the last seven years, the proportion of listeners listening to radio via TV, the internet and by mobile phone has balanced out to a level within the range 21% to 25%. Listening to radio via the internet continues to increase in popularity, reaching 25% in 2016.
Figure 3.28 Listening to radio via TV, internet and mobile phone
Source: Ofcom Technology Tracker. Data from Q1 of each year 2012-2014, then H1 2015-2016. Base: All adults aged 16+ (n = 6090 UK 2009, 9013 UK 2010, 3474 UK 2011, 3772 UK 2012, 3750 UK 2013, 3740 UK 2014, 3756 UK 2015, 3737 UK 2016) QP11 D/E/C: How often, if at all, do you access the radio via – Digital radio via: TV, Internet, mobile phone? *NB 2013-16 measures for internet combine responses across radio listeners and internet users, 2013-16 measures for mobile phone combine responses across radio listeners and mobile phone users.
Upturn in DAB receiver ownership
After a period of slow growth between Q1 2014 and Q1 2015, DAB set take-up has increased by 6.7pp in the current year to Q1 2016. Ownership of a DAB set, as claimed by respondents, now stands at 55.7% of all adults.
In Q1 2016, over 82% of new cars sold and 40% of new commercial vehicles sold were fitted with a DAB receiver as standard.
Figure 3.29 Ownership of DAB sets: Q1 2016
Source: RAJAR / Ipsos MORI / RSMB Q1 2009-2016
Proportion of respondents (%) who have listened to radio via digital television, internet or mobile phone
25 2527 27 27
2422 23
15 1614
16
22 23 24 25
10 10 1013
20 21 22 21
0%
10%
20%
30%
40%
2009 2010 2011 2012 2013 2014 2015 2016
TV Internet Mobile Phone
32.1% 34.5% 38.2% 42.6% 44.3% 47.9% 49.0%55.7%
0%
15%
30%
45%
60%
Q1 2009 Q1 2010 Q1 2011 Q1 2012 Q1 2013 Q1 2014 Q1 2015 Q1 2016
Percentage of adults who claim to own a DAB set / have a DAB set in the home
132
Levels of digital radio listening vary by sector and by station
Radio listening by sector and station, and via analogue or digital receivers, varies markedly from the average ‘all radio’ category, which shows that in the year ending Q1 2016 digital radio had a 42% share of radio listening. National commercial radio, which represents a 15% share of all listening, has 68% of listening through a digital device whereas BBC network radio (46% share of all radio listening) achieves a much lower proportion (45%) of its listening through a digital device.
Figure 3.30 Platform split by sector and station: year ending Q1 2016
Source: RAJAR, year ending Q1 2016, adults 15+ Note: With effect from Q1 2016 the term ‘not stated/specified’ was been eliminated.
Two broadcasters lead in digital-only radio service provision
As noted above, while many radio services are simulcast on analogue and DAB, some radio services broadcast only digitally. Among the digital-only radio services, BBC Radio and the commercial radio group Bauer Radio account for the largest share of digital-only listening. The BBC leads, with over 2.0 million listeners reached by both its BBC 6 Music and 4Extra radio stations, and these continue to increase their audience (by 6% and 12% year on year, respectively). Bauer operates more digital-only radio services than the BBC; seven of which reach audiences of less than one million, but the overall proportional split in Q1 2016 between the BBC’s and Bauer’s digital-only listening audience, is 51% Bauer / 49% BBC.
58% 55%77%
32%
71%59% 57%
43%
69% 63% 57% 56% 50%
42% 45%23%
68%
29% 41% 43%57%
31% 37% 43% 44% 50%
0%
20%
40%
60%
80%
100%
Digital
Analogue
100% 46% 7% 15% 29% 3% 2% 2% 6% 18% 1% 12% 4%
Overall radio sector National commercial BBC networkShareof radio listening
133

Figure 3.31 Most popular UK digital-only stations: Q1 2016
Source: RAJAR, year ending Q1 2016 adults 15+
Average weekly reach year ending Q1 2016 (millions) % change year on year
2.2 2.01.6 1.5 1.5 1.4
1.1 1.0 0.9 0.8 0.8 0.7 0.6 0.5 0.50.30.0
0.5
1.0
1.5
2.0
2.5 +6%
+2%-4%
+16%
+13% +11%
+10%
+12%
-11%
+33%+42%
+1%+6%+2%
BauerBBC
Radio group
Independent
-2%+43%
134