Embed Size (px)
Citation preview

The Commonwealth of Massachusetts Executive Office for Administration and Finance Division of Capital Asset Management and Maintenance
One Ashburton Place Boston, Massachusetts 02108
Tel: (617) 727-4050 Fax: (617) 727-5363
CHARLES D. BAKER MICHAEL J. HEFFERNAN GOVERNOR
SECRETARY
ADMINISTRATION & FINANCE
KARYN E. POLITO CAROL W. GLADSTONE LIEUTENANT GOVERNOR COMMISSIONER
Business Disparities in the DCAMM Construction and Design Market Area Prepared for the Commonwealth of Massachusetts Division of Capital Asset
Management and Maintenance (DCAMM) By NERA Economic Consulting - December 22, 2017
The Division of Capital Asset Management and Maintenance (DCAMM) retained NERA Economic Consulting, a nationally recognized economic research firm, to gather, analyze and report on the complex economic and statistical data as well as anecdotal evidence that constitute a Disparity Study for DCAMM's construction and design activities. Under federal law a Disparity Study is necessary for public entities to evaluate their existing minority and women business participation programs and determine whether a public entity has a strong basis for implementing or adjusting race- and gender-conscious contracting policies. The last Disparity Study conducted by DCAMM was completed in 2010. This most recent Disparity Study covers DCAMM construction and design contracts active during fiscal years 2010-2015, has been completed and is under review by DCAMM along with the Massachusetts Supplier Diversity Office. DCAMM is committed to transparency and values the input of all stakeholders involved in our construction and design Affirmative Marketing Program. Therefore, DCAMM is making the full study available for all interested parties, even as DCAMM conducts its internal review of the study. As we commence a careful and thoughtful process to review and develop the Affirmative Marketing Program going forward, we will schedule meetings to receive valuable input from stakeholders. DCAMM is proud of its history of, and on-going commitment to, addressing past and present business discrimination and ensuring that all firms get a full and fair opportunity to do business with DCAMM. We are strongly committed to continuing these efforts and look forward to working with all stakeholders in promoting business diversity.

Business Disparities in the DCAMM Construction and Design Market Area
Prepared for the Commonwealth of Massachusetts Division of Capital Asset Management and Maintenance (DCAMM)
December 22, 2017

i
Project Team
Principal Investigator:
Dr. Jon Wainwright, Senior Vice President, NERA
NERA Research Assistants:
Christie Ingham Kirkendall, Kirsten Deskins, Matthew Davis, Donna Benson, Jacob Sarabia, Jacqueline Ortega, Jennifer Brown, Laura Bogar, Melissa Pinder, Shelby Foster, and Sydney Kinchen.
Subcontractors:
Spotlight Communications, Inc.
CR Dynamics & Associates
The Law Firm of Don T. O’Bannon
CVV Transcripts
J&D Data Services
Acknowledgments
This study would not have been possible without the assistance and support of Commonwealth of Massachusetts Division of Capital Asset Management and Maintenance personnel.
NERA Economic Consulting Barton Creek Plaza Building II, Suite 330 3801 S. Capital of Texas Highway Austin, Texas 78704 Tel: +1 512 383 4800 Fax: +1 512 371 9612 www.nera.com

ii
About the Project Team
NERA Economic Consulting is a global firm of experts dedicated to applying economic, finance and quantitative principles to complex business and legal challenges. For over half a century, NERA’s economists have been creating strategies, studies, reports, expert testimony and policy recommendations for government authorities and the world’s leading law firms and corporations. We bring academic rigor, objectivity and real world industry experience to bear on issues arising from competition, regulation, public policy, strategy, finance and litigation.
NERA’s clients value our ability to apply and communicate state-of-the-art approaches clearly and convincingly, our commitment to deliver unbiased findings, and our reputation for quality and independence. Our clients rely on the integrity and skills of our unparalleled team of economists and other experts backed by the resources and reliability of one of the world’s largest economic consultancies. With its main office in New York City, NERA serves clients from more than 25 offices across North America, Europe and Asia Pacific.
NERA’s employment and labor experts advise clients on a wide range of issues both inside and outside the courtroom. We have provided expert testimony on statistical issues both at the class certification phase (on issues of commonality and typicality) and at the liability phase (for class or pattern-and-practice cases). Our experts have extensive experience examining issues of statistical liability in discrimination and other wrongful termination claims. We also provide detailed statistical analyses of workforce composition to identify potential disparities in hiring, layoffs, promotions, pay, and performance assessments, and have conducted studies on labor union issues and on affirmative action programs for historically disadvantaged business enterprises.
NERA Managing Director Dr. Jon Wainwright led the NERA project team for this Study. Dr. Wainwright heads NERA’s disparity study practice and is a nationally recognized expert on business discrimination and affirmative action. He has authored books, papers, and numerous research studies on the subject, and has been repeatedly qualified to testify on these and other issues as an expert in state and federal courts. At NERA, Dr. Wainwright directs and conducts economic and statistical studies of discrimination for attorneys, corporations, governments and non-profit organizations. He also directs and conducts research and provides clients with advice on adverse impact and economic damage matters arising from their hiring, performance assessment, compensation, promotion, termination or contracting activities.

iii
About the Project Team
Spotlight Communications, under the leadership of Tomeeka Farrington, has evolved from a PR firm into a full service marketing and communications corporation. This includes, among others, public outreach campaigns, social media marketing, public relations, copywriting, and website design. Spotlight Communications is an SDO-certified M/WBE. The firm also holds an 8(a) certification from the U.S. Small Business Administration (SBA) and a DBE certification from the Massachusetts Department of Transportation. On this project, Spotlight Communications was responsible for all of the stakeholder and community outreach functions in addition to assisting with the design of marketing materials.
CR Dynamics & Associates, Inc., owned by Charles and Patricia Ramos, is one of the top contact/call centers in the United States, providing services to private industry and government agencies. Over the past ten years, their perceptiveness in delivering critical program management supported with high-tech solutions has become invaluable to their clients. CRD provides a variety of services, including provision of help desk services, inbound travel counseling, order taking, reservations and outbound market research survey work. CRD is a City of Baltimore and State of Maryland certified MBE. On this project, CRD provided CATI survey services for both the race/gender misclassification survey and the mail survey non-respondent survey.
Attorney Don O’Bannon, Esq. Don O’Bannon is principal in the Law Office of Don T. O’Bannon in Dallas, Texas. He is the former Vice President of Business Diversity and Development for DFW International Airport and past chairman of the Airport Minority Advisory Council. Mr. O’Bannon is a past recipient of the M/WBE Advocate of the Year award from the Fort Worth Metropolitan Chamber of Commerce, the Business Advocate of the Year award from the Dallas-Fort Worth Hispanic Contractors’ Association, and the Chairman’s Award from the Dallas-Fort Worth Black Contractors’ Association. On this project, Mr. O’Bannon provided a review of case law, conducted interviews with public sector personnel and with local business owners and co-drafted study recommendations.
CVV Transcripts, LLC is a Veterans Administration verified Service-Disabled-Veteran Owned, and SBA Economically-Disadvantaged-Woman Owned Small Business based in Mesa, Arizona and led by founder Jennifer MacGregor. CVV provides court reporting and transcription of meetings, hearings, conference sessions, interviews, interrogations, depositions and court proceedings for a variety of government agencies, commercial businesses, small businesses and non-profit organizations. On this project, CVV provided transcription services for all of the business owner and public sector personnel interviews.
J&D Data Services is a small business enterprise owned by Mr. Joe Deegan and based in Plano, Texas. After a long career with ScanTron, Mr. Deegan started his own business to offer a solid and proven alternative to the time consuming and expensive job of key data entry long associated with mail surveys. The firm helps its clients conserve their surveying resources by designing and delivering survey instruments that can be electronically and automatically scanned upon return and sent directly to electronic format. J&D Data Services has conducted numerous

iv
surveys of M/WBEs and non-M/WBEs on behalf of the NERA team. On this assignment, they provided printing, postage, mail-out and mail-back service for the contract and subcontract data collection, the mail survey and the business owner interviews.

v
Report Qualifications/Assumptions and Limiting Conditions
This report is for the exclusive use of the Commonwealth of Massachusetts Division of Capital Asset Management and Maintenance (“DCAMM”). There are no third-party beneficiaries with respect to this report, and NERA Economic Consulting does not accept any liability to any third party.
Information furnished by others, upon which all or portions of this report is based, is believed to be reliable but has not been independently verified, unless otherwise expressly indicated. Public information and industry and statistical data, including contracting, subcontracting and procurement data, are from sources we deem to be reliable; however, we make no representation as to the accuracy or completeness of such information.
The opinions expressed in this report are valid only for the purpose stated herein and as of the date of this report. No obligation is assumed to revise this report to reflect changes, events or conditions that occur subsequent to the date hereof.
All decisions in connection with the implementation or use of advice or recommendations contained in this report are the sole responsibility of the client.
In portions of this report, NERA has commented on legal issues. NERA’s comments are based on its understanding of relevant law and industry best practice, as informed by legal counsel retained by NERA. However, NERA’s comments are not, and should not be construed as, legal advice to DCAMM. NERA recommends that DCAMM seek and obtain advice from its own legal counsel in connection with its affirmative action programs and with this report.

Contents
NERA Economic Consulting
vi
Contents
List of Tables ............................................................................................................................... viii
Executive Summary .........................................................................................................................1A. Introduction ..........................................................................................................................1B. Legal Standards for Government Affirmative Action Contracting Programs .....................1C. Defining the Relevant Markets ............................................................................................3D. M/WBE and PBE Availability in DCAMM’s Market Area ................................................4E. Statistical Disparities in Business Formation and Business Owner Earnings .....................5F. Statistical Disparities in Credit/Capital Markets ..................................................................8G. Public Sector Utilization vs. Availability in DCAMM Contracting ....................................9H. Anecdotal Evidence ...........................................................................................................14I. DCAMM’s M/WBE Program: Overview and Feedback Interviews .................................16J. Recommendations for Revised Contracting Policies and Procedures ...............................16
I. Introduction .............................................................................................................................19A. Study Outline .....................................................................................................................20
II. Defining the Relevant Markets ..............................................................................................23A. Preparing the Master Contract/Subcontract Database .......................................................23B. Geographic Market Definition for Contracting and Procurement .....................................29C. Product Market Definition for Contracting and Procurement ...........................................31
III. M/WBE Availability in DCAMM’s Market Area ................................................................35A. Introduction ........................................................................................................................35B. Identifying Business Establishments in the Relevant Markets ..........................................36C. Estimates of M/WBE and PBE Availability ......................................................................54
IV. Market-Based Disparities in Business Formation and Business Owner Earnings ...............63A. Introduction ........................................................................................................................63B. Race and Gender Disparities in Wage and Salary Earnings ..............................................67C. Race and Gender Disparities in Business Formation .........................................................87D. Expected Business Formation Rates—Implications for Current M/WBE Availability ..100E. Evidence from the Survey of Business Owners ...............................................................104
V. Statistical Disparities in Capital Markets .............................................................................113A. Introduction ......................................................................................................................113B. Theoretical Framework and Review of the Literature .....................................................115C. Empirical Framework and Description of the Data .........................................................119D. Qualitative Evidence ........................................................................................................124E. Differences in Loan Denial Rates by Race, Ethnicity or Gender ....................................128F. Differences in Interest Rates Charged on Approved Loans .............................................138G. Loan Approval Rates and Access to Credit .....................................................................141H. Analysis of Credit Market Discrimination in the U.S. in 1998 .......................................145I. Analysis of Credit Market Discrimination in the U.S. in 2003 .......................................155J. Further Analysis of Credit Market Discrimination: NERA Surveys 1999-2007 .............163

Contents
NERA Economic Consulting
vii
K. Conclusions from the 1993, 1998 and 2003 SSBF Analyses ..........................................166L. Evidence of Credit Market Discrimination from 2008 and Beyond ................................168
VI. M/WBE and PBE Utilization and Disparity in DCAMM Contracting Activity ................173A. Introduction ......................................................................................................................173B. M/WBE and PBE Utilization for All Contracting Dollars ..............................................174C. M/WBE and PBE Disparity Analysis for All Contracting Dollars ..................................177D. Effects on M/WBEs When Public Sector Affirmative Action Programs Are
Terminated .......................................................................................................................181E. Current Availability versus Expected Availability ..........................................................183
VII. Anecdotal Evidence of Disparities in the DCAMM Market Area ....................................187A. Introduction ......................................................................................................................187B. Business Experience Surveys ..........................................................................................188C. Business Owner Interviews ..............................................................................................215D. Conclusion .......................................................................................................................231
VIII. DCAMM’s M/WBE Program: Overview and Feedback Interviews ...............................233A. M/WBE Program Overview ............................................................................................233B. Race-Neutral and Gender-Neutral Initiatives ..................................................................241C. Business Owner Feedback Interviews .............................................................................243
IX. Suggested Best Practices for Race- and Gender-Conscious Contracting Programs ...........255A. Continue and Augment Race- and Gender-Neutral Initiatives ........................................255B. Implement Race- and Gender-Conscious Remedies ........................................................258
References ....................................................................................................................................265
Appendix A. Glossary ...............................................................................................................273
Appendix B. Legal Standards for Government Race- and Gender-Conscious Contracting Programs ..........................................................................................................................279
A. Overview of Strict Scrutiny .............................................................................................279B. Compelling Interest ..........................................................................................................284C. The Narrow Tailoring Analysis .......................................................................................292D. Conclusion .......................................................................................................................295E. List of Authorities ............................................................................................................297
Appendix C. Master M/WBE Directory Sources .....................................................................299A. Entities with lists of M/WBE firms that were duplicative of previously collected lists ..299B. Entities that had no directory, or their directory did not identify race and sex ................299C. Entities that were non-responsive to repeated contacts ...................................................300D. Entities that refused to provide the requested information ..............................................301
Appendix D. Detailed Utilization, Availability & Disparity Tables ........................................303

List of Tables
NERA Economic Consulting
viii
List of Tables
Table A1. Overall Estimated M/WBE Availability Percentages in the DCAMM Market Area .... 4
Table A2. Overall Estimated PBE Availability Percentages in the DCAMM Market Area .......... 5
Table B1. M/WBE Utilization in Contracting at DCAMM–All Contracts (Dollars Awarded) ... 10
Table B2. M/WBE Utilization in Contracting at DCAMM–All Contracts (Dollars Paid) ........... 10
Table B3. PBE Utilization in Contracting at DCAMM–All Contracts (Dollars Awarded) ......... 11
Table B4. PBE Utilization in Contracting at DCAMM–All Contracts (Dollars Paid) ................. 11
Table C1. M/WBE Utilization, Availability and Disparity Results for DCAMM Contracting, Overall and by Contracting Category–All Contracts (Dollars Awarded) ......................... 12
Table C2. M/WBE Utilization, Availability and Disparity Results for DCAMM Contracting, Overall and by Contracting Category–All Contracts (Dollars Paid) ................................ 13
Table C3. PBE Utilization, Availability and Disparity Results for DCAMM Contracting, Overall and by Contracting Category–All Contracts (Dollars Awarded) ...................................... 14
Table C4. PBE Utilization, Availability and Disparity Results for DCAMM Contracting, Overall and by Contracting Category–All Contracts (Dollars Paid) ............................................. 14
Table 2.1. Summary of Master Contract/Subcontract Database: Contracts and Subcontracts by Procurement Category, Fiscal Years 2010-2015 .............................................................. 26
Table 2.2. Summary of Master Contract/Subcontract Database: Prime Contracts by Fiscal Year (Dollars Awarded) ............................................................................................................ 27
Table 2.3. Summary of Master Contract/Subcontract Database: Prime Contracts by Year (Dollars Paid) .................................................................................................................................. 28
Table 2.4. Distribution of Contracting Dollars by Geographic Location ..................................... 29
Table 2.5. Distribution of DCAMM Contract Award Dollars by State and County, Inside the Market Area ...................................................................................................................... 30
Table 2.6. Distribution of Contract and Subcontract Dollars Awarded by Industry Group: Construction ...................................................................................................................... 31
Table 2.7. Distribution of Contract and Subcontract Dollars Awarded by Industry Group: Design........................................................................................................................................... 33
Table 3.1. Construction—Number of Establishments and Industry Weight, by NAICS Code, M/WBE Custom Census ................................................................................................... 38

List of Tables
NERA Economic Consulting
ix
Table 3.2. Design—Number of Establishments and Industry Weight, by NAICS Code, M/WBE Custom Census ................................................................................................................. 39
Table 3.3. Construction—Number of Establishments and Industry Weight, by NAICS Code, PBE Custom Census ......................................................................................................... 40
Table 3.4. Design—Number of Establishments and Industry Weight, by NAICS Code, PBE Custom Census ................................................................................................................. 41
Table 3.5. Construction—Number of Listed M/WBE Establishments and Industry Weight (Dollars Awarded), by NAICS Code, M/WBE Custom Census ...................................... 42
Table 3.6. Design—Number of Listed M/WBE Establishments and Industry Weight (Dollars Awarded), by NAICS Code, M/WBE Custom Census ..................................................... 44
Table 3.7. Construction—Number of Listed PBE Establishments and Industry Weight (Dollars Awarded), by NAICS Code, PBE Custom Census ........................................................... 44
Table 3.8. Design—Number of Listed PBE Establishments and Industry Weight (Dollars Awarded), by NAICS Code, PBE Custom Census ........................................................... 45
Table 3.9. Putative M/WBE Survey—Amount of Misclassification, by Putative M/WBE Type 48
Table 3.10. Putative M/WBE Survey—Cape Verdeans, by Putative M/WBE Type ................... 48
Table 3.11. Putative PBE Survey—Estimated Portuguese Ancestry Distribution for Putative Portuguese-Owned Firms .................................................................................................. 49
Table 3.12. Putative PBE Survey—Estimated Race and Gender Distribution for Putative Portuguese-Owned Firms .................................................................................................. 49
Table 3.13. Unclassified Businesses Survey—By Race and Gender ........................................... 50
Table 3.14. Unclassified Businesses Survey—By Portuguese Ancestry Status ........................... 51
Table 3.15. Overall Estimated M/WBE Availability Percentages ................................................ 54
Table 3.16. Overall Estimated PBE Availability Percentages ...................................................... 55
Table 3.17. Detailed M/WBE Availability Percentages—Construction (All Contracts) (Dollars Awarded) ........................................................................................................................... 55
Table 3.18. Detailed M/WBE Availability Percentages—Design (All Contracts) (Dollars Awarded) ........................................................................................................................... 59
Table 3.19. Detailed PBE Availability Percentages—Construction (All Contracts) (Dollars Awarded) ........................................................................................................................... 59

List of Tables
NERA Economic Consulting
x
Table 3.20. Detailed PBE Availability Percentages—Design (All Contracts) (Dollars Awarded)........................................................................................................................................... 61
Table 4.1. Wage and Salary Earnings Regressions, All Industries, 2010-2014 ........................... 73
Table 4.2. Wage Earnings Regressions, Construction, Design and Related Industries, 2010-2014........................................................................................................................................... 74
Table 4.3. Wage Earnings Regressions, Goods and Services Industries, 2010-2014 ................... 75
Table 4.4. Wage Earnings Regressions, All Industries, 2010-2014 ............................................. 76
Table 4.5. Wage Earnings Regressions, Construction, Design and Related Industries, 2010-2014........................................................................................................................................... 77
Table 4.6. Wage Earnings Regressions, Goods and Services Industries, 2010-2014 ................... 77
Table 4.7. Business Owner Earnings Regressions, All Industries, 2010-2014 ............................. 82
Table 4.8. Business Owner Earnings Regressions, Construction, Design and Related Industries, 2010-2014 ......................................................................................................................... 83
Table 4.9. Business Owner Earnings Regressions, Goods and Services Industries, 2010-2014 .. 84
Table 4.10. Annual Business Owner Earnings Regressions, All Industries, 2010-2014 .............. 85
Table 4.11. Business Owner Earnings Regressions, Construction, Design and Related Industries, 2010-2014 ......................................................................................................................... 86
Table 4.12. Business Owner Earnings Regressions, Goods and Services Industries, 2010-2014 86
Table 4.13. Self-Employment Rates in 2010-2014 for Selected Race and Gender Groups: United States and the Massachusetts Market Area, All Industries ............................................... 89
Table 4.14. Self-Employment Rates in 2010-2014 for Selected Race and Gender Groups: United States and the Massachusetts Market Area, Construction and Design Sector and Goods and Services Sector ........................................................................................................... 90
Table 4.15. Self-Employment Rates in 2010-2014 for Selected Race and Gender Groups: United States and the Massachusetts Market Area, All Industries ............................................... 91
Table 4.16. Self-Employment Rates in 2010-2014 for Selected Race and Gender Groups: United States and the Massachusetts Market Area, Construction and Design Sector and Goods and Services Sector ........................................................................................................... 91
Table 4.17. Business Formation Regressions, All Industries, 2010-2014 .................................... 95
Table 4.18. Business Formation Regressions, Construction, Design and Related Industries, 2010-2014................................................................................................................................... 96

List of Tables
NERA Economic Consulting
xi
Table 4.19. Business Formation Regressions, Goods and Services Industries, 2010-2014 ......... 97
Table 4.20. Business Formation Regressions, All Industries, 2010-2014 .................................... 98
Table 4.21. Business Formation Regressions, Construction, Design and Related Industries, 2010-2014................................................................................................................................... 98
Table 4.22. Business Formation Regressions, Goods and Services Industries, 2010-2014 ......... 99
Table 4.23. Actual and Potential Business Formation Rates in the Massachusetts Market Area102
Table 4.24. Actual and Potential Business Formation Rates in the Massachusetts Market Area103
Table 4.25. Disparity Ratios from the 2012 Survey of Business Owners, United States, All Industries ......................................................................................................................... 106
Table 4.26. Disparity Ratios from the 2012 Survey of Business Owners, Commonwealth of Massachusetts, All Industries .......................................................................................... 107
Table 4.27. Disparity Ratios from the 2012 Survey of Business Owners, United States, Construction and Design ................................................................................................ 108
Table 4.28. Disparity Ratios from the 2012 Survey of Business Owners, Commonwealth of Massachusetts, Construction and Design ........................................................................ 109
Table 4.29. Disparity Ratios from the 2012 Survey of Business Owners, United States, Goods and Services .................................................................................................................... 110
Table 4.30. Disparity Ratios from the 2012 Survey of Business Owners, Commonwealth of Massachusetts, Goods and Services ................................................................................ 111
Table 5.1. Selected Population-Weighted Sample Means of Loan Applicants from 1993 NSSBF Data ................................................................................................................................. 122
Table 5.2. Selected Sample Means of Loan Applicants—Northeast .......................................... 123
Table 5.3. Problems Firms Experienced During Preceding 12 Months—USA ......................... 125
Table 5.4. Problems Firms Experienced During Preceding 12 Months—Northeast .................. 125
Table 5.5. Percentage of Firms Reporting Most Important Issues Affecting Them Over the Next 12 Months—USA ........................................................................................................... 126
Table 5.6. Percentage of Firms Reporting Most Important Issues Affecting Them Over the Next 12 Months—Northeast .................................................................................................... 126
Table 5.7. Types of Problems Facing Your Business, by Race and Gender .............................. 128
Table 5.8. Determinants of Loan Denial Rates—USA ............................................................... 131

List of Tables
NERA Economic Consulting
xii
Table 5.9. Determinants of Loan Denial Rates—Northeast ....................................................... 132
Table 5.10. Alternative Models of Loan Denials ........................................................................ 136
Table 5.11. Models of Credit Card Use–USA ............................................................................ 138
Table 5.12. Models of Credit Card Use–Northeast ..................................................................... 138
Table 5.13. Models of Interest Rate Charged—USA ................................................................. 140
Table 5.14. Models of Interest Rate Charged—Northeast .......................................................... 141
Table 5.15. Racial Differences in Failing to Apply for Loans Fearing Denial ........................... 143
Table 5.16. Models of Failure to Obtain Credit Among Firms that Desired Additional Credit . 144
Table 5.17. What is the Most Important Problem Facing Your Business Today? ..................... 146
Table 5.18. Determinants of Loan Denial Rates—USA ............................................................. 149
Table 5.19. Determinants of Loan Denial Rates—Northeast ..................................................... 150
Table 5.20. More Loan Denial Probabilities ............................................................................... 152
Table 5.21. Models of Interest Rate Charged ............................................................................. 153
Table 5.22. Racial Differences in Failing to Apply for Loans Fearing Denial ........................... 154
Table 5.23. Models of Credit Card Use ...................................................................................... 155
Table 5.24. What is the Most Important Problem Facing Your Business Today? ..................... 157
Table 5.25. Determinants of Loan Denial Rates—USA ............................................................. 159
Table 5.26. Determinants of Loan Denial Rates—Northeast ..................................................... 160
Table 5.27. Models of Interest Rate Charged ............................................................................. 161
Table 5.28. Models of Credit Card Use ...................................................................................... 162
Table 5.29. Racial Differences in Failing to Apply for Loans Fearing Denial ........................... 163
Table 5.30. Determinants of Loan Denial Rates—Nine Jurisdictions ........................................ 165
Table 5.31. Determinants of Interest Rates—Nine Jurisdictions ................................................ 166
Table 6.1. M/WBE Utilization at DCAMM–All Contracts (Dollars Awarded) ......................... 175
Table 6.2. M/WBE Utilization at DCAMM–All Contracts (Dollars Paid) ................................ 175
List of Tables
NERA Economic Consulting
xiii
Table 6.3. PBE Utilization at DCAMM–All Contracts (Dollars Awarded) ............................... 176
Table 6.4. PBE Utilization at DCAMM–All Contracts (Dollars Paid) ....................................... 177
Table 6.5. M/WBE Utilization, Availability, and Disparity Results for DCAMM Contracting, Overall and by Contracting Category–All Contracts (Dollars Awarded) ....................... 178
Table 6.6. M/WBE Utilization, Availability, and Disparity Results for DCAMM Contracting, Overall and by Contracting Category–All Contracts (Dollars Paid) .............................. 179
Table 6.7. PBE Utilization, Availability, and Disparity Results for DCAMM Contracting, Overall and by Contracting Category–All Contracts (Dollars Awarded) ....................... 180
Table 6.8. PBE Utilization, Availability, and Disparity Results for DCAMM Contracting, Overall and by Contracting Category–All Contracts (Dollars Paid) .............................. 180
Table 6.9. Current M/WBE Availability and Expected M/WBE Availability for DCAMM ..... 185
Table 6.10. Current PBE Availability and Expected PBE Availability for DCAMM ............... 186
Table 7.1. Race, Gender and Contracting Category of Mail Survey Respondents ..................... 189
Table 7.2. PBE Status of Mail Survey Respondents ................................................................... 189
Table 7.3. Survey Respondents Indicating They Had Worked or Attempted to Work for Public Sector Agencies in the Last Five Years, MW/BE ........................................................... 190
Table 7.4. Survey Respondents Indicating They Had Worked or Attempted to Work for Public Sector Agencies in the Last Five Years, PBE ................................................................. 191
Table 7.5. Firms Indicating They Had Been Treated Less Favorably Due to Race and/or Gender While Participating in Business Dealings, M/WBE ....................................................... 193
Table 7.6. Firms Indicating They Had Been Treated Less Favorably Due to Race and/or Gender While Participating in Business Dealings, PBE ............................................................. 195
Table 7.7. Firms Indicating They Had Been Treated Less Favorably Due to Race and/or Gender While Participating in Business Dealings (Rankings), M/WBE .................................... 197
Table 7.8. Firms Indicating They Had Been Treated Less Favorably Due to Race and/or Gender While Participating in Business Dealings (Rankings), PBE ........................................... 198
Table 7.9. Prevalence of Disparate Treatment Facing M/WBEs ................................................ 201
Table 7.10. Prevalence of Disparate Treatment Facing PBEs .................................................... 202
Table 7.11. Prevalence of Disparate Treatment Facing M/WBEs, by Type of Business Dealing......................................................................................................................................... 203

List of Tables
NERA Economic Consulting
xiv
Table 7.12. Prevalence of Disparate Treatment Facing PBEs, by Type of Business Dealing .... 204
Table 7.13. Firms Indicating that Specific Factors in the Business Environment Make It Harder or Impossible to Obtain Contracts, M/WBE ................................................................... 206
Table 7.14. Firms Indicating that Specific Factors in the Business Environment Make It Harder or Impossible to Obtain Contracts, PBE ......................................................................... 207
Table 7.15. Firms Indicating that Specific Factors in the Business Environment Make It Harder or Impossible for M/WBEs to Obtain Contracts, Regression Results ............................ 208
Table 7.16. Firms Indicating that Specific Factors in the Business Environment Make It Harder or Impossible for PBEs to Obtain Contracts, Regression Results .................................. 209
Table 7.17. Percent of M/WBEs Indicating that Prime Contractors Who Use Them as Subcontractors on Projects with Goals Seldom or Never Hire Them on Projects without Such Goals ...................................................................................................................... 210
Table 7.18. Percent of PBEs Indicating that Prime Contractors Who Use Them as Subcontractors on Projects with Goals Seldom or Never Hire Them on Projects without Such Goals .. 210
Table 7.19. Percent of M/WBEs Indicating that Prime Contractors Who Use Them as Subcontractors on Projects with Goals Seldom or Never Solicit Them on Projects without Such Goals ...................................................................................................................... 211
Table 7.20. Percent of PBEs Indicating that Prime Contractors Who Use Them as Subcontractors on Projects with Goals Seldom or Never Solicit Them on Projects without Such Goals 212
Table AD.1. M/WBE Industry Group Utilization, Availability, and Disparity Results for DCAMM Construction Contracting (Dollars Awarded) ................................................ 304
Table AD.2. M/WBE Industry Group Utilization, Availability, and Disparity Results for DCAMM Construction Contracting (Dollars Paid) ........................................................ 315
Table AD.3. M/WBE Industry Group Utilization, Availability, and Disparity Results for DCAMM Design Contracting (Dollars Awarded) .......................................................... 326
Table AD.4. M/WBE Industry Group Utilization, Availability, and Disparity Results for DCAMM Design Contracting (Dollars Paid) ................................................................. 328
Table AD.5. PBE Industry Group Utilization, Availability, and Disparity Results for DCAMM Construction Contracting (Dollars Awarded) ................................................................. 330
Table AD.6. PBE Industry Group Utilization, Availability, and Disparity Results for DCAMM Construction Contracting (Dollars Paid) ........................................................................ 335
Table AD.7. PBE Industry Group Utilization, Availability, and Disparity Results for DCAMM Design Contracting (Dollars Awarded) .......................................................................... 340

List of Tables
NERA Economic Consulting
xv
Table AD.8. PBE Industry Group Utilization, Availability, and Disparity Results for DCAMM Design Contracting (Dollars Paid) .................................................................................. 341

Executive Summary
NERA Economic Consulting
1
Executive Summary
A. Introduction
The Commonwealth of Massachusetts Division of Capital Asset Management and Maintenance (“DCAMM”) commissioned this Study to evaluate whether minority-owned and women-owned business enterprises (“M/WBEs”) and Portuguese-owned business enterprises (“PBEs”) in DCAMM’s market area have full and fair opportunities to compete for its prime contracts, purchases and associated subcontracts.
To ensure compliance with constitutional mandates, State law, and M/WBE program best practices, DCAMM commissioned NERA Economic Consulting to examine the past and current status of M/WBEs and PBEs in its geographic and product markets for Construction and Design contracting. The results of the Study provide the evidentiary record necessary for DCAMM’s consideration of whether to implement renewed M/WBE policies that comply with the requirements of the courts and to assess the extent to which previous efforts have assisted M/WBEs and PBEs to compete on a fair basis in DCAMM’s Construction and Design contracting activity.
This Study finds statistical evidence consistent with the presence of business discrimination against M/WBEs and PBEs in the private sector of the DCAMM market area. These findings are presented in Chapters IV and V. Statistical analyses of DCAMM’s own contracting are contained in Chapters II, III and VI. As a check on our statistical findings, documented in Chapter VII, we surveyed the contracting experiences of M/WBEs, PBEs, non-M/WBEs, and non-PBEs in the market area and also conducted a series of in-depth personal interviews with business enterprises throughout the market area, M/WBE, PBE, non-M/WBE and non-PBE.1
B. Legal Standards for Government Affirmative Action Contracting Programs
To be legally defensible, a race-based program must meet the judicial test of constitutional strict scrutiny. Strict scrutiny is the highest level of judicial review and consists of two elements:
• The government must establish its “compelling interest”2 in remedying race discrimination by showing “a strong basis in evidence”3 of the persistence of discrimination. Such evidence may consist of demonstrating that the entity is a ‘passive participant’ in a system of racial exclusion….”4
1 For this Study, unless otherwise noted, the category “non-M/WBE,” excludes nonminority male PBEs.
Similarly, the category “non-PBE” excludes minority-owned non-Portuguese firms. See also fn. 47. 2 City of Richmond v. J.A. Croson Co., 488 U.S. 469 at 492 (1989). 3 Id. at 500 (citing Wygant v. Jackson Board of Education, 476 U.S. 267, 277 (1986)). 4 Id. at 492.

Executive Summary
NERA Economic Consulting
2
• Any remedies adopted must be narrowly tailored to that discrimination; that is, “the means chosen to accomplish the government’s asserted purpose are specifically and narrowly framed to accomplish that purpose.”5
The compelling interest prong has been met through two types of proof:
• Statistical evidence of “identified discrimination in [the relevant] industry,”6 typically established by showing the underutilization of minority-owned firms relative to their availability in the jurisdiction’s market area known as disparity indexes or disparity ratios.7
• Anecdotal evidence of race-based barriers to the full and fair participation of minority-owned firms in the market area and in seeking contract opportunities with the agency.8
The narrow tailoring prong has been met through the assessment of several factors:
• Consideration of alternative, race-neutral means to increase M/WBE participation;9
• The flexibility of the program requirements, including the availability of waiver provisions;10
• The duration of the proposed relief;11
• The relationship of numerical participation goals to the availability of M/WBEs in the relevant market;12
5 Sherbrooke Turf, Inc. v. Minnesota Department of Transportation, 345 F.3d 964, 971 (8th Cir. 2003), cert.
denied, 541 U.S. 1041 (2004) (citing Grutter v. Bollinger, 539 U.S. 306, 333 (2003)). 6 Croson, 488 U.S. at 505. 7 See J. Wainwright and C. Holt, Guidelines for Conducting a Disparity and Availability Study for the Federal
DBE Program, Transportation Research Board of the National Academies, NCHRP Report, Issue No. 644, 2010, pp. 5-6.
8 Concrete Works of Colorado, Inc. v. City and County of Denver, 36 F.3d 1513, 1520 (10th Cir. 1994) (“Concrete Works II”) (“Personal accounts of actual discrimination or the effects of discriminatory practices may, however, vividly complement empirical evidence. Moreover, anecdotal evidence of a municipality’s institutional practices that exacerbate discriminatory market conditions are often particularly probative. Therefore, the government may include anecdotal evidence in its evidentiary mosaic of past or present discrimination.”). See also Adarand Constructors, Inc. v. Slater, 228 F3d 1147, 1166 (10th Cir., 2000) (“Adarand VII’), cert. granted, 532 U.S. 941, then dismissed as improvidently granted, 534 U.S. 103 (2001) (“Both statistical and anecdotal evidence are appropriate in the strict scrutiny calculus, although anecdotal evidence by itself is not.”).
9 Croson, 488 U.S. at 507, citing United States v. Paradise, 480 U.S. 149, 171 (1987). See also Adarand Constructors, Inc. v. Pena, 515 U.S. 200, 237-238 (1995) (“Adarand III”).
10 Paradise, 480 U.S. at 171; Adarand VII, 228 F.3d at 1177. 11 Croson, 488 U.S. at 498, 509. See also Paradise, 480 U.S. at 171. 12 Paradise, 480 U.S. at 171.

Executive Summary
NERA Economic Consulting
3
• The impact of the relief on third parties;13 and
• The overinclusiveness or underinclusiveness of the racial classifications.14
In Adarand Constructors, Inc. v. Peña,15 the Court extended the analysis of strict scrutiny to race-based federal enactments such as the federal (“DBE”) Program. Just as in the state and local government context, the national government must have a compelling interest for the use of race, and the remedies adopted must be narrowly tailored to meet that interest.
Appendix B provides an overview of constitutional standards and case law and outlines legal and program development issues for DCAMM’s consideration in evaluating its M/WBE Program, with emphasis on critical issues and evidentiary concerns.
C. Defining the Relevant Markets
Chapter II describes how the relevant geographic and product markets were defined for this Study. These definitions were derived empirically, based on the Master Contract/Subcontract Database assembled for the Study. The relevant geographic and product markets were then used to focus and frame the quantitative and qualitative analyses in the remainder of the Study.
The Master Contract/Subcontract Database contains information on 1,920 prime contracts and 7,196 associated subcontracts active during fiscal years 2010-2015. These contracts and purchases had a total award value of $3.13 billion and a total paid value of $2.97 billion (see Table 2.1).16 Contracts and subcontracts in the database were catalogued according to fiscal year and whether they were for Construction or Design. The firms performing these contracts and subcontracts were catalogued according to geographic location, primary industry, race, gender, and PBE status.
The Master Contract/Subcontract Database was analyzed to determine the geographic area that accounts for approximately 75 percent of aggregate contract and subcontract spending. DCAMM’s relevant geographic market area was determined to comprise the Commonwealth of Massachusetts (see Tables 2.4 and 2.5).
The Master Contract/Subcontract Database was also analyzed to determine those detailed industry categories that account for over 99 percent of contract and subcontract spending by DCAMM. Overall, we determined that DCAMM’s relevant product market includes firms in 138 different North American Industrial Classification System (“NAICS”) Industry Groups and 273 different NAICS Industries (see Tables 2.6 and 2.7).
13 Id. 14 Croson, 488 U.S. at 506. 15 515 U.S. 200 (1995) (“Adarand III”). 16 Payments on contracts that were not substantially complete at the time of the Study data collection were
excluded from the paid dollar totals.
Executive Summary
NERA Economic Consulting
4
D. M/WBE and PBE Availability in DCAMM’s Market Area
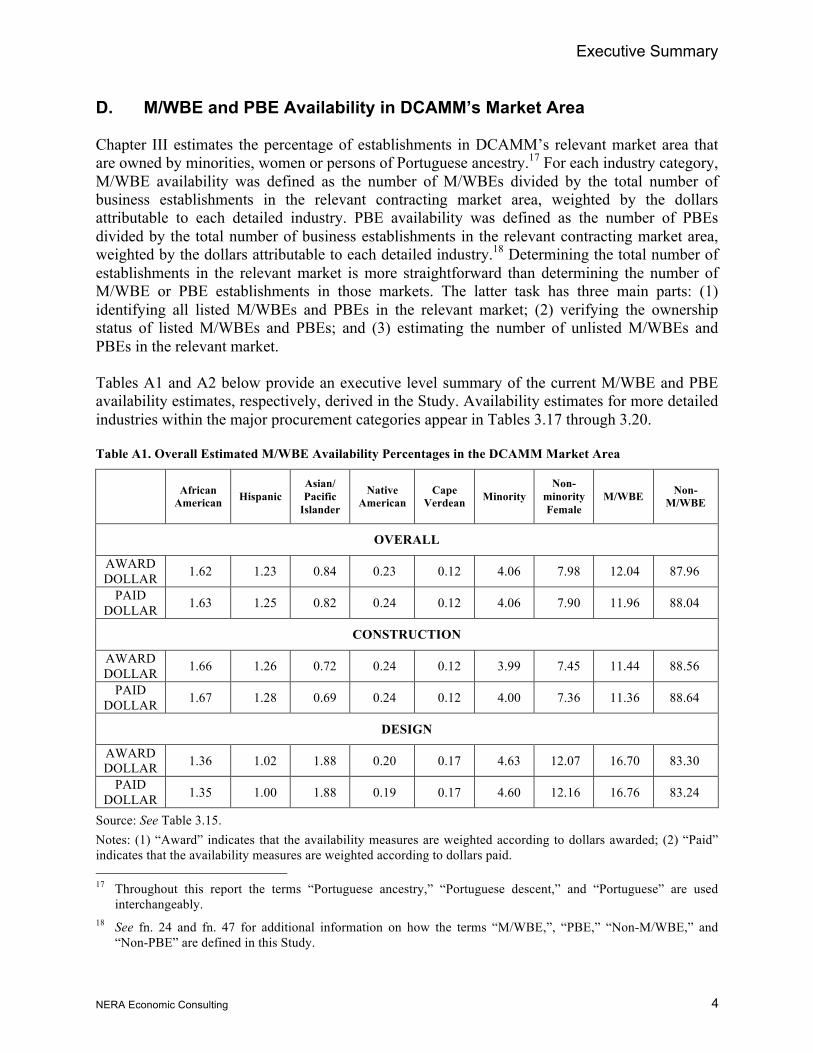
Chapter III estimates the percentage of establishments in DCAMM’s relevant market area that are owned by minorities, women or persons of Portuguese ancestry.17 For each industry category, M/WBE availability was defined as the number of M/WBEs divided by the total number of business establishments in the relevant contracting market area, weighted by the dollars attributable to each detailed industry. PBE availability was defined as the number of PBEs divided by the total number of business establishments in the relevant contracting market area, weighted by the dollars attributable to each detailed industry.18 Determining the total number of establishments in the relevant market is more straightforward than determining the number of M/WBE or PBE establishments in those markets. The latter task has three main parts: (1) identifying all listed M/WBEs and PBEs in the relevant market; (2) verifying the ownership status of listed M/WBEs and PBEs; and (3) estimating the number of unlisted M/WBEs and PBEs in the relevant market.
Tables A1 and A2 below provide an executive level summary of the current M/WBE and PBE availability estimates, respectively, derived in the Study. Availability estimates for more detailed industries within the major procurement categories appear in Tables 3.17 through 3.20.
Table A1. Overall Estimated M/WBE Availability Percentages in the DCAMM Market Area
African
American Hispanic Asian/ Pacific
Islander
Native American
Cape Verdean Minority
Non-minority Female
M/WBE Non-M/WBE
OVERALL
AWARD DOLLAR
S
1.62 1.23 0.84 0.23 0.12 4.06 7.98 12.04 87.96
PAID DOLLAR
S
1.63 1.25 0.82 0.24 0.12 4.06 7.90 11.96 88.04
CONSTRUCTION
AWARD DOLLAR
S
1.66 1.26 0.72 0.24 0.12 3.99 7.45 11.44 88.56
PAID DOLLAR
S
1.67 1.28 0.69 0.24 0.12 4.00 7.36 11.36 88.64
DESIGN
AWARD DOLLAR
S
1.36 1.02 1.88 0.20 0.17 4.63 12.07 16.70 83.30
PAID DOLLAR
S
1.35 1.00 1.88 0.19 0.17 4.60 12.16 16.76 83.24
Source: See Table 3.15. Notes: (1) “Award” indicates that the availability measures are weighted according to dollars awarded; (2) “Paid” indicates that the availability measures are weighted according to dollars paid. 17 Throughout this report the terms “Portuguese ancestry,” “Portuguese descent,” and “Portuguese” are used
interchangeably. 18 See fn. 24 and fn. 47 for additional information on how the terms “M/WBE,”, “PBE,” “Non-M/WBE,” and
“Non-PBE” are defined in this Study.

Executive Summary
NERA Economic Consulting
5
Table A2. Overall Estimated PBE Availability Percentages in the DCAMM Market Area
Portuguese Ancestry through
Portugal
Portuguese Ancestry through
Brazil
Portuguese Ancestry (Any) Non-PBE
OVERALL
AWARD DOLLARS 1.59 0.94 2.52 97.48
PAID DOLLARS 1.61 0.95 2.56 97.44
CONSTRUCTION
AWARD DOLLARS 1.69 1.02 2.70 97.30
PAID DOLLARS 1.71 1.03 2.74 97.26
DESIGN
AWARD DOLLARS 0.77 0.27 1.04 98.96
PAID DOLLARS 0.77 0.27 1.04 98.96
Source: See Table 3.16.
E. Statistical Disparities in Business Formation and Business Owner Earnings
1. Census Bureau’s American Community Survey
Chapter III demonstrates that current M/WBE and PBE availability levels in DCAMM’s market area, as measured in Chapter II, are substantially lower in most instances than those that we would expect to observe if commercial markets operated in a race- and gender-neutral manner and that these levels are statistically significant.19 In other words, minorities, women and PBEs are substantially and significantly less likely to own their own businesses as the result of discrimination than would be expected based upon their observable characteristics, including age, education, geographic location and industry. We find that these groups also suffer substantial and significant earnings disadvantages relative to comparable nonminority, non-Portuguese males, whether they work as employees or entrepreneurs.
For example, we found that annual average wages for African Americans in 2010–2014 in the economy as a whole were 39.3 percent lower in the DCAMM market area than for non-Portuguese nonminority males who were otherwise similar in terms of geographic location, industry, age and education (see Table 4.1, column 3). This difference is large and statistically significant. Large, adverse, and statistically significant wage and salary disparities were also 19 Typically, for a given disparity statistic to be considered “statistically significant” there must be a substantial
probability that the value of that statistic is unlikely to be due to chance alone. See also fn. 69.

Executive Summary
NERA Economic Consulting
6
observed for Hispanics (34.1 percent lower), Asians/Pacific Islanders (20.5 percent lower), Native Americans (16.0 percent lower), persons reporting two or more races (33.9 percent lower) and nonminority women (29.6 percent lower). For persons of Portuguese descent, wages and salaries were 22.2 percent lower. These disparities are consistent with the presence of market-wide discrimination. Comparable results were observed when the analysis was restricted to the Construction and Design sector or the Goods and Services sector. That is, large, adverse, and statistically significant wage disparities were observed for virtually all minority groups, for nonminority women, and for persons of Portuguese descent. All wage and salary disparity analyses were then repeated to test whether observed disparities in the DCAMM market area were different enough from elsewhere in the country or the economy to alter any of the basic conclusions regarding wage and salary disparities. They were not.
This analysis demonstrates that minorities, women, and persons of Portuguese descent earn substantially and significantly less than their non-Portuguese nonminority male counterparts. Such disparities are consistent with race and gender discrimination in the labor force that, in addition to its direct effect on workers, reduces the future availability of M/WBEs and PBEs by stifling opportunities for minorities, women, and persons of Portuguese descent to progress through precisely those internal labor markets and occupational hierarchies that are most likely to lead to entrepreneurial opportunities. These disparities reflect more than mere “societal discrimination” because they demonstrate the nexus between discrimination in the job market and reduced entrepreneurial opportunities for minorities and women. Other things equal, these reduced entrepreneurial opportunities in turn lead to lower M/WBE and PBE availability levels than would be observed in a race- and gender-neutral market area.
Next, we analyzed race and gender disparities in business owner earnings (see Tables 4.7 to 4.12). We found, for example, that annual earnings for self-employed African Americans in 2010–2014 in the economy as a whole were 46.8 percent lower in the DCAMM market area than for nonminority males who were otherwise similar in terms of geographic location, industry, age and education. This difference is large and statistically significant. Large, adverse, and statistically significant earnings disparities were also observed for Hispanics (21.3 percent lower), Asians/Pacific Islanders (8.4 percent lower), Native Americans (1.4 percent lower), Cape Verdeans (25.4 percent lower), persons reporting two or more races (5.9 percent lower), nonminority women (34.6 percent lower), and Portuguese (3.9 percent lower). These disparities are consistent with the presence of market-wide discrimination. Comparable results were observed when the analysis was restricted to the Construction and Design sector or to the Goods and Services sector.20 As with the wage and salary disparity analysis, we enhanced our basic statistical model to test whether minority, female, and Portuguese business owners in the DCAMM market area differed significantly enough from business owners elsewhere in the U.S. economy to alter any of our basic conclusions regarding disparity. They did not.
20 A possible exception is for Portuguese business owners in the Construction and Design sector (see Table 4.11).
In that sector, business owner earnings for Portuguese were 2.2 percent higher than for comparable non-PBE males (see Table 4.11, column 1). However, when the interaction term for the DCAMM market area was included ((see Table 4.11, column 2), the overall earnings difference becomes adverse—falling to -1.8 percent. The interaction term for Portuguese in the DCAMM market area, is statistically significant at an 85 percent level (t-value of 1.44).

Executive Summary
NERA Economic Consulting
7
As was the case for wage and salary earners, minority, female and Portuguese entrepreneurs earned substantially and significantly less from their efforts than similarly situated nonminority male entrepreneurs. These disparities are a symptom of discrimination in commercial markets that directly and adversely affect M/WBEs and PBEs. Other things equal, if minorities, women and persons of Portuguese descent cannot earn remuneration from their entrepreneurial efforts comparable to that of nonminority males, growth rates will slow, business failure rates will increase, and business formation rates may decrease. Combined, these phenomena result in lower M/WBE and PBE availability levels than would otherwise be observed in a race- and gender-neutral market area.
Next, we analyzed race and gender disparities in business formation (see Tables 4.17 to 4.22). As with earnings, in most cases we observed large, adverse, and statistically significant disparities consistent with the presence of discrimination in these markets in the overall economy, in the Construction and Design sector and in the Goods and Services sector. In the Construction and Design sector (Table 4.18), for example, business formation rates for African Americans were 14.7 percentage points lower than for comparable non-Portuguese nonminority males. Large, adverse, and statistically significant reductions in business formation were also observed for Hispanics (8.3 percentage points lower), Asians/Pacific Islanders (8.5 percentage points lower), Native Americans (19.8 percentage points lower), Cape Verdeans (13.3 percentage points lower), persons reporting two or more races (4.2 percentage points lower) and nonminority women (14.5 percentage points lower). For persons of Portuguese descent, business formation rates in the Construction and Design sector were 6.4 percentage points lower. Comparable results for the Goods and Services sector and for the economy as a whole are also presented in this chapter.
2. Census Bureau’s Survey of Business Owners
As a further check on the statistical findings in this chapter, we examined evidence from the Census Bureau’s Survey of Business Owners and Self-Employed Persons (SBO) (see Tables 4.25 through 4.30). These data show large, adverse, and statistically significant disparities between M/WBEs’ share of overall revenues and their share of overall firms in the U.S. as a whole, and in the Commonwealth of Massachusetts.21 The size of the disparities facing minority-owned firms in Massachusetts is very large. For example, Table 4.26 shows that although African Americans owned 3.9 percent of all firms in Massachusetts, these firms earned only 0.62 percent of all sales and receipts. Hispanic-owned firms were 5.06 percent of all firms in Massachusetts, yet they earned only 1.25 percent of all sales and receipts. Asian-owned firms were 5.71 percent of all firms in Massachusetts, but earned only 3.65 percent of sales and receipts. Native Hawaiian and Pacific Islander-owned firms were 0.06 percent of all firms in Massachusetts, but earned only 0.02 percent of all sales and receipts. Native American-owned firms were 0.48 percent of all firms in Massachusetts, but earned only 0.18 percent of sales and receipts. Women-owned firms were 33.59 percent of all firms in Massachusetts, but these firms earned only 9.36 percent of sales and receipts.
21 In general, with this particular dataset, it is not possible to analyze geographies below the state level.

Executive Summary
NERA Economic Consulting
8
Comparable results for the Construction and Design sector and the Goods and Services sector are also included in this section.
F. Statistical Disparities in Credit/Capital Markets
In Chapter V, we analyzed historical data from the Survey of Small Business Finances (“SSBF”), conducted by the Federal Reserve Board and the U.S. Small Business Administration covering 1993-2003, and more limited data from: (a) nine surveys mirroring the SSBF that NERA conducted throughout the nation between 1999 and 2007, and (b) more recent data compiled from the Kauffman Firm Survey, to examine whether discrimination exists in the market for small business credit and capital.
Credit market discrimination can have an important effect on the likelihood that M/WBEs will succeed. Moreover, discrimination in the credit market might even prevent such businesses from opening in the first place. This analysis has been held by some courts to be probative of a public entity’s compelling interest in remedying discrimination.22 We provide qualitative and quantitative evidence supporting the view that M/WBE firms, particularly African American-owned firms, suffer discrimination in this market.
The SSBF datasets are constructed for the nation as a whole and for four Census regions. The DCAMM market area is part of the Northeast region (NEAST), which includes the Commonwealth of Massachusetts and eight surrounding states.23 To render the results as narrowly tailored as possible, we included indicator variables in our statistical analyses to determine whether the results for the NEAST were different from those for the nation as a whole. We determined that the national results also apply in general to the NEAST.
The main results from the SSBF are as follows:
• Minority-owned firms were more likely to report that they did not apply for a loan over the preceding three years because they feared the loan would be denied (see Tables 5.15, 5.22, 5.29).
• When minority-owned firms applied for a loan, their loan requests were substantially more likely to be denied than non-minorities, even after accounting for differences like firm size and credit history (see Tables 5.8, 5.9, 5.18, 5.19, 5.25, 5.26).
• When minority-owned firms did receive a loan they were obligated to pay higher interest rates on the loans than comparable nonminority-owned firms (see Tables 5.13, 5.14, 5.21, 5.27).
22 See, e.g., Northern Contracting, Inc. v. Illinois Department of Transportation, No. 00-C-4515, 2005 U.S. Dist.
LEXIS 19868 (N.D. Ill. Sept. 8, 2005); Concrete Works of Colorado v. City and County of Denver, 321 F.3d 950, (10th Cir. 2003).2003) (“Concrete Works IV”) cert. denied 540 U.S. 1027 (2003).
23 The NEAST includes Massachusetts as well as Connecticut, Maine, Rhode Island, New Hampshire, Vermont, New Jersey, New York, and Pennsylvania.

Executive Summary
NERA Economic Consulting
9
• A larger proportion of minority-owned firms than nonminority-owned firms report that credit market conditions are a serious concern (see Tables 5.3, 5.4, 5.5, 5.6, 5.7, 5.17, 5.24).
• A larger share of minority-owned firms than nonminority-owned firms believes that the availability of credit is the most important issue likely to confront them in the upcoming year (see Tables 5.5, 5.6).
• There is no evidence that discrimination in the market for credit is significantly different in the NEAST, which includes the DCAMM market area, or in the Construction and Design industries than it is in the nation or the economy as a whole (various tables). The evidence from NERA’s own credit surveys in a variety of states and metropolitan areas across the country is entirely consistent with the results from the SSBF.
Results from the 1999-2007 NERA surveys and more recent Kauffman Firm Survey data were consistent with these findings from the SSBF. There is no evidence that the level of discrimination in the market for credit has diminished between 1993 and 2003, between 1999-2007, or in more recent years (various tables).
We conclude that there is evidence of discrimination against M/WBEs in the DCAMM market area in the small business credit market. This discrimination is particularly acute for African American-owned small businesses where, even after adjusting for differences in assets, liabilities, and creditworthiness, the loan denial rates remain substantially higher than for nonminority male-owned small businesses.
G. Public Sector Utilization vs. Availability in DCAMM Contracting
Chapter VI analyzes the extent to which M/WBEs and PBEs were utilized on contracts active at DCAMM during FY 2010-2015 and compares this utilization rate to the availability of M/WBEs and PBEs in the relevant market area. Tables B1, B2, B3 and B4 provide an executive summary of the utilization findings for the Study by industry category and M/WBE and PBE type. Table B1 shows M/WBE and non-M/WBE utilization measured by dollars awarded for all contracts and purchases examined during the study period. Table B2 shows comparable M/WBE and non-M/WBE utilization measured by dollars paid. Tables B3 and B4 provide comparable information, respectively, for PBEs.

Executive Summary
NERA Economic Consulting
10
Table B1. M/WBE Utilization in Contracting at DCAMM–All Contracts (Dollars Awarded)
M/WBE Type Procurement Category
Construction Design Overall (%) (%) (%)
African American 1.20 0.34 1.11 Hispanic 2.37 0.75 2.20 Asian/Pacific Islander 0.46 7.16 1.17 Native American 0.01 0.01 0.01 Cape Verdean 0.15 0.21 0.15 Minority Total 4.20 8.47 4.65 Nonminority female 10.43 17.04 11.12 M/WBE Total 14.62 25.51 15.77 Non-M/WBE Total 85.38 74.49 84.23
Total (%) 100.00 100.00 100.00 Total ($) 2,709,068,875 320,042,321 3,029,111,196
Prime Contracts 1,608 308 1,916 Subcontracts 5,263 1,838 7,101
Source and Notes: See Table 6.1.
Table B2. M/WBE Utilization in Contracting at DCAMM–All Contracts (Dollars Paid)
M/WBE Type Procurement Category
Construction Design Overall (%) (%) (%)
African American 1.25 0.31 1.16 Hispanic 2.38 0.69 2.21 Asian/Pacific Islander 0.53 7.36 1.24 Native American 0.01 0.01 0.01 Cape Verdean 0.16 0.22 0.16 Minority Total 4.33 8.59 4.78 Nonminority female 10.15 17.81 10.94 M/WBE Total 14.48 26.40 15.72 Non-M/WBE Total 85.52 73.60 84.28
Total (%) 100.00 100.00 100.00 Total ($) 2,572,726,160 297,719,057 2,870,445,217
Prime Contracts 1,580 300 1,880 Subcontracts 5,186 1,793 6.979
Source: See Table 6.2.

Executive Summary
NERA Economic Consulting
11
Table B3. PBE Utilization in Contracting at DCAMM–All Contracts (Dollars Awarded)
PBE Type Procurement Category
Construction Design Overall (%) (%) (%)
Ancestry via Portugal 4.88 0.32 4.47 Ancestry via Brazil 0.11 0.00 0.10 PBE Total 4.99 0.32 4.57 Non-PBE Total 95.01 99.68 95.43
Total (%) 100.00 100.00 100.00 Total ($) 2,434,460,883 239,175,726 2,673,636,610
Prime Contracts 1,489 237 1,726 Subcontracts 4,410 1,204 5,614
Source and Notes: See Table 6.3.
Table B4. PBE Utilization in Contracting at DCAMM–All Contracts (Dollars Paid)
PBE Type Procurement Category
Construction Design Overall (%) (%) (%)
Ancestry via Portugal 4.97 0.32 4.57 Ancestry via Brazil 0.12 0.00 0.11 PBE Total 5.09 0.32 4.68 Non-PBE Total 94.91 99.68 95.32
Total (%) 100.00 100.00 100.00 Total ($) 2,318,220,445 219,834,456 2,538,054,901
Prime Contracts 1,465 231 1,696 Subcontracts 4,349 1,174 5,523
Source: See Table 6.4.
Finally in Chapter VI, we compared the use of M/WBEs and PBEs on all DCAMM Construction and Design contracts and subcontracts from the study period to our measures of M/WBE and PBE availability in the DCAMM market area. If M/WBE (or PBE) utilization is lower than measured availability in a given category, we report this result as a disparity. If M/WBE or PBE utilization exceeds availability, this does not necessarily indicate a lack of discrimination. Rather, given all of the other evidence from this Study, it is most likely simply a reflection of DCAMM’s longstanding efforts to affirmatively increase M/WBE and PBE participation in its contracting activities.
Table C1, on the following page, provides a top-level summary of our disparity findings for the Study for each major procurement category using dollars awarded. Table C2 provides

Executive Summary
NERA Economic Consulting
12
comparable results using dollars paid. Tables C3 and C4 provide corresponding results, respectively, for PBEs.
Table C1. M/WBE Utilization, Availability and Disparity Results for DCAMM Contracting, Overall and by Contracting Category–All Contracts (Dollars Awarded)
Contracting Category & M/WBE Type Utilization Availability Disparity Ratio
OVERALL African American 1.11 1.62 68.2 Hispanic 2.20 1.23 Asian/Pacific Islander 1.17 0.84 Native American 0.01 0.23 5.0 *** Cape Verdean 0.15 0.12 Minority-owned 4.65 4.06 Nonminority female 11.12 7.98 M/WBE total 15.77 12.04 CONSTRUCTION African American 1.20 1.66 72.3 Hispanic 2.37 1.26 Asian/Pacific Islander 0.46 0.72 64.5 Native American 0.01 0.24 5.1 *** Cape Verdean 0.15 0.12 Minority-owned 4.20 3.99 Nonminority female 10.43 7.45 M/WBE total 14.62 11.44
DESIGN African American 0.34 1.36 25.0 *** Hispanic 0.75 1.02 74.1 Asian/Pacific Islander 7.16 1.88 Native American 0.01 0.20 4.0 *** Cape Verdean 0.21 0.17 Minority-owned 8.47 4.63 Nonminority female 17.04 12.07 M/WBE total 25.51 16.70
Source: See Table 6.5. Notes: (1) “*” indicates an adverse disparity that is statistically significant at the 10% level or better (90% confidence). “**” indicates the disparity is significant at a 5% level or better (95% confidence). “***” indicates significance at a 1% level or better (99% confidence). (2) An empty cell in the Disparity Ratio column indicates that no adverse disparity was observed for that category.

Executive Summary
NERA Economic Consulting
13
Table C2. M/WBE Utilization, Availability and Disparity Results for DCAMM Contracting, Overall and by Contracting Category–All Contracts (Dollars Paid)
Contracting Category & M/WBE Type Utilization Availability Disparity Ratio
OVERALL African American 1.16 1.63 70.9 Hispanic 2.21 1.25 Asian/Pacific Islander 1.24 0.82 Native American 0.01 0.24 5.3 *** Cape Verdean 0.16 0.12 Minority-owned 4.78 4.06 Nonminority female 10.94 7.90 M/WBE total 15.72 11.96 CONSTRUCTION African American 1.25 1.67 75.3 Hispanic 2.38 1.28 Asian/Pacific Islander 0.53 0.69 76.1 Native American 0.01 0.24 5.3 *** Cape Verdean 0.16 0.12 Minority-owned 4.33 4.00 Nonminority female 10.15 7.36 M/WBE total 14.48 11.36
DESIGN African American 0.31 1.35 22.8 *** Hispanic 0.69 1.00 68.8 Asian/Pacific Islander 7.36 1.88 Native American 0.01 0.19 4.4 *** Cape Verdean 0.22 0.17 Minority-owned 8.59 4.60 Nonminority female 17.81 12.16 M/WBE total 26.40 16.76
Source and Notes: See Table 6.6.

Executive Summary
NERA Economic Consulting
14
Table C3. PBE Utilization, Availability and Disparity Results for DCAMM Contracting, Overall and by Contracting Category–All Contracts (Dollars Awarded)
Contracting Category & PBE Type Utilization Availability Disparity Ratio
OVERALL Via Portugal 4.47 1.59 Via Brazil 0.10 0.94 11.0 *** All Portuguese 4.57 2.52 CONSTRUCTION Via Portugal 4.88 1.69 . Via Brazil 0.11 1.02 11.1 *** All Portuguese 4.99 2.70
DESIGN Via Portugal 0.32 0.77 42.2 * Via Brazil 0.00 0.27 0.0 *** All Portuguese 0.32 1.04 31.2 ***
Source and Notes: See Table 6.7.
Table C4. PBE Utilization, Availability and Disparity Results for DCAMM Contracting, Overall and by Contracting Category–All Contracts (Dollars Paid)
Contracting Category & PBE Type Utilization Availability Disparity Ratio
OVERALL Via Portugal 4.57 1.61 Via Brazil 0.11 0.95 11.5 *** All Portuguese 4.68 2.56 CONSTRUCTION Via Portugal 4.97 1.71 Via Brazil 0.12 1.03 11.6 *** All Portuguese 5.09 2.74
DESIGN Via Portugal 0.32 0.77 42.0 * Via Brazil 0.00 0.27 0.0 *** All Portuguese 0.32 1.04 31.1 ***
Source and Notes: See Table 6.8.
H. Anecdotal Evidence
Chapter VII presents the results of a large-scale mail survey we conducted of M/WBEs, PBEs, and non-M/WBEs about their experiences and difficulties in obtaining contracts. The survey quantified and compared anecdotal evidence on the experiences of M/WBEs, PBEs, and non-M/WBEs as a method to examine whether any differences might be due to discrimination.

Executive Summary
NERA Economic Consulting
15
We found that M/WBEs and PBEs that have been hired in the past by non-M/WBE, non-PBE prime contractors to work on public sector contracts with M/WBE goals are rarely hired—or even solicited—by these prime contractors to work on projects without M/WBE goals. The relative lack of M/WBE hiring and, moreover, the relative lack of solicitation of M/WBEs in the absence of affirmative efforts by DCAMM and other public entities in the market area shows that business discrimination continues to fetter M/WBE and PBE business opportunities in the relevant markets.
We found that M/WBEs and PBEs in the relevant market area report suffering business-related discrimination in relatively large numbers and with statistically significantly greater frequency than non-M/WBE non-PBEs. These differences remain statistically significant even when firm size and other “capacity”-related owner characteristics are held constant. Some of the largest disparities were observed in applying for commercial loans, applying for surety bonds, working or attempting to work on private sector prime contracts and subcontracts, functioning without hindrance or harassment on the work site, working or attempting to work on private sector subcontracts, in having to perform inappropriate or extra work not required of comparable non-M/WBE, non-PBE firms, and having to meet quality, inspection or performance standards not required of comparable non-M/WBE, non-PBE firms.
We also found that M/WBEs and PBEs in these markets are more likely than similarly situated non-M/WBE non-PBEs to report that specific aspects of the regular business environment make it harder for them to conduct their businesses, and less likely than similarly situated non-M/WBEs to report that specific aspects of the regular business environment make it easier for them to conduct their businesses. In particular, bonding requirements, previous experience requirements, large project sizes, and prior dealings with public and/or private sector project owners were statistically significantly more difficult for M/WBEs and/or PBEs than non-M/WBE non-PBEs, even when holding firm size and other “capacity”-related owner characteristics constant. Other factors where M/WBEs and/or PBEs reported more difficulty than similarly-situated non-M/WBEs included insurance requirements, the cost of bidding or proposing, the price of supplies or materials, obtaining working capital, and late notice of bid/proposal deadlines.
Chapter VII also presents the results from a series of in-depth personal interviews conducted with more than 120 M/WBE, PBE, and non-M/WBE non-PBE business owners and representatives from DCAMM’s market area. Similar to the survey responses, the interviews strongly suggest that minorities, women, and persons of Portuguese descent continue to suffer discriminatory barriers to full and fair access to DCAMM, other public sector, and private sector contracts in Massachusetts. Participants reported negative perceptions of M/WBE and PBE competence and qualifications, being held to higher performance standards, exclusion from industry networks, workplace harassment, glass ceiling discrimination, discrimination in access to commercial loans and surety bonds, abuses in the payment process, and exclusion from significant public and private sector opportunities to perform as either prime contractors or as subcontractors.
We conclude that the statistical evidence presented in this report is consistent with these anecdotal accounts of contemporary business discrimination. The results of the surveys and the

Executive Summary
NERA Economic Consulting
16
personal interviews are the types of anecdotal evidence that, especially in conjunction with the Study’s extensive statistical evidence, the courts have found to be highly probative of whether, without affirmative interventions, DCAMM would be a passive participant in a discriminatory local market area. It is also highly relevant for narrowly tailoring any M/WBE goals that are established.
I. DCAMM’s M/WBE Program: Overview and Feedback Interviews
Chapter VIII provides an overview of DCAMM’s current M/WBE Program, followed by a summary of business owner experiences with these policies and procedures obtained from our interviews. We interviewed more than 120 business owners and representatives, as well as DCAMM staff, to solicit their feedback regarding DCAMM’s policies in this area. Our interviews covered the following subjects:
• The significance of DCAMM’s M/WBE Program;
• The significance of DCAMM’s M/WBE Program to PBE Firms;
• Certification standards and processes of the Operational Services Division, Supplier Diversity Office (“SDO”);
• Pre-award processes: Meeting M/WBE goals;
• Pre-award processes: Contract solicitations;
• Contract performance: Monitoring;
• Contract performance: Payment;
• Contract performance: Retainage; and
• Front companies and Pass Throughs.
J. Recommendations for Revised Contracting Policies and Procedures
Finally, in Chapter IX we present the following recommendations, based upon the Study’s results and findings and upon our views on best practices for contracting diversity programs.

Executive Summary
NERA Economic Consulting
17
1. Suggested Best Practices for Race- and Gender-Conscious Contracting Programs Procedures
a. Continue and Augment Race- and Gender-Neutral initiatives
§ Expand the Small Business Purchasing Program to Construction and Design
§ Review Surety Bonding and Previous Experience Requirements
§ Increase Contract Unbundling
§ Ensure Prompt Payments
§ Collect Bid Data and Pricing Information for Subcontractor Quotations
§ Utilize Emerging Technologies
§ Enhance Objective Evaluation Criteria and Scoring for Design Awards
§ Enact Mechanisms to Allow Businesses to Report Program Infractions Without Fear of Retaliation
b. Implement Race- and Gender-Conscious Remedies
§ Increase Certification Outreach and Training
§ Continue to Set Overall Aspirational, M/WBE Goals for DCAMM Spending, and Develop and Publicize Accurate Annual Forecasts of Opportunities and Participation Levels
§ Continue to Set Contract Specific Goals
• Count M/WBE Prime Contractors’ Own Participation Toward Meeting Contract Goals
• Continue to Count Lower-Tier M/WBE Utilization
• Set M/WBE Goals on Filed Sub-Bids
• Establish Control Contracts
§ Review Contract Award Procedures
• Scrutinize M/WBEs’ Commercially Useful Function

Executive Summary
NERA Economic Consulting
18
• Standardize and Disseminate Good Faith Efforts Policies and Procedures
• Develop Standard Contractual Terms and Conditions for Program Enforcement
§ Monitor Contract Performance
§ Enhance Program Administration
§ Mentor-Protégé Program
§ Develop Performance Measures for Program Success
§ Retainage
§ Periodically Review the Program

Introduction
NERA Economic Consulting
19
I. Introduction
The Commonwealth of Massachusetts Division of Capital Asset Management and Maintenance (“DCAMM”) commissioned this Study to evaluate whether minority-owned, women-owned business enterprises (“M/WBEs”), and Portuguese-owned business enterprises (“PBEs”) in the Commonwealth’s market area have full and fair opportunities to compete for its Construction and Design prime contracts and associated subcontracts.
To ensure compliance with constitutional mandates, its own M/WBE Statute, and M/WBE program best practices, DCAMM commissioned NERA Economic Consulting to examine the past and current status of M/WBEs and PBEs in its geographic and product markets for contracting and procurement. The results of the Study provide the evidentiary record necessary for DCAMM’s consideration of whether to implement renewed M/WBE and PBE policies that comply with the requirements of the courts and to assess the extent to which previous efforts have assisted M/WBEs and PBEs to compete on a fair basis in DCAMM’s contracting activity.
This Study finds statistical evidence consistent with the presence of business discrimination against M/WBEs and PBEs in the private sector of the Commonwealth of Massachusetts market area. These findings are presented in Chapters IV and V. Statistical analyses of the Commonwealth’s own contracting, which also document evidence consistent with business discrimination, are contained in Chapters II, III and VI. As a check on our statistical findings, documented in Chapter VII, we surveyed the contracting experiences of M/WBEs, PBEs, non-M/WBEs, and non-PBEs in the market area and also conducted a series of in-depth personal interviews with business enterprises throughout the market area, both M/WBE, PBE, non-M/WBE, and non-PBE.24
As will be documented in this Study, during the study period DCAMM has been a significant source of demand in the Commonwealth’s economy for the products and services provided by M/WBEs and PBEs—demand that, in general, is found to be lacking in the private sector of the Massachusetts economy and the surrounding region.
As documented below in Chapter VI, DCAMM’s prior efforts have produced positive results—M/WBEs earned approximately 16 percent of DCAMM’s overall contracting and subcontracting payments on Construction and Design contracts active during the FY2010-2015 study period. Strict scrutiny requires a “strong basis in evidence”25 for concluding that discrimination persists and “narrowly tailored”26 measures to address that discrimination. These principles guide and inform our work for DCAMM in this Study.
The results of the 2017 Study provide the evidentiary record necessary for DCAMM’s consideration of whether to implement renewed M/WBE and PBE policies that comply with the
24 For this Study, unless otherwise noted, the category “non-M/WBE,” excludes nonminority male PBEs.
Similarly, the category “non-PBE” excludes minority-owned non-Portuguese firms. See also fn. 47. 25 Croson, 488 U.S. at 500 (citing Wygant v. Jackson Board of Education, 476 U.S. 267, 277 (1986)). 26 Id. at 506-508. See also, Wygant, 476 U.S. at 274.

Introduction
NERA Economic Consulting
20
requirements of the courts and to assess the extent to which previous efforts have assisted M/WBEs and PBEs to participate on a fair basis in DCAMM’s contracting activity.
The 2017 Study finds both statistical and anecdotal evidence of business discrimination against M/WBEs and PBEs in the private sector of DCAMM’s market area. As a check on our statistical findings, we surveyed the contracting experiences and credit access experiences of M/WBEs, PBEs, and non-M/WBEs and non-PBEs in the market area and we also conducted a series of in-depth personal interviews with local business enterprises, M/WBE, PBE, and non-M/WBE and non-PBE. Statistical analyses of DCAMM’s public sector contracting activity appear below in Chapters II, III and VI.
A. Study Outline
The Study is presented in nine chapters, and is designed to answer the following questions:
Chapter I: Introduction
Chapter II: What is the relevant geographic market for DCAMM and how is it defined? What are the relevant product markets for DCAMM and how are they defined?
Chapter III: What percentage of all businesses in DCAMM’s market area is owned by minorities, women, and persons of Portuguese ancestry?27 How are these availability estimates constructed?
Chapter IV: Do minority and/or female wage and salary earners earn less than similarly situated nonminority males? Do minority and/or female business owners earn less from their businesses than similarly situated nonminority males? Are minorities and/or women in DCAMM’s market area less likely to be self-employed than similarly situated nonminority males? How do the findings in DCAMM’s market area differ from the national findings on these questions? How have these findings changed over time? Chapter IV also asks a similar set of questions with respect to Portuguese and non-Portuguese wage and salary earners.
Chapter V: Do minorities and/or women face discrimination in the market for commercial capital and credit compared to similarly situated nonminority males? How, if at all, do findings locally differ from findings nationally?
Chapter VI: To what extent have M/WBEs and PBEs been utilized by DCAMM on contracts active during the study period, and how does this utilization compare to the availability of M/WBEs and PBEs in the relevant market area?
27 Throughout this report the terms “Portuguese ancestry,” “Portuguese descent,” and “Portuguese” are used
interchangeably.
Introduction
NERA Economic Consulting
21
Chapter VII: How many M/WBEs experienced disparate treatment in the study period? What types of discriminatory experiences are most frequently encountered by M/WBEs? How do the experiences of M/WBEs differ from those of similar non-M/WBEs regarding difficulties in obtaining prime contracts and subcontracts? Chapter VII also asks a similar set of questions with respect to PBEs and non-PBEs.
Chapter VIII: What general policies and procedures govern DCAMM’s M/WBE Program? What were some of the most frequently encountered comments from M/WBEs and non-M/WBEs concerning DCAMM’s contracting affirmative action programs?
In assessing these questions, we present in Chapters II through VII a series of quantitative and qualitative analyses that compare minority and/or female outcomes to nonminority male outcomes, as well as Portuguese versus non-Portuguese outcomes, in all of these business-related areas. The Executive Summary, above, provides a brief overview of our key findings and conclusions.
Finally, Chapter IX contains our observations regarding M/WBE program best practices applicable to DCAMM.

Introduction
NERA Economic Consulting
22
This page intentionally left blank.

Defining the Relevant Markets
NERA Economic Consulting
23
II. Defining the Relevant Markets
A. Preparing the Master Contract/Subcontract Database
1. Overview
In the Croson decision, the Supreme Court indicated that the national findings by Congress of minority business discrimination in construction and related industries were not specific or exacting enough, standing alone, to support an MBE program in the City of Richmond. For this reason, the first step in our evaluation of M/WBE availability and participation for DCAMM is to define the relevant market area for its contracting and procurement activity. Markets have both a geographic dimension and a product, or industry, dimension.28 Both aspects of market definition are considered in this chapter. For this Study, we define the relevant geographic market area based on DCAMM’s historical contracting and subcontracting records. This market dimension is determined empirically by examining the zip code distribution of utilized contractors and subcontractors.
Narrow tailoring also applies to product markets. The extent of disparity may differ from industry to industry just as it does among geographic locations.29 Documenting the specific industries that comprise DCAMM’s contracting activities and the relative importance of each to contract and subcontract spending is important because it allows for: (1) implementation of more narrowly tailored availability estimation methods, (2) contract-level goal-setting, and (3) overall M/WBE availability estimates and annual goals that are a weighted average of underlying industry-level availability estimates, rather than a simple average. The weights used are the proportion of dollars awarded or paid within each industry and allow the overall availability measure to be influenced more heavily by availability in those industries where more contracting dollars are spent, and less heavily by availability in those industries where relatively fewer contracting dollars are spent.
We define the product market dimension by estimating which North American Industrial Classification System (NAICS) codes best describe each identifiable contractor, subcontractor, subconsultant, or supplier in those records.30 In both cases, the definitions are weighted according to how many dollars were spent with firms from each zip code or NAICS code, respectively, so that locations and industries, respectively, receiving relatively more contracting dollars receive relatively more weight in the estimation of M/WBE availability. Once the geographic and industry parameters of the DCAMM’s market area have been defined, we can restrict our subsequent analyses to business enterprises and other phenomena within this market area. Restricting our analyses in this manner narrowly tailors our findings to DCAMM’s specific market area and contracting circumstances.
28 See, for example, Areeda, P., L. Kaplow, and A. Edlin (2004). 29 See Wainwright (2000), documenting that, in general, the similarities in the amount of discrimination present in
different industries and geographic locations significantly outweigh the differences. 30 Executive Office of the President, Office of Management and Budget (2012).

Defining the Relevant Markets
NERA Economic Consulting
24
2. DCAMM Contracting
With assistance from DCAMM, NERA collected all prime contract award and payment records (“prime contracts”) and all associated available subcontract, subconsultant and supplier award and payment records (“subcontracts”) spanning fiscal years 2010 through 2015.31 These data were retrieved from several sources including MMARS (the Commonwealth’s official accounting system), the Commonwealth’s Designer Selection Board database and DCAMM’s M/WBE Compliance database, M/WBE Compliance Certificates of Payment, Bid Tally sheets, House Doctor database, hard copy S1B forms, and contractor and subcontractor registration database.
For each prime contract active during the study period, we identified whether it was for construction or design, the business name and address of the prime contractor or consultant, a description of the contract, the contract number, start date, total award amount, the total current paid amount, and the amount of any MBE or WBE goal. We also cross-referenced business names and addresses with the Commonwealth’s Supplier Diversity Office (“SDO”) directory and other directories (See Chapter III) to obtain additional contractor race, gender, and Portuguese status information.
In this manner, a total of 1,700 prime Construction contracts and 348 prime Design contracts were identified as comprising the contract universe. According to DCAMM records, the 1,700 prime Construction contracts had a cumulative award value of $2.86 billion and a cumulative paid value of $2.51 billion, while the 348 prime Design contracts had a cumulative award value of $359.0 million and a cumulative paid value of $276.3 million. Collectively, these 2,048 prime Construction and Design contracts had a cumulative award value of $3.22 billion and a cumulative paid value of $2.79 billion.
Not all prime contracts have significant subcontract opportunities. In particular, contracts valued at $50,000 or less frequently do not have such opportunities. Of the 1,700 prime Construction contracts in the contract universe, 684 were deemed to have significant subcontract opportunities (leaving 1,016 smaller contracts without such opportunities). These 684 prime Construction contracts had a cumulative award value of $2.85 billion, or 99.5 percent of all construction award dollars in the contract universe, and a cumulative paid value of $2.50 billion, or 99.6 percent of all paid construction dollars in the contract universe. Of the 348 prime Design contracts, 292 were deemed to have significant subcontract opportunities (leaving 56 smaller contracts without such opportunities). These 292 prime design contracts had a cumulative award value of $357.8 million, or 99.7 percent of all design award dollars in the contract universe, and a cumulative paid value of $275.2 million, or 99.6 percent of all paid design dollars in the contract universe.
We conducted a careful review of the available subcontract data for these 684 Construction contracts and 292 Design contracts with subcontract opportunities, and determined that the available subcontract information in DCAMM records, although significant, was incomplete. In consultation with DCAMM, NERA developed a plan to directly contact the prime contractors
31 The Commonwealth’s fiscal year runs from July 1st through June 30th. Contracts that were begun prior to
FY2010 but which were still active during FY2010-FY2015 were included in the FY2010 contract counts.

Defining the Relevant Markets
NERA Economic Consulting
25
that performed these contracts in order to verify the existing record and to supplement it with additional subcontract records where appropriate. As noted above, all prime contracts valued at $50,000 or greater were included in this data collection effort. Smaller prime contracts were not included in the data collection effort. Those prime contracts did, however, remain in the overall study universe for subsequent analysis.
After an intensive data collection effort and with assistance from DCAMM, we were able to obtain relevant information for 596 prime Construction contracts, or 87.1 percent of all prime Construction contracts sought, and 5,343 associated subcontracts. The total award dollar value of these 596 prime Construction contracts, according to DCAMM records, was $2.71 billion, or 95.2 percent of all awarded Construction dollars sought, and the total paid dollar value was $2.37 billion, or 94.8 percent of all paid dollars sought. Similarly, we were able to obtain relevant information for 252 prime Design contracts, or 86.3 percent of all prime Design contracts sampled, and 1,853 associated subcontracts. The total award dollar value of these 252 prime design contracts, according to DCAMM records, was $310.3 million, or 86.7 percent of all awarded design dollars in our sample, and the total paid dollar value was $243.1 million, or 88.4 percent of all paid dollars in our sample. These percentages are sufficiently large to be well representative of the entire universe of DCAMM contracts and subcontracts being examined for this Study.
Dollar values reported by prime contractors did not always match DCAMM records exactly.32 According to prime-reported amounts, the total awarded dollar value of the 596 prime Construction contracts obtained was $2.79 billion and the total paid dollar value was $2.68 billion. For prime Design contracts, the total awarded dollar value of the 252 prime construction contracts obtained was $319.6 million and the total paid dollar value was $299.8 million. In order to achieve consistency with the subcontract dollar values we collected, we use prime reported dollar amounts for the remainder of the relevant analyses in this report.
In all, therefore, a total of 848 prime contracts and 7,196 associated subcontracts were collected from prime construction and design contractors, with a total awarded value of approximately $3.11 billion and a total paid value of $2.98 billion. These 848 prime contracts and 7,196 associated subcontracts were then combined with the 1,072 smaller prime Construction and Design contracts without significant subcontracting opportunities to obtain an overall sample of 1,920 prime construction and design contracts and 7,196 associated subcontracts. Additionally, we then removed, from the paid dollar column only, contracts that were not substantially complete at the time we performed the data collection for this Study. We made this adjustment so as not to skew the picture of subcontract activity presented in the Study. Certain contracts require a different mix of subcontract industries in the later phases of a project than in the earlier phases. By removing contracts that are not substantially complete from the paid dollar totals, we
32 For award dollars, the difference is primarily due to change orders, renewals, and extensions that occurred after
collection of the initial records by DCAMM but prior to NERA receiving the requested information from the prime contractor. For paid dollars, it is primarily due to the passage of time between collection of the initial records from DCAMM and receipt of the requested information from the prime contractor.

Defining the Relevant Markets
NERA Economic Consulting
26
minimize the possibility that not yet completed contracts can alter the distribution of industries from what we would see if all contracts analyzed were 100 percent complete.33
Together, as shown below in Tables 2.1 through 2.3, these prime contracts and subcontracts comprise the Master Contract/Subcontract Database compiled for this Study. Table 2.1 shows, for each major procurement category, the total number of prime contracts and associated subcontracts awarded, the total number of prime contracts and associated subcontracts substantially completed, total dollars awarded, and total dollars paid. Tables 2.2 and 2.3 show comparable information for dollars awarded and dollars paid, respectively, in each fiscal year of the study period.
Table 2.1. Summary of Master Contract/Subcontract Database: Contracts and Subcontracts by Procurement Category, Fiscal Years 2010-2015
CONTRACT CATEGORY NUMBER OF AWARDED
CONTRACTS
NUMBER OF PAID
CONTRACTS
DOLLARS AWARDED
($)
DOLLARS PAID
($)
CONSTRUCTION 2,807,806,798 2,668,814,401
Prime Contracts 1,612 1,584 665,687,511 584,024,803
Subcontracts 5,343 5,265 2,142,119,287 2,084,789,597
DESIGN 320,817,309 298,428,340
Prime Contracts 308 300 188,302,685 172,551,411
Subcontracts 1,853 1,806 132,514,624 125,876,929
GRAND TOTAL 3,128,624,108 2,967,242,740
Prime Contracts 1,920 1,884 853,990,196 756,576,214
Subcontracts 7,196 7,071 2,274,633,911 2,210,666,526
Source: NERA calculations from Master Contract/Subcontract Database.
Note: Prime Contract dollar amounts are net of subcontract amounts.
33 For purposes of the Study, a contract was considered to be substantially complete if (a) the initial award value
was under $50k, or (b) the initial award value was $50k or more, the start date was in fiscal year 2012 or later, and at least 75 percent of the total award amount had been paid.

Defining the Relevant Markets
NERA Economic Consulting
27
Table 2.2 shows the total number of prime contracts awarded during each year of the Study period and total dollars awarded for those contracts, by major procurement category.
Table 2.2. Summary of Master Contract/Subcontract Database: Prime Contracts by Fiscal Year (Dollars Awarded)
PROCUREMENT CATEGORY & YEAR
NUMBER OF PRIME
CONTRACTS
DOLLARS AWARDED
($)
CONSTRUCTION 2010 300 1,217,304,097
2011 124 419,988,889
2012 182 319,295,780
2013 221 298,626,351
2014 412 319,396,123
2015 373 233,195,559
TOTAL 1,612 2,807,806,799 DESIGN
2010 137 193,715,599
2011 32 26,888,789
2012 23 20,792,454
2013 43 31,219,159
2014 39 34,425,100
2015 34 13,776,208
TOTAL 308 320,817,309 GRAND TOTAL
2010 437 1,411,019,695
2011 156 446,877,678
2012 205 340,088,235
2013 264 329,845,510
2014 451 353,821,224
2015 407 246,971,767
TOTAL 1,920 3,128,624,108
Source and Notes: See Table 2.1 and fn. 31.

Defining the Relevant Markets
NERA Economic Consulting
28
Table 2.3 shows the total number of prime contracts awarded during each year of the Study period and total dollars paid for those contracts, by major procurement category.
Table 2.3. Summary of Master Contract/Subcontract Database: Prime Contracts by Year (Dollars Paid)
PROCUREMENT CATEGORY & YEAR
NUMBER OF PRIME
CONTRACTS
DOLLARS PAID
($)
CONSTRUCTION 2010 300 1,202,789,517
2011 124 402,015,071
2012 174 309,654,374
2013 217 265,296,351
2014 406 305,829,806
2015 363 183,229,281
TOTAL 1,584 2,668,814,400 DESIGN
2010 137 183,460,857
2011 32 25,458,204
2012 22 20,292,186
2013 41 28,760,280
2014 39 31,161,078
2015 29 9,295,736
TOTAL 300 298,428,340 GRAND TOTAL
2010 437 1,386,250,374
2011 156 427,473,275
2012 196 329,946,560
2013 258 294,056,631
2014 445 336,990,884
2015 392 192,525,017
TOTAL 1,884 2,967,242,740
Source and Notes: See Table 2.1 and fn. 31.

Defining the Relevant Markets
NERA Economic Consulting
29
B. Geographic Market Definition for Contracting and Procurement
To determine the geographic dimension of DCAMM’s contracting and procurement markets, we used the Master Contract/Subcontract Database, as described in the previous section, to obtain the zip codes and thereby the county and state for each contractor and subcontractor establishment identified in the database. Using this location information, we then calculated the percentage of DCAMM contract and subcontract dollars awarded to establishments by state and county during the study period. As discussed above, the geographic market area is defined as that region which accounts for approximately 75 percent of overall contracting and procurement spending by a given state or local government. Contractors and vendors with locations in the Commonwealth of Massachusetts account for the large majority of DCAMM contracting expenditures during the study period.
Table 2.4. Distribution of Contracting Dollars by Geographic Location
LOCATION CONSTRUCTION (%)
DESIGN (%)
TOTAL (%)
Dollars Awarded Inside DCAMM Market Area 80.5 92.0 81.7
Outside DCAMM Market Area 19.5 8.0 18.3
Dollars Paid
Inside DCAMM Market Area 80.7 92.0 81.8
Outside DCAMM Market Area 19.3 8.0 18.2
Source: See Table 2.1.
As shown in Table 2.4, the overall share of expenditures inside the DCAMM market area is 81.7 percent of dollars awarded and 81.8 percent of dollars paid. The share in Construction is 80.5 percent for dollars awarded and 80.7 percent for dollars paid. For Design, the share is 92.0 percent for dollars awarded and 92.0 percent for dollars paid. For purposes of this Study, therefore, we define the relevant geographic market area to be the Commonwealth of Massachusetts.

Defining the Relevant Markets
NERA Economic Consulting
30
Table 2.5 shows the geographic distribution of contract and procurement dollars across all procurement categories within DCAMM’s market area.
Table 2.5. Distribution of DCAMM Contract Award Dollars by State and County, Inside the Market Area
STATE COUNTY AMOUNT ($) PERCENT CUMULATIVE
PERCENT
MA MIDDLESEX 728,997,130 28.53 28.53
MA SUFFOLK 355,390,715 13.91 42.44
MA WORCESTER 344,316,712 13.48 55.91
MA NORFOLK 326,119,654 12.76 68.68
MA HAMPDEN 247,831,136 9.70 78.38
MA ESSEX 142,574,872 5.58 83.96
MA BRISTOL 134,399,894 5.26 89.22
MA PLYMOUTH 112,367,557 4.40 93.61
MA BERKSHIRE 89,539,507 3.50 97.12
MA HAMPSHIRE 56,502,487 2.21 99.33
MA BARNSTABLE 15,553,488 0.61 99.94
MA FRANKLIN 1,591,121 0.06 100.00
MA DUKES 22,673 0.00 100.00
Source: See Table 2.1.
Outside the market area, counties with a significant amount of spending activity (defined as geographies that accounted for more than 1.0 percent of total spending among three or more firms) included, in descending order of importance:
CONSTRUCTION DESIGN Providence, RI New York, NY Quebec Province, Canada Hartford, CT Rockingham, NH Chittenden, VT Hartford, CT Philadelphia, PA New Haven, CT Essex, NJ Baltimore City, MD Morris, NJ Kent, RI Hillsborough, NH Montgomery, PA Ottawa, MI Merrimack, NH

Defining the Relevant Markets
NERA Economic Consulting
31
C. Product Market Definition for Contracting and Procurement
Using the major procurement categories for each prime contract and the primary NAICS codes assigned by NERA to each prime contractor and subcontractor in the Master Contract/ Subcontract Database, we identified the most important Industry Groups within each contracting and procurement category, as measured by total dollars awarded. The relevant NAICS codes and their associated dollar weights appear below in Tables 2.6 and 2.7 for Construction and Design, respectively.
Each Industry Group (four-digit NAICS) identified in Tables 2.6 and 2.7 consists of several more detailed Industries (five- and six-digit NAICS) and, as well, is part of a more aggregated Industry Sub-sector (three-digit NAICS). Overall, DCAMM contracting awards occur in 57 NAICS Industry Sub-sectors, 138 NAICS Industry Groups and 273 NAICS Industries. In Construction, contract spending occurs across 57 NAICS Industry Sub-sectors, 137 NAICS Industry Groups and 268 NAICS Industries. In Design, spending occurs across 23 NAICS Industry Sub-sectors, 41 NAICS Industry Groups and 64 NAICS Industries.
Many industries are part of DCAMM’s contracting activities. However, Tables 2.6 and 2.7 demonstrate that actual contracting and subcontracting opportunities are not distributed evenly among these industries. The distribution of contract expenditures is, in fact, highly skewed. In Construction, we see from Table 2.6 that just five Industry Groups alone (NAICS 2382, 2381, 2362, 2389, and 2383) account for over three-fourths of all award dollars, and just 11 Industry Groups account for over 90 percent, with the remainder distributed among another 126 additional Industry Groups.
Table 2.6. Distribution of Contract and Subcontract Dollars Awarded by Industry Group: Construction
NAICS Industry Group
NAICS Description Percentage Cumulative Percentage
2382 Building Equipment Contractors 29.75 29.75
2381 Foundation, Structure, and Building Exterior Contractors 17.42 47.17
2362 Nonresidential Building Construction 14.53 61.70
2389 Other Specialty Trade Contractors 8.10 69.80
2383 Building Finishing Contractors 7.77 77.57
5413 Architectural, Engineering, and Related Services 4.68 82.25
3323 Architectural and Structural Metals Manufacturing 4.00 86.25
2373 Highway, Street, and Bridge Construction 1.39 87.64
2211 Electric Power Generation, Transmission and Distribution 1.04 88.68
5629 Remediation and Other Waste Management Services 0.92 89.60
4234 Professional and Commercial Equipment and Supplies Merchant Wholesalers 0.91 90.50
5617 Services to Buildings and Dwellings 0.72 91.23

Defining the Relevant Markets
NERA Economic Consulting
32
NAICS Industry Group
NAICS Description Percentage Cumulative Percentage
4238 Machinery, Equipment, and Supplies Merchant Wholesalers 0.72 91.95
3219 Other Wood Product Manufacturing 0.68 92.63
5416 Management, Scientific, and Technical Consulting Services 0.63 93.26
4233 Lumber and Other Construction Materials Merchant Wholesalers 0.59 93.85
3273 Cement and Concrete Product Manufacturing 0.58 94.43
4237 Hardware, and Plumbing and Heating Equipment and Supplies Merchant Wholesalers 0.49 94.92
4235 Metal and Mineral (except Petroleum) Merchant Wholesalers 0.48 95.40
3372 Office Furniture (including Fixtures) Manufacturing 0.47 95.87
3371 Household and Institutional Furniture and Kitchen Cabinet Manufacturing 0.36 96.23
3336 Engine, Turbine, and Power Transmission Equipment Manufacturing 0.32 96.55
4422 Home Furnishings Stores 0.30 96.85
4236 Household Appliances and Electrical and Electronic Goods Merchant Wholesalers 0.27 97.12
2371 Utility System Construction 0.24 97.36
4239 Miscellaneous Durable Goods Merchant Wholesalers 0.22 97.58
3339 Other General Purpose Machinery Manufacturing 0.21 97.79
4232 Furniture and Home Furnishing Merchant Wholesalers 0.20 97.99
5324 Commercial and Industrial Machinery and Equipment Rental and Leasing 0.20 98.19
8114 Personal and Household Goods Repair and Maintenance 0.17 98.36
3399 Other Miscellaneous Manufacturing 0.13 98.49
3342 Communications Equipment Manufacturing 0.13 98.62
5112 Software Publishers 0.10 98.72
5616 Investigation and Security Services 0.10 98.82
3334 Ventilation, Heating, Air-Conditioning, and Commercial Refrigeration Equipment Manufacturing 0.09 98.91
4842 Specialized Freight Trucking 0.08 98.99
5241 Insurance Carriers 0.08 99.07
Balance of industries (100 industry groups) 0.73 100.00
TOTAL - $2,807,806,798
Source: See Table 2.1.

Defining the Relevant Markets
NERA Economic Consulting
33
In Design (Table 2.7), there is an even more concentrated pattern—one Industry Group alone (NAICS 5413) accounts for over 90 percent of all award dollars and just six Industry Groups account for over 99 percent, with the balance distributed among another 35 Industry Groups.
Table 2.7. Distribution of Contract and Subcontract Dollars Awarded by Industry Group: Design
NAICS Industry Group
NAICS Description Percentage Cumulative Percentage
5413 Architectural, Engineering, and Related Services 93.35 93.35
5416 Management, Scientific, and Technical Consulting Services 4.32 97.67
5619 Other Support Services 0.46 98.14
5419 Other Professional, Scientific, and Technical Services 0.39 98.52
5415 Computer Systems Design and Related Services 0.35 98.88
5112 Software Publishers 0.30 99.18
Balance of industries (35 industry groups) 0.82 100.00
TOTAL - $320,817,309
Source: See Table 2.1.
The resulting percentage weights from these NAICS Sub-sectors, Groups, and Industries are used below in Chapter III to calculate average M/WBE availability figures for Construction and Design.34
34 After re-normalizing the percentage weights to sum to 100.

Defining the Relevant Markets
NERA Economic Consulting
34
This page intentionally left blank.

M/WBE Availability in DCAMM’s Market Area
NERA Economic Consulting
35
III. M/WBE Availability in DCAMM’s Market Area
A. Introduction
Estimates of M/WBE availability are an important element of DCAMM’s disparity study since they provide benchmarks for assessing the effectiveness of its efforts to encourage M/WBE participation in its contracting and procurement. Furthermore, they provide a means by which to establish overall goals as well as contract-level goals for M/WBE participation that are tailored to its relevant market area.
Many approaches to estimating availability suffer from internal inconsistency since the data employed to construct the availability numerator (i.e., the total number of M/WBE establishments in the market area) are measured differently than the data employed to construct the availability denominator (i.e., the total number of establishments in the market area). For example, the numerator might be drawn from an agency’s internal list of certified M/WBEs while the denominator might be drawn from Census data. Since the methods used to identify and certify firms as M/WBEs are different from the methods used by the Census Bureau to count business establishments, such approaches inevitably compare “apples to oranges.”
For this Study, we measure availability using an approach that ensures an “apples to apples” comparison between the availability numerator and denominator. This “Custom Census” method was pioneered by NERA and has been favorably reviewed by each court that has examined it to date. The Tenth Circuit found the custom census approach to be “a more sophisticated method to calculate availability than the earlier studies [by the other consultant in this case].”35 Likewise, this method was successful in the defense of the DBE programs for Minnesota DOT36 and Illinois DOT,37 the M/WBE construction program for the City of Chicago,38 and, most recently, in the successful defense of a DBE program challenge to U.S. DOT, the Illinois DOT, and the Illinois State Toll Highway Authority.39
In addition to its favorable reception in the courts, when properly executed, the Custom Census method is superior to other approaches for at least three reasons. First, as already mentioned, it provides an internally consistent and rigorous “apples to apples” comparison between establishments in the availability numerator and those in the denominator. Second, it comports with the remedial nature of most M/WBE policies by measuring overall M/WBE availability in the relevant market area as opposed to only those businesses currently certified by an agency.40 35 Concrete Works of Colorado, Inc. v. City and County of Denver, 321 F.3d 950, 966 (10th Cir. 2003) (“Concrete
Works IV”), cert. denied, 540 U.S. 1027 (2003). 36 Sherbrooke Turf, Inc. v. Minnesota Department of Transportation, 345 F.3d 964 (8th Cir. 2003), cert. denied,
541 U.S. 1041 (2004). 37 Northern Contracting, Inc. v. Illinois Department of Transportation, 473 F.3d 715 (7th Cir. 2007). 38 Builders Ass’n of Greater Chicago v. City of Chicago, 298 F. Supp.2d 725 (N.D. Ill. 2003). 39 Midwest Fence Corp. v. United States Department of Transportation, et al., 84 F.Supp. 3d 705 (N.D. Ill. 2015)
aff’d, 830 F.3d 932 (7th Cir. 2016). 40 See Northern Contracting, 473 F.3d at 723 (“We agree with the district court that the remedial nature of the
federal scheme militates in favor of a method of DBE availability calculation that casts a broader net.”).

M/WBE Availability in DCAMM’s Market Area
NERA Economic Consulting
36
Third, a properly executed Custom Census is less likely to be tainted by the effects of past and present discrimination than other methods.41
The Custom Census method has seven steps. These are:
1. Create a database of representative and recent DCAMM contracts in Construction and Design;
2. Identify DCAMM’s relevant geographic market from this database;
3. Identify DCAMM’s relevant product market from this database;
4. Count all business establishments in the relevant market area;
5. Identify listed M/WBE establishments in the relevant market area;
6. Verify the ownership status of listed M/WBEs; and
7. Verify the ownership status of all other firms in the relevant market area.
Steps 1-3 were described above in Chapter II. Steps 4-7 are described in more detail below.
We conducted a parallel Custom Census to estimate availability of Portuguese Business Enterprises (“PBE”). The elements of this parallel custom census are presented side-by-side with the M/WBE results, below.
B. Identifying Business Establishments in the Relevant Markets
M/WBE availability (unweighted) is defined as the number of M/WBEs divided by the total number of business establishments in DCAMM’s contracting market area—what we will refer to as the Baseline Business Universe.42 Determining the total number of business establishments in the market area, however, is a less complex task than determining the number of minority- or women-owned establishments in those markets. The latter has three main parts: (1) identify all listed M/WBEs in the relevant market; (2) verify the ownership status of listed M/WBEs; and (3) estimate the number of unlisted M/WBEs in the relevant market. This section describes how these tasks were accomplished for DCAMM.
It is important to note that NERA’s availability analysis is free from variables tainted by discrimination. Our approach recognizes that discrimination may impact many of the variables that contribute to a firm’s success in obtaining work as a prime or a subcontractor. Factors such as firm size, time in business, qualifications, and experience are all adversely affected by discrimination if it is present in the market area. Despite the obvious relationship, some
41 See Section B.5., below, for further discussion of this point. 42 To yield a percentage, the resulting figure is multiplied by 100.

M/WBE Availability in DCAMM’s Market Area
NERA Economic Consulting
37
commentators argue that disparities should only be assessed between firms with similar “capacities.”43
However, some courts have properly refused to make the results of discrimination the benchmark for non-discrimination.44 They have acknowledged that M/WBEs may be smaller, newer, and otherwise less competitive than non-M/WBEs because of the very discrimination sought to be remedied by race-conscious contracting programs. Racial and gender differences in these “capacity” factors are the outcomes of discrimination and it is therefore inappropriate as a matter of economics and statistics to use them as “control” variables in a disparity study.45
1. Estimate the Total Number of Business Establishments in the Market
We used data supplied by Dun & Bradstreet to determine the total number of business establishments operating in the relevant geographic and product markets (these markets were discussed in the previous chapter). Dun & Bradstreet produces the most comprehensive publicly available database of business establishments in the U.S. This database contains over 17 million domestic records and is updated continuously. Each record in Dun & Bradstreet represents a business establishment and includes the business name, address, telephone number, NAICS code, SIC code, business type, DUNS Number (a unique number assigned to each establishment by Dun & Bradstreet), and other descriptive information. Dun & Bradstreet gathers and verifies information from many different sources. These sources include, among others, annual management interviews, payment experiences, bank account information, filings for suits, liens, judgments and bankruptcies, news items, the U.S. Postal Service, utility and telephone service, business registrations, corporate charters, Uniform Commercial Code filings, and records of the Small Business Administration and other governmental agencies.
We used the Dun & Bradstreet database to identify the total number of businesses in each NAICS code that was identified as part of DCAMM’s product market. Table 3.1 shows the number of businesses identified in each NAICS Industry Group within the Construction category, along with the associated industry weight according to dollars awarded. Comparable
43 See, e.g., La Noue (2006). Most of La Noue’s expert report in Gross Seed Company v. Nebraska Department of
Roads, No. 02-3016 (D. Neb. 2002), including his views on “capacity,” was rejected by the court on the basis that it was legal opinion and not expert analysis. According to the court, “[legal analysis] is an issue solely for the Court and not for the presentation of expert testimony….” (see Defendants-Appellees’ Brief, Gross Seed Company v. Nebraska Department of Roads, on appeal to the Eighth Circuit Court of Appeals).
44 North Shore Concrete and Assoc., Inc. v. City of New York, No. 94-CV-4017, 1998 U.S. Dist. LEXIS 6785 273027 at *24 (E.D.N.Y. April 12, 1998); Concrete Works IV, 321 F.3d at 981, 983 (“MWBE construction firms are generally smaller and less experienced because of discrimination.… Additionally, we do not read Croson to require disparity studies that measure whether construction firms are able to perform a particular contract.” (emphasis in the originals)). See also Northern Contracting, at 723 (“We agree with the district court that the remedial nature of the federal scheme militates in favor of a method of DBE availability calculation that casts a broader net [than a simple count of the number of registered and prequalified DBEs].”); and Midwest Fence, 84 F.Supp. at 733-734.
45 Concrete Works IV, 321 F.3d at 981 (emphasis in the original). See also Wainwright and Holt (2010), Appendix B “Understanding Capacity,” and Section B.5, below.

M/WBE Availability in DCAMM’s Market Area
NERA Economic Consulting
38
data for Design is presented in Table 3.2. 46 Tables 3.3 and 3.4 provide parallel results for the PBE Custom Census.47
Although numerous industries are represented in DCAMM Baseline Business Universe, contracting and subcontracting opportunities are not distributed evenly among them. Indeed, the distribution of contract expenditures is quite skewed, as shown above in Chapter II.
Table 3.1. Construction—Number of Establishments and Industry Weight, by NAICS Code, M/WBE Custom Census
NAICS Industry Group
NAICS Description Number of Estab-lishments
Industry Weight
Cumulative Industry Weight
2382 Building Equipment Contractors 9,155 30.05 30.05 2381 Foundation, Structure, and Building Exterior Contractors 3,951 17.58 47.63 2362 Nonresidential Building Construction 1,087 14.68 62.31 2389 Other Specialty Trade Contractors 4,126 8.18 70.49 2383 Building Finishing Contractors 4,644 7.85 78.33 5413 Architectural, Engineering, and Related Services 7,048 4.68 83.01 3323 Architectural and Structural Metals Manufacturing 200 4.02 87.04 2373 Highway, Street, and Bridge Construction 623 1.41 88.44 2211 Electric Power Generation, Transmission and Distribution 310 1.03 89.47 5629 Remediation and Other Waste Management Services 103 0.92 90.40
4234 Professional and Commercial Equipment and Supplies Merchant Wholesalers 522 0.88 91.27
4238 Machinery, Equipment, and Supplies Merchant Wholesalers 1,733 0.73 92.00
5617 Services to Buildings and Dwellings 4,349 0.73 92.73 3219 Other Wood Product Manufacturing 346 0.65 93.38
5416 Management, Scientific, and Technical Consulting Services 1,660 0.59 93.97
4233 Lumber and Other Construction Materials Merchant Wholesalers 783 0.57 94.54
3273 Cement and Concrete Product Manufacturing 101 0.57 95.10
4237 Hardware, and Plumbing and Heating Equipment and Supplies Merchant Wholesalers 592 0.49 95.60
4235 Metal and Mineral (except Petroleum) Merchant Wholesalers 234 0.49 96.08
3372 Office Furniture (including Fixtures) Manufacturing 44 0.44 96.52
3336 Engine, Turbine, and Power Transmission Equipment Manufacturing 25 0.32 96.84
3371 Household and Institutional Furniture and Kitchen Cabinet Manufacturing 286 0.32 97.16
46 Analogous sets of weights using paid dollars, were also produced. They are similar and not published here due to
space considerations. 47 If PBE firms, like M/WBE firms, are presumed under a contracting preference program to be socially and
economically disadvantaged, certain minor modifications must be made to allow for an accurate assessment of that presumption. Specifically, from this point forward, non-Portuguese minority-owned firms are excluded from the all PBE vs. non-PBE analyses. Similarly, nonminority male-owned Portuguese firms are excluded from all M/WBE vs. non-M/WBE analyses. This adjustment explains why the count of total establishments differs slightly between Tables 3.1 and 3.3 and between Tables 3.2 and 3.4.

M/WBE Availability in DCAMM’s Market Area
NERA Economic Consulting
39
NAICS Industry Group
NAICS Description Number of Estab-lishments
Industry Weight
Cumulative Industry Weight
4422 Home Furnishings Stores 846 0.29 97.46
4236 Household Appliances and Electrical and Electronic Goods Merchant Wholesalers 494 0.26 97.72
2371 Utility System Construction 300 0.25 97.96 4239 Miscellaneous Durable Goods Merchant Wholesalers 1,056 0.22 98.18
5324 Commercial and Industrial Machinery and Equipment Rental and Leasing 661 0.20 98.38
4232 Furniture and Home Furnishing Merchant Wholesalers 295 0.20 98.58 3339 Other General Purpose Machinery Manufacturing 6 0.19 98.77 8114 Personal and Household Goods Repair and Maintenance 705 0.17 98.94 3399 Other Miscellaneous Manufacturing 376 0.13 99.06 3342 Communications Equipment Manufacturing 96 0.13 99.19 5112 Software Publishers 988 0.10 99.29 5616 Investigation and Security Services 282 0.09 99.38
3334 Ventilation, Heating, Air-Conditioning, and Commercial Refrigeration Equipment Manufacturing 54 0.08 99.46
5241 Insurance Carriers 253 0.08 99.55 3325 Hardware Manufacturing 42 0.08 99.63
3333 Commercial and Service Industry Machinery Manufacturing 123 0.07 99.70
4842 Specialized Freight Trucking 177 0.06 99.75 3391 Medical Equipment and Supplies Manufacturing 308 0.06 99.81 2379 Other Heavy and Civil Engineering Construction 162 0.06 99.86 5415 Computer Systems Design and Related Services 2,243 0.05 99.92 5619 Other Support Services 33,972 0.05 99.97 5622 Waste Treatment and Disposal 149 0.03 100.00
Source: Dun & Bradstreet; M/WBE business directory information compiled by NERA.
Notes: The dollar-based industry weight and cumulative industry weight are expressed as percentages.
Table 3.2. Design—Number of Establishments and Industry Weight, by NAICS Code, M/WBE Custom Census
NAICS Industry Group
NAICS Description Number of Estab-lishments
Industry Weight
Cumulative Industry Weight
5413 Architectural, Engineering, and Related Services 7,313 94.17 94.17
5416 Management, Scientific, and Technical Consulting Services 14,381 4.29 98.46
5619 Other Support Services 33,972 0.41 98.87 5419 Other Professional, Scientific, and Technical Services 5,362 0.39 99.26 5112 Software Publishers 988 0.30 99.56 5415 Computer Systems Design and Related Services 2,243 0.23 99.79 5414 Specialized Design Services 1,087 0.21 100.00
Source and Notes: See Table 3.1.

M/WBE Availability in DCAMM’s Market Area
NERA Economic Consulting
40
Table 3.3. Construction—Number of Establishments and Industry Weight, by NAICS Code, PBE Custom Census
NAICS Industry Group
NAICS Description Number of Estab-lishments
Industry Weight
Cumulative Industry Weight
2382 Building Equipment Contractors 9,126 30.05 30.05 2381 Foundation, Structure, and Building Exterior Contractors 3,942 17.58 47.63 2362 Nonresidential Building Construction 1,085 14.68 62.31 2389 Other Specialty Trade Contractors 4,121 8.18 70.49 2383 Building Finishing Contractors 4,628 7.85 78.33 5413 Architectural, Engineering, and Related Services 7,009 4.68 83.01 3323 Architectural and Structural Metals Manufacturing 200 4.02 87.04 2373 Highway, Street, and Bridge Construction 622 1.41 88.44 2211 Electric Power Generation, Transmission and Distribution 310 1.03 89.47 5629 Remediation and Other Waste Management Services 103 0.92 90.40
4234 Professional and Commercial Equipment and Supplies Merchant Wholesalers 521 0.88 91.27
4238 Machinery, Equipment, and Supplies Merchant Wholesalers 1,732 0.73 92.00
5617 Services to Buildings and Dwellings 4,337 0.73 92.73 3219 Other Wood Product Manufacturing 346 0.65 93.38
5416 Management, Scientific, and Technical Consulting Services 1,658 0.59 93.97
4233 Lumber and Other Construction Materials Merchant Wholesalers 783 0.57 94.54
3273 Cement and Concrete Product Manufacturing 101 0.57 95.10
4237 Hardware, and Plumbing and Heating Equipment and Supplies Merchant Wholesalers 592 0.49 95.60
4235 Metal and Mineral (except Petroleum) Merchant Wholesalers 234 0.49 96.08
3372 Office Furniture (including Fixtures) Manufacturing 44 0.44 96.52
3336 Engine, Turbine, and Power Transmission Equipment Manufacturing 25 0.32 96.84
3371 Household and Institutional Furniture and Kitchen Cabinet Manufacturing 286 0.32 97.16
4422 Home Furnishings Stores 845 0.29 97.46
4236 Household Appliances and Electrical and Electronic Goods Merchant Wholesalers 494 0.26 97.72
2371 Utility System Construction 290 0.25 97.96 4239 Miscellaneous Durable Goods Merchant Wholesalers 1,055 0.22 98.18
5324 Commercial and Industrial Machinery and Equipment Rental and Leasing 660 0.20 98.38
4232 Furniture and Home Furnishing Merchant Wholesalers 295 0.20 98.58 3339 Other General Purpose Machinery Manufacturing 6 0.19 98.77 8114 Personal and Household Goods Repair and Maintenance 702 0.17 98.94 3399 Other Miscellaneous Manufacturing 373 0.13 99.06 3342 Communications Equipment Manufacturing 96 0.13 99.19 5112 Software Publishers 988 0.10 99.29 5616 Investigation and Security Services 282 0.09 99.38
3334 Ventilation, Heating, Air-Conditioning, and Commercial Refrigeration Equipment Manufacturing 54 0.08 99.46
5241 Insurance Carriers 252 0.08 99.55
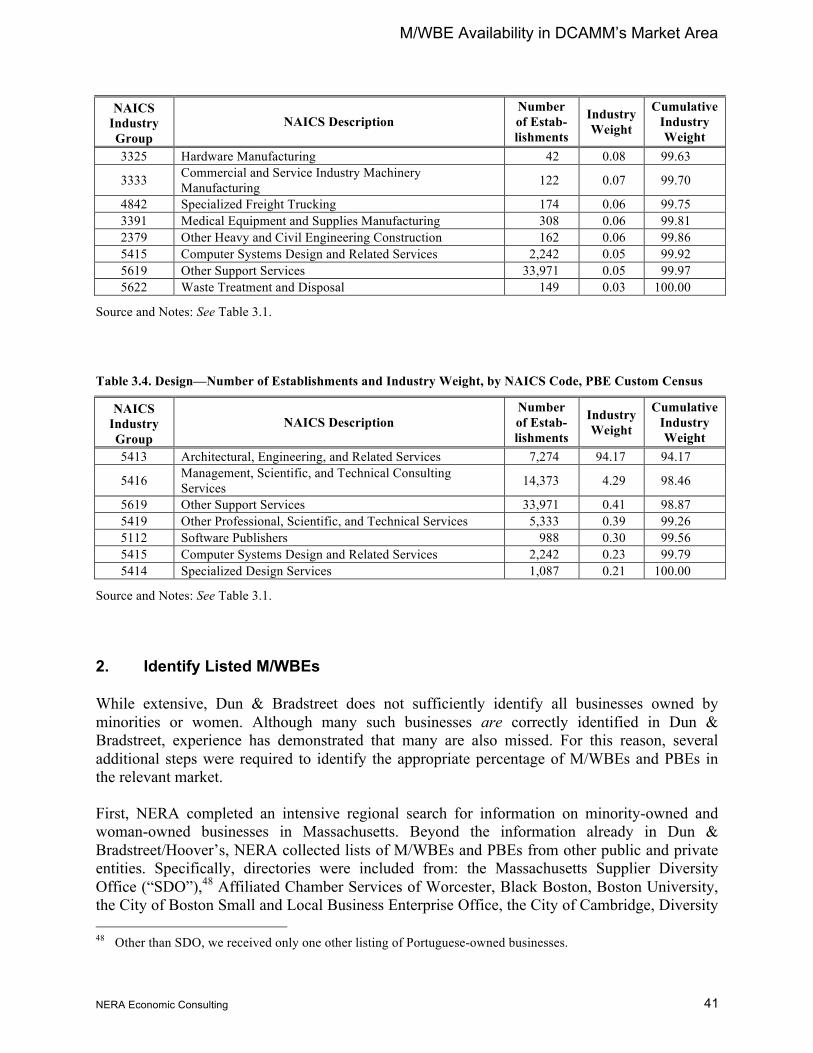
M/WBE Availability in DCAMM’s Market Area
NERA Economic Consulting
41
NAICS Industry Group
NAICS Description Number of Estab-lishments
Industry Weight
Cumulative Industry Weight
3325 Hardware Manufacturing 42 0.08 99.63
3333 Commercial and Service Industry Machinery Manufacturing 122 0.07 99.70
4842 Specialized Freight Trucking 174 0.06 99.75 3391 Medical Equipment and Supplies Manufacturing 308 0.06 99.81 2379 Other Heavy and Civil Engineering Construction 162 0.06 99.86 5415 Computer Systems Design and Related Services 2,242 0.05 99.92 5619 Other Support Services 33,971 0.05 99.97 5622 Waste Treatment and Disposal 149 0.03 100.00
Source and Notes: See Table 3.1.
Table 3.4. Design—Number of Establishments and Industry Weight, by NAICS Code, PBE Custom Census
NAICS Industry Group
NAICS Description Number of Estab-lishments
Industry Weight
Cumulative Industry Weight
5413 Architectural, Engineering, and Related Services 7,274 94.17 94.17
5416 Management, Scientific, and Technical Consulting Services 14,373 4.29 98.46
5619 Other Support Services 33,971 0.41 98.87 5419 Other Professional, Scientific, and Technical Services 5,333 0.39 99.26 5112 Software Publishers 988 0.30 99.56 5415 Computer Systems Design and Related Services 2,242 0.23 99.79 5414 Specialized Design Services 1,087 0.21 100.00
Source and Notes: See Table 3.1.
2. Identify Listed M/WBEs
While extensive, Dun & Bradstreet does not sufficiently identify all businesses owned by minorities or women. Although many such businesses are correctly identified in Dun & Bradstreet, experience has demonstrated that many are also missed. For this reason, several additional steps were required to identify the appropriate percentage of M/WBEs and PBEs in the relevant market.
First, NERA completed an intensive regional search for information on minority-owned and woman-owned businesses in Massachusetts. Beyond the information already in Dun & Bradstreet/Hoover’s, NERA collected lists of M/WBEs and PBEs from other public and private entities. Specifically, directories were included from: the Massachusetts Supplier Diversity Office (“SDO”),48 Affiliated Chamber Services of Worcester, Black Boston, Boston University, the City of Boston Small and Local Business Enterprise Office, the City of Cambridge, Diversity 48 Other than SDO, we received only one other listing of Portuguese-owned businesses.

M/WBE Availability in DCAMM’s Market Area
NERA Economic Consulting
42
Information Resources, DiversityBusiness.com, Harvard University, the U.S. Minority Business Development Agency, and the U.S. Small Business Administration.49
Tables 3.5 and 3.6 show the listed M/WBEs in Construction and Design, respectively. Tables 3.7 and 3.8 show the listed PBEs in Construction and Design, respectively. If the listed M/WBEs (PBEs) identified in Tables 3.5 and 3.6 (Tables 3.7 and 3.8) are in fact all M/WBEs (PBEs) and are the only M/WBEs (PBEs) among all of the establishments in the relevant market identified in Tables 3.1 and 3.2 (Tables 3.3 and 3.4), then an estimate of “listed” M/WBE (PBE) availability is simply the number of listed M/WBEs (PBEs) divided by the total number of establishments in the relevant market. However, as we shall see below, neither of these two conditions holds true in practice and this is therefore not an appropriate method for measuring M/WBE (PBE) availability.
There are two reasons for this. First, it is likely that some proportion of the M/WBEs (PBEs) listed in the tables is not actually minority-owned or women-owned (Portuguese-owned). Second, it is likely that there are additional “unlisted” M/WBEs (PBEs) among all of the establishments included in Tables 3.1 and 3.2 (Tables 3.3 and 3.4). Such businesses do not appear in any of the directories we gathered and are therefore not included as “listed” M/WBEs (PBEs) in these tables. Additional steps are required to test these two conditions and to arrive at a more accurate representation of M/WBE (PBE) availability within the Baseline Business Universe. We discuss these steps below in Sections 3.a and 3.b.
Table 3.5. Construction—Number of Listed M/WBE Establishments and Industry Weight (Dollars Awarded), by NAICS Code, M/WBE Custom Census
NAICS Industry Group
NAICS Description Number of
Listed M/WBEs
Industry Weight
Cumulative Industry Weight
2382 Building Equipment Contractors 442 30.05 30.05
2381 Foundation, Structure, and Building Exterior Contractors 272 17.58 47.63
2362 Nonresidential Building Construction 123 14.68 62.31 2389 Other Specialty Trade Contractors 301 8.18 70.49 2383 Building Finishing Contractors 462 7.85 78.33 5413 Architectural, Engineering, and Related Services 795 4.68 83.01 3323 Architectural and Structural Metals Manufacturing 32 4.02 87.04 2373 Highway, Street, and Bridge Construction 67 1.41 88.44
2211 Electric Power Generation, Transmission and Distribution 17 1.03 89.47
5629 Remediation and Other Waste Management Services 24 0.92 90.40
4234 Professional and Commercial Equipment and Supplies Merchant Wholesalers 41 0.88 91.27
49 We also obtained information from certain entities that was duplicative of either Dun & Bradstreet or one or
more of the other sources listed above. These entities are listed below in Appendix C. We were unable to obtain relevant lists or directories from a number of entities. The reasons for this include: (1) the entity did not have a list or the entity’s list did not include race and sex information; (2) the entity was unresponsive to repeated attempts at contacts; or (3) the entity simply declined to provide us the list. These entities, as well, are listed in Appendix C.

M/WBE Availability in DCAMM’s Market Area
NERA Economic Consulting
43
NAICS Industry Group
NAICS Description Number of
Listed M/WBEs
Industry Weight
Cumulative Industry Weight
4238 Machinery, Equipment, and Supplies Merchant Wholesalers 150 0.73 92.00
5617 Services to Buildings and Dwellings 475 0.73 92.73 3219 Other Wood Product Manufacturing 16 0.65 93.38
5416 Management, Scientific, and Technical Consulting Services 287 0.59 93.97
4233 Lumber and Other Construction Materials Merchant Wholesalers 64 0.57 94.54
3273 Cement and Concrete Product Manufacturing 7 0.57 95.10
4237 Hardware, and Plumbing and Heating Equipment and Supplies Merchant Wholesalers 51 0.49 95.60
4235 Metal and Mineral (except Petroleum) Merchant Wholesalers 24 0.49 96.08
3372 Office Furniture (including Fixtures) Manufacturing 5 0.44 96.52
3336 Engine, Turbine, and Power Transmission Equipment Manufacturing 5 0.32 96.84
3371 Household and Institutional Furniture and Kitchen Cabinet Manufacturing 22 0.32 97.16
4422 Home Furnishings Stores 119 0.29 97.46
4236 Household Appliances and Electrical and Electronic Goods Merchant Wholesalers 51 0.26 97.72
2371 Utility System Construction 34 0.25 97.96 4239 Miscellaneous Durable Goods Merchant Wholesalers 116 0.22 98.18
5324 Commercial and Industrial Machinery and Equipment Rental and Leasing 52 0.20 98.38
4232 Furniture and Home Furnishing Merchant Wholesalers 37 0.20 98.58 3339 Other General Purpose Machinery Manufacturing 2 0.19 98.77
8114 Personal and Household Goods Repair and Maintenance 136 0.17 98.94
3399 Other Miscellaneous Manufacturing 60 0.13 99.06 3342 Communications Equipment Manufacturing 13 0.13 99.19 5112 Software Publishers 113 0.10 99.29 5616 Investigation and Security Services 16 0.09 99.38
3334 Ventilation, Heating, Air-Conditioning, and Commercial Refrigeration Equipment Manufacturing 3 0.08 99.46
5241 Insurance Carriers 9 0.08 99.55 3325 Hardware Manufacturing 5 0.08 99.63
3333 Commercial and Service Industry Machinery Manufacturing 10 0.07 99.70
4842 Specialized Freight Trucking 24 0.06 99.75 3391 Medical Equipment and Supplies Manufacturing 28 0.06 99.81 2379 Other Heavy and Civil Engineering Construction 18 0.06 99.86 5415 Computer Systems Design and Related Services 365 0.05 99.92 5619 Other Support Services 1,909 0.05 99.97 5622 Waste Treatment and Disposal 10 0.03 100.00
Source and Notes: See Table 3.1.

M/WBE Availability in DCAMM’s Market Area
NERA Economic Consulting
44
Table 3.6. Design—Number of Listed M/WBE Establishments and Industry Weight (Dollars Awarded), by NAICS Code, M/WBE Custom Census
NAICS Industry Group
NAICS Description Number of
Listed M/WBEs
Industry Weight
Cumulative Industry Weight
5413 Architectural, Engineering, and Related Services 814 94.17 94.17
5416 Management, Scientific, and Technical Consulting Services 1,782 4.29 98.46
5619 Other Support Services 1,909 0.41 98.87 5419 Other Professional, Scientific, and Technical Services 562 0.39 99.26 5112 Software Publishers 113 0.30 99.56 5415 Computer Systems Design and Related Services 365 0.23 99.79 5414 Specialized Design Services 341 0.21 100.00
Source and Notes: See Table 3.1. Table 3.7. Construction—Number of Listed PBE Establishments and Industry Weight (Dollars Awarded), by NAICS Code, PBE Custom Census
NAICS Industry Group
NAICS Description Number of
Listed PBEs
Industry Weight
Cumulative Industry Weight
2382 Building Equipment Contractors 40 30.05 30.05
2381 Foundation, Structure, and Building Exterior Contractors 33 17.58 47.63
2362 Nonresidential Building Construction 4 14.68 62.31 2389 Other Specialty Trade Contractors 37 8.18 70.49 2383 Building Finishing Contractors 79 7.85 78.33 5413 Architectural, Engineering, and Related Services 26 4.68 83.01 3323 Architectural and Structural Metals Manufacturing 0 4.02 87.04 2373 Highway, Street, and Bridge Construction 4 1.41 88.44
2211 Electric Power Generation, Transmission and Distribution 0 1.03 89.47
5629 Remediation and Other Waste Management Services 0 0.92 90.40
4234 Professional and Commercial Equipment and Supplies Merchant Wholesalers 1 0.88 91.27
4238 Machinery, Equipment, and Supplies Merchant Wholesalers 5 0.73 92.00
5617 Services to Buildings and Dwellings 61 0.73 92.73 3219 Other Wood Product Manufacturing 0 0.65 93.38
5416 Management, Scientific, and Technical Consulting Services 1 0.59 93.97
4233 Lumber and Other Construction Materials Merchant Wholesalers 3 0.57 94.54
3273 Cement and Concrete Product Manufacturing 0 0.57 95.10
4237 Hardware, and Plumbing and Heating Equipment and Supplies Merchant Wholesalers 3 0.49 95.60
4235 Metal and Mineral (except Petroleum) Merchant Wholesalers 1 0.49 96.08
3372 Office Furniture (including Fixtures) Manufacturing 0 0.44 96.52
3336 Engine, Turbine, and Power Transmission Equipment Manufacturing 0 0.32 96.84

M/WBE Availability in DCAMM’s Market Area
NERA Economic Consulting
45
NAICS Industry Group
NAICS Description Number of
Listed PBEs
Industry Weight
Cumulative Industry Weight
3371 Household and Institutional Furniture and Kitchen Cabinet Manufacturing 1 0.32 97.16
4422 Home Furnishings Stores 8 0.29 97.46
4236 Household Appliances and Electrical and Electronic Goods Merchant Wholesalers 0 0.26 97.72
2371 Utility System Construction 9 0.25 97.96 4239 Miscellaneous Durable Goods Merchant Wholesalers 1 0.22 98.18
5324 Commercial and Industrial Machinery and Equipment Rental and Leasing 0 0.20 98.38
4232 Furniture and Home Furnishing Merchant Wholesalers 1 0.20 98.58 3339 Other General Purpose Machinery Manufacturing 0 0.19 98.77
8114 Personal and Household Goods Repair and Maintenance 10 0.17 98.94
3399 Other Miscellaneous Manufacturing 4 0.13 99.06 3342 Communications Equipment Manufacturing 0 0.13 99.19 5112 Software Publishers 0 0.10 99.29 5616 Investigation and Security Services 0 0.09 99.38
3334 Ventilation, Heating, Air-Conditioning, and Commercial Refrigeration Equipment Manufacturing 0 0.08 99.46
5241 Insurance Carriers 1 0.08 99.55 3325 Hardware Manufacturing 1 0.08 99.63
3333 Commercial and Service Industry Machinery Manufacturing 1 0.07 99.70
4842 Specialized Freight Trucking 2 0.06 99.75 3391 Medical Equipment and Supplies Manufacturing 0 0.06 99.81 2379 Other Heavy and Civil Engineering Construction 0 0.06 99.86 5415 Computer Systems Design and Related Services 11 0.05 99.92 5619 Other Support Services 24 0.05 99.97 5622 Waste Treatment and Disposal 0 0.03 100.00
Source and Notes: See Table 3.1.
Table 3.8. Design—Number of Listed PBE Establishments and Industry Weight (Dollars Awarded), by NAICS Code, PBE Custom Census
NAICS Industry Group
NAICS Description Number of
Listed PBEs
Industry Weight
Cumulative Industry Weight
5413 Architectural, Engineering, and Related Services 26 94.17 94.17 5416 Management, Scientific, and Technical Consulting
Services 39 4.29 98.46
5619 Other Support Services 24 0.41 98.87 5419 Other Professional, Scientific, and Technical Services 35 0.39 99.26 5112 Software Publishers 0 0.30 99.56 5415 Computer Systems Design and Related Services 11 0.23 99.79 5414 Specialized Design Services 8 0.21 100.00
Source and Notes: See Table 3.1.

M/WBE Availability in DCAMM’s Market Area
NERA Economic Consulting
46
3. Verify Listed M/WBEs
a. Introduction
It is likely that the race and gender (and PBE) classifications for businesses from Dun & Bradstreet and the M/WBE directories are not correct in all instances. Phenomena such as ownership changes, associate or mentor status, recording errors, or even misrepresentation, will lead to businesses being listed as M/WBEs in a particular directory even though they may not actually be owned by such entities. Other things equal, this type of error would cause our availability estimate to be biased upward from the actual availability number.
The second likelihood that must be addressed is that not all M/WBE (or PBE) businesses are necessarily listed—either in Dun & Bradstreet or in any of the other directories we collected. Such phenomena as geographic relocation, ownership changes, directory compilation errors, fear of stigmatization, and limitations in M/WBE (PBE) outreach, could all lead to such establishments being unlisted. Other things equal, this type of error would cause our availability estimate to be biased downward from the actual availability number.
In our experience, we have found that both types of bias are not uncommon. For this Study, we corrected for the effect of these biases using statistical sampling procedures. We surveyed by telephone a large, stratified random sample of more than 44,000 records drawn from the Baseline Business Universe and measured how often and how they were misclassified (or unclassified) by race and gender and Portuguese ancestry status.50
Strata were defined according to NAICS industries and listed M/WBE status.51 In the telephone survey, up to 10 attempts were made to reach each business and speak with an appropriate respondent. Attempts were scheduled for a mix of day and evening, weekdays and weekends, and appointments were scheduled for callbacks when necessary. Of the 44,500 establishments in our sample, 7,014 (15.8%) were putative M/WBEs (but not putative PBEs), 1,752 (3.9%) were putative PBEs, and 35,734 (80.3%) were unclassified by race or gender (and were not putative PBEs).52 Of these 44,500 establishments, however, 15,035 (33.8%) were excluded as “unable to contact.” Exclusions resulted from a variety of reasons including disconnected and wrong numbers, do not call requests, and establishments that were no longer in business.53 Of the remaining 29,465 establishments, 4,526 (15.4%) were putative M/WBEs, 1,143 (3.9%) were putative PBEs, and the remaining 23,796 establishments (80.8%) were unclassified by race or gender and were not putative PBEs. 50 A similar method, with respect to M/WBE establishments, was employed by the Federal Reserve Board to deal
with similar problems in designing and implementing the National Survey of Small Business Finances for 1993 and 1998. See Haggerty, C., K. Grigorian, R. Harter and J. D. Wolken (2000).
51 A total of 110 separate industry strata were created based on NAICS code. All strata were further split according to putative M/WBE and putative PBE status. Putative M/WBEs and PBEs were sampled at a higher rate than unclassified establishments.
52 By “putative,” we mean the race, gender and Portuguese ancestry status that we initially assigned to each firm based on the information provided by the SDO, Dun & Bradstreet, our master M/WBE directory, and other sources.
53 Putative M/WBEs were not more likely to be affected by this than putative non-M/WBEs.

M/WBE Availability in DCAMM’s Market Area
NERA Economic Consulting
47
The first part of the survey tested whether our sample of putative M/WBEs and PBEs was correctly classified by race, gender and Portuguese ancestry. The second part of the survey tested whether the unclassified establishments (that is, those putatively owned by nonminority, non-Portuguese males) could all be properly classified as non-M/WBEs and non-PBEs. Both elements of the survey are described in more detail below.
b. Survey of Putative M/WBEs and PBEs
We selected a stratified random sample of 7,014 putative M/WBEs and 1,752 putative PBEs to verify the race and gender and Portuguese ancestry status of their owner(s). Of these, 2,488 putative M/WBEs (35.5%) and 609 putative PBEs (34.8%) were excluded as “unable to contact.” Of the remaining 4,526 putative M/WBE establishments and 1,143 putative PBE establishments, we obtained complete interviews from 1,865 putative M/WBEs, for a response rate of 41.2 percent, and 283 putative PBEs, for a response rate of 24.8%.
Of the 1,865 putative M/WBE establishments interviewed, 813 (43.6%) were actually owned by nonminority males. Misclassification varied by putative race and gender, as shown in Table 3.9. Misclassification was highest among putative Native American-owned establishments, followed by putative Hispanic-owned establishments, putative African American-owned establishments, putative nonminority female-owned establishments, and finally putative Asian- or Pacific Islander-owned establishments.

M/WBE Availability in DCAMM’s Market Area
NERA Economic Consulting
48
Table 3.9. Putative M/WBE Survey—Amount of Misclassification, by Putative M/WBE Type
Putative Race/Gender Misclassification
(Percentage Nonminority Male)
Misclassification (Percentage Other
M/WBE Type)
Percentage Correctly Classified
Number of Businesses
Interviewed
African American (either gender) 38.00 15.00 47.00 100
Hispanic (either gender)
48.13 12.15 37.97 187
Asian/Pacific Islander (either gender) 25.49 13.73 60.78 204
Native American (either gender) 45.00 50.00 5.00 20
Nonminority Female 46.09 2.36 51.55 1,354
All M/WBE Types 43.59 5.95 50.46 1,865
Source: NERA telephone surveys. Notes: (1) Figures are rounded. Rounding was performed subsequent to any mathematical calculations. (2) Similar calculations, not shown here, were performed within each stratum.
Cape Verdeans are also included as a race/ethnicity category in this Study, in addition to the race/ethnicity categories of African American, Hispanic, Asian/Pacific Islander and Native American. However, it was not possible to putatively identify Cape Verdeans prior to conducting the telephone survey. Therefore, Cape Verdean status was estimated based on the proportion of all putative M/WBE firms surveyed that identified themselves as Cape Verdean. These results appear below in Table 3.10.
Table 3.10. Putative M/WBE Survey—Cape Verdeans, by Putative M/WBE Type
Putative Race/Gender Cape Verdean Males Cape Verdean Females Number of Businesses
Interviewed
African American (either gender) 1.00 0.00 100
Hispanic (either gender)
0.00 0.00 187
Asian/Pacific Islander (either gender) 1.47 0.00 204
Native American (either gender) 5.00 0.00 20
Nonminority Female 0.00 0.07 1,354
All M/WBE Types 0.21 0.00 1,865
Source and Notes: See Table 3.9.

M/WBE Availability in DCAMM’s Market Area
NERA Economic Consulting
49
We conducted a comparable analysis for firms that were identified prior to the telephone survey as putative PBEs. We did not have information prior to the survey on whether putative PBEs had ancestry from Portugal or from Brazil. Like Cape Verdeans, we derived these estimates directly from the telephone survey results. Tables 3.11 and 3.12, below, show the estimated ancestry distribution and race/ethnicity and gender distribution, respectively, for the putative PBEs in our sample.
Table 3.11. Putative PBE Survey—Estimated Portuguese Ancestry Distribution for Putative Portuguese-Owned Firms
Putative Race/Gender Putative Males (%)
Putative Females (%)
Putative Males and Females
(%)
Non-Portuguese Ancestry 51.38 63.33 52.65 Portuguese Ancestry from Portugal 24.51 30.00 25.09 Portuguese Ancestry from Brazil 24.11 6.67 22.26
Total 253 30 283
Source and Notes: See Table 3.9.
Table 3.12. Putative PBE Survey—Estimated Race and Gender Distribution for Putative Portuguese-Owned Firms
Putative Race/Gender Putative Males (%)
Putative Females
(%)
Putative Males and Females
(%)
Nonminority Male 76.68 23.33 71.02 Nonminority Female 8.30 43.33 12.01 African-American 1.58 3.33 1.77 Hispanic 11.46 23.33 12.72 Asian/Pacific Islander 0.40 0.00 0.35 Native American 0.00 0.00 0.00 Cape Verdean 1.58 6.67 2.12
Total 253 30 283
Source and Notes: See Table 3.9.
The race/ethnicity, gender and PBE status of the putative M/WBEs and PBEs responding to the telephone survey was changed, if necessary, according to the survey results. For example, if an establishment originally listed as African American-owned was actually nonminority male-owned, then that establishment was counted as nonminority male-owned for purposes of calculating M/WBE availability.

M/WBE Availability in DCAMM’s Market Area
NERA Economic Consulting
50
But what about, for example, the remaining putative African American-owned establishments that we did not interview? For these businesses, we estimated the race and gender of their ownership based on the amount of misclassification we observed among the putatively African American-owned establishments that we did interview. We performed this procedure within each sample stratum and for all putative race/ethnicity, gender, and PBE categories.
4. Verify Putative Non-M/WBEs
a. Survey of Unclassified Businesses
In the same manner as our telephone survey of putative M/WBEs and PBEs, we also examined unclassified businesses, i.e., any business that was not originally identified as an M/WBE or a PBE, either in Dun & Bradstreet or in one or more of the other directories, and that would otherwise appear to be a non-M/WBE, non-PBE establishment.
We selected a stratified random sample of 35,734 unclassified businesses. Of these, 11,938 (33.4%) were excluded as “unable to contact.” Of the remaining 23,796 establishments, we obtained 9,156 complete interviews, for a response rate of 38.5 percent. Table 3.13 and Table 3.14, respectively, show the distribution of these establishments by race/ethnicity/gender and PBE status.
In Table 3.13, of the 9,156 establishments interviewed, nonminority, non-PBE males owned 8,328 (90.96%). Clearly, a large majority of unclassified businesses in the Baseline Business Universe are nonminority male-owned. Nevertheless, the survey results indicate that 9.04 percent of these establishments are not owned by nonminority non-PBE males. Among the latter, the largest group was nonminority female-owned (6.73%), followed by African American-owned (1.19%), with descending size shares accounted for by Hispanic-owned (0.50%), Asian/Pacific Islander-owned (0.31%), Native American-owned (0.17%), and Cape Verdean-owned (0.14%).
Table 3.13. Unclassified Businesses Survey—By Race and Gender
Verified Race/Gender Number of Businesses Interviewed Percentage of Total
Nonminority male 8,328 90.96
Nonminority female 616 6.73
African American (either gender) 109 1.19
Hispanic (either gender) 46 0.50
Asian/Pacific Islander (either gender) 28 0.31
Native American (either gender) 16 0.17
Cape Verdean (either gender) 13 0.14
TOTAL 9,156 100.00
Source and Notes: See Table 3.9.

M/WBE Availability in DCAMM’s Market Area
NERA Economic Consulting
51
In Table 3.14, of the 9,156 establishments interviewed, persons claiming no Portuguese ancestry owned 9,020 (98.51%). Of the remainder, 67 (0.73%) indicated Portuguese ancestry through Portugal, and 69 (0.75%) indicated Portuguese ancestry through Brazil.
Table 3.14. Unclassified Businesses Survey—By Portuguese Ancestry Status
Verified Race/Gender Number of Businesses Interviewed Percentage of Total
Non-Portuguese Ancestry 9,020 98.51
Portuguese Ancestry from Portugal 67 0.73
Portuguese Ancestry from Brazil 69 0.75
TOTAL 9,156 100.00
Source and Notes: See Table 3.11.
In the same manner as the telephone survey of putative M/WBEs and PBEs, the race/ethnicity, gender and PBE status of unclassified establishments was changed, if necessary, according to the survey results. For example, if an interviewed establishment that was originally unclassified indicated that it was actually nonminority male-owned and non-PBE owned, then that establishment was counted as nonminority male-owned and non-PBE owned for purposes of the availability calculation. If the establishment indicated it was nonminority female-owned, then it was counted as nonminority female, and so on. For unclassified establishments that were not interviewed, we assigned probability values based on the interview responses. We again carried out the probability assignment procedure within each stratum.
5. Understanding “Capacity”
As noted in the beginning of this chapter, some observers, primarily opponents of efforts to address discrimination in contracting, have argued that, in order to be accurate, availability estimates must be adjusted for “capacity.” These assertions are rarely accompanied by specific suggestions about how such adjustments could be made consistent with professional social science standards. This Study does adjust for certain appropriate characteristics of firms related to capacity (such as industry affiliation, geographic location, owner labor market experience, and educational attainment); however, we are careful to not adjust for capacity factors that are themselves likely to be influenced by discrimination. In our view, all of the “capacity” indicators recommended by program opponents (e.g., firm age, annual individual firm revenues, number of employees, largest contract received, bonding limits) are subject to the impact of discrimination.
Further, the reality is that large, adverse statistical disparities between minority-owned or women-owned businesses and nonminority male-owned businesses have been documented in numerous research studies and reports since Croson.54 Business outcomes, however, can be
54 See Enchautegui, et al. (1996). More recently, see Wainwright (2012), Wainwright (2010).

M/WBE Availability in DCAMM’s Market Area
NERA Economic Consulting
52
influenced by multiple factors, and it is important that disparity studies examine the likelihood of whether discrimination is an important contributing factor to observed disparities.
Moreover, terms such as “capacity,” “qualifications,” and “ability,” are not well defined in any statistical sense. Does “capacity” mean the level of annual individual firm revenues, employment size, bonding limits, or number of contracts bid or awarded? Does “qualified” or “able” mean possession of a business license, certain amounts of training, types of work experience, or the number of contracts a firm can perform at a given moment? What mix of business attributes properly reflects “capacity”? Does the meaning of such terms differ from industry to industry, locality to locality, or through time? Where and how might such data be reliably gathered? Even if capacity is well-defined and adequate data are gathered, when measuring the existence of discrimination, the statistical method used should not improperly limit the availability measure by incorporating factors that are themselves impacted by discrimination, such as firm age, annual individual firm revenues, bonding limits, or number of employees.
Consider an extreme example where discrimination has prevented the emergence of any minority owned firms. Suppose that racial discrimination was ingrained in a State’s construction market. As a result, few minority construction employees are given the opportunity to gain managerial experience in the business; minorities who do end up starting construction firms are denied the opportunity to work as subcontractors for nonminority prime contractors; and nonminority prime contractors refuse to work with minority firms and put pressure on bonding companies and banks to prevent minority-owned construction firms from securing bonding and capital. In this example, discrimination has prevented the emergence of a minority highway construction industry with “capacity.” Those M/WBEs that exist at all will be smaller and less experienced and have lower annual individual firm revenues, bonding limits, and employees (i.e., “capacity”) because of discrimination than firms that have benefited from the exclusionary system.
Using annual individual firm revenues as the measure of qualifications illustrates the point. If M/WBEs are subject to market area discrimination, their annual individual firm revenues will be smaller than nonminority, male-owned businesses because they will be less successful at obtaining work. Annual individual firm revenues measure the extent to which a firm has succeeded in the market area, perhaps in spite of discrimination—it does not measure the ability to succeed in the absence of discrimination and should not be used to evaluate the effects of discrimination.
Therefore, focusing on the “capacity” of businesses in terms of employment, annual individual firm revenues, bonding limits, number of trucks, and so forth, is simply wrong as a matter of economics because it can obscure the existence of discrimination. A truly “effective” discriminatory system would lead to a finding of no “capacity,” and under the “capacity” approach, a finding of no discrimination. Excluding firms from an availability measure based on their “capacity” in a discriminatory market merely affirms the results of discrimination rather than ameliorating them. A capacity requirement could preclude DCAMM from doing anything to rectify its passive participation through public dollars in a clearly discriminatory system. The capacity argument fails to acknowledge that discrimination has obstructed the emergence of “qualified, willing, and able” minority firms. Without such firms, there can be no statistical disparity.

M/WBE Availability in DCAMM’s Market Area
NERA Economic Consulting
53
Further, in dynamic business environments, and especially in the construction sector, such “qualifications” or “capacity” can be obtained relatively easily. It is well known that small construction companies can expand rapidly as needs arise by hiring workers and renting equipment, and many general contractors subcontract the majority of a project. Firms grow quickly when demand increases and shrink quickly when demand decreases. Subcontracting is one important source of this elasticity, as has been noted by several academic studies.55 Other industry sectors, especially in this era of Internet commerce and independent contractors, can also quickly grow or shrink in response to demand.
Finally, even where “capacity”-type factors have been controlled for in statistical analyses, results consistent with business discrimination are still typically observed. For example, large and statistically significant differences in commercial loan denial rates between minority and nonminority firms are evident throughout the country, even when detailed balance sheet and creditworthiness measures are held constant.56 Similarly, economists using decennial census data have demonstrated that statistically significant disparities in business formation and business owner earnings between minorities and non-minorities remain even after controlling for a host of additional relevant factors, including educational achievement, labor market experience, marital status, disability status, veteran status, interest and dividend income, labor market attachment, industry, geographic location, and local labor market variables such as the unemployment rate, population growth rate, government employment rate, or per capita income.57
To summarize, the statistical analysis of the availability of minority firms compared to nonminority firms to examine the existence and effects of discrimination in disparity studies should not adjust for inappropriate “capacity” factors because:
• “Capacity” has been ill-defined, and reliable data for measurement are generally unavailable;
• Small firms, particularly in the construction industry, are highly elastic with regard to ability to perform;
• Many disparity studies have shown that even when “capacity” and “qualifications”-type factors are held constant in statistical analyses, evidence of disparate impact against M/WBE firms persists; and
• Most important, identifiable indicators of “capacity” are themselves impacted by discrimination.
55 See Bourdon and Levitt (1980); see also Eccles (1981); and Gould (1980). 56 See Wainwright (2008). 57 Wainwright (2000).

M/WBE Availability in DCAMM’s Market Area
NERA Economic Consulting
54
C. Estimates of M/WBE and PBE Availability
Top-level estimates of M/WBE availability appear below in Table 3.15. Two sets of weighted availability measures are provided for each of the five major procurement categories of Construction and Design. The first set is weighted by award dollars for all contracts. The second set is weighted by paid dollars for substantially completed contracts.
Table 3.15. Overall Estimated M/WBE Availability Percentages
African American Hispanic
Asian/ Pacific
Islander
Native American
Cape Verdean Minority
Non-minority Female
M/WBE Non-M/WBE
OVERALL
AWARD DOLLAR
S
1.62 1.23 0.84 0.23 0.12 4.06 7.98 12.04 87.96
PAID DOLLAR
S
1.63 1.25 0.82 0.24 0.12 4.06 7.90 11.96 88.04
CONSTRUCTION
AWARD DOLLAR
S
1.66 1.26 0.72 0.24 0.12 3.99 7.45 11.44 88.56
PAID DOLLAR
S
1.67 1.28 0.69 0.24 0.12 4.00 7.36 11.36 88.64
DESIGN
AWARD DOLLAR
S
1.36 1.02 1.88 0.20 0.17 4.63 12.07 16.70 83.30
PAID DOLLAR
S
1.35 1.00 1.88 0.19 0.17 4.60 12.16 16.76 83.24
Source: Dun & Bradstreet; M/WBE business directory information compiled by NERA; Master Contract/ Subcontract Database; Master Concessions Database. Note: Figures are rounded. Rounding was performed subsequent to any mathematical calculations.
Overall M/WBE availability in the Construction sector is between 11.36 and 11.44 percent. Non-M/WBE availability is between 88.56 and 88.64 percent. Among M/WBEs, availability of African American-owned businesses is between 1.66 and 1.67 percent, availability of Hispanic-owned businesses is between 1.26 and 1.28 percent, availability of Asian/Pacific Islander-owned businesses is between 0.69 and 0.72 percent, availability of Native American-owned businesses is 0.24 percent, and availability of Cape Verdean-owned businesses is 0.12 percent. Availability of minority-owned businesses as a group is between 3.99 and 4.00 percent. Availability of nonminority female-owned businesses is between 7.36 and 7.45 percent.
Overall M/WBE availability in the Design sector is between 16.70 and 16.76 percent. Non-M/WBE availability is between 83.24 and 83.30 percent. Among M/WBEs, availability of African American-owned businesses is between 1.35 and 1.36 percent, availability of Hispanic-owned businesses is between 1.00 and 1.02 percent, availability of Asian/Pacific Islander-owned businesses is 1.88 percent, and availability of Native American-owned businesses is between 0.19 and 0.20 percent, and availability of Cape Verdean-owned businesses is 0.17 percent.

M/WBE Availability in DCAMM’s Market Area
NERA Economic Consulting
55
Availability of minority-owned businesses as a group is between 4.60 and 4.63 percent. Availability of nonminority female-owned businesses is between 12.07 and 12.16 percent.
Table 3.16. Overall Estimated PBE Availability Percentages
Portuguese
Ancestry through Portugal
Portuguese Ancestry through
Brazil
Portuguese Ancestry (Any) Non-PBE
OVERALL
AWARD DOLLARS 1.59 0.94 2.52 97.48
PAID DOLLARS 1.61 0.95 2.56 97.44
CONSTRUCTION
AWARD DOLLARS 1.69 1.02 2.70 97.30
PAID DOLLARS 1.71 1.03 2.74 97.26
DESIGN
AWARD DOLLARS 0.77 0.27 1.04 98.96
PAID DOLLARS 0.77 0.27 1.04 98.96
Source and Notes: See Table 3.15.
Table 3.16 shows that overall PBE availability in the Construction sector is between 2.70 and 2.74 percent. Non-PBE availability is between 97.26 and 97.30 percent. Overall PBE availability in the Design sector is 1.04 percent. Non-PBE availability is 98.96 percent.
Tables 3.17 and 3.18 present detailed estimates of M/WBE availability in DCAMM’s relevant market area for Construction and Design.58
Table 3.17. Detailed M/WBE Availability Percentages—Construction (All Contracts) (Dollars Awarded)
Detailed Industry Group African American Hispanic
Asian/ Pacific
Islander
Native American
Cape Verdean
Non-minority Female
M/WBE Non-M/WBE
Building Equipment Contractors (NAICS 2382) 1.64 0.99 0.61 0.35 0.12 6.33 10.04 89.96
Foundation, Structure, and Building Exterior Contractors (NAICS 2381)
1.02 2.43 0.50 0.05 0.24 8.06 12.31 87.69
Nonresidential Building Construction (NAICS 2362) 1.71 1.15 0.60 0.70 0.01 9.92 14.09 85.91
Other Specialty Trade Contractors (NAICS 2389) 2.05 1.78 0.40 0.17 0.07 9.71 14.18 85.82
58 Similar tables using paid dollar weights were also produced but are not included here for space considerations.

M/WBE Availability in DCAMM’s Market Area
NERA Economic Consulting
56
Detailed Industry Group African American Hispanic
Asian/ Pacific
Islander
Native American
Cape Verdean
Non-minority Female
M/WBE Non-M/WBE
Building Finishing Contractors (NAICS 2383) 2.96 4.56 1.89 0.03 0.28 9.46 19.17 80.83
Architectural, Engineering, and Related Services (NAICS 5413)
1.43 0.75 2.33 0.13 0.17 9.59 14.39 85.61
Architectural and Structural Metals Manufacturing (NAICS 3323)
0.00 1.94 0.82 0.00 0.01 14.83 17.61 82.39
Highway, Street, and Bridge Construction (NAICS 2373) 0.16 0.32 0.48 0.00 0.00 4.60 5.57 94.43
Electric Power Generation, Transmission and Distribution (NAICS 2211)
0.67 0.68 1.01 0.00 0.02 2.94 5.32 94.68
Remediation and Other Waste Management Services (NAICS 5629)
3.86 8.74 1.93 0.00 0.04 16.99 31.56 68.44
Professional and Commercial Equipment and Supplies Merchant Wholesalers (NAICS 4234)
0.90 2.07 0.58 0.00 0.01 7.46 11.02 88.98
Machinery, Equipment, and Supplies Merchant Wholesalers (NAICS 4238)
0.56 1.61 1.62 0.36 0.02 7.58 11.75 88.25
Services to Buildings and Dwellings (NAICS 5617) 2.21 1.40 0.47 0.33 0.10 9.98 14.49 85.51
Other Wood Product Manufacturing (NAICS 3219)
0.00 1.44 0.58 0.00 0.01 5.63 7.65 92.35
Management, Scientific, and Technical Consulting Services (NAICS 5416)
0.37 0.78 0.87 0.02 0.03 13.48 15.54 84.46
Lumber and Other Construction Materials Merchant Wholesalers (NAICS 4233)
0.00 3.63 1.14 0.00 0.20 7.56 12.53 87.47
Cement and Concrete Product Manufacturing (NAICS 3273)
0.00 4.33 1.93 0.00 0.02 8.70 14.98 85.02
Hardware, and Plumbing and Heating Equipment and Supplies Merchant Wholesalers (NAICS 4237)
1.23 0.30 0.30 0.00 0.00 3.80 5.64 94.36
Metal and Mineral (except Petroleum) Merchant Wholesalers (NAICS 4235)
0.43 1.71 3.84 0.00 0.01 10.20 16.19 83.81
Office Furniture (including Fixtures) Manufacturing (NAICS 3372)
0.00 0.00 6.76 0.00 0.02 8.29 15.07 84.93
Engine, Turbine, and Power Transmission Equipment Manufacturing (NAICS 3336)
0.00 4.00 3.98 0.00 0.03 18.86 26.86 73.14
Household and Institutional 0.00 1.59 6.78 0.00 0.02 10.61 19.00 81.00
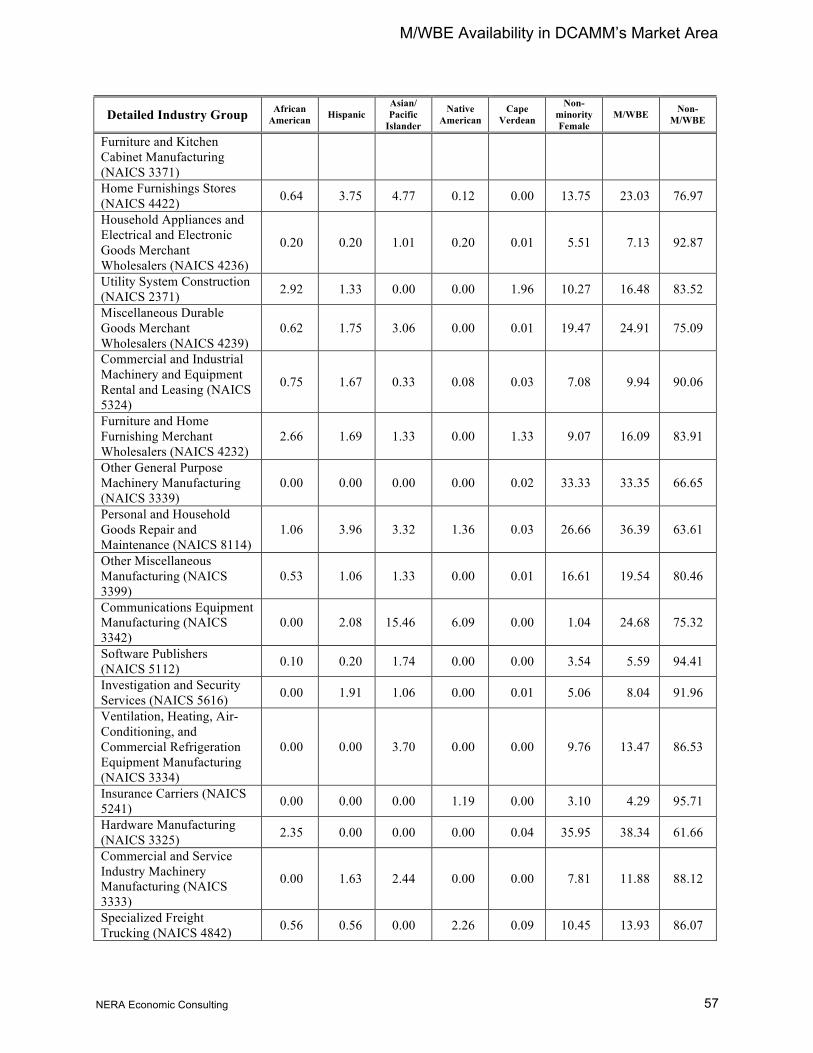
M/WBE Availability in DCAMM’s Market Area
NERA Economic Consulting
57
Detailed Industry Group African American Hispanic
Asian/ Pacific
Islander
Native American
Cape Verdean
Non-minority Female
M/WBE Non-M/WBE
Furniture and Kitchen Cabinet Manufacturing (NAICS 3371) Home Furnishings Stores (NAICS 4422) 0.64 3.75 4.77 0.12 0.00 13.75 23.03 76.97
Household Appliances and Electrical and Electronic Goods Merchant Wholesalers (NAICS 4236)
0.20 0.20 1.01 0.20 0.01 5.51 7.13 92.87
Utility System Construction (NAICS 2371) 2.92 1.33 0.00 0.00 1.96 10.27 16.48 83.52
Miscellaneous Durable Goods Merchant Wholesalers (NAICS 4239)
0.62 1.75 3.06 0.00 0.01 19.47 24.91 75.09
Commercial and Industrial Machinery and Equipment Rental and Leasing (NAICS 5324)
0.75 1.67 0.33 0.08 0.03 7.08 9.94 90.06
Furniture and Home Furnishing Merchant Wholesalers (NAICS 4232)
2.66 1.69 1.33 0.00 1.33 9.07 16.09 83.91
Other General Purpose Machinery Manufacturing (NAICS 3339)
0.00 0.00 0.00 0.00 0.02 33.33 33.35 66.65
Personal and Household Goods Repair and Maintenance (NAICS 8114)
1.06 3.96 3.32 1.36 0.03 26.66 36.39 63.61
Other Miscellaneous Manufacturing (NAICS 3399)
0.53 1.06 1.33 0.00 0.01 16.61 19.54 80.46
Communications Equipment Manufacturing (NAICS 3342)
0.00 2.08 15.46 6.09 0.00 1.04 24.68 75.32
Software Publishers (NAICS 5112) 0.10 0.20 1.74 0.00 0.00 3.54 5.59 94.41
Investigation and Security Services (NAICS 5616) 0.00 1.91 1.06 0.00 0.01 5.06 8.04 91.96
Ventilation, Heating, Air-Conditioning, and Commercial Refrigeration Equipment Manufacturing (NAICS 3334)
0.00 0.00 3.70 0.00 0.00 9.76 13.47 86.53
Insurance Carriers (NAICS 5241) 0.00 0.00 0.00 1.19 0.00 3.10 4.29 95.71
Hardware Manufacturing (NAICS 3325) 2.35 0.00 0.00 0.00 0.04 35.95 38.34 61.66
Commercial and Service Industry Machinery Manufacturing (NAICS 3333)
0.00 1.63 2.44 0.00 0.00 7.81 11.88 88.12
Specialized Freight Trucking (NAICS 4842) 0.56 0.56 0.00 2.26 0.09 10.45 13.93 86.07

M/WBE Availability in DCAMM’s Market Area
NERA Economic Consulting
58
Detailed Industry Group African American Hispanic
Asian/ Pacific
Islander
Native American
Cape Verdean
Non-minority Female
M/WBE Non-M/WBE
Medical Equipment and Supplies Manufacturing (NAICS 3391)
0.32 0.65 2.92 0.00 0.07 0.33 4.29 95.71
Other Heavy and Civil Engineering Construction (NAICS 2379)
0.00 1.23 1.23 0.00 0.02 8.02 10.50 89.50
Computer Systems Design and Related Services (NAICS 5415)
2.48 0.29 4.08 0.00 0.00 15.17 22.02 77.98
Other Support Services (NAICS 5619) 0.12 0.39 0.12 0.01 0.08 33.66 34.38 65.62
Waste Treatment and Disposal (NAICS 5622) 0.00 2.01 0.00 0.00 0.01 6.38 8.40 91.60
Sources and Notes: See Table 3.13.

M/WBE Availability in DCAMM’s Market Area
NERA Economic Consulting
59
Table 3.18. Detailed M/WBE Availability Percentages—Design (All Contracts) (Dollars Awarded)
Detailed Industry Group African American Hispanic
Asian/ Pacific
Islander
Native American
Cape Verdean
Non-minority Female
M/WBE Non-M/WBE
Architectural, Engineering, and Related Services (NAICS 5413)
1.60 1.36 1.99 0.27 0.20 10.52 15.94 84.06
Management, Scientific, and Technical Consulting Services (NAICS 5416)
0.54 0.72 0.75 0.14 0.05 12.65 14.85 85.15
Other Support Services (NAICS 5619) 0.12 0.39 0.12 0.01 0.08 33.66 34.38 65.62
Other Professional, Scientific, and Technical Services (NAICS 5419)
0.00 1.09 1.58 0.10 0.02 34.52 37.32 62.68
Software Publishers (NAICS 5112) 0.10 0.20 1.74 0.00 0.00 3.54 5.59 94.41
Computer Systems Design and Related Services (NAICS 5415)
2.48 0.29 4.08 0.00 0.00 15.17 22.02 77.98
Specialized Design Services (NAICS 5414) 1.21 1.75 0.55 0.09 0.00 16.82 20.43 79.57
Sources and Notes: See Table 3.11.
Tables 3.19 and 3.20 present detailed estimates of PBE availability in DCAMM’s relevant market area for Construction and Design.
Table 3.19. Detailed PBE Availability Percentages—Construction (All Contracts) (Dollars Awarded)
Detailed Industry Group
Portuguese Ancestry through Portugal
Portuguese Ancestry through Brazil
Portuguese Ancestry
(Any) Non-PBE
Building Equipment Contractors (NAICS 2382) 1.78 0.78 2.56 97.44
Foundation, Structure, and Building Exterior Contractors (NAICS 2381) 1.50 1.54 3.04 96.96
Nonresidential Building Construction (NAICS 2362) 0.52 1.31 1.83 98.17
Other Specialty Trade Contractors (NAICS 2389) 3.40 1.85 5.25 94.75
Building Finishing Contractors (NAICS 2383) 3.58 2.33 5.91 94.09 Architectural, Engineering, and Related Services (NAICS 5413) 0.85 0.22 1.07 98.93
Architectural and Structural Metals Manufacturing (NAICS 3323) 0.11 0.10 0.21 99.79
Highway, Street, and Bridge Construction (NAICS 2373) 1.04 2.23 3.27 96.73
Electric Power Generation, Transmission and Distribution (NAICS 2211) 0.21 0.08 0.30 99.70
Remediation and Other Waste Management Services (NAICS 5629) 0.90 0.57 1.46 98.54

M/WBE Availability in DCAMM’s Market Area
NERA Economic Consulting
60
Detailed Industry Group
Portuguese Ancestry through Portugal
Portuguese Ancestry through Brazil
Portuguese Ancestry
(Any) Non-PBE
Professional and Commercial Equipment and Supplies Merchant Wholesalers (NAICS 4234)
0.45 0.27 0.72 99.28
Machinery, Equipment, and Supplies Merchant Wholesalers (NAICS 4238) 0.20 0.19 0.38 99.62
Services to Buildings and Dwellings (NAICS 5617) 1.33 2.63 3.96 96.04
Other Wood Product Manufacturing (NAICS 3219) 0.11 0.18 0.29 99.71
Management, Scientific, and Technical Consulting Services (NAICS 5416) 0.78 0.10 0.87 99.13
Lumber and Other Construction Materials Merchant Wholesalers (NAICS 4233) 0.69 0.43 1.12 98.88
Cement and Concrete Product Manufacturing (NAICS 3273) 0.79 0.58 1.37 98.63
Hardware, and Plumbing and Heating Equipment and Supplies Merchant Wholesalers (NAICS 4237)
0.05 0.30 0.35 99.65
Metal and Mineral (except Petroleum) Merchant Wholesalers (NAICS 4235) 2.21 0.18 2.39 97.61
Office Furniture (including Fixtures) Manufacturing (NAICS 3372) 0.00 0.03 0.04 99.96
Engine, Turbine, and Power Transmission Equipment Manufacturing (NAICS 3336) 0.16 0.24 0.40 99.60
Household and Institutional Furniture and Kitchen Cabinet Manufacturing (NAICS 3371)
0.14 0.03 0.18 99.82
Home Furnishings Stores (NAICS 4422) 4.15 1.04 5.19 94.81 Household Appliances and Electrical and Electronic Goods Merchant Wholesalers (NAICS 4236)
0.05 0.03 0.08 99.92
Utility System Construction (NAICS 2371) 3.16 0.07 3.23 96.77 Miscellaneous Durable Goods Merchant Wholesalers (NAICS 4239) 0.21 0.28 0.50 99.50
Commercial and Industrial Machinery and Equipment Rental and Leasing (NAICS 5324) 0.23 0.26 0.49 99.51
Furniture and Home Furnishing Merchant Wholesalers (NAICS 4232) 0.15 1.44 1.58 98.42
Other General Purpose Machinery Manufacturing (NAICS 3339) 0.09 0.68 0.77 99.23
Personal and Household Goods Repair and Maintenance (NAICS 8114) 3.17 0.07 3.23 96.77
Other Miscellaneous Manufacturing (NAICS 3399) 1.68 2.23 3.92 96.08
Communications Equipment Manufacturing (NAICS 3342) 0.07 0.06 0.13 99.87
Software Publishers (NAICS 5112) 0.04 0.03 0.06 99.94 Investigation and Security Services (NAICS 5616) 0.21 0.16 0.37 99.63

M/WBE Availability in DCAMM’s Market Area
NERA Economic Consulting
61
Detailed Industry Group
Portuguese Ancestry through Portugal
Portuguese Ancestry through Brazil
Portuguese Ancestry
(Any) Non-PBE
Ventilation, Heating, Air-Conditioning, and Commercial Refrigeration Equipment Manufacturing (NAICS 3334)
0.00 0.04 0.04 99.96
Insurance Carriers (NAICS 5241) 0.11 1.27 1.37 98.63 Hardware Manufacturing (NAICS 3325) 0.16 9.00 9.16 90.84 Commercial and Service Industry Machinery Manufacturing (NAICS 3333) 0.00 2.03 2.03 97.97
Specialized Freight Trucking (NAICS 4842) 0.57 6.24 6.81 93.19 Medical Equipment and Supplies Manufacturing (NAICS 3391) 0.40 0.49 0.88 99.12
Other Heavy and Civil Engineering Construction (NAICS 2379) 0.26 0.23 0.50 99.50
Computer Systems Design and Related Services (NAICS 5415) 0.23 0.47 0.70 99.30
Other Support Services (NAICS 5619) 0.35 0.56 0.91 99.09 Waste Treatment and Disposal (NAICS 5622) 0.48 0.41 0.89 99.11
Sources and Notes: See Table 3.13.
Table 3.20. Detailed PBE Availability Percentages—Design (All Contracts) (Dollars Awarded)
Detailed Industry Group
Portuguese Ancestry through Portugal
Portuguese Ancestry through Brazil
Portuguese Ancestry
(Any) Non-PBE
Architectural, Engineering, and Related Services (NAICS 5413) 0.79 0.24 1.03 98.97
Management, Scientific, and Technical Consulting Services (NAICS 5416) 0.63 0.16 0.79 99.21
Other Support Services (NAICS 5619) 0.35 0.56 0.91 99.09 Other Professional, Scientific, and Technical Services (NAICS 5419) 0.47 1.07 1.54 98.46
Software Publishers (NAICS 5112) 0.04 0.03 0.06 99.94 Computer Systems Design and Related Services (NAICS 5415) 0.23 0.47 0.70 99.30
Specialized Design Services (NAICS 5414) 0.05 0.75 0.80 99.20 Sources and Notes: See Table 3.11.

M/WBE Availability in DCAMM’s Market Area
NERA Economic Consulting
62

Market-Based Disparities in Business Formation and Business Owner Earnings
NERA Economic Consulting
63
IV. Market-Based Disparities in Business Formation and Business Owner Earnings
A. Introduction
In this chapter, we examine disparities in business formation and earnings in the private sector, where contracting activities are generally not subject to M/WBE or other affirmative action requirements. Statistical examination of disparities in the private sector of the relevant geographic market area is important for at least two reasons. First, to the extent that discriminatory practices by contractors, suppliers, insurers, lenders, customers, and others limit the ability of M/WBEs and PBEs to compete, those practices will impact the larger private sector as well as the public sector. Second, examining the utilization of M/WBEs and PBEs in the private sector provides an indicator of the extent to which M/WBEs and PBEs are used in the absence of race- and gender-conscious efforts, since few firms in the private sector make such efforts.
There is a significant body of research on the economics of entrepreneurship and self-employment,59 and there exists significant agreement on the microeconomic correlates of self-employment.60 In the U.S., it is known that self-employment rises with age, is higher among men than women, and higher among non-minorities than minorities. The least educated have the highest probability of being self-employed. However, there is evidence in the U.S. that the most highly educated also have a relatively high probability of self-employment. On average, however, increases in educational attainment are generally found to lead to increases in the probability of being self-employed. A higher number of children in the family increases the likelihood of self-employment, at least for men. Workers in agriculture and construction are also especially relatively more likely to be self-employed.
There has been relatively less work on how institutional factors influence self-employment. Such work that has been conducted includes examining the role of minimum wage legislation (Blau, 1987), immigration (Fairlie and Meyer, 1998 and 2003; Olson, Zuiker and Montalto, 2000; Mora and Dávila, 2006; Robles and Cordero-Guzmán, 2007),61 immigration policy (Borjas and
59 Microeconometric work includes Fuchs (1982), Borjas and Bronars (1989), Evans and Jovanovic (1989), Evans
and Leighton (1989), Fairlie and Meyer (1996, 1998), Reardon (1998), Fairlie (1999), Wainwright (2000), Blanchflower and Wainwright (2005), and Blanchflower (2009) for the United States; Rees and Shah (1986), Pickles and O’Farrell (1987), Blanchflower and Oswald (1990, 1998), Meager (1992), Taylor (1996), Robson (1998a, 1998b), and Blanchflower and Shadforth (2007) for the UK; DeWit and van Winden (1990) for the Netherlands; Alba-Ramirez (1994) for Spain; Bernhardt (1994), Schuetze (1998), Arai (1997), Lentz and Laband (1990), and Kuhn and Schuetze (1998) for Canada; Laferrere and McEntee (1995) for France; Blanchflower and Meyer (1994) and Kidd (1993) for Australia; and Foti and Vivarelli (1994) for Italy. There are also several theoretical papers including Kihlstrom and Laffonte (1979), Kanbur (1990), Holmes and Schmitz (1990), Coate and Tennyson (1992), and Cagetti and DeNardi (2006), plus a few papers that draw comparisons across countries, e.g., Schuetze (1998) for Canada and the U.S., Blanchflower and Meyer (1994) for Australia and the U.S., Alba-Ramirez (1994) for Spain and the United States, and Acs and Evans (1994), Blanchflower (2000), Blanchflower, Oswald, and Stutzer (2001), and Blanchflower and Oswald (2008) for many countries.
60 Parker (2004) and Aronson (1991) provide good overviews. 61 Fairlie and Meyer (1998) found that immigration had no statistically significant impact at all on African
American self-employment. In a subsequent paper, Fairlie and Meyer (2003) found that self-employed

Market-Based Disparities in Business Formation and Business Owner Earnings
NERA Economic Consulting
64
Bronars, 1989), and retirement policies (Quinn, 1980). Studies by Long (1982), Blau (1987), and Schuetze (1998), have considered the role of taxes.62 A number of other studies have also considered the cyclical aspects of self-employment and in particular how movements of self-employment are correlated with movements in unemployment. Meager (1992) provides a useful summary of much of this work.63
Blanchflower, Oswald and Stutzer (2001) found that there is a strikingly large latent desire to own a business. There exists frustrated entrepreneurship on a huge scale in the U.S. and other Organization for Economic Co-operation and Development (OECD) countries.64 In the U.S., 7 out of 10 people say they would prefer to be self-employed. This compares to an actual proportion of self-employed people in 2001 of 7.3 percent of the civilian labor force, which also shows that the proportion of the labor force that is self-employed has declined steadily since 1990 following a small increase in the rate from 1980 to 1990. This raises an important question. Why do so few individuals in the U.S. and OECD countries manage to translate their preferences into action? Lack of start-up capital is one likely explanation. This factor is commonly cited by small-business managers themselves (Blanchflower and Oswald, 1998). There is also econometric evidence that confirms this barrier. Holding other influences constant, people who inherit cash, who win the lottery, or who have large family assets, are all more likely both to set up and sustain a lasting small business. By contrast, childhood personality test-scores turn out to
immigrants did displace self-employed native non-African Americans. They found that immigration has a large negative effect on the probability of self-employment among native non-African Americans, although, surprisingly, they found that immigrants increase native self-employment earnings.
62 In an interesting study pooling individual level data for the U.S. and Canada from the Current Population Survey and the Survey of Consumer Finances, respectively, Schuetze (1998) finds that increases in income taxes have large and positive effects on the male self-employment rate. He found that a 30 percent increase in taxes generated a rise of 0.9 to 2.0 percentage points in the male self-employment rate in Canada compared with a rise of 0.8 to 1.4 percentage points in the U.S. over 1994 levels.
63 Evans and Leighton (1989) found that nonminority men who are unemployed are nearly twice as likely as wage workers to enter self-employment. Bogenhold and Staber (1991) also find evidence that unemployment and self-employment are positively correlated. Blanchflower and Oswald (1990) found a strong negative relationship between regional unemployment and self-employment for the period 1983-1989 in the U.K. using a pooled cross-section time-series data set. Blanchflower and Oswald (1998) confirmed this result, finding that the log of the county unemployment rate entered negatively in a cross-section self-employment model for young people age 23 in 1981 and for the same people aged 33 in 1991. Taylor (1996) confirmed this result using data from the British Household Panel Study of 1991, showing that the probability of being self-employed rises when expected self-employment earnings increase relative to employee earnings, i.e., when unemployment is low. Acs and Evans (1994) found evidence from an analysis of a panel of countries that the unemployment rate entered negatively in a fixed effect and random effects formulation. However, Schuetze (1998) found that for the U.S. and Canada the elasticity of the male self-employment rate with respect to the unemployment rate was considerably smaller than found for the effect from taxes discussed above. The elasticity of self-employment associated with the unemployment rate is about 0.1 in both countries using 1994 figures. A decrease of 5 percentage points in the unemployment rate in the U.S. (about the same decline occurred from 1983-1989) leads to about a 1 percentage point decrease in self-employment. Blanchflower (2000) found that there is generally a negative relationship between the self-employment rate and the unemployment rate. It does seem then that there is some disagreement in the literature on whether high unemployment acts to discourage self-employment because of the lack of available opportunities or encourage it because of the lack of viable alternatives.
64 The OECD is an international organization of those developed countries that accept the principles of representative democracy and a free market economy. There are currently 30 full members.

Market-Based Disparities in Business Formation and Business Owner Earnings
NERA Economic Consulting
65
have almost no predictive power about which persons will be running their own businesses as adults (Blanchflower and Oswald, 1998).
One primary impediment to entrepreneurship among minorities is lack of capital. In work based on U.S. micro data at the level of the individual, Evans and Leighton (1989), and Evans and Jovanovic (1989), have argued formally that entrepreneurs face liquidity constraints. The authors use the National Longitudinal Survey of Young Men for 1966-1981, and the Current Population Surveys for 1968-1987. The key test shows that, all else remaining equal, people with greater family assets are more likely to switch to self-employment from employment. This asset variable enters econometric equations significantly and with a quadratic form. Although Evans and his collaborators draw the conclusion that capital and liquidity constraints bind, this claim is open to the objection that other interpretations of their correlation are feasible. One possibility, for example, is that inherently acquisitive individuals both start their own businesses and forego leisure to build up family assets. In this case, there would be a correlation between family assets and movement into self-employment even if capital constraints did not exist. A second possibility is that the correlation between family assets and the movement to self-employment arises because children tend to inherit family firms. Blanchflower and Oswald (1998), however, find that the probability of self-employment depends positively upon whether the individual ever received an inheritance or gift.65 Moreover, when directly questioned in interview surveys, potential entrepreneurs say that raising capital is their principal problem. Work by Holtz-Eakin, Joulfaian and Harvey (1994a, 1994b) drew similar conclusions using different methods on U.S. data, examining flows into and out of self-employment and finding that inheritances both raise entry and slow exit. In contrast, Hurst and Lusardi (2004), citing evidence from the U.S. Panel Study of Income Dynamics, claim to show that wealth is not a significant determinant of entry into self-employment. In response, however, Fairlie and Krashinsky (2006) have demonstrated that when the sample is split into two segments—those who enter self-employment after job loss and those who do not—the strong correlation between assets and rate of entry business formation is evident in both segments.
The work of Black, et al. (1996) for the United Kingdom discovers an apparently powerful role for house prices (through its impact on equity withdrawal) in affecting the supply of small new firms. Cowling and Mitchell (1997) find a similar result. Again, these are both suggestive of capital constraints. Finally, Lindh and Ohlsson (1996) adopt the Blanchflower-Oswald procedure and provide complementary evidence for Sweden. Bernhardt (1994), in a study for Canada using data from the 1981 Social Change in Canada Project, also found evidence that capital constraints appear to bind. Using the 1991 French Household Survey of Financial Assets, Laferrere and McEntee (1995) examined the determinants of self-employment using data on intergenerational transfers of wealth, education, informal human capital, and a range of demographic variables.
They also find evidence of the importance played by the family in the decision to enter self-employment. Intergenerational transfers of wealth, familial transfers of human capital, and the structure of the family, were found to be determining factors in the decision to move from wage work into entrepreneurship. Broussard, et al. (2003) found that the self-employed have between
65 This emerges from British data, the National Child Development Study; a birth cohort of children born in March
1958 who have been followed for the whole of their lives.

Market-Based Disparities in Business Formation and Business Owner Earnings
NERA Economic Consulting
66
0.2 and 0.4 more children compared to the non-self-employed. The authors argue that having more children can increase the likelihood that an inside family member will be a good match at running the business. One might also think that the existence of family businesses, which are particularly prevalent in construction and in agriculture, is a further way to overcome the existence of capital constraints. Transfers of firms within families will help to preserve the status quo and will work against the interests of African Americans, in particular, who do not have as strong a history of business ownership as indigenous non-minorities. Analogously, Hout and Rosen (2000) and Fairlie and Robb (2007a) found that the offspring of self-employed parents are more likely than others to become self-employed and argued that the historically low rates of self-employment among African Americans and Latinos may contribute to their low contemporary rates. Fairlie and Robb (2007b), using data from the U.S. Characteristics of Business Owners Survey, and Dunn and Holtz-Eakin (2000), using data from the U.S. National Longitudinal Surveys, show that the transmission of positive effects of family on self-employment operates through two channels, intergenerational transmission of entrepreneurial preferences and wealth, and the acquisition of general and specific human capital.
A continuing puzzle in the literature has been why, nationally, the self-employment rate of African American males is one-third of that of nonminority males and has remained roughly constant since 1910. Fairlie and Meyer (2000) rule out a number of explanations for the difference. They found that trends in demographic factors, including the Great Migration and the racial convergence in education levels, “did not have large effects on the trend in the racial gap in self-employment” (p. 662). They also found that an initial lack of business experience “cannot explain the current low levels of black self-employment.” Further, they found that “the lack of traditions in business enterprise among blacks that resulted from slavery cannot explain a substantial part of the current racial gap in self-employment” (p. 664).
Fairlie (1999) and Wainwright (2000) have shown that a considerable part of the explanation of the differences between the African American and nonminority self-employment rate can be attributed to discrimination. Using the 5 percent Public Use Microdata Sample data (“PUMS”) from the 1990 Census, Wainwright (2000) demonstrated that these disparities tend to persist even when factors such as geography, industry, occupation, age, education and assets are held constant.66
Bates (1989) finds strong supporting evidence that racial differences in levels of financial capital have significant effects upon racial patterns in business failure rates. Fairlie (1999, 2006)
66 In Wainwright (2000), the author conducted a series of regression analyses, similar to those reported in Chapter
IV, that examined racial differences among males in business formation rates and business owner earnings while holding a large set of control factors constant. Separate regressions were conducted for each of the nine Census geographic divisions. In addition to race, the following factors were controlled for: educational attainment, age, marital status, non-mover status, number of workers in the family, number of children, immigrant status, years in the U.S., English language proficiency, work-limiting disability, veteran status, years of military services, interest and dividend income, usual weeks worked per year, and usual hours worked per week, industry, and occupation. Additionally, a set of local labor market variables was included for each Census division, including the unemployment rate, population size, population growth rate, the government employment rate, and per capita income. The results, in general, showed large and statistically significant disparities in both sets of regressions for all minority groups examined. The findings were strongest for African Americans, followed by Native Americans and Hispanics. Large disparities were documented for Asians as well in many instances.

Market-Based Disparities in Business Formation and Business Owner Earnings
NERA Economic Consulting
67
demonstrates, for example, that the African American exit rate from self-employment is twice as high as that of non-minorities. An example will help to make the point. Two baths are being filled with water. In the first scenario, both have the plug in. Water flows into bath A at the same rate as it does into bath B—that is, the inflow rate is the same. When we return after ten minutes the amount of water (the stock) will be the same in the two baths as the inflow rates were the same. In the second scenario, we take out the plugs and allow for the possibility that the outflow rates from the two baths are different. Bath A (the African American firms) has a much larger drain and hence the water flows out more quickly than it does from bath B (the nonminority firms). When we return after 10 minutes, even though the inflow rates are the same there is much less water in bath A than there is in bath B. A lower exit rate for nonminority-owned firms than is found for minority-owned firms is perfectly consistent with the observed fact that minority-owned firms are younger and smaller than nonminority-owned firms. The extent to which that will be true is a function of the relative sizes of the inflow and the outflow rates.
B. Race and Gender Disparities in Wage and Salary Earnings
In this section, we examine earnings to determine whether minority, female, and Portuguese entrepreneurs earn less from their businesses than do their non-Portuguese nonminority male counterparts. Other things equal, if minority and female business owners as a group cannot achieve comparable earnings from their businesses as similarly situated nonminorities because of discrimination, then failure rates for M/WBEs and PBEs will be higher and M/WBE and PBE formation rates will be lower than would be observed in a race- and gender-neutral market area. Both phenomena would contribute directly to lower levels of minority and female business ownership.
Below, we first examine earnings disparities among wage and salary employees, that is, non-business owners. It is helpful to examine this segment of the labor force since a key source of new entrepreneurs in any given industry is the pool of experienced wage and salary workers in similar or related industries (Blanchflower 2000). Therefore, employment discrimination that adversely impacts the ability of minorities or women to succeed in the labor force directly shrinks the available pool of potential M/WBEs and PBEs. In almost every instance examined, a statistically significant adverse impact on wage and salary earnings is observed—in both the economy at large, in the construction and construction-related professional services sector, and in the goods and services sector.67
We then turn to an examination of differences in earnings among the self-employed, that is, among business owners. Here too, among the pool of minorities and women who have formed businesses despite discrimination in both employment opportunities and business opportunities, statistically significant adverse impacts are observed in the vast majority of cases in construction,
67 There is a substantial body of evidence that discriminatory constraints in the capital market prevent minority-
owned businesses from obtaining business loans. Furthermore, even when they are able to obtain them, there is evidence that these loans are not obtained on equal terms: minority-owned firms have to pay higher interest rates, other things being equal. This is another form of discrimination with an obvious and direct impact on the ability of racial minorities to form businesses and to expand or grow previously formed businesses. See Chapter V, infra.

Market-Based Disparities in Business Formation and Business Owner Earnings
NERA Economic Consulting
68
design, and construction-related professional services (hereafter, “construction and design”), and other sectors of the economy.
In the remainder of this chapter, we discuss the methods and data we employed and present the specific findings.
1. Methods
We used the statistical technique of linear regression analysis to estimate the effect of each of a set of observable characteristics, such as education and age, on an outcome variable of interest. In this case, the outcome variable of interest is earnings and we used regression to compare earnings among individuals in similar geographic and product markets at similar points in time and with similar years of education and potential labor market experience and see if any adverse race or gender differences remain. In a discrimination free market area, one would not expect to observe significant differences in earnings by race or gender among such similarly situated observations.
Regression also allows us to narrowly tailor our statistical tests to the Commonwealth of Massachusetts’ relevant geographic market, and assess whether disparities in that market are statistically significantly different from those observed elsewhere in the nation. Starting from an economy-wide data set, we first estimated the basic model of earnings differences just described and also included an indicator variable for the Massachusetts Market Area (MASSMA), which is comprised of the Commonwealth of Massachusetts. This variable estimates the differential effect of location in the MASSMA relevant to the rest of the country. This model appears as Specification 1 in Tables 4.1 through 4.6. Next, we estimated Specification 2, which is the same model as Specification 1 but with the addition of indicator variables that interact race and gender with the MASSMA indicator. These variables estimate the differential effect of location in the MASSMA and membership in the given race or gender group. Specification 3 represents our ultimate specification, which includes all of the variables from the basic model as well as any of the interaction terms from Specification 2 that were statistically significant.68
Any negative and statistically significant differences by race or gender that remain in Specification 3 after holding all of these other factors constant—time, age, education, geography, and industry—are consistent with what would be observed in a market suffering from business-related discrimination.69
68 If none of these terms is significant, then Specification 3 reduces to Specification 1. 69 Typically, a given test statistic is considered to be statistically significant if there is a reasonably low probability
that the value of the statistic is due to random chance alone. Unless otherwise indicated, in this and subsequent chapters, we employ three levels of statistical significance, corresponding to 10 percent, 5 percent, and 1 percent probabilities that results were the result of random chance.

Market-Based Disparities in Business Formation and Business Owner Earnings
NERA Economic Consulting
69
2. Data
The analyses undertaken in this Study require individual-level data (i.e., “microdata”) with relevant information on business ownership status and other key socioeconomic characteristics. The data source used is the American Community Survey (ACS) Public Use Microdata Sample (PUMS) for 2010–2014. The Census Bureau’s ACS is an ongoing survey covering the same type of information collected in the decennial census. The ACS is sent to approximately 3.5 million addresses annually, including housing units in all counties in the 50 states and the District of Columbia.70 The PUMS file from the ACS contains records for a subsample of the full ACS. The data used here are the multi-year estimates combining the 2010 through 2014 ACS PUMS records. The combined file contains over six million person-level records. The 2010-2014 ACS PUMS provides the full range of population and housing information collected in the annual ACS and in the decennial census. Business ownership status is identified in the ACS PUMS through the “class of worker” variable, which distinguishes the unincorporated and incorporated self-employed from others in the labor force. The presence of the class of worker variable allows us to construct a detailed cross-sectional sample of individual business owners and their associated earnings.
3. Findings: Race and Gender Disparities in Wage and Salary Earnings
Tables 4.1, 4.2 and 4.3 report results from our regression analyses of annual earnings among wage and salary workers. Table 4.1 focuses on the economy as a whole, Table 4.2 on the construction sector, and Table 4.3 on the goods and services sector. The numbers shown in each table indicate the percentage difference in that sector between the average annual wages of a given race/gender group and comparable nonminority males.
a. Specification 1 - the Basic Model
In Table 4.1 Specification 1, the estimated percentage difference in average annual wages between African Americans (both genders) and nonminority males in 2010–2014 was -36.0 percent. That is, average annual wages among African Americans were 36.0 percent lower than for nonminority males who were otherwise similar in terms of geographic location, industry, age, and education. The number in parentheses below each percentage difference is the t-statistic, which indicates whether the estimated percentage difference is statistically significant or not. In Tables 4.1 through 4.6, a t-statistic of 1.99 or larger indicates statistical significance at a 95 percent confidence level or better.71 In the example just used, the t-statistic of 1378.72 indicates that the result is statistically significant.
Specification 1 in Table 4.1 shows adverse and statistically significant wage disparities for African Americans, Hispanics, Asians/Pacific Islanders, Native Americans, persons reporting in multiple race categories, and nonminority women, consistent with the presence of discrimination in these markets. Observed disparities are large as well, ranging from -18.3 percent for
70 U.S. Census Bureau (2013). 71 From a two-tailed test.

Market-Based Disparities in Business Formation and Business Owner Earnings
NERA Economic Consulting
70
Asians/Pacific Islanders to -36.0 percent for African Americans. No significant adverse wage and salary disparity is observed for Cape Verdeans.
Specification 1 in Table 4.2 shows similar results when the basic analysis is restricted to the Construction and Design sector. Here, large, adverse, and statistically significant wage disparities are once again observed for African Americans, Hispanics, Asians/Pacific Islanders, Native Americans, persons reporting in multiple race categories and nonminority women, consistent with the presence of discrimination in these markets. Observed disparities in this sector are large as well, ranging from -14.0 percent for Asians/Pacific Islanders to -34.7 percent for African Americans. A positive and significant wage and salary advantage is observed for Cape Verdeans in this sector.
Similarly, Specification 1 in Table 4.3 for the Goods and Services sector also shows large, adverse, and statistically significant wage disparities for African Americans, Hispanics, Asians/Pacific Islanders, Native Americans, persons reporting in multiple race categories and nonminority women, consistent with the presence of discrimination in these markets. Observed disparities are large in this sector also, ranging from -19.6 percent for Asians/Pacific Islanders to -41.0 percent for African Americans. A small but significant adverse disparity is also observed for Cape Verdeans in this sector.
b. Specifications 2 and 3 - the Full Model Including Massachusetts-Specific Interaction Terms
Next, we turn to Specifications 2 and 3 in Tables 4.1 through 4.3. In each of these Tables, Specification 2 is the basic regression model with a set of interaction terms added, designed to test whether minorities and women in the MASSMA differ significantly from those elsewhere in the U.S. economy.
Specification 2 in Table 4.1, for the economy as a whole, shows a -36.0 percent wage and salary difference which estimates the direct effect of being African American in 2010–2014, as well as a statistically significant 3.3 percent wage and salary decrement that captures the indirect effect of residing in the MASSMA and being African American. That is, wages and salaries for African Americans in the MASSMA, on average, were 36.0 percent lower than for African Americans in the nation as a whole and 39.3 percent lower (-36.0 percent minus 3.3 percent) than for nonminority males in the MASSMA. Similarly for Hispanics, there is a statistically significant 7.0 percent wage and salary decrement associated with residing in the MASSMA, resulting in an overall disparity of 34.1 percent. For Asians/Pacific Islanders, there is a statistically significant 2.2 percent wage and salary decrement associated with residing in the MASSMA, resulting in an overall disparity of 20.5 percent. For Native Americans, there is a statistically significant 18.5 percent wage and salary increment associated with residing in the MASSMA, resulting in an overall disparity of 16.0 percent. For Cape Verdeans, there is a statistically significant 3.2 percent wage and salary increment associated with residing in the MASSMA, resulting in an overall advantage of 3.2 percent. For persons reporting multiple races, there is a statistically significant 5.9 percent wage and salary decrement associated with residing in the MASSMA, resulting in an overall disparity of 33.9 percent. For nonminority women, there is a statistically significant 1.1 percent wage and salary increment associated with residing in the MASSMA, leading to an overall disparity of 29.6 percent.

Market-Based Disparities in Business Formation and Business Owner Earnings
NERA Economic Consulting
71
Specification 3 simply repeats Specification 2, dropping any MASSMA interactions that are not statistically significant. In Table 4.1, Specifications 2 and 3 are identical, since all the local interaction terms are statistically significant. The net result of Specification 3 in Table 4.1 is evidence of large, adverse, and statistically significant wage disparities for African Americans, Hispanics, Asians/Pacific Islanders, Native Americans, persons reporting multiple races, and nonminority women consistent with the presence of discrimination in these markets.
Specification 2 in Table 4.2, for the Construction and Design sector, shows a -34.7 percent wage and salary difference which estimates the direct effect of being African American in 2010–2014, as well as a statistically significant 4.5 percent wage and salary increment that captures the indirect effect of residing in the MASSMA and being African American, resulting in an overall disparity of 30.2 percent. Similarly for Hispanics, there is a statistically significant 8.4 percent wage and salary decrement associated with residing in the MASSMA, resulting in an overall disparity of 30.9 percent. For Asians/Pacific Islanders, there is a statistically significant 2.8 percent wage and salary increment associated with residing in the MASSMA, resulting in an overall disparity of 11.2 percent. For Native Americans, there is a statistically significant 28.9 percent wage and salary increment associated with residing in the MASSMA, resulting in an overall disparity of 7.8 percent. For Cape Verdeans, there is a statistically significant 37.4 percent wage and salary decrement associated with residing in the MASSMA, resulting in an overall advantage of 11.3 percent. For persons reporting multiple races, there is a statistically significant 34.7 percent wage and salary decrement associated with residing in the MASSMA, resulting in an overall disparity of 56.8 percent. For nonminority women, there is a statistically significant 22.5 percent wage and salary decrement associated with residing in the MASSMA, leading to an overall disparity of 51.8 percent.
In Table 4.2, just as in Table 4.1, Specifications 2 and 3 are identical, since all the local interaction terms are statistically significant. The net result of Specification 3 in Table 4.2 is evidence of large, adverse, and statistically significant wage disparities for African Americans, Hispanics, Asians/Pacific Islanders, Native Americans, Cape Verdeans, persons reporting multiple races, and for nonminority women consistent with the presence of discrimination in these markets.
Specification 2 in Table 4.3, for the Goods and Services sector, shows a -41.0 percent wage and salary difference which estimates the direct effect of being African American in 2010–2014, as well as a statistically significant 4.5 percent wage and salary decrement that captures the indirect effect of residing in the MASSMA and being African American, resulting in an overall disparity of 45.5 percent. For Hispanics, there is a statistically significant 9.0 percent wage and salary decrement associated with residing in the MASSMA, resulting in an overall disparity of 42.3 percent. For Asians/Pacific Islanders, there is a statistically significant 1.0 percent wage and salary increment associated with residing in the MASSMA, resulting in an overall disparity of 18.6 percent. For Native Americans, there is a statistically significant 13.3 percent wage and salary increment associated with residing in the MASSMA, resulting in an overall disparity of 27.0 percent. For Cape Verdeans, there is a statistically significant 5.3 percent wage and salary increment associated with residing in the MASSMA, resulting in an overall advantage of 4.0 percent. For persons reporting multiple races, there is a statistically significant 8.4 percent wage and salary decrement associated with residing in the MASSMA, resulting in an overall disparity of 41.1 percent. For nonminority women, there is a statistically significant 0.8 percent wage and

Market-Based Disparities in Business Formation and Business Owner Earnings
NERA Economic Consulting
72
salary increment associated with residing in the MASSMA, leading to an overall disparity of 34.3 percent.
In Table 4.3, just as in Tables 4.1 and 4.2, Specifications 2 and 3 are identical, since all the local interaction terms are statistically significant. The net result of Specification 3 in Table 4.3 is evidence of large, adverse, and statistically significant wage disparities for African Americans, Hispanics, Asians/Pacific Islanders, Native Americans, Cape Verdeans, persons reporting multiple races, and for nonminority women consistent with the presence of discrimination in these markets.

Market-Based Disparities in Business Formation and Business Owner Earnings
NERA Economic Consulting
73
Table 4.1. Wage and Salary Earnings Regressions, All Industries, 2010-2014
Independent Variables Specification
(1) (2) (3)
African American -0.360
(1378.72) -0.360
(1366.86) -0.360
(1366.86)
Hispanic -0.272 (1070.62)
-0.271 (1057.63)
-0.271 (1057.63)
Asian/Pacific Islander -0.183 (484.33)
-0.183 (475.8)
-0.183 (475.8)
Native American -0.345 (324.66)
-0.345 (324.33)
-0.345 (324.33)
Cape Verdean -0.001 (0.19)
0.001 (0.15)
0.001 (0.15)
Two or more races -0.281 (478.29)
-0.280 (469.68)
-0.280 (469.68)
Nonminority Female -0.306 (1552.80)
-0.307 (1535.20)
-0.307 (1535.20)
Age 0.192 (3666.40)
0.192 (3666.46)
0.192 (3666.46)
Age2 -0.002 (3137.26)
-0.002 (3137.34)
-0.002 (3137.34)
MASSMA 0.245 (230.79)
0.254 (185.87)
0.254 (185.87)
MASSMA*African American -0.033 (12.99)
-0.033 (12.99)
MASSMA*Hispanic -0.070 (34.23)
-0.070 (34.23)
MASSMA*Asian/Pacific Islander -0.022 (8.95)
-0.022 (8.95)
MASSMA*Native American 0.185 (9.71)
0.185 (9.71)
MASSMA*Cape Verdean 0.032 (3.24)
0.032 (3.24)
MASSMA*Two or more races -0.059 (14.12)
-0.059 (14.12)
MASSMA*Nonminority female 0.011 (7.91)
0.011 (7.91)
Education (16 categories) Yes Yes Yes Geography (51 categories) Yes Yes Yes Industry (88 categories) Yes Yes Yes
N 115,040,370 115,040,370 115,040,370 Adj. R2 .3734 .3734 .3734
Source: NERA calculations from the 2010-2014 ACS Public Use Microdata Sample. Notes: (1) See above, section B.3.(a)-(b) for a description of Specifications 1 through 3; (2) Universe is all private sector wage and salary workers between the ages of 16 and 64; (3) Reported number is the percentage difference in annual wages between a given group and nonminority men; (4) Number in parentheses is the absolute value of the associated t-statistic. Using a two-tailed test, t-statistics greater than 1.67 (1.99) (2.64) are statistically significant at a 90 (95) (99) percent confidence level; (5) Geography is defined based on place of residence; (6) “MASSMA” is shorthand for “Commonwealth of Massachusetts Market Area,” which includes the Commonwealth of Massachusetts; (7) “n/a” in Specification 3 means that the category was not included in the regression because it was not statistically significant in Specification 2, as described above in section B.3.b; (8) The “Yes” values next to the “Education,” “Geography” and “Industry” rows indicate that control variables were included in the regression specification for these factors.

Market-Based Disparities in Business Formation and Business Owner Earnings
NERA Economic Consulting
74
Table 4.2. Wage Earnings Regressions, Construction, Design and Related Industries, 2010-2014
Independent Variables Specification
(1) (2) (3)
African American -0.347
(297.59) -0.347
(295.94) -0.347
(295.94)
Hispanic -0.226 (285.1)
-0.225 (282.58)
-0.225 (282.58)
Asian/Pacific Islander -0.140 (72.91)
-0.140 (72.26)
-0.140 (72.26)
Native American -0.366 (112.15)
-0.367 (112.14)
-0.367 (112.14)
Cape Verdean 0.119 (5.19)
0.487 (12.07)
0.487 (12.07)
Two or more races -0.224 (95.35)
-0.221 (92.43)
-0.221 (92.43)
Nonminority Female -0.294 (315.19)
-0.293 (310.01)
-0.293 (310.01)
Age 0.140 (715.03)
0.140 (714.99)
0.140 (714.99)
Age2 -0.001 (608.38)
-0.001 (608.35)
-0.001 (608.35)
MASSMA 0.239 (64.67)
0.257 (63.30)
0.257 (63.30)
MASSMA*African American 0.045 (3.54)
0.045 (3.54)
MASSMA*Hispanic -0.084 (11.12)
-0.084 (11.12)
MASSMA*Asian/Pacific Islander 0.028 (2.12)
0.028 (2.12)
MASSMA*Native American 0.289 (4.88)
0.289 (4.88)
MASSMA*Cape Verdean -0.374 (10.48)
-0.374 (10.48)
MASSMA*Two or more races -0.093 (6.53)
-0.093 (6.53)
MASSMA*Nonminority female -0.048 (7.27)
-0.048 (7.27)
Education (16 categories) Yes Yes Yes Geography (51 categories) Yes Yes Yes Industry (88 categories) Yes Yes Yes
N 8,805,206 8,805,206 8,805,206 Adj. R2 .2066 .2067 .2067
Source and Notes: See Table 4.1.

Market-Based Disparities in Business Formation and Business Owner Earnings
NERA Economic Consulting
75
Table 4.3. Wage Earnings Regressions, Goods and Services Industries, 2010-2014
Independent Variables Specification
(1) (2) (3)
African American -0.410
(1541.49) -0.410
(1526.84) -0.410
(1526.84)
Hispanic -0.334 (1245.13)
-0.333 (1229.06)
-0.333 (1229.06)
Asian/Pacific Islander -0.196 (490.17)
-0.196 (483.43)
-0.196 (483.43)
Native American -0.402 (357.15)
-0.403 (356.44)
-0.403 (356.44)
Cape Verdean -0.013 (2.52)
-0.013 (1.61)
-0.013 (1.61)
Two or more races -0.329 (531.64)
-0.327 (521.70)
-0.327 (521.70)
Nonminority Female -0.351 (1795.66)
-0.351 (1772.31)
-0.351 (1772.31)
Age 0.229 (4050.69)
0.229 (4050.76)
0.229 (4050.76)
Age2 -0.002 (3439.96)
-0.002 (3440.04)
-0.002 (3440.04)
MASSMA 0.245 (211.25)
0.258 (168.93)
0.258 (168.93)
MASSMA*African American -0.045 (16.93)
-0.045 (16.93)
MASSMA*Hispanic -0.090 (40.90)
-0.090 (40.90)
MASSMA*Asian/Pacific Islander 0.010 (3.81)
0.010 (3.81)
MASSMA*Native American 0.133 (6.41)
0.133 (6.41)
MASSMA*Cape Verdean 0.053 (4.90)
0.053 (4.90)
MASSMA*Two or more races -0.084 (18.77)
-0.084 (18.77)
MASSMA*Nonminority female 0.008 (5.26)
0.008 (5.26)
Education (16 categories) Yes Yes Yes Geography (51 categories) Yes Yes Yes Industry (88 categories) Yes Yes Yes
N 106,235,164 106,235,164 106,235,164 Adj. R2 .3189 .3189 .3189
Source and Notes: See Table 4.1.

Market-Based Disparities in Business Formation and Business Owner Earnings
NERA Economic Consulting
76
Tables 4.4, 4.5 and 4.6 provide comparable results for Portuguese wage and salary workers compared to non-Portuguese nonminority male wage and salary workers.72
Table 4.4 shows that, for the economy as a whole, Portuguese wage and salary workers earned 16.8 percent less than non-Portuguese nonminority male wage and salary workers. When a local interaction term is included in Specifications 2 and 3, we find that Portuguese wage and salary workers in the MASSMA experienced an additional 6.5 percent wage and salary decrement to their earnings, for an overall disparity of 22.2 percent. All of these differences are statistically significant.
Table 4.4. Wage Earnings Regressions, All Industries, 2010-2014
Independent Variables Specification
(1) (2) (3)
Portuguese -0.168
(169.48) -0.157
(139.48) -0.157
(139.48)
Age 0.219 (2477.99)
0.219 (2478.10)
0.219 (2478.10)
Age2 -0.002 (2123.23)
-0.002 (2123.34)
-0.002 (2123.34)
MASSMA 0.196 (121.55)
0.206 (124.16)
0.206 (124.16)
MASSMA*Portuguese -0.065 (25.36)
-0.065 (25.36)
Education (16 categories) Yes Yes Yes Geography (51 categories) Yes Yes Yes Industry (88 categories) Yes Yes Yes
N 40,279,717 40,279,717 40,279,717 Adj. R2 .4030 .4030 .4030
Source and Notes: See Table 4.1.
Table 4.5, for the Construction and Design sector, shows that Portuguese wage and salary workers earned 4.2 percent less than non-Portuguese nonminority male wage and salary workers. When the local interaction term is included in Specifications 2 and 3, it shows that Portuguese wage and salary workers in the MASSMA experienced an additional 1.6 percent wage and salary decrement, for an overall disparity of 5.4 percent. All of these differences are statistically significant.
72 In this chapter, “Portuguese” is defined using three different measurements in the ACS. If a person reported
Ancestry from either Portugal or Brazil, they were counted as Portuguese. If a person’s reported place of birth was either Portugal or Brazil, they were counted as Portuguese. Finally, if a person’s language that was reported spoken at home was Portuguese, they were counted as Portuguese. Due to the inclusion of the language measure, it was not possible to completely separate Brazilians from other persons with Portuguese ancestry.

Market-Based Disparities in Business Formation and Business Owner Earnings
NERA Economic Consulting
77
Table 4.5. Wage Earnings Regressions, Construction, Design and Related Industries, 2010-2014
Independent Variables Specification
(1) (2) (3)
Portuguese -0.042 (12.87)
-0.038 (10.24)
-0.038 (10.24)
Age 0.155 (605.38)
0.155 (605.38)
0.155 (605.38)
Age2 -0.001 (515.81)
-0.001 (515.81)
-0.001 (515.81)
MASSMA 0.216 (49.03)
0.218 (48.30)
0.218 (48.30)
MASSMA* Portuguese -0.016 (2.14)
-0.016 (2.14)
Education (16 categories) Yes Yes Yes Geography (51 categories) Yes Yes Yes Industry (88 categories) Yes Yes Yes
N 5,105,560 5,105,560 5,105,560 Adj. R2 .2012 .2012 .2012
Source and Notes: See Table 4.1.
Table 4.6, for the Goods and Services sector, shows that Portuguese wage and salary workers earned 22.5 percent less than nonminority male non-Portuguese wage and salary workers. When the local interaction term is included in Specifications 2 and 3, it shows that Portuguese wage and salary workers in the MASSMA experienced an additional 10.7 percent wage and salary decrement, for an overall disparity of 31.3 percent. All of these differences are statistically significant as well.
Table 4.6. Wage Earnings Regressions, Goods and Services Industries, 2010-2014
Independent Variables Specification
(1) (2) (3)
Portuguese -0.225
(209.86) -0.206
(170.04) -0.206
(170.04)
Age 0.265 (2695.78)
0.265 (2695.96)
0.265 (2695.96)
Age2 -0.002 (2289.91)
-0.002 (2290.09)
-0.002 (2290.09)
MASSMA 0.190 (103.96)
0.207 (109.67)
0.207 (109.67)
MASSMA* Portuguese -0.107 (37.76)
-0.107 (37.76)
Education (16 categories) Yes Yes Yes Geography (51 categories) Yes Yes Yes Industry (88 categories) Yes Yes Yes
N 35,174,922 35,174,922 35,174,922 Adj. R2 .3565 .3565 .3565
Source and Notes: See Table 4.1.
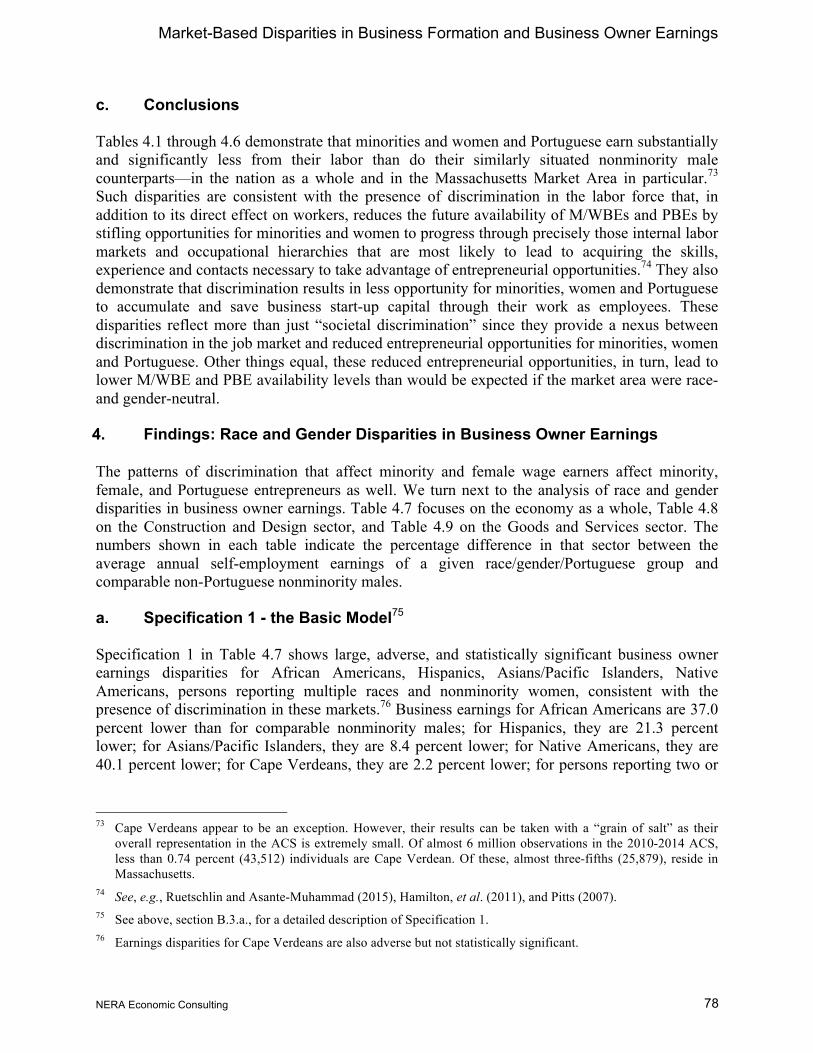
Market-Based Disparities in Business Formation and Business Owner Earnings
NERA Economic Consulting
78
c. Conclusions
Tables 4.1 through 4.6 demonstrate that minorities and women and Portuguese earn substantially and significantly less from their labor than do their similarly situated nonminority male counterparts—in the nation as a whole and in the Massachusetts Market Area in particular.73 Such disparities are consistent with the presence of discrimination in the labor force that, in addition to its direct effect on workers, reduces the future availability of M/WBEs and PBEs by stifling opportunities for minorities and women to progress through precisely those internal labor markets and occupational hierarchies that are most likely to lead to acquiring the skills, experience and contacts necessary to take advantage of entrepreneurial opportunities.74 They also demonstrate that discrimination results in less opportunity for minorities, women and Portuguese to accumulate and save business start-up capital through their work as employees. These disparities reflect more than just “societal discrimination” since they provide a nexus between discrimination in the job market and reduced entrepreneurial opportunities for minorities, women and Portuguese. Other things equal, these reduced entrepreneurial opportunities, in turn, lead to lower M/WBE and PBE availability levels than would be expected if the market area were race- and gender-neutral.
4. Findings: Race and Gender Disparities in Business Owner Earnings
The patterns of discrimination that affect minority and female wage earners affect minority, female, and Portuguese entrepreneurs as well. We turn next to the analysis of race and gender disparities in business owner earnings. Table 4.7 focuses on the economy as a whole, Table 4.8 on the Construction and Design sector, and Table 4.9 on the Goods and Services sector. The numbers shown in each table indicate the percentage difference in that sector between the average annual self-employment earnings of a given race/gender/Portuguese group and comparable non-Portuguese nonminority males.
a. Specification 1 - the Basic Model75
Specification 1 in Table 4.7 shows large, adverse, and statistically significant business owner earnings disparities for African Americans, Hispanics, Asians/Pacific Islanders, Native Americans, persons reporting multiple races and nonminority women, consistent with the presence of discrimination in these markets.76 Business earnings for African Americans are 37.0 percent lower than for comparable nonminority males; for Hispanics, they are 21.3 percent lower; for Asians/Pacific Islanders, they are 8.4 percent lower; for Native Americans, they are 40.1 percent lower; for Cape Verdeans, they are 2.2 percent lower; for persons reporting two or
73 Cape Verdeans appear to be an exception. However, their results can be taken with a “grain of salt” as their
overall representation in the ACS is extremely small. Of almost 6 million observations in the 2010-2014 ACS, less than 0.74 percent (43,512) individuals are Cape Verdean. Of these, almost three-fifths (25,879), reside in Massachusetts.
74 See, e.g., Ruetschlin and Asante-Muhammad (2015), Hamilton, et al. (2011), and Pitts (2007). 75 See above, section B.3.a., for a detailed description of Specification 1. 76 Earnings disparities for Cape Verdeans are also adverse but not statistically significant.
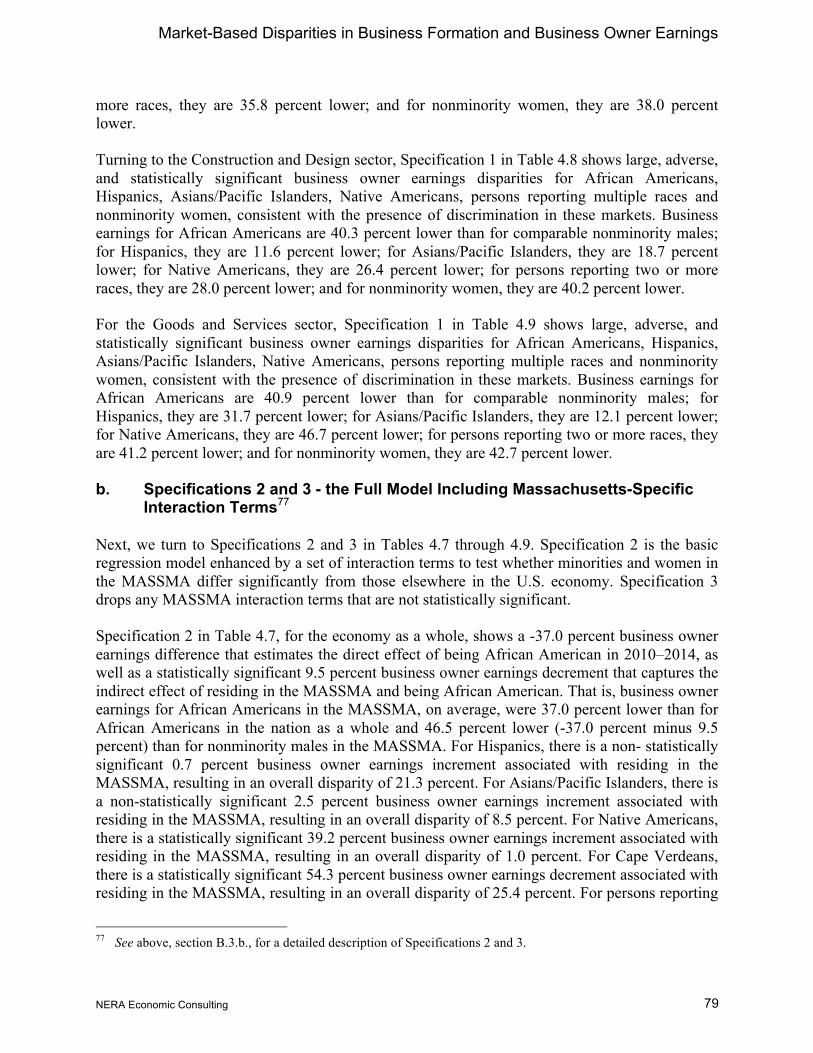
Market-Based Disparities in Business Formation and Business Owner Earnings
NERA Economic Consulting
79
more races, they are 35.8 percent lower; and for nonminority women, they are 38.0 percent lower.
Turning to the Construction and Design sector, Specification 1 in Table 4.8 shows large, adverse, and statistically significant business owner earnings disparities for African Americans, Hispanics, Asians/Pacific Islanders, Native Americans, persons reporting multiple races and nonminority women, consistent with the presence of discrimination in these markets. Business earnings for African Americans are 40.3 percent lower than for comparable nonminority males; for Hispanics, they are 11.6 percent lower; for Asians/Pacific Islanders, they are 18.7 percent lower; for Native Americans, they are 26.4 percent lower; for persons reporting two or more races, they are 28.0 percent lower; and for nonminority women, they are 40.2 percent lower.
For the Goods and Services sector, Specification 1 in Table 4.9 shows large, adverse, and statistically significant business owner earnings disparities for African Americans, Hispanics, Asians/Pacific Islanders, Native Americans, persons reporting multiple races and nonminority women, consistent with the presence of discrimination in these markets. Business earnings for African Americans are 40.9 percent lower than for comparable nonminority males; for Hispanics, they are 31.7 percent lower; for Asians/Pacific Islanders, they are 12.1 percent lower; for Native Americans, they are 46.7 percent lower; for persons reporting two or more races, they are 41.2 percent lower; and for nonminority women, they are 42.7 percent lower.
b. Specifications 2 and 3 - the Full Model Including Massachusetts-Specific Interaction Terms77
Next, we turn to Specifications 2 and 3 in Tables 4.7 through 4.9. Specification 2 is the basic regression model enhanced by a set of interaction terms to test whether minorities and women in the MASSMA differ significantly from those elsewhere in the U.S. economy. Specification 3 drops any MASSMA interaction terms that are not statistically significant.
Specification 2 in Table 4.7, for the economy as a whole, shows a -37.0 percent business owner earnings difference that estimates the direct effect of being African American in 2010–2014, as well as a statistically significant 9.5 percent business owner earnings decrement that captures the indirect effect of residing in the MASSMA and being African American. That is, business owner earnings for African Americans in the MASSMA, on average, were 37.0 percent lower than for African Americans in the nation as a whole and 46.5 percent lower (-37.0 percent minus 9.5 percent) than for nonminority males in the MASSMA. For Hispanics, there is a non- statistically significant 0.7 percent business owner earnings increment associated with residing in the MASSMA, resulting in an overall disparity of 21.3 percent. For Asians/Pacific Islanders, there is a non-statistically significant 2.5 percent business owner earnings increment associated with residing in the MASSMA, resulting in an overall disparity of 8.5 percent. For Native Americans, there is a statistically significant 39.2 percent business owner earnings increment associated with residing in the MASSMA, resulting in an overall disparity of 1.0 percent. For Cape Verdeans, there is a statistically significant 54.3 percent business owner earnings decrement associated with residing in the MASSMA, resulting in an overall disparity of 25.4 percent. For persons reporting
77 See above, section B.3.b., for a detailed description of Specifications 2 and 3.

Market-Based Disparities in Business Formation and Business Owner Earnings
NERA Economic Consulting
80
multiple races, there is a statistically significant 30.6 percent business owner earnings increment associated with residing in the MASSMA, resulting in an overall disparity of 5.6 percent. For nonminority women, there is a statistically significant 3.8 percent business owner earnings increment associated with residing in the MASSMA, leading to an overall disparity of 34.3 percent.
Specification 3 simply repeats Specification 2, dropping any MASSMA interactions that are not statistically significant. In Table 4.7, Specifications 2 and 3 differ in that the local interaction term for Hispanics and Asians/Pacific Islanders is not significant. The net result of Specification 3 in Table 4.7 is evidence of large, adverse, and statistically significant wage disparities for African Americans, Hispanics, Asians/Pacific Islanders, Native Americans, Cape Verdeans, and nonminority women consistent with the presence of discrimination in these markets.
Specification 2 in Table 4.8, for the Construction and Design sector, shows a -40.4 percent business owner earnings difference which estimates the direct effect of being African American in 2010–2014, as well as a statistically significant 27.3 percent business owner earnings increment that captures the indirect effect of residing in the MASSMA and being African American, resulting in an overall disparity of 13.1 percent. For Hispanics, there is a non-statistically significant 5.6 percent business owner earnings increment associated with residing in the MASSMA, resulting in an overall disparity of 11.6 percent.78 For Asians/Pacific Islanders, there is a non-statistically significant 5.3 percent business owner earnings increment associated with residing in the MASSMA, resulting in an overall disparity of 18.8 percent. For Native Americans, there is a non-statistically significant 15.5 percent business owner earnings increment associated with residing in the MASSMA, resulting in an overall disparity of 26.5 percent. For Cape Verdeans, there is a non-statistically significant 14.0 percent business owner earnings decrement associated with residing in the MASSMA, resulting in an overall disparity of 6.9 percent. For persons reporting multiple races, there is a statistically significant 47.5 percent business owner earnings increment associated with residing in the MASSMA, resulting in an overall advantage of 18.8 percent. For nonminority women, there is a statistically significant 15.4 percent business owner earnings decrement associated with residing in the MASSMA, leading to an overall disparity of 55.3 percent.
In Table 4.8, Specification 3 differs from Specification 2 since the local interaction terms for Hispanics, Asians/Pacific Islanders, Native Americans, and Cape Verdeans, are not statistically significant. The net result of Specification 3 in Table 4.8 is evidence of large, adverse, and statistically significant business owner earnings disparities for African Americans, Hispanics, Asians/Pacific Islanders, Native Americans, Cape Verdeans, and for nonminority women consistent with the presence of discrimination in these markets.
Specification 2 in Table 4.9, for the Goods and Services sector, shows a -40.9 percent business owner earnings difference which estimates the direct effect of being African American in 2010–2014, as well as a statistically significant 8.2 percent business owner earnings decrement that captures the indirect effect of residing in the MASSMA and being African American, resulting in
78 The statistical significance threshold for local interaction effects from Specification 2 to be included in
Specification 3 was set at 95 percent confidence.

Market-Based Disparities in Business Formation and Business Owner Earnings
NERA Economic Consulting
81
an overall disparity of 49.1 percent. For Hispanics, there is a non-statistically significant 3.1 percent business owner earnings increment associated with residing in the MASSMA, resulting in an overall disparity of 31.7 percent. For Asians/Pacific Islanders, there is a non-statistically significant 3.7 percent business owner earnings increment associated with residing in the MASSMA, resulting in an overall disparity of 12.1 percent. For Native Americans, there is a statistically significant 42.7 percent business owner earnings increment associated with residing in the MASSMA, resulting in an overall disparity of 4.2 percent. For Cape Verdeans, there is a statistically significant 51.8 percent business owner earnings decrement associated with residing in the MASSMA, resulting in an overall disparity of 25.2 percent. For persons reporting multiple races, there is a statistically significant 19.6 percent business owner earnings increment associated with residing in the MASSMA, resulting in an overall disparity of 21.9 percent. For nonminority women, there is a statistically significant 7.0 percent business owner earnings increment associated with residing in the MASSMA, leading to an overall disparity of 35.8 percent.
In Table 4.9, Specification 3 differs from Specification 2 since the local interaction terms for Hispanics and Asians/Pacific Islanders are not statistically significant. The net result of Specification 3 in Table 4.9 is evidence of large, adverse, and statistically significant business owner earnings disparities for African Americans, Hispanics, Asians/Pacific Islanders, Native Americans, Cape Verdeans, and for nonminority women consistent with the presence of discrimination in these markets.

Market-Based Disparities in Business Formation and Business Owner Earnings
NERA Economic Consulting
82
Table 4.7. Business Owner Earnings Regressions, All Industries, 2010-2014
Independent Variables Specification
(1) (2) (3)
African American -0.370
(205.26) -0.370
(203.75) -0.370
(203.78)
Hispanic -0.213 (134.33)
-0.213 (133.66)
-0.213 (134.36)
Asian/Pacific Islander -0.084 (34.89)
-0.085 (34.77)
-0.084 (34.92)
Native American -0.401 (65.70)
-0.402 (65.81)
-0.402 (65.81)
Cape Verdean -0.022 (0.49)
0.289 (4.37)
0.289 (4.37)
Two or more races -0.358 (109.49)
-0.362 (109.77)
-0.362 (109.76)
Nonminority Female -0.380 (346.06)
-0.381 (342.78)
-0.381 (342.94)
Age 0.173 (511.62)
0.173 (511.55)
0.173 (511.55)
Age2 -0.002 (443.64)
-0.002 (443.56)
-0.002 (443.56)
MASSMA 0.253 (39.08)
0.232 (31.00)
0.236 (32.92)
MASSMA*African American -0.095 (4.86)
-0.098 (5.01)
MASSMA*Hispanic 0.007 (0.49) n/a
MASSMA*Asian/Pacific Islander 0.025 (1.47) n/a
MASSMA*Native American 0.392 (3.75)
0.388 (3.73)
MASSMA*Cape Verdean -0.543 (8.28)
-0.543 (8.28)
MASSMA*Two or more races 0.306
(10.61) 0.303
(10.54)
MASSMA*Nonminority female 0.038 (4.96)
0.035 (4.79)
Education (16 categories) Yes Yes Yes Geography (51 categories) Yes Yes Yes Industry (88 categories) Yes Yes Yes
N 10,720,989 10,720,989 10,720,989 Adj. R2 .1266 .1266 .1266
Source: NERA calculations from the 2010-2014 ACS Public Use Microdata Sample. Notes: (1) See above, section B.4.(a)-(b) for a description of Specifications 1 through 3; (2) Universe is all persons in the private sector with positive business earnings between the ages of 16 and 64; (3) Reported number is the percentage difference in annual business earnings between a given group and nonminority men; (4) Number in parentheses is the absolute value of the associated t-statistic. Using a two-tailed test, t-statistics greater than 1.67 (1.99) (2.64) are statistically significant at a 90 (95) (99) percent confidence level; (5) Geography is defined based on place of residence; (6) “MASSMA” is shorthand for “Commonwealth of Massachusetts Market Area,” which includes the Commonwealth of Massachusetts; (7) “n/a” in Specification 3 means that the category was not included in the regression because it was not statistically significant in Specification 2, as described above in section B.4.b.

Market-Based Disparities in Business Formation and Business Owner Earnings
NERA Economic Consulting
83
Table 4.8. Business Owner Earnings Regressions, Construction, Design and Related Industries, 2010-2014
Independent Variables Specification
(1) (2) (3)
African American -0.403 (93.66)
-0.404 (93.62)
-0.404 (93.6)
Hispanic -0.116 (36.65)
-0.116 (36.63)
-0.115 (36.62)
Asian/Pacific Islander -0.187 (24.59)
-0.188 (24.45)
-0.187 (24.61)
Native American -0.264 (19.28)
-0.265 (19.29)
-0.264 (19.28)
Cape Verdean 0.009 (0.06)
-0.069 (0.29)
-0.148 (1.02)
Two or more races -0.280 (33.97)
-0.287 (34.58)
-0.287 (34.55)
Nonminority female -0.402 (95.89)
-0.399 (93.95)
-0.399 (93.93)
Age 0.126 (160.11)
0.126 (160.13)
0.126 (160.14)
Age2 -0.001 (144.83)
-0.001 (144.84)
-0.001 (144.84)
MASSMA 0.332 (25.25)
0.325 (23.83)
0.331 (24.72)
MASSMA*African American 0.273 (4.20)
0.263 (4.09)
MASSMA*Hispanic 0.056 (1.79) n/a
MASSMA*Asian/Pacific Islander 0.053 (0.99) n/a
MASSMA*Native American 0.155 (0.61) n/a
MASSMA*Cape Verdean -0.140 (0.48) n/a
MASSMA*Two or more races 0.475 (6.52)
-0.404 (93.6)
MASSMA*Nonminority Female -0.154 (5.04)
-0.115 (36.62)
Education (16 categories) Yes Yes Yes Geography (51 categories) Yes Yes Yes Industry (88 categories) Yes Yes Yes
N 1,770,260 1,770,260 1,770,260 Adj. R2 .0405 .0405 .0405
Source and Notes: See Table 4.4.

Market-Based Disparities in Business Formation and Business Owner Earnings
NERA Economic Consulting
84
Table 4.9. Business Owner Earnings Regressions, Goods and Services Industries, 2010-2014
Independent Variables Specification
(1) (2) (3)
African American -0.409
(211.53) -0.409
(210.04) -0.409
(210.05)
Hispanic -0.317 (185.23)
-0.317 (184.36)
-0.317 (185.31)
Asian/Pacific Islander -0.121 (47.59)
-0.121 (47.40)
-0.121 (47.61)
Native American -0.467 (69.40)
-0.469 (69.49)
-0.468 (69.48)
Cape Verdean -0.020 (0.40)
0.266 (3.78)
0.266 (3.78)
Two or more races -0.412 (116.77)
-0.415 (116.24)
-0.415 (116.21)
Nonminority female -0.427 (398.33)
-0.428 (394.24)
-0.428 (394.55)
Age 0.196 (509.76)
0.196 (509.70)
0.196 (509.70)
Age2 -0.002 (434.91)
-0.002 (434.85)
-0.002 (434.85)
MASSMA 0.216 (28.92)
0.178 (19.91)
0.186 (22.02)
MASSMA*African American -0.082 (3.76)
-0.089 (4.09)
MASSMA*Hispanic 0.031 (1.76) n/a
MASSMA*Asian/Pacific Islander 0.037 (1.93) n/a
MASSMA*Native American 0.427 (3.63)
0.417 (3.56)
MASSMA*Cape Verdean -0.518 (7.03)
-0.518 (7.03)
MASSMA*Two or more races 0.196 (6.28)
0.188 (6.07)
MASSMA*Nonminority Female 0.070 (7.83)
0.063 (7.44)
Education (16 categories) Yes Yes Yes Geography (51 categories) Yes Yes Yes Industry (88 categories) Yes Yes Yes
N 8,950,729 8,950,729 8,950,729 Adj. R2 .0863 .0863 .0863
Source and Notes: See Table 4.7.

Market-Based Disparities in Business Formation and Business Owner Earnings
NERA Economic Consulting
85
Tables 4.10, 4.11 and 4.12 provide comparable results for Portuguese business owner earnings compared to non-Portuguese nonminority male business owner earnings.
Table 4.10 shows that, for the economy as a whole, Portuguese business owners earned 7.6 percent less than non-Portuguese nonminority male business owners. When a local interaction term is included in Specifications 2 and 3, we find that Portuguese business owners in the MASSMA experienced a 4.4 percent increment to their earnings, for an overall disparity of 3.9 percent. All of these differences are statistically significant.
Table 4.10. Annual Business Owner Earnings Regressions, All Industries, 2010-2014
Independent Variables Specification
(1) (2) (3)
Portuguese -0.076 (13.82)
-0.083 (13.88)
-0.083 (13.88)
Age 0.185 (342.03)
0.185 (341.99)
0.185 (341.99)
Age2 -0.002 (300.96)
-0.002 (300.92)
-0.002 (300.92)
MASSMA 0.220 (24.31)
0.213 (23.16)
0.213 (23.16)
MASSMA* Portuguese 0.044 (2.99)
0.044 (2.99)
Education (16 categories) Yes Yes Yes Geography (51 categories) Yes Yes Yes Industry (88 categories) Yes Yes Yes
N 4,798,543 4,798,543 4,798,543 Adj. R2 .1158 .1158 .1158
Source and Notes: See Table 4.7.
Table 4.11, for the Construction and Design sector, shows that Portuguese business owners earned 2.2 percent more than non-Portuguese nonminority male business owners. When the local interaction term is included in Specifications 2, it shows that Portuguese business owners in the MASSMA experienced a 4.0 percent business owner earnings decrement, but that this decrement is not statistically significant.

Market-Based Disparities in Business Formation and Business Owner Earnings
NERA Economic Consulting
86
Table 4.11. Business Owner Earnings Regressions, Construction, Design and Related Industries, 2010-2014
Independent Variables Specification
(1) (2) (3)
Portuguese 0.022 (1.89)
0.031 (2.34)
0.022 (1.89)
Age 0.133 (131.46)
0.133 (131.47)
0.133 (131.46)
Age2 -0.001 (120.34)
-0.001 (120.35)
-0.001 (120.34)
MASSMA 0.297 (20.01)
0.302 (19.96)
0.297 (20.01)
MASSMA* Portuguese -0.040 (1.44)
Education (16 categories) Yes Yes Yes Geography (51 categories) Yes Yes Yes Industry (88 categories) Yes Yes Yes
N 1,194,344 1,194,344 1,194,344 Adj. R2 .0324 .0324 .0324
Source and Notes: See Table 4.7.
Table 4.12, for the Goods and Services sector, shows that Portuguese business owners earned 18.8 percent less than nonminority male non-Portuguese business owners. When the local interaction term is included in Specification 2, it shows that Portuguese business owners in the MASSMA experienced a 4.3 percent business owner earnings increment, for an overall disparity of 15.1 percent. All of these differences are statistically significant.
Table 4.12. Business Owner Earnings Regressions, Goods and Services Industries, 2010-2014
Independent Variables Specification
(1) (2) (3)
Portuguese -0.188 (31.78)
-0.194 (30.06)
-0.194 (30.06)
Age 0.210 (318.50)
0.210 (318.47)
0.210 (318.47)
Age2 -0.002 (270.96)
-0.002 (270.93)
-0.002 (270.93)
MASSMA 0.151 (13.38)
0.144 (12.53)
0.144 (12.53)
MASSMA* Portuguese 0.043 (2.37)
0.043 (2.37)
Education (16 categories) Yes Yes Yes Geography (51 categories) Yes Yes Yes Industry (88 categories) Yes Yes Yes
N 3,604,199 3,604,199 3,604,199 Adj. R2 .0663 .0663 .0663
Source and Notes: See Table 4.7.

Market-Based Disparities in Business Formation and Business Owner Earnings
NERA Economic Consulting
87
c. Conclusions
As was the case for wage and salary earners, minority, female, and Portuguese entrepreneurs earn substantially and significantly less from their efforts than similarly situated nonminority male entrepreneurs. This is true, in general, in the Massachusetts Market Area and in the nation as a whole. These disparities are consistent with the presence of discrimination in commercial markets that adversely affects M/WBEs and PBEs. Other things equal, if minorities, women, and Portuguese are prevented by discrimination from earning remuneration from their entrepreneurial efforts comparable to that of similarly situated nonminority males, then capital reinvestment and growth rates may slow, business failure rates may increase and, as demonstrated in the next section, business formation rates may decrease. Combined, these phenomena result in lower M/WBE and PBE availability levels than would be observed in a race- and gender-neutral market area, since discrimination depresses business owner earnings for minority, female and Portuguese entrepreneurs. Business owner earnings, however, are often directly related to whether an owner has the capital to reinvest (firm size), how long a firm survives (firm age), and how much money a firm takes in (individual firm revenues). These observations illustrate why employment size, years in business, and individual firm revenues are especially inappropriate factors to consider when attempting to determine if discrimination has diminished opportunities for M/WBEs and PBEs.79
C. Race and Gender Disparities in Business Formation
As discussed in the two previous sections, discrimination that affects the wages and entrepreneurial earnings of minorities, women and persons of Portuguese descent will ultimately affect the number of businesses formed by these groups as well. In this section, we turn to an analysis of race and gender disparities in business formation.80 We compare self-employment rates by race and gender to determine whether minorities or women are as likely to become entrepreneurs as are similarly situated nonminority males. We find that in most cases they are not as likely to do so, and that minority and female business formation rates would be substantially and significantly higher if markets operated in a race- and gender-neutral manner.
Discrimination in the labor market, symptoms of which are evidenced in Section B.3 above, might cause wage and salary workers to turn to self-employment in hopes of encountering less discrimination from customers and suppliers than from employers and co-workers. Other things equal, and assuming minority, female and Portuguese workers did not believe that discrimination pervaded commercial markets as well, this would lead minority, female and Portuguese business formation rates to be higher than would otherwise be expected.
On the other hand, discrimination in the labor market may prevent minorities, women and Portuguese from acquiring the very skills, experience, and positions that are often observed among those who leave the ranks of the wage and salary earners to start their own businesses.
79 For more on this topic, see “Understanding Capacity,” in Chapter III, section B.5, supra. 80 We use the phrases “business formation rates” and “self-employment rates” interchangeably in this Study.

Market-Based Disparities in Business Formation and Business Owner Earnings
NERA Economic Consulting
88
Many construction contracting concerns have been formed by individuals who were once employed as foremen or in related positions for other contractors, fewer by those who were employed instead as laborers. Moreover, discrimination in wages and salaries earned in labor markets inhibits the accumulation of capital necessary for business formation. Similarly, discrimination in commercial capital and credit markets, as well as asset and wealth distribution, prevents minorities and women from acquiring the financial credit and capital that are so often prerequisites to starting or expanding a business. Other things being equal, these phenomena would lead minority, female and Portuguese business formation rates to be lower than otherwise would be expected.
Further, discrimination by commercial customers and suppliers against M/WBEs and PBEs, symptoms of which are evidenced in Section B.4 above and elsewhere, operates to increase input prices and lower output prices for M/WBEs and PBEs. This discrimination leads to higher rates of failure for some minority-, women-, and Portuguese-owned firms, lower rates of profitability and growth for others, and prevents some minorities, women and Portuguese from ever starting businesses at all.81 All of these phenomena, other things equal, would contribute directly to relatively lower observed rates of minority, female and Portuguese self-employment.
1. Methods and Data
To see if minorities, women or Portuguese are as likely to be business owners as are comparable nonminority males, we use a statistical technique known as Probit regression. Probit regression is used to determine the relationship between a categorical variable—one that can be characterized in terms of a “yes” or a “no” response as opposed to a continuous number—and a set of characteristics that are related to the outcome of the categorical variable. Probit regression produces estimates of the extent to which each characteristic is positively or negatively related to the likelihood that the categorical variable will be a yes or no. For example, Probit regression is used by statisticians to estimate the likelihood that an individual participates in the labor force, retires this year, or contracts a particular disease—these are all variables that can be categorized by a response of “yes” (for example, she is in the labor force) or “no” (for example, she is not in the labor force)—and the extent to which certain factors are positively or negatively related to the likelihood (for example, the more education she has, the more likely that she is in the labor force). Probit regression is one of several techniques that can be used to examine qualitative outcomes. Generally, other techniques such as Logit regression yield similar results.82 In the present case, Probit regression is used to examine the relationship between the choice to own a business (yes or no) and the other demographic and socioeconomic characteristics in our basic model. The underlying data for this section is once again the 2010-2014 ACS PUMS.
2. Findings: Race and Gender Disparities in Business Formation
As a reference point, Tables 4.13 and 4.14 summarize rates of business ownership during 2010-2014 by race, gender, and Portuguese status. A noticeable feature of both tables is how much
81 See also the materials cited at fn. 59 supra. 82 For a detailed discussion, see G.S. Maddala (1983). Probit analysis is performed here using the “dprobit”
command in the statistical program STATA.

Market-Based Disparities in Business Formation and Business Owner Earnings
NERA Economic Consulting
89
higher, on average, rates are for nonminority males than for most other groups. Table 4.13, for example, shows an 8.77 percentage point difference between the overall self-employment rate of African Americans and nonminority males in the MASSMA (13.10 – 4.33 = 8.77). As shown in the rightmost column of Table 4.13, this 8.77 percentage point gap translates into an African American business formation rate in the MASSMA that is 66.9 percent lower than the nonminority male business formation rate (i.e., 4.33 – 13.10 ÷ 13.10 ≈ -66.9%). For Hispanics, the business formation rate is 55.6 percent lower. For Asians/Pacific Islanders, it is 50.6 percent lower. For Native Americans, it is 48.5 percent lower. For Cape Verdeans, it is 73.7 percent lower. For persons reporting multiple races, it is 39.5 percent lower. For minorities as a group, it is 55.5 percent lower. For nonminority women, it is 39.8 percent lower; and for M/WBEs overall, it is 46.0 percent lower.
Table 4.14 provides similar information for the Construction and Design sector and the Goods and Services sector. Without exception, self-employment rates for minorities and women in these sectors are vastly lower than for nonminority males.
Tables 4.15 and 4.16 provide similar information for Portuguese business owners. Here as well, Portuguese self-employment rates are lower than for nonminority, non-Portuguese males, especially in the Construction and Design sector.
Table 4.13. Self-Employment Rates in 2010-2014 for Selected Race and Gender Groups: United States and the Massachusetts Market Area, All Industries
Race/Gender U.S. (%)
Massachusetts Market Area
(%)
Percent Difference from
Nonminority Male in
Column (2) (1) (2) (3) African American 5.68 4.33 -66.9 Hispanic 8.88 5.81 -55.6 Asian/Pacific Islander 10.48 6.47 -50.6 Native American 8.77 6.75 -48.5 Cape Verdean 4.07 3.45 -73.7 Two or more races 8.99 7.93 -39.5 Minority 8.16 5.83 -55.5 Nonminority female 8.65 7.89 -39.8 M/WBE 8.38 7.07 -46.0 Nonminority male 13.71 13.10
Source: NERA calculations from the 2010-2014 ACS Public Use Microdata Sample.

Market-Based Disparities in Business Formation and Business Owner Earnings
NERA Economic Consulting
90
Table 4.14. Self-Employment Rates in 2010-2014 for Selected Race and Gender Groups: United States and the Massachusetts Market Area, Construction and Design Sector and Goods and Services Sector
Race/Gender U.S. (%)
Massachusetts Market Area
(%)
Percent Difference from
Nonminority Male in
Column (2) (1) (2) (3)
Construction and Design Sector
African American 18.04 12.45 -57.6 Hispanic 17.55 17.10 -41.8 Asian/Pacific Islander 17.80 15.55 -47.1 Native American 17.46 12.17 -58.6 Cape Verdean 7.30 7.96 -72.9 Two or more races 20.62 17.94 -38.9 Minority 17.77 15.99 -45.6 Nonminority female 15.06 11.50 -60.8 M/WBE 17.23 14.23 -51.5 Nonminority male 26.66 29.37
Goods and Services Sector African American 5.15 4.01 -61.4 Hispanic 7.71 5.04 -51.5 Asian/Pacific Islander 10.21 6.16 -40.7 Native American 7.75 6.08 -41.5 Cape Verdean 3.92 3.26 -68.6 Two or more races 8.16 7.10 -31.7 Minority 7.33 5.29 -49.1 Nonminority female 8.50 7.81 -24.8 M/WBE 7.88 6.82 -34.4 Nonminority male 11.56 10.39
Source: NERA calculations from the 2010-2014 ACS Public Use Microdata Sample. Note: Figures are rounded. Rounding was performed subsequent to any mathematical calculations.

Market-Based Disparities in Business Formation and Business Owner Earnings
NERA Economic Consulting
91
Table 4.15. Self-Employment Rates in 2010-2014 for Selected Race and Gender Groups: United States and the Massachusetts Market Area, All Industries
Race/Gender U.S. (%)
Massachusetts Market Area
(%)
Percent Difference from
Nonminority Male in
Column (2) (1) (2) (3) Portuguese 13.90 11.17 -14.7 Non-Portuguese 13.71 13.10
Source: NERA calculations from the 2010-2014 ACS Public Use Microdata Sample.
Table 4.16. Self-Employment Rates in 2010-2014 for Selected Race and Gender Groups: United States and the Massachusetts Market Area, Construction and Design Sector and Goods and Services Sector
Race/Gender U.S. (%)
Massachusetts Market Area
(%)
Percent Difference from
Nonminority Male in
Column (2) (1) (2) (3)
Construction and Design Sector
Portuguese 25.61 20.22 -31.2 Non-Portuguese 26.66 29.37
Goods and Services Sector Portuguese 12.40 9.85 -5.2 Non-Portuguese 11.56 10.39
Source: NERA calculations from the 2010-2014 ACS Public Use Microdata Sample. Note: Figures are rounded. Rounding was performed subsequent to any mathematical calculations.
There is no doubt that a portion of the group differences documented in Tables 4.13 and 4.14 are associated with differences in the distribution of individual productivity characteristics and preferences between minorities, women and nonminority males. It is well known, for example, that earnings tend to increase with labor market experience (i.e., age). It is also true that the propensity toward self-employment increases with labor market experience.83 Since most minority populations in the United States have a lower median age than the nonminority population, it is important to test whether the disparities in business ownership evidenced in Tables 4.13 and 4.14 can be explained by differences in the age distribution or in other factors such as education, geographic location or the industry preferences of minorities and nonminority women compared to nonminority males.
To do this, the remainder of this section presents a series of regression analyses that test whether large, adverse and statistically significant race and gender disparities for minorities and women remain when such other factors are held constant. Table 4.17 focuses on the economy as a whole
83 Wainwright (2000), p. 86.

Market-Based Disparities in Business Formation and Business Owner Earnings
NERA Economic Consulting
92
and Tables 4.18 and 4.19 focus on the Construction and Design sector and the Goods and Services sector, respectively. The numbers shown in each of these tables indicate the percentage point difference between the probability of business ownership for a given race/gender group compared to similarly situated nonminority males. Tables 4.20 through 4.22 provide comparable results for Portuguese business owners.
a. Specification 1 - the Basic Model84
Specification 1 in Table 4.17 shows large, adverse, and statistically significant business formation disparities for African Americans, Hispanics, Asians/Pacific Islanders, Native Americans, Cape Verdeans, persons reporting multiple races and nonminority women consistent with the presence of discrimination in these markets. Specification 1 in Tables 4.21 and 4.22 shows large, negative, and statistically significant business formation disparities for each of these groups in the Construction and Design sector as well as in the Goods and Services sector.
For Portuguese business owners, Specification 1 in Table 4.20 shows an adverse and statistically significant business formation disparity. Specification 1 in Tables 4.18 and 4.19 also shows adverse and statistically significant business formation disparities for Portuguese business owners in the Construction and Design sector as well as in the Goods and Services sector.
b. Specifications 2 and 3 - the Full Model Including Massachusetts-Specific Interaction Terms85
Several of the MASSMA interaction terms included in Specification 2 were significant. The final results are shown in Specification 3 for Tables 4.17 through 4.19 (and in Tables 4.20 through 4.22 for Portuguese business owners).
To summarize the economy-wide results for minorities and women (Table 4.17):
• For African Americans, business formation rates are 4.0 percentage points lower than what would be expected in a race- and gender-neutral market area.86
• For Hispanics, business formation rates are 3.4 percentage points lower than what would be expected in a race- and gender-neutral market area.
• For Asians/Pacific Islanders, business formation rates are 2.4 percentage points lower than what would be expected in a race- and gender-neutral market area.
84 See above, section C.2.a., for a detailed description of Specification 1. 85 See above, section C.2.b., for a detailed description of Specifications 2 and 3. 86 Recall that the net business formation rate is equal to the value of the direct coefficient (on the African American
indicator variable in this case) plus the value of the statistically significant coefficient on the MASSMA*African American interaction term. In this example, the -4.0 percent figure is the net result of the direct coefficient for African Americans, with a value of -3.5 percent, and the coefficient for African Americans interacted with the MASSMA indicator, which is negative 0.5 percent.

Market-Based Disparities in Business Formation and Business Owner Earnings
NERA Economic Consulting
93
• For Native Americans, business formation rates are 4.6 percentage points lower than what would be expected in a race- and gender-neutral market area.
• For Cape Verdeans, business formation rates are 2.3 percentage points lower than what would be expected in a race- and gender-neutral market area.
• For persons reporting multiple races, business formation rates are 1.7 percentage points lower than what would be expected in a race- and gender-neutral market area.
• For nonminority women, business formation rates are 2.7 percentage points lower than what would be expected in a race- and gender-neutral market area.
To summarize the Construction and Design sector results for minorities and women (Table 4.18):
• For African Americans, business formation rates are 14.7 percentage points lower than what would be expected in a race- and gender-neutral market area.
• For Hispanics, business formation rates are 8.3 percentage points lower than what would be expected in a race- and gender-neutral market area.
• For Asians/Pacific Islanders, business formation rates are 8.5 percentage points lower than what would be expected in a race- and gender-neutral market area.
• For Native Americans, business formation rates are 19.8 percentage points lower than what would be expected in a race- and gender-neutral market area.
• For Cape Verdeans, business formation rates are 13.3 percentage points lower than what would be expected in a race- and gender-neutral market area.
• For persons reporting multiple races, business formation rates are 4.2 percentage points lower than what would be expected in a race- and gender-neutral market area.
• For nonminority women, business formation rates are 14.5 percentage points lower than what would be expected in a race- and gender-neutral market area.
To summarize the Goods and Services sector results for minorities and women (Table 4.19):
• For African Americans, business formation rates are 5.0 percentage points lower than what would be expected in a race- and gender-neutral market area.
• For Hispanics, business formation rates are 3.5 percentage points lower than what would be expected in a race- and gender-neutral market area.
• For Asians/Pacific Islanders, business formation rates are 3.1 percentage points lower than what would be expected in a race- and gender-neutral market area.

Market-Based Disparities in Business Formation and Business Owner Earnings
NERA Economic Consulting
94
• For Native Americans, business formation rates are 2.7 percentage points lower than what would be expected in a race- and gender-neutral market area.
• For Cape Verdeans, business formation rates are 4.0 percentage points lower than what would be expected in a race- and gender-neutral market area.
• For persons reporting multiple races, business formation rates are 0.3 percentage points lower than what would be expected in a race- and gender-neutral market area.
• For nonminority women, business formation rates are 2.0 percentage points lower than what would be expected in a race- and gender-neutral market area.
To summarize the economy-wide results for Portuguese business owners (Table 4.20):
• For Portuguese, business formation rates are 1.4 percentage points lower than what would be expected in a race- and gender-neutral market area.
To summarize for the Construction and Design sector results for Portuguese business owners (Table 4.21):
• For Portuguese, business formation rates are 6.4 percentage points lower than what would be expected in a race- and gender-neutral market area.
To summarize for the Goods and Services sector results for Portuguese business owners (Table 4.22):
• For Portuguese, business formation rates are 0.6 percentage points higher than what would be expected in a race- and gender-neutral market area.

Market-Based Disparities in Business Formation and Business Owner Earnings
NERA Economic Consulting
95
Table 4.17. Business Formation Regressions, All Industries, 2010-2014
Independent Variables Specification
(1) (2) (3)
African American -0.035
(555.53) -0.035
(550.91) -0.035
(550.91)
Hispanic -0.029 (523.42)
-0.029 (518.54)
-0.029 (518.54)
Asian/Pacific Islander -0.012 (143.20)
-0.012 (138.28)
-0.012 (138.28)
Native American -0.025 (104.66)
-0.024 (103.81)
-0.024 (103.81)
Cape Verdean -0.019 (16.31)
-0.016 (8.59)
-0.016 (8.59)
Two or more races -0.013 (92.81)
-0.013 (91.03)
-0.013 (91.03)
Nonminority Female -0.024 (493.73)
-0.024 (486.40)
-0.024 (486.40)
Age 0.008 (692.77)
0.008 (692.76)
0.008 (692.76)
Age2 -0.000 (453.40)
-0.000 (453.42)
-0.000 (453.42)
MASSMA -0.005 (26.23)
-0.003 (12.17)
-0.003 (12.17)
MASSMA*African American -0.005 (7.87)
-0.005 (7.87)
MASSMA*Hispanic -0.005 (10.39)
-0.005 (10.39)
MASSMA*Asian/Pacific Islander -0.012 (22.16)
-0.012 (22.16)
MASSMA*Native American -0.022 (6.03)
-0.022 (6.03)
MASSMA*Cape Verdean -0.007 (2.47)
-0.007 (2.47)
MASSMA*Two or more races -0.004 (3.90)
-0.004 (3.90)
MASSMA*Nonminority Female -0.003 (10.87)
-0.003 (10.87)
Education (16 categories) Yes Yes Yes Geography (51 categories) Yes Yes Yes Industry (25 categories) Yes Yes Yes
N 1.3e+08 1.3e+08 1.3e+08 Pseudo R2 .2049 .2049 .2049
Source: NERA calculations from the 2010-2014 ACS Public Use Microdata Sample. Notes: (1) See above, section C.2.(a)-(b) for a description of Specifications 1 through 3; (2) Universe is all private sector labor force participants between the ages of 16 and 64; (3) Reported number represents the percentage point probability difference in business ownership rates between a given group and nonminority men, evaluated at the mean business ownership rate for the estimation sample; (4) Number in parentheses is the absolute value of the associated z-statistic. Using a two-tailed test, z-statistics greater than 1.67 (1.99) (2.64) are statistically significant at a 90 (95) (99) percent confidence level; (5) Geography is defined based on place of residence; (6) “MASSMA” is shorthand for “Commonwealth of Massachusetts Market Area,” which includes the Commonwealth of Massachusetts; (7) “n/a” in Specification 3 indicates that the category was not included in the regression because it was not statistically significant in Specification 2, as described above in section C.2.b.

Market-Based Disparities in Business Formation and Business Owner Earnings
NERA Economic Consulting
96
Table 4.18. Business Formation Regressions, Construction, Design and Related Industries, 2010-2014
Independent Variables Specification
(1) (2) (3)
African American -0.075
(141.16) -0.075
(138.62) -0.075
(138.65)
Hispanic -0.058 (162.33)
-0.058 (160.42)
-0.058 (160.42)
Asian/Pacific Islander -0.048 (55.92)
-0.047 (54.11)
-0.047 (54.11)
Native American -0.076 (50.03)
-0.075 (49.22)
-0.075 (49.22)
Cape Verdean -0.138 (14.46)
-0.143 (10.04)
-0.133 (13.41)
Two or more races -0.025 (23.08)
-0.024 (22.25)
-0.024 (22.26)
Nonminority Female -0.094 (210.37)
-0.093 (205.31)
-0.093 (205.31)
Age 0.019 (234.73)
0.019 (234.75)
0.019 (234.75)
Age2 -0.000 (145.78)
-0.000 (145.81)
-0.000 (145.81)
MASSMA 0.012 (8.94)
0.023 (15.43)
0.023 (15.43)
MASSMA*African American -0.072 (13.99)
-0.072 (13.94)
MASSMA*Hispanic -0.025 (7.59)
-0.025 (7.58)
MASSMA*Asian/Pacific Islander -0.038 (6.79)
-0.038 (6.80)
MASSMA*Native American -0.123 (6.63)
-0.123 (6.63)
MASSMA*Cape Verdean 0.044 (1.55) n/a
MASSMA*Two or more races -0.020 (3.10)
-0.018 (2.88)
MASSMA*Nonminority female -0.052 (16.72)
-0.052 (16.72)
Education (16 categories) Yes Yes Yes Geography (51 categories) Yes Yes Yes Industry (25 categories) Yes Yes Yes
N 10,715,693 10,715,693 10,715,693 Pseudo R2 .0710 .0710 .0710
Source and Notes: See Table 4.17.

Market-Based Disparities in Business Formation and Business Owner Earnings
NERA Economic Consulting
97
Table 4.19. Business Formation Regressions, Goods and Services Industries, 2010-2014
Independent Variables Specification
(1) (2) (3)
African American -0.046
(586.54) -0.046
(582.02) -0.046
(582.02)
Hispanic -0.029 (379.65)
-0.029 (375.8)
-0.029 (375.8)
Asian/Pacific Islander -0.017 (164.16)
-0.016 (159.05)
-0.016 (159.04)
Native American -0.027 (82.67)
-0.027 (82.54)
-0.027 (82.65)
Cape Verdean -0.025 (16.91)
-0.014 (6.31)
-0.015 (6.31)
Two or more races -0.015 (81.36)
-0.015 (81.66)
-0.015 (81.65)
Nonminority Female -0.023 (406.80)
-0.023 (402.68)
-0.023 (402.68)
Age 0.009 (626.53)
0.009 (626.50)
0.009 (626.50)
Age2 -0.000 (414.3)
-0.000 (414.29)
-0.000 (414.29)
MASSMA -0.003 (11.48)
-0.003 (7.77)
-0.003 (7.71)
MASSMA*African American -0.004 (5.18)
-0.004 (5.20)
MASSMA*Hispanic -0.006 (9.51)
-0.006 (9.54)
MASSMA*Asian/Pacific Islander -0.015 (21.36)
-0.015 (21.39)
MASSMA*Native American 0.008 (1.53) n/a
MASSMA*Cape Verdean -0.025 (8.19)
-0.025 (8.19)
MASSMA*Two or more races 0.012 (9.16)
0.012 (9.14)
MASSMA*Nonminority female 0.003 (6.62)
0.003 (6.57)
Education (16 categories) Yes Yes Yes Geography (51 categories) Yes Yes Yes Industry (25 categories) Yes Yes Yes
N 5440429 5440429 5440429 Pseudo R2 .0531 .0531 .0531
Source and Notes: See Table 4.17.

Market-Based Disparities in Business Formation and Business Owner Earnings
NERA Economic Consulting
98
Table 4.20. Business Formation Regressions, All Industries, 2010-2014
Independent Variables Specification
(1) (2) (3)
Portuguese -0.005 (16.23)
-0.003 (8.22)
-0.003 (8.22)
Age 0.011 (441.43)
0.011 (441.49)
0.011 (441.49)
Age2 -0.000 (275.86)
-0.000 (275.92)
-0.000 (275.92)
MASSMA -0.007 (18.49)
-0.006 (14.82)
-0.006 (14.82)
MASSMA* Portuguese -0.011 (15.43)
-0.011 (15.43)
Education (16 categories) Yes Yes Yes Geography (51 categories) Yes Yes Yes Industry (25 categories) Yes Yes Yes
N 44,736,142 44,736,142 44,736,142 Pseudo R2 .1992 .1992 .1992
Source and Notes: See Table 4.17.
Table 4.21. Business Formation Regressions, Construction, Design and Related Industries, 2010-2014
Independent Variables Specification
(1) (2) (3)
Portuguese -0.009 (6.44)
0.009 (5.31)
0.009 (5.31)
Age 0.025 (219.90)
0.025 (219.95)
0.025 (219.95)
Age2 -0.000 (145.18)
-0.000 (145.25)
-0.000 (145.25)
MASSMA 0.016 (9.12)
0.025 (13.69)
0.025 (13.69)
MASSMA* Portuguese -0.073 (23.25)
-0.073 (23.25)
Education (16 categories) Yes Yes Yes Geography (51 categories) Yes Yes Yes Industry (25 categories) Yes Yes Yes
N 6,326,400 6,326,400 6,326,400 Pseudo R2 .0695 .0695 .0695
Source and Notes: See Table 4.17.

Market-Based Disparities in Business Formation and Business Owner Earnings
NERA Economic Consulting
99
Table 4.22. Business Formation Regressions, Goods and Services Industries, 2010-2014
Independent Variables Specification
(1) (2) (3)
Portuguese 0.010
(29.07) 0.011
(28.63) 0.011
(28.63)
Age 0.010 (356.61)
0.010 (356.62)
0.010 (356.62)
Age2 -0.000 (210.68)
-0.000 (210.7)
-0.000 (210.7)
MASSMA -0.006 (13.03)
-0.006 (11.51)
-0.006 (11.51)
MASSMA* Portuguese -0.005 (5.34)
-0.005 (5.34)
Education (16 categories) Yes Yes Yes Geography (51 categories) Yes Yes Yes Industry (25 categories) Yes Yes Yes
N 38,410,611 38,410,611 38,410,611 Pseudo R2 .0556 .0556 .0556
Source and Notes: See Table 4.17.
c. Conclusions
This section has demonstrated that, for African Americans, Hispanics, Asians/Pacific Islanders, Native Americans, Cape Verdeans, persons reporting multiple races, minorities as a group, nonminority women, and minorities and women as a group, observed business formation rates in the overall economy of the Massachusetts Market Area are substantially and statistically significantly lower than those that would be expected to be observed if commercial markets operated in a race- and gender-neutral manner. The same is true in the Construction and Design sector and in the Goods and Services sector.
Portuguese business owners also have statistically significantly lower business formation rates, both in the economy as a whole and in the Construction and Design sector. In the Goods and Services sector, Portuguese business formation rates are slightly higher than expected.
Minorities, women and Portuguese, in general, are substantially and significantly less likely to own their own businesses than would be expected based upon their observable demographic characteristics including age, education, geographic location, industry and trends over time. Moreover, as demonstrated in previous sections, these groups also suffer substantial and significant earnings disadvantages relative to comparable nonminority (and non-Portuguese) males whether they work as wage and salary employees or as entrepreneurs. These findings are consistent with results that would be observed in a discriminatory market area.

Market-Based Disparities in Business Formation and Business Owner Earnings
NERA Economic Consulting
100
D. Expected Business Formation Rates—Implications for Current M/WBE Availability87
If discrimination is present in the market area, business formation rates may be lower than they would be if discrimination were not present. In this section we describe how we estimate what the “expected” business formation rate for M/WBEs and PBEs would be in market free of the negative impact of discrimination.
In Table 4.23, the Probit regression results for the Massachusetts Market Area from Tables 4.17, 4.18 and 4.19 for the overall economy, the Construction and Design sector, and the Goods and Services sector, respectively, are combined with weighted average self-employment rates by race and gender from the 2010-2014 ACS PUMS (Tables 4.13 and 4.14) to determine the disparity between observed business formation rates and expected business formation rates in a race- and gender-neutral market area. These figures appear in column (3) of each panel in Table 4.23. Comparable figures for Portuguese appear in Table 4.24.
The observed business formation rate in the MASSMA for African Americans in the Construction and Design sector, for example, is 12.45 percent (see middle panel of Table 4.23, top row). According to the regression specification underlying Table 4.18, however, that rate would be 27.15 percent, or 118.1 percent higher, in a race- and gender-neutral market area. Put differently, the disparity ratio of the actual business formation rate to the expected business formation rate for African Americans in Construction in the MASSMA is 45.86.
Disparities are large and statistically significant for African Americans, Hispanics, Asians/Pacific Islanders, Native Americans, Cape Verdeans, persons reporting multiple races, minorities as a group, nonminority women, and M/WBEs as a group.
In the economy as a whole, the largest potential business formation disparities observed are for African Americans (51.98), followed in descending order of severity, by Native Americans (59.47), Cape Verdeans (60.00), minorities as a group (61.05), Hispanics (63.08), M/WBEs as a group (65.89), Asians/Pacific Islanders (72.94), nonminority females (74.50), and persons reporting multiple races (82.35).
In the Construction and Design sector, the largest disparities observed are for Cape Verdeans (37.44), followed in descending order by Native Americans (38.07), nonminority females (44.23), African Americans (45.86), M/WBEs as a group (52.80), minorities as a group (61.17), Asians/Pacific Islanders (64.66), Hispanics (67.32), and persons reporting multiple races (81.03).
In the Goods and Services sector, the largest disparities observed are for African Americans (44.51), followed in descending order by Cape Verdeans (44.90), Hispanics (59.02), minorities as a group (63.35), Asians/Pacific Islanders (66.52), M/WBEs as a group (68.82), Native Americans (69.25), nonminority females (79.61), and persons reporting multiple races (95.95).
87 In addition to quantifying how discrimination may have depressed current measured levels of M/WBE
availability, this exercise also addresses the requirements of 49 C.F.R. 26.45 (“Step 2”) for the United States Department of Transportation Disadvantaged Business Enterprise Program.

Market-Based Disparities in Business Formation and Business Owner Earnings
NERA Economic Consulting
101
For PBEs, in the economy as a whole, the disparity ratio is 88.86. In Construction and Design, the disparity ratio is 75.96. In Goods and Services, no potential business formation disparity is observed.
Given the substantial disparities observed in all sectors of the economy for virtually all presumptively disadvantaged groups, goal-setters might consider adjusting baseline estimates of M/WBE and PBE availability upward to partly account for the depressing effects of discrimination on current measured levels of availability. The business formation rate disparities documented in Table 4.23 for M/WBEs and Table 4.24 for PBEs can be combined with the estimates of current M/WBE availability documented in Table 3.15 and current PBE availability documented in Table 3.16 to provide estimates of expected availability. Such estimates appear below in Table 6.9 for M/WBEs and Table 6.10 for PBEs. Expected M/WBE availability exceeds actual current M/WBE availability overall and in each major procurement category. The same is true for expected PBE availability.

Market-Based Disparities in Business Formation and Business Owner Earnings
NERA Economic Consulting
102
Table 4.23. Actual and Potential Business Formation Rates in the Massachusetts Market Area
Source: 2010-2014 ACS Public Use Microdata Sample. See Tables 4.17 through 4.19. Notes: (A) Figures are rounded. Rounding was performed subsequent to any mathematical calculations. (B) Figures in column (1) are average self-employment rates weighted using ACS population-based person weights, as also shown in Tables 4.13 and 4.14. (C) Figures in column (2), top, middle, and bottom panels, are derived by combining the figure in column (1) with the corresponding result from the regression reported in Table 4.17, 4.18 or 4.19, respectively. Minority and M/WBE figures were derived from similar regression analyses, not reported separately. (D) Column (3) is the figure in column (1) divided by the figure in column (2), with the result multiplied by 100. (E) An empty cell in the Disparity Ratio column indicates that no adverse disparity was observed for that category. (F) All disparity ratios are statistically significant at a 95 percent level of confidence or better.
Race/Gender
Business Formation
Rate (%)
Expected Business
Formation Rate (%)
Disparity Ratio
(1) (2) (3) All Industries
African American 4.33 8.33 51.98 Hispanic 5.81 9.21 63.08 Asian/Pacific Islander 6.47 8.87 72.94 Native American 6.75 11.35 59.47 Cape Verdean 3.45 5.75 60.00 Two or more races 7.93 9.63 82.35 Minority 5.83 9.55 61.05 Nonminority female 7.89 10.59 74.50 M/WBE 7.07 10.73 65.89
Construction and Design Sector African American 12.45 27.15 45.86 Hispanic 17.10 25.40 67.32 Asian/Pacific Islander 15.55 24.05 64.66 Native American 12.17 31.97 38.07 Cape Verdean 7.96 21.26 37.44 Two or more races 17.94 22.14 81.03 Minority 15.99 26.14 61.17 Nonminority female 11.50 26.00 44.23 M/WBE 14.23 26.95 52.80
Goods and Services Sector African American 4.01 9.01 44.51 Hispanic 5.04 8.54 59.02 Asian/Pacific Islander 6.16 9.26 66.52 Native American 6.08 8.78 69.25 Cape Verdean 3.26 7.26 44.90 Two or more races 7.10 7.40 95.95 Minority 5.29 8.35 63.35 Nonminority female 7.81 9.81 79.61 M/WBE 6.82 9.91 68.82

Market-Based Disparities in Business Formation and Business Owner Earnings
NERA Economic Consulting
103
Table 4.24. Actual and Potential Business Formation Rates in the Massachusetts Market Area
Race/Gender
Business Formation
Rate (%)
Expected Business
Formation Rate (%)
Disparity Ratio
(1) (2) (3) All Industries
Portuguese 11.17 12.57 88.86 Construction and Design Sector
Portuguese 20.22 26.62 75.96 Goods and Services Sector
Portuguese 9.85 9.25 Source: 2010-2014 ACS Public Use Microdata Sample. See Tables 4.20 through 4.22. Notes: (A) Figures are rounded. Rounding was performed subsequent to any mathematical calculations. (B) Figures in column (1) are average self-employment rates weighted using ACS population-based person weights, as also shown in Tables 4.15 and 4.16. (C) Figures in column (2), top, middle, and bottom panels, are derived by combining the figure in column (1) with the corresponding result from the regression reported in Table 4.20, 4.21 or 4.22, respectively. (D) Column (3) is the figure in column (1) divided by the figure in column (2), with the result multiplied by 100. (E) An empty cell in the Disparity Ratio column indicates that no adverse disparity was observed for that category.

Market-Based Disparities in Business Formation and Business Owner Earnings
NERA Economic Consulting
104
E. Evidence from the Survey of Business Owners
As a final check on the statistical findings in this chapter, we present evidence from a Census Bureau data collection effort dedicated to M/WBEs. The Census Bureau’s Survey of Business Owners and Self-Employed Persons (SBO), formerly known as the Survey of Minority- and Women-Owned Business Enterprises (SMWOBE), collects and disseminates data on the number, sales, employment, and payrolls of businesses owned by women and members of racial and ethnic minority groups.88 This survey has been conducted every five years since 1972 as part of the Economic Census program. Data from the 2012 SBO, the most recent available, were released in December 2015.
The SBO estimates are created by matching data collected from income tax returns by the Internal Revenue Service with Social Security Administration data on race and ethnicity, and supplementing this information using statistical sampling methods. The unique field for conducting this matching is the Social Security Number (SSN) or the Employer Identification Number (EIN), as reported on the tax return.
The SBO covers women and five groups of minorities: (1) African Americans, (2) Hispanics, (3) Asians, (4) Native Hawaiians and Pacific Islanders, and (5) American Indians and Alaskan Natives. Comparative information for nonminority male-owned firms is also included.89
The SBO provides aggregate estimates of the number of minority-owned and women-owned firms and their annual sales and receipts. The SBO distinguishes employer firms (i.e., firms with one or more paid employees) from nonemployer firms, and for the former also includes estimates of aggregate annual employment and payroll.
Compared to the ACS PUMS, the SBO is more limited in the scope of industrial and geographic detail it provides. Nonetheless, it contains a wealth of information on the character of minority and female business enterprise in the U.S as a whole as well as in the Commonwealth of Massachusetts Market Area (“MASSMA”). In the remainder of this section, we present SBO statistics for the United States as a whole and in the Commonwealth of Massachusetts and calculate disparity indices from them. We observe results in the SBO regarding disparities that are consistent with our findings above using the ACS PUMS.
Tables 4.25 and 4.26 contain data for all industries combined. Table 4.25 is for the U.S. as a whole, Table 4.26 is for the Commonwealth of Massachusetts. Panel A in these two tables summarizes the SBO results for each race and/or gender grouping. For example, Panel A of Table 4.25 shows a total of 27.18 million firms in the U.S. in 2012 (column 1) with overall sales and receipts of $11.964 trillion (column 2). Of these 27.18 million firms, 5.14 million had one or more employees (column 3) and these 5.14 million firms had overall sales and receipts of
88 The SBO does not provide data for persons of Portuguese or Cape Verdean ancestry. 89 In the ACS PUMS data, discussed above, the unit of analysis is the business owner, or self-employed person. In
the SBO data, the unit of analysis is the business rather than the business owner. Furthermore, unlike most other business statistics, including the other components of the Economic Census, the unit of analysis in the SBO is the firm, rather than the establishment.

Market-Based Disparities in Business Formation and Business Owner Earnings
NERA Economic Consulting
105
$10.965 trillion (column 4). Column (5) shows a total of 56.06 million employees on the payroll of these 5.14 million firms and a total annual payroll expense of $2.096 trillion (column 6).
The remaining rows in Panel A provide comparable statistics for nonminority male-owned, women-owned, and minority-owned firms. For example, Table 4.25 shows that there were 2.6 million African American-owned firms counted in the SBO, and that these 2.6 million firms registered $150.2 billion in sales and receipts. It also shows that 109,137 of these African American-owned firms had one or more employees, and that they employed a total of 975,052 workers with an annual payroll total of $27.69 billion.
Panel A of Table 4.26 provides comparable information for the MASSMA. The SBO counted 592,989 firms in the MASSMA, of which 199,210 were female-owned; 23,108 were African American-owned; 30,022 were Hispanic-owned; 33,875 were Asian-owned; 365 were Native Hawaiian- or Pacific Islander-owned; and 2,818 were Native American-owned.
Panel B in each Table converts the figures in Panel A to percentage distributions within each column. For example, Column (1) in Panel B of Table 4.14 shows that African American-owned firms were 3.90 percent of all firms in the MASSMA and female-owned firms were 33.59 percent. Additionally, 5.06 percent of firms were Hispanic-owned, 5.71 percent were Asian-owned, 0.06 percent were Native Hawaiian- or Pacific Islander-owned, and 0.48 percent were Native American-owned.
Column (2) in Panel B provides the same percentage distribution for overall sales and receipts. Table 4.26, for example, shows that although African American-owned firms were 3.90 percent of all firms in the MASSMA, they accounted for only 0.62 percent of all sales and receipts. Although female-owned firms accounted for 33.59 percent, they earned only 9.36 percent of all sales and receipts. For Hispanic-owned firms, the figures are 5.06 percent and 1.25 percent, respectively. For Asian-owned firms, they are 5.71 percent and 3.65 percent, respectively. For Native Hawaiian- or Pacific Islander-owned firms they are 0.06 percent and 0.02 percent, respectively. For Native American-owned firms, they are 0.48 percent and 0.18 percent, respectively. In contrast, the figures for nonminority male-owned firms are 54.08 percent and 80.83 percent, respectively.
Similar results are obtained when the survey results are restricted to firms with one or more paid employees. Column (3) in Table 4.26, for example, shows that although nonminority male-owned firms were 65.22 percent of all employer firms, they accounted for 82.18 percent of all employer firm sales and receipts. African American-owned firms, in contrast, were 1.08 percent of all employer firms, but they accounted for only 0.48 percent of all employer firm sales and receipts. Hispanic-owned firms were 2.08 percent of all employer firms, but they accounted for only 1.08 percent of all employer firm sales and receipts. Asian-owned firms were 6.82 percent of all employer firms, but they accounted for only 3.55 percent of all employer firm sales and receipts. Native Hawaiian- and Pacific Islander-owned firms were 0.02 percent of all employer firms but accounted for such a small fraction of all employer firm sales and receipts that the Census could not disclose it due to confidentiality restrictions. Native American-owned firms were 0.33 percent of all employer firms but accounted for only 0.17 percent of all employer firm sales and receipts. Finally, female-owned firms accounted for 18.94 percent of all employer firms, but earned only 8.25 percent of all employer firm sales and receipts.

Market-Based Disparities in Business Formation and Business Owner Earnings
NERA Economic Consulting
106
Table 4.25. Disparity Ratios from the 2012 Survey of Business Owners, United States, All Industries
Number of
Firms
Sales and Receipts ($000s)
Employer Firms
Sales and Receipts ($000s)
Employees Payroll ($000s)
(1) (2) (3) (4) (5) (6) Panel A. Levels All Firms 27,179,380 11,964,077,871 5,136,203 10,964,584,749 56,058,563 2,096,442,212 Nonminority Male 12,280,591 8,787,915,377 2,933,198 8,221,010,815 37,750,711 1,531,662,394 Female 9,878,397 1,419,834,295 1,035,655 1,190,586,438 8,431,614 263,720,252 African American 2,584,403 150,203,163 109,137 103,451,510 975,052 27,689,957 Hispanic 3,305,873 473,635,944 287,501 379,994,999 2,329,553 70,855,704 Asian 1,917,902 699,492,422 481,026 627,532,399 3,572,577 110,543,615 Native Hawaiian/Pac. Islander 54,749 8,136,445 4,706 6,469,957 39,001 1,430,591 Am. Indian & Alaska Native 272,919 38,838,125 26,179 31,654,165 208,178 6,994,509 Panel B. Column Percentages All Firms 100.00% 100.00% 100.00% 100.00% 100.00% 100.00% Nonminority Male 45.18% 73.45% 57.11% 74.98% 67.34% 73.06% Female 36.35% 11.87% 20.16% 10.86% 15.04% 12.58% African American 9.51% 1.26% 2.12% 0.94% 1.74% 1.32% Hispanic 12.16% 3.96% 5.60% 3.47% 4.16% 3.38% Asian 7.06% 5.85% 9.37% 5.72% 6.37% 5.27% Native Hawaiian/Pac. Islander 0.20% 0.07% 0.09% 0.06% 0.07% 0.07% Am. Indian & Alaska Native 1.00% 0.32% 0.51% 0.29% 0.37% 0.33% Panel C. Disparity Ratios (2) vs. (1) (4) vs. (3) (5) vs. (3) (6) vs. (3) Nonminority Male 162.56 131.29 117.92 127.93 Female 32.65 53.85 74.59 62.39 African American 13.20 44.40 81.86 62.16 Hispanic 32.55 61.91 74.24 60.38 Asian 82.85 61.11 68.05 56.30 Native Hawaiian/Pac. Islander 33.76 64.40 75.93 74.48 Am. Indian & Alaska Native 32.33 56.64 72.86 65.46
Source: NERA calculations using 2012 SBO. Notes: (A) Figures are rounded. Rounding was performed subsequent to any mathematical calculations. (B) Excludes publicly owned, foreign-owned, and not-for-profit firms. (C) “n/a” indicates that data were not disclosed due to confidentiality or other publication restrictions. Disparities between the fraction of firms that are minority- or women-owned and their fraction of sales and receipts in the MASSMA are observed for African Americans, Hispanics, Asians, Native Hawaiians and Pacific Islanders, Native Americans, and women, both for employer firms and nonemployer firms. The disparity indices are presented in Panel C of each table. Disparity indices of approximately 80 percent or less are consistent with business discrimination (0 percent being complete disparity and 100 percent being full parity). In the MASSMA (Table 4.26), the sales and receipts disparity indices (in columns 2 and 4) fall at or below the 80 percent threshold in 12 out of 12 instances.90 All of these disparity indices are statistically significant within a 95 percent confidence interval.
90 Although the disparity index is “n/a” for Native Hawaiian or Pacific Islander-owned employer firms due to
disclosure restrictions, it is highly likely that, absent the non-disclosure, this ratio would fall below the 80 percent threshold.

Market-Based Disparities in Business Formation and Business Owner Earnings
NERA Economic Consulting
107
Table 4.26. Disparity Ratios from the 2012 Survey of Business Owners, Commonwealth of Massachusetts, All Industries
Number of
Firms
Sales and Receipts ($000s)
Employer Firms
Sales and Receipts ($000s)
Employees Payroll ($000s)
(1) (2) (3) (4) (5) (6) Panel A. Levels All Firms 592,989 308,238,306 121,824 284,140,990 1,280,870 57,187,845 Nonminority Male 320,715 249,161,493 79,450 233,515,765 927,529 44,532,686 Female 199,210 28,855,145 23,074 23,447,974 178,196 6,030,065 African American 23,108 1,921,932 1,312 1,377,366 12,762 364,039 Hispanic 30,022 3,855,791 2,532 3,069,931 18,502 671,929 Asian 33,875 11,238,471 8,307 10,100,857 65,469 2,592,879 Native Hawaiian/Pac. Islander 365 46,489 26 n/a n/a n/a Am. Indian & Alaska Native 2,818 562,322 403 484,628 2,646 114,478 Panel B. Column Percentages All Firms 100.00% 100.00% 100.00% 100.00% 100.00% 100.00% Nonminority Male 54.08% 80.83% 65.22% 82.18% 72.41% 77.87% Female 33.59% 9.36% 18.94% 8.25% 13.91% 10.54% African American 3.90% 0.62% 1.08% 0.48% 1.00% 0.64% Hispanic 5.06% 1.25% 2.08% 1.08% 1.44% 1.17% Asian 5.71% 3.65% 6.82% 3.55% 5.11% 4.53% Native Hawaiian/Pac. Islander 0.06% 0.02% 0.02% n/a n/a n/a Am. Indian & Alaska Native 0.48% 0.18% 0.33% 0.17% 0.21% 0.20% Panel C. Disparity Ratios (2) vs. (1) (4) vs. (3) (5) vs. (3) (6) vs. (3) Nonminority Male 149.46 126.01 111.04 119.40 Female 27.87 43.57 73.45 55.67 African American 16.00 45.01 92.52 59.11 Hispanic 24.71 51.98 69.50 56.53 Asian 63.82 52.13 74.96 66.49 Native Hawaiian/Pac. Islander 24.50 n/a n/a n/a Am. Indian & Alaska Native 38.39 51.56 62.45 60.51
Source and Notes: See Table 4.25. Table 4.27 shows comparable SBO data for the Construction and Design sector in the U.S. as a whole. Here, large and adverse disparities are evident for African Americans, Hispanics, Asians, Native Hawaiians and Pacific Islanders, Native Americans, and women.91 For example, although African Americans account for 5.06 percent of all firms in the Construction and Design sector, they earned only 1.29 percent of all sales and receipts in that sector. Hispanics account for 11.09 percent of firms but only 4.30 percent of sales and receipts. For Asians, the figures are 5.21 percent and 4.00 percent, respectively. For Native Hawaiians and Pacific Islanders, the figures are 0.17 percent and 0.12 percent, respectively. For Native Americans, the figures are 0.98 percent and 0.51 percent, respectively. Finally, women account for 23.55 percent of all Construction and Design firms but earned only 11.15 percent of all sales and receipts.
91 There were just two exceptions: Asian-owned firms with paid employees (although this disparity index was
adverse it was not large) and Native Hawaiian and Pacific Islander-owned firms with paid employees.

Market-Based Disparities in Business Formation and Business Owner Earnings
NERA Economic Consulting
108
Among firms with paid employees, adverse disparities are observed for African Americans, Hispanics, Native Americans and women. Overall, disparities in this category are slightly less acute than among firms as a whole. However, they remain far larger than the comparable figure for nonminority male-owned firms. This is evident in that the fraction of employer firms compared to the fraction of all firms is far higher among nonminority males than among other race and gender groups. In Table 4.27, for example, nonminority males represent 60.30 percent of all firms but 67.41 percent of employer firms. For all other groups, the direction of this ratio is reversed. That is, each group’s fraction among employer firms is substantially smaller than its fraction among firms as a whole, whereas for nonminority males it is larger.
Table 4.27. Disparity Ratios from the 2012 Survey of Business Owners, United States, Construction and Design
Number of
Firms
Sales and Receipts ($000s)
Employer Firms
Sales and Receipts ($000s)
Employees Payroll ($000s)
(1) (2) (3) (4) (5) (6) Panel A. Levels All Firms 6,796,672 2,077,651,539 1,385,740 1,825,720,151 9,417,271 502,212,138 Nonminority Male 4,098,217 1,588,153,063 934,173 1,418,932,123 6,918,815 380,577,855 Female 1,600,294 231,672,089 219,948 187,668,757 1,210,435 58,325,262 African American 343,671 26,824,886 21,416 19,607,626 121,053 6,165,077 Hispanic 753,538 89,355,188 68,286 64,485,132 393,114 17,294,719 Asian 353,843 83,128,886 61,401 71,585,506 399,780 25,539,672 Native Hawaiian/Pac. Islander 11,843 2,439,922 1,324 2,018,181 8,483 494,869 Am. Indian & Alaska Native 66,935 10,569,706 8,463 8,317,526 47,582 2,116,501 Panel B. Column Percentages All Firms 100.00% 100.00% 100.00% 100.00% 100.00% 100.00% Nonminority Male 60.30% 76.44% 67.41% 77.72% 73.47% 75.78% Female 23.55% 11.15% 15.87% 10.28% 12.85% 11.61% African American 5.06% 1.29% 1.55% 1.07% 1.29% 1.23% Hispanic 11.09% 4.30% 4.93% 3.53% 4.17% 3.44% Asian 5.21% 4.00% 4.43% 3.92% 4.25% 5.09% Native Hawaiian/Pac. Islander 0.17% 0.12% 0.10% 0.11% 0.09% 0.10% Am. Indian & Alaska Native 0.98% 0.51% 0.61% 0.46% 0.51% 0.42% Panel C. Disparity Ratios (2) vs. (1) (4) vs. (3) (5) vs. (3) (6) vs. (3) Nonminority Male 126.77 115.29 108.98 112.41 Female 47.36 64.76 80.98 73.17 African American 25.53 69.49 83.18 79.43 Hispanic 38.79 71.68 84.71 69.88 Asian 76.85 88.49 95.81 114.77 Native Hawaiian/Pac. Islander 67.40 115.70 94.28 103.13 Am. Indian & Alaska Native 51.66 74.60 82.73 69.01
Source and Notes: See Table 4.25.
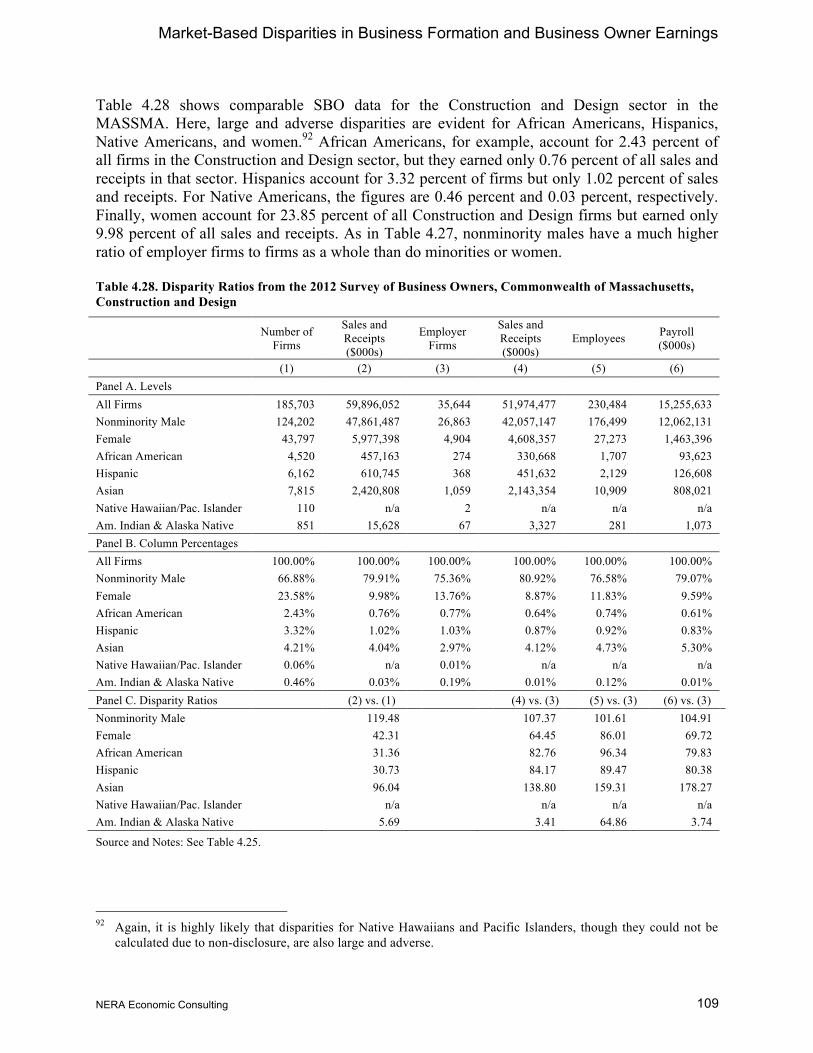
Market-Based Disparities in Business Formation and Business Owner Earnings
NERA Economic Consulting
109
Table 4.28 shows comparable SBO data for the Construction and Design sector in the MASSMA. Here, large and adverse disparities are evident for African Americans, Hispanics, Native Americans, and women.92 African Americans, for example, account for 2.43 percent of all firms in the Construction and Design sector, but they earned only 0.76 percent of all sales and receipts in that sector. Hispanics account for 3.32 percent of firms but only 1.02 percent of sales and receipts. For Native Americans, the figures are 0.46 percent and 0.03 percent, respectively. Finally, women account for 23.85 percent of all Construction and Design firms but earned only 9.98 percent of all sales and receipts. As in Table 4.27, nonminority males have a much higher ratio of employer firms to firms as a whole than do minorities or women.
Table 4.28. Disparity Ratios from the 2012 Survey of Business Owners, Commonwealth of Massachusetts, Construction and Design
Number of
Firms
Sales and Receipts ($000s)
Employer Firms
Sales and Receipts ($000s)
Employees Payroll ($000s)
(1) (2) (3) (4) (5) (6) Panel A. Levels All Firms 185,703 59,896,052 35,644 51,974,477 230,484 15,255,633 Nonminority Male 124,202 47,861,487 26,863 42,057,147 176,499 12,062,131 Female 43,797 5,977,398 4,904 4,608,357 27,273 1,463,396 African American 4,520 457,163 274 330,668 1,707 93,623 Hispanic 6,162 610,745 368 451,632 2,129 126,608 Asian 7,815 2,420,808 1,059 2,143,354 10,909 808,021 Native Hawaiian/Pac. Islander 110 n/a 2 n/a n/a n/a Am. Indian & Alaska Native 851 15,628 67 3,327 281 1,073 Panel B. Column Percentages All Firms 100.00% 100.00% 100.00% 100.00% 100.00% 100.00% Nonminority Male 66.88% 79.91% 75.36% 80.92% 76.58% 79.07% Female 23.58% 9.98% 13.76% 8.87% 11.83% 9.59% African American 2.43% 0.76% 0.77% 0.64% 0.74% 0.61% Hispanic 3.32% 1.02% 1.03% 0.87% 0.92% 0.83% Asian 4.21% 4.04% 2.97% 4.12% 4.73% 5.30% Native Hawaiian/Pac. Islander 0.06% n/a 0.01% n/a n/a n/a Am. Indian & Alaska Native 0.46% 0.03% 0.19% 0.01% 0.12% 0.01% Panel C. Disparity Ratios (2) vs. (1) (4) vs. (3) (5) vs. (3) (6) vs. (3) Nonminority Male 119.48 107.37 101.61 104.91 Female 42.31 64.45 86.01 69.72 African American 31.36 82.76 96.34 79.83 Hispanic 30.73 84.17 89.47 80.38 Asian 96.04 138.80 159.31 178.27 Native Hawaiian/Pac. Islander n/a n/a n/a n/a Am. Indian & Alaska Native 5.69 3.41 64.86 3.74
Source and Notes: See Table 4.25.
92 Again, it is highly likely that disparities for Native Hawaiians and Pacific Islanders, though they could not be
calculated due to non-disclosure, are also large and adverse.

Market-Based Disparities in Business Formation and Business Owner Earnings
NERA Economic Consulting
110
Table 4.29 shows comparable SBO data for the Goods and Services sector in the U.S. as a whole. Here, adverse disparities are evident for African Americans, Hispanics, Asians, Native Americans, Native Hawaiians and Pacific Islanders, and women. African Americans, for example, account for 10.99 percent of all firms in the Goods and Services sector, they earned only 1.25 percent of all sales and receipts in that sector. Hispanics account for 12.52 percent of firms but only 3.89 percent of sales and receipts. For Asians, the figures are 7.67 percent and 6.23 percent, respectively. For Native Hawaiians and Pacific Islanders, the figures are 0.21 percent and 0.06 percent, respectively. For Native Americans, the figures are 1.01 percent and 0.29 percent, respectively. Finally, women account for 40.61 percent of all Goods and Services firms but earned only 12.02 percent of all sales and receipts. Comparable, though slightly smaller, disparities are observed as well among firms with paid employees in the Goods and Services sector.93
Table 4.29. Disparity Ratios from the 2012 Survey of Business Owners, United States, Goods and Services
Number of
Firms
Sales and Receipts ($000s)
Employer Firms
Sales and Receipts ($000s)
Employees Payroll ($000s)
(1) (2) (3) (4) (5) (6) Panel A. Levels All Firms 20,382,708 9,886,426,332 3,750,463 9,138,864,598 46,641,292 1,594,230,074 Nonminority Male 8,182,374 7,199,762,314 1,999,025 6,802,078,692 30,831,896 1,151,084,539 Female 8,278,103 1,188,162,206 815,707 1,002,917,681 7,221,179 205,394,990 African American 2,240,732 123,378,277 87,721 83,843,884 853,999 21,524,880 Hispanic 2,552,335 384,280,756 219,215 315,509,867 1,936,439 53,560,985 Asian 1,564,059 616,363,536 419,625 555,946,893 3,172,797 85,003,943 Native Hawaiian/Pac. Islander 42,906 5,696,523 3,382 4,451,776 30,518 935,722 Am. Indian & Alaska Native 205,984 28,268,419 17,716 23,336,639 160,596 4,878,008 Panel B. Column Percentages All Firms 100.00% 100.00% 100.00% 100.00% 100.00% 100.00% Nonminority Male 40.14% 72.82% 53.30% 74.43% 66.10% 72.20% Female 40.61% 12.02% 21.75% 10.97% 15.48% 12.88% African American 10.99% 1.25% 2.34% 0.92% 1.83% 1.35% Hispanic 12.52% 3.89% 5.85% 3.45% 4.15% 3.36% Asian 7.67% 6.23% 11.19% 6.08% 6.80% 5.33% Native Hawaiian/Pac. Islander 0.21% 0.06% 0.09% 0.05% 0.07% 0.06% Am. Indian & Alaska Native 1.01% 0.29% 0.47% 0.26% 0.34% 0.31% Panel C. Disparity Ratios (2) vs. (1) (4) vs. (3) (5) vs. (3) (6) vs. (3) Nonminority Male 181.41 139.64 124.02 135.46 Female 29.59 50.46 71.18 59.24 African American 11.35 39.22 78.28 57.73 Hispanic 31.04 59.07 71.03 57.48 Asian 81.25 54.37 60.80 47.66 Native Hawaiian/Pac. Islander 27.37 54.02 72.56 65.09 Am. Indian & Alaska Native 28.29 54.06 72.89 64.78
Source and Notes: See Table 4.13.
93 The exception being Asian-owned firms, for which the disparity facing firms with paid employees is
substantially more acute than for Asian firms overall.

Market-Based Disparities in Business Formation and Business Owner Earnings
NERA Economic Consulting
111
Finally, Table 4.30 shows comparable results for the Goods and Services sector in the MASSMA. Among all firms in Goods and Services, adverse disparities are observed for African Americans, Hispanics, Asians, Native Americans and women.94 Among firms with paid employees, adverse disparities are observed for African Americans, Hispanics, Asians, Native Americans, and women.95 As in Table 4.29, nonminority males have a much higher ratio of employer firms to firms as a whole than do minorities or women.96 In the MASSMA Goods and Services sector, the sales and receipts disparity indices fall at or below the 80 percent threshold in 12 out of 12 cases.97 All of these disparity indices are statistically significant within a 95 percent confidence interval.
Table 4.30. Disparity Ratios from the 2012 Survey of Business Owners, Commonwealth of Massachusetts, Goods and Services
Number of
Firms
Sales and Receipts ($000s)
Employer Firms
Sales and Receipts ($000s)
Employees Payroll ($000s)
(1) (2) (3) (4) (5) (6) Panel A. Levels All Firms 407,286 248,342,254 86,180 232,166,513 1,050,386 41,932,212 Nonminority Male 196,513 201,300,006 52,587 191,458,618 751,030 32,470,555 Female 155,413 22,877,747 18,170 18,839,617 150,923 4,566,669 African American 18,588 1,464,769 1,038 1,046,698 11,055 270,416 Hispanic 23,860 3,245,046 2,164 2,618,299 16,373 545,321 Asian 26,060 8,817,663 7,248 7,957,503 54,560 1,784,858 Native Hawaiian/Pac. Islander 255 n/a 24 n/a n/a n/a Am. Indian & Alaska Native 1,967 546,694 336 481,301 2,365 113,405 Panel B. Column Percentages All Firms 100.00% 100.00% 100.00% 100.00% 100.00% 100.00% Nonminority Male 48.25% 81.06% 61.02% 82.47% 71.50% 77.44% Female 38.16% 9.21% 21.08% 8.11% 14.37% 10.89% African American 4.56% 0.59% 1.20% 0.45% 1.05% 0.64% Hispanic 5.86% 1.31% 2.51% 1.13% 1.56% 1.30% Asian 6.40% 3.55% 8.41% 3.43% 5.19% 4.26% Native Hawaiian/Pac. Islander 0.06% n/a 0.03% n/a n/a n/a Am. Indian & Alaska Native 0.48% 0.22% 0.39% 0.21% 0.23% 0.27% Panel C. Disparity Ratios (2) vs. (1) (4) vs. (3) (5) vs. (3) (6) vs. (3) Nonminority Male 168.00 135.15 117.18 126.90 Female 24.14 38.49 68.15 51.65 African American 12.92 37.43 87.38 53.54 Hispanic 22.30 44.91 62.08 51.79 Asian 55.49 40.75 61.76 50.61 Native Hawaiian/Pac. Islander n/a n/a n/a n/a Am. Indian & Alaska Native 45.58 53.17 57.75 69.37
Source and Notes: See Table 4.25. 94 See fn.92. 95 See fn. 92. 96 The sole exception being among Asian-owned firms. 97 See fn. 92.

Market-Based Disparities in Business Formation and Business Owner Earnings
NERA Economic Consulting
112
This page intentionally left blank.

Statistical Disparities in Capital Markets
NERA Economic Consulting
113
V. Statistical Disparities in Capital Markets
A. Introduction
Discrimination occurs whenever the terms of a transaction are affected by personal characteristics of the participants that are not relevant to the transaction. Among such characteristics, the most commonly considered are race, ethnicity and gender. In labor markets, this might translate into equally productive workers in similar jobs being paid different salaries because of their race, ethnicity or gender. In commercial credit markets, it might translate into small business loan approvals differing across racial or gender groups with otherwise similar financial backgrounds.
In this chapter, we examine whether there is evidence consistent with the presence of discrimination against M/WBEs in the commercial credit market. Discrimination in the credit market against such small businesses can have an important effect on the likelihood that they will succeed. Moreover, discrimination in the credit market can even prevent businesses from opening in the first place, and can negatively impact the size a firm can obtain, and/or shorten its longevity in the market.98
In our analyses in this chapter, we use data from a variety of sources. First and foremost are data from the Federal Reserve Board that allow us to examine whether discrimination exists in the small business credit market for the key years of 1993, 1998 and 2003, as these are the primary years of availability for the most important data source of small business finance by race and gender that has ever been produced. These surveys were based on a large representative sample of firms with fewer than 500 employees and were administered by the Federal Reserve Board and the U.S. Small Business Administration. The 1993 and 1998 surveys deliberately oversampled minority-owned firms, but the 2003 survey did not.99 Unfortunately, the much-anticipated continuation of this survey series in 2008 (and presumably in 2013) never materialized due to the Federal Reserve Board’s cancellation of this important effort.100
Next, in addition to the 1993, 1998 and 2003 Federal Reserve data, this chapter also analyzes similar datasets collected through NERA’s own surveys conducted from 1999 through 2007 that mirrored the relevant sections of the earlier Federal Reserve Board surveys. Results from the NERA credit surveys are consistent with the results obtained from the 1993-2003 Federal Reserve Board data.
98 Again, as noted in Chapter IV, these factors also illustrate why, in a disparity study intended to answer the
question of whether discrimination is present in business enterprise, adjusting availability for “capacity” factors such as firm age, firm size or firm revenues, is not a legitimate practice when there is evidence that suggests that these factors themselves are tainted by discrimination. To do so would be to inappropriately introduce one or more endogenous variables into the analysis.
99 The 2003 survey took other steps, however, to increase the likelihood that minority-owned and women-owned firms were captured in the sampling frame. For more details, see National Opinion Research Center (2005), p. 11.
100 For more on this, see fn. 143 below.

Statistical Disparities in Capital Markets
NERA Economic Consulting
114
Finally, we review the results of the most recent available research on commercial credit market discrimination, spanning the time period from 2008 forward. Much of this review focuses on the work of Dr. Alicia Robb and her colleagues with data from the Kauffman Firm Survey, the largest and longest longitudinal survey of new businesses in the world. Analyses of the Kauffman data are, as well, consistent with those obtained from the 1993-2003 Federal Reserve Board data and the 1999-2007 NERA credit survey data.
Taken as a whole, these data provide qualitative and quantitative evidence consistent with the presence of discrimination against minorities in the credit market for small businesses. For example, we find that African American-owned firms are much more likely to report being seriously concerned with credit market problems and report being less likely to apply for credit because they fear the loan would be denied. Moreover, after controlling for a large number of characteristics of the firms, we find that African American-owned firms, Hispanic-owned firms, and to a lesser extent other minority-owned firms, are substantially and statistically significantly more likely to be denied credit than are nonminority-owned firms. We find some evidence that women are discriminated against in this market as well. The principal results are as follows:
• Minority-owned firms were more likely to report that they did not apply for a loan over the preceding three years because they feared the loan would be denied (see Tables 5.15, 5.22, 5.29);
• When minority-owned firms applied for a loan, their loan requests were substantially more likely to be denied than non-minorities, even after accounting for differences like firm size and credit history (see Tables 5.8, 5.9, 5.18, 5.19, 5.25, 5.26);
• When minority-owned firms did receive a loan, they were obligated to pay higher interest rates on the loans than comparable nonminority-owned firms (see Tables 5.13, 5.14, 5.21, 5.27);
• A larger proportion of minority-owned firms than nonminority-owned firms report that credit market conditions are a serious concern (see Tables 5.3, 5.4, 5.5, 5.6, 5.7, 5.17, 5.24);
• A larger share of minority-owned firms than nonminority-owned firms believes that the availability of credit was the most important issue likely to confront them in the upcoming year (see Tables 5.5, 5.6);
• There is no evidence that discrimination in the market for credit is significantly different in the Northeast census region or in the construction, design, and construction-related professional services industries than it is in the nation or the economy as a whole (various tables);
• There is no evidence that the level of discrimination in the market for credit has diminished between 1993 and 2003 (various tables);

Statistical Disparities in Capital Markets
NERA Economic Consulting
115
• Evidence from NERA’s own 1999-2007 credit surveys, which contained questions similar to the relevant portions of the SSBF, is fully consistent with the findings drawn from the earlier SSBF data (see Tables 5.30, 5.31); and
• More recent evidence from non-SSBF sources, particularly the Kauffman Firm Survey, yields results that are fully consistent with those drawn from the earlier SSBF data (see Section L, below).
The structure of this chapter is as follows. First, we outline the main theories of business credit discrimination and discuss how they might be tested. Second, we examine the evidence on the existence of capital/liquidity constraints facing individuals in the mortgage market, households in the non-mortgage loan market, and for small businesses in the commercial credit market. Third, we describe the Federal Reserve Board data files used in the chapter and then examine in more detail problems faced by minority-owned firms in obtaining credit. Fourth, we describe comparable analyses and results using NERA’s own credit surveys conducted between 1999-2007. Fifth, we provide a series of answers to potential criticisms and present our conclusions. Finally, we provide an overview of the results of others’ research, with a focus on the most recent time period from 2008 forward and draw conclusions about its consistency with our own results.
B. Theoretical Framework and Review of the Literature
Most economic studies of discrimination draw on the analyses contained in Gary Becker’s (1957) The Economics of Discrimination. Becker’s main contribution was to translate the notion of discrimination into financial terms. Discrimination, in this view, results from the desire of owners, workers, or customers to avoid contact with certain groups. This being the case, transactions with the undesired groups would require more favorable terms than those that occur with a desired group. Assume that the primary objective of a financial institution is to maximize their expected profits. The expected return on a loan will depend on the interest rate charged and the likelihood that a borrower defaults. The financial institution would approve any loan for which the expected return on the loan exceeded the cost of the funds to the institution. Discrimination would then result in either (a) higher interest rates being charged to undesired groups having otherwise similar characteristics to the desired group, or (b) requiring better characteristics (i.e., a lower expected default rate) from the undesired group at any given interest rate. In other words, applicants from the disadvantaged group might either be appraised more rigorously or be given less favorable terms on the loan, or both.
A similar connection between the likelihood of loan approval and the race, ethnicity or gender of the applicant might also be found if lenders employ “statistical discrimination”—a concept first put forth by economists Kenneth Arrow (1973) and Edmund Phelps (1972)—meaning that lenders use personal characteristics such as race, ethnicity or gender to infer the likelihood of default on the loan. If experience has suggested that certain groups of individuals are on average more or less likely to default, then the lender may use this information to economize on the costs of gathering more directly relevant information. Hence, discrimination would not reflect the preferences of the owner but would, rather, reflect an attempt to minimize costs. Empirically, the racial, ethnic or gender characteristics of the applicant could proxy for unobserved characteristics of their creditworthiness.

Statistical Disparities in Capital Markets
NERA Economic Consulting
116
In the public policy realm, there has been an active debate about whether banks discriminate against minority applicants for mortgages. In particular, banks were often accused of “redlining”—that is, not granting loans for properties located in certain geographic areas. To analyze that issue, Congress passed the Home Mortgage Disclosure Act in 1975 to require lenders to disclose information on the geographic location of their home mortgage loans. These data, however, were not sufficient to assess whether or not there was discrimination in the market for mortgage loans.
In 1992, researchers at the Federal Reserve Bank of Boston collected additional information from mortgage lenders (Munnell, et al., 1996). In particular, they tried to collect any information that might be deemed economically relevant to whether a loan would be approved. In the raw data, nonminorities had 10 percent of their loans rejected, whereas rejection rates were 28 percent for both African Americans and Hispanics. Even after the creditworthiness of the borrowers (including the amount of the debt, debt-to-income ratio, credit history, loan characteristics, etc.) were controlled for, African Americans were still found to be 7 percentage points less likely to be granted the loan. A variety of criticisms have been launched at this study (See, e.g., Horne, 1994; Day and Liebowitz, 1998; and Harrison, 1998), most alleging various errors in the Munnell, et al. (1996) data. Responses to these criticisms are found in Browne and Tootell (1995) and Tootell (1996). Carr and Megbolugbe (1993) and Glennon and Stengle (1994) undertook independent examinations of the Munnell, et al. (1996) data that addressed Horne’s (1994) major criticisms and reached similar conclusions as Munnell, et al. (1996). As Ardalan (2006, p. 123) notes, “Overall, Munnell et al. (1996) paid a great deal of attention to their data and no one has provided credible evidence that the results of the study are influenced by data errors.”
In addition to the type of statistical analysis done in the Munnell, et al. (1996) study, two other approaches have been used to measure discrimination in mortgage markets. First, Federal Reserve regulators can examine a lending institution’s files to try to identify any cases where a loan rejection looks suspicious. Second, audit studies have been used with paired “identical” applicants. Such studies have also found evidence of discrimination (See, e.g., Cloud and Galster, 1993; Smith and Cloud, 1996; and Yinger, 1998), although the audit approach is not without its critics (Heckman, 1998, arguing that theoretical tester heterogeneity invalidates the conclusions of paired testing). Subsequent research has shown Heckman’s theoretical critique is not borne out when tested empirically (See Ross, et al. 2008). Hanson, et al. (2016) went a step further and designed a testing experiment that is not subject to Heckman’s critique at all, by using e-mail correspondence with mortgage loan originators, and concludes there is a continuing presence of racial discrimination in mortgage markets.
Another relevant subset of the literature is concerned with the severity of liquidity constraints affecting consumers in non-mortgage credit markets. A consumer is said to be liquidity-constrained when lenders refuse to make the household a loan or offer the household less than they wished to borrow (Ferri and Simon, 1997). Many studies have suggested that roughly 20 percent of U.S. families are liquidity-constrained (See Hall and Mishkin, 1982; and Jappelli, 1990). As might be expected, liquidity-constrained households are typically younger, with less wealth and accumulated savings (Hayashi, 1985; and Jappelli, 1990). The research shows minority households to be substantially more likely to be liquidity-constrained even when a variety of financial characteristics of households are controlled for (Jappelli, 1990; and Ferri and

Statistical Disparities in Capital Markets
NERA Economic Consulting
117
Simon, 1997). Using data from the Survey of Consumer Finances, Dogra and Gorbachev (2016) document that despite an increase in household debt between 1983 and 2007, the proportion of liquidity-constrained households did not decline. Using data from the 2010-2013 Consumer Expenditure Surveys, Chénier, et al. (2015) confirm that liquidity constraints remain significantly more severe for minority households than for similarly situated nonminority households.
We turn next to the more directly relevant evidence on liquidity constraints facing small businesses. Just like individuals and households, businesses can also face liquidity constraints.101 Liquidity constraints can be a problem in starting a business as well as in running it.102 Discrimination in the credit market against minority- and women-owned small businesses can have a devastating effect on their success, and may even prevent them from opening in the first place.103 In his report for Builders Association of Greater Chicago v. the City of Chicago,104 Professor Tim Bates (2002) wrote “from its origins, the black-business community has been constrained by limited access to credit, limited opportunities for education and training, and
101 Evans and Leighton (1989) and Evans and Jovanovic (1989) have argued formally that entrepreneurs face
difficulties borrowing money. As in the discussion above, such individuals are labeled liquidity constrained by economists. Using data from the National Longitudinal Survey of Youth from 1966-1981 and the Current Population Surveys from 1968-1987, these authors found that, all else equal, people with greater family assets are more likely to switch to self-employment from employment. Similar findings with more recent data have been made, in the US and abroad, by numerous researchers, including Meyer (1990), Holtz-Eakin, Joulfaian, and Rosen (1994), Lindh and Ohlsson (1996), Lindh and Ohlsson (1998), Blanchflower and Oswald (1998), Fairlie (1999), Dunn and Holtz-Eakin (2000), Johansson (2000), Taylor (2001), Giannetti and Simonov (2004), Gentry and Hubbard (2005), Holtz-Eakin and Rosen (2005), Nykvist (2005), Cagetti and DeNardi (2006), Zissimopoulos and Karoly (2007), Fairlie and Robb (2008), Zissimopoulos and Karoly (2009), and Lofstrom and Bates (2013). Blanchflower and Oswald (1998) studied the probability that an individual reports him or herself as self-employed. Consistent with the existence of capital constraints on potential entrepreneurs, their econometric estimates imply that the probability of being self-employed depends positively upon whether the individual ever received an inheritance or gift. Holtz-Eakin, et al. (1994a, 1994b) examine flows in and out of self-employment and also find that inheritances both raise entry and slow exit. Similarly, Lindh and Ohlsson (1996) suggest that the probability of being self-employed increases when people receive windfall gains in the form of lottery winnings and inheritances. Further confirmation of the positive effect of inheritances on reducing liquidity constraints is found, e.g., in Disney and Gathergood (2009) and Sauer and Wilson (2016). Housing equity also plays an important role in shaping the supply of entrepreneurs (See, e.g., Black, de Meza and Jeffreys (1996), Cavalluzzo and Walken (2005), and Adelino, et al. (2015). Additionally, Blanchflower and Oswald (1998) present evidence that potential entrepreneurs, when directly questioned in interview surveys, say that raising capital is one of their principal problems. The liquidity constraint interpretation has been challenged by Hurst and Lusardi (2004), who argue, using data from 1989 and 1994 waves of the Panel Study of Income Dynamics, that business entry rates are essentially flat across the asset distribution except above the 95th percentile. However, Fairlie and Krashinsky (2012) find that when the sample is stratified according to job losers and non-job losers, the data show evidence consistent with the liquidity constraints hypothesis—that of generally increasing rates of entry into self-employment throughout the asset distribution.
102 See, e.g., Fan and White (2003), Fairlie and Krashinsky (2012), Corradin and Popov (2013), Fort, et al. (2013), and Kleiner (2013). Schmalz, et al. (2013) found similar results for France, as did Black, et al., (1996) and Kleiner (2013) for the UK.
103 For further evidence regarding the latter effect, see Chapter IV. 104 298 F.Supp. 2d 725 (N.D. Ill. 2003).

Statistical Disparities in Capital Markets
NERA Economic Consulting
118
nonminority stereotypes about suitable roles for minorities in society.”105 As Bates points out, almost 60 years prior Gunner Myrdal had observed,
The Negro businessman … encounters greater difficulties than whites in securing credit. This is partly due to the marginal position of Negro business. It is also partly due to prejudicial opinions among whites concerning business ability and personal reliability of Negroes. In either case a vicious circle is in operation keeping Negro business down.106
Available evidence indicates that capital constraints for M/WBEs are particularly large. A survey conducted by the U.S. Chamber of Commerce (2005, p. 55) found that although 19 percent of nonminority male business owners reported that obtaining credit was the biggest problem for their business, the corresponding figure for nonminority women was 23 percent. For Asian/Pacific Islanders the figure was 34 percent; for Native Americans it was 43 percent; for African Americans it was 46 percent; and for Hispanics it was 52 percent.107
Bates (1989) finds that racial differences in levels of financial capital have a significant effect upon racial patterns in business failure rates. Fairlie and Meyer (1996) find that racial groups with higher levels of unearned income have higher levels of self-employment. In an important paper, Fairlie (1999) uses data from the 1968-1989 Panel Study of Income Dynamics to examine why African American men are one-third as likely to be self-employed as nonminority men. Fairlie finds that the large discrepancy is due to an African American transition rate into self-employment that is approximately one half the nonminority rate and an African American transition rate out of self-employment that is twice the nonminority rate. He finds that capital constraints—measured by interest income and lump-sum cash payments—significantly reduce the flow into self-employment from wage/salary work, with this effect being nearly seven times larger for self-employed African Americans than for nonminority self-employed persons. Fairlie then attempts to decompose the racial gap in the transition rate into self-employment into a part due to differences in the distributions of individual characteristics and a part due to differences in the processes generating the transitions. He finds that differences in the distributions of characteristics between African Americans and non-minorities explain only a part of the racial gap in the transition rate into self-employment. In addition, racial differences in specific variables, such as levels of assets and the likelihood of having a self-employed father, provide important contributions to the gap. He concludes, however, that “the remaining part of the gap is large and is due to racial differences in the coefficients. Unfortunately, we know much less about the causes of these differences. They may be partly caused by lending or consumer discrimination against blacks” (Fairlie, 1999, p. 14).
Using 2002 data from the Characteristics of Business Owners survey, Fairlie and Robb (2008) document a strong positive relationship between the availability and amount of startup capital and business outcomes for African American and Hispanic firms. They conclude: “Firms with higher levels of startup capital are less likely to close and are more likely to have higher profits and sales and to hire employees. The estimated positive relationship is consistent with the 105 See also Bates (1991a); Bates (1991b); Bates (1993); Bates (1997); and Fairlie and Robb (2008). 106 Myrdal (1944), p. 308. See also Bates (1973). 107 See also Table 5.7 below.

Statistical Disparities in Capital Markets
NERA Economic Consulting
119
inability of some entrepreneurs to obtain the optimal level of startup capital because of liquidity constraints” (Fairlie and Robb, 2008, p.11). Further evidence for liquidity constraints affecting the formation of Hispanic-owned businesses has been documented, e.g., by Fairlie and Woodruff (2010) and Lofstrom and Wang (2009).
There is also research on racial differences in access to credit among small businesses—the main subject of this chapter. Cavalluzzo and Cavalluzzo (1998) used data from the 1988-1989 National Survey of Small Business Finances (NSSBF), conducted by the Federal Reserve Board, to analyze differences in application rates, denial rates, and other outcomes by race, ethnicity and gender in a manner similar to the econometric models reported below in this chapter. They documented a large discrepancy in credit access between nonminority- and minority-owned firms that could not be explained by available firm financial characteristics. Unfortunately, this earliest NSSBF data did not over-sample minority-owned firms and contained only limited information on a firm’s credit history and that of its owner, thus reducing the ability to provide a powerful test of the causal impact of race, ethnicity or gender on loan decisions.
Cole (1999) and Cavaluzzo, et al. (2002), using data from the 1993 NSSBF, found higher loan application rejection rates for minority-owned businesses than similarly-situated nonminority businesses, and higher loan denial rates for African American-owned and Asian-owned businesses. Blanchflower, Levine and Zimmerman (2003), using data from the 1993 NSSBF and the 1998 Survey of Small Business Finances (SSBF), find that African American-owned small businesses were about twice as likely to be denied credit even after controlling for a wide variety of balance sheet, creditworthiness and other factors. They find similar results for firms owned by Asians, Hispanics, and women, although at smaller magnitudes than for African Americans. They conclude that the racial disparity is likely to be caused by discrimination. Cavaluzzo and Wolken (2005), using data from the 1998 SSBF, find that large disparities exist in denial rates for African American-, Hispanic-, and Asian-owned firms when compared to similarly situated nonminority-owned firms.
The main analyses in the present chapter take advantage of the three most recent waves of the Survey of Small Business Finances: the 1993 NSSBF data, the 1998 SSBF data, and the 2003 SSBF data. All three datasets have better information on creditworthiness than did the earlier (1988-1989) NSSBF data, and the 1993 and 1998 surveys have a larger sample of minority-owned firms than did the earlier NSSBF data. These datasets are also used to conduct an extensive set of specification checks designed to weigh the possibility that our results are subject to alternative interpretations.
C. Empirical Framework and Description of the Data
1. Introduction
Disputes about discrimination typically originate in differences in the average outcomes for two groups. To determine whether a difference in the loan denial rate for African American-owned firms compared to nonminority-owned firms is consistent with discrimination, it is necessary to compare African American- and nonminority-owned firms that have similar risks of default; that is, the fraction of the African American firms’ loans that would be approved if they had the same creditworthiness as the nonminority-owned firms. A standard approach to this problem is to

Statistical Disparities in Capital Markets
NERA Economic Consulting
120
statistically control for firms’ characteristics relevant to the loan decision. If African American-owned firms with the same likelihood of default as nonminority-owned firms are less likely to be approved, then it is appropriate to attribute such a difference to discrimination.
Following Munnell, et al. (1996) we estimated the following loan denial equation:
(1) Prob(Di = 1) = Φ(β0 + β1CWi + β2Xi + β3Ri),
where Di represents an indicator variable for loan denial for firm i (that is, 1 if the loan is denied and 0 if accepted), CW represents measures of creditworthiness, X represents other firm characteristics, R represents the race, ethnicity or gender of the firm’s ownership, and Φ is the cumulative normal probability distribution.108 This econometric model can be thought of as a reduced form version of a structural model that incorporates firms’ demand for and financial institutions’ supply of loan funds as a function of the interest rate and other factors. Within the framework of this model, a positive estimate of β3 is consistent with the presence of discrimination.109
We begin with the 1993 NSSBF dataset and will continue chronologically through the 2003 dataset and then proceed to evidence from NERA’s own comparable surveys conducted in various geographies between 1999 and 2007. This chronological progression allows the reader to see the consistency of the main findings over time. This approach serves as well to demonstrate the value of over-sampling minority and female small business owners, as was the case in the 1993 and 1998 surveys, but not the 2003 survey. Unfortunately, the much-anticipated 2008 SSBF results never materialized because the Federal Reserve cancelled this important survey effort.110
2. 1993 NSSBF Data
The 1993 NSSBF data contain substantial information regarding credit availability on a nationally representative target sample of for-profit, non-farm, non-financial business enterprises with fewer than 500 employees. The survey was conducted during 1994 and 1995 for the Board of Governors of the Federal Reserve System and the U.S. Small Business Administration; the data relate to the years 1992 and 1993. The data file used here contains 4,637 firms.111 In this NSSBF file, minority-owned firms were over-sampled, but sampling weights are provided to generate nationally representative estimates. Of the firms surveyed, 9.5 percent were owned by African Americans, 6.4 percent were owned by Hispanics, and 7.4 percent were owned by individuals of other races (i.e., Asians/Pacific Islanders and Native Americans).112
108 Additional discussion of Probit regression appears in Chapter IV, Section C.1. 109 The Equal Credit Opportunity Act prohibits discrimination in access to credit by race and would apply to both
Becker-type and statistical discrimination. 110 For more on this, see fn. 143 below. 111 The median size of firms in the sample was 5.5 and mean size was 31.6 full-time equivalent employees; 440
firms out of 4,637 had 100 or more full-time equivalent employees. 112 There were also two firms in the “Other race” category in 1993 that reported multiple or mixed race.
Statistical Disparities in Capital Markets
NERA Economic Consulting
121
Table 5.1 presents population-weighted sample means from these data for all firms in the sample that applied for credit. The estimates indicate that African American-owned firms are almost 2.5 times more likely to have a loan application rejected as are nonminority firms (65.9 percent versus 26.9 percent).113 Other minority groups are denied at rates higher than nonminorities as well, but the magnitude of the African American-to-nonminority differential is particularly large.
Minority-owned firms, however, do have characteristics that are different from those of nonminority-owned firms, and such differences may contribute to the gap in loan denial rates. For instance, minority-owned firms were younger, smaller (whether measured in terms of sales or employment), more likely to be located in urban areas, and more likely to have an owner with fewer years of experience than their nonminority counterparts. Minority firms were also less creditworthy, on average, than their nonminority counterparts, as measured by whether (a) the owner had legal judgments against him or her over the previous three years, (b) the firm had been delinquent for more than 60 days on business obligations over the preceding three years, or (c) the owner had been delinquent for more than 60 days on personal obligations over the prior three years. Additionally, compared to nonminority-owned firms, African American-owned firms were also more likely, on average, to have owners who had declared bankruptcy over the preceding seven years.
Minority-owned firms also sought smaller amounts of credit than nonminority-owned firms. This was particularly true for African American-owned firms, who requested loans that were, on average, about 60 percent smaller than those requested by nonminority-owned firms, and Hispanic-owned firms, who requested loans about 42 percent smaller than those requested by nonminority-owned firms.
The NSSBF database does not identify the specific city or state where the firm is located; instead, data are reported for four census regions, nine census divisions, and urban or rural location. Table 5.2 presents evidence for the Northeast (NEAST) region, which includes the Commonwealth of Massachusetts and eight surrounding states.114 The NEAST sample includes the owners of 873 firms, of which 352 owners (40.3%) said that they had applied for a loan over the preceding three-year period.
The overall denial rate of 37.2 percent in the NEAST is higher than the national rate of 28.8 percent reported in Table 5.1. The difference in the denial rates between African American-owned firms and nonminority-owned firms is somewhat lower in the NEAST (23.5 percentage points) than in the nation as a whole (39.0 percentage points), and somewhat higher for Hispanics, Asians/Pacific Islanders, and Native Americans. On balance, however, the weighted
113 Cavalluzzo and Cavalluzzo (1998) examined these outcomes using the 1987 NSSBF and similarly found that
denial rates (weighted) are considerably higher for minorities. Nonminority-owned firms had a denial rate for loans of 22 percent compared with 56 percent for African Americans, 36 percent for Hispanics, and 24 percent for other races, which are broadly similar to the differences reported here. These estimates for minority groups are estimated with less precision, however, because of the smaller number of minority-owned firms in the 1987 sample.
114 In addition to Massachusetts, the NEAST includes Connecticut, Maine, New Hampshire, Rhode Island, Vermont, New Jersey, New York, and Pennsylvania.

Statistical Disparities in Capital Markets
NERA Economic Consulting
122
sample means are not significantly different in the NEAST than in the nation as a whole—either overall or by race, ethnicity or gender.
Table 5.1. Selected Population-Weighted Sample Means of Loan Applicants from 1993 NSSBF Data
All Non-minority
African American Hispanic Other Races
% of Firms Denied in the Last Three Years 28.8 26.9 65.9 35.9 39.9 Credit History of Firm/Owners
% Owners with Judgments Against Them 4.8 4.1 16.9 5.2 15.2 % Firms Delinquent in Business Obligations 24.2 23.1 49.0 25.1 31.6 % Owners Delinquent on Personal Obligations 14.0 12.6 43.4 14.8 24.5 % Owners Declared Bankruptcy in Past 7yrs 2.4 2.4 5.3 2.0 0.8
Other Firm Characteristics % Female-Owned 17.9 18.1 18.2 9.7 23.1 Sales (in 1,000s of 1992 $) 1795.0 1870.6 588.6 1361.3 1309.1 Profits (in 1,000s of 1992 $) 86.7 84.5 59.9 189.5 54.0 Assets (in 1,000s of 1992 $) 889.4 922.5 230.3 745.6 747.3 Liabilities (in 1,000s of 1992 $) 547.4 572.8 146.2 308.6 486.0 Owner’s Years of Experience 18.3 18.7 15.3 15.9 14.9 Owner’s Share of Business 77.1 76.5 86.4 83.9 77.1 % <= 8th Grade Education 0.8 0.7 0.0 3.4 1.0 % 9th-11th Grade Education 2.2 2.2 3.7 1.8 1.2 % High School Graduate 19.6 19.7 12.8 27.7 14.9 % Some College 28.0 28.3 36.0 20.6 19.8 % College Graduate 29.2 29.2 28.0 24.1 36.5 % Postgraduate Education 20.2 19.9 19.5 22.3 26.6 % Line of credit 48.7 49.1 35.8 52.8 43.7 Total Full-time Employment in 1990 11.4 11.8 6.8 9.3 8.8 Total Full-time Employment in 1993 13.6 13.9 8.3 10.8 12.3 Firm age, in years 13.4 13.6 11.5 13.3 9.3 % New Firm Since 1990 9.4 9.4 13.0 6.4 9.5 % Firms Located in MSA 76.5 75.1 91.2 90.7 85.7 % Sole Proprietorship 32.8 32.3 48.6 38.2 24.2 % Partnership 7.8 7.8 7.7 6.7 7.9 % S Corporation 26.1 27.1 11.7 13.7 27.1 % C Corporation 33.4 32.8 32.1 41.4 40.8 % Existing Relationship with Lender 24.6 24.7 12.8 29.6 25.7 % Firms with Local Sales Market 54.1 54.7 42.9 55.0 47.4
Characteristics of Loan Application Amount Requested (in 1,000s of 1992 $) 300.4 310.8 126.5 179.1 310.5 % Loans to be Used for Working Capital 8.4 8.8 4.9 4.6 5.5 % Loans to be Used for Equipment/Machinery 2.3 2.4 1.7 0.2 0.6 % Loans to be Used for Land/Buildings 0.4 0.4 0.9 0.0 0.0 % Loans to be Backed by Real Estate 28.3 28.6 24.7 26.2 24.7
Sample Size (unweighted) 2,007 1,648 170 96 93
Source: NERA calculations from 1993 NSSBF. Notes: (1) Sample weights are used to provide statistics that are nationally representative of all small businesses. (2) Sample restricted to firms that applied for a loan over the preceding three years.

Statistical Disparities in Capital Markets
NERA Economic Consulting
123
Table 5.2. Selected Sample Means of Loan Applicants—Northeast
All Non-minority
African American Hispanic Other Races
% of Firms Denied in the Last Three Years 37.2 35.0 58.5 74.6 48.6 Credit History of Firm/Owners
% Owners with Judgments Against Them 3.6 3.2 7.4 8.7 12.8 % Firms Delinquent in Business Obligations 29.8 30.2 42.1 17.6 23.9 % Owners Delinquent on Personal Obligations 16.7 16.5 22.7 17.6 14.8 % Owners Declared Bankruptcy in Past 7yrs 1.1 1.0 1.2 0.0 7.2
Other Firm Characteristics % Female-Owned 15.7 16.2 15.8 0.0 25.4 Sales (in 1,000s of 1992 $) 1998.1 2081.7 654.2 352.5 2594.6 Profits (in 1,000s of 1992 $) 164.1 166.6 207.3 42.2 241.3 Assets (in 1,000s of 1992 $) 874.6 916.4 417.1 135.3 759.8 Liabilities (in 1,000s of 1992 $) 610.3 640.1 251.8 89.9 547.2 Owner’s Years of Experience 18.9 19.3 14.3 15.5 14.1 Owner’s Share of Business 77.3 76.9 81.6 85.3 72.8 % <= 8th Grade Education 0.7 0.6 0.0 0.0 9.1 % 9th-11th Grade Education 3.0 3.1 4.6 0.0 0.0 % High School Graduate 15.9 15.1 14.9 37.1 14.8 % Some College 29.6 30.8 9.5 22.2 9.1 % College Graduate 33.1 33.2 34.7 24.7 44.4 % Postgraduate Education 17.7 17.3 36.2 16.0 22.6 % Line of credit 45.3 45.2 62.9 43.1 34.5 Total Full-time Employment in 1990 11.9 12.2 8.0 5.6 13.8 Total Full-time Employment in 1993 13.8 14.0 9.0 4.4 29.2 Firm age, in years 14.7 14.9 12.2 11.8 10.0 % New Firm Since 1990 9.8 10.3 7.4 0.0 7.2 % Firms Located in MSA 84.5 83.7 100.0 86.6 100.0 % Sole Proprietorship 27.1 25.9 27.1 63.9 9.1 % Partnership 7.4 7.6 13.2 4.6 0.0 % S Corporation 34.7 35.7 10.3 22.2 35.1 % C Corporation 30.8 30.8 49.5 9.2 55.8 % Existing Relationship with Lender 22.0 23.3 2.7 4.6 15.5 % Firms with Local Sales Market 53.9 54.3 39.0 50.5 59.7
Characteristics of Loan Application Amount Requested (in 1,000s of 1992 $) 247.5 248.5 258.5 31.7 638.5 % Loans to be Used for Working Capital 9.4 9.7 9.6 6.8 0.0 % Loans to be Used for Equipment/Machinery 4.2 4.5 0.0 0.0 0.0 % Loans to be Used for Land/Buildings 0.8 0.9 0.0 0.0 0.0 % Loans to be Backed by Real Estate 36.2 36.6 32.2 40.2 14.3
Total Sample Size (unweighted) 352 304 23 12 13
Source: See Table 5.1. Notes: (1) Sample weights are used to provide statistics that are nationally representative of all small businesses. (2) Some variable means are computed from slightly smaller samples because of missing values. (3) “Other Races” are not reported separately due to small sample size. In the Northeast region, the 43 observations in the “Other Races” category included 42 Asians and 1 Native American.

Statistical Disparities in Capital Markets
NERA Economic Consulting
124
D. Qualitative Evidence
Before moving on to the results of our multivariate analysis, we first report on what business owners themselves say are their main problems. While this evidence is not conclusive in determining whether discrimination exists, it highlights firms’ perceptions regarding discrimination in obtaining credit. That African American-owned firms and other minorities report greater difficulty in obtaining commercial credit than do nonminority-owned firms, but report other types of problems no more frequently, suggests either that discrimination takes place or that perceptions of discrimination exist that are unwarranted. It therefore complements the econometric analysis provided subsequently, which can distinguish between these two hypotheses.
Table 5.3 summarizes, for the U.S. as a whole, responses to specific questions about problems that firms confronted over the 12-month period before the date of response. In the top panel, respondents were asked to what extent credit market conditions had been a problem. African Americans and Hispanics were much more likely to say that it had been a “serious” problem (31.3 percent and 22.9 percent, respectively) than nonminorities (12.7 percent). The bottom panel of the table reports the results for eight other designated problem areas: (1) training costs; (2) worker’s compensation costs; (3) health insurance costs; (4) IRS regulation or penalties; (5) environmental regulations; (6) The American with Disabilities Act; (7) the Occupational Safety and Health Act; and (8) The Family and Medical Leave Act. Differences between African American-owned firms and Hispanic-owned firms, on the one hand, and nonminority-owned firms, on the other, are much less pronounced in these eight areas than they are in relation to credit market conditions.115 The finding that minority-owned firms are largely indistinguishable from nonminority-owned firms in reporting a variety of problems, except for the case of credit, indicates that these firms perceive credit availability to be a particular problem for them.
Results are similar in Table 5.4 for the NEAST region—with African American and Hispanic firms being more likely than nonminority-owned firms to say that credit market conditions had been somewhat of a problem or a serious problem in the preceding 12 months.
115 We also estimated a series of ordered Logit equations (not reported) to control for differences across firms in
their creditworthiness, location, industry, size, and the like. It is apparent from these regressions that African American-owned firms were more likely to report that credit market conditions were especially serious.

Statistical Disparities in Capital Markets
NERA Economic Consulting
125
Table 5.3. Problems Firms Experienced During Preceding 12 Months—USA
All Non-minority
African American Hispanic Other Races
Credit Market Conditions Percent reporting not a problem 66.2 67.3 43.1 58.9 65.8 Percent reporting somewhat of a problem 20.1 19.9 25.6 18.2 21.3 Percent reporting serious problem 13.7 12.7 31.3 22.9 12.9
Other Potential Problems (% reporting problem is serious) Training costs 6.5 6.6 7.2 6.3 4.3 Worker’s compensation costs 21.7 21.0 19.3 30.6 28.7 Health insurance costs 32.5 31.6 38.1 44.3 35.0 IRS regulation or penalties 12.3 11.8 17.1 17.9 13.2 Environmental regulations 8.5 8.5 5.6 7.4 11.0 Americans with Disabilities Act 2.7 2.6 3.6 2.7 3.9 Occupational Safety and Health Act 4.5 4.5 3.9 3.6 6.2 Family and Medical Leave Act 2.7 2.5 4.5 3.1 4.8 Number of observations (unweighted) 2,007 1,648 170 96 93 Source: See Table 5.1. Note: Figures are rounded. Rounding was performed subsequent to any mathematical calculations.
Table 5.4. Problems Firms Experienced During Preceding 12 Months—Northeast
All Non-minority
African American Hispanic Other Races
Credit Market Conditions Percent reporting not a problem 62.8 63.3 49.5 57.1 62.1 Percent reporting somewhat of a problem 19.8 19.6 32.9 15.0 24.3 Percent reporting serious problem 17.4 17.1 17.7 28.0 13.6
Other Potential Problems (% reporting problem is serious) Training costs 5.6 5.4 3.2 11.4 8.6 Worker’s compensation costs 23.3 23.8 11.2 28.9 7.2 Health insurance costs 39.3 39.6 39.7 47.7 19.7 IRS regulation or penalties 10.4 9.6 14.1 26.8 12.9 Environmental regulations 5.8 6.2 0.9 1.5 1.8 Americans with Disabilities Act 1.9 2.0 0.0 1.4 0.0 Occupational Safety and Health Act 4.5 4.8 2.2 0.0 0.0 Family and Medical Leave Act 2.8 2.8 2.6 3.6 2.4 Number of observations (unweighted) 873 270 65 40 43 Source: See Table 5.1. Note: Figures are rounded. Rounding was performed subsequent to any mathematical calculations. Tables 5.5 and 5.6 report the views of NSSBF respondents for the U.S. as a whole and the NEAST region, respectively, on the most important issues businesses expected to face over the following year. Nationally, credit availability and cash flow again appear to be more important issues for African American-owned firms than for nonminority-owned firms. Nonminority-owned firms were especially worried about health care costs. Hispanic-owned, Asian/Pacific

Statistical Disparities in Capital Markets
NERA Economic Consulting
126
Islander-owned, and Native American-owned firms were relatively more worried about general business conditions.
In the NEAST, credit availability is a far more important issue for African American-owned firms, Asian/Pacific Islander-owned and Native American-owned firms. More than twice as many such firms reported credit availability as the most important issue compared to nonminority-owned firms. Moreover, almost three times as many African American-owned firms reported cash flow or the cost of conducting business as the most important issue compared to nonminority-owned firms. Hispanic-owned, Asian/Pacific Islander-owned, and Native American-owned firms were relatively more worried about general business conditions, just as in the national sample.
Table 5.5. Percentage of Firms Reporting Most Important Issues Affecting Them Over the Next 12 Months—USA
All Non-minority
African American Hispanic Other
Races Credit availability 5.9 5.5 20.5 5.3 4.3
Health care, health insurance 21.1 22.1 12.3 13.7 14.8 Taxes, tax policy 5.7 5.7 2.6 8.7 3.3 General U.S. business conditions 11.8 11.5 8.9 14.4 17.4 High interest rates 5.4 5.7 1.8 3.5 3.4 Costs of conducting business 3.3 3.3 3.8 3.8 3.6 Labor force problems 3.5 3.3 3.9 5.5 3.6 Profits, cash flow, expansion, sales 10.3 9.9 20.3 9.8 11.9
Number of observations (unweighted) 4,388 3,383 424 262 319
Source: See Table 5.1. Table 5.6. Percentage of Firms Reporting Most Important Issues Affecting Them Over the Next 12 Months—Northeast
All Non-minority
African American Hispanic Other
Races Credit availability 6.1 5.9 12.0 2.9 13.0
Health care, health insurance 24.3 24.9 12.7 16.5 23.5 Taxes, tax policy 5.3 5.2 3.3 12.6 1.9 General U.S. business conditions 13.2 12.7 11.1 25.0 18.4 High interest rates 6.6 6.8 4.8 7.4 0.0 Costs of conducting business 3.3 3.2 9.8 1.4 3.1 Labor force problems 2.7 2.6 0.5 9.0 1.9 Profits, cash flow, expansion, sales 10.4 10.2 28.6 3.2 10.8
Number of observations (unweighted) 873 270 65 40 43
Source: See Table 5.1.

Statistical Disparities in Capital Markets
NERA Economic Consulting
127
Acute credit availability problems for minorities have been reported in surveys other than the NSSBF. In the Census Bureau’s 1992 Characteristics of Business Owners (CBO) Survey, for example, when owners were asked to identify the impact of various issues on their firm’s profitability, 27.0 percent of African American-owned firms reporting an answer indicated that lack of financial capital had a strong negative impact—compared to only 17.3 percent among nonminority male-owned firms. Hispanic-owned firms and other minority-owned firms also reported higher percentages than nonminority male-owned firms—21.3 percent and 19.7 percent, respectively. Further, owners who had recently discontinued their business because it was unsuccessful were asked in the CBO survey to identify the reasons why. African American-owned firms, and to a lesser degree Hispanic-owned firms, other minority-owned firms, and women-owned firms, were much more likely than nonminority male-owned firms to report that the reason was due to lack of access to business or personal loans or credit. For unsuccessful firms that were discontinued, 7.3 percent of firms owned by nonminority males reported it was due to lack of access to business loans or credit compared to 15.5 percent for firms owned by African Americans, 8.8 percent for Hispanics, 6.1 percent for Other minorities, and 9.3 percent for women. Another 2.7 percent of nonminority males said it was due to lack of personal loans or credit compared to 8.4 percent for firms owned by African Americans, 5.8 percent for Hispanics, 6.4 percent for Other minorities, and 3.3 percent for women.116
A later study published by the U.S. Chamber of Commerce (2005) is also consistent with these findings from the 1993 NSSBF and the 1992 CBO.117 The Chamber of Commerce survey was conducted in March and April 2005 and detailed the financing problems experienced by small business owners, 95 percent of whom had less than 100 employees. Over 1,000 business owners were interviewed. This survey showed that minority-owned businesses rely heavily on credit cards to fund their businesses; often do not apply for credit, even though they need it, for fear of being denied; and were especially likely to need working capital. In particular, as shown in Table 5.7, minority-owned firms report that availability of credit is their top problem. The biggest difference in responses between minorities and nonminority men and women was availability of credit: 19 percent of nonminority males report credit as their top problem compared with 54 percent for minority males. There was a 15 percentage point difference between minority women and nonminority women. In no other category is there more than an 11 percentage point difference for men or women.
116 Bureau of the Census (1997), Table 5a, p. 46, Table 1, p. 21. 117 Although the CBO is part of the Economic Census, it was not published in 1997. In 2002, the name was changed
to the Survey of Business Owners (SBO). However, questions relating to the importance of access to financial loans and credit to business success were not included in SBO.

Statistical Disparities in Capital Markets
NERA Economic Consulting
128
Table 5.7. Types of Problems Facing Your Business, by Race and Gender
Non-
minority Male
Non-minority Female
Minority Male
Minority Female
African American Hispanic
Asian/ Pacific
Islander
Native American
Availability of credit 19 23 54 38 46 52 34 43
Rising health care costs 60 49 50 41 31 42 66 50
Excessive tax burden 49 46 48 42 46 34 51 50
Lack of qualified workers
37 28 33 17 22 20 34 14
Rising energy costs 37 35 36 35 29 34 44 29
Rising costs of materials 44 47 36 47 53 42 32 43
Legal reform 21 15 15 12 11 10 17 29
Number of firms 415 356 80 81 55 50 41 14
Source: U.S. Chamber of Commerce (2005), p. 55. Note: Percentages may total to more than 100% because respondents had the option to select multiple choices.
In summary, African American-owned and Hispanic-owned firms in particular reported that they had problems with the availability of credit in the past and expected that such difficulties would continue into the future. Whether or not these perceptions are consistent with the presence of discrimination in credit markets will be tested in the econometric analyses to follow.
E. Differences in Loan Denial Rates by Race, Ethnicity or Gender
Evidence presented to this point indicates that minority-owned firms are more likely to be denied loans and report that their lack of access to credit significantly impairs their business. Can these differences be explained by such things as differences in size, creditworthiness, location, or other factors as some have suggested in the literature on discrimination in mortgage lending (Horne, 1994; Bauer and Cromwell, 1994; and Yezer, Phillips, and Trost, 1994)? To address this question, we turn to an econometric examination of whether the loan requests made by minority-owned firms are more likely to be denied, holding constant important differences among firms.
In Table 5.8 and Table 5.9, we report the results from a series of loan denial Probit regressions of the form specified in Equation (1) using data from the 1993 NSSBF for the U.S. and the NEAST

Statistical Disparities in Capital Markets
NERA Economic Consulting
129
region.118 As indicated earlier, the 1993-2003 datasets have the particular advantage that they include information that can be used to proxy an applicant’s creditworthiness. We report estimates from these models that can be interpreted as changes or differences in loan denial probabilities depending on the type of variables considered. For indicator variables such as race, ethnicity and gender, estimates show differences in loan denial probabilities between the indicated group and the base group.119 In Column (1) of Table 5.8 (in which the regression model contains only race and gender indicators), the estimated coefficient of 0.443 on the African American indicator indicates that the denial rate for African American-owned businesses is 44.3 percentage points higher than that for nonminority male-owned firms.120
The remainder of Table 5.8 includes additional explanatory variables to hold constant differences in the characteristics of firms that may vary by race, ethnicity or gender.121 In Column (2) a number of controls are included that distinguish the creditworthiness of the firm and the owner. Many are statistically significant on a two-tailed test at conventional levels of significance with the expected signs. For instance, having been bankrupt or had legal judgments against the firm or owner raises the probability of denial; stronger sales lower this probability. Even after controlling for these differences in creditworthiness, however, African American-owned firms remain 28.8 percentage points more likely than nonminority-owned firms to have their loan request denied.
The models reported in Columns (3) through (5) of Table 5.8 control for an array of additional characteristics of firms. Column (3) adds 39 additional characteristics of the firm and the loan application, including such factors as level of employment, change in employment, the size of the loan request, and the use of the loan. Column (4) includes variables to control for differences across regions of the country and major industry groups. Column (5) adds variables indicating the month and year in which the loan was requested and the type of financial institution to which
118 Firms owned 50-50 by minorities and non-minorities are excluded from this and all subsequent analyses, as are
nonminority firms owned 50-50 by women and men. 119 For “continuous” variables, such as profits and sales, estimates can be thought of as changes in loan denial
probability when the continuous variable changes by one unit. For example, in Column (2) of Table 5.8, the estimated coefficient of -0.003 on owner’s years of experience indicates that one additional year of owner’s experience, on average, is related to 0.3 percentage point reduction in loan denial rate.
120 This estimate largely replicates the raw difference in denial rates between African American-owned and nonminority-owned businesses reported in Table 5.1. The raw differential observed there (0.659 – 0.269 = 0.39) differs slightly from the 0.443 differential reported here because this specification also controls for whether the business is owned by a White Female and because the regressions are unweighted whereas the descriptive statistics are weighted using the sample weights. When a full set of explanatory control variables are included, the unweighted estimates are insignificantly different from the weighted estimates, hence in Table 5.8 and subsequent tables we report only unweighted estimates.
121 In preliminary analyses, these models were also estimated separately, focusing specifically on the differences in coefficient estimates between nonminorities and African Americans. The F-Test conducted to determine whether parameter estimates were the same for African Americans and nonminorities rejected this null hypothesis. Next, the estimates obtained by estimating the model separately by race were used to conduct an Oaxaca (1973) decomposition. The results from this analysis were similar to those obtained by restricting the coefficients to be the same between African Americans and nonminorities and using the coefficient on the African Americans indicator variable to measure the gap between groups. In this chapter, all the results are reported in this simpler format for ease of exposition and interpretation.

Statistical Disparities in Capital Markets
NERA Economic Consulting
130
the firm applied.122 In total, these three columns add 176 variables to the more parsimonious specification reported in Column (2).123 Nevertheless, the estimated disadvantage experienced by African American-owned firms in obtaining credit remains large and statistically significant. The estimate from each of the three additional columns indicates that African American-owned firms are 24 percentage points more likely than nonminority male-owned firms to have their loan application denied even after controlling for the multitude of factors we have taken into consideration.
The results also indicate that Asians/Pacific Islanders had significantly higher denial rates than nonminority males—12 percentage points. There is little evidence in the 1993 national data, however, that denial rates for firms owned by Native Americans or Hispanics were significantly different from the denial rates of firms owned by nonminorities; or that denial rates for firms owned by nonminority women were significantly different from those for firms owned by nonminority men.124
In Table 5.9, we see results for the NEAST region similar to those reported in Table 5.8 for the nation as a whole. The table shows that the results of our loan denial model in the NEAST are not substantially different from the nationwide results reported in Table 5.8. The indicator variable for the NEAST region is insignificantly different from zero. The interaction terms between race/ethnicity/gender and the NEAST region are also insignificant, with the exception of the Hispanic*NEAST interaction, which is positive and close to significance in columns (4) and (5), indicating that Hispanics in the NEAST may also be experiencing credit market discrimination.125
122 Approximately four out of five (80.5%) of the firms who required a loan applied to a commercial bank. Overall,
seventeen different types of financial institutions were tabulated, although only the following accounted for more than 1% of the (weighted) total: Finance Companies (4.9%); Savings Banks (2.5%); Savings & Loans (2.3%); Leasing Companies (2.1%); and Credit Unions (2.0%).
123 One piece of information to which we did not have access in the 1993 NSSBF or the 1998 SSBF because of confidentiality concerns was each firm’s credit rating. A paper by Cavalluzzo, Cavalluzzo and Wolken (2002) was able to incorporate Dun & Bradstreet credit ratings for each firm because the authors’ connection to the Federal Reserve Board enabled them to access the confidential firm identifiers. They added these credit rating variables in a model comparable to that reported here and found the results insensitive to the inclusion. The 2003 SSBF includes Dun & Bradstreet credit ratings for each firm. Below, we discuss the impact of incorporating them into a model similar to that presented in Table 5.8 (see Tables 5.27 and 5.28).
124 It would be a mistake to interpret a lack of statistical significance (as opposed to substantive significance) in any of the tables in Chapter V, or elsewhere in this Study, as a lack of adverse disparity. While tests for statistical significance are very useful for assessing whether chance can explain disparities that we observe, they do have important limitations. First, the fact that a disparity is not statistically significant does not mean that it is due to chance. It merely means that we cannot rule out chance. Second, there are circumstances under which tests for statistical significance are not helpful for distinguishing disparities due to chance from disparities due to other reasons (e.g., discrimination). In the particular statistical application presented in this chapter, the chance that a test for statistical significance will incorrectly attribute to chance disparities that are due to discrimination becomes greater when relatively small sample sizes are present for an affected group. See also Appendix A, “Constitutional Significance,” “Statistical Significance,” and “Substantive Significance.”
125 The number of Native Americans in the NEAST sample was too small to yield statistical results.

Statistical Disparities in Capital Markets
NERA Economic Consulting
131
Table 5.8. Determinants of Loan Denial Rates—USA
(1) (2) (3) (4) (5)
African American 0.443 (11.21)
0.288 (6.84)
0.237 (5.57)
0.235 (5.22)
0.241 (5.13)
Asian/Pacific Islander 0.225 (4.21)
0.171 (3.18)
0.140 (2.56)
0.121 (2.15)
0.119 (2.07)
Native American -0.016 (0.11)
-0.141 (1.06)
-0.097 (0.71)
-0.052 (0.35)
-0.083 (0.56)
Hispanic 0.129 (2.62)
0.070 (1.42)
0.067 (1.36)
0.035 (0.70)
0.031 (0.63)
Nonminority female 0.088 (2.65)
0.048 (1.45)
0.047 (1.45)
0.036 (1.06)
0.033 (0.94)
Judgments 0.143 (2.84)
0.129 (2.56)
0.124 (2.40)
0.121 (2.29)
Firm delinquent 0.176 (6.50)
0.178 (6.43)
0.195 (6.77)
0.208 (7.00)
Personally delinquent 0.161 (4.45)
0.128 (3.56)
0.124 (3.38)
0.119 (3.17)
Bankrupt past 7 years 0.208 (3.11)
0.179 (2.68)
0.162 (2.37)
0.167 (2.33)
$1992 profits (*108) -0.000 (0.89)
-0.000 (1.64)
-0.000 (1.78)
-0.000 (1.83)
$1992 sales (*108) -0.000 (3.08)
-0.000 (3.38)
-0.000 (3.28)
-0.000 (3.38)
$1992 assets (*108) 0.000 (0.51)
0.000 (0.60)
0.000 (0.40)
0.000 (0.37)
$1992 liabilities (*108) 0.000 (0.61)
0.000 (1.11)
0.000 (1.04)
0.000 (1.17)
Owner years of experience -0.003 (2.59)
-0.001 (1.30)
-0.002 (1.55)
-0.002 (1.72)
Owner share of business 0.001 (1.91)
0.000 (0.71)
0.000 (0.26)
0.000 (0.30)
Owner Education (5 indicator variables) No Yes Yes Yes Yes Other Firm Characteristics (17 variables) No No Yes Yes Yes Characteristics of the Loan (13 variables) No No Yes Yes Yes Geographic Division (8 indicator variables) No No No Yes Yes Industry (60 indicator variables) No No No Yes Yes Month/Year of Application (51 indicator variables) No No No No Yes Type of Financial Institution (16 indicator vars.) No No No No Yes
N 2,007 2,007 2,006 1,985 1,973 Pseudo R2 .0608 .1412 .2276 .2539 .2725 Chi2 143.6 333.4 537.3 595.4 635.8 Log likelihood -1108.8 -1013.8 -911.6 -874.8 -848.7
Source: See Table 5.1. Notes: (1) Reported estimates are derivatives from Probit models, t-statistics are in parentheses. Using a two-tailed test, t-statistics greater than 1.64 (1.96) (2.58) are statistically significant at a 90 (95) (99) percent confidence level. (2) “Other firm characteristics” include variables indicating whether the firm had a line of credit, 1990 employment, firm age, metropolitan area, a new firm since 1990, legal form of organization (sole proprietorship, partnership, S-corporation, or C-corporation), 1990-1992 employment change, existing long run relation with lender, geographic scope of market (local, regional, national or international), the value of the firm’s inventory, the level of wages and salaries paid to workers, the firm’s cash holdings, and the value of land held by the firm. (3) “Characteristics of the loan” include the size of the loan applied for, a variable indicating whether the loan was backed by real estate, and twelve variables indicating the intended use of the loan.

Statistical Disparities in Capital Markets
NERA Economic Consulting
132
Table 5.9. Determinants of Loan Denial Rates—Northeast
(1) (2) (3) (4) (5)
African American 0.455 (10.65)
0.289 (6.32)
0.233 (5.05)
0.230 (4.74)
0.225 (4.47)
Asian/Pacific Islander 0.231 (3.95)
0.178 (3.04)
0.148 (2.49)
0.127 (2.06)
0.126 (2.00)
Native American -0.006 (0.04)
-0.136 (1.01)
-0.096 (0.70)
-0.057 (0.39)
-0.087 (0.60)
Hispanic 0.116 (2.19)
0.047 (0.89)
0.044 (0.83)
-0.004 (0.08)
-0.008 (0.16)
Nonminority female 0.093 (2.56)
0.046 (1.28)
0.034 (0.97)
0.022 (0.59)
0.023 (0.61)
African American*NEAST -0.052 (0.55)
0.010 (0.10)
0.023 (0.23)
0.012 (0.13)
0.073 (0.69)
Asian/Pacific Islander*NEAST -0.019 (0.15)
-0.020 (0.16)
-0.038 (0.31)
-0.036 (0.29)
-0.043 (0.34)
Native American*NEAST
Hispanic*NEAST 0.119 (0.83)
0.191 (1.28)
0.174 (1.16)
0.293 (1.83)
0.315 (1.88)
Nonminority female*NEAST -0.012 (0.14)
0.020 (0.23)
0.087 (0.95)
0.083 (0.89)
0.055 (0.59)
NEAST region 0.056 (1.77)
0.047 (1.48)
0.021 (0.66)
-0.058 (1.01)
-0.061 (1.03)
Creditworthiness Controls (4 variables) No Yes Yes Yes Yes Owner Education (5 indicator variables) No Yes Yes Yes Yes Other Firm Characteristics (17 variables) No No Yes Yes Yes Characteristics of the Loan (13 variables) No No Yes Yes Yes Geographic Division (7 indicator variables) No No No Yes Yes Industry (60 indicator variables) No No No Yes Yes Month/Year of Application (51 indicator variables) No No No No Yes Type of Financial Institution (16 indicator vars.) No No No No Yes
N 2,007 2,007 2,006 1,985 1,973 Pseudo R2 .0629 .1438 .2294 .2556 .2743 Chi2 148.62 339.46 541.45 599.45 640.10 Log likelihood -1,106.2 -1,010.8 -909.5 -872.7 -846.6 Source: See Table 5.1. Notes: See Table 5.8. Creditworthiness controls are those used in Table 5.8 above.

Statistical Disparities in Capital Markets
NERA Economic Consulting
133
Although the results provided so far strongly indicate that financial institutions treat African American-owned, Asian/Pacific Islander-owned, and, in the Northeast, Hispanic-owned and small businesses differently in lending than nonminority male-owned businesses, other considerations may limit our ability to interpret this finding as discrimination. Of perhaps greatest concern is the possibility that we may not have adequately controlled for differences in the creditworthiness of firms. If African American-owned firms are less creditworthy and we have failed to sufficiently capture those differences, then we would be inadvertently attributing the racial difference in loan denial rates to discrimination. On the other hand, if financial institutions discriminate against African American-owned firms, then the greater likelihood of denial for African Americans in earlier years is likely to hurt the performance of these firms and appears to make them look less creditworthy. Therefore, controlling for creditworthiness will likely understate the presence of discrimination.
As a check on the foregoing results, therefore, our first approach was to identify the types of information that financial institutions collect in order to evaluate a loan application and compare that with the information available to us in the NSSBF. First, a selection of small business loan applications was collected from various banks. An Internet search of web sites that provide general business advice to small firms was also conducted. Such sites typically include descriptions of the loan application process and list the kinds of information typically requested of applicants.126
Bank loan applications typically request detailed information about both the firm and its owner(s). Regarding the firm, banks typically request information on: (a) type of business, (b) years in business, (c) number of full-time employees, (d) annual sales, (e) organization type (corporation or proprietorship), (f) owner share(s), (g) assets and liabilities, (h) whether the business is a party to any lawsuit, and (i) whether any back taxes are owed. Regarding the owner’s personal finances, banks typically ask for: (a) assets and liabilities, (b) sources and levels of income, and (c) whether the owner has any contingent liabilities. Some applications ask explicitly if the firm qualifies as a minority-owned enterprise for the purposes of certain government loan guarantee programs. The race of the applicant, however, would be readily identifiable even in the absence of such a question since most of these loans would be originated through face-to-face contact with a representative of the financial institution.
These criteria seem to match quite closely the information available in the 1993 NSSBF. The particular strength of the NSSBF is the detail available on the firm, which covers much of the information typically requested on loan application forms. The only shortcoming that we have identified in the 1993 NSSBF data is that less detail is available on the finances of the owner of the firm, as opposed to the firm itself.127 Although our creditworthiness measures enable us to identify those owners who have had serious financial problems (like being delinquent on personal obligations), we have no direct information regarding the owner’s assets, liabilities, and income (as opposed to those of the firm). These factors would be necessary to identify whether
126 An example of a typical application form is presented as Appendix B in Blanchflower, Levine, and Zimmerman
(2003). 127 This is remedied in the 1998 SSBF and the 2003 SSBF, discussed below, both of which contain information on
the owner’s home equity, and personal net worth excluding home equity and business equity.
Statistical Disparities in Capital Markets
NERA Economic Consulting
134
the business owner has sufficient personal resources to draw upon should the business encounter difficulties and to determine the personal collateral available should the firm default on its obligation. We do have measures of the owner’s human capital in the form of education and experience, which likely capture at least some of the differential in available personal wealth across firm owners. Nevertheless, our potentially incomplete characterization of the business owner’s personal financial condition in the 1993 NSSBF dataset may introduce a bias into our analysis if African American business owners have fewer resources than nonminority business owners. As we will see below, however, and as noted in the previous footnote, this deficiency is rectified in the 1998 and 2003 SSBF datasets, with little change in the main findings.
To assess the potential impact of this problem on our results, we separately examined groups of firms who differ in the degree to which personal finances should influence the loan decision and compare the estimated disadvantage experienced by African American-owned firms in different groups. First, we examine proprietorships and partnerships separately from corporations since owners of incorporated businesses are at least somewhat shielded from incurring the costs of a failed business. Second, we divide firms according to size.128 Both larger small businesses and those that have been in existence for some time are more likely to rely on the business’s funds, rather than the owner’s, to repay its obligations. Third, we consider firms that have applied for loans to obtain working capital separately from those firms that seek funds for other purposes (mainly to purchase vehicles, machinery and equipment, and buildings or land). Loans made for one of these other purposes are at least partially collateralized because the financial institution could sell them, albeit at a potentially somewhat reduced rate, should the small business default.129
Results from these analyses provide no indication that omitting the owner’s personal wealth substantially biases the results presented above in Tables 5.8 and 5.9. Estimates presented in row numbers 1 through 8 of Table 5.10 indicate that African American-owned small businesses are significantly more likely to have their loan applications rejected regardless of the category of firm considered. In particular, even when samples are restricted to corporations, larger firms, and firms seeking credit for uses other than working capital, African American-owned firms are 19, 22, and 17 percentage points more likely, respectively, to have their loan application rejected even though personal resources should be less important in these categories. Moreover, in each group where there are two types of firms (large and small, etc.), the estimates for the two types of firms are not significantly different from each other.
128 As reported earlier, the mean and median size of firms is 8.5 and 3.0 full-time equivalent workers, respectively.
Fourteen percent of firms have one or fewer employees and 27 percent have two or fewer employees. In the NEAST, the mean and median size of firms is 8.1 and 3.0 full-time equivalent workers, respectively. Fifteen percent of firms have one or fewer employees and 28 percent have two or fewer employees.
129 As indicated earlier, greater personal wealth may improve a small business’s chances of obtaining credit because it provides collateral should the loan go bad and because wealthy owners can use their own resources to weather bad times, improving the likelihood of repayment. Our separate analysis of corporations and proprietorships and of large and small firms does not account for this second reason because corporations and large businesses may still need to draw on the owner’s personal wealth to help it survive short-term shocks. Businesses that have been in existence for several years, however, are less likely to experience these shocks, making them less likely to require infusions from the owner’s personal wealth. A loan used to purchase equipment that can be sold if the firm defaults similarly insulates the bank from the need to seek repayment directly from the owner.

Statistical Disparities in Capital Markets
NERA Economic Consulting
135
Another issue is whether the racial differences in loan denial rates among firms with similar characteristics can be attributable to differences in the geographic location of African American- and nonminority-owned firms. If, for example, African American-owned firms are more likely to be located in the central city, and a central city location is negatively correlated with profitability and the ability to repay debt, then financial institutions may be acting optimally in rejecting the loan applications of African American-owned firms at a higher rate. As indicated earlier, this type of behavior is labeled “statistical discrimination.” In the subsequent text and tables, we present a limited analysis to address whether or not this type of behavior takes place.130
To identify whether lenders’ behavior is consistent with this hypothesis, we distinguish those firms that self-classified their sales market as being local rather than regional, national, or international. A central city location should have a greater impact on future profit expectations for those firms that operate on a local level. If minority-owned firms are more likely to locate in the central city, racial differences in loan approval rates should be greater in the firms that sell in the local market area. The results of this test, reported in row numbers 9 and 10 of Table 5.10, reject the hypothesis that differences in loan denial rates are attributable to different propensities to locate in the center of a city. Estimates indicate that African American-owned firms that sell to the local market are 17 percentage points more likely to have their loan applications denied compared to a 20 percent excess denial rate for firms selling primarily to regional, national, or international markets. In the NEAST, this result is unchanged.
130 A strong test to distinguish between statistical discrimination and “Becker-Type” discrimination (referring to the
standard economic model of discrimination first expounded by University of Chicago economist Gary Becker) would require a tremendous amount of detail about the specific location of the firm, characteristics of its surrounding area, characteristics of neighboring firms, and the like, which were unavailable to us. As indicated earlier, both forms of discrimination are illegal and this chapter applies a definition that incorporates both.
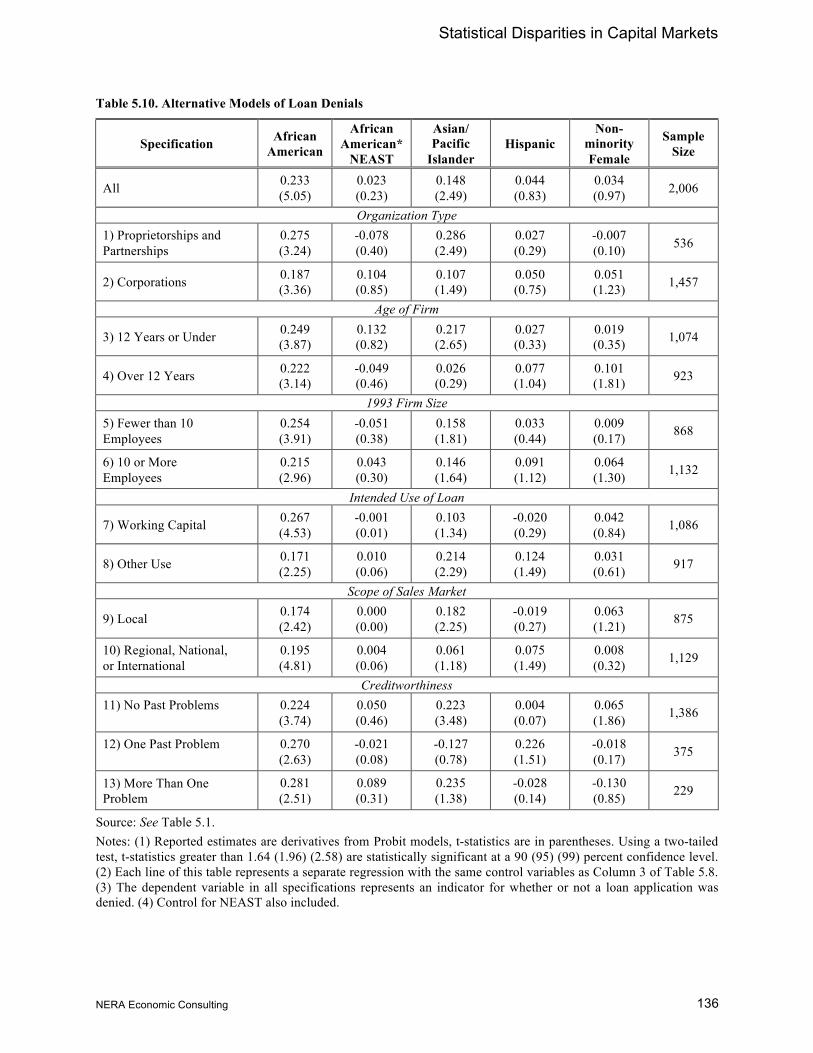
Statistical Disparities in Capital Markets
NERA Economic Consulting
136
Table 5.10. Alternative Models of Loan Denials
Specification African American
African American*
NEAST
Asian/ Pacific
Islander Hispanic
Non-minority Female
Sample Size
All 0.233 (5.05)
0.023 (0.23)
0.148 (2.49)
0.044 (0.83)
0.034 (0.97) 2,006
Organization Type 1) Proprietorships and Partnerships
0.275 (3.24)
-0.078 (0.40)
0.286 (2.49)
0.027 (0.29)
-0.007 (0.10) 536
2) Corporations 0.187 (3.36)
0.104 (0.85)
0.107 (1.49)
0.050 (0.75)
0.051 (1.23) 1,457
Age of Firm
3) 12 Years or Under 0.249 (3.87)
0.132 (0.82)
0.217 (2.65)
0.027 (0.33)
0.019 (0.35) 1,074
4) Over 12 Years 0.222 (3.14)
-0.049 (0.46)
0.026 (0.29)
0.077 (1.04)
0.101 (1.81) 923
1993 Firm Size 5) Fewer than 10 Employees
0.254 (3.91)
-0.051 (0.38)
0.158 (1.81)
0.033 (0.44)
0.009 (0.17) 868
6) 10 or More Employees
0.215 (2.96)
0.043 (0.30)
0.146 (1.64)
0.091 (1.12)
0.064 (1.30) 1,132
Intended Use of Loan
7) Working Capital 0.267 (4.53)
-0.001 (0.01)
0.103 (1.34)
-0.020 (0.29)
0.042 (0.84) 1,086
8) Other Use 0.171 (2.25)
0.010 (0.06)
0.214 (2.29)
0.124 (1.49)
0.031 (0.61) 917
Scope of Sales Market
9) Local 0.174 (2.42)
0.000 (0.00)
0.182 (2.25)
-0.019 (0.27)
0.063 (1.21) 875
10) Regional, National, or International
0.195 (4.81)
0.004 (0.06)
0.061 (1.18)
0.075 (1.49)
0.008 (0.32) 1,129
Creditworthiness 11) No Past Problems
0.224 (3.74)
0.050 (0.46)
0.223 (3.48)
0.004 (0.07)
0.065 (1.86) 1,386
12) One Past Problem
0.270 (2.63)
-0.021 (0.08)
-0.127 (0.78)
0.226 (1.51)
-0.018 (0.17) 375
13) More Than One Problem
0.281 (2.51)
0.089 (0.31)
0.235 (1.38)
-0.028 (0.14)
-0.130 (0.85) 229
Source: See Table 5.1. Notes: (1) Reported estimates are derivatives from Probit models, t-statistics are in parentheses. Using a two-tailed test, t-statistics greater than 1.64 (1.96) (2.58) are statistically significant at a 90 (95) (99) percent confidence level. (2) Each line of this table represents a separate regression with the same control variables as Column 3 of Table 5.8. (3) The dependent variable in all specifications represents an indicator for whether or not a loan application was denied. (4) Control for NEAST also included.

Statistical Disparities in Capital Markets
NERA Economic Consulting
137
We also estimate models that address a potential weakness in the specific functional form with which we control for differences in credit history across firms. As shown in Tables 5.1 and 5.2, African American-owned firms are considerably more likely to have had troubles in the past in the form of judgments against them, late payments by the firm or its owner, or past bankruptcies. The model specifications reported in Tables 5.8 and 5.9 implicitly assume that these past problems are additive in their effect on loan denials and one might suspect the marginal impact would rise as past problems rise. Therefore, in the final three rows of Table 5.10, we separated firms by the number of past problems experienced. In Rows 11 through 13, we restricted the sample to those firms that have never had any past credit problems, those firms that reported one problem only, and those firms that reported more than one of these problems, respectively. The results indicate that even African American-owned firms with clean credit histories are at a significant disadvantage in getting their loans approved, holding constant their other characteristics. In fact, the estimated differential in loan approval rates between African American- and nonminority-owned firms is statistically indistinguishable within each of these groups. Asian/Pacific Islander-owned firms and nonminority female-owned firms with clean credit histories are also at a significant disadvantage relative to nonminority-male owned firms.
Finally, we considered whether African American-owned firms are treated differently from nonminority-owned firms when requesting credit from other sources. The source of credit we examined is credit cards. Such an analysis provides a unique advantage because credit card applications are more likely to be filled out and mailed in, so it is more likely that the race of the applicant is unknown to the financial institution, at least in the case of African American-owned firms and Native American-owned firms, where surname is unlikely to provide any signal about minority status. On the other hand, for Asian/Pacific Islander and Hispanic applicants, it is possible that surname does provide such a signal, albeit a somewhat noisy one. The 1993 NSSBF asked respondents whether they used either a business or personal credit card for business purposes. Although our analysis of use of credit cards does not condition on application, a finding that African American- and nonminority-owned small businesses are equally likely to use credit cards may still provide evidence supporting discrimination in small-business lending. In fact, if financial institutions discriminate against African Americans in providing small business loans, we may even expect to see African Americans use credit cards more often than nonminorities since they have fewer alternatives. Even though many institutions may offer both types of credit, they may only be aware of the race of the applicant in a small business loan.131
In Tables 5.11 and 5.12, we examine the probability that a firm uses either a business credit card (Row 1) or a personal credit card (Row 2) to finance business expenses holding constant other differences across firms.132 There is no evidence, either for the U.S. as a whole or for the 131 It appears that race may also rarely be known to those institutions that issue credit ratings. As we mentioned
above, Cavalluzo, Cavalluzo and Wolken (2002) show that Dun & Bradstreet Credit Ratings are not helpful in explaining racial disparities in loan denials. Although we are not privy to Dun & Bradstreet’s methodology for establishing its credit ratings, we do know from long experience that the good indicators of ownership by race are sometimes lacking in Dun & Bradstreet’s master business identifier file. Indeed, this is the reason why NERA’s availability estimation methodology requires us to create a master directory of minority- and women-owned businesses for merging with Dun & Bradstreet’s data.
132 On average, 29 percent of all firms use business credit cards and 41 percent use personal credit cards for business use; these levels vary only modestly by race and ethnicity. In the NEAST region, the figures are 28 percent and 39 percent, respectively.
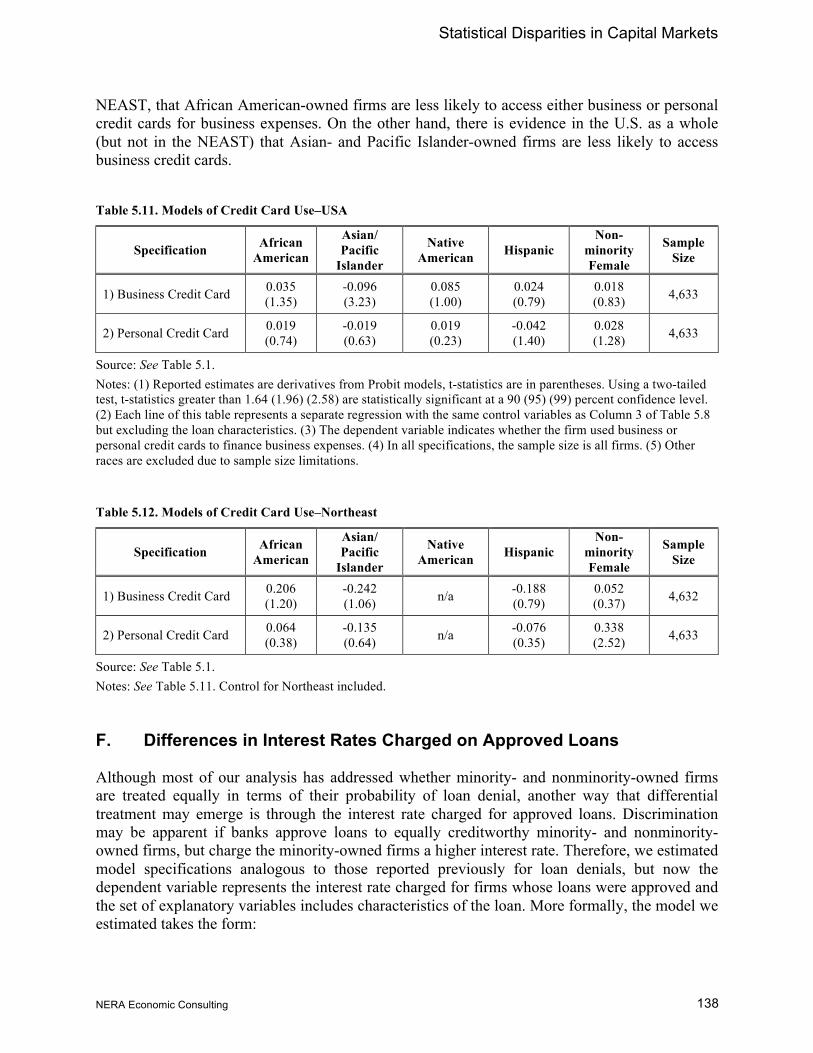
Statistical Disparities in Capital Markets
NERA Economic Consulting
138
NEAST, that African American-owned firms are less likely to access either business or personal credit cards for business expenses. On the other hand, there is evidence in the U.S. as a whole (but not in the NEAST) that Asian- and Pacific Islander-owned firms are less likely to access business credit cards. Table 5.11. Models of Credit Card Use–USA
Specification African American
Asian/ Pacific
Islander
Native American Hispanic
Non-minority Female
Sample Size
1) Business Credit Card 0.035 (1.35)
-0.096 (3.23)
0.085 (1.00)
0.024 (0.79)
0.018 (0.83) 4,633
2) Personal Credit Card 0.019 (0.74)
-0.019 (0.63)
0.019 (0.23)
-0.042 (1.40)
0.028 (1.28) 4,633
Source: See Table 5.1. Notes: (1) Reported estimates are derivatives from Probit models, t-statistics are in parentheses. Using a two-tailed test, t-statistics greater than 1.64 (1.96) (2.58) are statistically significant at a 90 (95) (99) percent confidence level. (2) Each line of this table represents a separate regression with the same control variables as Column 3 of Table 5.8 but excluding the loan characteristics. (3) The dependent variable indicates whether the firm used business or personal credit cards to finance business expenses. (4) In all specifications, the sample size is all firms. (5) Other races are excluded due to sample size limitations.
Table 5.12. Models of Credit Card Use–Northeast
Specification African American
Asian/ Pacific
Islander
Native American Hispanic
Non-minority Female
Sample Size
1) Business Credit Card 0.206 (1.20)
-0.242 (1.06) n/a -0.188
(0.79) 0.052 (0.37) 4,632
2) Personal Credit Card 0.064 (0.38)
-0.135 (0.64) n/a -0.076
(0.35) 0.338 (2.52) 4,633
Source: See Table 5.1. Notes: See Table 5.11. Control for Northeast included.
F. Differences in Interest Rates Charged on Approved Loans
Although most of our analysis has addressed whether minority- and nonminority-owned firms are treated equally in terms of their probability of loan denial, another way that differential treatment may emerge is through the interest rate charged for approved loans. Discrimination may be apparent if banks approve loans to equally creditworthy minority- and nonminority-owned firms, but charge the minority-owned firms a higher interest rate. Therefore, we estimated model specifications analogous to those reported previously for loan denials, but now the dependent variable represents the interest rate charged for firms whose loans were approved and the set of explanatory variables includes characteristics of the loan. More formally, the model we estimated takes the form:

Statistical Disparities in Capital Markets
NERA Economic Consulting
139
(2) Ii = β0 + β1CWi + β2Xi + β3Ri + β4LCi + εi,
where I represents the interest rate charged on the loan, LC represents characteristics of the loan (See Table 5.8 notes for a full list of the variables included in this set), εi is a term capturing random factors, and all other notations are the same as in equation (1).
An important consideration is whether the interest rate may be treated as exogenous, as our reduced form model assumes. In the context of small business loans, in which it is possible that the loan terms may be negotiated in the determination process, this assumption may not be valid. As such, a model that simultaneously estimates the interest rate and the loan decision might be appropriate, except that the interest rate that would be charged to firms whose loans were denied is not available in our data. Alternatively, one could estimate an interest rate model alone for those firms whose loan was approved, adjusting for the potential bias brought about by sample selection. To properly identify such a model, however, a variable is required that is linked to the loan denial decision, but unrelated to the level of interest charged on approved loans; no such variable exists in the data.
Nevertheless, one would expect these considerations to impose a downward bias on the estimated differential in interest rates charged on loans to African American-owned firms. Those firms whose loans were rejected would have been charged higher interest rates than those approved. Since African American-owned businesses were considerably more likely to be rejected holding constant differences in creditworthiness, one would expect any differential in interest rate to be even greater if those firms were included in the sample. We overlook this implication in the results reported below, but its impact should be kept in mind.
The results obtained from estimating equation (2) are reported in Row 1 of Table 5.13, which includes the complete set of control variables comparable to those in Column 5 of Table 5.8. Estimates indicated that African American-owned firms pay rates of interest that are roughly one percent (100 basis points) higher than similarly situated nonminority-owned firms, while Hispanic-owned firms pay roughly 50 basis points more than similarly situated nonminority-owned firms. Row 2 shows that even African American-owned firms with good credit histories, and to a lesser extent other minority groups as well, are charged higher interest rates relative to nonminority-owned firms.133
The remainder of the table presents similar specification checks to those reported in Table 5.10. Recall that most of these models identify firms for which the firm’s own history is likely to be a more important contributor to its creditworthiness. The specifications by sales market are designed to distinguish the impact of central city location. Unfortunately, sample sizes are smaller in these specifications and reduce the power of the analysis. Nevertheless, we still find that regardless of organization type or market scope, African American-owned firms face statistically significantly higher interest rates. Overall, the evidence presented indicates that African Americans face disadvantages in the market for small business credit that does not appear to be attributable to differences in geography or creditworthiness; and to a lesser extent
133 Separate estimates from firms that have had past credit problems are not presented since the higher likelihood of
their being denied credit restricts the size of the sample and limits the ability to provide a powerful test of the interest rates charged if they are approved.

Statistical Disparities in Capital Markets
NERA Economic Consulting
140
Hispanics and Asians/Pacific Islanders face disadvantages in the market for small business credit that does not appear to be attributable to differences in creditworthiness.
Table 5.13. Models of Interest Rate Charged—USA
Specification African American
Asian/ Pacific
Islander
Native American Hispanic
Non-minority Female
Sample Size
1) All loans (controls as in Column 5, Table 5.8)
1.034 (3.72)
0.413 (1.37)
-0.427 (0.63)
0.517 (1.97)
0.025 (0.14)
1,454
Creditworthiness
2) No credit problems 1.187 (3.27)
0.485 (1.33)
0.910 (1.07)
0.435 (1.48)
0.129 (0.66)
1,137
Organization Type 3) Proprietorships and
Partnerships 1.735 (2.57)
0.826 (1.03)
2.589 (0.90)
1.008 (1.74)
-0.239 (0.53)
364
4) Corporations 0.660 (2.04)
0.359 (1.07)
-0.585 (0.86)
0.491 (1.53)
0.127 (0.66)
1,090
1993 Firm Size
5) Fewer than 10 Employees 1.200 (2.58)
-0.247 (0.41)
-0.010 (0.01)
0.783 (1.75)
-0.311 (1.02)
574
6) 10 or More Employees 0.450 (1.15)
0.446 (1.21)
-0.197 (0.25)
0.515 (1.37)
0.164 (0.77)
880
Scope of Sales Market
7) Local 0.751 (1.55)
-0.073 (0.13)
1.773 (1.12)
0.805 (2.05)
0.324 (1.08)
633
8) Regional, National, or International
1.544 (4.26)
1.185 (2.93)
-1.368 (1.85)
0.392 (0.96)
-0.163 (0.73)
821
Source: See Table 5.1. Notes: (1) Reported estimates are Ordinary Least Squares (OLS) coefficients, t-statistics in parentheses. Using a two-tailed test, t-statistics greater than 1.64 (1.96) (2.58) are statistically significant at a 90 (95) (99) percent confidence level. (2) Each line of this table represents a separate regression with all of the control variables as Column 5 of Table 5.8 (except where specified) as well as: an indicator variable for whether the loan request was for a fixed interest rate loan, the length of the loan, the size of the loan, whether the loan was guaranteed, whether the loan was secured by collateral, and 7 variables identifying the type of collateral used if the loan was secured. (3) The sample consists of firms that had applied for a loan and had their application approved. (4) “No credit problems” means that neither the firm nor the owner had been delinquent on payments over 60 days, no judgments against the owner for the preceding 3 years, and the owner had not been bankrupt in the preceding 7 years.

Statistical Disparities in Capital Markets
NERA Economic Consulting
141
Table 5.14 shows results for the NEAST. Findings are similar to those observed for the nation as a whole.
Table 5.14. Models of Interest Rate Charged—Northeast
Specification African American
African American * NEAST
Asian/ Pacific
Islander
Native American Hispanic
Non-minority Female
Sample Size
1) All loans (controls as in Column 5, Table 5.9)
0.956 (3.22)
0.592 (0.79)
0.374 (1.13)
-0.406 (0.60)
0.619 (2.23)
0.181 (0.99) 1,454
Creditworthiness
2) No credit problems 1.286 (3.33)
-0.851 (0.81)
0.381 (0.93)
0.936 (1.10)
0.621 (2.01)
0.247 (1.20) 1,137
Organization Type 3) Proprietorships and
Partnerships 1.820 (2.42)
-0.927 (0.53)
0.974 (1.16)
3.334 (1.16)
1.046 (1.68)
0.149 (0.31) 364
4) Corporations 0.578 (1.67)
0.632 (0.71)
0.233 (0.61)
-0.587 (0.86)
0.505 (1.50)
0.196 (0.95) 1,090
1993 Firm Size 5) Fewer than 10
Employees 1.267 (2.55)
-0.264 (0.20)
-0.042 (0.07)
0.019 (0.01)
0.797 (1.65)
-0.215 (0.64) 574
6) 10 or More Employees
0.374 (0.89)
0.588 (0.59)
0.334 (0.81)
-0.203 (0.26)
0.451 (1.16)
0.279 (1.24) 880
Scope of Sales Market
7) Local 0.798 (1.55)
-0.184 (0.12)
0.019 (0.03)
1.767 (1.12)
0.871 (2.13)
0.500 (1.55) 633
8) Regional, National, or International
1.378 (3.56)
1.046 (1.10)
1.158 (2.48)
-1.353 (1.83)
0.604 (1.36)
-0.129 (0.54) 821
Source: See Table 5.1. Notes: See Table 5.13.
G. Loan Approval Rates and Access to Credit
The results presented so far may be biased toward finding too small a disparity between nonminority- and African American-owned firms because those minority-owned firms that actually apply for credit may represent a selected sample of the most creditworthy. More marginal minority-owned firms whose loans may have been accepted had they been owned by nonminorities may not even be among the pool of loan applicants. First, these firms may have gone out of business or may not have had the opportunity to commence operations because of their inability to obtain capital. Second, some existing firms may have chosen not to apply for credit because they were afraid their application would be rejected due to prejudice.
Although we have no direct evidence regarding the first proposition, data from the 1993 NSSBF provide some evidence for the second: African American- and Hispanic-owned firms are much more likely to report that they did not apply for a loan, even though they needed credit, because

Statistical Disparities in Capital Markets
NERA Economic Consulting
142
they thought they would be rejected. Table 5.15 reports estimates from Probit models in which the dependent variable is an indicator variable representing failure to apply for a loan fearing denial for all firms. The first row presents racial differences without controlling for any other characteristics of firms, and the results indicate that African American-owned, Hispanic-owned, Native American-owned, and Asian/Pacific Islander-owned firms are 41, 24, 13, and 10 percentage points more likely than nonminority-owned firms to withhold an application fearing denial.
Of course, some of this difference may be attributable to differences in creditworthiness across firms since firms that are bad credit risks should be afraid that their loan would be denied. To adjust for this, the second row of Table 5.15 reports comparable models that control for differences in creditworthiness and other characteristics of firms. The results from this specification show that the greater fear of rejection among African American- and Hispanic-owned firms can partially be explained by these differences. Nevertheless, a gap of 26, 5, and 16 percentage points still exists for African American-owned, Asian/Pacific Islander-owned and Hispanic-owned firms relative to nonminority-owned firms with similar characteristics. In fact, when asked directly why they were afraid to apply for loans, African American-owned firms and Hispanic-owned firms were far more likely to report prejudice as the reason (19 percent and 8 percent, respectively, compared to less than 3 percent for nonminority-owned firms).134 Results obtained in section (b) of Table 5.15 for the NEAST division are very similar to those found for the nation as a whole. As section (c) of Table 5.15 shows, African American-owned firms in construction and design industries also appear to be fearful of applying because of the possibility of their application being turned down.135
If these minority-owned firms had applied for credit and were rejected because of discrimination, estimates of racial disparities based only upon loan applicants (as in Tables 5.8 and 5.9) would be understated. The perception of prejudice among these firms, however, does not necessarily imply that selection bias is present. Those firms that failed to apply because they feared rejection may have had similar loan denial rates as other minority-owned firms with comparable levels of creditworthiness that did apply. If those firms chose to apply for a loan, differences by race in the combined denial rate of the actual and potential applicants would be the same as what we have estimated for the observed sample of applicants.
More formally, suppose that loan denial rates for equally creditworthy nonminority- and minority-owned firms that applied for credit are θw and θm, respectively; the measure of discrimination employed in the previous analysis is θm - θw. Now suppose that firms that are equally creditworthy, but chose not to apply for a loan because they feared rejection, would have been denied at the rates θw and ψm for nonminority- and minority-owned firms, respectively. Among the nonminority-owned firms, the denial rate is identical regardless of whether the firm chose to apply or not, conditional upon creditworthiness. Among minority-owned firms, however, those who were afraid to apply may have been denied at a higher rate (perhaps because of their greater propensity to locate in the central city or other factors that are related to their
134 Other reasons given, including “too little collateral,” “poor credit history,” and “poor balance sheet,” are
comparable across groups. Firms could report more than one reason. 135 It was not possible to report separate construction results in earlier tables because of small sample sizes.

Statistical Disparities in Capital Markets
NERA Economic Consulting
143
race, but unrelated to creditworthiness) compared with other minority-owned firms. Then the correct representation of the disadvantage faced by minority-owned firms is [ηθm + (1-η) ψm] - θw, where η represents the share of minority-owned firms desiring credit that submitted an application. Our earlier findings are biased if θm is not equal to ψm.
Table 5.15. Racial Differences in Failing to Apply for Loans Fearing Denial
Specification African American
Asian/ Pacific
Islander
Native American Hispanic
Non-minority Female
a) USA No Other Control Variables (n=4,637)
0.405 (16.65)
0.099 (3.61)
0.134 (1.72)
0.235 (8.28)
0.031 (1.54)
Full Set of Control Variables (same as Table 5.8, Column 3 except for loan characteristics) (n=4,633)
0.257 (10.02)
0.054 (1.98)
0.019 (0.27)
0.164 (5.69)
-0.008 (0.38)
b) Northeast No Other Control Variables, except for NEAST dummy and race* NEAST interactions (n=4,636)
0.434 (16.29)
0.110 (3.65)
0.128 (1.60)
0.233 (7.57)
0.037 (1.63)
Full Set of Control Variables (same as Table 5.8, Column 3 except for loan characteristics) (n=4,632)
0.287 (10.13)
0.061 (2.04)
0.016 (0.22)
0.164 (5.29)
-0.005 (0.25)
c) Construction and Design No Other Control Variables (n=781)
0.350 (6.74)
0.109 (1.27)
-0.087 (0.54)
0.150 (2.22)
-0.007 (0.12)
Full Set of Control Variables (same as Table 5.8, Column 3 except for loan characteristics) (n=781)
0.181 (3.67)
0.064 (0.78)
-0.132 (1.00)
0.039 (0.65)
-0.063 (1.32)
Source: See Table 5.1. Notes: (1) Reported estimates are Probit derivatives, t-statistics in parentheses. Using a two-tailed test, t-statistics greater than 1.64 (1.96) (2.58) are statistically significant at a 90 (95) (99) percent confidence level. (2) Sample consists of all firms. (3) Dependent variable equals one if the firm said they did not apply for a loan fearing denial, zero otherwise.
One approach that is frequently employed to address such a problem is to estimate a “Heckman-correction” that would formally model the application process in conjunction with the loan outcome for those who applied. The difficulty with this methodology in the present context is that it is only correctly implemented when some variable is present that is correlated with a firm’s decision to apply for a loan, but is independent of the financial institution’s decision to approve or deny the request. Unfortunately, the NSSBF data do not appear to contain any variables that would satisfy these conditions, so we are unable to implement this methodology.136
136 The only variable that potentially could meet these conditions in the NSSBF data is the distance between a firm
and the nearest financial institution. If greater distance reduced a firm’s information regarding the availability of funds, it might be related to the decision to apply for a loan. On the other hand, the creditworthiness of the firm should be independent of its location and should be unlikely to enter into the approval process. Unfortunately, we did not find a direct relationship between distance to the nearest financial institution and the probability of

Statistical Disparities in Capital Markets
NERA Economic Consulting
144
As an alternative that answers a different, but related, question, we consider the ability of firms to get credit among those who desired it, regardless of whether or not they applied. This amounts to analyzing access to credit rather than loan approval and includes in the denominator those firms that needed credit but did not apply because they feared rejection. If differences by race in this rate among all firms who needed credit are greater than differences by race in the rate of denial among loan applicants, then this would indicate that African American- and other minority-owned firms have even less access to credit than an analysis of loan applicants would indicate.
Table 5.16. Models of Failure to Obtain Credit Among Firms that Desired Additional Credit
Specification African American
Asian/ Pacific
Islander
Native American Hispanic
Non-minority Female
a) USA No Other Control Variables (n=2,647)
0.455 (14.85)
0.299 (6.83)
0.188 (1.57)
0.297 (7.77)
0.126 (4.01)
Full Set of Control Variables (same as Table 5.8, Column 3 except for loan characteristics) (n=2,644)
0.276 (6.93)
0.180 (3.42)
-0.009 (0.06)
0.165 (3.51)
0.049 (1.38)
b) Northeast No Other Control Variables (n=2,647)
0.469 (14.28)
0.321 (6.85)
0.184 (1.48)
0.295 (7.11)
0.129 (3.72)
Full Set of Control Variables (same as Table 5.8, Column 3 except for loan characteristics) (n=2,644)
0.290 (6.72)
0.209 (3.68)
-0.016 (0.11)
0.168 (3.31)
0.033 (0.84)
c) Construction & Design No Other Control Variables (n=2,647)
0.413 (6.12)
0.196 (1.46)
0.128 (0.36)
0.255 (2.71)
0.043 (0.51)
Full Set of Control Variables (same as Table 5.8, Column 3 except for loan characteristics) (n=2,644)
0.051 (2.86)
0.015 (0.53)
-0.015 (0.41)
0.019 (1.00)
-0.010 (1.04)
Source: See Table 5.1. Notes: (1) Reported estimates are Probit derivatives, t-statistics in parentheses. Using a two-tailed test, t-statistics greater than 1.64 (1.96) (2.58) are statistically significant at a 90 (95) (99) percent confidence level. (2) The sample consists of all firms that applied for loans along with those who needed credit, but did not apply for fear of refusal. (3) Failure to obtain credit includes those firms that were denied and those that did not apply for fear of refusal. (4) Dependent variable is set to one if the firm failed to obtain credit and to zero if the firm applied for credit and had their loan application approved.
To test this proposition, we estimate a regression model comparable to the one reported in Table 5.10 for the sample of firms that applied for a loan, except that this analysis considers all firms seeking credit and treats those who did not apply for fear of rejection as denials. The sample excludes firms that did not need additional credit in the preceding three years. The results, reported in Table 5.16, are consistent with the previous analysis; we find that selection is not much of an issue for African American-owned firms nationally, Asian/Pacific Islander-owned firms nationally, or in the NEAST region. Regardless of whether we consider denial rates among
applying for a loan. This may be due to the fact that few firms are located more than a very short distance from the nearest financial institution.

Statistical Disparities in Capital Markets
NERA Economic Consulting
145
applicants or denial rates among firms that desired additional credit, African American-owned firms are roughly 30 percentage points less likely to obtain credit once control variables are included and even higher than that when they are not. For Hispanic-owned firms, however, some selection bias is evident. Among the pool of loan applicants, Hispanic-owned firms are not statistically significantly more likely to be denied than other firms with the same characteristics (See, e.g., Table 5.8, Column 5).
Among the pool of firms seeking additional credit but not applying for fear of denial, however, Hispanic-owned firms are 17 percentage points more likely to be denied access to credit, both nationally and in the NEAST, and these differences are statistically significant.
H. Analysis of Credit Market Discrimination in the U.S. in 1998
We turn next to an examination of the extent to which discrimination in the credit market has changed since 1993 using data from the 1998 SSBF conducted by the Board of Governors of the Federal Reserve System.137 This section updates the estimates obtained above using the 1993 NSSBF. Two complications are that the overall sample size is smaller and a number of the questions have been changed. However, the result is still clear—African American-owned firms face discrimination in the credit market. In addition, there is evidence of discrimination in the credit market against other minority-owned firms as well. We present four sections of evidence, all of which are consistent with our findings from the 1993 survey.
1. Qualitative Evidence
Consistent with the 1993 survey, African American-owned firms in the 1998 survey report that the biggest problem their firm currently faces is “financing and interest rates” (Table 5.17). In the 1993 survey, respondents were asked to report problems in the preceding 12 months (Tables 5.3 and 5.4) and over the next 12 months (Tables 5.5 and 5.6). Interestingly, even though credit availability was by far the most important category for African Americans (21 percent in Table 5.5), interest rates were relatively unimportant (2 percent). The 1998 SSBF, however, did not report separate categories.
137 The target population of the survey was for-profit businesses with fewer than 500 employees that were either a
single establishment or the headquarters of a multiple establishment company, and were not agricultural firms, financial institutions, or government entities. These firms also had to be in business during December 1998. Data were collected for fiscal year-end 1998. Like its 1993 counterpart, the purpose of this survey was to gather information about small business financial behavior and the use of financial services and financial service providers by these firms. The objectives of the survey were to collect information that can inform researchers and policy makers on the availability of credit to small businesses; the location of the sources of financial services; the types of financial services used, including checking accounts, savings accounts, various types of credit, credit cards, trade credit, and equity injections; as well as the firm’s recent credit acquisition experiences. The survey also investigated the level of debt held by these firms and their access to credit. Additionally, the survey collected information on firm and owner demographics, as well as the firm’s recent income statement and balance sheet.

Statistical Disparities in Capital Markets
NERA Economic Consulting
146
Table 5.17. What is the Most Important Problem Facing Your Business Today?
Non-minority
Male
African American Other Hispanic
Non-minority Female
Total
Financing and interest rates 5.8% 18.2% 10.6% 8.1% 6.2% 6.8% Taxes 7.7% 1.9% 5.3% 3.1% 6.6% 6.9% Inflation 0.4% 0.6% 0.0% 1.0% 0.4% 0.4% Poor sales 7.0% 5.9% 11.6% 7.0% 8.3% 7.5% Cost/availability of labor 3.9% 3.3% 2.4% 3.5% 4.5% 3.9% Government regulations/red tape 7.1% 3.0% 4.8% 8.1% 6.5% 6.8% Competition (from larger firms) 11.1% 10.7% 10.6% 18.4% 10.2% 11.3% Quality of labor 14.4% 11.0% 9.4% 8.7% 9.1% 12.6% Cost and availability of insurance 2.6% 1.0% 0.8% 0.0% 2.3% 2.2% Other 11.4% 10.0% 8.3% 16.0% 12.7% 11.7% Cash flow 4.6% 10.9% 6.3% 3.5% 3.3% 4.6% Capital other than working capital 1.1% 1.7% 4.1% 0.8% 1.3% 1.3% Acquiring and retaining new customers 3.1% 3.9% 5.0% 1.8% 3.3% 3.2% Growth of firm/industry 0.9% 1.0% 1.2% 0.1% 0.4% 0.8% Overcapacity of firm/industry 0.1% 0.0% 0.0% 0.3% 0.0% 0.1% Marketing/advertising 2.1% 3.9% 2.5% 2.8% 3.6% 2.5% Technology 1.4% 1.2% 1.6% 2.6% 1.3% 1.5% Costs, other than labor 2.7% 1.8% 2.5% 3.6% 3.8% 2.9% Seasonal/cyclical issues 1.3% 1.2% 0.7% 0.4% 0.7% 1.1% Bill collection 2.8% 2.2% 2.4% 2.6% 2.8% 2.8% Too much work/not enough time 3.6% 2.2% 4.3% 1.4% 5.7% 3.9% No problems 4.6% 4.3% 5.6% 5.8% 6.4% 5.1% Not ascertainable 0.4% 0.0% 0.0% 0.0% 0.7% 0.4%
Source: NERA calculations from the 1998 SSBF (n=3,561). Note: Results are weighted.

Statistical Disparities in Capital Markets
NERA Economic Consulting
147
2. Differences in Loan Denial Rates by Race/Ethnicity
In 1998 as in 1993, in comparison with firms owned by nonminority males, minority- and female-owned firms were less creditworthy, more likely to have their loan applications turned down, more likely not to apply for a loan for fear of being denied, and consistently smaller and younger. Moreover, their owners had lower amounts of both home and non-home equity. Minority-owned firms in general, and African American-owned firms in particular, were much less likely to be classified as having a “low risk” credit rating by Dun & Bradstreet.138
In the 1993 survey, respondents were asked: “During the last three years has the firm applied for credit or asked for the renewal of terms on an existing loan?” In 1998, a narrower question limited to new loans was asked: “Did the firm apply for new loans in the last three years?” In 1993, 43 percent answered the question in the affirmative compared with 27 percent in 1998. Despite the fact that in 1993 the question was broader, the pattern of denials by race and gender is similar across the years. As can be seen below, minority-owned firms were especially likely to have their loan applications denied.
Percentage of Loan Applications Denied
1993 1998 Nonminority males 26.2% 24.4% African Americans 65.9% 62.3% Asians/Pacific Islanders, Native Americans, etc. 39.9% 47.0% Hispanics 35.9% 49.9% Nonminority females 30.1% 23.5% Overall 28.8% 28.6%
Similarly, the proportion of firms reporting that they did not apply for fear of being denied is similar by race, ethnicity, and gender across the two survey years. More than half of African American owners did not apply for a loan for fear of being denied compared with only one out of five nonminority males.
Percentage Not Applying for Fear of Denial
1993 1998 Nonminority males 22.5% 20.2% African Americans 60.7% 53.9% Asians/Pacific Islanders, Native Americans, etc. 27.5% 23.1% Hispanics 41.5% 34.3% Nonminority females 22.7% 24.2% Overall 24.7% 23.3%
In the 1998 SSBF survey, respondents who were denied loans were asked if they believed there were reasons other than the official ones provided by their financial institution as to why their loan applications were turned down. Among numerous options provided were the following:
a) Prejudice on a racial/ethnic basis.
138 Information on home and non-home equity or on the Dun & Bradstreet credit rating was not available in the
1993 survey.

Statistical Disparities in Capital Markets
NERA Economic Consulting
148
b) Prejudice against women.
c) Prejudice against the business location.
d) Prejudice against the business type.
e) Prejudice or discrimination (not-specified or other).
Among firm owners who had applied for credit within the last three years and were denied, 34.1 percent believed there were reasons for their denial beyond the official explanation provided by the financial institution. Among nonminorities, 7.7 percent suspected some sort of prejudice. By contrast, the figure among minorities was 25.8 percent. Among owners who needed credit but did not apply for fear of denial, a similar pattern was observed. Only 1.7 percent of nonminorities stated prejudice was the reason, whereas among minorities the figure was 6.8 percent.
In Tables 5.8 and 5.9, the determinants of loan denial rates were estimated using data from the 1993 NSSBF. It was found that African American-owned firms were almost twice as likely to have their loans denied than nonminority male-owned firms, even after controlling for a host of variables included primarily to control for the possibility that minority-owned firms are smaller and less creditworthy than those owned by nonminority men.
A similar exercise is performed below in Tables 5.18 and 5.19 using data from the 1998 SSBF. Column 1 in Table 5.18 shows that African American-owned firms in 1998 had a 42.2 percentage point higher probability of denial than nonminority male-owned firms before taking account of creditworthiness of the firm or any other characteristics. For 1993, the comparable figure was 44.3 percentage points. The addition of a large number of controls reduces the percentage point differential for African Americans to 21.8 in column 5 as the full set of controls is added. For 1993, the comparable figure was 24.1 percentage points.
The main difference between 1993 and 1998 is that now we find evidence that the probability of denial is significantly higher for Hispanic-owned firms as well. In Table 5.18, Column 5, Hispanic-owned firms have a 17.1 percentage point higher probability of being denied than nonminority male-owned firms. In Table 5.8, by contrast, denial probabilities for Hispanic-owned firms were not significantly different from those of nonminority male-owned firms. If anything, discrimination in the small business credit market appears to have worsened during the late 1990s.

Statistical Disparities in Capital Markets
NERA Economic Consulting
149
Table 5.18. Determinants of Loan Denial Rates—USA
(1) (2) (3) (4) (5)
African American 0.422 (7.94)
0.254 (5.36)
0.217 (5.05)
0.192 (4.52)
0.218 (4.74)
Asian/Pacific Islander 0.148 (2.54)
0.129 (2.52)
0.049 (1.25)
0.023 (0.65)
0.028 (0.77)
Hispanic 0.353 (6.44)
0.269 (5.37)
0.211 (4.69)
0.183 (4.21)
0.171 (4.00)
Nonminority female 0.087 (2.22)
0.049 (1.55)
0.024 (0.96)
0.016 (0.66)
0.011 (0.44)
Judgments 0.272 (4.28)
0.249 (4.32)
0.272 (4.47)
0.262 (4.20)
Firm delinquent 0.081 (2.88)
0.115 (4.20)
0.103 (3.88)
0.111 (4.01)
Personally delinquent 0.092 (2.85)
0.039 (1.59)
0.042 (1.69)
0.045 (1.76)
Bankrupt past 7 years 0.504 (4.48)
0.406 (3.83)
0.392 (3.67)
0.395 (3.64)
$1998 sales (*108) -0.000 (2.47)
-0.000 (0.26)
0.000 (0.02)
0.000 (0.03)
$1998 firm equity (*108) 0.000 (1.40)
0.000 (0.46)
0.000 (0.20)
0.000 (0.06)
Owner home equity (*108) 0.000 (0.52)
0.000 (1.47)
0.000 (0.96)
0.000 (0.90)
Owner net worth (*108) -0.000 (1.25)
-0.000 (1.28)
-0.000 (1.19)
-0.000 (1.24)
Owner years of experience -0.002 (1.42)
-0.001 (0.49)
-0.000 (0.34)
-0.000 (0.21)
Owner share of business 0.000 (0.75)
-0.000 (0.12)
0.000 (0.03)
-0.000 (0.33)
Dun & Bradstreet credit ratings (4 variables) No Yes Yes Yes Yes Owner Education (6 indicator variables) No Yes Yes Yes Yes Other Firm Characteristics (17 variables) No No Yes Yes Yes Characteristics of the Loan (1 variable) No No Yes Yes Yes Geographic Division (8 indicator variables) No No No Yes Yes Industry (8 indicator variables) No No No Yes Yes Year of Application (5 indicator variables) No No No No Yes Type of Financial Institution (11 indicator vars.) No No No No Yes
N 924 924 924 924 905 Pseudo R2 .1061 .2842 .3714 .3910 .4015 Chi2 90.0 241.1 315.1 331.8 337.8 Log likelihood -379.3 -303.7 -266.7 -258.3 -251.7 Source: See Table 5.17. Notes: (1) Reported estimates are derivatives from Probit models, t-statistics are in parentheses. Using a two-tailed test, t-statistics greater than 1.64 (1.96) (2.58) are statistically significant at a 90 (95) (99) percent confidence level. (2) “Other firm characteristics” include variables indicating whether the firm had a line of credit, 1998 full time equivalent employment, firm age, metropolitan area, legal form of organization (sole proprietorship, partnership, LLP, S-corporation, C-corporation, or LLC), existing long run relation with lender, geographic scope of market (regional, national, foreign or international), the value of the firm’s inventory, the firm’s cash holdings, and the value of land held by the firm. (3) “Characteristics of the loan” includes the size of the loan applied for.

Statistical Disparities in Capital Markets
NERA Economic Consulting
150
Table 5.19. Determinants of Loan Denial Rates—Northeast
(1) (2) (3) (4) (5)
African American 0.412 (7.05)
0.220 (4.34)
0.230 (4.70)
0.204 (4.21)
0.234 (4.47)
Asian/Pacific Islander 0.134 (2.08)
0.092 (1.73)
0.021 (0.53)
-0.004 (0.10)
-0.004 (0.12)
Hispanic 0.366 (6.22)
0.284 (5.18)
0.217 (4.46)
0.184 (3.92)
0.166 (3.63)
Nonminority Female 0.084 (1.93)
0.045 (1.31)
0.029 (1.05)
0.020 (0.74)
0.016 (0.59)
African American*NEAST 0.032 (0.31)
0.104 (1.02)
-0.023 (0.43)
-0.014 (0.26)
-0.013 (0.24)
Asian/Pacific Islander* NEAST 0.048 (0.37)
0.169 (1.26)
0.180 (1.36)
0.216 (1.54)
0.263 (1.75)
Hispanic* NEAST -0.051 (0.48)
-0.045 (0.61)
-0.018 (0.26)
-0.005 (0.07)
0.015 (0.18)
Nonminority female* NEAST 0.005 (0.06)
0.016 (0.22)
-0.022 (0.44)
-0.018 (0.36)
-0.024 (0.50)
NEAST region 0.032 (0.70)
-0.004 (0.10)
0.012 (0.37)
0.119 (1.39)
0.028 (0.50)
Creditworthiness Controls (8 variables) No Yes Yes Yes Yes Owner’s Education (6 indicator variables) No Yes Yes Yes Yes Other Firm Characteristics (17 variables) No No Yes Yes Yes Characteristics of the Loan (1 variable) No No Yes Yes Yes Geographic Division (7 indicator variables) No No No Yes Yes Industry (8 indicator variables) No No No Yes Yes Year of Application (5 indicator variables) No No No No Yes Type of Financial Institution (11 indicator vars.) No No No No Yes N 924 924 924 924 905 Pseudo R2 0.1081 0.2883 0.3748 0.3946 0.4062 Chi2 91.70 244.61 318.07 334.80 341.74 Log likelihood -378.4 -302.0 -265.2 -256.9 -249.8 Source: See Table 5.17. Notes: (1) t-statistics in parentheses. Using a two-tailed test, t-statistics greater than 1.64 (1.96) (2.58) are statistically significant at a 90 (95) (99) percent confidence level. (2) Other creditworthiness controls are the four other variables included in Column 2 of Table 5.18.
Table 5.19 focusing on the NEAST region yields similar results—showing significantly larger denial probabilities for African American- and Hispanic-owned firms (23.4 percent and 16.6 percent, respectively) than for nonminority male-owned firms. The NEAST indicator was not significant in Table 5.19. With one exception, the interaction terms between NEAST and race, ethnicity or gender were not significant either, indicating that the loan denial results for the NEAST are not significantly different than for the nation as a whole. An important exception, however, is for Asian/Pacific Islander-owned firms, which show a statistically significant 26.3 larger denial probability in the NEAST.

Statistical Disparities in Capital Markets
NERA Economic Consulting
151
Although tempered by the smaller sample size available, the quality of the experiment is somewhat better using the 1998 data than it was using the 1993 data due to the availability of an improved set of controls for the creditworthiness of the firm and its owner. In 1998, three new variables are included regarding the financial viability of the firm:
a) The value of the equity, if any, in the owner’s home.
b) The owner’s net worth excluding home equity and equity in the firm.
c) The firm’s Dun & Bradstreet credit rating in five categories (low, moderate, average, significant and high) indicating the likelihood of loan default.139
Despite the fact that these new variables do help to predict loan denials,140 the estimated race differences including these variables are essentially unchanged from those reported above.141 This suggests that the large estimated differences in the denial probabilities that were estimated in 1993 were not biased significantly upwards by the fact that these variables were unavailable.
3. Effect of 1998 Survey Design Changes on Differences in Loan Denial Rates
The question we used to examine the 1998 data was somewhat narrower than the question used in the 1993 survey because it was changed by the survey designers. The 1998 question asked about new loans over the preceding three years, whereas the 1993 question covered all loans, including renewals. Responses in 1998 were as follows:
Applied for New Loans Last Three Years Number Percent Did not apply 2,599 73.0% Always approved 713 20.0% Always denied 166 4.7% Sometimes approved/sometimes denied 83 2.3% Total 3,561 100.0%
The dependent variable used in Tables 5.18 and 5.19 was set to one if the loan application was always denied and was set to zero if the application was always approved or sometimes approved/sometimes denied. An alternative dependent variable–DenyAlt–is set to one if the application is always denied, set to zero if always approved. Those responding “sometimes approved/sometimes denied” are excluded from the analysis. Column (1) of Table 5.20 replicates Column 1 of Table 5.18 using DenyAlt as the dependent variable with the smaller sub-sample.
139 The D&B Commercial Credit Score Report predicts the likelihood of a company paying in a delinquent manner
(90+ days past terms) during the next 12 months based on the information in D&B’s file. The score is intended to help firms decide quickly whether to accept or reject accounts, adjust terms or credit limits, or conduct a more extensive review based on the report D&B provides. Firms can also determine the company’s relative ranking among other businesses in the D&B database.
140 The coefficients and t-statistics on the credit score variables when they were included alone in a U.S. loan denial model was as follows: moderate risk = .228 (2.45); average risk = .295 (3.25); significant risk =.319 (3.28); high risk = .391 (3.53); n =924; pseudo r2 =.0253. Excluded category “low risk.” Results were essentially the same when a control for NEAST was also included.
141 This confirms the findings of Cavalluzzo, Cavalluzzo and Wolken (2002) who performed a similar exercise with the 1993 data.

Statistical Disparities in Capital Markets
NERA Economic Consulting
152
African Americans, Hispanics, Asians/Pacific Islanders, and nonminority females are all confirmed to face higher denial rates than nonminority males using this specification. For African Americans and Hispanics, the difference is 46 and 36 percentage points, respectively. For Asians/Pacific Islanders, the difference is 19 percentage points, and for nonminority females, 8 percentage points.
Table 5.20. More Loan Denial Probabilities
(1) (2) (3) (4)
DenyAlt DenyAlt DenyAlt DenyAlt
African American 0.457 (8.00)
0.246 (4.76)
0.432 (6.98)
0.224 (4.04)
Asian/Pacific Islander 0.185 (2.81)
0.027 (0.65)
0.165 (2.28)
-0.008 (0.19)
Hispanic 0.360 (6.28)
0.171 (3.67)
0.376 (6.09)
0.174 (3.42)
Nonminority female 0.083 (2.00)
0.005 (0.20)
0.080 (1.73)
0.006 (0.21)
African American*NEAST 0.145 (1.00)
0.092 (0.82)
Asian/Pacific Islander* NEAST 0.076 (0.50)
0.303 (1.79)
Hispanic* NEAST -0.064 (0.58)
-0.005 (0.05)
Nonminority female* NEAST 0.007 (0.07)
-0.007 (0.11)
NEAST 0.034 (0.68)
0.091 (1.00)
Creditworthiness Controls No Yes No Yes Owner’s Education No Yes No Yes Other Firm Characteristics No Yes No Yes Characteristics of the Loan No Yes No Yes Geographic Division No Yes No Yes Industry No Yes No Yes N 846 846 846 846 Pseudo R2 0.1112 0.4265 0.1154 0.4312 Chi2 90.94 348.71 94.36 352.60 Log likelihood -363.3 -234.5 -361.6 -232.5
Source: See Table 5.18.
Results consistent with discrimination are confirmed for African American-owned firms and Hispanic-owned firms in Column (2) of Table 5.20 when a host of demographic and financial characteristics and geographic and industry indicators are included. When interaction terms for the NEAST region are added to the model as in Columns (3) and (4), results for African Americans and Hispanics remain statistically significant throughout. The NEAST indicator is not

Statistical Disparities in Capital Markets
NERA Economic Consulting
153
significant in any of the specifications, nor are the interaction terms between NEAST and race, ethnicity, or gender.
4. Differences in Interest Rates, Credit Card Use, and Failure to Apply for Fear of Denial
Tables 5.21 through 5.23 provide confirmation from the 1998 survey of a number of other results from the 1993 survey reported above.
Table 5.21, which is similar to Tables 5.13 and 5.14, finds that conditional on obtaining a loan, African American-owned firms are charged a higher price for their credit—on average 1.06 percentage points nationally, and 4.99 percentage points in the NEAST. Asian/Pacific Islander-owned firms were charged a higher price for credit as well—on average 0.56 percentage points nationally, and 2.18 percentage points in the NEAST.
Table 5.22, which is similar to Table 5.15, shows that African American-owned firms are much more likely not to apply for a loan for fear that they will be denied. Based on all of the foregoing evidence, this is perhaps a sensible decision—if and when they do apply they are almost twice as likely as nonminority male-owned firms to have their application rejected. This is evident in the NEAST as well and also in the construction and design industries. There is some evidence of this phenomenon for Hispanic-owned firms nationally, as well as for Asian/Pacific Islanders in the NEAST.
Table 5.21. Models of Interest Rate Charged
Specification African American
African American*
NEAST
Asian/ Pacific
Islander
Asian/ Pacific
Islander *NEAST
Hispanic Hispanic *NEAST
Non-minority Female
Non-minority Female
*NEAST
1a) All Loans (as in Column 5 of Table 5.18) n=765
1.064 (2.66) 0.559
(1.49) -0.088 (0.23) -0.501
(1.93)
1b) All Loans (as in Column 5 of Table 5.19) n=765
0.253 (0.59)
4.992 (4.72)
0.223 (0.58)
2.183 (2.23)
0.145 (0.36)
-1.777 (1.54)
-0.523 (1.89)
-0.034 (0.05)
Source: See Tables 5.18 and 5.19. Notes: (1) Each line of this table represents a separate OLS regression with all of the control variables. (2) t-statistics are in parentheses. Using a two-tailed test, t-statistics greater than 1.64 (1.96) (2.58) are statistically significant at a 90 (95) (99) percent confidence level. (3) The sample consists of firms that had applied for a loan and had their application approved.

Statistical Disparities in Capital Markets
NERA Economic Consulting
154
Table 5.22. Racial Differences in Failing to Apply for Loans Fearing Denial
Specification African American
Asian/ Pacific
Islander Hispanic Non-minority
Female
a) U.S.
No Other Control Variables (n=3,448)
0.353 (11.9)
0.046 (1.48)
0.173 (5.77)
0.051 (2.55)
Full Set of Control Variables (n=3,448) 0.208 (7.04)
-0.012 (0.43)
0.052 (1.87)
0.011 (0.59)
b) NEAST region
No Other Control Variables (n=565)
0.376 (4.97)
0.240 (2.48)
0.084 (0.99)
0.075 (1.51)
Full Set of Control Variables (n=560) 0.260 (3.08)
0.224 (2.20)
0.058 (0.71)
-0.012 (0.25)
c) Construction and Design
No Other Control Variables (n=613)
0.371 (5.06)
0.117 (1.43)
0.020 (0.26)
0.122 (2.08)
Full Set of Control Variables (n=609) 0.273 (3.69)
0.099 (1.32)
-0.062 (1.13)
0.038 (0.74)
Source: See Table 5.18. Notes: (1) Reported estimates are Probit derivatives with t-statistics in parentheses. Using a two-tailed test, t-statistics greater than 1.64 (1.96) (2.58) are statistically significant at a 90 (95) (99) percent confidence level. (2) Full set of control variables as in Column 5 of Table 5.18, except for loan amount, year of application, and type of lender.
Finally, Table 5.23, which is comparable to Tables 5.11 and 5.12, suggests that when the financial institution does not know the race or ethnicity of the applicant—as is often the case in an application for a credit card—there are no differences by race or ethnicity in the usage for business purposes of either business or personal credit cards. There was also no evidence of any race effects in the use of business credit cards in the NEAST region (row 3) or in construction and design.
The strength of the findings from the 1993 NSSBF survey is elevated by these findings from the 1998 SSBF survey, which strongly confirm the earlier results. Unfortunately, African Americans continue to be discriminated against in the market for small business credit throughout this time period. By 1998, this discrimination was on the increase for African Americans and expanding to impact other minority groups, such as Hispanics and Asians/Pacific Islanders, as well.

Statistical Disparities in Capital Markets
NERA Economic Consulting
155
Table 5.23. Models of Credit Card Use
Specification African American
Asian/ Pacific
Islander Hispanic Nonminority
Female Sample Size
1) Business Credit Card -0.001 (0.02)
-0.038 (1.00)
-0.014 (0.38)
-0.018 (0.72) 3,561
2) Personal Credit Card -0.018 (0.54)
0.016 (0.44)
-0.050 (1.42)
0.012 (0.52) 3,561
3) Business Credit Card NEAST
-0.099 (1.09)
-0.024 (0.21)
0.101 (0.97)
-0.006 (0.08) 593
4) Personal Credit Card NEAST
0.023 (0.24)
0.061 (0.53)
-0.105 (1.05)
-0.061 (0.96) 593
3) Business Credit Card Construction
0.056 (0.62)
-0.074 (0.70)
0.087 (0.86)
-0.025 (0.35) 624
4) Personal Credit Card Construction
0.003 (0.04)
0.047 (0.46)
-0.092 (1.01)
-0.073 (0.99) 624
Source: See Table 5.18. Notes: (1) Each line of this table represents a separate regression with the same control variables as Column 5 of Table 5.18, except for loan amount, year of application, and type of lender. (2) The dependent variable indicates whether the firm used business or personal credit cards to finance business expenses. (3) In all specifications, the sample size includes all firms. (4) Reported estimates are Probit derivatives with t-statistics in parentheses. Using a two-tailed test, t-statistics greater than 1.64 (1.96) (2.58) are statistically significant at a 90 (95) (99) percent confidence level.
I. Analysis of Credit Market Discrimination in the U.S. in 2003
The most recent wave of the Survey of Small Business Finances was made available by the Board of Governors of the Federal Reserve System in 2007.142 This is the fourth and final survey of U.S. small businesses conducted by the Board of Governors since 1987.143 The survey gathered data from 4,072 firms selected to be representative of small businesses operating in the U.S. at the end of 2003. The survey covered a nationally representative sample of U.S. for profit, non-financial, non-subsidiary, nonagricultural, and nongovernmental businesses with fewer than 500 employees that were in operation at year-end 2003 and at the time of interview. Most interviews took place between June 2004 and January 2005. The sample was drawn from the Dun & Bradstreet Market Identifier file. The number of employees varied from zero to 486 with a weighted median of 3.0 and weighted mean of 8.6.
142 See www.federalreserve.gov/pubs/oss/oss3/ssbf03/ssbf03home.html. 143 The Federal Reserve Board cancelled the SSBF subsequent to the completion of the 2003 wave, ostensibly for
financial reasons. See Robb (2010).

Statistical Disparities in Capital Markets
NERA Economic Consulting
156
Unfortunately, the 2003 SSBF did not over-sample minority-owned firms, as in the first three survey waves. According to survey staff, this was due to concerns that doing so would delay the survey timeline and reduce the overall response rate.144
In 1998, almost 8 percent of survey respondents were African American, compared to slightly more than 3 percent in 2003. Hispanics were almost 7 percent in 1998 but less than 4 percent in 2003. Other minorities were 6.5 percent in 1998 but only 5.4 percent in 2003.145 Although the population weights were adjusted to accommodate these changes, even these weighted percentages are significantly smaller for minorities in 2003 than in 1998.146
Mach and Wolken (2006) reported using these data that 13.1 percent of firms were owned by nonminority or Hispanic individuals; the share is statistically lower than in 1998 (14.6 percent). The shares for African Americans and Asians/Pacific Islanders each held roughly constant at 4 percent; the share of American Indians and Alaska natives held at roughly 1 percent. However, the share of Hispanics fell a statistically significant amount from 5.6 percent to 4.2 percent. The percentage of firms owned by females also declined from 72.0 percent to 64.8 percent. Despite these drawbacks, our analysis of the 2003 SSBF yields results that are strongly consistent with those obtained from the 1993 and 1998 survey waves. The remainder of this section presents our findings from this analysis.147
1. Qualitative Evidence
Table 5.24 reports the results of asking business owners for the most important problem currently facing their firm. Consistent with the surveys in earlier years, firms owned by minority and women-owned firms were more likely to say that their most important problem was “financing and interest rates.” Once again, the African American-nonminority difference was most pronounced—only slightly more than 5 percent of nonminority male business owners reported this as their major problem compared to almost 21 percent of African American business owners.
144 See fn. 99, above. 145 The impact on women was not as pronounced. Females were 23.3 percent in 1998 and 20.9 percent in 2003. For
nonminority females, the figures are 17.8 percent in 1998 and 18.2 percent in 2003. 146 Mach and Wolken (2006, Table 2) report that weighted figures for Blacks were 4.1 percent in 1998 and 3.7
percent in 2003. Hispanics were 5.6 and 4.2 percent, respectively; Asians and Pacific Islanders were 4.4 and 4.2 percent, respectively; Native Americans were 0.8 and 1.3 percent, respectively; and women were 24.3 and 22.4 percent, respectively.
147 The data file provided by the Board of Governors includes five separate observations per firm. That is to say, there are 4240*5=21,200 observations. These so-called multiple imputations are done via a randomized regression model, and are included because where there are missing observations several alternative estimates are provided. Where values are not missing the values for each of the five imputations are identical. We make use of the data from the first imputation: the results presented here are essentially identical whichever imputation is used. Overall, only 1.8 percent of observations in the data file were missing.

Statistical Disparities in Capital Markets
NERA Economic Consulting
157
Table 5.24. What is the Most Important Problem Facing Your Business Today?
Non-minority
Male
African American Other Hispanic
Non-minority Female
Total
Financing and interest rates 5.4% 20.7% 9.1% 5.7% 5.8% 6.3% Taxes 6.3% 2.4% 4.9% 7.7% 4.3% 5.7% Inflation 2.7% 1.0% 2.3% 0.5% 1.4% 2.3% Poor sales or profitability 17.8% 38.5% 28.9% 30.0% 22.5% 20.6% Cost/availability of labor 1.5% 0.0% 0.6% 1.5% 1.5% 1.4% Government regulations/red tape 4.7% 1.0% 5.4% 9.6% 2.5% 4.5% Competition from larger firms 4.0% 2.7% 2.7% 3.6% 3.6% 3.8% Quality of labor 7.9% 6.9% 5.0% 3.8% 6.5% 7.2% Cost and availability of insurances 10.3% 1.8% 3.1% 5.2% 6.4% 8.6% Other 2.6% 1.9% 4.0% 2.8% 1.6% 2.5% None 5.3% 3.4% 9.4% 4.1% 8.6% 6.0% Cash flow 6.2% 5.1% 4.6% 7.1% 6.8% 6.3% Growth 0.9% 2.7% 0.4% 1.1% 0.8% 1.0% Foreign competition 1.3% 0.0% 1.0% 0.1% 0.7% 1.0% Competition - other 1.6% 0.8% 1.8% 0.1% 1.1% 1.4% Availability of materials/resources 0.8% 0.8% 0.6% 1.6% 1.2% 0.9% Labor problems other than cost or quality 1.2% 2.2% 0.2% 0.0% 1.3% 1.1% Internal management/administrative problems 4.2% 2.5% 4.3% 1.0% 6.1% 4.4% Environmental constraints 1.4% 0.7% 1.6% 2.3% 2.0% 1.6% Advertising and public awareness 2.2% 1.8% 2.4% 1.8% 3.3% 2.4% Market/economic/industry factors 4.9% 1.9% 4.0% 2.3% 6.2% 4.8% Health care cost and availability 1.5% 0.0% 0.7% 0.8% 1.4% 1.4% Energy costs 1.5% 0.0% 0.7% 3.7% 1.2% 1.4% Costs other than health care and energy 2.2% 1.0% 0.1% 3.6% 1.0% 1.9% Owner’s personal problems 0.3% 0.0% 0.0% 0.0% 0.8% 0.4% Technology 0.4% 0.0% 0.7% 0.0% 0.5% 0.4% Dealing with insurance companies 0.3% 0.4% 0.0% 0.0% 0.4% 0.3% War and September 11th 0.2% 0.0% 1.3% 0.0% 0.5% 0.3%
Source: NERA calculations from the 2003 SSBF (n=4,072). Note: Results are weighted.

Statistical Disparities in Capital Markets
NERA Economic Consulting
158
2. Differences in Loan Denial Rates by Race/Ethnicity
Tables 5.25 and 5.26 present estimates of loan denial probabilities for the nation as a whole and for the NEAST region using a regression model comparable to that used with the 1993 and 1998 survey waves.148
Column (1) in Table 5.25 (comparable to Table 5.8 for 1993 and 5.18 for 1998) shows that African American-owned firms in 2003 had a 45.9 percentage point higher probability of denial than nonminority male-owned firms before taking into account the creditworthiness of the firm or any other characteristics. The addition of a large number of controls reduces the percentage point differential for African Americans to 9.4 in Column (5) as the full set of controls is added. The coefficients in Column (5) for nonminority females and for other minority groups are not significant, however.
Table 5.26 (comparable to Table 5.9 for 1993 and 5.19 for 1998) focuses on the NEAST region and yields similar results—showing a significantly larger denial probability for African American-owned firms than for nonminority male-owned firms (43.6 percentage points), persisting even after the addition of all of the control variables (8.0 percentage points). The NEAST indicator as well as the race and gender interaction terms with the NEAST are also insignificant, both with and without the control variables added.
148 In 2003, the credit application question was changed from 1998 to once again include requests for renewals as
well as new loans, making it comparable to the 1993 version.

Statistical Disparities in Capital Markets
NERA Economic Consulting
159
Table 5.25. Determinants of Loan Denial Rates—USA
(1) (2) (3) (4) (5)
African American 0.459 (8.38)
0.136 (5.47)
0.105 (4.80)
0.091 (5.04)
0.094 (4.95)
Asian/Pacific Islander 0.055 (1.51)
0.020 (1.59)
0.009 (1.01)
0.002 (0.49)
0.001 (0.18)
Hispanic 0.067 (1.74)
0.008 (0.83)
0.004 (0.58)
0.001 (0.30)
0.001 (0.25)
Native American 0.184 (2.22)
0.061 (1.95)
0.032 (1.47)
0.021 (1.43)
0.021 (1.49)
Nonminority female 0.043 (2.17)
0.003 (0.70)
0.002 (0.49)
0.001 (0.57)
0.002 (0.76)
Judgments against owner 0.007 (0.66)
0.003 (0.35)
0.003 (0.54)
0.006 (0.90)
Judgments against firm 0.005 (1.16)
0.005 (1.42)
0.001 (0.54)
0.001 (0.64)
Firm delinquent 0.032 (3.78)
0.021 (3.23)
0.019 (3.89)
0.021 (4.08)
Personally delinquent -0.007 (0.69)
-0.006 (1.02)
-0.003 (0.82)
-0.002 (0.58)
Owner Bankrupt past 7 years 0.046 (1.36)
0.041 (1.35)
0.052 (1.81)
0.044 (1.66)
Firm Bankrupt past 7 years 0.000 (0.03)
0.003 (0.37)
0.001 (0.17)
-0.001 (0.38)
$1998 sales (*108) -0.000 (1.68)
0.000 (0.04)
0.000 (0.29)
0.000 (0.51)
$1998 firm equity (*108) -0.000 (2.23)
-0.000 (1.03)
-0.000 (1.62)
-0.000 (1.63)
Owner home equity (*108) 0.000 (0.28)
0.000 (0.02)
-0.000 (0.45)
-0.000 (0.26)
Owner net worth (*108) -0.000 (2.97)
-0.000 (2.92)
-0.000 (3.06)
-0.000 (3.26)
Owner years of experience 0.000 (0.31)
0.000 (1.00)
0.000 (0.82)
0.000 (0.62)
Owner share of business 0.000 (0.08)
0.000 (0.61)
0.000 (0.38)
0.000 (0.47)
Dun & Bradstreet credit ratings (4 variables) No Yes Yes Yes Yes Owner Education (6 indicator variables) No Yes Yes Yes Yes Other Firm Characteristics (17 variables) No No Yes Yes Yes Characteristics of the Loan (1 variable) No No Yes Yes Yes Geographic Division (8 indicator variables) No No No Yes Yes Industry (8 indicator variables) No No No Yes Yes Year of Application (5 indicator variables) No No No No Yes Type of Financial Institution (11 indicator vars.) No No No No Yes N 1,664 1,655 1,655 1,655 1,605 Pseudo R2 .0850 .2267 .2901 .3336 .3681 Chi2 74.1 192.9 246.8 283.8 310.3 Log likelihood -399.1 -328.9 -301.9 -283.4 -266.4 Source: See Table 5.26. Notes: (1) Reported estimates are Probit derivatives with t-statistics in parentheses. Using a two-tailed test, t-statistics greater than 1.64 (1.96) (2.58) are statistically significant at a 90 (95) (99) percent confidence level. (2) “Other firm characteristics” include variables indicating whether the firm had a line of credit, 2003 total employment, firm age, metropolitan area, legal form of organization (sole proprietorship, partnership, LLP, S-corporation, C-corporation, or LLC), existing long-run relation with lender, geographic scope of market (local, regional, national, foreign or international), the value of the firm’s inventory, the firm’s cash holdings, the value of land held by the firm, and total salaries and wages paid. (3) “Characteristics of the loan” includes the size of the loan applied for.

Statistical Disparities in Capital Markets
NERA Economic Consulting
160
Table 5.26. Determinants of Loan Denial Rates—Northeast
(1) (2) (3) (4) (5)
African American 0.436 (7.35)
0.115 (4.64)
0.089 (4.17)
0.077 (4.44)
0.080 (4.36)
Asian/Pacific Islander 0.055 (1.39)
0.028 (1.85)
0.016 (1.4)
0.005 (0.91)
0.002 (0.43)
Hispanic 0.079 (1.95)
0.012 (1.07)
0.007 (0.86)
0.002 (0.50)
0.003 (0.58)
Native American 0.121 (1.47)
0.036 (1.29)
0.017 (0.90)
0.011 (0.89)
0.013 (1.05)
Nonminority female 0.029 (1.32)
0.000 (0.04)
-0.000 (0.08)
0.000 (0.02)
0.001 (0.25)
African American*NEAST 0.054 (0.65)
0.039 (1.02)
0.044 (1.06)
0.026 (0.96)
0.023 (0.90)
Asian/Pacific Islander*NEAST 0.001 (0.01)
-0.009 (0.88)
-0.007 (0.98)
-0.004 (0.87)
-0.002 (0.45)
Hispanic*NEAST 0.000 (0.00)
0.000 (0.00)
0.000 (0.00)
0.000 (0.00)
0.000 (0.00)
Native*NEAST 0.000 (0.00)
0.000 (0.00)
0.000 (0.00)
0.000 (0.00)
0.000 (0.00)
Nonminority female*NEAST 0.062 (1.18)
0.015 (1.02)
0.010 (0.92)
0.007 (0.96)
0.005 (0.86)
NEAST region 0.010 (0.52)
0.005 (0.96)
0.004 (0.93)
-0.002 (0.48)
-0.002 (0.46)
Creditworthiness (4 variables) No Yes Yes Yes Yes Dun & Bradstreet credit ratings (4 variables) No Yes Yes Yes Yes Balance Sheet (4 indicator variables) No Yes Yes Yes Yes Owner Experience (1 indicator variable) No Yes Yes Yes Yes Owner’s Share of Business (1 indicator variable) No Yes Yes Yes Yes Owner’s Education (6 indicator variables) No Yes Yes Yes Yes Other Firm Characteristics (17 variables) No No Yes Yes Yes Characteristics of the Loan (1 variable) No No Yes Yes Yes Geographic Division (7 indicator variables) No No No Yes Yes Industry (8 indicator variables) No No No Yes Yes Year of Application (5 indicator variables) No No No No Yes Type of Financial Institution (11 indicator vars.) No No No No Yes N 1,659 1,650 1,650 1,650 1,600 Pseudo R2 0.0879 0.2321 0.2954 0.3354 0.3691 Chi2 76.14 196.07 249.57 283.33 309.07 Log likelihood -395.2 -324.3 -297.6 -280.7 -264.1 Source: See Table 5.24. Notes: (1) t-statistics in parentheses. Using a two-tailed test, t-statistics greater than 1.64 (1.96) (2.58) are statistically significant at a 90 (95) (99) percent confidence level. (2) Creditworthiness controls include presence of legal judgments against the firm during the previous 3 years, more than 60 days delinquent on any personal obligations of the firm’s owner during the previous 3 years, more than 60 days delinquent on any business obligations of the firm during the previous 3 years, and declaration of owner of firm bankruptcy during the previous 7 years. (3) Balance sheet variables include firm sales in 1998, firm equity in 1998, owner’s home equity in 1998, and owner’s personal net worth (exclusive of firm equity and home equity) in 1998. (4) For other variables, see notes for Table 5.25.

Statistical Disparities in Capital Markets
NERA Economic Consulting
161
3. Differences in Interest Rates, Credit Card Use, and Failure to Apply for Fear of Denial
Table 5.27 models the interest rate charged for those minority-owned and nonminority female-owned firms that were able to successfully obtain a loan (comparable to Tables 5.13 and 5.14 for 1993 and Table 5.21 for 1998). As was found in earlier surveys, African American business owners are hurt here as well since they have to pay, on average, 1.04 percentage points more for their loans than nonminority male business owners with identical characteristics. Hispanic business owners, as well, pay 1.01 percentage points more than their nonminority male counterparts.
Table 5.27 shows that the loan price differential is present for African American and Hispanic business owners in the NEAST as well. For African American-owned firms, the differential is 0.99 percentage points. For Hispanics, the differential is 1.12 percentage points.
Table 5.27. Models of Interest Rate Charged
Specification African American
African American*
NEAST
Asian/Pacific Islander
Asian/Pacific Islander* NEAST
Hispanic Hispanic* NEAST
1a) All Loans (as in Column 5 of Table 5.25) n=1,537
1.043 (2.01) 0.445
(1.24) 1.006 (2.76)
1b) All Loans (as in Column 5 of Table 5.26) n=1,537
0.989 (1.78)
0.428 (0.28)
0.366 (0.94)
0.531 (0.55)
1.122 (2.95)
-1.427 (1.10)
Specification Native American
Native American*
NEAST
Nonminority Female
Nonminority Female* NEAST
1a) All Loans (as in Column 5 of Table 5.25) n=1,537
0.263 (0.35) -0.142
(0.72)
1b) All Loans (as in Column 5 of Table 5.26) n=1,537
0.252 (0.34) n/a -0.175
(0.82) 0.212 (0.41)
Source: See Table 5.24. Notes: (1) Each line of this table represents a separate regression with all of the control variables as indicated. (2) t-statistics are in parentheses. Using a two-tailed test, t-statistics greater than 1.64 (1.96) (2.58) are statistically significant at a 90 (95) (99) percent confidence level.
Table 5.28 reports the results of estimating a model where the dependent variable is whether a business or personal credit card is used to pay business expenses (comparable to Tables 5.11 and 5.12 for 1993 and Table 5.23 for 1998). As noted above, the application procedure for business and personal credit cards is usually automated and not conducted face-to-face. If there were missing variables such as creditworthiness or some such characteristic unobserved to the econometrician, then the race and ethnicity indicator variables should enter significantly in these

Statistical Disparities in Capital Markets
NERA Economic Consulting
162
equations. As with the 1993 and 1998 results, there is no evidence that minorities or women are less likely to use business credit cards to pay business expenses. However, there is some evidence nationally in 2003 that African Americans and Hispanics are less likely to use personal credit cards for business expenses. A similar result is also observed for African Americans in the NEAST.
Table 5.28. Models of Credit Card Use
Specification African American
Asian/ Pacific
Islander Hispanic
Native American and Other
Non-minority Female
Sample Size
1) Business Credit Card
-0.061 (1.16)
0.039 (0.90)
0.003 (0.06)
-0.001 (0.01)
0.002 (0.07) 3,676
2) Personal Credit Card
-0.132 (2.68)
0.036 (0.84)
-0.080 (1.77)
-0.040 (0.48)
0.036 (1.56) 3,676
3) Business Credit Card, NEAST
-0.343 (2.23)
0.042 (0.37)
-0.281 (1.72) -0.021
(0.37) 666
4) Personal Credit Card, NEAST
-0.242 (1.87)
0.031 (0.28)
0.174 (1.04)
-0.183 (0.75)
0.057 (1.07) 670
Source: See Table 5.24. Notes: (1) Each line of this table represents a separate regression with the same control variables as Column 5 of Table 5.27, except for loan amount, year of application, and type of lender. (2) The dependent variable indicates whether the firm used business or personal credit cards to finance business expenses. (3) In all specifications, the sample size is all firms. (4) Reported estimates are Probit derivatives with t-statistics in parentheses. Using a two-tailed test, t-statistics greater than 1.64 (1.96) (2.58) are statistically significant at a 90 (95) (99) percent confidence level.
Finally, consistent with earlier results, Table 5.29 (comparable to Tables 5.15 for 1993 and 5.22 for 1998) shows that African American owners are much more likely not to apply for a loan fearing they will be denied. Even after controlling for a host of demographic, financial, geographic and industry factors, African American business owners are still almost 17 percentage points more likely to fail to apply for loans for fear of denial—even though they need the credit. A similar but smaller differential is also observed for Hispanic and nonminority female business owners, and to a lesser extent for Asian/Pacific Islander business owners.
In the NEAST, this phenomenon is evident as well—African American business owners are 13 percentage points more likely to fail to apply for fear of denial. The phenomenon is observed for Asian/Pacific Islander, Hispanic, Native American, and nonminority female business owners as well, although to a smaller degree than African Americans.
In the construction and design industries, the trend is even more pronounced for African American business owners at 28 percentage points, and for Native American business owners at 13 percentage points.

Statistical Disparities in Capital Markets
NERA Economic Consulting
163
Table 5.29. Racial Differences in Failing to Apply for Loans Fearing Denial
Specification African American
Asian/ Pacific
Islander Hispanic Native
American
Non-minority Female
a) USA
No Other Control Variables (n=3,704)
0.385 (9.48)
0.059 (1.95)
0.138 (4.01)
0.138 (2.14)
0.072 (4.47)
Full Set of Control Variables (n=3,676)
0.168 (4.77)
0.039 (1.42)
0.051 (1.85)
0.052 (1.02)
0.035 (2.47)
b) NEAST region
No Other Control Variables (n=3,694)
0.354 (8.22)
0.053 (1.59)
0.121 (3.42)
0.166 (2.41)
0.063 (3.55)
Full Set of Control Variables (n=3,666)
0.131 (3.65)
0.051 (1.67)
0.040 (1.43)
0.072 (1.29)
0.029 (1.83)
c) Construction
No Other Control Variables (n=705)
0.492 (4.34)
-0.022 (0.29)
0.090 (1.22)
0.258 (2.17)
0.026 (0.64)
Full Set of Control Variables (n=695)
0.278 (3.02)
0.002 (0.03)
-0.012 (0.50)
0.129 (1.61)
-0.005 (0.24)
Source: See Table 5.24. Notes: (1) Reported estimates are Probit derivatives with t-statistics in parentheses. Using a two-tailed test, t-statistics greater than 1.64 (1.96) (2.58) are statistically significant at a 90 (95) (99) percent confidence level. (2) Full set of control variables as in Column 5 of Table 5.27, except for loan amount, year of application, and type of lender. (3) In Panel (b), interaction terms between race, gender, and NEAST were all insignificant.
J. Further Analysis of Credit Market Discrimination: NERA Surveys 1999-2007
NERA has conducted local credit market surveys at nine other times and places since 1999. These include the Chicago metropolitan area in 1999, the State of Maryland in 2000 (Maryland I), the Jacksonville, Florida metropolitan area in 2002, the Baltimore-Washington, DC metropolitan area in 2003, the St. Louis metropolitan area in 2004, the Denver metropolitan area in 2005, the State of Maryland (again) in 2005 (Maryland II), the Commonwealth of Massachusetts in 2005, and the Memphis, TN-MS-AR metropolitan area in 2007. The Chicago, Jacksonville, Baltimore, St. Louis, and Denver surveys focused on construction and construction-related industries, while the two Maryland surveys, the Massachusetts surveys, and the Memphis surveys, included other goods and services as well.
Our Chicago, Maryland I, and Jacksonville survey questionnaires followed the format of the 1993 NSSBF, while our Baltimore, St. Louis, Denver, Maryland II, Massachusetts, and Memphis surveys followed the format of the 1998 SSBF questionnaire.

Statistical Disparities in Capital Markets
NERA Economic Consulting
164
As another check on our findings in this chapter, we combined the results of these nine NERA surveys together in a consistent format and re-estimated the basic loan denial model on this larger file. These results appear below in Table 5.30, and are remarkably similar to results seen in Tables 5.8-5.9, 5.18-5.19, and 5.25-5.26. Denial probabilities for African American-owned firms compared to nonminority male-owned firms are 29 percentage points higher—even when creditworthiness controls, other firm and owner characteristics, and interaction terms are included.
Moreover, the NERA surveys found statistically significant loan denial disparities for Hispanic-owned firms and nonminority female-owned firms as well. Denial rates were 18-24 percentage points higher for Hispanic-owned firms and 5-9 percentage points higher for nonminority female-owned firms than for their nonminority male-owned counterparts. Significant loan denial disparities were also observed for Native American-owned firms (9-19 percentage points higher).
Finally, as shown in Table 5.31, we modeled the rate of interest charged, conditional upon receiving loan approval, using our nine-jurisdiction dataset. Results are very similar to that observed in Tables 5.13-5.14, 5.21 and 5.27. African Americans pay almost 1.7 percentage points more, on average, for their business credit than do nonminority males, declining to 1.5 percentage points when creditworthiness and other firm and owner controls are accounted for.
On the basis of the foregoing, we conclude that the evidence of credit discrimination from NERA’s nine local credit market surveys conducted throughout the nation between 1999-2007 is entirely consistent with the results obtained using data from the 1993 NSSBF, the 1998 SSBF and the 2003 SSBF.

Statistical Disparities in Capital Markets
NERA Economic Consulting
165
Table 5.30. Determinants of Loan Denial Rates—Nine Jurisdictions
(1) (2)
Most Recent Application Last Three Years
African American 0.289 (8.20)
0.293 (7.60)
Hispanic 0.178 (3.86)
0.244 (4.59)
Native American 0.087 (1.69)
0.188 (3.29)
Asian/Pacific Islander 0.042 (0.72)
0.003 (0.05)
Other race 0.313 (3.07)
0.364 (3.15)
Nonminority female 0.046 (1.83)
0.086 (2.96)
Judgments 0.051 (1.23)
0.119 (2.24)
Firm delinquent 0.022 (2.7)
0.057 (5.90)
Personally delinquent 0.076 (7.38)
0.077 (6.03)
Bankrupt past 3 years 0.228 (3.99)
0.328 (4.74)
N 1,855 1,855
Pseudo R2 .1905 .1721
Chi2 336.0 363.3
Source: NERA Credit Market Surveys, 1999-2007. Notes: (1) Reported estimates are derivatives from Probit models, t-statistics are in parentheses. Using a two-tailed test, t-statistics greater than 1.64 (1.96) (2.58) are statistically significant at a 90 (95) (99) percent confidence level. (2) Indicator variables are also included for the various jurisdictions.
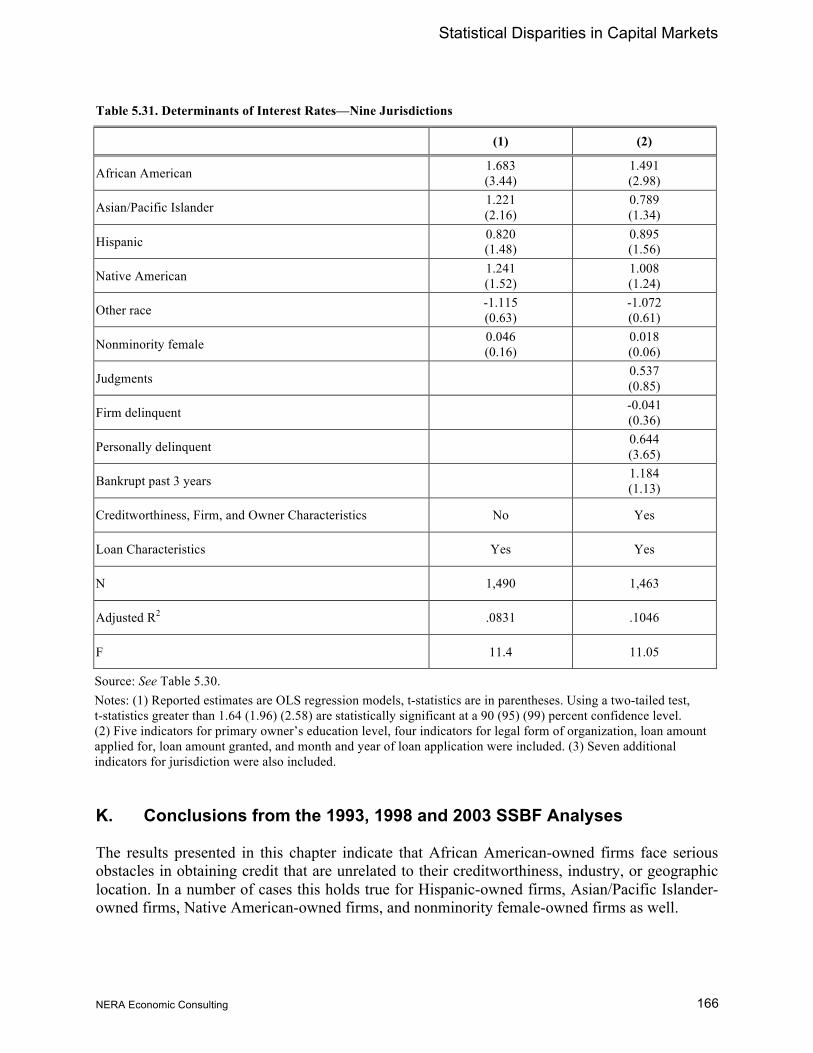
Statistical Disparities in Capital Markets
NERA Economic Consulting
166
Table 5.31. Determinants of Interest Rates—Nine Jurisdictions
(1) (2)
African American 1.683 (3.44)
1.491 (2.98)
Asian/Pacific Islander 1.221 (2.16)
0.789 (1.34)
Hispanic 0.820 (1.48)
0.895 (1.56)
Native American 1.241 (1.52)
1.008 (1.24)
Other race -1.115 (0.63)
-1.072 (0.61)
Nonminority female 0.046 (0.16)
0.018 (0.06)
Judgments 0.537 (0.85)
Firm delinquent -0.041 (0.36)
Personally delinquent 0.644 (3.65)
Bankrupt past 3 years 1.184 (1.13)
Creditworthiness, Firm, and Owner Characteristics No Yes
Loan Characteristics Yes Yes
N 1,490 1,463
Adjusted R2 .0831 .1046
F 11.4 11.05
Source: See Table 5.30. Notes: (1) Reported estimates are OLS regression models, t-statistics are in parentheses. Using a two-tailed test, t-statistics greater than 1.64 (1.96) (2.58) are statistically significant at a 90 (95) (99) percent confidence level. (2) Five indicators for primary owner’s education level, four indicators for legal form of organization, loan amount applied for, loan amount granted, and month and year of loan application were included. (3) Seven additional indicators for jurisdiction were also included.
K. Conclusions from the 1993, 1998 and 2003 SSBF Analyses
The results presented in this chapter indicate that African American-owned firms face serious obstacles in obtaining credit that are unrelated to their creditworthiness, industry, or geographic location. In a number of cases this holds true for Hispanic-owned firms, Asian/Pacific Islander-owned firms, Native American-owned firms, and nonminority female-owned firms as well.

Statistical Disparities in Capital Markets
NERA Economic Consulting
167
Many of the criticisms levied against the home mortgage loan discrimination study of Munnell, et al. (1996) could perhaps be applied to the analyses in this Chapter. Yet, these criticisms have been effectively countered by, e.g., Browne and Tootell (1995) and Tootell (1996). What is important to keep in mind in reference to the analyses in the present Chapter compared with Munnell, et al. (1996), is the magnitude of the estimated racial disparities. The absolute size of the raw racial differences found in the mortgage study are considerably smaller than those observed in this study regarding small business credit.149
The magnitude of the racial difference in small business loan approval rates is substantial, even after controlling for observed differences in creditworthiness, and considerably larger than that found in the analysis of discrimination in mortgage markets. Why do the results for small business loans differ so markedly from those obtained from mortgage loans? First, many mortgages are sold in the secondary market and a substantial fraction of mortgage lenders have little intention of keeping the loans they make. This added “distance” in the transaction might reduce the likelihood of discrimination. As Day and Liebowitz (1998, p. 6) point out, “economic self-interest, therefore, should reduce racial discrimination in this market more completely than in many others.” A highly sophisticated secondary market for loans to small firms does not exist. Second, the presence of special programs and regulatory incentives to encourage banks and others to increase their mortgage lending to minorities gives these groups some advantages in obtaining a mortgage.
Clearly, a portion of the difference in denial rates between nonminority males and other groups in both types of studies appears to be due to differences in the characteristics of the applicants. Even after controlling for these differences, however, the gap in denial rates in the small business credit market is considerably larger than that found in the mortgage market.150
Our analysis finds significant evidence that African American-owned businesses face impediments to obtaining credit that go beyond observable differences in their creditworthiness. These firms are more likely to report that credit availability was a problem in the past and expect it to be a problem in the future. In fact, these concerns prevented more African American-owned firms from applying for loans because they feared being turned down due to prejudice or discrimination. We also found that loan denial rates are significantly higher for African American-owned firms than for nonminority male-owned firms even after taking into account differences in an extensive array of measures of creditworthiness and other characteristics. This result appears to be largely insensitive to geographic location or to changes in econometric specification. Comparable findings are observed for other minority business owners and for nonminority women as well, although not with as much consistency as the findings for African Americans.
149 In the Boston Fed study, 10 percent of White mortgage applications were rejected compared with 28 percent for
African Americans. Loan denial rates (weighted) for business credit in this study ranged from 8.3 to 26.2 percent for White males and between 50.0 and 65.9 percent for African American-owned firms (depending on which NSSBF or SSBF survey is used).
150 The gap in denial rates between African Americans and nonminorities with similar characteristics is between 34-46 percentage points in the small business credit market compared with 7 percentage points in the mortgage market.

Statistical Disparities in Capital Markets
NERA Economic Consulting
168
Overall, the evidence is strong that African American-owned firms and, to varying degrees, other M/WBE firms, face large and statistically significant disadvantages in the market for small business credit. The larger size and significance of the effects found in our analyses (compared to mortgage market analyses) significantly reduces the possibility that the observed differences can be explained away by some quirk of the econometric estimation procedure and, instead, strongly suggests that the observed differences are consistent with the presence of discrimination.
L. Evidence of Credit Market Discrimination from 2008 and Beyond
As noted above, the Federal Reserve abolished the SSBF prior to releasing results from 2008, and the most recent NERA survey on credit access was conducted in 2007. Economist Alicia Robb, in her article “Beyond the late, lamented Survey of Small Business Finance,” notes:
A few years ago, the [SSBF], the main source of data on small business financing, was cancelled by the Federal Reserve Board. The SSBF had provided detailed information on the use of credit and other financial services by small businesses every five years beginning in 1987. There are no data available after 2003. The Federal Reserve stated the survey was cancelled for financial reasons and the survey had been conducted four times in varying economic conditions. Yet, less than a year after the cancellation, the worst financial crisis hit the United States since the Great Depression. Unfortunately, the nation now has no demand-side data to investigate the impact of this financial crisis on small business financing or firm performance. …. It is ironic that a survey that could shed light on the impact of a financial crisis on the state of small business financing was cancelled due to budgetary concerns when the government has spent hundreds of billions of dollars on other matters arising from the crisis. The survey cost about $6 million dollars over a five-year survey period, more of a rounding error to the Fed than a significant investment. What a pity that we have no data for 2008—a year of great interest for policy purposes.151
Given this, what can we say about evidence of M/WBE disparities in access to capital and credit during the period subsequent to 2007? Although the negative impact of the loss of the SSBF cannot be overstated, Dr. Robb and others have worked to fill the void using analyses on a unique data set known as the Kauffman Firm Survey (“KFS”). As mentioned above, the KFS is the largest and longest longitudinal survey of new businesses in the world, and followed a large sample of small businesses for eight years, from their inception in 2004 through 2011.
Robb (2013) uses data from the 2004-2010 cohort of KFS firms to examine the financing patterns of firms during their first years of operation. Key findings from this study include:
• Differences in asset levels are the largest single factor explaining racial disparities in business creation rates. Half of all Hispanic families in 2004 had less than $13,375 in wealth and half of all African American families in 2004 had less than $8,650 in wealth. These figures were 12 percent and 8 percent, respectively, of nonminority wealth levels (Robb, 2013, pp. 5-6).
151 Robb (2010).
Statistical Disparities in Capital Markets
NERA Economic Consulting
169
• There is evidence that during times of financial distress, bank lending is curtailed, especially to firms that appear inherently more risky, such as minority-owned and women-owned firms (Ibid. at 7, citing Caballero and Krishnamurthy, 2008; Ivashina and Scharfstein, 2010).
• During 2007-2010, young firms owned by African Americans, Hispanics, and women were statistically significantly less likely than similarly situated nonminority firms to apply for credit when they needed it for fear of denial. Robb (2013, p. 23) notes: “This is perhaps the clearest recent evidence of continued borrowing constraints for Black and Hispanic business owners in the United States. Women were also more likely than men to have this fear during the economic crisis.”
• During 2007-2010, when they did apply for credit, young African American- and Hispanic-owned firms were statistically significantly more likely to have their loans denied than nonminority-owned firms with comparable levels of creditworthiness (Ibid. at 25).
• Moreover, the magnitude of minority denials “increased dramatically” during the 2007-2010 period and through the financial crisis (Ibid.).
• Women-owned firms were also more likely to be denied than nonminority male firms with comparable creditworthiness levels although the differences were not always statistically significant (Ibid.).
Robb (2013) concludes:
The analysis…suggests minority owners who did not apply for new loans were significantly more likely than their White counterparts to avoid applying for loans when needed because they were afraid that their loan applications would be declined by lenders. This is even after controlling for credit quality and a host of owner and firm characteristics. Women were also more likely than similar men not to apply for credit when it was needed for fear of having their loan application denied during the years of the economic crisis. The analysis showed that women and minority business owners’ fears of being declined for a loan were not necessarily unwarranted. In particular, in terms of loan application outcomes, even after controlling for such factors as industry, credit score, legal form, and human capital, minority owners of young firms were significantly less likely to have their loan applications approved than were similar White business owners. Similarly, in 2008, women owners of new businesses were significantly less likely than men with similar credit profiles and legal forms of organization to be approved for loans. More generally, the results suggest that in the initial year of startup, Black- and Hispanic-owned businesses faced greater credit constraints than did their White and Asian counterparts. Similarly, women-owned businesses faced greater credit constraints than did similar startups owned by men during the years of the financial crisis (Ibid. at 31-32).
Robb, et al. (2010) use data from the 2004-2008 KFS cohort to examine differences in external financing among African American- and nonminority-owned firms to determine if African

Statistical Disparities in Capital Markets
NERA Economic Consulting
170
Americans received smaller loans after starting up. Controlling for both firm and owner characteristics, including credit scores and owner wealth, they found that adverse disparities in the amounts of financing persisted, with race being the strongest single determinant of loan size.
Bates and Robb (2013) provide an overview of the major issues and debates that continue to the present day regarding discrimination in commercial credit access. They conclude:
Limited access to financing restricts the ability of [MBEs] to achieve viability, to generate new jobs, and, generally, to reach their full potential to contribute to the economic development of the communities and regions in which they operate. Although MBEs rely more heavily on financial institutions for loans than all other borrowing sources combined, they experience higher costs than White firms when they borrow, receive smaller loans, and have their loan applications rejected more often. … The federal government needs to prosecute financial institutions that discriminate against MBEs on the basis of borrower race. Local governments can assist by weighing bank-lending activity in local minority communities when choosing the local banks with which they do business. Prompt payment of MBE vendor invoices by public-sector clients is needed (Bates and Robb, 2013, p. 1).
Noting that urban minority-owned businesses are heavily concentrated in relatively segregated neighborhoods, Bates and Robb (2016) examined whether loan denial disparities were attributable to race, to location, or to both. Using the 2004-2011 cohort from the KFS data to disentangle the interaction of race and location, they conclude that:
[Our] findings suggest that banks engage in discriminatory practices limiting credit availability to MBEs. Controlling for risk factors, however, firm location in a minority or inner-city neighborhood has no apparent impact on loan availability or size. Owner race/ethnicity, in contrast, is important. Subtle processes discourage MBEs from seeking bank loans. Owner race and wealth both powerfully shape loan access: high wealth opens doors, minority ownership closes them (Bates and Robb, 2016, p. 159).
Post-2007 evidence is also provided by sources other than the KFS. In addition to their own findings, Bates and Robb (2016) also report on the findings of Bone, et al. (2014) who conducted a paired testing, or audit, study of small business credit access and race. Bates and Robb (2016) summarize:
A common initial objective of firm owners seeking business loans is to identify bank-lending criteria. In their audit study of small business owners seeking bank loans, Bone, [et al. (2014)] focused directly on this inquiry stage and found that Black and Latino owners were treated differently than matched Whites. Typifying audit studies, the White and minority testers were matched regarding age, gender, credit history, personal net worth, characteristics of the loans being sought, and other traits, and their differential treatment was strongly consistent with minority owners being treated worse than Whites. … In comparison to White testers, minorities were more often asked to provide business financial statements (83% vs. 50%), income tax returns (86% vs. 52%), bank account information (25% vs. 0%), personal financial asset details (60% vs. 22%), and credit card debt (42% vs. 13%). Additionally, minorities were offered less frequent assistance than

Statistical Disparities in Capital Markets
NERA Economic Consulting
171
Whites in completing loan applications (18% vs. 59%), and loan officers offered business cards to minority testers less often (43% vs. 82%). Overall, minorities were consistently offered less assistance and subjected to greater scrutiny, in comparison with the White testers (Bates and Robb, 2016, p. 160, referencing Bone, et al., 2014).
[These audit] study findings … indicate that starkly differential treatment [by race] is real in the experiences of minorities investigating small-business financing sources. By themselves, these findings provide no direct evidence of racial reservation price differentials regarding loan terms. What they do provide is audit study evidence of minorities being treated badly, compared with Whites. In this sense, they confirm, with control-group precision, past findings that banks treat MBEs badly, relative to equally creditworthy Whites. Studies using regression analysis to demonstrate disproportionate bank rejection of minority loan applicants, their unfavorable loan terms, and high discouraged-borrower incidence are all subject to omitted variable-bias criticisms …. No such criticisms apply to the [Bone et al. 2014] audit study findings (Bates and Robb, 2016, p. 162, referencing Bone, et al., 2014).
The findings of Robb (2013), Robb, et al. (2010), Bates and Robb (2013), Bates and Robb (2016), and Bone, et al. (2014) are consistent with the findings reported above in this chapter from the SSBF and from NERA’s own surveys. There is no evidence to suggest that credit discrimination has lessened in the years since 2007. Indeed, the available evidence suggests that credit discrimination has continued and, if anything, worsened during and subsequent to the recent financial crisis.

Statistical Disparities in Capital Markets
NERA Economic Consulting
172
This page intentionally left blank.

M/WBE and PBE Utilization and Disparity in DCAMM Contracting Activity
NERA Economic Consulting
173
VI. M/WBE and PBE Utilization and Disparity in DCAMM Contracting Activity
A. Introduction
The Croson decision and its progeny have held that statistical evidence of race-based or gender-based disparities in business enterprise activity is a requirement for any state or local entity that desires to establish or maintain race-conscious or gender-conscious requirements for M/WBE participation in contracting and procurement. Chapters IV and V documented several specific disparities facing minority- and women-owned firms in the private sector of DCAMM’s market area, where contracting and procurement activity is generally not subject to such requirements. In this chapter, we combined the evidence from Chapter III, which estimates M/WBE and PBE availability in the DCAMM market area, with the Master Contract/Subcontract Database described in Chapter II, in order to examine whether there is statistical evidence of disparities in DCAMM’s own contracting activity.
The statistical evidence reported in Chapter II has already established from which specific industries DCAMM procures goods and services from as well as from which geographic areas it draws the majority of its prime contractors and subcontractors. In addition, the statistical evidence reported in Chapter III has established what percentage of all firms in DCAMM’s geographic and product markets are M/WBEs and PBEs.
To determine whether M/WBEs and PBEs have been underutilized at DCAMM, we should ideally examine public expenditures that were not subject to subcontracting goals. DCAMM has a long and well-established policy of setting subcontracting goals on many of its construction and design contracts. Given this, the data on DCAMM contracts may not show evidence of underutilization, even if such underutilization exists in DCAMM’s relevant market area. Instead, the data on such contracts is most informative for examining the effectiveness of DCAMM’s M/WBE efforts during the study time period.
If DCAMM M/WBE utilization is still significantly less than M/WBE availability, particularly on such contracts on which no subcontracting goals were established, then that data would be consistent with the persistence of discrimination, in conjunction with the private sector data examined in Chapters IV and V.
This chapter, therefore, will document:
• To what extent have M/WBEs and PBEs been utilized in the contracting and subcontracting activities of DCAMM during the study period.
• To what extent there is a disparity between M/WBE and PBE utilization and M/WBE and PBE availability, respectively, in the relevant market area.
The M/WBE and PBE utilization results below are reported using two different, but related, measures—dollars awarded and dollars paid. We report this information for Construction, Design, and for both categories combined. Results for M/WBEs are reported by race and gender

M/WBE and PBE Utilization and Disparity in DCAMM Contracting Activity
NERA Economic Consulting
174
as well as for minorities as a group and for all minorities and women combined. Results for PBEs are reported for ancestry via Portugal and ancestry via Brazil, as well as for both ancestry groups combined.
B. M/WBE and PBE Utilization for All Contracting Dollars
For this Study, we examined 1,920 prime contracts and 7,196 associated subcontracts active during 2010-2015. These contracts had a total award value of $3.13 billion and a total paid value of $2.97 billion.152 NAICS codes, M/WBE status, PBE status, and detailed race and gender status for the prime contractors and subcontractors included in the Master Contract/Subcontract Database were established through extensive computer-assisted cross-referencing of firms in our database with firms in the (a) Massachusetts SDO directory, (b) the master directory of M/WBEs assembled for this study, (c) Dun & Bradstreet, (d) company profiles drawn from Hoover’s, American Business Information, Standard & Poor’s, and other sources, and (e) the results of our race/gender misclassification/non-classification surveys.
1. M/WBE Utilization Across All Contracts
From Tables 6.1 and 6.2 we see that, as a group during the study period, M/WBEs were awarded 14.62 percent and paid 14.48 percent of all contract and subcontract dollars in Construction, and awarded 25.51 percent and paid 26.40 percent of all contract and subcontract dollars in Design. Altogether, M/WBEs were awarded 15.77 percent and paid 15.72 percent of all contract and subcontract dollars during the study period. Among M/WBEs, firms owned by nonminority females were awarded the largest fraction of contracting and subcontracting dollars (both awarded and paid), followed in descending order by firms owned by Hispanics, Asians/Pacific Islanders, African Americans, Cape Verdeans, and Native Americans.
Non-M/WBEs were awarded and paid the vast majority of contract and subcontract dollars in all categories. Non-M/WBEs received 85.38 percent of Construction awards, 74.49 percent of Design awards, and 84.23 percent of awards overall. Measured by payments, non-M/WBEs received 85.52 percent of Construction payments, 73.60 percent of Design payments, and 84.28 percent of payments overall.
152 Payments on contracts that were not substantially complete at the time of the Study data collection were
excluded from the paid dollar totals.
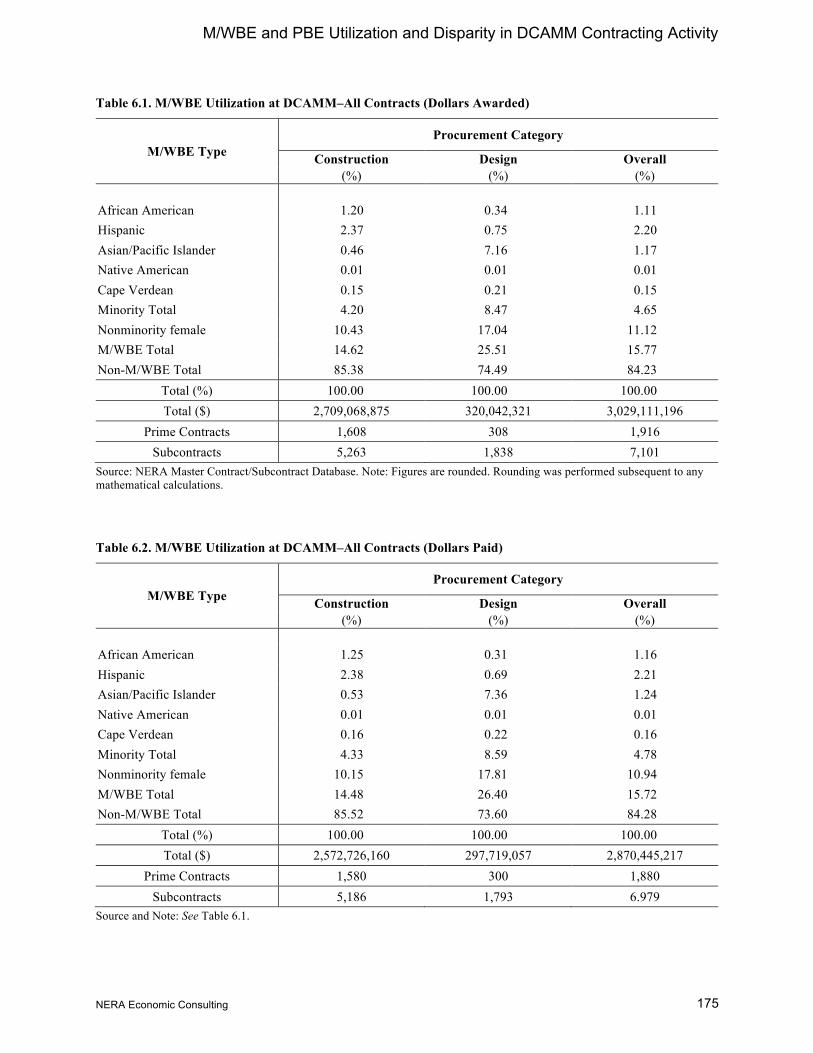
M/WBE and PBE Utilization and Disparity in DCAMM Contracting Activity
NERA Economic Consulting
175
Table 6.1. M/WBE Utilization at DCAMM–All Contracts (Dollars Awarded)
M/WBE Type Procurement Category
Construction Design Overall (%) (%) (%)
African American 1.20 0.34 1.11 Hispanic 2.37 0.75 2.20 Asian/Pacific Islander 0.46 7.16 1.17 Native American 0.01 0.01 0.01 Cape Verdean 0.15 0.21 0.15 Minority Total 4.20 8.47 4.65 Nonminority female 10.43 17.04 11.12 M/WBE Total 14.62 25.51 15.77 Non-M/WBE Total 85.38 74.49 84.23
Total (%) 100.00 100.00 100.00 Total ($) 2,709,068,875 320,042,321 3,029,111,196
Prime Contracts 1,608 308 1,916 Subcontracts 5,263 1,838 7,101
Source: NERA Master Contract/Subcontract Database. Note: Figures are rounded. Rounding was performed subsequent to any mathematical calculations.
Table 6.2. M/WBE Utilization at DCAMM–All Contracts (Dollars Paid)
M/WBE Type Procurement Category
Construction Design Overall (%) (%) (%)
African American 1.25 0.31 1.16 Hispanic 2.38 0.69 2.21 Asian/Pacific Islander 0.53 7.36 1.24 Native American 0.01 0.01 0.01 Cape Verdean 0.16 0.22 0.16 Minority Total 4.33 8.59 4.78 Nonminority female 10.15 17.81 10.94 M/WBE Total 14.48 26.40 15.72 Non-M/WBE Total 85.52 73.60 84.28
Total (%) 100.00 100.00 100.00 Total ($) 2,572,726,160 297,719,057 2,870,445,217
Prime Contracts 1,580 300 1,880 Subcontracts 5,186 1,793 6.979
Source and Note: See Table 6.1.

M/WBE and PBE Utilization and Disparity in DCAMM Contracting Activity
NERA Economic Consulting
176
2. PBE Utilization Across All Contracts
From Tables 6.3 and 6.4 we see that, as a group during the study period, PBEs were awarded 4.99 percent and paid 5.09 percent of all contract and subcontract dollars in Construction, and awarded 0.32 percent and paid 0.32 percent of all contract and subcontract dollars in Design. Altogether, PBEs were awarded 4.57 percent and paid 4.68 percent of all contract and subcontract dollars during the study period. Among PBEs, firms owned by persons with ancestry via Portugal were awarded the largest fraction of contracting and subcontracting dollars (both awarded and paid), followed by firms owned by persons with ancestry via Brazil.
Non-PBEs were awarded and paid the vast majority of contract and subcontract dollars in all categories. Non-PBEs received 95.01 percent of Construction awards, 99.68 percent of Design awards, and 95.43 percent of awards overall. Measured by payments, non-PBEs received 94.91 percent of Construction payments, 99.68 percent of Design payments, and 95.32 percent of payments overall.
Table 6.3. PBE Utilization at DCAMM–All Contracts (Dollars Awarded)
PBE Type Procurement Category
Construction Design Overall (%) (%) (%)
Ancestry via Portugal 4.88 0.32 4.47 Ancestry via Brazil 0.11 0.00 0.10 PBE Total 4.99 0.32 4.57 Non-PBE Total 95.01 99.68 95.43
Total (%) 100.00 100.00 100.00 Total ($) 2,434,460,883 239,175,726 2,673,636,610
Prime Contracts 1,489 237 1,726 Subcontracts 4,410 1,204 5,614
Source and Note: See Table 6.1.

M/WBE and PBE Utilization and Disparity in DCAMM Contracting Activity
NERA Economic Consulting
177
Table 6.4. PBE Utilization at DCAMM–All Contracts (Dollars Paid)
M/WBE Type Procurement Category
Construction Design Overall (%) (%) (%)
Ancestry via Portugal 4.97 0.32 4.57 Ancestry via Brazil 0.12 0.00 0.11 PBE Total 5.09 0.32 4.68 Non-PBE Total 94.91 99.68 95.32
Total (%) 100.00 100.00 100.00 Total ($) 2,318,220,445 219,834,456 2,538,054,901
Prime Contracts 1,465 231 1,696 Subcontracts 4,349 1,174 5,523
Source and Note: See Table 6.1.
C. M/WBE and PBE Disparity Analysis for All Contracting Dollars
1. M/WBE Results by Major Procurement Category
In this section, we compare our estimates of M/WBE utilization in DCAMM’s contracting and subcontracting activities to our estimates of M/WBE availability in the relevant geographic and product market area. Tables 6.5 and 6.6 present the results of this comparison for all prime contracts and purchase orders examined during the study period, using dollars awarded and dollars paid, respectively, as the metric of utilization.
In each of these tables, the figures in the utilization column include both prime contract and subcontract dollars and were derived as described above in this chapter. The figures in the availability column were derived as described in Chapter III. The disparity ratio, which appears in the final column of each table, is derived by dividing utilization by availability and then multiplying the result by 100. A disparity ratio below 100 indicates that M/WBEs did not participate in DCAMM contracting and subcontracting at a level that is consistent with their estimated availability in the relevant market area. A disparity ratio is said to be substantively significant, or large, if its value is approximately 80 or less. A disparity ratio is said to be statistically significant if it is unlikely to be caused by chance alone. In the tables below, statistical significance is indicated by one or more asterisks to the right of the disparity ratio.
When all procurement categories are combined, Tables 6.5 and 6.6 show that adverse disparities are observed for firms owned by African Americans and Native Americans. These disparities are all large, and the disparities for Native Americans are statistically significant.
In Construction, adverse disparities are observed for firms owned by African Americans, Asians/Pacific Islanders, and Native Americans. These disparities are all large, and the disparities for Native Americans are statistically significant.

M/WBE and PBE Utilization and Disparity in DCAMM Contracting Activity
NERA Economic Consulting
178
In Design, adverse disparities are observed for firms owned by African Americans, Hispanics, and Native Americans. These disparities are all large. The disparity for paid dollars for African Americans is statistically significant and the disparities for Native Americans are statistically significant.
Table 6.5. M/WBE Utilization, Availability, and Disparity Results for DCAMM Contracting, Overall and by Contracting Category–All Contracts (Dollars Awarded)
Contracting Category & M/WBE Type Utilization Availability Disparity Ratio
OVERALL African American 1.11 1.62 68.2 Hispanic 2.20 1.23 Asian/Pacific Islander 1.17 0.84 Native American 0.01 0.23 5.0 *** Cape Verdean 0.15 0.12 Minority-owned 4.65 4.06 Nonminority female 11.12 7.98 M/WBE total 15.77 12.04 CONSTRUCTION African American 1.20 1.66 72.3 Hispanic 2.37 1.26 Asian/Pacific Islander 0.46 0.72 64.5 Native American 0.01 0.24 5.1 *** Cape Verdean 0.15 0.12 Minority-owned 4.20 3.99 Nonminority female 10.43 7.45 M/WBE total 14.62 11.44
DESIGN African American 0.34 1.36 25.0 *** Hispanic 0.75 1.02 74.1 Asian/Pacific Islander 7.16 1.88 Native American 0.01 0.20 4.0 *** Cape Verdean 0.21 0.17 Minority-owned 8.47 4.63 Nonminority female 17.04 12.07 M/WBE total 25.51 16.70
Source: Calculations from NERA Master Contract/Subcontract Database and NERA Baseline Business Universe. Notes: (1) “*” indicates an adverse disparity that is statistically significant at the 10% level or better (90% confidence). “**” indicates the disparity is significant at a 5% level or better (95% confidence). “***” indicates significance at a 1% level or better (99% confidence). (2) An empty cell in the Disparity Ratio column indicates that no adverse disparity was observed for that category.

M/WBE and PBE Utilization and Disparity in DCAMM Contracting Activity
NERA Economic Consulting
179
Table 6.6. M/WBE Utilization, Availability, and Disparity Results for DCAMM Contracting, Overall and by Contracting Category–All Contracts (Dollars Paid)
Contracting Category & M/WBE Type Utilization Availability Disparity Ratio
OVERALL African American 1.16 1.63 70.9 Hispanic 2.21 1.25 Asian/Pacific Islander 1.24 0.82 Native American 0.01 0.24 5.3 *** Cape Verdean 0.16 0.12 Minority-owned 4.78 4.06 Nonminority female 10.94 7.90 M/WBE total 15.72 11.96 CONSTRUCTION African American 1.25 1.67 75.3 Hispanic 2.38 1.28 Asian/Pacific Islander 0.53 0.69 76.1 Native American 0.01 0.24 5.3 *** Cape Verdean 0.16 0.12 Minority-owned 4.33 4.00 Nonminority female 10.15 7.36 M/WBE total 14.48 11.36
DESIGN African American 0.31 1.35 22.8 *** Hispanic 0.69 1.00 68.8 Asian/Pacific Islander 7.36 1.88 Native American 0.01 0.19 4.4 *** Cape Verdean 0.22 0.17 Minority-owned 8.59 4.60 Nonminority female 17.81 12.16 M/WBE total 26.40 16.76
Source and Notes: See Table 6.5.
2. PBE Results by Major Procurement Category
In this section, we compare our estimates of PBE utilization in DCAMM’s contracting and subcontracting activities to our estimates of PBE availability in the relevant geographic and product market area. Tables 6.7 and 6.8 present the results of this comparison for all prime contracts and purchase orders examined during the study period, using dollars awarded and dollars paid, respectively, as the metric of utilization.
When all procurement categories are combined, Tables 6.7 and 6.8 show that adverse disparities are observed for Portuguese firms with Brazilian ancestry. These disparities are large and statistically significant.
In Construction, adverse disparities are observed for Portuguese firms with Brazilian ancestry. These disparities are large and statistically significant.
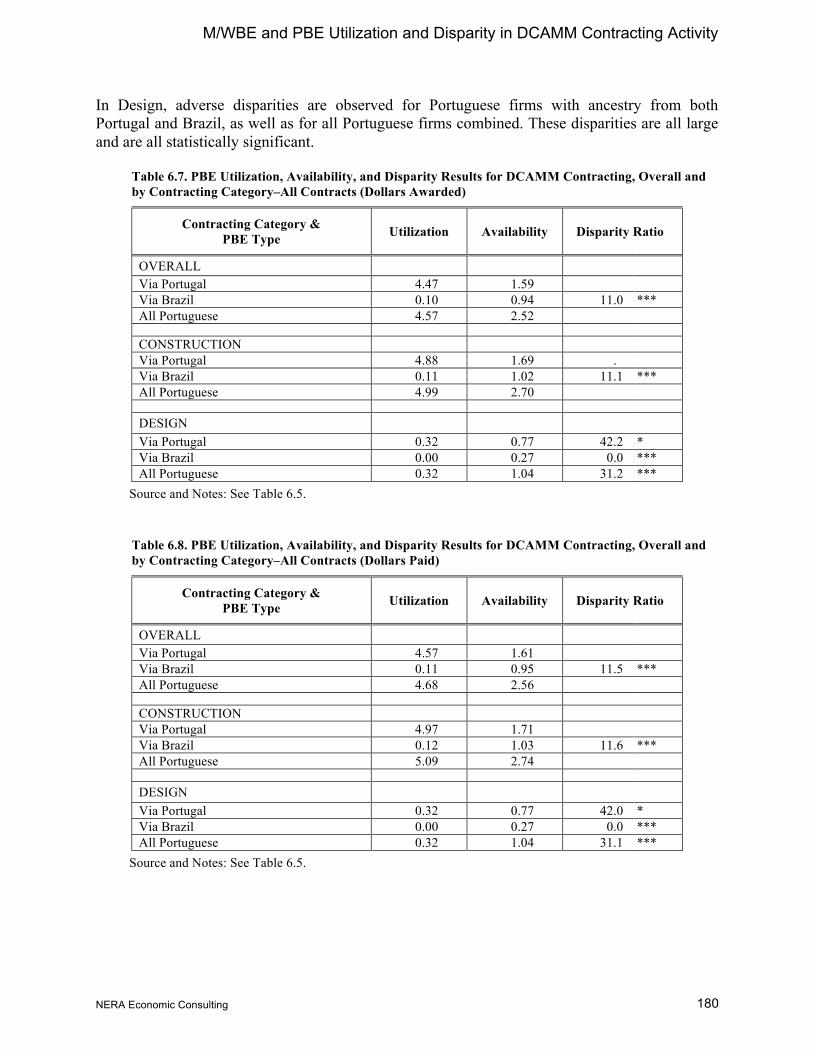
M/WBE and PBE Utilization and Disparity in DCAMM Contracting Activity
NERA Economic Consulting
180
In Design, adverse disparities are observed for Portuguese firms with ancestry from both Portugal and Brazil, as well as for all Portuguese firms combined. These disparities are all large and are all statistically significant.
Table 6.7. PBE Utilization, Availability, and Disparity Results for DCAMM Contracting, Overall and by Contracting Category–All Contracts (Dollars Awarded)
Contracting Category & PBE Type Utilization Availability Disparity Ratio
OVERALL Via Portugal 4.47 1.59 Via Brazil 0.10 0.94 11.0 *** All Portuguese 4.57 2.52 CONSTRUCTION Via Portugal 4.88 1.69 . Via Brazil 0.11 1.02 11.1 *** All Portuguese 4.99 2.70
DESIGN Via Portugal 0.32 0.77 42.2 * Via Brazil 0.00 0.27 0.0 *** All Portuguese 0.32 1.04 31.2 ***
Source and Notes: See Table 6.5.
Table 6.8. PBE Utilization, Availability, and Disparity Results for DCAMM Contracting, Overall and by Contracting Category–All Contracts (Dollars Paid)
Contracting Category & PBE Type Utilization Availability Disparity Ratio
OVERALL Via Portugal 4.57 1.61 Via Brazil 0.11 0.95 11.5 *** All Portuguese 4.68 2.56 CONSTRUCTION Via Portugal 4.97 1.71 Via Brazil 0.12 1.03 11.6 *** All Portuguese 5.09 2.74
DESIGN Via Portugal 0.32 0.77 42.0 * Via Brazil 0.00 0.27 0.0 *** All Portuguese 0.32 1.04 31.1 ***
Source and Notes: See Table 6.5.

M/WBE and PBE Utilization and Disparity in DCAMM Contracting Activity
NERA Economic Consulting
181
3. Detailed Industry Level Results
Utilization, availability and disparity results comparable to those presented above in Tables 6.5 through 6.8 have also been produced according to detailed Industry Groups. These tables are presented in Appendix D.
D. Effects on M/WBEs When Public Sector Affirmative Action Programs Are Terminated
1. City of Boston
When public sector affirmative action programs in Massachusetts have been enjoined or otherwise discontinued, sharp declines in M/WBE utilization are observed. Two examples are presented here. The first is taken from the City of Boston. In 2003 the City suspended its affirmative action program for M/WBEs. The program has not yet been reinstated.
As we reported in our prior disparity study for DCAMM:153
According to [the City of Boston’s Resident Jobs Program data], prior to January 31, 2003, of [all the] firms tracked … as being paid, [MBEs were 3.64%], and [WBEs were 1.35%] …. Thus, approximately 5.0 percent of all firms being paid by the City at that time were M/WBEs. Subsequent to January 31, 2003 (through November 21, 2005), of [all] firms being paid by the City, only [2.15% were MBEs and only 0.98% were WBEs] …. Thus, since the termination of the program, the fraction of the [City’s] active contractor pool that is MBE is 41 percent lower and the fraction that is WBE is 27 percent lower. Assuming that average payment amounts did not change significantly between the two periods, these are dramatic reductions indeed.
For the current study, we obtained summary data from the City of Boston on MBE and WBE prime and subcontracting activity for the same time period that we studied for DCAMM (SFY 2010-2015). This data encompassed the three City departments that performed the largest amount of direct construction contracting during this period: the Public Facilities Department, the Public Works Department, and the Parks Department.154
For the Public Facilities Department, from a total of $52.25 million spent between SFY 2011 through SFY 2014, MBEs received 2.31 percent and WBEs received 1.98 percent, for an M/WBE total of 4.29 percent.
For the Public Works Department, from a total of $147.28 million spent between SFY 2010 through SFY 2014, MBEs received 0.85 percent and WBEs received 4.72 percent, for an M/WBE total of 5.57 percent.
153 See NERA Economic Consulting (2010), pp. 184-186. 154 Data for SFY 2010 was not available for the Public Facilities Department. Comparable data for Design contracts
that included subcontracting activity was not available.

M/WBE and PBE Utilization and Disparity in DCAMM Contracting Activity
NERA Economic Consulting
182
For the Parks Department, from a total of $246.83 million, MBEs received 0.69 percent and WBEs received 5.83 percent, for an M/WBE total of 6.52 percent.
For all three departments combined, from a total of $246.83 million, MBEs received 1.13 percent and WBEs received 4.35 percent, for an M/WBE total of 5.48 percent.
2. Massachusetts Bay Transportation Authority
Our second example is from the Massachusetts Bay Transportation Authority (“MBTA”). The MBTA’s M/WBE affirmative action program for state-funded contracts and procurements was suspended on June 28, 2000 as the result of legal challenge, although its implementation of the DBE Program for federally assisted procurements was not. As we reported in our prior disparity study for DCAMM:155
We obtained data from the MBTA regarding its state-funded expenditures from before and after the suspension of the M/WBE program. Reasonably complete data for the MBTA were obtained for the pre-suspension period between July 1995 and June 2000. The MBTA awarded approximately $557 million in construction contracts during this period. M/WBE participation on these contracts amounted to approximately 18.9 percent. The MBTA awarded approximately $39 million worth of construction-related professional services contracts during this same period. M/WBE participation on these contracts was approximately 19.1 percent.
The data we were able to obtain for the post-suspension period (July 2000 through December 2005) were less complete. The data that were available, however, indicate a severe decline in M/WBE participation at the MBTA after the suspension of the M/WBE program. [Although there were some gaps] [c]onstruction data [starting in] October 2002 [and running] through December 2005 … showed [less than] 0.13 percent … awarded to M/WBE firms. … An analysis of … professional services contracts awarded by the MBTA between July 2000 and June 2003 shows M/WBE participation of only 6.1 ….
For the current Study, we obtained data from MBTA on its state-funded Construction contract expenditures and Design contract expenditures for the SFY 2010 through SFY 2014 time period.156 Of $89.0 million in state-funded Construction contract expenditures during this time period, M/WBEs received just 5.11 percent. In contrast, during the same time period, MBTA’s federally assisted Construction contracts totaled $447.1 million, of which 29.94 percent was paid to M/WBEs.
155 Ibid. 156 Data for SFY 2015 was not yet available at the time the data request was made.

M/WBE and PBE Utilization and Disparity in DCAMM Contracting Activity
NERA Economic Consulting
183
We also obtained from MassDOT (MBTA’s parent agency) for its state-funded Construction contracting activity (which has not been enjoined) between SFY 2010 and SFY 2014. These data showed the following:157
• For SFY 2010, out of a total of $136.29 million, M/WBE utilization was 19.46%.
• For SFY 2011, out of a total of $186.78 million, M/WBE utilization was 24.26%.
• For SFY 2012, out of a total of $224.07 million, M/WBE utilization was 21.43%.
• For SFY 2013, out of a total of $144.12 million, M/WBE utilization was 18.33%.
• For SFY 2014, out of a total of $160.75 million, M/WBE utilization was 19.37%.
Overall, for MassDOT state-funded Construction contracts during SFY 2010 through SFY 2014, out of a total of $852.01 million in Construction contract awards, a total of 20.82 percent M/WBE participation was attained.
For state-funded MBTA Design contracts, out of a total of $27.44 million in total contract awards during the period, M/WBEs received just 7.50 percent. In contrast, during the same time period, MBTA’s federally assisted Design contracts totaled $300.66 million, of which 16.62 percent was paid to M/WBEs.
These data show clearly that, in the absence of affirmative efforts to include M/WBEs, participation levels tend to decline dramatically. M/WBE participation levels at MassDOT for Construction contracting and at MBTA for federally funded Design contracting rival those observed above in this Chapter for DCAMM’s own Construction and Design contracting. In contrast, M/WBE participation at the City of Boston, with no formal M/WBE program in place, and for MBTA’s state-funded Construction and Design contracts, which are precluded from affirmative M/WBE efforts, utilization levels are very low.
E. Current Availability versus Expected Availability
Finally, Tables 6.9 and 6.10 provide a comparison between current levels of M/WBE and PBE availability for DCAMM and levels that we would expect to observe in a race- and gender-neutral market area. The latter, referred to as “expected availability,” is derived by dividing the current availability figures, as documented in Tables 3.15 and 3.16, respectively, by the disparity ratios documented in column (3) of Table 4.23 and Table 4.24, respectively. If no disparity is present in the relevant market area, the disparity ratio will be equal to 100 and expected availability will be equivalent to current availability. In cases where adverse disparities are present in the relevant market area, the disparity ratio will be less than 100 and, consequently, expected availability will exceed current availability.
157 A request to MBTA for federally-funded Construction contracting figures for SFY 2010 through SFY 2014 is
pending.

M/WBE and PBE Utilization and Disparity in DCAMM Contracting Activity
NERA Economic Consulting
184
In 48 out of 48 instances, expected M/WBE availability in DCAMM’s market area exceeds current M/WBE availability by substantial margins. In 18 out of 18 instances, expected PBE availability in DCAMM’s market area exceeds current PBE availability by substantial margins.
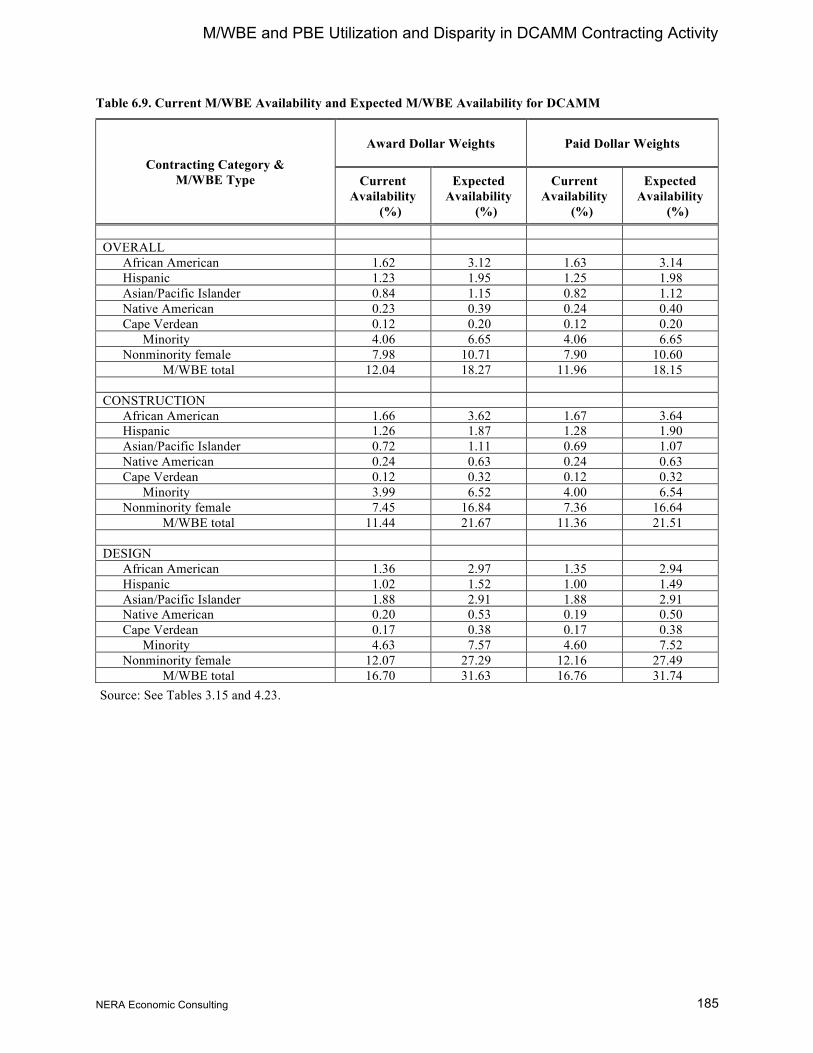
M/WBE and PBE Utilization and Disparity in DCAMM Contracting Activity
NERA Economic Consulting
185
Table 6.9. Current M/WBE Availability and Expected M/WBE Availability for DCAMM
Contracting Category & M/WBE Type
Award Dollar Weights Paid Dollar Weights
Current Availability
(%)
Expected Availability
(%)
Current Availability
(%)
Expected Availability
(%)
OVERALL African American 1.62 3.12 1.63 3.14 Hispanic 1.23 1.95 1.25 1.98 Asian/Pacific Islander 0.84 1.15 0.82 1.12 Native American 0.23 0.39 0.24 0.40 Cape Verdean 0.12 0.20 0.12 0.20 Minority 4.06 6.65 4.06 6.65 Nonminority female 7.98 10.71 7.90 10.60 M/WBE total 12.04 18.27 11.96 18.15 CONSTRUCTION African American 1.66 3.62 1.67 3.64 Hispanic 1.26 1.87 1.28 1.90 Asian/Pacific Islander 0.72 1.11 0.69 1.07 Native American 0.24 0.63 0.24 0.63 Cape Verdean 0.12 0.32 0.12 0.32 Minority 3.99 6.52 4.00 6.54 Nonminority female 7.45 16.84 7.36 16.64 M/WBE total 11.44 21.67 11.36 21.51 DESIGN African American 1.36 2.97 1.35 2.94 Hispanic 1.02 1.52 1.00 1.49 Asian/Pacific Islander 1.88 2.91 1.88 2.91 Native American 0.20 0.53 0.19 0.50 Cape Verdean 0.17 0.38 0.17 0.38 Minority 4.63 7.57 4.60 7.52 Nonminority female 12.07 27.29 12.16 27.49 M/WBE total 16.70 31.63 16.76 31.74 Source: See Tables 3.15 and 4.23.

M/WBE and PBE Utilization and Disparity in DCAMM Contracting Activity
NERA Economic Consulting
186
Table 6.10. Current PBE Availability and Expected PBE Availability for DCAMM
Contracting Category & PBE Type
Award Dollar Weights Paid Dollar Weights
Current Availability
(%)
Expected Availability
(%)
Current Availability
(%)
Expected Availability
(%)
OVERALL Ancestry via Portugal 1.59 1.79 1.61 1.81 Ancestry via Brazil 0.94 1.06 0.95 1.07 All Portuguese 2.52 2.84 2.56 2.88 CONSTRUCTION Ancestry via Portugal 1.69 2.22 1.71 2.25 Ancestry via Brazil 1.02 1.34 1.03 1.36 All Portuguese 2.70 3.55 2.74 3.61 DESIGN Ancestry via Portugal 0.77 1.01 0.77 1.01 Ancestry via Brazil 0.27 0.36 0.27 0.36 All Portuguese 1.04 1.37 1.04 1.37 Source: See Tables 3.16 and 4.24.

Anecdotal Evidence of Disparities in the DCAMM Market Area
NERA Economic Consulting
187
VII. Anecdotal Evidence of Disparities in the DCAMM Market Area
A. Introduction
We have presented a variety of economic and statistical findings above that are consistent with, and indicative of, the presence of business discrimination against minorities and women in the geographic and product markets that are relevant to DCAMM’s Construction and Design contracting activities. Chapters IV and V, in particular, have documented large and statistically significant disparities in DCAMM’s relevant markets adversely impacting the competitiveness and utilization of minority, female, and Portuguese entrepreneurs. In most cases, commercial loan denial rates were higher, the cost of credit was higher, business formation rates are lower, and business owner earnings are lower—even when comparisons are restricted to similarly situated businesses and business owners.
As a complement to these quantitative findings, we gathered anecdotal evidence regarding disparities, perceived barriers, and differences in treatment of business owners on the basis of race, gender or Portuguese ancestry in DCAMM’s market area. First, we conducted a large-scale survey of business establishments in the market area—M/WBE, non-M/WBE and PBE—and asked owners directly about their experiences, if any, with contemporary business-related acts of discrimination. We find that M/WBEs and PBEs in DCAMM’s markets report suffering business-related discrimination in substantial numbers and often with statistically significantly greater frequency than non-M/WBEs (see Table 7.5 for M/WBEs and Table 7.6 for PBEs). These differences tend to remain substantial when firm size and owner characteristics are held constant (see Tables 7.9 and 7.11 for M/WBEs and Tables 7.10 and 7.12 for PBEs). Additionally, we find that M/WBE and PBE firms that have been hired in the past by non-M/WBE prime contractors to work on public sector contracts with M/WBE goals often are not hired—or even solicited—by these prime contractors to work on projects without M/WBE goals (see Tables 7.17 and 7.19 for M/WBEs and Tables 7.18 and 7.20 for PBEs). The relative lack of M/WBE and PBE hiring and, even more significantly, the relative lack of solicitation of M/WBEs and PBEs in the absence of affirmative efforts by DCAMM and other public entities in the relevant market area, shows that business discrimination continues to fetter M/WBE and PBE business opportunities. We conclude that the statistical evidence presented in this Study is consistent with these anecdotal accounts of contemporary business discrimination.
The remainder of this chapter is organized as follows. We first discuss the mail survey results in Section B. In Section B.1, we discuss the survey questionnaire, sample frame, and response rate. Section B.2 presents evidence on willingness of firms to do business with the public sector. Section B.3 presents the key findings from the M/WBE, non-M/WBE and PBE respondents concerning disparate treatment. Section B.4 presents the key findings concerning the impact of the current business environment on M/WBEs’ and PBEs’ ability to conduct their businesses. Section B.5 presents key findings to our questions concerning whether prime contractors solicit or hire M/WBEs or PBEs for work on public or private contracts without M/WBE goals. Section B.6 then examines whether M/WBEs, non-M/WBEs or PBEs that responded to the mail surveys are representative of all M/WBEs, non-M/WBEs and PBEs in the relevant markets. To do so, we surveyed a random sample of M/WBEs, non-M/WBEs and PBEs that did not respond to our mail survey, and then compared their responses to key questions with those of our survey respondents.

Anecdotal Evidence of Disparities in the DCAMM Market Area
NERA Economic Consulting
188
Finally, Section C describes the results of the business experience group interviews. Responses are grouped under the headings of the most common cited barriers and issues facing businesses in DCAMM’s contracting market area.
B. Business Experience Surveys
1. Survey Questionnaire, Sample, and Responses
The survey questionnaire asked whether and with what frequency firms had experienced discrimination in a wide variety of likely business dealings in the previous five years. The survey also inquired about the influence of specific aspects of the everyday business environment, such as bonding and insurance requirements, on each firm’s ability to do business in DCAMM’s relevant markets. We also asked about the relative frequency with which firms that have been used as subcontractors, subconsultants, or suppliers by prime contractors on contracts with M/WBE goals have been hired to work, or even solicited to bid, on similar contracts without M/WBE goals. Finally, we posed questions about the characteristics of the firm, including firm age, owner’s education, employment size and revenue size, to facilitate comparisons of similarly situated firms.
The mail survey sample was stratified by industry and drawn directly from the Master M/WBE Directory and the Baseline Business Universe compiled for this Study using the custom census methodology outlined in this chapter.158 Firms were sampled randomly within strata. M/WBE and PBE firms were oversampled to facilitate statistical comparisons with non-M/WBEs. Of 14,422 businesses that received the questionnaire,159 1,263 (8.8%) provided usable responses.160 The distribution of total responses according to the race, gender, and Portuguese status of the business owner, by major contracting category, appears in Tables 7.1 and 7.2.
158 See Chapter II for a discussion of how the product and geographic markets were defined. See Chapter III for a
discussion of how the Master M/WBE Directory and the Baseline Business Universe were assembled. 159 These figures exclude surveys that were returned undelivered or were otherwise undeliverable. 160 The total number of valid responses to any particular survey question, however, was sometimes lower than this
due to item non-response.
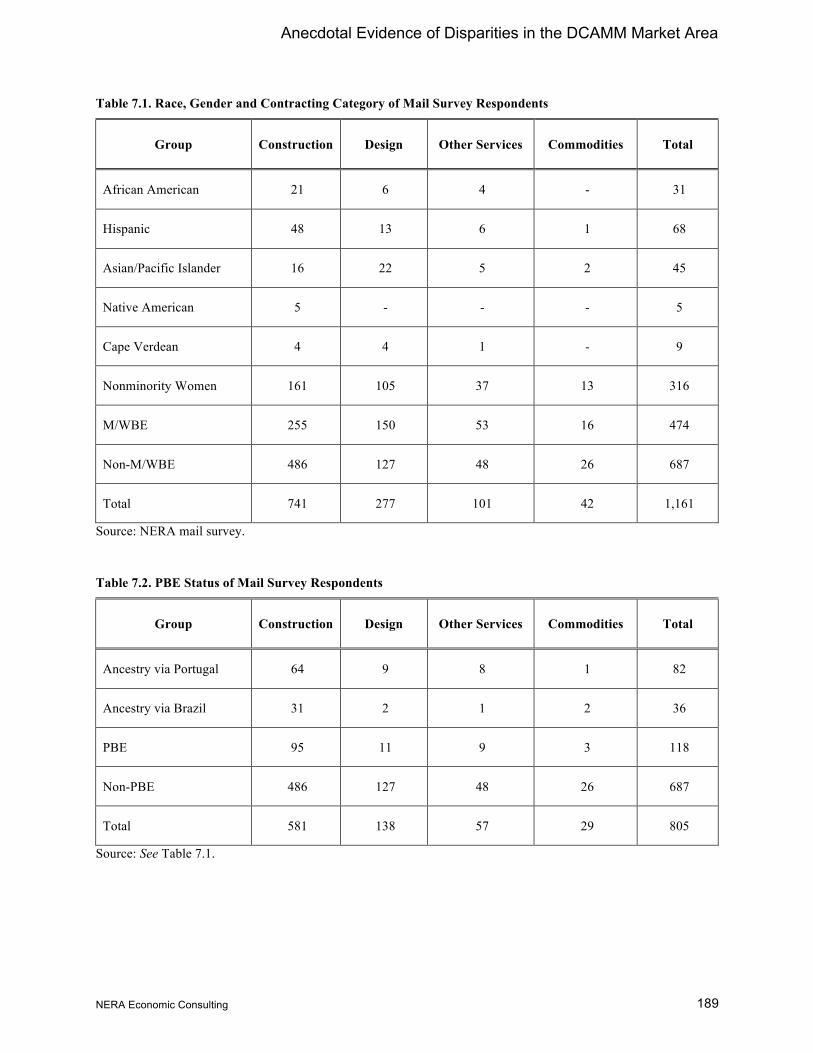
Anecdotal Evidence of Disparities in the DCAMM Market Area
NERA Economic Consulting
189
Table 7.1. Race, Gender and Contracting Category of Mail Survey Respondents
Group Construction Design Other Services Commodities Total
African American 21 6 4 - 31
Hispanic 48 13 6 1 68
Asian/Pacific Islander 16 22 5 2 45
Native American 5 - - - 5
Cape Verdean 4 4 1 - 9
Nonminority Women 161 105 37 13 316
M/WBE 255 150 53 16 474
Non-M/WBE 486 127 48 26 687
Total 741 277 101 42 1,161
Source: NERA mail survey.
Table 7.2. PBE Status of Mail Survey Respondents
Group Construction Design Other Services Commodities Total
Ancestry via Portugal 64 9 8 1 82
Ancestry via Brazil 31 2 1 2 36
PBE 95 11 9 3 118
Non-PBE 486 127 48 26 687
Total 581 138 57 29 805
Source: See Table 7.1.

Anecdotal Evidence of Disparities in the DCAMM Market Area
NERA Economic Consulting
190
2. Willingness of Firms to Contract with the Public Sector
The probative value of anecdotal evidence of discrimination increases when it comes from active businesses in the relevant geographic and procurement markets. The value of such evidence increases further when it comes from firms that have actually worked or attempted to work for the public sector within those markets. Such is the present case.
As shown below in Table 7.3, there is an observable link between the firms responding to our mail survey and the public sector of the Massachusetts area economy. All respondents operate establishments in the relevant geographic and product markets. Moreover, significant numbers of survey respondents have worked or attempted to do work for DCAMM or other public entities in the market area in the last five years. This is observed for virtually all types of M/WBEs and non-M/WBEs in all procurement categories, and the importance of the public sector is even more significant for M/WBEs than it is for non-MWBEs. Overall, 45 percent of non-M/WBEs and 52 percent of M/WBEs have worked or attempted to work for DCAMM or some other public entity in the market area in the previous five years.
Table 7.3. Survey Respondents Indicating They Had Worked or Attempted to Work for Public Sector Agencies in the Last Five Years, MW/BE
Worked or Attempted to
Work, Last 5 Years
African American Hispanic
Asian/ Pacific
Islander
Native American
Cape Verdean
Minority Total
Non-minority Female
M/WBE Non-M/WBE
ALL INDUSTRIES With DCAMM 38.7% 30.3% 33.3% 40.0% 11.1% 32.1% 29.1% 30.1% 20.8% (31) (66) (45) (5) (9) (156) (316) (472) (682) With Other Public Entity in Market Area
70.0% 43.9% 50.0% 80.0% 11.1% 50.0% 51.0% 50.6% 44.2%
(30) (66) (44) (5) (9) (154) (314) (468) (681) With any Public Entity in Market Area
73.3% 48.5% 50.0% 80.0% 11.1% 52.6% 51.6% 51.9% 44.9%
(30) (66) (44) (5) (9) (154) (314) (468) (680) CONSTRUCTION
With DCAMM 38.1% 30.4% 18.8% 40.0% 25.0% 30.4% 31.7% 31.2% 20.5%
(21) (46) (16) (5) (4) (92) (161) (253) (482) With Other Public Entity in Market Area
70.0% 41.3% 37.5% 80.0% 25.0% 48.4% 55.6% 53.0% 43.9%
(20) (46) (16) (5) (4) (91) (160) (251) (483) With any Public Entity in Market Area
75.0% 47.8% 37.5% 80.0% 25.0% 52.7% 56.9% 55.4% 44.4%
(20) (46) (16) (5) (4) (91) (160) (251) (482) DESIGN
With DCAMM 33.3% 38.5% 54.5% - 0.0% 42.2% 30.5% 34.0% 28.6%
(6) (13) (22) (0) (4) (45) (105) (150) (126) With Other Public Entity in Market Area
66.7% 61.5% 71.4% - 0.0% 61.4% 49.5% 53.0% 49.2%
(6) (13) (21) (0) (4) (44) (105) (149) (124)

Anecdotal Evidence of Disparities in the DCAMM Market Area
NERA Economic Consulting
191
Worked or Attempted to
Work, Last 5 Years
African American Hispanic
Asian/ Pacific
Islander
Native American
Cape Verdean
Minority Total
Non-minority Female
M/WBE Non-M/WBE
With any Public Entity in Market Area
66.7% 61.5% 71.4% - 0.0% 61.4% 49.5% 53.0% 50.8%
(6) (13) (21) (0) (4) (44) (105) (149) (124) OTHER SERVICES
With DCAMM 50.0% 16.7% 0.0% - 0.0% 18.8% 18.9% 18.9% 8.3%
(4) (6) (5) (0) (1) (16) (37) (53) (48) With Other Public Entity in Market Area
75.0% 33.3% 0.0% - 0.0% 31.3% 37.8% 35.8% 39.6%
(4) (6) (5) (0) (1) (16) (37) (53) (48) With any Public Entity in Market Area
75.0% 33.3% 0.0% - 0.0% 31.3% 37.8% 35.8% 39.6%
(4) (6) (5) (0) (1) (16) (37) (53) (48) COMMODITIES
With DCAMM - 0.0% 0.0% - - 0.0% 15.4% 12.5% 11.5%
(0) (1) (2) (0) (0) (3) (13) (16) (26) With Other Public Entity in Market Area
- 0.0% 50.0% - - 33.3% 41.7% 40.0% 34.6%
(0) (1) (2) (0) (0) (3) (12) (15) (26) With any Public Entity in Market Area
- 0.0% 50.0% - - 33.3% 41.7% 40.0% 34.6%
(0) (1) (2) (0) (0) (3) (12) (15) (26) Source: NERA mail survey. Note: Total number of valid responses in parentheses.
Comparable information for PBEs is shown below in Table 7.4. Overall, 45 percent of non-PBEs and 41 percent of PBEs have worked or attempted to work for DCAMM or some other public entity in the market area in the previous five years.
Table 7.4. Survey Respondents Indicating They Had Worked or Attempted to Work for Public Sector Agencies in the Last Five Years, PBE
Worked or Attempted to Work, Last 5 Years
Ancestry via Portugal
Ancestry via Brazil PBE Non-PBE
ALL INDUSTRIES With DCAMM 23.5% 11.1% 19.7% 20.8% (81) (36) (117) (682) With Other Public Entity in Market Area 48.8% 22.2% 40.5% 44.2%
(80) (36) (116) (681)
With any Public Entity in Market Area 50.0% 22.2% 41.4% 44.9%
(80) (36) (116) (680) CONSTRUCTION
With DCAMM 27.0% 9.7% 21.3% 20.5%

Anecdotal Evidence of Disparities in the DCAMM Market Area
NERA Economic Consulting
192
Worked or Attempted to Work, Last 5 Years
Ancestry via Portugal
Ancestry via Brazil PBE Non-PBE
(63) (31) (94) (482) With Other Public Entity in Market Area 51.6% 22.6% 41.9% 43.9%
(62) (31) (93) (483)
With any Public Entity in Market Area 53.2% 22.6% 43.0% 44.4%
(62) (31) (93) (482) DESIGN
With DCAMM 11.1% 0.0% 9.1% 28.6%
(9) (2) (11) (126) With Other Public Entity in Market Area 44.4% 0.0% 36.4% 49.2%
(9) (2) (11) (124)
With any Public Entity in Market Area 44.4% 0.0% 36.4% 50.8%
(9) (2) (11) (124) OTHER SERVICES
With DCAMM 12.5% 100.0% 22.2% 8.3%
(8) (1) (9) (48) With Other Public Entity in Market Area 37.5% 100.0% 44.4% 39.6%
(8) (1) (9) (48)
With any Public Entity in Market Area 37.5% 100.0% 44.4% 39.6%
(8) (1) (9) (48) COMMODITIES
With DCAMM 0.0% 0.0% 0.0% 11.5%
(1) (2) (3) (26) With Other Public Entity in Market Area 0.0% 0.0% 0.0% 34.6%
(1) (2) (3) (26)
With any Public Entity in Market Area 0.0% 0.0% 0.0% 34.6%
(1) (2) (3) (26) Source: NERA mail survey. Note: Total number of valid responses in parentheses.
3. Experiences of Disparate Treatment in Business Dealings
The survey included questions about instances of disparate treatment based on race and/or gender experienced in various business dealings during the past five years. As shown in the two rightmost columns of Table 7.5, in almost every one of the 14 categories on which they were polled, substantially and statistically significantly more M/WBEs than non-M/WBEs reported experiencing disparate treatment, casting doubt on claims of widespread “reverse discrimination.” In many cases, these differences were also statistically significant.
On average, reports were highest among African Americans, with an overall rate of 71 percent, followed in descending order, by Cape Verdeans (38%), nonminority women (37%), Hispanics (36%), Asians/Pacific Islanders (26%), and Native Americans (20%). By comparison, the

Anecdotal Evidence of Disparities in the DCAMM Market Area
NERA Economic Consulting
193
reported rate for nonminority males was 22 percent. The balance of Table 7.5 shows results for each of 14 distinct types of disparate treatment that we asked about in the survey.
In all 14 categories, the ratio of the reported amount of disparate treatment by M/WBEs is greater than for non-M/WBEs. In 12 of 14 categories, the ratio of the difference is large—more than 1.5 times the reported rate for non-M/WBEs. In 11 of 14 categories, this difference is statistically significant as well. In several categories, the reported incidence of disparate treatment is far more severe than 1.5 times the non-M/WBE rate of incidence. In applying for commercial loans, for example, M/WBEs reported disparate treatment more than 3 times more frequently than nonminority males.161 In applying for surety bonds, it was almost 6 times more frequent. In working or attempting to work on private sector prime contracts it was almost 4 times more frequent. In functioning without hindrance or harassment on the worksite, it was almost 3.5 times more frequent. In working or attempting to work on private sector subcontracts, and in having to perform inappropriate or extra work not required of comparable non-M/WBEs, it was almost 3 times more frequent.
Table 7.5 also provides evidence of the positive impact of public sector M/WBE programs in the Massachusetts economy. The category with the smallest overall relative difference between M/WBEs and non-M/WBEs was working or attempting to work on public sector subcontracts. In this category, the incidence of disparate impact was only 1.3 times more frequent.
Table 7.5. Firms Indicating They Had Been Treated Less Favorably Due to Race and/or Gender While Participating in Business Dealings, M/WBE
Business Dealings
African American Hispanic
Asian/ Pacific
Islander
Native American
Cape Verdean
Minority Total
Non-minority Female
M/WBE Non-M/WBE
Applying for com-mercial loans
35.3% 10.5% 0.0% 0.0% 28.6% 14.3% 6.8% 9.3% 2.9%
(17) (38) (18) (4) (7) (84) (162) (246) (385)
Applying for surety bonds
37.5% 6.9% 9.1% 0.0% 20.0% 15.4% 2.7% 7.4% 1.3%
(16) (29) (11) (4) (5) (65) (110) (175) (306) Applying for com-mercial or professional insurance
13.6% 10.2% 5.7% 0.0% 0.0% 8.6% 1.8% 4.2% 2.9%
(22) (49) (35) (4) (6) (116) (221) (337) (484)
Hiring workers from union hiring halls
25.0% 5.3% 0.0% 0.0% 0.0% 9.1% 3.8% 5.6% 2.9%
(12) (19) (4) (4) (5) (44) (80) (124) (205)
Obtaining price quotes from sup-pliers or subcon-tractors
27.8% 10.2% 4.0% 0.0% 14.3% 11.5% 8.4% 9.4% 3.7%
(18) (49) (25) (5) (7) (104) (214) (318) (454)
161 For more evidence on this topic, see Chapter V.

Anecdotal Evidence of Disparities in the DCAMM Market Area
NERA Economic Consulting
194
Business Dealings
African American Hispanic
Asian/ Pacific
Islander
Native American
Cape Verdean
Minority Total
Non-minority Female
M/WBE Non-M/WBE
Working or attempting to obtain work on public sector prime contracts
50.0% 27.5% 5.6% 20.0% 0.0% 26.1% 14.0% 18.5% 10.9%
(22) (40) (18) (5) (7) (92) (157) (249) (321)
Working or attempting to obtain work on public sector subcontracts
50.0% 15.8% 9.5% 20.0% 0.0% 21.1% 15.7% 17.6% 13.4%
(20) (38) (21) (5) (6) (90) (166) (256) (321)
Working or attempting to obtain work on private sector prime contracts
50.0% 22.2% 9.1% 0.0% 0.0% 23.2% 15.5% 18.0% 5.0%
(22) (45) (22) (4) (6) (99) (206) (305) (422)
Working or attempting to obtain work on private sector sub-contracts
42.9% 13.3% 13.6% 20.0% 0.0% 19.2% 10.9% 13.7% 4.8%
(21) (45) (22) (5) (6) (99) (201) (300) (419)
Receiving timely payment for work per-formed
47.8% 26.5% 19.4% 0.0% 16.7% 27.4% 23.9% 25.1% 13.5%
(23) (49) (31) (4) (6) (113) (238) (351) (474)
Functioning without hindrance or harassment on the work site
24.0% 9.5% 7.7% 0.0% 0.0% 11.3% 19.8% 17.1% 5.0%
(25) (42) (26) (5) (8) (106) (227) (333) (442)
Joining or dealing with construction trade associations
36.8% 9.1% 0.0% 20.0% 0.0% 13.6% 6.3% 8.5% 3.3%
(19) (33) (19) (5) (5) (81) (191) (272) (365)
Having to do inappro-priate or extra work not required of compar-able non-M/WBEs
39.1% 20.0% 15.4% 0.0% 16.7% 22.0% 7.1% 11.9% 4.3%
(23) (40) (26) (5) (6) (100) (212) (312) (420)
Double standards not required of compar-able non-M/WBEs
33.3% 6.7% 3.8% 0.0% 0.0% 11.3% 10.1% 10.5% 4.4%
(24) (45) (26) (5) (6) (106) (217) (323) (429)

Anecdotal Evidence of Disparities in the DCAMM Market Area
NERA Economic Consulting
195
Business Dealings
African American Hispanic
Asian/ Pacific
Islander
Native American
Cape Verdean
Minority Total
Non-minority Female
M/WBE Non-M/WBE
In any one of the business dealings listed above
71.4% 36.2% 26.3% 20.0% 37.5% 40.1% 37.3% 38.2% 21.6%
(28) (58) (38) (5) (8) (137) (271) (408) (542)
Source: See Table 7.1. Notes: Total number of valid responses in parentheses. Figures in boldface type are statistically significantly different from non-M/WBEs using a conventional two-tailed Fisher’s Exact Test and within a 95% or better confidence interval. Figures in boldface italicized type are significant within a 90% confidence interval.
Comparable information for PBEs appears in Table 7.6. In all 14 categories, the ratio of the reported amount of disparate treatment by PBEs is greater than for non-PBEs. In all 14 categories, the ratio of the difference is large—more than 1.5 times the reported rate for non-PBEs. In 13 of 14 categories, this difference is statistically significant as well. In applying for commercial loans, for example, PBEs reported disparate treatment almost 6 times more frequently than non-PBEs. In applying for surety bonds, it was over 7 times more frequent. In obtaining price quotes from suppliers it was 4 times more frequent. In having to meet quality, inspection or performance standards not required of comparable non-PBEs, it was almost 4 times more frequent. In working or attempting to work on private sector prime contracts and subcontracts it was also almost 4 times more frequent.
Table 7.6. Firms Indicating They Had Been Treated Less Favorably Due to Race and/or Gender While Participating in Business Dealings, PBE
Business Dealings Ancestry via Portugal
Ancestry via Brazil PBE Non-PBE
Applying for commercial loans
11.3% 28.6% 16.2% 2.9%
(53) (21) (74) (385)
Applying for surety bonds 10.9% 6.3% 9.7% 1.3% (46) (16) (62) (306)
Applying for commercial or professional insurance
8.6% 4.2% 7.4% 2.9%
(70) (24) (94) (484)
Hiring workers from union hiring halls
8.3% 7.7% 8.2% 2.9%
(36) (13) (49) (205)
Obtaining price quotes from suppliers or subcontractors
14.9% 16.0% 15.2% 3.7%
(67) (25) (92) (454)
Working or attempting to obtain work on public sector prime contracts
17.9% 20.0% 18.4% 10.9%
(56) (20) (76) (321)
Working or attempting to obtain work on public sector subcontracts
22.4% 15.8% 20.8% 13.4%
(58) (19) (77) (321)

Anecdotal Evidence of Disparities in the DCAMM Market Area
NERA Economic Consulting
196
Business Dealings Ancestry via Portugal
Ancestry via Brazil PBE Non-PBE
Working or attempting to obtain work on private sector prime contracts
15.6% 25.0% 18.2% 5.0%
(64) (24) (88) (422)
Working or attempting to obtain work on private sector subcontracts
17.7% 16.7% 17.4% 4.8%
(62) (24) (86) (419)
Receiving timely payment for work performed
25.8% 32.0% 27.5% 13.5%
(66) (25) (91) (474)
Functioning without hindrance or harassment on the work site
10.4% 19.0% 12.5% 5.0%
(67) (21) (88) (442) Joining or dealing with construction trade associations
5.4% 5.0% 5.3% 3.3%
(56) (20) (76) (365)
Having to do inappropriate or extra work not required of comparable non-M/WBEs
10.6% 12.5% 11.1% 4.3%
(66) (24) (90) (420)
Double standards not required of comparable non-M/WBEs
17.4% 13.0% 16.3% 4.4%
(69) (23) (92) (429)
In any one of the business dealings listed above
37.8% 53.3% 42.3% 21.6%
(74) (30) (104) (542) Source: See Table 7.1. Notes: Total number of valid responses in parentheses. Figures in boldface type are statistically significantly different from non-M/WBEs using a conventional two-tailed Fisher’s Exact Test and within a 95% or better confidence interval. Figures in boldface italicized type are significant within a 90% confidence interval.
Table 7.7 represents the same disparate treatment information as in Table 7.5, but with the frequency percentages replaced by relative rankings. That is, the 14 kinds of disparate treatment are ranked by each group according to the frequency with which disparate treatment was reported, with “1” representing the most frequent and “14” representing the least frequent.162 The most frequently reported problem overall for M/WBEs—as opposed to the one with the most relative difference from non-M/WBEs—was receiving timely payment for work performed. The next five most frequently reported, in descending order of frequency, were working or attempting to work on public sector prime contracts,163 working or attempting to work on private
162 In the case of ties, not all 14 ranks will be present. 163 In this survey question, “public sector” refers to public sector entities in general and not to DCAMM
specifically.

Anecdotal Evidence of Disparities in the DCAMM Market Area
NERA Economic Consulting
197
sector prime contracts, working or attempting to work on public sector subcontracts,164
functioning without hindrance or harassment on the work site, and working or attempting to work on private sector subcontracts.
Table 7.7. Firms Indicating They Had Been Treated Less Favorably Due to Race and/or Gender While Participating in Business Dealings (Rankings), M/WBE
Business Dealings
African American Hispanic
Asian/ Pacific
Islander
Native American
Cape Verdean
Minority Total
Non-minority Female
M/WBE
Applying for commercial loans
7 7 11 2 1 8 10 10
Applying for surety bonds
5 11 5 2 2 7 13 12
Applying for commercial or professional insurance
12 8 7 2 5 13 14 14
Hiring workers from union hiring halls
10 13 11 2 5 12 12 13
Obtaining price quotes from suppliers or subs
9 8 9 2 4 10 8 9
Working or attempting to obtain work on public sector prime contracts
1 1 8 1 5 2 5 2
Working or attempting to obtain work on public sector subcontracts
1 5 4 1 5 5 3 4
Working or attempting to obtain work on private sector prime contracts
1 3 5 2 5 3 4 3
Working or attempting to obtain work on private sector subcontracts
3 6 3 1 5 6 6 6
Receiving timely payment for work performed
2 2 1 2 3 1 1 1
164 In this survey question, “public sector” refers to public sector entities in general and not to DCAMM
specifically.

Anecdotal Evidence of Disparities in the DCAMM Market Area
NERA Economic Consulting
198
Business Dealings
African American Hispanic
Asian/ Pacific
Islander
Native American
Cape Verdean
Minority Total
Non-minority Female
M/WBE
Functioning without hindrance or harassment on the work site
11 9 6 2 5 11 2 5
Joining or dealing with trade associations
6 10 11 1 5 9 11 11
Having to do inappropriate or extra work not required of comparable non-M/WBEs
4 4 2 2 3 4 9 7
Having to meet quality or performance standards not required of comparable non-M/WBEs
8 12 10 2 5 11 7 8
Source: See Table 7.1.
Table 7.8 presents comparable information for PBEs. The most frequently reported problem overall for PBEs—as opposed to the one with the most relative difference from non-PBEs—was also receiving timely payment for work performed. The next five most frequently reported, in descending order of frequency, were working or attempting to work on public sector subcontracts,165 working or attempting to work on public sector prime contracts,166 working or attempting to work on private sector prime contractors, working or attempting to work on private sector subcontracts, and having to meet quality, inspection or performance standards not required of comparable non-PBEs.
Table 7.8. Firms Indicating They Had Been Treated Less Favorably Due to Race and/or Gender While Participating in Business Dealings (Rankings), PBE
Business Dealings Ancestry via Portugal Ancestry via Brazil PBE
Applying for commercial loans 8 2 7
Applying for surety bonds 9 12 11
165 In this survey question, “public sector” refers to public sector entities in general and not to DCAMM
specifically. 166 In this survey question, “public sector” refers to public sector entities in general and not to DCAMM
specifically.
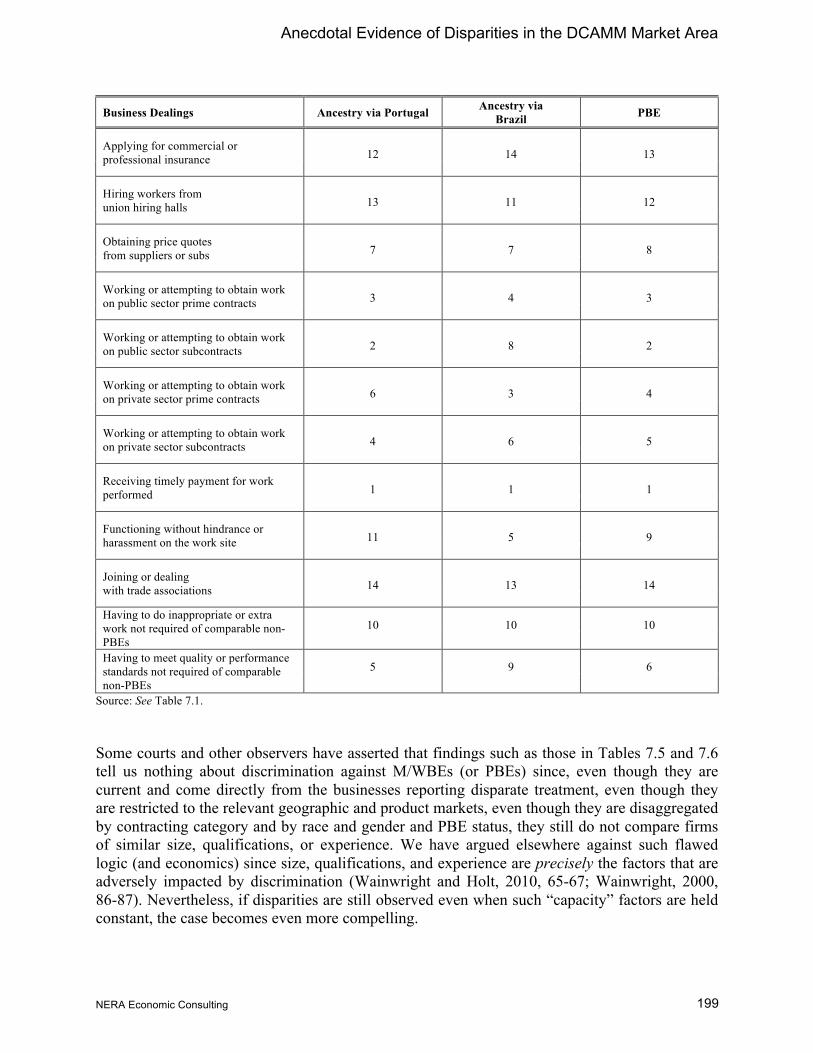
Anecdotal Evidence of Disparities in the DCAMM Market Area
NERA Economic Consulting
199
Business Dealings Ancestry via Portugal Ancestry via Brazil PBE
Applying for commercial or professional insurance 12 14 13
Hiring workers from union hiring halls 13 11 12
Obtaining price quotes from suppliers or subs 7 7 8
Working or attempting to obtain work on public sector prime contracts 3 4 3
Working or attempting to obtain work on public sector subcontracts 2 8 2
Working or attempting to obtain work on private sector prime contracts 6 3 4
Working or attempting to obtain work on private sector subcontracts 4 6 5
Receiving timely payment for work performed 1 1 1
Functioning without hindrance or harassment on the work site 11 5 9
Joining or dealing with trade associations 14 13 14
Having to do inappropriate or extra work not required of comparable non-PBEs
10 10 10
Having to meet quality or performance standards not required of comparable non-PBEs
5 9 6
Source: See Table 7.1.
Some courts and other observers have asserted that findings such as those in Tables 7.5 and 7.6 tell us nothing about discrimination against M/WBEs (or PBEs) since, even though they are current and come directly from the businesses reporting disparate treatment, even though they are restricted to the relevant geographic and product markets, even though they are disaggregated by contracting category and by race and gender and PBE status, they still do not compare firms of similar size, qualifications, or experience. We have argued elsewhere against such flawed logic (and economics) since size, qualifications, and experience are precisely the factors that are adversely impacted by discrimination (Wainwright and Holt, 2010, 65-67; Wainwright, 2000, 86-87). Nevertheless, if disparities are still observed even when such “capacity” factors are held constant, the case becomes even more compelling.

Anecdotal Evidence of Disparities in the DCAMM Market Area
NERA Economic Consulting
200
The results reported next in Table 7.9 show that even when levels of size, qualifications, and experience are held constant across firms, measures of disparate treatment of M/WBEs are still large, adverse, and statistically significant.
In Table 7.9, we report the results from a series of Probit regressions using the mail survey data on disparate treatment.167 As indicated earlier, the survey questionnaire collected data related to each firm’s size, qualifications, and experience. The reported estimates from these models can be interpreted as changes or differences in the probability of disparate treatment conditional on these control variables. The estimates in the table show large differences in disparate treatment probabilities between M/WBEs and non-M/WBEs. In column (1) of Table 7.9 (in which the regression model contains only M/WBE status and contracting category indicators), the estimated coefficient of 0.15 on the M/WBE variable indicates that the likelihood of experiencing disparate treatment for M/WBE firms is 15.0 percentage points higher than that for non-M/WBE firms.168 This difference is statistically significant. Column (2) includes additional explanatory variables to hold constant differences in the characteristics of firms that may vary by race or gender, including the owner’s education, the age of the firm, and the size of the firm measured by employment and by sales. Even after controlling for these differences, however, M/WBE firms remain 15.0 percentage points more likely than non-M/WBE firms to experience disparate treatment. Firm size and other “capacity”-type characteristics appear to account for none of the disparate treatment reported by M/WBEs in DCAMM’s market area.
The exercise is repeated in columns (3) and (4). The only difference in these columns from the earlier regressions is that the M/WBE variable is now separated into two components—one for minority-owned firms and one for nonminority-female owned firms. The results in column (3) indicate that minority-owned firms in DCAMM’s market area are 18.1 percentage points more likely to experience disparate treatment than non-M/WBE firms. When controls are added in column (4), this difference falls only slightly to 17.2 percentage points, indicating that controlling for other “capacity”-type factors makes only a small difference in the incidence of disparate treatment. The differences for nonminority female-owned firms are similar, showing a 14.5 percentage point difference with only the industry controls and slightly larger 14.9 percentage point difference when the full set of capacity-type controls is added. All of these differences are statistically significant.
The exercise is repeated a final time in columns (5) and (6) with separate indicators for each type of M/WBE. The results for nonminority females are nearly identical to those in columns (3) and (4). For African American-owned firms, the differential is 49.6 percentage points in column (5), increasing slightly to 52.1 percentage points after the full set of controls is added. These differences are statistically significant. For Hispanic-owned firms, the differential is 15.8 percentage points in column (5), increasing slightly to 17.3 percentage points after the full set of controls is added. These differences are statistically significant as well. The results for
167 See Chapter IV for a description of Probit regression. 168 This estimate largely replicates the raw difference in disparate treatment rates between M/WBE and non-
M/WBE firms reported in the last row of Table 7.5. The raw differential observed there (38.2% – 21.6% = 16.6%) differs slightly from the 15.0% differential reported here since the regression specification also controls for industry category.

Anecdotal Evidence of Disparities in the DCAMM Market Area
NERA Economic Consulting
201
Asian/Pacific Islander-owned firms, Native American-owned firms, and Cape Verdean-owned firms were not statistically significant.
Table 7.9. Prevalence of Disparate Treatment Facing M/WBEs
(1) (2) (3) (4) (5) (6) M/WBE 0.150 0.150 (4.97) (4.57) Minority 0.181 0.172 (3.98) (3.52) Nonminority Female 0.145 0.149 0.143 0.147 (4.11) (3.96) (4.07) (3.91) African American 0.496 0.521 (5.13) (5.04) Hispanic 0.158 0.173 (2.38) (2.43) Asian/Pacific Islander 0.010 -0.001 (0.13) (0.01) Native American 0.000 0.000 (0.00) (0.00) Cape Verdean 0.140 -0.132 (0.83) (0.76) Owner’s Education (3 indicator variables) No Yes No Yes No Yes
Firm Age (4 indicators) No Yes No Yes No Yes Employment size bracket (6 indicators) No Yes No Yes No Yes
Sales/revenue size bracket (4 indicators) No Yes No Yes No Yes
Industry category (3 indicators) Yes Yes Yes Yes Yes Yes
N 950.00 916.00 950.00 916.00 950.00 916.00 Pseudo R2 0.04 0.07 0.04 0.07 0.06 0.09 Chi2 45.87 77.14 46.27 77.26 63.43 97.88 Log likelihood (546.85) (514.22) (546.66) (514.15) (538.07) (503.84)
Source: See Table 7.1. Notes: Reported estimates are derivatives from Probit models, t-statistics are in parentheses. A t-statistic of 1.96 (1.64) or larger indicates that the result is significant within a 95 (90) percent confidence interval.
Table 7.10 repeats this exercise for PBEs compared to non-PBEs. The estimates in this table as well show large differences in disparate treatment probabilities between PBEs and non-M/WBE non-PBEs. In column (1) of Table 7.10, the estimated coefficient of 0.218 on the PBE variable indicates that the likelihood of experiencing disparate treatment for PBE firms is 21.8 percentage points higher than that for non-M/WBE non-PBE firms.169 Column (2) includes additional
169 This estimate largely replicates the raw difference in disparate treatment rates between PBE and non-M/WBE
non-PBE firms reported in the last row of Table 7.6. The raw differential observed there (42.3% – 21.6% = 20.7%) differs slightly from the 21.8% differential reported here since the regression specification also controls for industry category.

Anecdotal Evidence of Disparities in the DCAMM Market Area
NERA Economic Consulting
202
explanatory variables to hold constant differences in the characteristics of firms that may vary by race or gender, including the owner’s education, the age of the firm, and the size of the firm measured by employment and by sales. After controlling for these differences, however, PBE firms are 22.7 percentage points more likely than non-M/WBE non-PBE firms to experience disparate treatment. Firm size and other “capacity”-type characteristics appear to account for none of the disparate treatment reported by PBEs in DCAMM’s market area. Both of these differences are statistically significant.
The exercise is repeated in columns (3) and (4) with separate indicators for each type of Portuguese ancestry. For PBEs with ancestry via Portugal, the differential is 17.5 percentage points in column (5), and virtually the same at 17.6 percentage points after the full set of controls is added in column (6). These differences are statistically significant. For PBEs with ancestry via Brazil, the differential is 33.9 percentage points in column (5), increasing to 39.5 percentage points after the full set of controls is added. These differences are statistically significant as well.
Table 7.10. Prevalence of Disparate Treatment Facing PBEs
(1) (2) (3) (4) PBE 0.218 0.227 (4.49) (4.19) Ancestry via Portugal 0.175 0.176 (3.12) (2.90) Ancestry via Brazil 0.339 0.395 (3.84) (3.98) Owner’s Education (3 indicator variables) No Yes No Yes
Firm Age (4 indicators) No Yes No Yes Employment size bracket (6 indicators) No Yes No Yes
Sales/revenue size bracket (4 indicators) No Yes No Yes
Industry category (3 indicators) Yes Yes Yes Yes
N 646.00 623.00 646.00 623.00 Pseudo R2 0.04 0.09 0.04 0.09 Chi2 25.96 61.18 28.21 64.81 Log likelihood (349.74) (321.11) (348.61) (319.30)
Source: See Table 7.1. Notes: Reported estimates are derivatives from Probit models, t-statistics are in parentheses. A t-statistic of 1.96 (1.64) or larger indicates that the result is significant within a 95 (90) percent confidence interval.
The regression models reported in Table 7.9 for M/WBEs and Table 7.10 for PBEs used as their dependent variable an indicator of whether or not a survey respondent reported having been treated less favorably in any of the 14 different types of business dealings described in the first column of Table 7.5 for M/WBEs and Table 7.6 for PBEs. We re-estimated the regression model reported in Column (2) of Table 7.9 for M/WBEs (and Table 7.10 for PBEs) separately using as the dependent variable, in turn, each of the 14 types of business dealings, and we report those results in Table 7.11 for M/WBEs and Table 7.12 for PBEs.

Anecdotal Evidence of Disparities in the DCAMM Market Area
NERA Economic Consulting
203
Table 7.11. Prevalence of Disparate Treatment Facing M/WBEs, by Type of Business Dealing
Business Dealings African American Hispanic
Asian/ Pacific
Islander
Native American
Cape Verdean
Minority Total
Non-minority Female
M/WBE Total
Applying for commercial loans
42.0% 5.5% 0.0% 0.0% 14.1% 11.2% 4.8% 6.0%
(4.37) (1.24) (0.00) (0.00) (1.22) (3.09) (1.89) (2.86)
Applying for surety bonds
36.2% 4.3% 12.5% 0.0% 11.9% 12.8% 1.6% 5.3%
(4.40) (1.27) (1.73) (0.00) (1.47) (3.77) (0.86) (2.87) Applying for commercial insurance
10.3% 7.1% 2.7% 0.0% 0.0% 4.7% -0.6% 1.6% (2.23) (2.29) (0.88) (0.00) (0.00) (2.40) (0.43) (1.21)
Hiring workers from union hiring halls
28.8% 2.6% 0.0% 0.0% 0.0% 7.1% 0.1% 2.5%
(2.83) (0.50) (0.00) (0.00) (0.00) (1.72) (0.05) (1.00) Obtaining price quotes from suppliers
25.2% 5.7% -0.6% 0.0% 12.7% 7.0% 5.0% 5.0% (3.19) (1.41) (0.13) (0.00) (1.11) (2.32) (2.15) (2.62)
Working or attempting to work on public sector prime contracts
37.3% 21.4% -6.8% 7.5% 0.0% 15.4% 0.6% 5.9%
(3.96) (2.95) (0.87) (0.47) (0.00) (3.28) (0.16) (1.88) Working or attempting to work on public sector subcontracts
28.4% 0.5% -7.8% 6.4% 0.0% 3.6% -1.6% 0.4%
(2.97) (0.08) (1.18) (0.40) (0.00) (0.83) (0.46) (0.11) Working or attempting to work on private sector prime contracts
43.8% 14.5% 4.9% 0.0% 0.0% 15.3% 8.7% 9.2%
(4.79) (2.69) (0.76) (0.00) (0.00) (3.97) (3.20) (4.10) Working or attempting to work on private sector subcontracts
36.3% 6.3% 10.4% 20.0% 0.0% 12.8% 5.0% 6.6%
(4.33) (1.35) (1.53) (1.36) (0.00) (3.55) (1.98) (3.09) Receiving timely payment for work performed
41.0% 17.2% 5.2% 0.0% 0.0% 15.6% 11.2% 11.7%
(4.11) (2.50) (0.67) (0.00) (0.00) (3.34) (3.21) (3.91) Functioning without hindrance or harassment on the work site
23.1% 5.7% 0.9% 0.0% 0.0% 6.9% 13.4% 10.1%
(3.02) (0.99) (0.14) (0.00) (0.00) (1.86) (4.78) (4.43) Joining or dealing with construction trade associations
33.9% 6.7% 0.0% 11.7% 0.0% 10.3% 4.2% 5.0%
(4.04) (1.33) (0.00) (1.06) (0.00) (2.93) (1.85) (2.67) Having to do inappropriate or extra work not required of comparable non-M/WBEs
34.2% 10.7% 11.8% 0.0% 0.0% 12.8% 1.2% 4.4%
(4.56) (2.47) (2.10) (0.00) (0.00) (4.14) (0.63) (2.60)
Having to meet quality, inspection, or performance standards not required of comparable non-M/WBEs
33.7% 1.3% -0.1% 0.0% 0.0% 7.5% 6.4% 6.0%
(4.21) (0.28) (0.02) (0.00) (0.00) (2.19) (2.52) (2.82)
In any one of the business dealings listed above
52.1% 17.3% -0.1% 0.6% -13.2% 17.2% 14.9% 15.0%
(5.04) (2.43) (0.01) (0.03) (0.76) (3.52) (3.96) (4.57) Source: See Table 7.1. Notes: Reported estimates are derivatives from Probit models with specification such as in Table 7.5, column (2). The t-statistics are in parentheses. A t-statistic of 1.96 (1.64) or larger indicates that the result is significant within a 95 (90) percent confidence interval. Results with t-statistics of 1.96 or higher are boldfaced. Results with t-statistics of 1.64 or higher are boldfaced italicized.

Anecdotal Evidence of Disparities in the DCAMM Market Area
NERA Economic Consulting
204
As Table 7.11 shows, minority-owned firms experience a wide variety of disparate treatment compared to non-M/WBEs. In 13 of 14 categories, the differences for these firms are both large and statistically significant. For nonminority female-owned firms, large and statistically significant levels of disparate treatment are observed in 8 of 14 categories.
Table 7.12. Prevalence of Disparate Treatment Facing PBEs, by Type of Business Dealing
Business Dealings Ancestry via Portugal Ancestry via Brazil PBE Total
Applying for commercial loans 3.1% 16.8% 5.4%
(1.42) (2.94) (2.59)
Applying for surety bonds 0.2% 0.0% 0.2%
(2.60) (0.41) (2.36)
Applying for commercial insurance 2.9% -1.7% 1.6% (1.39) (0.80) (0.84)
Hiring workers from union hiring halls 1.4% 58.0% 4.9%
(1.06) (2.31) (1.75)
Obtaining price quotes from suppliers 9.7% 8.7% 8.9% (2.92) (1.69) (3.07)
Working or attempting to work on public sector prime contracts
6.5% 15.5% 7.8% (1.24) (1.46) (1.57)
Working or attempting to work on public sector subcontracts
11.0% 11.9% 10.9%
(1.90) (1.03) (2.00)
Working or attempting to work on private sector prime contracts
8.5% 14.8% 9.3%
(2.42) (2.37) (2.95)
Working or attempting to work on private sector subcontracts
12.6% 12.9% 11.8%
(3.10) (1.91) (3.27)
Receiving timely payment for work performed 12.8% 22.4% 14.5%
(2.35) (2.36) (2.93)
Functioning without hindrance or harassment on the work site
5.5% 13.9% 7.0%
(1.47) (1.97) (2.05)
Joining or dealing with construction trade associations
1.2% 3.0% 1.5%
(0.50) (0.62) (0.66)
Having to do inappropriate or extra work not required of comparable non-M/WBEs
3.3% 5.5% 3.6%
(1.33) (1.25) (1.59) Having to meet quality, inspection, or performance standards not required of comparable non-M/WBEs
11.3% 10.5% 10.5%
(3.21) (1.67) (3.32)
In any one of the business dealings listed above 17.6% 39.5% 22.7%
(2.90) (3.98) (4.19) Source: See Table 7.1. Notes: Reported estimates are derivatives from Probit models with specification such as in Table 7.5, column (2). The t-statistics are in parentheses. A t-statistic of 1.96 (1.64) or larger indicates that the result is significant within a 95 (90) percent confidence interval. Results with t-statistics of 1.96 or higher are boldfaced. Results with t-statistics of 1.64 or higher are boldfaced italicized.
Anecdotal Evidence of Disparities in the DCAMM Market Area
NERA Economic Consulting
205
Similarly, Table 7.12 shows that Portuguese-owned firms also experience a wide variety of disparate treatment compared to non-PBEs. In 10 of 14 categories, the differences for PBE firms are both large and statistically significant.
4. Impact of Current Business Environment on Ability to Win Contracts
The survey also asked questions about some common features of the business environment to determine if certain factors were perceived by M/WBEs as more serious impediments to obtaining contracts than for their non-M/WBE counterparts.
As Table 7.13 indicates, substantial percentages of both M/WBEs and non-M/WBEs report that certain factors, such as large project sizes, late Notice of bid/proposal deadlines, bonding requirements, obtaining working capital, the cost of bidding or proposing, the price of supplies or materials, previous experience requirements, and insurance requirements, make it harder or impossible for their firms to obtain contracts. Among non-M/WBEs, for example, 36 percent reported that large project sizes made it harder or impossible for them to win contracts, 29 percent reported that bonding requirements had this effect, 26 percent reported that obtaining working capital had this effect, 28 percent reported that the cost of bidding or proposing had this effect, and 12 percent reported that previous experience requirements had this effect. The figures for M/WBEs in these five categories, however, at 53 percent, 44 percent, 36 percent, 34 percent, and 23 percent, respectively, are substantially and statistically significantly higher than those for non-M/WBEs. Indeed, as Table 7.13 shows, M/WBEs reported more difficulty than non-M/WBEs in eight of the nine factors about which they were polled. In general, the rates at which M/WBEs reported difficulty with these factors were 1.1 to 1.8 times higher than the rates reported by non-M/WBEs.

Anecdotal Evidence of Disparities in the DCAMM Market Area
NERA Economic Consulting
206
Table 7.13. Firms Indicating that Specific Factors in the Business Environment Make It Harder or Impossible to Obtain Contracts, M/WBE
Business Environment
African American Hispanic
Asian/ Pacific
Islander
Native American
Cape Verdean
Minority Total
Non-minority Female
M/WBE Total
Non-M/WBEs
Bonding Requirements
68.2% 48.7% 41.7% 75.0% 100.0% 66.2% 35.5% 43.6% 28.9%
(22) (39) (12) (4) (3) (68) (124) (204) (308)
Insurance Requirements
32.0% 27.3% 36.7% 0.0% 0.0% 41.9% 16.3% 20.7% 15.2%
(25) (44) (30) (4) (3) (74) (208) (314) (461) Previous Experience Requirements
28.0% 31.0% 31.0% 0.0% 25.0% 42.3% 19.7% 22.6% 12.3%
(25) (42) (29) (4) (4) (71) (228) (332) (462) Cost of Bidding or Proposing
50.0% 36.8% 42.9% 0.0% 33.3% 58.5% 30.8% 33.8% 27.6%
(22) (38) (28) (4) (3) (65) (201) (296) (421)
Large Project Sizes
68.0% 51.2% 48.1% 66.7% 100.0% 82.4% 50.5% 52.5% 35.7%
(25) (41) (27) (3) (3) (68) (198) (297) (381) Price of Supplies or Materials
45.8% 26.3% 15.0% 0.0% 0.0% 35.8% 29.6% 28.9% 26.4%
(24) (38) (20) (3) (3) (67) (189) (277) (416) Obtaining Working Capital
58.3% 51.3% 33.3% 50.0% 66.7% 65.7% 29.1% 36.2% 26.3%
(24) (39) (18) (4) (3) (67) (172) (260) (373) Late Notice of Bid/Proposal Deadlines
43.5% 51.4% 33.3% 25.0% 66.7% 60.6% 47.1% 46.0% 46.5%
(23) (37) (24) (4) (3) (66) (174) (265) (355)
Prior Dealings with Owner
20.8% 15.8% 7.4% 25.0% 50.0% 25.8% 10.0% 12.1% 8.6%
(24) (38) (27) (4) (4) (62) (209) (306) (429) Source: See Table 7.1. Notes: Total number of valid responses in parentheses. Figures in boldface type are adverse and statistically significantly different from non-M/WBEs using a conventional two-tailed Fisher’s Exact Test and within a 95% or better confidence interval. Figures in boldface italicized type are adverse and significant within a 90% confidence interval.
Comparable results for PBEs are shown in Table 7.14. Among non-M/WBE non-PBEs, for example, 36 percent reported that large project sizes made it harder or impossible for them to win contracts, 29 percent reported that bonding requirements had this effect, 12 percent reported that previous experience requirements had this effect, and 9 percent reported that prior dealings with project owners (public or private) had this effect. The figures for PBEs in these four categories, however, at 47 percent, 47 percent, 20 percent, and 17 percent, respectively, are substantially and statistically significantly higher than those for non-PBEs. In fact, Table 7.14 shows that PBEs reported more difficulty than non-M/WBE non-PBEs in seven of the nine factors about which they were polled. In general, the rates at which PBEs reported difficulty with these factors were 1.1 to 2.0 times higher than the rates reported by non-M/WBE non-PBEs.

Anecdotal Evidence of Disparities in the DCAMM Market Area
NERA Economic Consulting
207
Table 7.14. Firms Indicating that Specific Factors in the Business Environment Make It Harder or Impossible to Obtain Contracts, PBE
Business Environment Ancestry via Portugal
Ancestry via Brazil PBE Non-PBE
Bonding Requirements 45.5% 50.0% 46.7% 28.9%
(44) (16) (60) (308)
Insurance Requirements 21.0% 22.7% 21.4% 15.2%
(62) (22) (84) (461)
Previous Experience Requirements
19.0% 27.8% 19.8% 12.3%
(63) (18) (81) (462)
Cost of Bidding or Proposing
28.6% 33.3% 29.7% 27.6%
(56) (18) (74) (421)
Large Project Sizes 48.1% 42.1% 46.6% 35.7%
(54) (19) (73) (381)
Price of Supplies or Materials
27.8% 16.7% 25.0% 26.4%
(54) (18) (72) (416)
Obtaining Working Capital 28.8% 26.3% 28.2% 26.3%
(52) (19) (71) (373)
Late Notice of Bid/Proposal Deadlines
49.1% 11.8% 40.0% 46.5%
(53) (17) (70) (355)
Prior Dealings with Owner 20.7% 5.6% 17.1% 8.6%
(58) (18) (76) (429) Source: See Table 7.1. Notes: Total number of valid responses in parentheses. Figures in boldface type are adverse and statistically significantly different from non-M/WBEs using a conventional two-tailed Fisher’s Exact Test and within a 95% or better confidence interval. Figures in boldface italicized type are adverse and significant within a 90% confidence interval.
To control for firm and owner characteristics, we used a regression technique known as ordered Probit.170 Ordered Probit regression is used when the dependent variable is discrete and ordinal (and hence can be ranked). We use ordered Probit to model the ordinal ranking—(1) “helps me,” (2) “has no effect,” (3) “makes it harder,” or (4) “makes it impossible”—of the aspect of procurement under consideration. The firm characteristics used as control variables consist of the age of the firm, the number of employees, the size of revenues, the education level of the primary owner of the firm and the major industry group. To report results from ordered Probit analysis, we use a “+” to indicate that M/WBEs (or PBEs) had more difficulty than non-M/WBEs (or non-PBEs) with similar firm characteristics, and a “−“ to indicate that M/WBEs (or PBEs) had less difficulty than non-M/WBEs (or non-PBEs) with similar firm characteristics.
170 For a textbook discussion of ordered Probit, see, e.g., Greene (1997).

Anecdotal Evidence of Disparities in the DCAMM Market Area
NERA Economic Consulting
208
Table 7.15 reports the sign and statistical significance from the ordered Probit analysis. We find that when observable firm characteristics are controlled for, eight of the nine factors we inquired about prove to be greater difficulties for M/WBEs than for non-M/WBEs (as indicated by the “+” sign), even when “capacity”-type factors such as employment size, revenue size, years in business, and owner education are held constant. The disparities observed regarding bonding requirements, previous experience requirements, large project sizes, and prior dealings with project owners (public or private), in particular, are also statistically significant.
Table 7.15. Firms Indicating that Specific Factors in the Business Environment Make It Harder or Impossible for M/WBEs to Obtain Contracts, Regression Results
Business Environment M/WBEs
Bonding Requirements +†
Insurance Requirements +
Previous Experience Requirements +†
Cost of Bidding or Proposing +
Large Project Sizes +*
Price of Supplies or Materials +
Obtaining Working Capital +
Late Notice of Bid/Proposal Deadlines –
Prior Dealings with Owner +† Source: See Table 7.1. Notes: A plus (+) indicates that a group is more likely than non-M/WBEs to report difficulty with business environment factors. A minus (–) indicates that a group is less likely than non-M/WBEs to experience difficulty. An asterisk (*) indicates that the disparity is statistically significant within a 95% or better confidence interval. A dagger (†) indicates that the disparity is statistically significant within a 90% or better confidence interval.
Table 7.16 reports comparable results for PBEs. We find that when observable firm characteristics are controlled for, six of the nine factors we inquired about prove to be greater difficulties for PBEs than for non-PBEs, even when “capacity”-type factors are held constant. The disparities observed regarding bonding requirements and previous experience requirements are also statistically significant.
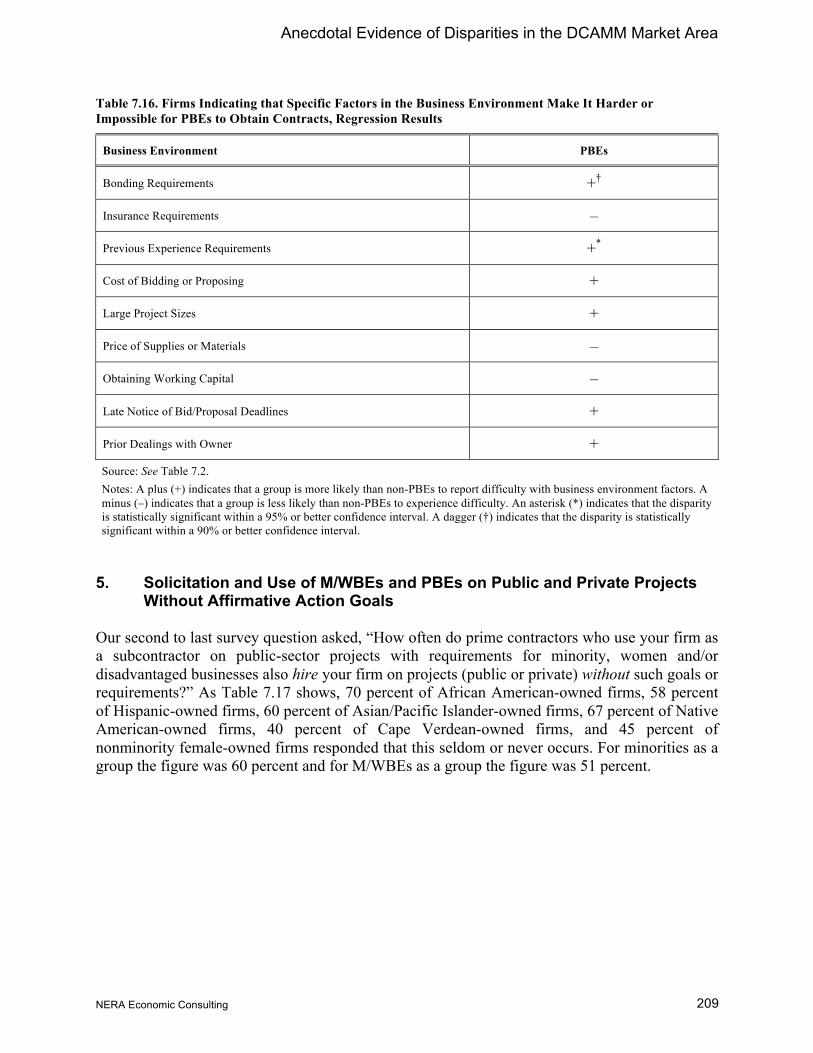
Anecdotal Evidence of Disparities in the DCAMM Market Area
NERA Economic Consulting
209
Table 7.16. Firms Indicating that Specific Factors in the Business Environment Make It Harder or Impossible for PBEs to Obtain Contracts, Regression Results
Business Environment PBEs
Bonding Requirements +†
Insurance Requirements –
Previous Experience Requirements +*
Cost of Bidding or Proposing +
Large Project Sizes +
Price of Supplies or Materials –
Obtaining Working Capital –
Late Notice of Bid/Proposal Deadlines +
Prior Dealings with Owner + Source: See Table 7.2. Notes: A plus (+) indicates that a group is more likely than non-PBEs to report difficulty with business environment factors. A minus (–) indicates that a group is less likely than non-PBEs to experience difficulty. An asterisk (*) indicates that the disparity is statistically significant within a 95% or better confidence interval. A dagger (†) indicates that the disparity is statistically significant within a 90% or better confidence interval.
5. Solicitation and Use of M/WBEs and PBEs on Public and Private Projects Without Affirmative Action Goals
Our second to last survey question asked, “How often do prime contractors who use your firm as a subcontractor on public-sector projects with requirements for minority, women and/or disadvantaged businesses also hire your firm on projects (public or private) without such goals or requirements?” As Table 7.17 shows, 70 percent of African American-owned firms, 58 percent of Hispanic-owned firms, 60 percent of Asian/Pacific Islander-owned firms, 67 percent of Native American-owned firms, 40 percent of Cape Verdean-owned firms, and 45 percent of nonminority female-owned firms responded that this seldom or never occurs. For minorities as a group the figure was 60 percent and for M/WBEs as a group the figure was 51 percent.
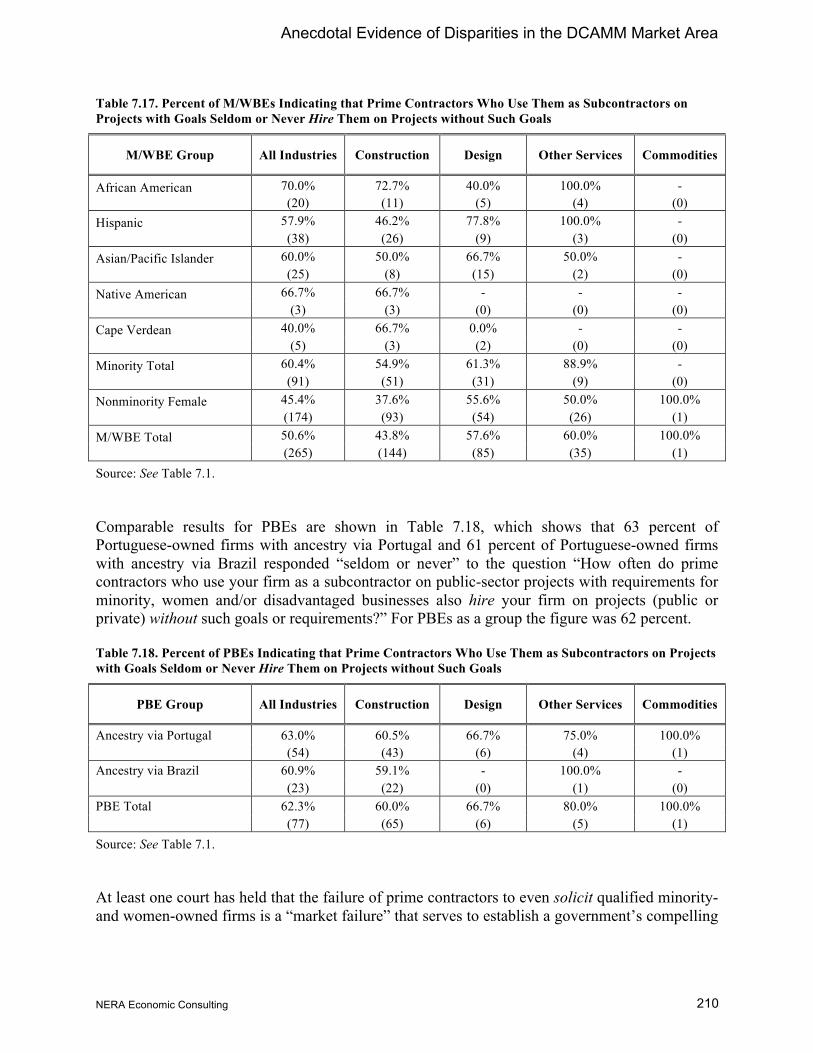
Anecdotal Evidence of Disparities in the DCAMM Market Area
NERA Economic Consulting
210
Table 7.17. Percent of M/WBEs Indicating that Prime Contractors Who Use Them as Subcontractors on Projects with Goals Seldom or Never Hire Them on Projects without Such Goals
M/WBE Group All Industries Construction Design Other Services Commodities
African American 70.0% 72.7% 40.0% 100.0% - (20) (11) (5) (4) (0) Hispanic 57.9% 46.2% 77.8% 100.0% - (38) (26) (9) (3) (0) Asian/Pacific Islander 60.0% 50.0% 66.7% 50.0% - (25) (8) (15) (2) (0) Native American 66.7% 66.7% - - - (3) (3) (0) (0) (0) Cape Verdean 40.0% 66.7% 0.0% - - (5) (3) (2) (0) (0) Minority Total 60.4% 54.9% 61.3% 88.9% - (91) (51) (31) (9) (0) Nonminority Female 45.4% 37.6% 55.6% 50.0% 100.0% (174) (93) (54) (26) (1) M/WBE Total 50.6% 43.8% 57.6% 60.0% 100.0% (265) (144) (85) (35) (1) Source: See Table 7.1.
Comparable results for PBEs are shown in Table 7.18, which shows that 63 percent of Portuguese-owned firms with ancestry via Portugal and 61 percent of Portuguese-owned firms with ancestry via Brazil responded “seldom or never” to the question “How often do prime contractors who use your firm as a subcontractor on public-sector projects with requirements for minority, women and/or disadvantaged businesses also hire your firm on projects (public or private) without such goals or requirements?” For PBEs as a group the figure was 62 percent.
Table 7.18. Percent of PBEs Indicating that Prime Contractors Who Use Them as Subcontractors on Projects with Goals Seldom or Never Hire Them on Projects without Such Goals
PBE Group All Industries Construction Design Other Services Commodities
Ancestry via Portugal 63.0% 60.5% 66.7% 75.0% 100.0% (54) (43) (6) (4) (1) Ancestry via Brazil 60.9% 59.1% - 100.0% - (23) (22) (0) (1) (0) PBE Total 62.3% 60.0% 66.7% 80.0% 100.0% (77) (65) (6) (5) (1) Source: See Table 7.1.
At least one court has held that the failure of prime contractors to even solicit qualified minority- and women-owned firms is a “market failure” that serves to establish a government’s compelling

Anecdotal Evidence of Disparities in the DCAMM Market Area
NERA Economic Consulting
211
interest in remedying that failure.171 Among the evidence relied upon for this holding was a NERA survey similar to the current one in which approximately 50 percent of the respondents reported that they were seldom or never solicited for non-goals work.172
Our final survey question therefore asked “How often do prime contractors who use your firm as a subcontractor on public-sector projects with requirements for minority, women and/or disadvantaged businesses solicit your firm on projects (public or private) without such goals or requirements?” Responses to this question are tabulated in Table 7.19, which shows a similar pattern as in Table 7.17. In Table 7.19, 61 percent of African American-owned firms, 48 percent of Hispanic-owned firms, 54 percent of Asian/Pacific Islander-owned firms, 67 percent of Native American-owned firms, 40 percent of Cape Verdean-owned firms, and 55 percent of nonminority female-owned firms responded that this seldom or never occurs. For minorities as a group the figure was 53 percent and for M/WBEs as a group the figure was 54 percent. Similar results were observed in each major contracting category as well.
Table 7.19. Percent of M/WBEs Indicating that Prime Contractors Who Use Them as Subcontractors on Projects with Goals Seldom or Never Solicit Them on Projects without Such Goals
M/WBE Group All Industries Construction Design Other Services Commodities
African American 60.9% 64.3% 60.0% 50.0% - (23) (14) (5) (4) (0) Hispanic 47.5% 39.3% 62.5% 75.0% - (40) (28) (8) (4) (0) Asian/Pacific Islander 54.2% 50.0% 53.3% 100.0% - (24) (8) (15) (1) (0) Native American 66.7% 66.7% - - - (3) (3) (0) (0) (0) Cape Verdean 40.0% 33.3% 50.0% - - (5) (3) (2) (0) (0) Minority Total 52.6% 48.2% 56.7% 66.7% 66.7% (95) (56) (30) (9) (9) Nonminority Female 54.9% 49.0% 56.1% 69.2% 69.2% (182) (96) (57) (26) (26) M/WBE Total 54.2% 48.7% 56.3% 68.6% 68.6% (277) (152) (87) (35) (35) Source: See Table 7.1.
Comparable results for PBEs appear in Table 7.20, where 67 percent of Portuguese-owned firms with ancestry via Portugal and 46 percent of Portuguese-owned firms with ancestry via Brazil responded “seldom or never” to the question “How often do prime contractors who use your firm as a subcontractor on public-sector projects with requirements for minority, women and/or
171 Builders Association of Greater Chicago v. City of Chicago, 298 F.Supp.2d 725, 737 (N.D. Ill. 2003). 172 Id.

Anecdotal Evidence of Disparities in the DCAMM Market Area
NERA Economic Consulting
212
disadvantaged businesses solicit your firm on projects (public or private) without such goals or requirements?” For PBEs as a group the figure was 61 percent.
Table 7.20. Percent of PBEs Indicating that Prime Contractors Who Use Them as Subcontractors on Projects with Goals Seldom or Never Solicit Them on Projects without Such Goals
PBE Group All Industries Construction Design Other Services Commodities
Ancestry via Portugal 67.2% 66.0% 66.7% 75.0% 100.0% (58) (47) (6) (4) (1) Ancestry via Brazil 45.5% 42.9% - 100.0% - (22) (21) (0) (1) (0) PBE Total 61.3% 58.8% 66.7% 80.0% 100.0% (80) (68) (6) (5) (1) Source: See Table 7.1.

Anecdotal Evidence of Disparities in the DCAMM Market Area
NERA Economic Consulting
213
6. Impact of Survey Non-Response
Since the mail survey was voluntary, it is important to account for the fact that many of those who received it did not respond. As a check on the usefulness of the information obtained from our mail survey respondents, we attempted to survey by telephone 5,750 randomly selected M/WBEs, PBEs, and non-M/WBEs/non-PBEs (hereafter “non-M/WBEs” for the balance of this section) that did not respond to our mail survey. The purpose of this “non-response” survey was to test whether their answers to key survey questions were different from the answers of respondents in ways that would significantly alter the findings and conclusions reached above in this Chapter.
We obtained complete responses from 1,253 firms, for a raw response rate of 22 percent. After removing records where the firm was no longer in business, and the telephone number was disconnected or the listing was otherwise unreachable, the effective response rate increased to 34 percent. For the non-respondent survey, we selected three questions from the mail survey to pose to non-respondents. The first question asked whether large project sizes helped or harmed the firm’s ability to obtain public or private sector contracts. The second question asked whether and how frequently the firm had experienced discrimination in attempting to apply for commercial loans. The final question asked whether and how frequently the firm had experienced discrimination in working or attempting to work on private sector prime contracts.
Not surprisingly, one difference that we observed between respondents and non-respondents was a greater general interest in the questions being asked. Among survey respondents, only 23.4 percent indicated that the question about large project sizes was “not applicable.” Among non-respondents, the figure was 36.8 percent. Among survey respondents, 58.4 percent indicated that discrimination in applying for commercial loans never occurred, compared to 91.8 percent among non-respondents. Among survey respondents, 62.7 percent indicated that discrimination in working or attempting to work on private sector prime contracts never occurred, compared to 95.9 percent among non-respondents. This phenomenon was apparent regardless of whether the firm was M/WBE, PBE or non-M/WBE.
Among those firms to which the question was applicable, 13.1 percent of minority-owned firms that did not respond to the mail survey indicated that large project sizes made it harder or impossible for them to obtain contract awards. Among those that did respond to the survey, the figure was 52.6 percent. This difference is statistically significant. Among female-owned firms that did not respond to the mail survey, 6.1 percent indicated that large project sizes made it harder or impossible for them to obtain contract awards. Among those that did respond to the survey, the figure was 48.6 percent.173 Among Portuguese-owned firms that did not respond to the mail survey, 4.1 percent indicated that large project sizes made it harder or impossible for them to obtain contract awards. Among those that did respond to the survey, the figure was 46.6 percent. This difference is statistically significant. Among nonminority male-owned firms that did not respond to the mail survey, 3.9 percent indicated that large project sizes made it harder or
173 The percentages reported in this section may differ slightly from comparable figures reported elsewhere in
Chapter VII, since minorities of unknown race or ethnicity were excluded from the tallies in the mail survey.

Anecdotal Evidence of Disparities in the DCAMM Market Area
NERA Economic Consulting
214
impossible for them to obtain contract awards. Among those that did respond to the survey, the figure was 37.6 percent. This difference is also statistically significant.
These results demonstrate two key findings. First, reports that large project sizes make it harder or impossible for firms to obtain contracts are greater among mail survey respondents than among non-respondents, regardless of M/WBE or PBE status. Second, more M/WBEs and PBEs than non-M/WBEs report that large project sizes make it harder or impossible for them to obtain contracts, regardless of whether they responded to the mail survey or not. Moreover, the ratio of M/WBEs to non-M/WBEs reporting difficulty in this regard is actually greater among non-respondents than among respondents, implying that the estimate of adverse disparity for M/WBE firms with regard to large project sizes that was reported from the mail survey (See Tables 7.13 and 7.15) may be somewhat understated relative to the universe of firms as a whole. For PBEs, the ratios were similar among respondents and non-respondents, indicating that the estimate of adverse disparity for PBE firms with regard to large project sizes that was reported from the mail survey is representative of the universe of firms as a whole.
Among those firms to which the question was applicable, 2.4 percent of minority-owned firms that did not respond to the mail survey indicated that they had experienced one or more instances of discrimination during the previous five years in applying for commercial loans. Among those that did respond to the survey, the figure was 12.9 percent. This difference is statistically significant. For female-owned firms, 3.3 percent of those that did not respond to the mail survey indicated that they had experienced one or more instances of discrimination during the previous five years in applying for commercial loans. Among those that did respond to the survey, the figure was 6.5 percent. This difference is not statistically significant. Among Portuguese-owned firms that did not respond to the mail survey, 2.6 percent indicated that large project sizes made it harder or impossible for them to obtain contract awards. Among those that did respond to the survey, the figure was 16.2 percent. This difference is statistically significant. Among nonminority male-owned firms that did not respond to the mail survey, 1.9 percent indicated that they had experienced one or more instances of discrimination during the previous five years in applying for commercial loans. Among those that did respond to the survey, the figure was 5.0 percent. This difference is statistically significant.
We see from these results, once again, that more M/WBEs and PBEs than non-M/WBEs report experiencing discrimination in applying for commercial loans during the previous five years, regardless of whether they responded to the mail survey or not. On this question, the ratio of M/WBEs to non-M/WBEs reporting credit discrimination is similar among respondents and non-respondents, indicating that the estimate of adverse disparity for M/WBE firms with regard to discrimination in applying for commercial loans reported from the mail survey (See Tables 7.5 and 7.9) is representative of the universe of firms as a whole. The ratio of PBEs to non-PBEs reporting credit discrimination is higher among respondents than non-respondents, indicating that the estimate of adverse disparity for PBE firms with regard to discrimination in applying for commercial loans reported from the mail survey (See Tables 7.6 and 7.10) may be somewhat overstated compared to the universe of firms as a whole.
Among those firms to which the question was applicable, 1.2 percent of minority-owned firms that did not respond to the mail survey indicated that they had experienced one or more instances of discrimination during the previous five years in working or attempting to work on private

Anecdotal Evidence of Disparities in the DCAMM Market Area
NERA Economic Consulting
215
sector prime contracts. Among those that did respond to the survey, the figure was 19.3 percent. For female-owned firms, 4.9 percent of those that did not respond to the mail survey indicated that they had experienced one or more instances of discrimination during the previous five years in working or attempting to work on private sector prime contracts. Among those that did respond to the survey, the figure was 14.2 percent. Both of these differences are statistically significant. Among Portuguese-owned firms that did not respond to the mail survey, 2.6 percent indicated that working or attempting to work on private sector prime contracts made it harder or impossible for them to obtain contract awards. Among those that did respond to the survey, the figure was 18.2 percent. This difference is statistically significant. Among nonminority male-owned firms that did not respond to the mail survey, 1.7 percent indicated that they had experienced one or more instances of discrimination during the previous five years in working or attempting to work on private sector prime contracts. Among those that did respond to the survey, the figure was 8.0 percent. This difference is also statistically significant.
Yet again, these results show that more M/WBEs and PBEs than non-M/WBEs report experiencing discrimination in working or attempting to work on private sector prime contracts during the previous five years. They also show that reports of discrimination are greater among mail survey respondents than among non-respondents, regardless of M/WBE or PBE status. For this question, the ratio of M/WBEs to non-M/WBEs reporting this type of discrimination is somewhat larger among non-respondents than respondents, indicating that the estimate of adverse disparity for M/WBE firms with regard to discrimination in working or attempting to work on private sector prime contracts shown above (See Tables 7.5 and 7.9) may be somewhat understated compared to the universe of firms as a whole. The reverse is true for PBEs, indicating that the estimate of adverse disparity for PBE firms with regard to discrimination in working or attempting to work on private sector prime contracts shown above (See Tables 7.6 and 7.10) may be somewhat overstated compared to the universe of firms as a whole.
In conclusion, the results of our non-respondent survey indicate that M/WBEs, PBEs and non-M/WBEs are more likely to have responded to the mail survey if they had experienced the difficulties identified in the mail survey and also that M/WBEs and PBEs generally reported greater difficulties than non-M/WBEs whether or not they responded to the mail survey. For all three of the questions we examined, this means the actual disparities facing M/WBEs in the Massachusetts market area are not dissimilar to those that we estimated based on our mail survey results. For all three questions examined, the basic qualitative finding of more problems and greater disparities being observed among M/WBEs and PBEs than among non-M/WBEs is unchanged.
C. Business Owner Interviews
To explore additional anecdotal evidence of possible discrimination against M/WBEs and PBEs in the DCAMM market area, we conducted 26 focus group sessions with M/WBEs and PBEs as well as non-MWBEs and non-PBEs in professional services including, construction, design, and related industries. We also conducted interviews with DCAMM staff responsible for construction contracting, design contracting, and M/WBE and PBE compliance. The focus group sessions were held throughout the Commonwealth. Specifically, in Boston, Worcester, New Bedford, Springfield and Lowell. Combined, we met with more than 120 business owners or

Anecdotal Evidence of Disparities in the DCAMM Market Area
NERA Economic Consulting
216
representatives, and received written comments as well, from a cross section of the industries from which DCAMM procures Construction and Design goods and services. Firms ranged in size from large national businesses to much smaller and newer firms in construction, design, and related industries. Owners’ backgrounds included individuals with decades of experience in their fields as well as entrepreneurs at the start of their business careers. We sought to explore their experiences in seeking and performing public and private sector contracting opportunities, with DCAMM and on DCAMM-related projects in Massachusetts, and with DCAMM contracting policies and practices.
This effort gathered individual perspectives to augment the statistical information in the study, including that from the business experience surveys. In general, interviewees’ individual experiences echoed the responses to the business experience surveys. We also elicited feedback, both positive and negative, on DCAMM’s contracting policies and practices, along with corresponding recommendations for improvements. These are reported below in Chapter VIII.
The following are summaries of the issues discussed. Quotations are indented, and are intended to represent the views expressed by several participants.
1. Perceptions of Competence and Qualifications and Higher Performance Standards
Despite significant progress providing opportunities for minorities and women in the Commonwealth of Massachusetts’ public and private sector contracting activities, there is the recognition among M/WBE, PBE,174 and non-MWBE firms that many barriers persist in DCAMM’s contracting activities. Although not quantifiable, one consistent theme in the focus group interviews was the continuing influence of subtle and sometimes not so subtle negative perceptions and stereotypes about M/WBE and PBE firms among contractors, consultants and DCAMM staff. These stereotypes of a lack of competence touch all aspects of the contracting process and M/WBEs’ and PBEs’ attempts to obtain contracts and to be treated equally in performing contract work. Minorities and women spoke candidly about their struggles with negative perceptions and attitudes of their capabilities in the business world.
[T]he first day of the meeting, literally, I went in there to sit and just everybody just sat at the other side of the table and say, “Oh, he’s MBE” And they thought we’re not capable.
***
And I'm not saying to be—actually, sometimes, I'm afraid, I don’t even want to say that I am a minority, because if you say you’re minority, it may marginalize you. You understand?
***
174 During our group interviews, PBEs frequently referred to themselves as “minorities” or “MBE” businesses, in
the same manner as the other racial or ethnic groups we interviewed.

Anecdotal Evidence of Disparities in the DCAMM Market Area
NERA Economic Consulting
217
When we first went on our very first bigger job, the GC used terms like, “We thought you guys would not make it based upon previous…history with MBEs”.
***
But I know that in architecture it’s a challenge because…I showed my resume, I showed my portfolio…I worked on projects that people are familiar with, but their attitude was, “Well, you were with that firm.”…But for some strange reason they just can’t believe that you did that….
***
The superintendent on the project said, “You people – when you people are on [the job], you know, you don’t perform.”
***
I don’t think that bias has disappeared. I think the subtle signs of people’s perceptions of my business and what we can do and can’t do are, I wouldn’t say…, they can’t be obvious but they’re there. I feel it and see it, where we’re not considered for projects that we could do.
One majority prime contractor summarized his view of the state of minority contractors as follows:
I think that they’re competent. They have the same training and the same licenses that we have, so they can do the work. I think they’re comfortable at what they’re doing and maybe don’t want to get too big ….
M/WBE firms also recognize that they are often held to higher standards than their non-minority counterparts.
You have to prove yourself. And as an MBE, we almost have an obligation. Once you get it, people start giving strange looks anyway. “Oh, you’re here because you are an MBE.” So, you have to, and it’s an obligation to do [a] better job than other people.
***
We’ve got to prove them wrong because when we go to a meeting for the first time, they are going to start asking you, “Do you know so and so? Do you know—Well, let me tell you about what this guy did or what that guy did.”
***
My members constantly say there’s a double standard out there. If a white-owned firm doesn’t perform well they get a second chance. If a Black-owned contractor doesn’t
Anecdotal Evidence of Disparities in the DCAMM Market Area
NERA Economic Consulting
218
perform well not only does he or she not get another chance, everyone else is thrown into the pool.
M/WBE firms also complained that the negative perceptions of their ability to perform were not limited to the contracting and consulting community.
A big room, a big table full of people and it got to one guy, you know, reviewing the proposal and he said, “I’m really glad to see that MBEs and WBEs have been relegated to the unimportant part of the project.”
***
[W]e’re an engineering firm…environmental engineering/civil engineering consulting firm and they’ll ask, “Can you run some –some reproduction through us?”…[T]hey have that need of plan sets and specification packages and things like that. And they’ll ask us to—if they can run numbers through our firm to get that percentage, which we’ve—obviously, we’d say “no” to.
Many M/WBE firms also hold the perception that many in the state, and a majority of nonminority prime contractors, did not support the inclusion of M/WBE firms in the contracting process.
So, long and short, even on the construction side, when it comes to implementing their policies and their goals I just don’t see a high level of commitment or cooperation from the [DCAMM].
***
There are people in [DCAMM] who are really opposed to African American firms getting business with the agency.
***
[T]he prime contractor, the general contractor that’s doing that work, has done no outreach to the minority business community…. I reached out to a representative for the prime and said “Hey, why don’t you come to one of our monthly meetings and talk to our members because this institution is located right in the heart of the Black community?”…But he claimed he couldn’t come.
***
Probably some of the primes would like to do more business with women are glad to be sort of pushed into it, but mostly they’re just pushed into it.

Anecdotal Evidence of Disparities in the DCAMM Market Area
NERA Economic Consulting
219
2. Discrimination
A significant number of M/WBE and PBE firms have the perception that the majority contracting community continues to engage in subtle forms of discrimination that negatively impact their ability to obtain work.
And many sectors of society, that discrimination is now at the tacit level rather than the explicit level, because people have learned that they can’t be so explicit and make speech acts that are prohibited. But it’s still very alive at the tacit level.
***
[M]ost of our guys speak Spanish or a different language while they’re working and communicating. An architect or someone would come by and they’d [say], “Oh, they don’t speak English too well. I’ve got to double check what they do.” But if I have the guy who is talking about the Redskins or the Patriots, talking to them…then I ain’t getting checked.
***
Every time you go to a GC’s office or something, you get the feeling, just by—I don’t know, the air in the office, or you’re only there because they’re holding their hand to the fire.
***
[P]eople think of us as not real companies as—“You guys are set asides, you don’t have to work hard to get your work.” And I’ve had people say a long time ago, “Well, we’re just going to redo your work.” I mean, so you get no respect….
PBE firms also have faced challenges with discrimination and the perception that the majority contracting community engages in blatant and subtle forms of discrimination.
We landed a job…and got a call from the GC…the third biggest contractor in the state, and he told us to go to his office. So, I went to his office for the meeting assuming that everybody was going to be there and basically what I got out of the meeting was that they were seeing what we were made out of. I mean one of the questions out of his mouth was “Do they make good linguine sandwiches where you’re from?”
***
There is still a stigma about, the reason why the education is low is because we’ve been struggling. You know, first generation, trying to get jobs, hard labor. So, we haven’t elevated. We’re just starting to get that because we’re a discriminated against group…So this is going to take us right off that stepping stone. So that stigma of Portuguese, dumb Porti, all that is still there.

Anecdotal Evidence of Disparities in the DCAMM Market Area
NERA Economic Consulting
220
***
Yeah, we employ a lot of, this whole area is disadvantaged with a lot of minorities and that's where our workforce comes from. It's mostly minority employees. So at the end, not only are we being discriminated against, our employees are being discriminated against, which are minorities of every, of all other types besides Portuguese.
Other examples of discrimination reported by PBE firms reflect the challenges faced with majority contractors because of the English proficiency among some Portuguese workers.
[W]e’ve had foreman replaced…because of the language barrier…The English wasn’t good enough. Their language is Portuguese and we’ve had to replace because our customers, the general contractor, said “I don’t want to deal with this guy. He doesn’t know how to communicate well enough and I don’t want him.”
***
[M]y best employees that …speak in very broken English…and when they’re speaking with somebody, or they’re speaking with a PM or a super, they’re looking at him like “Are you sure you know what you are doing here?” Calling me saying “Hey, does this guy know what he’s doing here?”…Like, “What do you mean, does he know what he’s doing there? Why? Because he doesn’t…speak the clearest English?” But the guy’s fully qualified and I bet you he’ll work circles around half the people that are there….
Although discrimination is much subtler, M/WBE firms reported that they continue to experience forms of blatant discrimination.
I had a student from Columbia, and he’s a hard worker, but he went to do whatever he had to do with construction at this particular site. And the woman who was paying for whatever it was—didn’t want it and kept saying, “Oh, stuff from house must be missing,” suggesting because he was Hispanic…that he must steal.
***
You know, I’ve been asked, “Can I talk to a man?” You can, they don’t own the company, but you can. They’ll just have to ask me for whatever resolution you want, but you can.
The PBE business community also made a very salient observation regarding discrimination against Portuguese firms.
If we weren’t being discriminated against, our change in status [as a result of the Federal Concrete litigation] shouldn’t affect the work like it’s affecting us. And the reason we’re losing work must be because we’re being discriminated against, because they don’t need us anymore…if relationship is established, why aren’t we still getting that work?

Anecdotal Evidence of Disparities in the DCAMM Market Area
NERA Economic Consulting
221
Some nonminority prime contractors recognize that discrimination and diversity in construction and professional services continues to be problematic.
I think it was the year before last, and acknowledge that the profession is one of the least diverse and integrated of any profession out there, in terms of architecture at least. I think some of the engineering professions have made more advances in diversity than architecture has.
***
I think that the affirmative action programs like the WBE/MBE are not simply important within the agency. They are actually very meaningful outside the agency as well. They send a clear message about public values, and they do open substantive opportunities that otherwise wouldn’t be there.
***
I think there’s something that’s really profound about White privilege in terms of the lack of minority businesses, I think as much as we feel that we are discriminated against, I think people of color—and I think there is real privilege that goes with being White, even a White woman, that other minorities don’t enjoy. And I think that really makes it harder for a minority business and a minority women-owned business to get ahead.
Some M/WBE and PBE firms reported that non-minority prime contractors intentionally sabotage or undermine the performance of M/WBE firms on DCAMM projects.
Dealing with GCs has been very difficult, meaning I think it’s done on purpose. They do make money and creating difficulties for some of us.
***
I don’t have fancy words, so when you go to these meetings, they don’t look at you right, you know and some general contractors already can see you don’t have the education so they’re already going to try to pull a fast one on you. They’re not, they’re going to make, they’re going to hold the money on you, they’re not going to pay you as fast. It just goes down the line.
***
If I am White, you’re Black, they’ll call back and say…” Can you go lower—can you cut $10,000?” But they call my White buddy…, “Can you do $2,000 less?”
M/WBE firms that have any degree of longevity in the business are very selective about the general contractors they are willing to submit bids to on projects.

Anecdotal Evidence of Disparities in the DCAMM Market Area
NERA Economic Consulting
222
But because I’ve been in business for so long…I never solicit job. They send me the bid invite, people I know for the project. That’s when I bid. Because I feel comfortable on this project, the GC that I know [means] I’m not going to get hurt.
3. Glass Ceiling
Some WBEs made the decision to become small business owners because of sexual harassment and barriers to advancement in the workplace.
I myself started off in a large corporate firm, was a victim of sexual harassment by my boss, made it very clear to me that I had no future in advancing professionally within the firm. And then went the other route…starting my own firm.
***
I left the workforce, again, same thing, that direct sexual harassment but definitely a man’s organization where there was no room for women to advance. Started my own firm….
***
I too worked with a larger architectural firm within an interiors department, but it was the same dead end.
The experiences of WBEs illustrate that gender bias and negative perceptions continue to manifest itself in all industries as well as internally at DCAMM.
I have had work sites where people will not work with a woman plumber. I know that discrimination is there and they don’t believe that—they want everything status quo of what it was 30 years ago, to the point where they still expect the laborer to pick up their coffee cup.
***
I think that the women who are in business and have been for a while, you have to let it roll off, because it’s happening not just construction, but everything in general…there’s still a glass ceiling….
***
I’ve worked with women construction workers who you would think it would be kind of sexual harassment, but it’s more things like, “Well, she can’t lift this” or “She can’t do this, so we don’t want her.”
***

Anecdotal Evidence of Disparities in the DCAMM Market Area
NERA Economic Consulting
223
You know, my entire experience there was that he patronized me. He condescended to me. He treated me like I was his intern and never listened to my professional advice whatsoever…. And that was my experience with DCAMM.
***
I worked with a female project manager at DCAMM that I was in a meeting with her DCAMM colleagues where I did see the gender bias internal to the agency…At a very basic level of respect, you know. “Mansplaining” and “man-terrupting” come to mind.
***
It’s so cliché to say it, but experiencing so many times of being in a room and stating an idea—and my voice is kind of quiet, but still I can be very assertive—stating ideas, not heard, and then Joe Blow in the corner says it and everyone is like, “what a great idea!”
***
When I show up at certain types of jobsites as a subcontractor, the job superintendents have openly complained that a female is on the job site.
Several minority and nonminority owners articulated a contrary position that the issue of race and gender should not be considered in the procurement process and that their status as a minority firm may be more problematic than beneficial.
I would say no, I mean, at least as an architect selecting professionals that work my projects. If the firm is good, I am going to continue to hire them.
***
I still think that my minority status is not helping me out, because the bottom line is the number. That’s where it is.
***
You [would] rather go for the quality work and try to get the job in your own rights for the capacity. If the minority status comes about, if they have a requirement to fit, great. But if you go right ahead and mention [it], some people [are] already set up, “Oh, their work is no good. They are not capable.”
***
I am a woman but no longer pursue the WBE certification because it is too time consuming with too much paperwork. I have never had a problem with procurement or contract or project issues with DCAMM.

Anecdotal Evidence of Disparities in the DCAMM Market Area
NERA Economic Consulting
224
4. Workplace Harassment
Although less overt, there was little disagreement that racism and gender motivated harassment on the job continues to persist on publicly funded projects.
[S]ome of my guys [were] kicked out of the project. And I believe not because they did something wrong, just because of—they mess with them.
***
These guys get in groups on the job site and they talk amongst themselves during breaks and we get the whole thing. “Hey, speak English?”…You know, and this kind of thing. And “You guys always have to have your way.”…That’s a daily thing.
5. Payment
There was uniform agreement among all contractors and consultants, prime and sub, regardless of race or gender, that one of the most important issues was payment, by both the government and the prime contractor.
Nonminority construction firms reported significant problems and delays in processing payments.
So, the State’s not paying the general contractor, the general contractor is then not paying the mechanical, so no matter where we are, …we float a lot of the financing so that the subcontractors not only have to be…to really stay in business and do well, you not only have to be excellent in your trade, but you have to be excellent in finance.
***
So, first of all, they do milestone billing so you might be working on something for a couple of months and not able to bill it because you haven’t hit that milestone and so that’s a problem…You send in your invoice and they’ll bounce it and not tell you that they’ve bounced it.
***
So DCAMM holds up the money and they hold up the money and they hold up the money, and you hope – you argue. I have – we have invoices out to DCAMM right now…we haven’t been paid anything, and we’re done and it’s a year later.
This is not to imply or suggest that all nonminority and M/WBE firms’ experience with DCAMM on administration of the capital projects and payment is negative.
I think the other piece is that I generally appreciate DCAMM’s openness and willingness to work with the architecture and engineering community. [DCAMM] has regular

Anecdotal Evidence of Disparities in the DCAMM Market Area
NERA Economic Consulting
225
meetings with the subcommittee of the ACEC group, and those have been very engaging conversations.
***
So, my sense is that DCAMM is at one of these moments of time again where they are recognizing the need to do their own reevaluation, which is great.
***
I was able to get a project manager who was ready to listen to me and hold his next payment and then it was once it was the created the …separate waiver, then I need to sign for him each month and he should submit it. If not, he’s not going to get his next payment.
***
So, it’s overall very favorable reviews of working with DCAMM.
6. Exclusion from Industry Networks
The perspective of many M/WBE firms was that the close-knit nature of the construction industry, intentionally or unintentionally, contributes to the exclusion of these firms from informal networks.
It’s hard, because the mentality and the frame is still you give—you do business with your friends. Sometimes, you give business to the guy that you play golf with or the guy [who’s] your drinking buddy….
***
And a lot of time it boils down, again, to the good ‘ole boy networks.
***
I do think that there is sometimes the “good ‘ole boy” network that says, “If we have a choice…we would go with [a White male-owned firm]”—Yes.
***
Yeah, it’s still a “good old boys” network out there, and…Well, to break into it, it’s like you really gotta know somebody. And as a start-up business or a small business to get into it, it’s so hard.
***
Anecdotal Evidence of Disparities in the DCAMM Market Area
NERA Economic Consulting
226
Access, yeah, it’s about equal access. And just trying to get into that network and that buddy system is number one.
***
[T]he “old boy” network in Boston is so tough to break through. So, I find the process actually that there is an “old boy” network, [that] they do business with each other, and [that] it is very difficult to break through….
***
When I show up at certain types of jobsites as a subcontractor, the job superintendents have openly complained that a female is on the job site. Then our customer explains that I own the business and they’ve had good experiences with me. There are tight fraternities and it is hard to break in.
7. Applying for Commercial Loans
Many M/WBE business owners stated that they found it difficult to obtain working capital. Minorities have been excluded from construction and other industry networks, which hamper their access to family wealth, and networks that support growing businesses, making access to commercial credit more critical.
Several M/WBEs commented on the difficulty of getting financing with a commercial bank.
Yes, but that was very tough, too, back when I really started to get it with the bank. And again, it’s weird, because, if you don’t have money, they’re not going to loan you the money.
***
I have a 20-year relationship with banks and I can’t get an extension on my lines or anything because of that. If I was manufacturing, “Oh, yeah, you’ve got equipment.” But I have labor. My biggest asset goes home at night.
***
[T]hat is definitely a challenge that I wanted to just put on the record. On the issue of availability of capital, that is one of the challenges that contractors face because when they get a job they have to do their mobilization and their upfront work and it’s difficult for them to do that if they don’t get any kind of cash infusion….
***
We cashed out our 401Ks completely…And then after two years we could get a line of credit.

Anecdotal Evidence of Disparities in the DCAMM Market Area
NERA Economic Consulting
227
***
We self-funded as well.
***
I was shocked when we started our firm how there’s really not any funding available unless you’ve been in business for two years, I think that’s a huge aspect.
Some M/WBE firms expressed mixed reviews, some complimentary and others more critical, regarding state sponsored programs designed to provide access to capital.
So, the organization [Mass Growth Capital] constantly says “We’re out there, we’re looking for contractors to provide funding to. We can’t find any.” But then you have a situation where they have a good one…and they won’t fund him. So, access to capital continues to be a challenge. I can’t get money from a bank. I have to self-finance. I started this with a dollar, literally. I mean I had $1.50.
***
[W]e were kind of hesitant to pursue anything where the client was paying someone else directly, because that’s how loans are structured. Just because you want to sort of appear financially sound to your clients.
8. Applying for Surety Bonds
Many M/WBE and PBE firms reported difficulty obtaining surety bonds and saw bonding as a barrier to growing and taking advantage of opportunities.
[I]t is not easy to get the amount of bonding needed to do work for the state, most often Owners have to put up their personal property as collateral.
***
Bonding is not as big of an issue as it used to be some years ago. Those contractors that are doing well are able to get the bonding that they need. I think the biggest challenge on bonding is those contractors who are transitioning from a micro firm to the next level of growth and they’re going to need more bonding capacity to go after more contracts.
There appear, however, to be strong business relationships within the PBE business community and some contractors have made an investment in working with other start-up PBEs to try to mitigate the challenges with bonding and access to capital.
So, one of the other things that we’ve been able to do is help other companies, …, when they have to get jobs and stuff, we help speak with the banks, so we help develop relationships with bonding companies. That’s something that we try to do with all our companies that are trying to grow.

Anecdotal Evidence of Disparities in the DCAMM Market Area
NERA Economic Consulting
228
9. Obtaining Work on Public Sector Projects
Most M/WBEs expressed a desire to grow their firms and move from subcontractor to prime on public sector contracts.
How do I move from a small GC to take a bigger role and play, because we look at this, lack of minority, let’s say contractors or laborers?
Many firms were also discouraged from pursuing prime contracts in professional services because of the perception that DCAMM favors awarding contracts to large firms and not to smaller local firms.
We have the expertise, but getting DCAMM to see that, they don’t really want to be bothered. They want to deal with the big companies because it’s easier.
Several M/WBE owners agreed that the program opened doors and created opportunities for firms.
The idea of the program is giving people or groups a chance that would otherwise not get the opportunity. Again, my phone has rung because of the WBE, and I’ve had architects sheepishly say, “I’m sorry”—after that, because we did our end and did a really good job, now they call us. Isn’t that what the program is about?
***
Did the MBE [Program] help us? Yes, it did. It helped my partner and I. It opened up a lot of doors.
***
We need to come together and see how we can partner. Which I think is really what is intended by the program, is to help a small business and minority business to expand and to be able to use those partnerships, to leverage those partnerships.
M/WBE firms were in uniform agreement that nonminority contractor perceived abuses or violations of the program often go unreported because of fear of retaliation.
[T]he biggest concern that people have is that they are going to be blackballed.
***
I’m a little leery of saying anything against DCAMM because everything is so political.
***

Anecdotal Evidence of Disparities in the DCAMM Market Area
NERA Economic Consulting
229
If you create too much noise about – you could observe a racial problem and you don’t get used based upon your merit…. If you make some noise, you got to be careful. Because there might be retaliation.
Although M/WBEs reported that it is easier to obtain subcontracts than prime contracts on public projects, the firm also expressed frustration with their prime-subcontractor relationships and the business practices of the primes.
I’ve had people …say, well, “We like our guy, can I put my guy on your payroll for, like, you know, three days a week?” And then I’m like, “no”
M/WBE firms uniformly complained that the minority firms are not solicited in good faith or not used as listed in the Contractor’s schedule of subcontractors.
I mean, we get letters of intent, yeah. But once we sign the letters of intent, there is no follow through with DCAMM to confirm that our letter of intent is going to be part of this package.
***
I have signed letters of intent for principal MEP firms. And I signed a lot of them. And you know I hear they get the job …and then they don’t call me.
***
I have seen GCs indicate that they are going to carry [MBEs] and [WBEs] on their schedule, and they do that just to get the contract. And then they really don’t have any intention of working with those firms. And we know this because, right early on, they’ll start requesting to substitute all, if some, of what’s on the original schedule.
M/WBE firms uniformly complained that the non-minority prime contractor’s efforts to include M/WBE firms were pro forma and their efforts were not designed to achieve the M/WBE participation goals.
And some of the tricks they play will be, “We wanted to use that sub, but they weren’t able to respond to our request”—that they gave you on Friday night at eight o’clock.
***
I mean, in all honesty, they think that we’re a necessary evil.
***
[S]he was a WBE. She did big yard piping. They had a 5.3 percent WBE [goal]. All she got was 5.3%. Not 5.31, not 5.35. It was 5.3 and nothing more.
***

Anecdotal Evidence of Disparities in the DCAMM Market Area
NERA Economic Consulting
230
The prime will use you to get the project, but then either they don’t give you the work, or they give you crap work.
***
[W]e’re an engineering firm…environmental engineering/civil engineering consulting firm and they’ll ask, “Can you run some –some reproduction through us?”…[T]hey have that need of plan sets and specification packages and things like that. And they’ll ask us to—if they can run numbers through our firm to get that percentage, which we’ve—obviously, we’d say no to.
***
[Y]ou see a lot of price shopping from time to time, particularly in contractors who own good firms, MBE firms, WBE firms, they put them on the schedule and then they try to shop their price.
Some nonminority companies and minorities characterized the structural challenge in meeting the M/WBE goals and the GCs’ reluctance to use new M/WBE firms as follows:
The problem is, that 10.4 [percent goal] is based on your total contract value, and your total contract value is made up of about half what they call filed sub-bids, which, no matter who the GC is, who the CM is, those bids are—here’s like 11 trade categories that are bid, electrical, masonry, etc., and then we, essentially, are basically bound to take the low bidder, unless you want to disadvantage yourself. There was a ruling in, like 2010, that we cannot require, even as a CM, the filed sub-bidders to add or participate in participation goals, and that’s half the overall job. So, you take that half, your 10.4 becomes 20.8. Now, you take out your general conditions, your overhead and profit, the stuff that’s in there staffing-wise, because that counts as part of, and now you’re 20.8 becomes something like 30 percent of the work of the GC that we have to subcontract to minority- and women-owned businesses.
***
GCs use the same [MBEs] and [WBEs] over and over and over again. And so other firms aren’t getting an opportunity who can do the same work. So, I see that these GCs are giving preference to a particular firm that they like, and they get all the work. And anybody else, an [MBE] or a [WBE] who can do it, they don’t get a chance.
10. Obtaining Work on Private Sector or “Non-Goals” Projects
M/WBEs providing construction services uniformly continue to find private sector prime or subcontractor work (other than small residential and commercial projects) very difficult to obtain. Most M/WBEs, particularly those owned by African Americans and Hispanics, are heavily dependent upon public sector projects. Minority firms in particular reported that general contractors who use them successfully and repeatedly on public sector projects with M/WBE goals rarely or never contact them to bid private work.

Anecdotal Evidence of Disparities in the DCAMM Market Area
NERA Economic Consulting
231
[W]hen it comes to operating in the private sector, you’re not going to get any work with these guys. You know? I mean…every company is built on relationships. And any time they insert one of us into their programs or projects, it disrupts the relationship that they’re very comfortable with having already. So, there is resistance not only where there has to be participation, but there’s absolute resistance where there does not need to be.
***
So, we might get a lot of bid requests, but whether you actually get the job depends on the relationship with the project managers or the foreman that was running the job – this is on private work….
***
[T]he reality about the whole thing is they don’t want to know you unless they’re required to do it.
***
When there’s no goal for women on these contract’s GCs don’t hire them. It’s really simple. It is not rocket science.
Some non-M/WBE companies reported good experiences working on state construction projects with M/WBE firms and using them on their private projects as a subcontractor.
[T]here’s a civil engineering firm that I started using on a private project that had nothing to do with MBE and WBE, and they provided great service. Any you know, I would go with them regardless of whether or not I had an MBE or WBE obligation.
The limited number of private sector opportunities limits the growth and development of M/WBEs. Despite having the capacity to take on more projects, many M/WBE firms must cut staff when public jobs are finished because they receive no or very limited private sector work, negatively affecting their capacity to do future projects.
D. Conclusion
Consistent with other evidence reported in this Study, our anecdotal evidence strongly suggests that M/WBEs and PBEs continue to face discriminatory barriers to full and fair participation in both public and private sector contracts in the DCAMM Market Area. This evidence includes negative perceptions of M/WBE and PBE skills and abilities; discrimination in access to commercial loans and surety bonds; difficulties in receiving fair treatment in obtaining public sector subcontracts; abuses by primes of the payment process, and in the compliance process; and exclusion from significant private sector opportunities to perform as either prime contractors or as subcontractors. The results of the surveys and the personal interviews are the types of evidence that the courts have found to be highly probative in deciding whether DCAMM has been and/or continues to be a passive participant in a discriminatory market area, particularly

Anecdotal Evidence of Disparities in the DCAMM Market Area
NERA Economic Consulting
232
when considered in conjunction with the numerous pieces of statistical evidence assembled and presented throughout this Study.

DCAMM’s M/WBE Program: Overview and Feedback Interviews
NERA Economic Consulting
233
VIII. DCAMM’s M/WBE Program: Overview and Feedback Interviews
DCAMM’s Minority and Women Owned Business Enterprise Program (“M/WBE Program”) seeks to provide opportunities for M/WBEs to participate fully and fairly in DCAMM contracting. DCAMM’s aspirational overall M/WBE spending goal is 10.4 percent for Construction and 17.9 percent for Design on DCAMM capital projects and procurement dollars directly or indirectly with certified M/WBEs.
A. M/WBE Program Overview
1. Program Eligibility
Massachusetts General Laws Chapter 7C, Section 6, Affirmative Marketing Program, outlines the general legislative framework for the Commonwealth’s public contracting affirmative action program.175 The Affirmative Marketing Program is defined in the law as a program of race- and gender-conscious goals for capital facility projects and state assisted [municipal] building projects to promote equality for, and to encourage the participation of, minority- and women-owned businesses.176 In authorizing the Affirmative Marketing Program, the Massachusetts legislature made inter alia the following findings:
• The Executive Office of Transportation and Construction produced a disparity study which documented a history of discrimination against minority- and women-owned businesses in which the Commonwealth's agencies were participants;
• The Massachusetts Commission Against Discrimination conducted hearings and investigations which documented a history of discrimination against minorities and women in the Commonwealth;
• Discrimination against minorities and women affected the use of minority- and women-owned businesses in state contracting;
• The Commonwealth has a compelling interest in promoting the use of minority-owned and women-owned businesses;
• The Commonwealth’s policy is to promote equality in the market and to that end, to encourage the full participation of minority- and women-owned businesses in all areas of state contracting, including contracts for construction, design, goods and services; and
• The Commonwealth shall include participation goals of minority and women workers in all state and state-assisted contracts.177
175 Mass. Gen. Laws. ch. 7C, § 6. 176 Mass. Gen. Laws. ch. 7C, § 6 (b). 177 Mass. Gen. Laws. ch. 7C, § 6 (a).

DCAMM’s M/WBE Program: Overview and Feedback Interviews
NERA Economic Consulting
234
Chapter 7C, section 6 (b) defines a “minority-owned business” as a business entity which is at least 51 percent owned by one or more minorities and in which the owners exercise dominant control over the management of the business.178 A woman-owned business is similarly defined in this section substituting the term “women” for minority in the definition of a minority-owned business. Section (b) also defines a “state assisted [municipal] building project” as a design or construction project undertaken by one or more political subdivisions of the Commonwealth whose costs are paid for, reimbursed, grant funded or otherwise supported in whole, or in part, by the Commonwealth.179
The Commissioner of DCAMM, in consultation with the Director of the Massachusetts Supplier Diversity Office, is tasked with the responsibility of establishing the goals and setting guidelines governing the implementation of the Affirmative Marketing Program.180 The Commissioner, in determining the participation goals for minority- and women-owned businesses on capital facility and state assisted [municipal] building projects, may establish statewide and regional participation goals based upon the availability of minority- and women-owned businesses.181 The Operational Services Division, Supplier Diversity Office (“SDO”) is designated with the responsibility of developing and maintaining a certified database of minority- and women-owned businesses.182 SDO is charged with certifying M/WBE firms at the state level, and for certifying Disadvantaged Business Enterprises (“DBE”) for federally funded projects.183 The Commissioner of DCAMM and the Director of SDO are to meet on a quarterly basis to assess the Program and take appropriate measures to achieve the purpose of the law.184 The Commissioner of DCAMM is also charged with the responsibility of promulgating regulations to implement the Affirmative Marketing Program.185
DCAMM is also charged with the management, monitoring and reporting of the Commonwealth’s Affirmative Marketing Program for capital facility projects under DCAMM's control.186 Massachusetts' executive offices and departments are responsible for reporting on their projects through the Executive Office for Administration and Finance,187 and municipal officials are responsible for the programs for their state assisted [municipal] building projects, with oversight from and monitoring through SDO.188
178 Mass. Gen. Laws. ch. 7C, § 6 (b). 179 Id. 180 Mass. Gen. Laws. ch. 7C, § 6 (c). 181 Id. 182 Id. 183 Mass. Gen. Laws, ch. 7, §§ §§ 60 , 61 (b), 61 (m) and ch. 7C, § 6 (c). 184 Mass. Gen. Laws, ch. 7C, § 6 (c) 185 Mass. Gen. Laws. ch. 7C, § 6 (k). 186 Mass. Gen. Laws. ch.7C, §§ 6 (b) and 6 (h). 187 Mass. Gen. Laws, ch. 7C, §6 (j). 188 Mass. Gen. Laws, ch. 7, §61 (n).

DCAMM’s M/WBE Program: Overview and Feedback Interviews
NERA Economic Consulting
235
2. Program Operations
DCAMM and designated public entities endeavor to achieve the overall Commonwealth goal of providing economic opportunities for minority- and women-owned businesses under the applicable chapters for state procurement of construction and design contracting activities.
The DCAMM Office of Access and Opportunity (“OAO”) is responsible for providing access and creating opportunities on agency design and construction projects for both prime contracting and subcontracting by M/WBE businesses and the other industry stakeholders.189 The OAO group is divided into two areas: DCAMM’s Contractor Certification Office and DCAMM's Compliance Office. DCAMM’s Contractor Certification Office is not responsible for certifying M/WBEs or PBEs, that is SDO’s responsibility.190 Instead, DCAMM's Contractor Certification Office is responsible for the statewide prequalification of prime contractors and sub contractors in 18 designated subcontracting trades, which is a prerequisite for contractors to bid as a prime or sub-bidder on any Massachusetts public vertical building construction project valued at more than $150,000 and put out to bid by state agencies, authorities and municipalities pursuant to M.G.L. Chapters 149, 149A and 25A.191
DCAMM’s Contractor Compliance Office serves two roles. One is to assist in ensuring that goals are appropriately set for agency projects and to monitor the performance of contractors and designers against program goals for the participation of SDO certified MBE and WBE firms on DCAMM's public construction and design projects.192 The initial function of Contractor Compliance Unit once goals are established is to ensure that contractors and designers contract with SDO certified M/WBEs a that are SDO certified to perform the designated scope of work, and that the M/WBE firms actually self-perform the scope of work designated. The Contractor Compliance Office also ensures that contractors and designers submit proper documentation confirming M/WBE participation and provide technical assistance to contractors and designers in meeting program participation goals.
The second is to monitor and report on the performance of contractors and designers in meeting workforce participation goals for women and minorities employed on DCAMM’s construction and design projects193 in order to promote fair representation of minority and women workers on its projects. In addition the Compliance Unit is responsible for ensuring contractors and subcontractors working on DCAMM projects comply with the Massachusetts Prevailing Wage Law, which sets minimum wages that can be paid to workers on public construction projects in Massachusetts.194
189 Mass. Gen. Laws, ch. 7C, § 6 and Discussions with DCAMM staff. 190 Mass. Gen. Laws, ch. 7 §§ 61 (b), 61 (m).and ch. 7C, § 6 (c). 191 Mass. Gen. Laws, ch.149, §§ 44D (1)(a), 44D (11)(i) and 44D (2). Mass. Gen. Laws, ch.149A, §5 (d)(12) and
Mass, Gen. Laws, ch. 25A, § 11 C(a). 192 Mass. Gen. Laws, ch. 7C, §§ 6 (e) and 6 (h). 193 Mass. Gen. Laws, ch. 7C, §6 (j). 194 Mass. Gen. Laws, ch. 149, §27.

DCAMM’s M/WBE Program: Overview and Feedback Interviews
NERA Economic Consulting
236
a. Public Bidding Thresholds for Construction
There are four dollar threshold categories applicable to the procurement of construction-related services for most Massachusetts public building projects. These thresholds are based upon the estimated construction costs: less than $10,000;195 at least $10,000 but not more than $50,000196; more than $50,000 but not more than $150,000,197 and greater than $150,000.198 For projects over $5 million, DCAMM has an additional option of utilizing the procurement of a Construction Manager at Risk.199
If the estimated contract cost is less than $10,000, public awarding authorities like DCAMM are not required to advertise, but are required to use sound business practices in seeking a price for the planned scope of work.200
For projects with an estimated cost between $10,000 and $50,000, DCAMM and other public awarding authorities must post the solicitation on COMMBUYS, the Commonwealth’s website on which public entities list open public procurement opportunities, and the awarding authority’s website, for at least two weeks. The awarding authority is also required to post the solicitation in the Central Register, a publication of the Secretary of State that lists procurement announcements, and at a conspicuous place in the primary office of the awarding authority.201 In addition to the public notice requirements, the awarding authority can also contact not less than three potential bidders that customarily provide the contracting services.202
For building construction projects in which the estimated cost is greater than $50,000 but not over $150,000, awarding authorities like DCAMM must post the solicitation on COMMBUYS, in the Central Register and on the awarding authority’s website for at least two weeks.203 The awarding authority is also required to advertise the solicitation in a newspaper of general circulation for a minimum of two weeks. After a public bid opening, the awarding authority is also required to award the contract to the lowest eligible and responsible bidder. The bidder is also required to post a refundable bid deposit in the amount of 5 percent of their bid.204
195 Mass. Gen. Laws, ch. 149, §44A (2)(A). 196 Mass. Gen. Laws, ch. 149, §44A (2)(B).For projects less than $25,000, the bonding, DCAMM certification, filed
sub-bid, and bid deposit requirements do not apply. 197 Mass. Gen. Laws, ch. 149, §44A (2)(C). For projects not over $150,000, DCAMM certification and filed sub-
bids requirements do not apply. 198 Mass. Gen. Laws, ch. 149, §44A (2)(D). 199 Mass. Gen. Laws, ch. 149A, §1. 200 Mass. Gen. Laws, ch. 149, §44A (2)(A). “Designing and Constructing Public Facilities,” Commonwealth of
Massachusetts Office of Inspector General, November 2016, p.48. 201 “Designing and Constructing Public Facilities,” Commonwealth of Massachusetts Office of Inspector General,
November 2016, p.49. 202 Id. at p. 49. 203 Id. at pp. 50–51. 204 Id.at p. 151.

DCAMM’s M/WBE Program: Overview and Feedback Interviews
NERA Economic Consulting
237
For building construction projects with an estimated cost over $150,000, DCAMM and other awarding authorities’ solicitations are subject to two unique requirements. First, the prime contractor must be DCAMM-certified in one of 28 DCAMM Certification specialty prime categories in order to submit a bid.205 Second, if the value of the trade work is estimated to cost over $25,000, subcontractors providing services in any of the 18 specially identified filed sub-bid trades must be DCAMM-certified in one of those 18 trades in order to submit its bid.206 A second level of prequalification is mandatory for all public building projects with estimated construction costs in excess of $10 million (although certain large public awarding authorities such as DCAMM are exempt from the prequalification requirements) and a prequalification process is also required for the construction manager and trade subcontractors on all Construction Manager at Risk projects.207 DCAMM or the awarding authority is also required to advertise the solicitation on COMMBUYS, the Central Register and in a newspaper of general circulation for two weeks.208 Selection of the CM is based upon multiple factors and selection of the trade subcontractors is a low price based selection.209
b. Public Bidding Process – Public Buildings Over $150,000
On public building projects estimated to cost over $150,000, following the advertisement of the construction solicitation, sub-bidders must timely submit their bids to the awarding authority, which are opened in public and reviewed.210 The list of filed sub-bidders is distributed to the list of prime contractors that have requested plans and specifications for the project.211 The prime contractors bidding the project submit their bids, and their bids reflect which of the filed sub-bidders they plan to contract for the identified filed sub-bid trade services. The general bids are also opened in public and reviewed.212 The construction project is awarded to the contractor that is the lowest eligible and responsible bidder.213 It is important to note that the prime bidders must select their filed sub-bidders from the list provided by the awarding authority. Prime bidders may select any sub-bidder from the list, but generally choose the lowest priced sub-bidder for competitive pricing.214
205 DCAMM certification is not required for horizontal construction work such as roads, tunnels, bridges, sewers, or
site work. See Mass. Gen. Laws, ch. 30, §39 M. 206 Mass. Gen. Laws. ch. 149, §44F. See also “Designing and Constructing Public Facilities,” Commonwealth of
Massachusetts Office of Inspector General, pp. 52-54. 207 Mass. Gen. Laws, ch. §44D1/2 and 44D3/4 and ch. 149A, §§5 and 8. 208 “Designing and Constructing Public Facilities,” Commonwealth of Massachusetts Office of Inspector General,
November 2016, pgs.62, 69, 125 and 132. 209 Mass. Gen. Laws, ch. 149A, §§6 (d) and 8 (h). 210 “Designing and Constructing Public Facilities,” Commonwealth of Massachusetts Office of Inspector General,
November 2016, pp. 70-71. 211 Id. at p. 72. 212 Id. at pp. 72-73. 213 Id. 214 Discussions with DCAMM staff.

DCAMM’s M/WBE Program: Overview and Feedback Interviews
NERA Economic Consulting
238
c. Design Services
DCAMM and other awarding authorities will engage architects and engineers to provide design services for capital facility and state assisted [municipal] building projects. The selection of design professionals for state agency projects is done through an independent board, the Designer Selection Board (“DSB”)215 and by a municipal version of the DSB for municipal projects.216 The DSB is composed of eleven volunteer members, eight of which are appointed by the Governor. Professional design organizations select the remaining three positions.217 The DSB is charged with the responsibility of selecting design teams to primarily design vertical construction building projects.218
In general terms, DCAMM or the awarding authority will advertise a solicitation for design services. The advertisement will outline the proposed scope of work, professional qualifications, and the fee for the project.219 The advertisement will be placed in a newspaper of general circulation and the Central Register.220 If the Design contract exceeds $50,000, the Designer is required to submit an M/WBE participation plan along with its application to the DSB.221 The DSB will review the design proposals submitted and make the selection of the top three applicant designers based upon an assessment of the proposers’ qualifications. The DSB, in evaluating the design proposals, does not use a formal objective point-based evaluation matrix. The DSB will meet to discuss the proposals and vote to rank the finalists in an open public meeting.222 The successful Designer receives a copy of the selection letter to the Commissioner designating the recipient as one of the finalists selected by DSB. The Commissioner is not obligated, however, to take the top-ranked firm. If the top-ranked firm is not selected, the Commissioner must provide a written justification. A copy of the selection letter is also sent to the user agency, or the awarding authority.223 Based upon the DSB recommendation, the Commissioner issues a letter of appointment and the designer is required to execute the proposed contract without alterations.
d. Affirmative Marketing Program
DCAMM currently sets an aspirational M/WBE combined construction goal for each project over $50,000. The maximum allowable goal is 10.4 percent. Frequently, especially on smaller and specialty projects, there is a reduced goal or no goal at all.224 Before advertising a project,
215 Mass. Gen. Laws. ch. 7C, § 45. 216 “Designing and Constructing Public Facilities,” Commonwealth of Massachusetts Office of Inspector General,
November 2016, pp. 11-29. 217 Mass. Gen. Laws. ch. 7C, § 45 (a). 218 Mass. Gen. Laws. ch. 7C, § 46. 219 Mass. Gen. Laws. ch. 7C, § 47. 220 Id. 221 DCAMM “Contract for Study, Final Design and Construction Administration Services (October 2017).” 222 Mass. Gen. Laws. ch. 7C, § 49. 223 Mass. Gen. Laws. ch. 7C, § 50. 224 Discussions with DCAMM staff.

DCAMM’s M/WBE Program: Overview and Feedback Interviews
NERA Economic Consulting
239
DCAMM's project staff and Compliance Office review the size, scope, location and opportunities for subcontracting and ensure that the goal, if any, is appropriate to the project.225 The project bid documents set forth the M/WBE participation goals for that particular project. Under the current program, the lowest eligible and responsible Contractor must utilize a reasonable mix of MBE and WBE subcontractors to meet the combined goal unless the goals have been waived.226 If the successful Contractor is an M/WBE, they must still bring a reasonable amount of participation by a firm(s) that holds the certification, which is not held by the Contractor to the project, and the entire contract amount will be credited toward M/WBE participation.227 A Contractor may request a waiver of all or part of the M/WBE goal within four working days after the list of filed sub-bidders is provided to the contractor.228 If there are no filed sub-bids on the project, the Contractor is required to request a waiver or reduction in the goal fourteen (14) calendar days before the submission date for general bids.229 If a Contractor’s waiver request is granted, the goal is lowered for all bidders via an Addendum issued to the bidders.230 The Contractor requesting a waiver is required to document that it made a “good faith effort” to achieve the participation goal. The documentation that must be submitted includes a list of the subcontracting opportunities the Contractor made available for M/WBE participation.231 The Contractor must submit evidence of written notices soliciting bids from the available M/WBE firms and a response from the M/WBE firms solicited.232 Finally, the Contractor’s documentation should include evidence of any assistance offered or made to the M/WBE firms and any other documentation that would support the granting of a waiver or reduction of the M/WBE participation goal.233
After bids have been submitted, the apparent low general bidder is required to submit within five (5) working days the following documents: (i) Schedule for Participation for M/WBE firms; (ii) Letters of Intent for each of the M/WBE firms listed on the Schedule for Participation; and (iii) SDO certifications for each M/WBE firm.234 The Compliance Office will review the documents submitted within five (5) working days and approve or disapprove the M/WBE participation submission.235 The Contractor is required to submit within 30 days a copy of signed subcontracts for each subcontractor.236
225 Id. 226 “DCAMM Instructions to Bidders c.149, 44A-J (Rev 11/17),” §8.2, p. 7. 227 Id. 228 Id. at § 8.4, p. 9. 229 Id. 230 Discussions with DCAMM staff. 231 “DCAMM Instructions to Bidders c.149, 44A-J (Rev 11/17),” at §. 8.3, pp. 7-8. 232 Id. 233 Id. 234 Id. at §§ 8.5 and 8.6, pp. 8-9. 235 Id. at § 8.7, p. 9. 236 Id. at § 8.8, p. 9.
DCAMM’s M/WBE Program: Overview and Feedback Interviews
NERA Economic Consulting
240
Under the current program, filed sub-bidders are not required to submit a schedule of M/WBE participation with their bids. Except in very limited circumstances, if the sub-bidder elects to use an M/WBE firm, the sub-bidder can contract out no more than 20 percent of the sub-bidder’s scope of work to an M/WBE. The sub-bidder’s M/WBE participation will only be counted toward the goal if the contractor submits a Letter of Intent from the M/WBE with the bid or after award of the subcontract.237 The prime contractor, however, is responsible for making sure that each M/WBE working on the project performs the work with its own workforce. The prime contractor is also required to notify the awarding authority of any change in the schedule of M/WBE participation. If a change in M/WBE participation results in the prime contractor failing to meet the M/WBE participation goal, the prime contractor is responsible for making a good faith effort to make up the deficiency in participation.238
The resident engineer on the project serves as DCAMM’s site superintendent and reports firms working on the site on a daily basis, which can identify any discrepancies in the M/WBE plan. In addition, project submittals, certified payrolls and site visits also provide opportunities to identify potential discrepancies in the M/WBE plan.239 DCAMM may withhold payment if there has been a change or reduction in M/WBE participation, which results in the prime contractor failing to meet the M/WBE participation goal.240 A prime contractor shall receive written notice and be given the opportunity to present evidence that the prime contractor is complying or a justifiable reason the requirement should be waived.241 The Compliance Unit is responsible for monitoring the contract during the life of the project. The prime contractor is required to submit Certificates of Payment to the Contractor Compliance Unit on a quarterly basis. The prime contractor’s submissions are used to monitor payments to the M/WBE subcontractors. The Compliance Unit may intervene with the prime contractor to facilitate payment to an M/WBE subcontractor, if it determines that such an intervention is appropriate.242
Under the terms of the General Conditions, prime contractor payments may be suspended for non-compliance with the M/WBE program requirements. Further, DCAMM or the awarding authority may terminate the contract or impose liquidated damages for a default for non-compliance under the terms of the contract. Before exercising any remedies, DCAMM may give the prime contractor an opportunity to present evidence that they are complying or to submit a justifiable reason for waiving non-compliance. DCAMM or the awarding authority may invite SDO and the Massachusetts Commission Against Discrimination to participate in any proceeding.243
237 Id. at § 8.9, p. 9. 238 DCAMM General Conditions of the Contract c.149 (rev 10-17),” Appendix B, §§ 5, 6 and 7, p. 57. 239 Discussions with DCAMM staff. 240 DCAMM General Conditions of the Contract c.149 (rev 10-17),” Appendix B, §8, p. 58. 241 Id. 242 Discussions with DCAMM staff. 243 DCAMM General Conditions of the Contract c.149 (rev 10-17),” Appendix B, §9, pp. 58-59.
DCAMM’s M/WBE Program: Overview and Feedback Interviews
NERA Economic Consulting
241
B. Race-Neutral and Gender-Neutral Initiatives
As discussed in Appendix B, a crucial element of narrowly tailoring a race- and gender-conscious program is the use of race- and gender-neutral measures. During the study period, the DCAMM OAO has made significant race-neutral outreach and assistance efforts, capacity building projects, and operational streamlining and enhancements. These race-neutral efforts positively impact all small firms, including M/WBEs.
a. Outreach and Assistance to Small Firms and M/WBEs
DCAMM’s OAO regularly presents ongoing outreach and educational programs targeted to Construction and Design businesses that are interested in public contracting, including small, minority- and women-owned firms. Between FY2012 and FY2015, OAO organized and presented a total of 37 separate workshops in 18 different cities and towns across the Commonwealth. More than 500 business owners and representatives attended these workshops, entitled “Vertical Construction Contracting Prime & Sub-bidder Certification.”244
In FY2016 and FY2017, OAO organized and presented a series of programs entitled “Doing Business with DCAMM.” These events were held in seven impacted cities in the Commonwealth and were attended by more than 400 business owners and representatives. The programs included presentations by DCAMM senior staff, who provided overviews of: DCAMM processes; the various divisions within the agency, including public construction and maintenance; how to bid and work on public construction projects; and DCAMM’s procurement of goods and services.245
The Doing Business with DCAMM programs also included presentations by representatives of longstanding DCAMM certified prime contractors. The prime contractor representatives discussed how to effectively work with DCAMM from a contractor’s perspective and were also available to discuss potential subcontracting opportunities available with their firms. Additionally, representatives from the Procurement Technical Assistance Center (“PTAC”), which is funded by the U.S. Small Business Administration, attended the event. PTAC provides in-person counseling services for small businesses to help them prepare to successfully pursue government contracting opportunities. Finally, SDO representatives, who provided information and assistance on applying for SDO certifications, also joined the majority of the programs.246
In addition to the workshops and programs DCAMM organized and presented directly, OAO staff also participated in the SDO Supplier Diversity Series events in FY2015 and FY2016. The goal of the SDO Series is to increase the awareness of business opportunities in the Commonwealth by small and diverse businesses; to assist those businesses to meet key public sector decision makers; and to provide access to networking opportunities and capacity-building resources. The Series was developed in collaboration with the Governor’s Office for Access and Opportunity and the Massachusetts Office of Business Development. During FY2015 and 244 Discussions and correspondence with DCAMM staff. 245 Id. 246 Id.

DCAMM’s M/WBE Program: Overview and Feedback Interviews
NERA Economic Consulting
242
FY2016, there were more than 850 attendees and more than 800 exhibitors who participated in these events.247
OAO staff also regularly participate in a variety of Construction and Design industry outreach and informational events organized by other public awarding authorities, industry trade organizations, regional and local business development organizations and others. 248 Additionally OAO staff regularly provides informational resources and technical assistance to prime contractors and subcontractors through DCAMM project-specific outreach events, particularly for the agency’s larger projects.249 Also, a variety of DCAMM staff regularly provide one-on-one informational and technical assistance to firms on any aspect of doing business in public construction.250
b. Capacity Building
In 2011, the Massachusetts Growth Capital Corporation’s (“MGCC”), through their contractor Next Street Financial, established a state-funded, multi-year capacity-building program entitled “Capacity & Contracts,” targeted to minority-owned firms, women-owned firms, and other small businesses in the Construction industry to build their capacity, grow their businesses, and win contracts with the Commonwealth of Massachusetts.251 Special emphasis was placed on recruiting participants who were SDO-certified.
Between 2011 and 2015, the Capacity & Contracts Program successfully provided training to nearly 150 business owners252 on a variety of topics, including strategic and financial planning, bonding and insurance, access to capital, organizational development, leadership effectiveness, and technical skills necessary for success in public procurement.253 The program also provided access to networking and mentoring opportunities with general contractors and other industry practitioners.254
The Program was separately customized for two different tiers of small businesses—Tier I businesses were smaller organizations with revenue of less than $2.5 million and Tier II businesses had revenue less than $10 million.255 Professionals with expertise in business, finance, human resources and other relevant fields as well as a number of public employees 247 Discussions and correspondence with DCAMM and SDO staff. 248 Discussions and correspondence with DCAMM staff. 249 Id. 250 Id. 251 Next Street Financial LLC, “MGCC Capacity & Contracts Program, 2012 -2013 Year End Report” (May 2013),
pp. 3-4. 252 Next Street Financial LLC, “OAO Capacity and Contracts, Year End Success Report, July 2014 – September
2015 (n.d.), p. 3. 253 Next Street Financial LLC, “MGCC Capacity & Contracts Program, 2012 -2013 Year End Report” (May 2013),
pp. 3, 8. 254 Id., p. 3. 255 Id., p. 4.

DCAMM’s M/WBE Program: Overview and Feedback Interviews
NERA Economic Consulting
243
(including DCAMM staff) provided portions of the training during the three-year period.256 Although Next Street is still assessing the overall impact of the program on the participating businesses, data from the first year’s participant cohort showed an increase in their firms’ full time employment, and also showed a significant number won a Commonwealth prime contract or subcontract following the first year of the program.257
c. Operational Enhancements
DCAMM has also implemented several programs during the study period to make working on public building construction projects in Massachusetts more accessible to all small firms, including M/WBEs. DCAMM added a new “Small Project Contractor Certification” category with reduced qualification requirements.258 DCAMM has also streamlined the certification application and renewal process and moved the DCAMM Contractor Certification process from a hard copy process to an online application.259 In addition, DCAMM has simplified and streamlined its bidding processes by transitioning from a paper-based plans and specification distribution and bid submission process, to the new DCAMM “E-Bid Room,” which includes an online plan room and an online bidding process.260
C. Business Owner Feedback Interviews
To gather anecdotal evidence on the current DCAMM M/WBE program, program implementation and procedures for leveling the playing field and opening opportunities for M/WBEs on public contracts, we met with more than 120 business owners or representatives from a cross section of the industries from which DCAMM contracts for Construction and Design.
The following are summaries of the issues discussed. Quotations are indented, and are intended to represent the views expressed by multiple participants.
1. Significance of the DCAMM M/WBE Program
In summary, a significant majority of M/WBE firms reported that being certified provided opportunities that otherwise would not have presented themselves. The Program was seen as critical to allowing M/WBE and PBE businesses access to the business opportunities within the Commonwealth.
I think the MBE, WBE categories I think overall are really helpful…. You know, I think we’re better off having these things than not having them. If we didn’t have them, we’d really be complaining.
256 Next Street Financial LLC, “OAO Capacity and Contracts, Year End Success Report, July 2014 – September
2015 (n.d.), p. 7. 257 Id. at pp. 22-24. 258 Discussions and correspondence with DCAMM staff. 259 Discussions and correspondence with DCAMM staff. 260 Discussions and correspondence with DCAMM staff.

DCAMM’s M/WBE Program: Overview and Feedback Interviews
NERA Economic Consulting
244
***
So, I have a lot to owe to that program. And so, I’m not dismissing it. In fact, I think it’s really important. Really, really important.
***
I wouldn’t be here if I didn’t get the state work I did as a WBE.
***
I do think the program is really important. I think it does help to level the playing field.
***
And the program helped us grow our company, absolutely.
Some non-minority firms had a contrary view of DCAMM’s M/WBE program and its efficacy.
I’ve worked with and tried to work with some minority owned businesses, one of which admitted that he was there to learn from us and eventually compete with us. I kind of found it to be an awkward conversation at best. I understood where he was and a lot of things we looked at just didn’t work out for other reasons, but it was – beyond that it was yeah, I don’t need to help competition. I got enough of it.
***
I’ve given up on the state, because I couldn’t get any business.
2. Significance of the M/WBE Program to PBE Firms
The loss of M/WBE status for PBE firms has had a significant negative impact upon the participation of PBE firms in DCAMM contracting.
[W]e’ve been getting chased by larger contractors to do subcontract work for them, installing millwork, mostly wood-type related items. Prior to that, again, we never chased it, but we’re not getting the calls anymore.
***
Almost any subcontracting work we had now is …we’ve lost a lot of it. I mean, a lot of it had to do because we were used as an MBE, on jobs, now, they can’t use us.
***
We were a minority company, and we have, I'd say, four generations of families working from—that immigrated when my father did. But what DCAMM and the state is missing is the

DCAMM’s M/WBE Program: Overview and Feedback Interviews
NERA Economic Consulting
245
Portuguese that started to work with my father and my uncle who built the company, their children work for us, and their children work for us, but we have abided by all the regulations, state and federal. We employed the Boston residents, the minorities, the women, every ethnicity, we do not discriminate, because we were discriminated against. When you stop giving us work, you have now made it so small, and we got to keep the ones that started with us working, so that's going to hurt everybody.
***
I had a phone call from someone. I said, “Hey how come you didn’t take us into consideration?” And the answer was, “Because you’re not on the list anymore.”
***
[T]he day after Patriot’s Day here in Massachusetts was the day that we were temporarily decertified… we haven’t gotten one state job.
***
If we look at everybody around here. First generation Portuguese. You got masons. You got sheet rockers. You got carpenters. All these people, all these people, they going to lose a job because [the] business owner [is] actually Portuguese. … A lot of people, they’re not going to find a job. That is, it's key. To me, there's going to be a lot of Portuguese people, if we lose this, they going to lose a job and by lose a job, they may lose houses. They’re going to effect it. They’re going to effect down the road and that is, I mean, look around. Here we're probably pulling two, three thousand employees between us everybody over here. And I'm just saying this area. You go to Hudson. You go to Ludlow, I'm sure it's the same thing.
***
But the bottom line is, we are Portuguese, 100 percent, and it was construed as minority before, and that being taken away has changed the whole playing field for business.
***
Matter of fact, there was a company I did a lot of work for, maybe last ten years, stopped using me almost altogether.
The PBE businesses uniformly felt that they were the victims of discrimination both historically and under the current circumstances.
The reason we probably feel discriminated against now is because we’re no longer being considered MBE.
***
DCAMM’s M/WBE Program: Overview and Feedback Interviews
NERA Economic Consulting
246
It was definitely tough before competing out there, being from a different country. I mean, with my last name. And ever since I was in school, I’d get made fun of for being from somewhere else…. And now that we lost that status, it’s much harder to compete.
The nonminority business community also recognized the significance of removing PBE businesses to meet their MBE goals.
[U]ntil 2016, we could use Portuguese-owned businesses as minority-owned businesses, which was kind of the general practice. And then someone challenged it…. But that’s taken now the pool of qualified minority-owned businesses or Portuguese and minority and cut it probably more than in half.
3. SDO Certification Standards and Processes
The experience of M/WBE and PBE firms with the SDO certification process and recertification process was mixed but overall perceived as good.
[T]hey will work with you. They’re smaller staffed than they used to be, so their verification of your qualifications is taking longer and longer. We’re finding that, even after the renewal period, it’s another month or so getting a renewal letter, so technically we’re expired but we’re not.
***
With the State of Massachusetts, I would say [that the certification process] was excellent. I was pleasantly surprised at the support.
***
Renewal has been fine.
***
I’ve been through some of the initial meetings and training. It feels as though they do not want people to apply. It’s not welcome, we want—you’re a woman owned business, please apply. It’s this is going to be a long process. Are you sure you really want to do this? And the answer, of course, is no. We’re going to interview you, we’re going to interview your staff, and it’s almost like they are assuming that we’re trying to pull some inappropriate scam on the Commonwealth.
4. Pre-award Processes
a. Meeting M/WBE Goals
A significant number of nonminority construction firms were concerned about the available pool of M/WBE firms.

DCAMM’s M/WBE Program: Overview and Feedback Interviews
NERA Economic Consulting
247
[O]f concern is the availability of qualified women and minority businesses that I can contract with to put onto DCAMM or city, in town projects where it’s a prevailing wage project.
***
I see an advertisement for bid, the minorities do, but they’re not coming out to bid it. Is it because they don’t have the funding, the bonding, the financing, the help...Maybe they are not comfortable being in the businessman’s shoes.
***
Some contractors were concerned with the short time frames for bidding DCAMM projects and opined that DCAMM should make sure that it provides a sufficient timeframe to prepare the bids on projects.
One thing I should mention the time frame for response. Major factor for us. For a job of DCAMM range size we need weeks to put numbers together. By the time I found out about the job, maybe it took me a week to even find out that it existed. Now the response time is a week. I can’t do that job. I don’t have enough time. Making sure that we have three or four weeks to bid a job is really important to us…. The longer time frame to respond to them the more likely we are to take it.
A potential barrier and concern which hinders the available pool of M/WBE firms is the requirement of audited financial statements.
Here’s one of the things that I think is another barrier and has been to me…but state agencies will require you to have audited financial statement. And I have a review of financial statements, but I’m not going to spend $10,000 on audited financial statements. I think that’s also a barrier.
***
Certification, especially when you come and tell me that I have to hire an accountant, which will cost me $10,000 to have my three years certified, and all the documentation I have to go through. Sometimes, a larger company can, but for me then to hire a CPA…. It is an issue.
b. Contract Solicitations
There was significant support among the M/WBE firms to unbundle DCAMM contracts to improve the opportunities for small firms to win prime contracts.
I have no access to those works. One, some of those works are pretty sizeable out of our category, they don’t slice it to be diversified, which [is] something – they talk a lot about it.… They make it big jobs [in] which [a] bigger company gets it. I lined up everything

DCAMM’s M/WBE Program: Overview and Feedback Interviews
NERA Economic Consulting
248
instead of moving from a sub to a GC into small projects within my dollar capacity, I can’t.
***
And what my issue is, is that it’s hard to break into the marketplace, if you will, because of past performance, the lack of, a new company.
***
Our biggest complaint is the prequalification rules by state agencies…and the size of bid packages.
Several M/WBEs expressed concerns that the restrictive experience requirements create a barrier to M/WBE firms getting their foot in the door and competing for opportunities.
You know it works more the other way, you know, where we find that the public sector, the government doesn’t want to work with somebody unless you’ve already worked with the government.
***
There’s a Catch 22 – well, it’s not just one. It’s a whole series of them, that if you haven’t done it, you can’t do it. So how you get into this space to be, you know, take advantage of it is quite difficult.
***
When you are a small contractor you cannot get a job with the state unless [you] are prequalified and you can’t get prequalified unless you have done 3 jobs of the same nature.
***
Owner’s Project Manager…services have no requirement for minority [participation], which we strongly feel, should be changed and made similar to other qualification-based selection such as the Design Selection Board.
***
Union requires a $50,000 bond and a million other type of requirement[s] that eliminated small company to qualify to become a signatory. Hello we are MBE, DBE for a reason; we don’t have the resources like other contractors.
Several M/WBEs suggested that DCAMM engage in more outreach for non-construction related projects and solicitations.

DCAMM’s M/WBE Program: Overview and Feedback Interviews
NERA Economic Consulting
249
I would say that there’s a lot more outreach from DCAMM, this kind of thing on the construction side. I really don’t see too much. When I saw this, I said, “Oh I should go to that because I don’t really see much for designers.”
There was uniform agreement among M/WBE firms that DCAMM was extremely bureaucratic and should review the procurement process to streamline the decision-making process.
When we work directly with user agency, we find they are so much more efficient in terms of decision-making, schedule moving forward, which of course is how we make money, right? When clients delay and the back on decisions and have many bureaucratic layers to reach decisions, then architects schedules slow down, and that same fee gets spread over a much longer period of time.
***
[Y]ou know, like it’s – again, it’s sort of like death by a thousand paper cuts.
***
I’m an engineer so I’m on the design side, but DCAMM is not just one entity but it drives different divisions…. And contract officers have a different interpretation of what is required. For example, my last contract we filed was six months to complete because aside from what’s [in] the 200-page instructions, there was unwritten rules—it was like finally got to the point where I am supposed to sign in blue ink and it cannot be typed. It has to be handwritten in blue ink.
Non-minority firms also echoed the assessment that DCAMM is extremely bureaucratic and should review the procurement process to streamline the decision-making process.
We’re still overwhelmed by the paperwork when we sign up for a DCAMM job. So, they – it’s a government, bureaucratic run organization, and they expect you, whether you’re a 2-man business or 200-man business, to dedicate somebody, like full time to the paperwork.
Both M/WBEs and Non-MWBEs construction and professional service firms complained about the project administration of DCAMM contracts.
Well we did work off the contract, but I have to say that it was, no lie, from the time we submitted the proposal until we got the call, it was like nine years. I was like, “Who are you?”
***
[T]here are many different project managers at DCAMM. They all have different management styles…. The project managers are very, very inconsistent from project to project.
DCAMM’s M/WBE Program: Overview and Feedback Interviews
NERA Economic Consulting
250
***
It’s very difficult to plan your firm, your resources, whatever, because you never know when somebody is going to pick up the phone to say, “We need this done.” And usually it is poorly planned, tight time line, not budgeted right. I mean the levels of disorganization at DCAMM are huge. And it’s gotten worse I think, at least in my perspective.
***
I had met and dealt with DCAMM at a project that was at UMass Boston…[T]here was a lot of miscommunication that was going around at the time and it seemed like one hand didn’t know what the other – there was a lot of that that was going around.
Both M/WBEs and non-MWBEs construction firms applauded DCAMM’s implementation of electronic bidding on construction contracts.
Typically, we would submit the bid by UPS rather than drive. But that did cause some problems. We had to be done earlier, ready earlier. But, yes, that is a major bonus of having it available to do online. And it’s a workable system. It’s just not a perfect system.
5. Contract Performance
a. Monitoring
Many M/WBE firms commented that DCAMM’s monitoring of M/WBE participation on contracts needs improvement.
They don’t care about you. But they do put the goals, it seems…. But who is going to check – they can put the goal. But who is going to check the goal was met?
***
Well, what they’ve been telling me is that they don’t always get the work that they’ve been told they’re going to get. There’s the scope and then there’s the day-to-day reality of what they’re actually getting.
***
[I]n order to get those contracts, they have to have me on their team. But then when they get the contract, most of the time, we don’t even hear about the projects. We’ll hear it later that they did it with their own engineers in-house…So, it’s like using us to get the project but then we don’t get the work.
Some nonminority firms expressed their view that DCAMM’s monitoring and compliance efforts were weak and ineffective.

DCAMM’s M/WBE Program: Overview and Feedback Interviews
NERA Economic Consulting
251
So, from a policy perspective there’s no one monitoring how these goals are implemented and measuring the level of M/WBE involvement that I’m aware of.
***
The enforcement isn’t there.
***
There is no back check at DCAMM saying, “Did you actually use the consultants you had on your team?”
Some M/WBE firms expressed their view that the M/WBE office could be more proactive in assisting M/WBE firms in payment disputes.
Can DCAMM have an office that I, as a sub, can call, “Excuse me, I have this issue”? Because for us, there’s got to be an office within DCAMM for arbitration. Before we have a problem, call me and the sub, and DCAMM,…we got to make sure that…subs…are not taken advantage of….
b. Payment
In general, both M/WBEs and non-M/WBEs recognized the importance of receiving timely payments and the negative impact that not getting paid had upon their ability to be successful on public projects.
I think, again, the biggest issue that we have as a small company is payment. Especially if we have to go through a subcontract, because then we generally wait for the prime to be paid and then they pay us. So, that’s where it is kind of been an issue with trying to pursue DCAMM work, is that I get from my supervisors and the owner of the company saying, you know it takes months to get paid.
***
The payments always [an] issue.
***
I think that most of those invoices sat with the project manager for three months before I was advised that they had been rejected.
***
[W]e submitted that invoice to you on blah, blah, blah. “Oh, well, we never got it.” Or “It went to this person.” Or “It didn’t get approved.” Or it didn’t – you know, and it’s just like you have this feeling that there’s this labyrinth of paper just flowing around.
DCAMM’s M/WBE Program: Overview and Feedback Interviews
NERA Economic Consulting
252
One of the most consistent themes with both M/WBEs and non-M/WBEs is the difficulty and delay in the processing of change orders.
[I]f you do some extra work, DCAMM, the paperwork is so many layers and to get a change order or changes everything for that job, it took me eight months to get something, you know, to get paid…for us, a minority small – that hurt us, you know.
***
But the big thing is…the change orders…. You wait and…the job is…it was a two or three year job.
***
One is the change orders which we say take too long. And I recently had somebody throw back all my change orders and say, “You’re only allowed 5 percent overhead and profit…I’ll go broke on change orders.”
***
I never count on these change orders. You just do it and you wait, of course, until it’s going to be approved. After it’s going to be approved, then you can…bill it. Sometimes, it takes months….
***
In specific change orders, I’d say more so than payment…we wait, in some cases a year, for a change order …We’ve outlaid the cost a year and half….
Some M/WBE firms expressed their view that the M/WBE office could be more proactive in assisting M/WBE firms in payment disputes.
Can DCAMM have an office that I as a sub, can call, “Excuse me, I have this issue”? Before we have a problem, call me and the sub, and DCAMM…we got to make sure that …subs…are not taken advantage of….
***
So, there is that verification. But as far as who is actually doing the work, there is no checking to see whether – they’re just checking to see who is paying who….
c. Retainage
There was another major concern among the majority of M/WBE construction and non-M/WBE firms regarding the long delay to release retainage.
I finished a job, and it was a year and half ago. I’m still waiting for my retainage.

DCAMM’s M/WBE Program: Overview and Feedback Interviews
NERA Economic Consulting
253
***
[I]t takes a long time so that by the time we get everything else cleaned up and then to wait for retainage it’s a long time.
***
We did a job maybe four or five years ago that went over a year period. They kept expanding the job, adding on. And that held retainage was problematic because that’s where a lot of your profit is. To continue over a year period of not getting that retainage was little bit trying…. Once each phase completes that retainage should be released.
d. Front Companies and Pass Throughs
Although not touched upon in all the focus group sessions, there was the perception with some minority and nonminority firms that contractors are gaming the system and shams and front companies continue to be a problem with the M/WBE program.
And the other thing is, people are just working their way around the system. They’re making companies up. It’s the same contractors still doing the same shit, and they’re beating the system because it’s a joke, because you can’t meet half the shit.
***
It was a family owned business. They were in their second, third, fourth generation and the wife was very involved operationally, absolutely knew what she was doing. And they said, “All right, let’s transfer ownership 51/49 to her.” So, it becomes a women-owned business. You know what I mean, you have established businesses that become women-owned. There’s not a lot of cases of established businesses becoming minority-owned, because you’re transferring ownership to another family. So, minority businesses basically have to start from scratch.
***
I was actually approached at one of these conferences that I went to. A contractor who said that they would like to see me certified so that they could give me a check. They don’t want me to actually do any work on their jobs, they just want to give me a check so they can satisfy their women-owned business requirement.
***
I am starting to notice a lot of general contractors – who use to be general contractors, are now setting up their nieces, their daughters as WBE to take advantage of the program.

DCAMM’s M/WBE Program: Overview and Feedback Interviews
NERA Economic Consulting
254
This page intentionally left blank.

Suggested Best Practices for Race- and Gender-Conscious Contracting Programs
NERA Economic Consulting
255
IX. Suggested Best Practices for Race- and Gender-Conscious Contracting Programs
As detailed above, we conducted a thorough examination of the evidence regarding the experiences of M/WBEs and PBEs in DCAMM’s contracting market area. Consistent with strict scrutiny standards, we have analyzed evidence of such firms’ utilization by DCAMM on its prime Construction and Design contracts and subcontracts, as well as M/WBEs’ and PBEs’ experiences in obtaining contracts, both in the public sector and economy-wide. We gathered statistical and anecdotal data to provide DCAMM with the evidence necessary to consider whether it has a compelling interest in remedying identified discrimination in its market area, and if so, how to narrowly tailor any race- and gender-based remedies adopted.
DCAMM has a mature and comprehensive M/WBE Program and accompanying regulations and guidance. Based upon our review of M/WBE best practices and our experience with M/WBE programs, we highlight some of the best practices applicable to the contracting process that allow for a well implemented M/WBE contracting and inclusion strategy.
A. Continue and Augment Race- and Gender-Neutral Initiatives
1. Expand the Small Business Purchasing Program to Construction and Design
Race- and gender-neutral programs are critical to a successful strategy that fosters the inclusion of M/WBE, PBE and small business owners in DCAMM’s contracting process. A question facing many jurisdictions is how to grow capacity at the prime level and shift the program objectives away from exclusive reliance on subcontracting goals. A best practice to facilitate this goal could include expanding the existing Small Business Purchasing Program (“SBPP”) to include Construction and Design contracts and, further, to raise the contract threshold above the existing $150,000 limit.261 Currently, the SBPP is administered by OSD, due to its oversight role in the procurement of contracts for non-construction goods and services. A comparable program for Construction and Design contracts might reasonably be placed under the oversight of DCAMM.
Creating and expanding small business preferences is recognized as a best practices approach to providing prime contracting opportunities to M/WBEs, PBEs and other small firms. There are three elements that merit consideration in a strategy of expanded inclusion for Construction and Design contracts. First, to maximize the program’s effectiveness, the size standards for small business program eligibility should be reviewed to ensure that the program targets the appropriate pool of firms. States may develop small business program eligibility standards that reflect their own small business profile. Some states have seen the need to encourage microbusiness or sheltered market programs for emerging or start-up businesses. Other programs, such as the Disadvantaged Business Enterprise Program, have relied upon the U.S. Small Business Administration size standards to determine eligibility. Second, as mentioned above, the contract dollar size threshold for small business program participation should be set at 261 The Small Business Purchasing Program was created by Executive Order No. 523 (June 2010).

Suggested Best Practices for Race- and Gender-Conscious Contracting Programs
NERA Economic Consulting
256
the largest level that is feasible and responsible. Third, it is important to be able to measure the impact of small business program efforts on the business community. Therefore, data on race, gender, and Portuguese status should be collected on all firms participating in the Program. This will facilitate any future study of M/WBE and PBE participation, which should include review of the effectiveness of the small business program in increasing the number and the capacity of M/WBEs, PBEs and other small business enterprises.
2. Review Surety Bonding and Previous Experience Requirements
Disproportionate and significant numbers of M/WBEs and PBEs told us that surety bonding, commercial insurance, and previous experience requirements render significant barriers to participation in Construction and Design contracting.
A recognized best practice to remove such barriers and to enhance the opportunity for participation in Construction and Design contracts is to review surety bonding and insurance requirements. The goal of such a review is to ensure that the bonding and insurance requirements are sensible from a business perspective and that required amounts and limits are no greater than necessary to protect DCAMM’s interests. For example, a bonding requirement of $50,000 for a job priced at $25,000 may not justify the expense related to securing the bond.
At least one jurisdiction has implemented an innovation to their bonding program by creating a group policy bonding program designed to increase the M/WBE bonding capacity. Other tools available to assist with bonding and insurance are “wrap up” insurance and Owner Controlled Insurance Programs designed both to manage risk and to potentially allow for more opportunities for M/WBEs, PBEs, and other small business enterprises to compete.
Similarly, the previous experience requirements on DCAMM contracts, including Design contracts, should not create an artificial barrier that precludes qualified firms from competing for those opportunities. Experience requirements in solicitations should be constantly reviewed to ensure that M/WBEs, PBEs, and other small business enterprises are not unfairly disadvantaged and that there is adequate competition for DCAMM work. Special scrutiny should be given to any qualification requirements that include a specific number of years of prior State design project work in order to determine if such a qualification requirement is actually necessary.
3. Increase Contract Unbundling
Another best practice is to review contracting opportunities to unbundle larger contracts to the greatest degree that is feasible and responsible in order to facilitate bidding by M/WBEs, PBEs, and other small business enterprises. Master contracts and blanket purchase order contracts as a best practice have been redefined to have smaller scopes and create more opportunity. Policies and procedures to divide contracts into smaller work packages have been implemented as a means to increase diverse business participation and to level the playing field. To increase opportunities for M/WBEs, PBEs, and other small business enterprises, for example, large Construction contracts are also unbundled, and direct prime contracts with governmental agencies are encouraged, which should facilitate the growth of M/WBE and PBE prime contractors.

Suggested Best Practices for Race- and Gender-Conscious Contracting Programs
NERA Economic Consulting
257
4. Ensure Prompt Payments
Prompt payment is the lifeblood of any business, and slow payments by DCAMM to prime firms and by prime contractors to firms performing as subcontractors clearly create hardships for M/WBEs, PBEs, and other small business enterprises, impacting their success. Many states require timely payments to subcontractors, including DCAMM. Generally, most require that the government pay the contractor within 30 days from approval of invoice and, similarly, require the prime contractor to pay the subcontractor within seven to ten days from receipt of payment by the prime.
Best practices to facilitate the payment process include implementing an electronic contract tracking system, whereby contractors and subcontractors can see where the prime contractor’s invoice is in the approval and payment process. Such technology would facilitate subcontractors’ ability to know whether and when their prime contractor has been paid. This addresses a frequently voiced complaint by subcontractors that prime contractors often withhold payment unnecessarily, despite the requirement that prime contractors are to “pay when paid.”
Expedited payment programs have also been adopted by some governments for major capital projects, which provide incentives for prime contractors to pay subcontractors within seven days of receiving a subcontractor’s invoice. Such voluntary programs allow prime contractors with multi-year contracts for Construction to be paid interest on the payments to their subcontractors, pending payment of the prime invoice.
5. Collect Bid Data and Pricing Information for Subcontractor Quotations
Collecting bid data on all subcontractor quotes received on larger projects is currently a requirement under federal DBE regulations. This practice can potentially provide a wealth of information, not only for pricing of state projects, but also for monitoring subcontractor participation in the M/WBE program. The prices and scopes can be compared to ensure that bidders are, in fact, soliciting and contracting with subcontractors on a non-discriminatory basis, and also can address the criticism, sometimes heard from non-M/WBE primes, of whether or not M/WBEs or PBEs are inflating quotes.
DCAMM already receives bid and pricing information for filed sub-bidders, although it is not clear whether that information is being utilized in the manner envisioned above. A best practice would be to do so, and, as well, to expand the practice of collecting bid and pricing information to non-filed sub-bidders and also to filed sub-bidders’ lower-tier subcontractors.
6. Utilize Emerging Technologies
The use of technology and the availability of technology has evolved tremendously with the advent of smart phones, tablets, and other mobile technology devices. The use of technology can increase the visibility of business opportunities and communicate directly with potential contractors and vendors. Utilizing technology can also be a costs savings for state agencies and enable the advertising of contract opportunities to a larger pool of firms.

Suggested Best Practices for Race- and Gender-Conscious Contracting Programs
NERA Economic Consulting
258
7. Enhance Objective Evaluation Criteria and Scoring for Design Awards
The use of objective evaluation criteria for scoring Design contracts is a standard and well-accepted component of the Design solicitation process. Indeed, Design contracts are generally awarded based solely upon an evaluation of the submitting parties’ qualifications. The use of objective criteria ensures that the evaluation process will be transparent not only to the Design contracting community, but to the general public as well. The use of objective criteria and scoring of the criteria against the proposed scope of work minimizes subjective elements of the award process and heightens integrity in the selection process. Finally, the use of objective criteria promotes confidence in the legitimacy of the process and allows a firm that is unsuccessful in the solicitation process to have an objective evaluation of the strengths and weaknesses of their proposal.
8. Enact Mechanisms to Allow Businesses to Report Program Infractions Without Fear of Retaliation
A number of M/WBE and PBE firms told us they had experienced hindrance or harassment on the job site, been required to perform inappropriate or extra work not required of comparable non-M/WBEs, or been subject to quality, inspection, or performance standards that were not required of comparable firms. Some firms also indicated a fear of retaliation or being “black-balled” for reporting these or related discrimination complaints.
A best practice in this area is for an agency to maintain a special hotline so that individuals can report suspected cases of fraud or other abuses related to the M/WBE Programs. It is important that such reports be subject to strict confidentiality and/or anonymity requirements in order that M/WBEs and PBEs will believe they can report infractions without fear of retaliation.
B. Implement Race- and Gender-Conscious Remedies
Based upon this Study, DCAMM has a strong basis in evidence to implement a race- and gender-based contracting program. This record establishes that minorities, women, and persons of Portuguese descent in the DCAMM market area continue to experience disparities in their access to public and private sector contracts and to those factors necessary for business success, leading to an inference that discrimination is a significant cause of those disparities. Further, individual business owners recounted their experiences with discriminatory barriers to their full and fair participation in DCAMM contracting activities as well as elsewhere in the public sector in Massachusetts and economy-wide in Massachusetts. This Study provides the statistical and anecdotal evidence needed to answer in the affirmative the question of whether there is strong quantitative and qualitative evidence that establishes DCAMM’s compelling interest in remedying race and gender discrimination. There is ample evidence that affirmative intervention is needed to dismantle the vestiges of a private sector system of racial and gender exclusion. It is clear that continuing the use of M/WBE and PBE goals would clearly not be motivated by the illegitimate racial stereotypes, bias, or blatant racial politics that strict constitutional scrutiny seeks to “smoke out.” Unless it continues to take action, DCAMM will be a passive participant in a discriminatory marketplace. Moreover, as shown in Chapter VI, participation of M/WBEs in public sector contracts tends to decline dramatically in the absence of affirmative efforts for their inclusion. These results support the need for continued remedial action.

Suggested Best Practices for Race- and Gender-Conscious Contracting Programs
NERA Economic Consulting
259
In adopting any revisions to its M/WBE Program, DCAMM may wish to consider best practices implemented in other race- and gender-conscious programs to advance equity and diversity in contracting. Other race- and gender-conscious best practices include the following.
1. Increase Certification Outreach and Training
The hallmark of an exemplary M/WBE program is a rigorous certification process to ensure Program integrity. To maximize the available pool of potential M/WBEs and PBEs, outreach is a necessary and important component of a good certification process. To facilitate an increase in the available M/WBE and PBE pool, the length of time it takes to be certified should not be unreasonable, and certification documents should be streamlined. Further, public entities should strive to explain the benefits of certification to the pool of non-certified M/WBE and PBE firms, and to provide training to certification personnel in order to avoid an inconsistent interpretation and/or application of the certification requirements.
2. Continue to Set Overall Aspirational, M/WBE Goals for DCAMM Spending, and Develop and Publicize Accurate Annual Forecasts of Opportunities and Participation Levels
DCAMM may wish to consider implementing a best practice policy of developing an annual plan for projected M/WBE utilization, detail the anticipated Construction and Design contracts along with the level of M/WBE participation they will seek to achieve, and publicizing this information to the contracting community as well as the general public. Certainly, the more accurate the anticipated annual contracting requirements, the more accurate the forecast of M/WBE participation that may be projected.
3. Continue to Set Contract Specific Goals
One of the best practices that directly impacts the success of an M/WBE program is the goal setting process. Contract goals cannot simply be the rote application of overall aspirational goals. Contract goals must be based upon the availability of M/WBEs and PBEs to perform the anticipated weighted scopes of a given project’s subcontracting opportunities, as well as a public agency’s progress towards meeting its overall aspirational goals. Given that goals are based upon both subcontracting opportunities and the available pool of M/WBE and PBE firms, it is axiomatic that if there are few or no subcontracting opportunities, then no goals should be set. Each individual contract above a pre-designated dollar threshold should be evaluated and a contract specific goal established for that specific scope of work prior to issuing the solicitation. This approach should substantially reduce assertions or perceptions that contract goals are actually quotas, and should facilitate a vigorous defense of the goal setting process if challenged. Realistic and achievable goals reduce contractor frustration with achieving M/WBE and PBE participation, reduce applications for waivers, and also reduce contractors’ temptation to use fronts and other forms of pass throughs.
In order to uniformly set contract specific goals, the contract-by-contract goal setting process should be standardized across DCAMM departments. Collaboration with project managers should be encouraged as early as possible in the goal setting process. A standard best practice is to require the Compliance Office to sign off on all goals before a solicitation is advertised. This

Suggested Best Practices for Race- and Gender-Conscious Contracting Programs
NERA Economic Consulting
260
facilitates consideration of M/WBE and PBE issues and provides earlier opportunities to reduce contracting barriers for such firms.
Setting goals for “on call” or “task order” or “house doctor” contracts is often difficult because the scope of the work is not fully developed in advance. Some jurisdictions have dispensed with the requirement of an M/WBE utilization plan with specific percentages or dollar values at the time of contract award. M/WBEs listed have no guarantee of any amount of work on these types of contracts and unrealistic expectations are often created by listing the firms in utilization plans. One best practice is to set contract specific goals on each task order within the framework of an overall commitment by the prime contractor to achieve an aspirational M/WBE goal as the portfolio of task orders is assigned.
a. Count M/WBE Prime Contractors’ Own Participation Toward Meeting Contract Goals
A best practice is to allow M/WBE prime firms to count their participation towards meeting a contract goal and to count those dollars towards its overall annual goal. However, M/WBE prime participation should only count for that portion of a contract actually performed by the M/WBE prime contractor. Presently, Massachusetts counts M/WBE prime participation at 100 percent of the contract value.262 This approach is captured in the federal DBE regulations, which permits a firm to count its self-performance, minus any work subcontracted to non-certified firms.263 This approach also requires that the M/WBE prime make good faith efforts to meet the subcontracting goal.
DCAMM should also encourage the use of joint ventures and other teaming approaches at the prime level, which allows M/WBE firms to gain prime contracting experience.
b. Continue to Count Lower-Tier M/WBE Utilization
Particularly on large projects, a best practice is to count verifiable lower-tier M/WBE subcontractors towards the contract. This approach facilities a prime contractors’ ability to meet the M/WBE subcontracting goals by providing more flexibility for general contractors, subcontractors, and potentially will provide more opportunities for smaller M/WBE firms on larger projects. Additionally, counting lower-tier M/WBE participation can provide a more accurate picture of overall participation levels and minimizes the potential to undercount participation on DCAMM projects.
c. Set M/WBE Goals on Filed Sub-Bids
A best practice is to provide M/WBE and PBE firms with maximum subcontracting opportunities on DCAMM projects or DCAMM-related projects. Given the significant level of potential subcontracting opportunities encompassed by filed sub-bid scopes of work, this
262 Discussions with DCAMM staff. 263 See 49 C.F.R. § 26.55(a)(1) (“Count the entire amount of that portion of a construction contract…that is
performed by the DBE’s own forces”).

Suggested Best Practices for Race- and Gender-Conscious Contracting Programs
NERA Economic Consulting
261
approach maximizes potential opportunities for participation across all trades. Opening the door to a wide variety of potential subcontracting opportunities should promote greater substantive participation and also promote the development of M/WBE and PBE firms within the trades subject to filed sub-bidding. Finally, in attempting to redress discrimination and disparities in public contracting, DCAMM’s ability to address the issue should not be artificially limited by an exemption that insulates a significant portion of Construction contracting opportunities from the M/WBE Program and the goal setting process. This approach spreads the initiative across the entire spectrum of Construction contracting trades and requires that the filed sub-bidders make good faith efforts to meet the lower-tier subcontracting goals.
d. Establish Control Contracts
With respect to future disparity studies, a best practice is for DCAMM to let some contracts—that have been determined to have significant opportunities for M/WBE participation—without the addition of any M/WBE goals. These “control contracts” can illuminate whether M/WBEs are used or even solicited in the absence of such goals. Some courts have considered such unremediated markets data to be probative of the needs to implement M/WBE goals to level the playing field for an agency’s contracting opportunities.
4. Review Contract Award Procedures
Once goals have been set on a contract, it is critical that standards for contract award be clarified, standardized and enforced across all departments within DCAMM.
a. Scrutinize M/WBEs’ Commercially Useful Function
The federal DBE regulations provide the best practice standard that M/WBE utilization should be carefully evaluated to determine whether the firm is serving a commercially useful function. It is uniformly recognized that minority- and woman-owned firms have sometimes been used as “pass throughs” or “fronts” on public contracts subject to M/WBE goals. Commercially useful function means responsibility for the execution of a distinct element of the work of the contract and carrying out the M/WBE’s responsibilities by actually performing, managing, and supervising the work involved, or fulfilling its responsibilities as a joint venture partner. Accordingly, the best practice is to review the proposed M/WBE subcontractor’s role on the project and confirm that the role meets the definition of a commercially useful function. It should be noted that the setting of contract goals based upon clear scopes of work and well-defined subcontracting opportunities should reduce the incentives to claim credit for work that does not, in fact, have a commercially useful function.
b. Standardize and Disseminate Good Faith Efforts Policies and Procedures
Flexibility in the aspirational goal and in the availability of waivers are essential elements for a well-designed M/WBE program. The best practice is that a bidder who makes legitimate good faith efforts will be treated just the same as one who meets the goals. To do otherwise—that is, to mandate meeting a defined goal regardless of the circumstances—may be held to be an impermissible race- and gender-based quota. Non-M/WBEs must be afforded reasonable

Suggested Best Practices for Race- and Gender-Conscious Contracting Programs
NERA Economic Consulting
262
opportunity to apply for a waiver, and accurate information about the waiver standards and process should be fully disseminated. The agency’s staff should be adequately trained on the evaluation of waivers and should be empowered to grant a waiver if the circumstances justify the decision.
Given that apparent low bid construction firms take bids up to the very last minute, a best practice is also to provide some flexibility for those solicitations, consistent with industry standards. Perhaps a very short window could be considered so that bidders can correct strictly clerical errors in the computation of the percentages or dollar values committed to M/WBE firms in their utilization plans for M/WBE firms. The goal of this approach is to avoid disqualification of a low bidder simply because of a clerical error in the M/WBE participation schedules.
c. Develop Standard Contractual Terms and Conditions for Program Enforcement
A best practice is to make sure that the contracting community understands that M/WBE Program requirements are not optional and that contract language for the M/WBE program is clear and concise. The contractual requirements for the M/WBE Program should be uniform across DCAMM departments, including any contract language that allows for the imposition of liquidated damages. Any failure to enforce contract sanctions for default, up to and including termination, when a contractor has violated the contract terms, conditions and applicable regulations with respect to M/WBEs, can undermine the legitimacy of an M/WBE Program, not only to the M/WBE and PBE community, but to the non-M/WBE community as well.
5. Monitor Contract Performance
Adequate staffing and authority to properly monitor prime contractor (and potentially filed sub-bidder) compliance with the M/WBE commitments, once awarded, is critical. The best practice is to provide M/WBEs and other subcontractors with transparency in the contracting process and access to information such as when the prime contractor receives the notice to proceed, subcontractor utilization, and when progress payments have been made. Addressing potential compliance issues are most effective when they are done in real time, since this helps to avoid situations the contracting agency learns of non-compliance with the M/WBE goals only after the project is complete. Depending upon the size of the agency, many compliance officers are too overwhelmed to conduct thorough ongoing compliance audits, and contract closeout is very late in the process to determine that a prime contractor has failed to utilize M/WBEs or that firms have not been paid. Some jurisdictions have relied as a best practice upon the project management staff to augment contract compliance monitoring. Another approach adopted by an increasing number of jurisdictions is the implementation of a comprehensive electronic data tracking and monitoring system.
Another best practice under this topic is to not permit a prime contractor to substitute those M/WBEs listed in the original compliance documents, even with another certified M/WBE, without prior written approval of both the project manager and the Compliance Office. Substitutions of M/WBE subcontractors should be permitted only under limited circumstances, such as the refusal by the subcontractor to honor the bid or proposal price, or demonstrated inability to perform the work. As a component of the M/WBE Program, the decision making
Suggested Best Practices for Race- and Gender-Conscious Contracting Programs
NERA Economic Consulting
263
process for the consideration of the prime contractor’s proposed substitution on a project should be administered in such a manner as to make the decision as timely as possible.
6. Enhance Program Administration
Continued training of Compliance personnel involved in capital facility and public building projects in DCAMM contracting procedures and the intricacies of the M/WBE program is also a best practice that will enhance consistency in the implementation of the Program across departments. Further, SDO should continue its certification responsibilities for the M/WBE and DBE Programs, as well as its collaboration with the Commissioner of DCAMM in assessing the M/WBE Program’s effectiveness.
7. Mentor-Protégé Program
Mentor Protégé programs can further the development of M/WBE firms by assisting them in growing and building the capacity of their firms. Mentor Protégé programs also have the potential for assisting M/WBE firms to move into non-traditional areas of work and compete in the private market. Following the federal DBE guidelines264 and other successful initiatives, provides another tool for fostering the development and growth of M/WBE firms. In an effort to encourage theses type of relationships, prime contractors for Construction and Design projects have been provided incentives, such as providing credit towards meeting contract goals, for participation in such a program.
8. Develop Performance Measures for Program Success
Another best practice of an M/WBE program is to regularly and consistently measure program performance. Achievement of the numerical diversity goal should not be the only measure of program success. Qualitative and quantitative performance measures for certified firms and overall program success should be utilized in evaluating or setting benchmarks for the M/WBE Program. Possible benchmarks are the achievement of business development plans similar to those used in the U.S. Small Business Administration’s 8(a) Program, including revenue targets for certified firms; increased amounts of prime contracting by M/WBEs; and increased graduation rates for M/WBEs. It is also important to learn about programmatic strengths and weaknesses, and to track progress towards DCAMM’s M/WBE policy goals and objectives.
9. Retainage
Another best practice is to release retainage to subcontractors prior to final completion of a multi-year project. The federal DBE rules permit an agency to release retainage on prime work that has been accepted by the agency and to require a contract clause obliging the prime contractor to pay all retainage owed to subcontractors for satisfactory completion of accepted work within 30 days after payment to the prime contractor.265 The release of retainage to subcontractors on work performed early in the project, i.e. site work and utility lines, can have a
264 49 C.F. R. Part 26, Appendix D, “Mentor-Protégé” Program Guidelines. 265 49 C.F. R. Part 26.29.

Suggested Best Practices for Race- and Gender-Conscious Contracting Programs
NERA Economic Consulting
264
significant positive impact upon the ability of M/WBEs, PBEs, and other small business enterprises to do business on Construction projects with DCAMM.
10. Periodically Review the Program
DCAMM may wish to consider adopting the best practice that the M/WBE Program be reviewed every five years, and that only if there is strong evidence of discrimination should it be continued. The Program’s goals and operations should also be evaluated to ensure that they remain narrowly tailored to current evidence. Also, the Commonwealth may wish to consider enacting a sunset date for the M/WBE law, which provides that the Program will end unless current evidence is provided and the law is subsequently reauthorized.

References
NERA Economic Consulting
265
References
Acs, Z. and D. Evans (1994), “The determinants of variations in self-employment rates across countries and over time,” Working Paper.
Alba-Ramirez, A. (1994), “Self-employment in the midst of unemployment; the case of Spain and the United States,” Applied Economics, 2, 189-204.
Arai, A. B. (1997), “The road not taken, the transition from unemployment to self-employment in Canada, 1961-1994,” Canadian Journal of Sociology, 22, Summer, 365-382.
Areeda, P., L. Kaplow and A. Edlin (2004), Antitrust Analysis: Problems, Text, Cases, New York: Aspen Publishers, 6th ed.
Aronson, R. L. (1991), Self-employment, Ithaca, NY: ILR Press.
Bates, T. (1973), Black capitalism, a quantitative analysis, New York, Praeger.
Bates, T. (1989), “The changing nature of minority business, a comparative analysis of Asian, non-minority, and black-owned businesses,” The Review of Black Political Economy, 25-42.
Bates, T. (1991a), “Discrimination and the capacity of Chicago metropolitan area minority and women-owned businesses,” Report to the City of Chicago Department of Law.
Bates, T. (1991b), “Commercial bank financing of white- and black-owned small business startups,” Quarterly Review of Economics and Business, 31(1), 64-80.
Bates, T. (1993), “Banking on black enterprise, the potential of emerging firms for revitalizing urban economies,” Washington, DC, Joint Center for Political and Economic Studies.
Bauer, P. W. and B. A. Cromwell (1994), “A Monte Carlo examination of bias tests in mortgage lending,” Federal Reserve Bank of Cleveland Economic Review, 30(3), 27-40.
Becker, G. S. (1957), The economics of discrimination, University of Chicago Press, Chicago, Illinois.
Bernhardt, I. (1994), “Comparative advantage in self-employment and paid work,” Canadian Journal of Economics, May, 273-289.
Black, J., D. de Meza and D. Jeffreys (1996), “House price, the supply of collateral and the enterprise economy,” The Economic Journal, 106(434), January, 60-75.
Blanchflower, D. G. (2000), “Self-employment in OECD countries,” Labour Economics, 7, September, 471-505.
Blanchflower, D. G. (2009), “Minority self-employment in the United States and the impact of affirmative action programs,” Annals of Finance, (5)3-4, 361-396.

References
NERA Economic Consulting
266
Blanchflower, D. G., P. Levine and D. Zimmerman (2003), “Discrimination In The Small Business Credit Market,” Review of Economics and Statistics, 85(4), 930-943.
Blanchflower, D. G. and B. Meyer (1994), “A longitudinal analysis of the young self-employed in Australia and the United States,” Small Business Economics, 6, 1-20.
Blanchflower, D. G. and A. J. Oswald (1990), “Self-employment and the enterprise culture,” British Social Attitudes: The 1990 Report, edited by R. Jowell, S. Witherspoon and L. Brook, Aldershot: Gower.
Blanchflower, D. G. and A. J. Oswald (1998), “What makes an entrepreneur?,” Journal of Labor Economics, 16(1), January, 26-60.
Blanchflower, D. G. and A. J. Oswald (2008), “What makes a young entrepreneur?,” International Handbook on Youth and Young Adulthood, edited by Andy Furlong, in the Routledge International Handbook series.
Blanchflower, D. G., A. J. Oswald and A. Stutzer (2001), “Latent entrepreneurship across nations,” European Economic Review, 45, no. 4-6, May, 680-691.
Blanchflower, D. G. and C. Shadforth (2007), “Entrepreneurship in the UK,” Foundations and Trends in Entrepreneurship, 3(4), 257-364.
Blanchflower, D. G. and J. S. Wainwright (2005), “An Analysis of the Impact of Affirmative Action Programs on Self-Employment in the Construction Industry,” National Bureau of Economic Research Working Paper Series, #11793, November.
Blau, D. (1987), “A time-series analysis of self-employment in the United States,” Journal of Political Economy, 95, 445-467.
Bogenhold, D. and U. Staber (1991), “The decline and rise of self-employment,” Employment and Society, 5, 223-239.
Borjas, G. J. and S. Bronars (1989), “Consumer discrimination and self-employment,” Journal of Political Economy, 97, 581-605.
Bourdon, C. C. and R. E. Levitt (1980), Union and open-shop construction, compensation, work practices, and labor markets, Lexington, MA: Lexington Books.
Broussard, N., R. Chami and G. Hess (2003), “(Why) do self-employed parents have more children?,” Working Paper, September.
Browne, L. E. and G. M. B. Tootell (1995), “Mortgage Lending in Boston-A Response to the Critics,” New England Economic Review, September-October, 53-78.
Cagetti, M. and M. DeNardi (2006), “Entrepreneurship, frictions and wealth,” Journal of Political Economy, 114(5), 835-70.

References
NERA Economic Consulting
267
Cavalluzzo, K. S. and L. C. Cavalluzzo (1998), “Market structure and discrimination, the case of small businesses,” Journal of Money, Credit, and Banking, 30(4), November, 771-792.
Cavalluzzo, K. S., L. C. Cavalluzzo and J. Wolken (2002), “Competition, small business financing, and discrimination, evidence from a new survey,” The Journal of Business, 75(4), 641-681.
Cloud, C. and G. Galster (1993), “What do we know about racial discrimination in mortgage markets,” Review of Black Political Economy, 22(1), Summer, 101-120.
Coate, S. and S. Tennyson (1992), “Labor market discrimination, imperfect information and self-employment,” Oxford Economic Papers, 44, 272-288.
Cole, R. A. (1998), “Availability of credit to small and minority-owned businesses, evidence from the 1993 National Survey of Small Business Finances,” unpublished manuscript, Employment Policies Institute, Washington, DC, April 13.
Cowling, M. and P. Mitchell (1997), “The evolution of UK self-employment, A study of government policy and the role of the macroeconomy,” Manchester School of Economic and Social Studies, 65, no. 4, September, 427-442.
Day, T. S. and S. J. Liebowitz (1998), “Mortgage lending to minorities, where’s the bias?,” Economic Inquiry, XXXVI, January, 3-28.
DeGroot, M.H., Fienberg, S.E., and J. B. Kadane (1994), Statistics and the Law, New York, John Wiley & Sons, Inc.
DeWit, G. and F. A. Van Winden (1990), “An empirical analysis of self-employment in the Netherlands,” Economics Letters, 32, 97-100.
Dunn, T. A. and D. J. Holtz-Eakin (2000), “Financial capital, human capital, and the transition to self-employment: evidence from intergenerational links,” Journal of Labor Economics, 18 (2) 282-305.
Eccles, R. G. (1981), “Bureaucratic versus craft administration: The relationship of market structure to the construction firm,” Administrative Science Quarterly, 26, 449-469.
Enchautegui, M. E., M. Fix, P. Loprest, S. von der Lippe and D. Wissoker (1996), Do minority-owned businesses get a fair share of government contracts?, Washington, DC: The Urban Institute.
Evans, D. and B. Jovanovic (1989), “An estimated model of entrepreneurial choice under liquidity constraints,” Journal of Political Economy, 97, 808-827.
Evans, D. and L. Leighton (1989), “Some empirical aspects of entrepreneurship,” American Economic Review, 79, 519-535.

References
NERA Economic Consulting
268
Executive Office of the President, Office of Management and Budget (2012), North American Industrial Classification System: United States, 2012, Lanham, MD: Bernan.
Fairlie, R. W. (1999), “The absence of the African American owned business, an analysis of the dynamics of self-employment,” Journal of Labor Economics, 17(1), 80-108.
Fairlie, R. W. (2006), “Entrepreneurship among Disadvantaged Groups: An Analysis of the Dynamics of Self-Employment by Gender, Race and Education,” Handbook of Entrepreneurship, Volume 2, eds. Simon C. Parker, Zoltan J. Acs and David R. Audretsch, New York: Springer Verlag.
Fairlie R. W. and B. D. Meyer (1996), “Ethnic and Racial Self-Employment Differences and Possible Explanations,” Journal of Human Resources, 31(4), 757-793.
Fairlie R. W. and B. D. Meyer (1998), “Does immigration hurt Black self-employment?,” Help or Hindrance? The Economic Implications of Immigration for Blacks, edited by D. S. Hamermesh and F. D. Bean, New York, Russell Sage Foundation.
Fairlie R. W. and B. D. Meyer (2003), “The effect of immigration on native self-employment,” Journal of Labor Economics, 21(3), 619-650.
Fairlie, R .W. and B. D. Meyer (2000), “Trends in self-employment among white and black men during the twentieth century,” Journal of Human Resources, XXXV(4), 643-669.
Fairlie, R. W. and H. A. Krashinsky (2006), “Liquidity constraints, household wealth and entrepreneurship revisited,” Working Paper, University of California, Santa Cruz.
Fairlie, R. W. and A. Robb (2007a), “Why are black-owned businesses less successful than white-owned businesses? The role of families, inheritances, and business human capital,” Journal of Labor Economics, 25(2), 289-323.
Fairlie, R. W. and A. Robb (2007b), “Families, human capital, and small business: evidence from the Characteristics of Business Owners Survey,” Industrial and Labor Relations Review, 60(2), 225-245.
Ferri, G. and P. Simon (1997), “Constrained consumer lending, exploring business cycle patterns using the Survey of Consumer Finances,” Working Paper, Princeton University.
Foti, A. and M. Vivarelli (1994), “An econometric test of the self-employment model - the case of Italy,” Small Business Economics, 6, no. 2, April, 81-93.
Fuchs, V. (1982), “Self-employment and labor force participation of older males,” Journal of Human Resources, 17, Fall, 339-357.
Gould, F. E. (1980), “Investigation in construction entrepreneurship,” Masters Thesis, MIT, May.

References
NERA Economic Consulting
269
Greene, W. H. (1997), Econometric Analysis, Third Edition, New Jersey, Prentice-Hall, 926-931.
Haggerty, C., K. Grigorian, R. Harter and J. D. Wolken (2000), “The 1998 Survey of Small Business Finances: Sampling and Level of Effort Associated with Gaining Cooperation from Minority-Owned Businesses,” Proceedings of the Second International Conference on Establishment Surveys, Buffalo, NY, June 17-21.
Hall, R. E. and F. Mishkin (1982), “The sensitivity of consumption to transitory income, estimates from panel data on households,” Econometrica, 50(2), 461-81.
Hamilton, D., A. Austin, and W. Darity Jr., “Whiter Jobs, Higher Wages, Occupational Segregation and the Lower Wages of Black Men,” Economic Policy Institute Working Paper No. 28, February 28, 2011, http://s1.epi.org/files/page/-/BriefingPaper288.pdf.
Harrison, G. W. (1998), “Mortgage lending in Boston, a reconsideration of the evidence,” Economic Inquiry, XXXVI, January, 29-38.
Hayashi, F. (1985), “The effect of liquidity constraints on consumption, a cross-sectional analysis,” Quarterly Journal of Economics, 100(1), February, 183-206.
Heckman, J. J. (1998), “Detecting discrimination,” Journal of Economic Perspectives, 12(2), Spring, 101-116.
Holmes T. J. and J. A. Schmitz (1990), “A theory of entrepreneurship and its application to the study of business transfers,” Journal of Political Economy, 89, 265-294.
Holtz-Eakin, D., D. Joulfaian and R. S. Harvey (1994a), “Entrepreneurial decisions and liquidity constraints,” Journal of Political Economy, 102, 53-75.
Holtz-Eakin, D., D. Joulfaian and R. S. Harvey (1994b), “Sticking it out, entrepreneurial survival and liquidity constraints,” Rand Journal of Economics, 25(2), Summer, 334-347.
Horne, D. (1994), “Evaluating the role of race in mortgage lending,” FDIC Banking Review, 7(1), Spring/Summer, 1-15.
Hout, M. and H. Rosen (2000), “Self-Employment, family background, and race,” Journal of Human Resources, 35, no. 4, Fall, 670-92.
Hurst, E. and A. Lusardi (2004), “Liquidity Constraints, Household Wealth, and Entrepreneurship,” Journal of Political Economy, Vol. 112(2), April, 319-347.
Jappelli, J. (1990), “Who is credit constrained in the U.S. economy?,” Quarterly Journal of Economics, 105(1), February, 219-234.
Kanbur, S. M. R. (1990), “Entrepreneurial risk taking, inequality, and public policy, an application of inequality decomposition analysis to the general equilibrium effects of progressive taxation,” Journal of Political Economy, 90, 1-21.

References
NERA Economic Consulting
270
Kidd, M. (1993), “Immigrant wage differentials and the role of self-employment in Australia,” Australian Economic Papers, 32, no. 60, June, 92-115.
Kihlstrom, R. E. and J. J. Laffont (1979), “A general equilibrium entrepreneurial theory of firm formation based on risk aversion,” Journal of Political Economy, 87, 719-848.
Kuhn, P. J. and H. J. Schuetze (1998), “The dynamics of self-employment in Canada,” Working Paper, McMaster University.
La Noue, G. (2006), “Remarks of George LaNoue,” in Disparity Studies as Evidence of Discrimination in Federal Contracting, U.S. Commission on Civil Rights, Washington, DC.
Ladd, H. F. (1998), “Evidence on discrimination in mortgage lending,” Journal of Economic Perspectives, 12(2), Spring, 41-62.
Laferrere, A. and P. McEntee (1995), “Self-employment and intergenerational transfers of physical and human capital, an empirical analysis of French data,” Economic and Social Review, 27, no. 1, October, 43-54.
Lentz, B. F. and D. N. Laband (1990), “Entrepreneurial success and occupational inheritance among proprietors,” Canadian Journal of Economics, 23, 563-579.
Lindh, T. and H. Ohlsson (1996), “Self-employment and windfall gains, Evidence from the Swedish lottery,” Economic Journal, 106(439), November, 1515-1526.
Long, J. E. (1982), “The income tax and self-employment,” National Tax Journal, 35, March, 31-42.
Mach, T. L. and J. D. Wolken (2006), “Financial services used by small businesses: evidence from the 2003 Survey of Small Business Finances,” Federal Reserve Bulletin, October 2006.
Maddala, G. S. (1983). Limited Dependent and Qualitative Variables in Econometrics, Cambridge: Cambridge University Press.
Meager, N. (1992), “Does unemployment lead to self-employment?,” Small Business Economics, 4, 87-103.
Mora, M. T. and A. Dávila (2006), “Mexican immigrant self-employment along the U.S.-Mexico border: an analysis of 2000 Census data,” Social Science Quarterly, 87(1), 91-109.
Munnell, A., G. M. B. Tootell, L. E. Browne and J. McEneaney (1996), “Mortgage lending in Boston, interpreting HMDA data,” American Economic Review, March, 86(1), 25-53.
Myrdal, G. (1944), An American dilemma, the Negro problem and modern democracy, Volume 1, New York, Harper & Row.
NERA Economic Consulting (2010). Race, Sex, and Business Enterprise: Evidence from the Commonwealth of Massachusetts: Volume II.

References
NERA Economic Consulting
271
National Opinion Research Center (2005), “The 2003 Survey of Small Business Finances Methodology Report,” mimeo, http://www.federalreserve.gov/pubs/oss/oss3/ssbf03/ssbf03home.html#ssbf03results.
Oaxaca, R. L. (1973), “Male-female wage differences in urban labor markets,” International Economic Review, 14(3), October, 693-709.
Olson, P. D., V. S. Zuiker and C. P. Montalto (2000), “Self-employed Hispanics and Hispanic wage earners: differences in earnings,” Hispanic Journal of Behavioral Sciences, 22, 114-130.
Parker, S. C. (2004), The Economics of Self-Employment and Entrepreneurship, Cambridge: Cambridge University Press.
Pickles, A. R. and P. N. O’Farrell (1987), “An analysis of entrepreneurial behavior from male work histories,” Regional Studies, 21, 425-444.
Pitts, S. (2007), “Bad Jobs: the Overlooked Crisis in the Black Community,” New Labor Forum, 16, no. 1, 39-47 (Winter).
Quinn, J. F. (1980), “Labor force participation patterns of older self-employed workers,” Social Security Bulletin, 43, 17-28.
Reardon, E. (1998), “Are the self-employed misfits or superstars?,” Working Paper, Rand Corporation.
Rees, H. and A. Shah (1986), “An empirical analysis of self-employment in the UK,” Journal of Applied Econometrics, 1, 95-108.
Robb, A. (2012), “Access to Capital among Young Firms, Minority-owned Firms, Women-owned Firms, and High-tech Firms,” for SBA Office of Advocacy, April.
Robb, A. (2010), “Beyond the Late, Lamented Survey of Small Business Finances,” Newsletter of the Association of Public Data Users, 33, no. 2, March/April.
Robles, B. J. and H. Cordero-Guzmán (2007), “Latino self-employment and entrepreneurship in the United States: an overview of the literature and data sources,” The Annals of the American Academy of Political and Social Science, 613, 18-31.
Robson, M. T. (1998a), “The rise in self-employment amongst UK males,” Small Business Economics, 10, no. 3, 199-212.
Robson, M. T. (1998b), “Self-employment in the UK regions,” Applied Economics, 30, no. 3, March, 313-322.
Ruetschlin, C. and D. Asante-Muhammad (2015), The Retail Race Divide: How the Retail Industry Is Perpetuating Racial Inequality in the 21st Century, www.demos.org.

References
NERA Economic Consulting
272
Schuetze, H. J. (1998), “Taxes, economic conditions and recent trends in male self-employment: a Canada-U.S. comparison,” Working Paper, McMaster University, Hamilton, Ontario, Canada.
Taylor, M. P. (1996), “Earnings, independence or unemployment; why become self-employed?,” Oxford Bulletin of Economics and Statistics, 58, 2, 253-265.
Tootell, G. M. B. (1996), “Turning a critical eye on the critics,” Mortgage lending, racial discrimination and federal policy, edited by J. Goering and R. Wienk, Urban Institute Press, Washington, DC.
U.S. Chamber of Commerce (2005), Access to capital, what funding sources work for you?, U.S. Chamber of Commerce, Washington, DC.
U.S. Census Bureau (2013), “American Community Survey Information Guide,” U.S. Department of Commerce, Washington, DC.
Yezer, M. J., R. F. Phillips and R. P. Trost (1994), “Bias in estimates of discrimination and default in mortgage lending; the effects of simultaneity and self-selection,” Journal of Real Estate Finance and Economics, 9(3), 196-215.
Wainwright, J. and C. Holt (2010), Guidelines for Conducting a Disparity and Availability Study for the Federal DBE Program, Transportation Research Board of the National Academies, NCHRP Report, Issue No. 644.
Wainwright, J. (2012), Report of Defendant Intervenor’s Expert in Geyer Signal, Inc. and Kevin Kissell v. Minnesota Department of Transportation, Thomas K. Sorel in his capacity as the Minnesota Commissioner of Transportation, and Mary Prescott in her capacity as Acting Director of the Office of Civil Rights, United States District Court for the District of Minnesota, Case No. 0:11-cv-00321-JRT, December 30.
Wainwright, J. S. (2010), Report of Defendant’s Expert in Kevcon, Inc. v. The United States, No. 09 625, United States Court of Federal Claims, April 29.
Wainwright, J. S. (2008), “Discrimination Facing Small Minority-Owned and Women-Owned Businesses in Commercial Credit Markets,” Testimony before the United States Senate, Committee on Small Business and Entrepreneurship, Hearing on “Business Start-up Hurdles in Underserved Communities: Access to Venture Capital and Entrepreneurship Training,” September 11.
Wainwright, J. S. (2000), Racial discrimination and minority business enterprise, evidence from the 1990 Census, Studies in Entrepreneurship Series, edited by S. Bruchey, New York, Garland Publishing.

Appendix A. Glossary
NERA Economic Consulting
273
Appendix A. Glossary
ACS. The American Community Survey. The Census Bureau’s ACS is an ongoing survey covering the same type of information collected in the decennial census. The ACS is sent to more than 3.5 million addresses annually, including housing units in all counties in the 50 states and the District of Columbia.
African American: African American or “Black” refers to an individual having origins in any of the Black racial groups of Africa.
Aggregation, aggregated: Refers to the practice of combining smaller groups into larger groups. In the present context, this term is typically used in reference to the presentation of utilization, availability, or related statistics according to industry. For example, statistics presented for the “Construction” sector as a whole are more aggregated than separate statistics for “Building Construction,” “Heavy Construction,” and “Special Trades Construction” industries. See also “Disaggregation, disaggregated.”
Anecdotal evidence: Qualitative data regarding business owners’ accounts of experiences with disparate treatment and other barriers to business success.
Asian: Refers to an individual having origins in the Far East, Southeast Asia or the Indian subcontinent.
Asian/Pacific Islander: Refers to an individual having origins in the Far East, Southeast Asia, the Indian subcontinent, or the Pacific Islanders (except Native Hawaiians).
Availability: A term of art in disparity studies that refers to the percentage of a given population of businesses owned by one or more groups of interest. See also “Utilization,” “Disparity Ratio.”
Baseline Business Universe: The underlying population of business establishments that is used in an availability analysis. It is used as the denominator in an M/WBE availability measure.
Black: Or “African American” refers to an individual having origins in any of the Black racial groups of Africa.
Capacity: This term has no single definition. See Chapter III for discussion of this concept and its role in disparity studies.
Constitutional significance or substantive significance: An indication of how large or small a given disparity is. Under the EEOC’s “four-fifths” rule, a disparity ratio is substantively significant if it is 0.8 or less on a scale of 0 to 1 or 80 or less on a scale of 1 to 100.
Decennial: Refers to the census conducted every decade by the U.S. Census Bureau. The last decennial census was conducted in 2010.

Appendix A. Glossary
NERA Economic Consulting
274
Demand-side: Refers to activity on the demand-side of an economic market. For example, when public agencies hire contractors or vendors they are creating market demand. See also “Supply-side.”
Dependent variable: In a regression analysis, a variable whose value is postulated to be influenced by one or more other “independent” or “exogenous” or “explanatory” variables. For example, in business owner earnings regressions, business owner earnings is the dependent variable, and other variables, such as industry, geographic location, or age, are the explanatory variables. See also “Independent variable,” “Exogenous variable.”
Disaggregation, disaggregated: Refers to the practice of splitting larger groups into smaller groups. In the present context, this term is typically used in reference to the presentation of utilization, availability, or related statistics according to industry. For example, statistics presented for “Building Construction,” “Heavy Construction,” and “Special Trades Construction” industries are more disaggregated than statistics for the “Construction” sector as a whole.
Disparate impact: A synonym for “disparity,” often used in the employment discrimination litigation context. A disparate impact occurs when a “good” outcome for a given group occurs significantly less often than expected given that group’s relative size, or when a “bad” outcome occurs significantly more often than expected.
Disparity ratio (or Disparity index): A measure derived from dividing utilization by availability and multiplying the result by 100. A disparity ratio of less than 100 indicates that utilization is less than availability. A disparity ratio of 80 or less can be taken as evidence of disparate impact. See also “Availability,” “Constitutional significance,” “Utilization.”
Distribution. A set of numbers and their frequency of occurrence collected from measurements over a statistical population.
Econometrics, econometrically: Econometrics is the field of economics that concerns itself with the application of statistical inference to the empirical measurement of relationships postulated by economic theory. See also “Regression.”
Endogenous variable: A variable that is correlated with the residual in a regression analysis or equation. Endogenous variables should not be used in statistical tests for the presence of disparities. See also “Exogenous variable.”
Exogenous variable: A variable that is uncorrelated with the residual in a regression analysis or equation. Exogenous variables are appropriate for use in statistical tests for the presence of disparities. See also “Endogenous variable,” “Independent variable,” “Dependent variable.”
First-tier subcontractors: Subcontractors or suppliers hired directly by the prime contractor.
Hispanic: Refers to an individual of Mexican, Puerto Rican, Cuban, Central or South American or other Spanish culture or origin, regardless of race.

Appendix A. Glossary
NERA Economic Consulting
275
Independent variable: In a regression analysis, one or more variables that are postulated to influence or explain the value of another, “dependent” variable. For example, in business owner earnings regressions, business owner earnings is the dependent variable, and other variables, such as industry, geographic location, or age, are the independent or explanatory variables. See also “Dependent variable,” “Exogenous variable.”
MBE: Minority-Owned Business Enterprise. A business establishment that is 51 percent or more owned and controlled by racial or ethnic minorities (i.e., African Americans, Hispanics, Asians/Pacific Islanders or Native Americans).
Mean: A term of art in statistics, synonymous in this context with the arithmetic average. For example, the mean value of the series 1, 1, 2, 2, 2, 4, 5 is 2.43. This is derived by calculating the sum of all the values in the series (i.e., 17) and dividing that sum by the number of elements in the series (i.e., 7).
Median: A term of art in statistics, meaning the middle value of a series of numbers. For example, the median value of the series 1, 1, 2, 2, 2, 4, 5 is 2.
Microdata or micro-level data: Quantitative data rendered at the level of the individual person or business, as opposed to data rendered for groups or aggregates of individuals or businesses. For example, Dun and Bradstreet provides micro-level data on business establishments. The Census Bureau’s Survey of Business Owners, provides grouped or aggregated data on businesses.
Misclassification: In the present context, this term refers to a situation when a listing or directory of minority-owned or women-owned firms has incorrectly classified a firm’s race or gender status. For example, when a firm listed as Hispanic-owned is actually African American-owned, or when a firm listed as nonminority female-owned is actually nonminority male-owned. See also “Nonclassification.”
MSA: Metropolitan Statistical Area. As defined by the Federal Office of Management and Budget, contains at least one urbanized area that has a total population of 50,000 or more, plus adjacent territory that has a high degree of social and economic integration with the core as measured by commuting ties.
M/WBE: Minority and/or Women-Owned Business Enterprise. A business establishment that is 51 percent or more owned and controlled by racial or ethnic minorities (i.e., African Americans, Hispanics, Asians/Pacific Islanders or Native Americans) or women.
NAICS: North American Industry Classification System. The standard system for classifying industry-based data in the U.S. Superseded the Standard Industrial Classification (SIC) System in 1997. See also “SIC.”
Nonclassification: In the present context, this term refers to a type of misclassification when a listing or directory has not identified firms as minority-owned or women-owned when, in fact, they are. See also “Misclassification.”

Appendix A. Glossary
NERA Economic Consulting
276
NSSBF or SSBF. The Survey of Small Business Finances, formerly the National Survey of Small Business Finances, was produced jointly by the Federal Reserve Board and the U.S. Small Business Administration to provide a periodic statistical picture of small business finances. The SSBF was discontinued after 2003.
Native American: Refers to an individual having origins in any of the original peoples of North America, including Native Hawaiians.
Nonminority: Firms that are not M/WBEs, i.e., not owned by African Americans, Hispanics, Asians/Pacific Islanders, Native Americans or nonminority females.
PBE: Portuguese-Owned Business Enterprise. A business establishment that is 51 percent or more owned and controlled by persons of Portuguese ancestry. For this study, PBEs were sub-divided into two groups: those with ancestry via Portugal and those with ancestry via Brazil.
PUMS: Public Use Microdata Sample. Both the decennial census and the American Community Survey publish PUMS products.
p-value: A standard measure used to represent the level of statistical significance. It states the numerical probability that the stated relationship is due to chance alone. For example, a p-value of 0.05 or 5 percent indicates that the chance a given statistical difference is due purely to chance is 1-in-20. See also “Statistical Significance.”
Regression, multiple regression, multivariate regression: A type of statistical analysis which examines the correlation between two variables (“regression”) or three or more variables (“multiple regression” or “multivariate regression”) in a mathematical model by determining the line of best fit through a series of data points. Econometric research typically employs regression analysis. See also “Econometrics.”
NEAST: Refers to the Northeast census region in the NSSBF and SSBF data sets. The NEAST includes the states of Massachusetts, Connecticut, Maine, New Hampshire, Rhode Island, Vermont, New Jersey, New York, and Pennsylvania.
SBO: The Census Bureau’s Survey of Business Owners statistical data series is devoted to capturing statistical information on the nation’s minority-owned and women-owned business enterprises. Part of the five-year Economic Census series.
Setaside, setasides: A contracting practice where certain contracts or classes of contracts are reserved for competitive bidding exclusively among a given subset of contractors, for example minority-owned and women-owned contractors.
SFY: State Fiscal Year. The Commonwealth of Massachusetts’ Fiscal Year runs from July 1 through June 30.
Statistical significance: A statistical outcome or result that is unlikely to have occurred as the result of random chance alone. The greater the statistical significance, the smaller the probability that it resulted from random chance alone. See also “p-value.”

Appendix A. Glossary
NERA Economic Consulting
277
SSBF. See NSSBF.
Stratified: In the present context, this refers to a statistical practice where random samples are drawn within different categories or “strata” such as time period, industry sector, or M/WBE status.
Substantive significance or constitutional significance: An indication of how large or small a given disparity is. Under the EEOC’s “four-fifths” rule, a disparity ratio is substantively significant if it is 0.8 or less on a scale of 0 to 1.
Supply-side: Refers to activity on the supply-side of an economic market. For example, when new businesses are formed, other things equal, the supply of contractors to the market is increased. See also “Demand-side.”
t-test, t-statistic, t-distribution: Often employed in disparity studies to determine the statistical significance of a particular disparity statistic. A t-test is a statistical hypothesis test based on a test statistic whose sampling distribution is a t-distribution. Various t-tests, strictly speaking, are aimed at testing hypotheses about populations with normal probability distributions. However, statistical research has shown that t-tests often provide quite adequate results for non-normally distributed populations as well.
Two-tailed (or two-sided) statistical test: A “two-tailed” test means that one is testing the hypothesis that two values, say u (utilization) and a (availability), are equal against the alternate hypothesis that u is not equal to a. In contrast, a one-sided test means that you are testing the hypothesis that u and a are equal against the alternate hypothesis u is not equal to a in only one direction. That is, that it is either larger than a or smaller than a.
Utilization: A term of art in disparity studies that refers to the percentage of a given amount of contracting and/or procurement dollars that is awarded or paid to businesses owned by one or more groups of interest. See also “Availability,” “Disparity Ratio.”
WBE: Women-Owned Business Enterprise: A business establishment that is 51 percent or more owned and controlled by nonminority women. In this Study, unless otherwise indicated, WBE refers to nonminority women-owned firms.

Appendix A. Glossary
NERA Economic Consulting
278
This page intentionally left blank.

Appendix B. Legal Standards for Government Race- and Gender-Conscious Contracting Programs
NERA Economic Consulting
279
Appendix B. Legal Standards for Government Race- and Gender-Conscious Contracting Programs
A. Overview of Strict Scrutiny
The applicable framework that establishes the legal standards governing race- and gender-conscious contracting programs is articulated in two seminal Supreme Court cases. In City of Richmond v. J.A. Croson Company266 and Adarand Constructors, Inc. v. Peña,267 the Supreme Court articulated that strict scrutiny would be the standard by which federal courts would review federal, state and local programs. Rather than permit generalized allegations of discrimination against minorities, the Supreme Court held that governments may adopt race-conscious programs only as a narrowly tailored remedy for a compelling interest of identified discrimination.268
1. Strict Scrutiny and City of Richmond v. J.A. Croson Company
The landmark case establishing that state and local government programs using race as a consideration must pass strict scrutiny is Croson. The strict scrutiny standard is comprised of two parts: (i) public entities must show a “compelling governmental interest” in establishing race-conscious programs,269 and (ii) such programs must be “narrowly tailored” to achieve that compelling interest.270 The strict scrutiny test calls for a “searching judicial inquiry into the justification,” to determine whether the classifications are truly remedial or rather “motivated by illegitimate notions of racial inferiority or simple racial politics.”271
The Croson Court struck down the City of Richmond’s Minority Business Enterprise Plan, which required prime contractors that were awarded city construction contracts to subcontract at least 30 percent of the project to minority-owned business enterprises (MBEs).272 The Croson Court affirmed the ruling of the U.S. Court of Appeals for the Fourth Circuit that the plan was unconstitutional, finding that the City of Richmond had not presented sufficient evidence to support its compelling interest in remedying discrimination.273
266 City of Richmond v. J.A. Croson Co., 488 U.S. 469 (1989). Justice O’Connor delivered the opinion of the Court
in Parts I, III-B and IV. Parts II, III-A and V were plurality opinions in which Justice O’Connor was joined by Chief Justice Rehnquist, and Justice White; Chief Justice Rehnquist, Justice White, and Justice Kennedy; and Chief Justice Rehnquist, Justice White, and Justice Kennedy, respectively. Justice Scalia concurred in the judgment and Justices Marshall, Brennan and Blackmun dissented. This legal discussion will refer to the entirety of O’Connor’s decision as “Croson” or the “Croson Court”.
267 Adarand Constructors, Inc. v. Pena, 515 U.S. 200 (1995) (“Adarand III”). 268 This legal analysis is not an exhaustive discussion of all the case law or issues related to Croson and its progeny
but rather highlights the major trends and status of the case law discussing the use of race- and gender-conscious measures in government contracting.
269 Croson, 488 U.S. at 485, 496-497. 270 Id. at 486, 507. 271 Id. at 493. 272 Id. at 477, 486. 273 Id. at 511.

Appendix B. Legal Standards for Government Race- and Gender-Conscious Contracting Programs
NERA Economic Consulting
280
With respect to the first prong of the strict scrutiny standard, the Croson Court emphasized that in order to establish a compelling interest, there must be “a strong basis in evidence” for the use of race-conscious measures.274 The Croson Court also stated that findings of societal discrimination would not be sufficient to meet the requirements of the Equal Protection Clause of the Fourteenth Amendment.275 The Croson Court found that there was insufficient evidence of discrimination against minority-owned subcontractors.276 The Supreme Court rejected all five of the predicate facts that the district court relied on to uphold the City of Richmond’s 30 percent quota.277
Specifically, the Croson Court reasoned that the predicate facts—the City’s declaration that the ordinance was remedial, generalized assertions of past discrimination in the construction industry, the paucity of minority contractors in state and local trade associations and Congress’ findings of the effects of past discrimination—did not singly or together provide a strong basis in evidence to justify race conscious measures. Finally, the City of Richmond’s statistical evidence showed a statistical disparity between the general population in Richmond (which was 50 percent African American) and the awards of prime contracts to African American firms (0.67 percent of the awards). The Croson Court held that this was an irrelevant statistical comparison and insufficient to raise an inference of discrimination.278 Therefore, the City had failed to establish that it had a strong basis in evidence to support a compelling interest for its use of race- conscious measures.
However, to avoid having its holding construed to categorically eliminate all race-conscious efforts, the Croson Court expressly stated that:
Nothing we say today precludes a state or local entity from taking action to rectify the effects of identified discrimination within its jurisdiction. If the city of Richmond had evidence before it that nonminority contractors were systematically excluding minority businesses from subcontracting opportunities, it could take action to end the discriminatory exclusion. Where there is a significant statistical disparity between the number of qualified minority contractors willing and able to perform a particular service and the number of such contractors actually engaged by the locality or the locality’s prime contractors, an inference of discriminatory exclusion could arise…. Moreover, evidence of a pattern of individual discriminatory acts can, if supported by appropriate statistical proof, lend support to a local government’s determination that broader remedial relief is justified.279
In suggesting what kind of evidence would support a proper statistical comparison, Justice O’Connor stated that a more relevant statistical test would compare the number of qualified
274 Id. at 500 (citing Wygant v. Jackson Board of Education, et al., 476 U.S. 267, 277 (1986)). 275 Id. at 485 (quoting Wygant, 476 U.S. at 274), 499. 276 Id. at 500. 277 Id. 278 Id. at 499–502. 279 Id. at 509.

Appendix B. Legal Standards for Government Race- and Gender-Conscious Contracting Programs
NERA Economic Consulting
281
minority contractors “willing and able to perform a particular service and the number of such contractors actually engaged by the locality or the locality’s prime contractors.” This, to the Croson Court, would support an inference of discrimination and thus satisfy the compelling interest requirement of the strict scrutiny test.280
With respect to the second prong, the Croson Court ruled that the MBE program was not narrowly tailored to remedy discrimination, as the 30 percent quota could not be “tied to any injury suffered by anyone.”281 For example, the Court pointed to the fact that the program was extended to a long list of minorities, other than African Americans, such as Hispanics, Asians, American Indians, and Eskimos and Aleuts, for which the City had not established any inference of discrimination.282 Finally, the Court pointed to Richmond’s failure to consider race-neutral means to increase MBE participation.283 In analyzing if the remedy implemented by the local or state government actor is narrowly tailored, the Supreme Court has identified several factors:
• The consideration of alternative, race-neutral means to increase M/WBE participation;284
• The flexibility of the program requirements, including the availability of waiver provisions;285
• The duration of the proposed relief;286
• The relationship of numerical participation goals to the availability of M/WBEs in the relevant market;287
• The impact of the relief on third parties;288 and
• The overinclusiveness or underinclusiveness of the racial classifications.289
280 Id. 281 Id. at 499. 282 Id. at 506. 283 Id. at 507. Croson describes a race-neutral device or measure as one that is, or can be, used to “increase the
accessibility of [government] contracting opportunities to small entrepreneurs of all races.” [Id. at 509] Examples of such measures include “Simplification of bidding procedures, relaxation of bonding requirements, and training and financial aid” [Id. at 509-510]. For purposes of this appendix, the term “race-neutral” also includes “gender-neutral.”
284 Id. at 507 (citing United States v. Paradise, 480 U.S. 149, 171 (1987)). See also Adarand Constructors, Inc. v. Pena, 515 U.S. 200, 237-238 (1995) (“Adarand III”).
285 City of Richmond v. J.A. Croson Co., 488 U.S. 469, 507-508 and Paradise, 480 U.S. at 171. See also Adarand Constructors, Inc. v. Slater, 228 F.3d 1147, 1177, 1180-1181 (10th Cir. 2000) (“Adarand VII”), cert. granted, 532 U.S. 941, dismissed as improvidently granted, 534 U.S. 103 (2001).
286 Croson, 488 U.S. at 497-498, 510-511. See also Paradise, 480 U.S. at 171. 287 Paradise, 480 U.S. at 171. See also Croson, 488 U.S. at 510. 288 Paradise, 480 U.S. at 171. See also Croson, 488 U.S. at 510-511. 289 Croson, 488 U.S. at 506.

Appendix B. Legal Standards for Government Race- and Gender-Conscious Contracting Programs
NERA Economic Consulting
282
All of the above factors should be considered when developing a race-based program to ensure that the program is sufficiently narrowly tailored under the strict scrutiny standard. Guidance from the courts relating to the above is further discussed in later sections of this Appendix.
2. Intermediate Scrutiny
Since Croson, the U.S. Supreme Court has remained silent with respect to the appropriate standard of review for WBE programs.290 Croson was limited to the review of a race-conscious government contracting program. In other contexts, however, the Supreme Court has ruled that gender-conscious classifications are not subject to the rigorous strict scrutiny standard applied to racial classifications. Instead, gender classifications are subject to a lesser “intermediate” level of scrutiny,291 requiring an “exceedingly persuasive justification” that gender-based classifications serve “important governmental objectives,” and that the means used to implement them are “substantially related to the achievement of those objectives.”292
A significant number of lower courts have therefore reviewed WBE programs using intermediate scrutiny, rather than the more exacting strict scrutiny standard of review.293 In these cases, unlike the strict scrutiny requirements for racial classifications, gender classifications are subject to “something less” than a strong basis in evidence.294 Intermediate review requires the governmental entity to demonstrate an “important governmental objective” and a method for achieving this objective that bears a fair and substantial relation to the goal.295
3. Strict Scrutiny and Adarand Constructors, Inc. v. Peña
While Croson’s holding applies to challenges to state and local government programs which classify based on race, Adarand Constructors, Inc. v. Peña held that the strict scrutiny standard
290 See H.B. Rowe Co., Inc. v. Tippett, 615 F.3d 233, 242 (4th Cir. 2010) (citing Engineering Contractors
Association of South Florida., Inc. v. Metropolitan Dade County, 122 F.3d 895, 909 (11th Cir. 1997), cert. denied, 523 U.S. 1004 (1998)).
291 United States v. Virginia, 518 U.S. 515, 570-571 (1996). 292 Id. at 532-533 (citing Mississippi University for Women v. Hogan, 458 U.S. 718, 724 (1982)). 293 See, e.g., Rowe, 615 F.3d at 242 (4th Cir. 2010); Concrete Works of Colorado v. City and County of Denver, 321
F.3d 950, 959-960, (10th Cir. 2003) (“Concrete Works IV”), cert. denied 540 U.S. 1027 (2003); W.H. Scott Construction Co., Inc. v. City of Jackson, 199 F.3d 206, 215 n.9. (5th Cir. 1999); Engineering Contractors, 122 F.3d at 909; Contractors Association of Eastern Pennsylvania, Inc. v. City of Philadelphia, 6 F.3d 990, 1009-1010 (3rd Cir. 1993); Coral Construction Co. v. King County., 941 F.2d 910, 931-932 (9th Cir. 1991), cert. denied 502 U.S. 1033 (1992). But see Midwest Fence Corp. v. United States Department of Transportation, 84 F.Supp. 3d 705, 719, affirmed, 840 F.3d 932 (7th Cir. 2016), cert. denied, 137 S.Ct. 2792 (2017) (“Because the challenged programs include both race and gender classifications, the Court applies strict scrutiny to the entire program”); Brunet v. City of Columbus, 1 F.3d 390, 403-404 (6th Cir. 1993) (gender-based affirmative action plans subject to strict scrutiny); and Milwaukee County Pavers Association v. Fiedler, 922 F.2d 419, 422 (7th Cir. 1991) (since state program employed both race and gender classifications, and since the state did not argue for a lesser standard of review for gender classifications, strict scrutiny applies to the entire program).
294 Rowe, 615 F.3d at 242. 295 Id.

Appendix B. Legal Standards for Government Race- and Gender-Conscious Contracting Programs
NERA Economic Consulting
283
applies to federal programs using race-based classifications as well.296 Similar to the state and local government context, the federal government must also show a compelling interest for the use of race-conscious measures and the remedies used must be narrowly tailored to the compelling interest.297
In Adarand III, a nonminority subcontractor that did not receive an award for the guardrail portion of a federal highway project brought an action against the Secretary of Transportation at the time, Federico Peña, alleging that the SBA 8(a) and 8(d) program preference for minorities violated the equal protection clause of the Fifth Amendment’s Due Process Clause.298 The prime contractor involved in this case had a clause in its contract with the government that it would receive a monetary incentive for hiring firms controlled by “socially and economically disadvantaged individuals” for its subcontracting work.299 While the district court ruled in favor of the federal government, and the U.S. Court of Appeals for the Tenth Circuit affirmed.300 In 1995, the Supreme Court remanded the case to determine whether the challenged program met the strict scrutiny standard.301
The Supreme Court noted that while Croson set strict scrutiny as the standard by which all race-based action by state and local governments would be analyzed,302 no such clear guidance was available in terms of what standard of review was required when such action was taken by the federal government.303 The Supreme Court ultimately concluded that strict scrutiny should also be applied to federal programs using race-conscious measures.304
In Adarand Constructors, Inc. v. Slater,305 a case that followed the original remand of the Adarand case, the Court of Appeals for the Tenth Circuit noted that Congress has already established the compelling interest prong of strict scrutiny. Acknowledging Congress’ power to address racial discrimination in the states, the court held that “we readily conclude that the federal government has a compelling interest in not perpetuating the effects of racial discrimination in its own distribution of federal funds and in remediation of the effects of past discrimination in the government contracting markets created by its disbursements.”306 The court drew this conclusion from a portion of Justice O’Connor’s opinion in Croson, where she stated that “it is beyond dispute that any public entity, state or federal, has a compelling interest in
296 Adarand Constructors, Inc. v. Pena, 515 U.S. 200, 227 (1995) (“Adarand III”). 297 Id. 298 Id. at 204-206. 299 Id. 300 Id. at 210. 301 Id. at 239. 302 Id. at 222. 303 Id. at 222-223. 304 Id. at 235-236. 305 Adarand Constructors, Inc. v. Slater, 228 F.3d 1147 (10th Cir. 2000) (“Adarand VII”), cert. granted, 532 U.S.
941, dismissed as improvidently granted, 534 U.S. 103 (2001). 306 Id. at 1165.

Appendix B. Legal Standards for Government Race- and Gender-Conscious Contracting Programs
NERA Economic Consulting
284
assuring that public dollars, drawn from the tax contributions of all citizens, do not serve to finance the evil of private prejudice.”307
B. Compelling Interest
1. Burden of Proof
Although it is the government’s obligation to produce a strong factual predicate to support its program,308 the party challenging the use of race-conscious measures bears the ultimate burden of proof, and must provide “credible, particularized evidence” to rebut the government’s demonstration of its compelling interest.309
Justice O’Connor explained the nature of the plaintiff’s burden of proof in her concurring opinion in Wygant v. Jackson Board of Education.310 She stated that, following the production of the factual predicate supporting the program:
[I]t is incumbent upon the non-minority [plaintiffs] to prove their case; they continue to bear the ultimate burden of persuading the court that the [government’s] evidence did not support an inference of prior discrimination and thus a remedial purpose, or that the plan instituted on the basis of this evidence was not sufficiently ‘narrowly tailored.’311
The challenging party’s rebuttal of the government’s compelling interest evidence may consist of showing that the government’s statistical disparities can be explained by neutral factors,312 by demonstrating that its statistics are flawed, by demonstrating that its statistics are not significant, or by introducing contrasting statistical evidence.313 However, “[c]onjecture and unsupported criticisms of the government’s methodology are insufficient.”314
307 City of Richmond v. J.A. Croson Co., 488 U.S. 469, 492 (1989). 308 Id. at 499-500. 309 Concrete Works of Colo., Inc. v. City & County. of Denver, 321 F.3d 950, 959 (10th Cir. 2003) (“Concrete
Works IV”), cert denied, 540 U.S. 1027 (2003) (quoting Adarand VII, 228 F.3d at 1175). 310 Wygant v. Jackson Board of Education, 476 U.S. 267, 293 (1986). 311 Id. at 293. 312 Concrete Works IV, 321 F.3d at 959 (citing Coral Construction Co. v. King County, 941 F.2d 910, 921 (9th Cir.
1991), cert. denied, 502 U.S. 1033 (1992)). 313 Id. See also Midwest Fence Corp. v. United States Department of Transportation, 84 F.Supp. 3d 705, 721,
affirmed, 840 F.3d 932 (7th Cir. 2016), cert. denied, 137 S.Ct. 2792 (2017); H.B. Rowe Co., Inc. v. Tippett, 615 F.3d 233, 242-243 (4th Cir. 2010); Engineering Contractors Association of South Florida., Inc. v. Metropolitan Dade County, 122 F.3d 895, 916 (11th Cir. 1997), cert. denied, 523 U.S. 1004 (1998); Contractors Association of Eastern Pennsylvania, Inc. v. City of Philadelphia, 6 F.3d 990, 1007 (3rd Cir. 1993).
314 Midwest Fence, 84 F.Supp. 3d at 721 (citing Concrete Works IV, 321 F.3d at 959).

Appendix B. Legal Standards for Government Race- and Gender-Conscious Contracting Programs
NERA Economic Consulting
285
2. Strong Basis in Evidence
It is undisputed that remedying racial discrimination is a legitimate compelling interest for the Commonwealth of Massachusetts.315 In such instances, Croson imposes an initial burden of production upon the government to demonstrate that there is a compelling interest and that a challenged M/WBE program is supported by a “strong basis in evidence,” i.e., documented evidence of past or present discrimination.316 A government “need not conclusively prove the existence of past or present discrimination to establish a strong basis in evidence for concluding that remedial action is necessary,”317 but instead may establish its initial showing through a combination of statistical and anecdotal evidence.318 Disparity studies frequently rely on multiple types of evidence, both statistical and anecdotal, to support the compelling interest requirement.319 Below, each type of evidence is briefly discussed.
a. Statistical Evidence from Government Contracting Activity
A primary evidentiary requirement to show a compelling interest and allow an inference of discrimination is through statistics comparing the utilization of minority firms by the government and its prime contractors with the availability of such firms in the government’s market area.320 The resulting analysis yields a disparity index, or disparity ratio, that can then be tested for statistical significance.321 However, in order for such statistics to be relevant, the state or local government must consider various factors, as discussed below.
Availability. Several courts have approved using a “Custom Census” as a proper method for calculating M/WBE availability. In Northern Contracting, Inc. v. State of Illinois, et al., the plaintiff argued that IDOT’s availability study overestimated the number of minority- and women-owned firms by using a custom census instead of a count of the number of Disadvantaged Business Enterprises (“DBEs”) registered and prequalified by IDOT.322 However, the Seventh Circuit Court of Appeals rejected that argument and upheld the “broader net” of
315 Croson, 488 U.S. at 491-492. 316 Id. at 500 (quoting Wygant, 476 U.S. at 277). 317 H.B. Rowe Company, Inc. v. Tippett, 615 F.3d 233, 241 (4th Cir. 2010) (citing Concrete Works IV, 321 F.3d at
958). 318 Adarand Constructors, Inc. v. Slater, 228 F.3d 1147, 1166-1167 (10th Cir. 2000) (“Adarand VII”), cert. granted,
532 U.S. 941, dismissed as improvidently granted, 534 U.S. 103 (2001). 319 See Wainwright, J. and C. Holt (2010), Guidelines for Conducting a Disparity and Availability Study for the
Federal DBE Program, Transportation Research Board of the National Academies, NCHRP Report, Issue No. 644 (detailing the major evidentiary components included in disparity studies).
320 Adarand VII, 228 F.3d at 1172-1173. See also Croson, 488 U.S. at 501-502 (“In this case, the city does not even know how many MBE’s in the relevant market are qualified to undertake prime or subcontracting work in public construction projects. Nor does the city know what percentage of total city construction dollars minority firms now receive as subcontractors on prime contracts let by the city” (citation omitted)).
321 Statistical significance measures the likelihood that a given statistical result can be attributed to random chance, as opposed to reflecting non-random phenomena. DeGroot, et al. (1994), pp. 1-48, discusses the evolution of the use of statistical significance in discrimination-related litigation.
322 Northern Contracting, Inc. v. State of Illinois, 473 F.3d 715, 723 (7th Cir. 2007).

Appendix B. Legal Standards for Government Race- and Gender-Conscious Contracting Programs
NERA Economic Consulting
286
DBE availability that was captured through the custom census, concluding that it reflected an attempt by IDOT to arrive at more accurate numbers than would have been possible through “a simple count of the number of registered and prequalified DBEs,” and that it was more consistent with the remedial nature of the federal DBE Program.323
Capacity. In discussing the type of availability measure that could pass muster under strict scrutiny, Croson spoke of “qualified minority contractors willing and able to perform.”324 The Court of Appeals for the Tenth Circuit examined this aspect of availability in Concrete Works IV. The Concrete Works court recognized that the plaintiff had identified a legitimate factual dispute regarding whether the City of Denver’s percentage of M/WBE firms overstated their ability to perform by ignoring “the actual qualifications and capacities” of M/WBEs in the market area.325 In assessing this argument, although the court recognized that “M/WBEs are generally smaller and less experienced than majority firms,” it also recognized that Denver’s disparity studies “strongly support [their] argument that M/WBEs are smaller and less experienced because of marketplace and industry discrimination.”326
The district court in Northern Contracting, as well, recognized that M/WBE capacity is adversely affected by discrimination. The court explained that “[a]lthough laws mandating award of prime contracts to the lowest bidder remove concerns regarding direct discrimination…the indirect effects of discrimination may linger.”327 The court further opined that DBEs’ ability to compete for prime contracts “may be indirectly affected by discrimination in the subcontracting market or in the bonding and finance markets.”328
In an apparently contrary approach to the issue of capacity, in Rothe Development Corporation v. Department of Defense, the Court of Appeals for the Federal Circuit, was highly critical of six specific disparity studies that were relied upon by the Defendant to establish its compelling interest, opining that each of the six disparity studies failed to account for the “relative capacities” of M/WBEs by ignoring firm size.329 The court opined that the capacity issue could have been addressed by employing regression analysis that controlled for firm size.330 Immediately after reaching this conclusion, however, the court went on to note, “[w]e recognize
323 Id. at 723. See also Concrete Works IV, 321 F.3d at 966-967 (upholding an M/WBE program using an
availability measure analogous to that used in Northern Contracting); Sherbrooke Turf, Inc. v. Minnesota Department of Transportation, 345 F.3d 964, 973-974 (8th Cir. 2003) (upholding a DBE program using an availability measure analogous to that used in Northern Contracting).
324 Croson, 488 U.S. at 509. 325 Concrete Works of Colorado, Inc. v. City & County. of Denver, 321 F.3d 950, 980-981 (10th Cir. 2003)
(“Concrete Works IV”), cert denied, 540 U.S. 1027 (2003) (quoting Concrete Works of Colorado, Inc. v. City and County of Denver, 86 F. Supp. 2d 1042, 1065-1066 (“Concrete Works III”)).
326 Id. at 981. 327 Northern Contracting, Inc. v. State of Illinois, 2005 U.S. Dist. LEXIS 19868 at *74 (N.D. Ill. 2005), affirmed
473 F.3d 715, 723 (7th Cir. 2007). 328 Id. 329 Rothe Development Corp. v. Department of Defense, 545 F.3d 1023, 1042-1044 (Fed. Cir. 2008) (“Rothe VII”). 330 Id. at 1044-1045.

Appendix B. Legal Standards for Government Race- and Gender-Conscious Contracting Programs
NERA Economic Consulting
287
that a minority-owned firm’s capacity and qualifications may themselves be affected by discrimination.”331
Geographic Markets. In order to ensure the relevance of the disparity study, the geographic market of the firms must also be taken into account. While Croson did not provide a bright line test for determining the local market area, the U.S. Court of Appeals for the Ninth Circuit, in Coral Construction Co. v. King County, stated that “the enacting jurisdiction should limit its factual inquiry to the presence of discrimination within its own boundaries.”332 Outside the Ninth Circuit, the recommended approach is to determine the geographic market by determining where the governmental entity is spending the majority of its contracting dollars. The National Cooperative Highway Research Program report on disparity study guidelines recommends that the relevant geographic market be defined according to the area where approximately 75 percent or more of government contract and subcontract dollars are spent, regardless of the jurisdictional boundaries of the governmental entity.333 Disparity studies have determined the relevant geographic market using anywhere from 60 percent to 90 percent of spending to define the market area.334
Study Period. Additionally, it appears that the recommended study time period be a minimum of three to a maximum of five to six years. The critical issue is that the study period be long enough in duration to provide a representative picture of the governmental entity’s spending profile and create a sufficiently large sample for statistical analysis. In Contractors Association of Eastern Pennsylvania v. City of Philadelphia, the U.S. Court of Appeals for the Third Circuit reviewed a study relied upon by the city using data for three fiscal years.335 In H.B. Rowe, the U.S. Court of Appeals for the Fourth Circuit also affirmed North Carolina’s program that was supported by a disparity study using data for a five-year period.336
Notwithstanding the above, if the data covered by the study dates back too far, then the court may find such data to be stale. In Builders Association of Greater Chicago v. City of Chicago, the City of Chicago used data from 1990 to justify the compelling need to continue the race- 331 Id. at 1045. See also Builders Association of Greater Chicago v. City of Chicago, 298 F. Supp. 2d 725, 736
(N.D. Ill. 2003) (noting that “minority firms, even after adjustment for size, earn less and work less, and have less sales to other businesses).
332 Coral Construction Co. v. King County, 941 F.2d 910, 917 (9th Cir. 1991), cert. denied, 502 U.S. 1033 (1992)). 333 Wainwright, J. and C. Holt (2010), Guidelines for Conducting a Disparity and Availability Study for the Federal
DBE Program, Transportation Research Board of the National Academies, NCHRP Report, Issue No. 644, at 29. 334 Concrete Works IV, 321 F.3d at 966-967 (local market defined as Denver MSA with 84% of contract dollars, but
statewide market also relevant for certain statistics with 60% of contract dollars); George R. La Noue, Standards for the Second Generation of Croson-Inspired Disparity Studies, 26 Urban Lawyer, pp. 495–496 & n.36 (1994) (geographic market defined as New York State and eight counties in New Jersey with 90% of state dollars). The disparity study at issue in Rowe employed a 75% standard (see MGT of America, North Carolina Department of Transportation Second Generation Disparity Study, pp. 410-411 (2004)).
335 Contractors Association of Eastern Pennsylvania, Inc. v. City of Philadelphia, 91 F.3d 586, 594 (3d Cir. 1996), cert. denied, 519 U.S. 1113 (1997).
336 H.B. Rowe Company, Inc. v. Tippett, 615 F.3d 233, 239 (4th Cir. 2010). The NCHRP Report (p. 34) notes that the median time period studied across 28 different disparity and availability studies performed for State Departments of Transportation was 5 years and the average was 5.3 years.

Appendix B. Legal Standards for Government Race- and Gender-Conscious Contracting Programs
NERA Economic Consulting
288
based program in 2003.337 The court stated that “viewed through the prism of 2003,” the present program could not have been considered “narrowly tailored.”338 This is in contrast to the district court’s footnote in Rothe Development Corp. v. U.S. Department of Defense, where it stated that “Congress cannot be expected to work in a vacuum” and that “Congress must have some sense of an institutional memory,” rejecting plaintiff’s objection to all evidence proffered by the Government that was prior to a certain year.339 In subsequent proceedings, the U.S. Court of Appeals for the Federal Circuit refused to adopt a bright-line for determining staleness, stating “While we certainly agree … that researchers should use current data when possible, we agree with the district court that Congress ‘should be able to rely on the most recently available data so long as that data is reasonably up-to-date.’”340
Non-goal contract data. Furthermore, the use of non-goal contract data can be probative in supporting a finding of discrimination. In Northern Contracting, the State of Illinois introduced evidence regarding five percent of IDOT contracts that did not use DBE goals. On these “zero goal” contracts, DBE firms received just 1.5 percent of the total value of the contracts.341 This, in conjunction with evidence relating to much higher levels of documented DBE availability and much higher levels of DBE utilization on contracts with DBE goals, helped lead the district court to conclude that IDOT’s program met the compelling evidence standard.342
Adoption of Study by the Governmental Entity. Finally, the governmental entity should formally adopt the findings of disparity studies in order for a court to find such disparity study to be established as evidence. In W.H. Scott Construction v. City of Jackson, the City failed to establish a compelling interest because the City did not adopt any particularized findings of discrimination in the construction industry and the City did not formally adopt the disparity study.343 The U.S. Court of Appeals for the Fifth Circuit in that case stated that “whatever probity the study’s findings might have had on our analysis is of no moment” as the “City refused to adopt the study when it was issued in 1995, and its belated reliance is unpersuasive.”344 It appears that having the government formally adopt the study is an important element to establish the compelling interest component of the strict scrutiny standard, and failure to do so might be dispositive.
337 Builders Association, 298 F. Supp. 2d at 729. 338 Id. at 742. 339 Rothe Development Corp. v. U.S. Department of Defense 324 F. Supp. 2d 840, 851 n.8. (W.D. Tex. 2004)
(“Rothe IV”), aff’d in part, vacated in part, and remanded by 499 F.2d 775 (413 F.3d 1327 (Fed. Circ. 2005). 340 Rothe Development Corporation v. Department of Defense, 545 F.3d 1023, 1039 (D.C. Cir. 2008) (“Rothe VII”)
(citations omitted). 341 Northern Contracting, Inc. v. State of Illinois, 473 F.3d 715, 719 (7th Cir. 2007). 342 Id. 343 W.H. Scott Construction Co., Inc. v. City of Jackson, 199 F.3d 206, 218-219 (5th Cir. 1999). 344 Id. at 218.

Appendix B. Legal Standards for Government Race- and Gender-Conscious Contracting Programs
NERA Economic Consulting
289
b. Other Statistical Evidence from the Government’s Market Area
Another significant form of evidence that the government may present involves the government’s own passive participation in a discriminatory market area. The Croson Court noted that the government need not be an active participant in the discrimination to be remedied by an M/WBE program. Rather, the Court stated that evidence of passive participation would suffice in satisfying the strict scrutiny standard.345
The difference between active and passive participation can be illustrated as follows. Evidence of active participation would be if the governmental entity actively created barriers to exclude M/WBEs from contracting opportunities. Evidence of passive participation would be the government’s infusion of tax dollars into an already discriminatory industry. The Croson Court highlighted that a government could passively participate in private sector discrimination simply through its monetary involvement, stating “it is beyond dispute that any public entity, state or federal, has a compelling interest in assuring that public dollars, drawn from the tax contributions of all citizens, do not serve to finance the evil of private prejudice.”346
In Concrete Works IV, the City of Denver relied upon market area data that measured discrimination in Denver’s overall construction market to satisfy the Croson compelling interest standard.347 The City produced evidence at trial that it indirectly contributed to private sector discrimination by awarding public contracts to firms that discriminated against M/WBEs in their private sector work.348 Concrete Works argued that market area data was irrelevant because only discrimination by the City or its prime contractors could demonstrate a strong basis in evidence.349 The Court of Appeals for the Tenth Circuit rejected this argument and noted that it did not read Croson or its own prior appellate rulings as requiring the defendant to identify “an exact linkage between its award of public contracts and private discrimination.”350 Rather, the court sided with the City in stating that the City’s strong basis in evidence of market area discrimination can assist in its burden of establishing a compelling interest.351 The court held that Denver’s anecdotal evidence and evidence linking its spending practices to the evidence of market area discrimination sufficiently illustrated that it indirectly contributed to private discrimination and was a passive participant in private discrimination.352
In Adarand VII, the Court of Appeals for the Tenth Circuit noted (in the context of whether it was legitimate to set M/WBE goals higher than actual M/WBE availability), that:
345 City of Richmond v. J.A. Croson Co., 488 U.S. 469, 492 (1989). 346 Id. 347 Concrete Works of Colorado, Inc. v. City & County. of Denver, 321 F.3d 950, 976 (10th Cir. 2003) (“Concrete
Works IV”), cert denied, 540 U.S. 1027 (2003). 348 Id. 349 Id. at 976-977. 350 Id. at 973. See also Concrete Works of Colorado, Inc. v. City & County. of Denver, 36 F.3d 1513, 1529 (10th Cir.
1994) (“Concrete Works II”). 351 Concrete Works IV, 321 F.3d at 973. 352 Id. at 977.

Appendix B. Legal Standards for Government Race- and Gender-Conscious Contracting Programs
NERA Economic Consulting
290
This aspirational goal is reasonably construed as narrowly tailored to remedy past discrimination that has resulted in homogenous ownership within the industry. It is reasonable to conclude that allocating more than 95% of all federal contracts to enterprises owned by non-minority persons, or more than 90% of federal transportation contracts to enterprises owned by non-minority males, is in and of itself a form of passive participation in discrimination that Congress is entitled to seek to avoid.353
In Builders Association of Greater Chicago v. City of Chicago354 the district court also found evidence of the lack of M/WBE participation on private construction contracts probative. In explaining the import of marketplace discrimination, it opined:
The anecdotal evidence indicates that M/WBEs are sometimes ignored because of racial, ethnic or gender animus or stereotyping. That cannot be quantified…. The tendency to stick with the old and ignore the new affects all newer firms, not just M/WBEs. But here the vestiges of past discrimination linger on to skew the marketplace and adversely impact M/WBEs disproportionately as more recent entrants to the industry. Not too long ago white male firms had a near monopoly in the industry and they, therefore, are the beneficiaries of a continuing adherence to old relationships.355
The court affirmed that Chicago had a compelling interest not to perpetuate with its tax dollars a market skewed by past and present discrimination that restricts M/WBE competition in the construction market.356
c. Anecdotal Evidence
Anecdotal evidence that reflects the personal experiences of minorities with discrimination in contracting opportunities is relevant because it goes to the question of whether observed statistical disparities are due to discrimination rather than to other nondiscriminatory causes.357 Although anecdotal evidence is usually insufficient standing alone, the U.S. Court of Appeals for the Eleventh Circuit stated: “[W]e do not set out a categorical rule that every case must rise or fall entirely on the sufficiency of the numbers. To the contrary, anecdotal evidence might make the pivotal difference in some cases; indeed, in an exceptional case, we do not rule out the possibility that evidence not reinforced by statistical evidence, as such, will be enough.”358 The Court of Appeals for the Tenth Circuit has noted that “[p]ersonal accounts of actual discrimination or the effects of discriminatory practices may vividly complement empirical 353 Adarand Constructors, Inc. v. Slater, 228 F.3d 1147, 1181 (10th Cir. 2000) (“Adarand VII”), cert. granted, 532
U.S. 941, dismissed as improvidently granted, 534 U.S. 103 (2001). 354 Builders Association of Greater Chicago v. City of Chicago, 298 F. Supp. 2d 725 (N.D. Ill. 2003). 355 Id. at 738. 356 Id. 357 See, e.g., Northern Contracting, Inc. v. State of Illinois, 2005 U.S. Dist. LEXIS 19868 at *75-76 (N.D. Ill. 2005),
affirmed 473 F.3d 715, 723 (7th Cir. 2007); See also Builders Association, 298 F.Supp.2d at 728-729, 737-738; Webster v. Fulton County, 51 F.Supp.2d 1354, 1363, 1378-1379 (N.D. Ga. 1999).
358 Engineering Contractors Association of South Florida., Inc. v. Metropolitan Dade County, 122 F.3d 895, 926 (11th Cir. 1997), cert. denied, 523 U.S. 1004 (1998).

Appendix B. Legal Standards for Government Race- and Gender-Conscious Contracting Programs
NERA Economic Consulting
291
evidence. Moreover, anecdotal evidence of a [government’s] institutional practices that exacerbate discriminatory market conditions are [sic] often particularly probative.”359 As the Supreme Court observed, anecdotal evidence presented in conjunction with statistical evidence may be persuasive because it helps bring “cold numbers convincingly to life.”360
Anecdotal evidence has been found relevant to whether a government had met its strict scrutiny burden. Using such evidence, governments have demonstrated that discrimination against minority firms by nonminority prime contractors, unions, and lenders impedes the formation of minority businesses,361 and discrimination by nonminority prime contractors, private sector customers, business networks, suppliers, and bonding companies harm the ability of existing minority firms to successfully compete for governmental contracts and subcontracts.362 Anecdotal information collected through disparity studies has provided strong evidence of discriminatory treatment of minority firms. The Court of Appeals for the Fourth Circuit recently noted:
The surveys in the 2004 study exposed an informal, racially exclusive network that systemically disadvantaged minority subcontractors. The State could conclude with good reason that such networks exert a chronic and pernicious influence on the marketplace that calls for remedial action…. [This court has] cautioned against inferring discrimination from reports of cronyism absent evidence of racial animus. Here, however, majorities of African American and Native American respondents agreed that prime contractors have higher standards for minority subcontractors, view minority subcontractors as being less competent than nonminority businesses, change their bidding practices when not required to hire minority subcontractors, and drop minority subcontractors after winning contracts. Together, these responses suggest strongly that the underutilization of African American and Native American subcontractors is more than a mere byproduct of misguided yet color-blind cronyism. Rather, they indicate that racial discrimination is a critical factor underlying the gross statistical disparities presented in the 2004 study. … [T]he State here presented substantial statistical evidence of gross disparity, corroborated by disturbing anecdotal evidence.363
Additionally, the Rowe court specifically rejected the notion that anecdotal testimony must be verified or corroborated, as befits the role of evidence in legislative decision-making as opposed to judicial proceedings. Plaintiff “offered no rationale as to why a fact finder could not rely on the State’s ‘unverified’ anecdotal data. Indeed, a fact finder could very well conclude that anecdotal evidence need not—and indeed cannot—be verified because it ‘is nothing more than a witness’ narrative of an incident told from the witness’ perspective and including the witness’
359 Concrete Works II, 36 F.3d at 1520. 360 Concrete Works II, 36 F.3d at 1521 (quoting International Brotherhood of Teamsters v. United States, 431 U.S.
324, 399 (1977)). 361 Adarand VII, 228 F.3d at 1168-1170. 362 Id. at 1171-1172. 363 H.B. Rowe Company, Inc. v. Tippett, 615 F.3d 233, 251 (4th Cir. 2010) (citations and quotation omitted).

Appendix B. Legal Standards for Government Race- and Gender-Conscious Contracting Programs
NERA Economic Consulting
292
perceptions.’”364 Likewise, the Court of Appeals for the Tenth Circuit held that “Denver was not required to present corroborating evidence and [plaintiff] was free to present its own witnesses to either refute the incidents described by Denver’s witnesses or to relate their own perceptions on discrimination in the Denver construction industry.”365
C. The Narrow Tailoring Analysis
Croson requires that an M/WBE program be “narrowly tailored” to remedy current evidence of discrimination.366 The Supreme Court has identified several factors to consider in evaluating whether a race-based remedy is narrowly tailored:
• The consideration of race-neutral means to increase M/WBE participation;367
• The flexibility of the program requirements, including the availability of waiver provisions; 368
• The duration of the proposed relief;369
• The relationship of numerical participation goals to the availability of M/WBEs in the relevant market;370
• The impact of the relief on third parties;371 and
• The overinclusiveness or underinclusiveness of the racial classifications.372
1. Race-Neutral Alternatives
Race-neutral approaches are a necessary component of a defensible and effective M/WBE program.373 Such measures include simplifying bidding procedures, relaxing bonding
364 Id. at 249 (quoting Concrete Works of Colorado, Inc. v. City & County. of Denver, 321 F.3d 950, 989 (10th Cir.
2003), cert denied, 540 U.S. 1027 (2003) (“Concrete Works IV”)). 365 Concrete Works IV, 321 F.3d at 989. 366 City of Richmond v. J.A. Croson Co., 488 U.S. 469, 507-508 (1989). 367 Id. at 507 (citing United States v. Paradise, 480 U.S. 149, 171 (1987)). See also Adarand Constructors, Inc. v.
Pena, 515 U.S. 200, 237-238 (1995) (“Adarand III”). 368 Croson, 488 U.S. at 507-508; Paradise, 480 U.S. at 171. See also Adarand VII, 228 F.3d at 1177, 1180-1181. 369 Croson, 488 U.S. at 498, 509. See also Paradise, 480 U.S. at 171. 370 Paradise, 480 U.S. at 171. See also Croson, 488 U.S. at 510. 371 Paradise, 480 U.S. at 171. See also Croson, 488 U.S. at 510-511. 372 Croson, 488 U.S. at 506. 373 Id. at 507 (Richmond considered no alternatives to a race-based quota).

Appendix B. Legal Standards for Government Race- and Gender-Conscious Contracting Programs
NERA Economic Consulting
293
requirements, providing training, and providing financial aid.374 However, while an entity must give good faith consideration to race-neutral alternatives, strict scrutiny does not require that every race-neutral approach must be implemented and then proven ineffective before race-conscious remedies may be utilized: “Narrow tailoring does not require exhaustion of every conceivable race-neutral alternative,” but it does require “serious, good faith consideration of workable race-neutral alternatives.”375 As is outlined in Chapter VIII of this report, DCAMM has tried, and continues to pursue, a number of race-neutral strategies, including: outreach and educational programs, participation in supplier diversity and capacity building programs sponsored by other public and private sector entities, and relaxing and streamlining contractor certification requirements and bidding requirements.
2. Flexibility
It is imperative that remedies not operate as fixed quotas.376 The courts have generally written approvingly of providing waivers for firms that fail to meet the contract goals but make good faith efforts to do so. In Croson, the Court referred approvingly to the contract-by-contract waivers used in a program similar to the USDOT DBE Program.377 The inclusion of waivers has been central to decisions holding that race-conscious programs are narrowly tailored.378
3. Duration
Strict scrutiny requires that programs be regularly reviewed to determine whether race-conscious remedies are still warranted. The USDOT DBE Program’s periodic review by Congress, for example, has been repeatedly held to provide adequate durational limits.379 Other cases also instruct that the “narrowly tailored” standard requires race-conscious programs to include these durational limitations.380
374 Id. See also 49 C.F.R. § 26.51 (describing examples of race-neutral measures under the U.S. Department of
Transportation’s (“USDOT”) DBE Program). 375 Sherbrooke Turf, Inc. v. Minnesota Department of Transportation, 345 F.3d 964, 972 (8th Cir. 2003) (citing
Grutter v. Bollinger, 539 U.S. 306, 339 (2003)). 376 Croson, 488 U.S. at 507-508. See also Grutter, 539 U.S. at 334 (quotas are not permitted; race must be used in a
flexible, non-mechanical way). 377 Croson, 488 U.S. at 508. 378 See, e.g., Midwest Fence Corp. v. United States Department of Transportation, 840 F.3d 932, 954-955 (7th Cir.
2016), cert. denied, 137 S.Ct. 2792 (2017); Sherbrooke, 345 F.3d at 972; Adarand VII, 228 F.3d at 1180-1181. See also H.B. Rowe Company, Inc. v. Tippett, 615 F.3d 233, 253-254 (4th Cir. 2010).
379 See, e.g., Midwest Fence, 840 F.3d at 943; Sherbrooke, 345 F.3d at 972; Adarand VII, 228 F.3d at 1179-1180. 380 Rowe, 615 F.3d at 253 (holding that North Carolina’s M/WBE program satisfied the duration factor of the
narrow tailoring test, since its program had a specific expiration date and a requirement that a new disparity study be conducted every five years); Western States Paving Co., Inc. v. Washington State Department of Transportation, 407 F.3d 983, 994 (9th Cir. 2005), cert. denied, 546 U.S. 1170 (2006) (holding that TEA-21 was subject to reauthorization by Congress) (TEA-21, or the Transportation Equity Act for the 21st Century, P.L. 105-178 (1998) refers to the legislation that authorized federal surface transportation programs and the DBE regulations at the time this case was decided); Sherbrooke, 345 F.3d at 972 (holding that a state was able to terminate its DBE program if it met its annual overall goal through race-neutral means for two consecutive

Appendix B. Legal Standards for Government Race- and Gender-Conscious Contracting Programs
NERA Economic Consulting
294
4. Goal Setting
Numerical goals for M/WBE participation must be related to the availability of M/WBEs in the relevant market. For example, in ruling that the federal DBE program was narrowly tailored, the U.S. Court of Appeals for the Eighth Circuit in Sherbrooke noted that “[t]he regulations require grantee States to set overall goals based upon the likely number of minority contractors that would have received federally assisted highway contracts but for the effects of past discrimination.”381 Similarly, the Ninth Circuit in Western States, wrote that “The TEA-21 regulations instead provide for each State to establish a DBE utilization goal that is based upon the proportion of ready, willing, and able DBEs in the State's transportation contracting industry.”382 Similarly, the Fourth Circuit in Rowe ruled that the state had “taken concrete steps to ensure that [its participation goals] accurately reflect the availability of minority-owned businesses ‘on a project-by-project basis.’”383
5. Sharing of the Burden by Third Parties
Strict scrutiny recognizes that third parties can be required to share a portion of the burden of the remedy for eradicating racial discrimination. As the court in Adarand VII noted,
While at the margin, some DBEs may be hired under the program in lieu of non-DBEs, the possibility that innocent parties will share the burden of a remedial program is itself insufficient to warrant the conclusion that the program is not narrowly tailored. To invalidate the [programs] on that basis would be to render strict scrutiny effectively fatal, in contravention of Justice O’Connor's clear statements to the contrary.”384
Similarly, the U.S. Court of Appeals for the Ninth Circuit noted in Western States, “Implementation of the race-conscious contracting goals for which TEA-21 provides will inevitably result in bids submitted by non-DBE firms being rejected in favor of higher bids from DBEs. Although this places a very real burden on non-DBE firms, this fact alone does not invalidate TEA-21. If it did, all affirmative action programs would be unconstitutional because of the burden upon non-minorities.”385
The Court of Appeals for the Fourth Circuit in Rowe rejected the plaintiff’s two arguments that the State’s contracting program imposed a substantial burden on prime contractors.386 First, although the plaintiff argued that the program “creates onerous solicitation and follow-
years); Associated General Contractors of Ohio v. Drabik, 214 F.3d 730, 737-738 (6th Cir. 2000) (holding that an MBE program was not narrowly tailored because it did not have a sunset provision or expiration).
381 Sherbrooke, 345 F.3d at 972. 382 Western States, 407 F.3d at 994-995. 383 Rowe, 615 F.3d at 253. Cf. Croson, 488 U.S. at 502 (“In this case, the city does not even know how many MBE's
in the relevant market are qualified to undertake prime or subcontracting work in public construction projects”). 384 Adarand VII, 228 F.3 at 1183 (citing Adarand Constructors, Inc. v. Pena, 515 U.S. 200, 237 (1995). 385 Western States, 407 F.3d at 995 (citations omitted). 386 Rowe, 615 F.3d at 254.

Appendix B. Legal Standards for Government Race- and Gender-Conscious Contracting Programs
NERA Economic Consulting
295
up requirements,” it admitted that “the company’s secretaries run the solicitation program with no need for additional employees dedicated to the task.”387 Second, Rowe offered no evidence to support its contention that complying with the State’s program required it to “subcontract millions of dollars of work that it could perform itself for less money.”388 North Carolina, however, offered evidence that “prime contractors need not subcontract work they can self-perform.”389
6. Over-inclusiveness and Under-inclusiveness of Remedies
The over- or under-inclusiveness of a program with regard to which groups are included is an additional consideration, and goes to whether the remedies truly target the evil identified. The courts have interpreted this factor to mean that race-conscious programs must be carefully targeted and must exclude those who are demonstrably not-disadvantaged (for example, very wealthy business owners).390 However, narrow tailoring does not require that each group included in the program suffer equally from discrimination.391
The federal DBE Program’s rebuttable presumptions of social and economic disadvantage have been central to the courts’ holdings that it is narrowly tailored:
While TEA-21 creates a rebuttable presumption that members of certain racial minorities fall within that class [of all small businesses owned and controlled by the socially and economically disadvantaged], the presumption is rebuttable, wealthy minority owners and wealthy minority-owned firms are excluded, and certification is available to persons who are not presumptively disadvantaged but can demonstrate actual social and economic disadvantage. Thus, race is made relevant in the program, but it is not a determinative factor.”392
D. Conclusion
The decisions of the U.S. Supreme Court in the Croson and Adarand cases changed the legal landscape for affirmative action in public contracting programs. This Appendix has examined what Croson, Adarand, and their progeny require for a state or local government entity to continue to implement a constitutional race- and gender-conscious public contracting program.
387 Id. (emphasis in original). 388 Id. 389 Id. (emphasis in original). 390 This final factor was not among those articulated in Paradise, but has been added by lower courts based on the
discussion in Croson. See, e.g., Adarand VII, 228 F.3d at 1183-1187 (noting that Croson includes over- and under-inclusiveness in the narrow tailoring factors).
391 Concrete Works IV, 321 F.3d at 971 (“The district court, however, apparently believed Denver could not satisfy its burden of introducing strong evidence unless it was able to show that each group suffered equally from discrimination. Croson imposes no such requirement.”) (emphasis in original).
392 Sherbrooke, 345 F.3d at 972-973; see also Adarand VII, 228 F.3d at 1183-1184 (personal net worth limit is element of narrow tailoring).

Appendix B. Legal Standards for Government Race- and Gender-Conscious Contracting Programs
NERA Economic Consulting
296

Appendix B. Legal Standards for Government Race- and Gender-Conscious Contracting Programs
NERA Economic Consulting
297
E. List of Authorities
Cases
Adarand Constructors, Inc. v. Pena, 515 U.S. 200 (1995) (“Adarand III”). City of Richmond v. J.A. Croson Co., 488 U.S. 469 (1989). Grutter v. Bollinger, 539 U.S. 306 (2003). International Brotherhood of Teamsters v. United States, 431 U.S. 324 (1977). Mississippi University for Women v. Hogan, 458 U.S. 718 (1982). United States v. Paradise, 480 U.S. 149 (1987). United States v. Virginia, 518 U.S. 515 (1996). Wygant v. Jackson Board of Education, et al., 476 U.S. 267 (1986). Contractors Association of Eastern Pennsylvania, Inc. v. City of Philadelphia, 6 F.3d 990 (3rd
Cir. 1993). Contractors Association of Eastern Pennsylvania, Inc. v. City of Philadelphia, 91 F.3d 586 (3d
Cir. 1996), cert. denied, 519 U.S. 1113 (1997). H.B. Rowe Co., Inc. v. Tippett, 615 F.3d 233 (4th Cir. 2010). W.H. Scott Construction Co., Inc. v. City of Jackson, 199 F.3d 206 (5th Cir. 1999). Brunet v. City of Columbus, 1 F.3d 390 (6th Cir. 1993). Midwest Fence Corp. v. United States Department of Transportation, 840 F.3d 932 (7th Cir.
2016), cert. denied, 137 S.Ct. 2792 (2017). Milwaukee County Pavers Association v. Fiedler, 922 F.2d 419 (7th Cir. 1991). Northern Contracting, Inc. v. State of Illinois, 473 F.3d 715 (7th Cir. 2007). Sherbrooke Turf, Inc. v. Minnesota Department of Transportation, 345 F.3d 964 (8th Cir. 2003). Western States Paving Co., Inc. v. Washington State Department of Transportation, 407 F.3d
983 (9th Cir. 2005), cert. denied, 546 U.S. 1170 (2006). Adarand Constructors, Inc. v. Slater, 228 F.3d 1147 (10th Cir. 2000), cert. granted, 532 U.S.
941, dismissed as improvidently granted, 534 U.S. 103 (2001) (“Adarand VII”). Concrete Works of Colorado v. City and County of Denver, 321 F.3d 95 (10th Cir. 2003), cert.
denied 540 U.S. 1027 (2003) (“Concrete Works IV”). Engineering Contractors Association of South Florida., Inc. v. Metropolitan Dade County, 122
F.3d 895 (11th Cir. 1997), cert. denied, 523 U.S. 1004 (1998). Rothe Development Corp. v. Department of Defense, 545 F.3d 1023 (Fed. Cir. 2008) (“Rothe
VII”). Builders Association of Greater Chicago v. City of Chicago, 298 F. Supp. 2d 725 (N.D. Ill.
2003).

Appendix B. Legal Standards for Government Race- and Gender-Conscious Contracting Programs
NERA Economic Consulting
298
Concrete Works of Colorado, Inc. v. City and County of Denver, 86 F. Supp. 2d 1042 (“Concrete Works III”).
Midwest Fence Corp. v. United States Department of Transportation, 84 F.Supp. 3d 705, affirmed, 840 F.3d 932 (7th Cir. 2016), cert. denied, 137 S.Ct. 2792 (2017).
Northern Contracting, Inc. v. State of Illinois, 2005 U.S. Dist. LEXIS 19868 (N.D. Ill. 2005), affirmed 473 F.3d 715, 723 (7th Cir. 2007).
Rothe Development Corp. v. U.S. Department of Defense 324 F. Supp. 2d 840 (W.D. Tex. 2004) (“Rothe IV”).
Webster v. Fulton County, 51 F.Supp.2d 1354, 1363 (N.D. Ga. 1999). Federal Statutes and Regulations
49 C.F.R. § 26.51. Transportation Equity Act for the 21st Century, P.L. 105-178 (1998).
Publications and Reports
DeGroot, M.H., Fienberg, S.E., and J. B. Kadane (1994), Statistics and the Law, New York, John Wiley & Sons, Inc.
La Noue, G. (1994), Standards for Second Generation of Croson Inspired Disparity Studies, 26 Urban Lawyer, 495-96 & n.36.
MGT of America (2004), North Carolina Department of Transportation Second Generation Disparity Study (2004)).
Wainwright, J. and C. Holt (2010), Guidelines for Conducting a Disparity and Availability Study for the Federal DBE Program, Transportation Research Board of the National Academies, NCHRP Report, Issue No. 644.

299
Appendix C. Master M/WBE Directory Sources
A. Entities with lists of M/WBE firms that were duplicative of previously collected lists
Boston Public Schools Cambridge Chamber of Commerce City of Pittsfield City of Worcester Comm-PASS (administered by Massachusetts Operational Services Division) Massachusetts Affirmative Market Program Massachusetts Department of Transportation Massachusetts Office of Business Development Massachusetts Water Resources Authority Middleborough Office Economic Development New Bedford Regional Airport Norfolk County Purchasing Department Springfield Office of Economic Development Western Massachusetts Economic Development Council B. Entities that had no directory, or their directory did not identify race
and sex
Affiliated Chambers of Commerce of Greater Springfield Air Conditioning Contractors of America-National Air Conditioning Contractors of America-New England Chapter Berkshire Chamber of Commerce (1Berkshire) Berkshire Regional Planning Commission Cape Cod Canal Region Chamber of Commerce Central Berkshire Regional School District Chicopee Chamber of Commerce City of Cambridge Community Development Department City of New Bedford City of Northampton City of Salem Cranberry Country Chamber of Commerce Empire State Development Everett Chamber of Commerce The Federal Government’s Central Contractor Registration Database Foundation for Fair Contracting of Massachusetts Franklin County Chamber of Commerce Greater Boston Chamber of Commerce Greater Northampton Chamber of Commerce Greater Springfield Convention and Visitors Bureau Home Builders & Remodelers Association of Massachusetts International Union of Painters and Allied Trades – New England

300
Mashpee Chamber of Commerce Massachusetts Alliance for Economic Development Massachusetts Growth Capital Corporation FKA Massachusetts Community Development
Finance Corporation Massachusetts Port Authority Merrimack Valley Chamber of Commerce Metro South Chamber of Commerce National Association of Women in Construction – Boston chapter National Procurement Council Neponset Valley Chamber of Commerce New Bedford Area Chamber of Commerce New Bedford Public Schools New Britain Chamber of Commerce New Hampshire DOT New York DOT North Shore Chamber of Commerce The Quincy 2000 Collaborative Quincy Purchasing Department Rhode Island DOT Minority Business Enterprise Small Business and Entrepreneurship Council Smaller Business Association of New England South Shore Chamber of Commerce Springfield Area Council on Excellence University of Massachusetts Amherst Westchester County Association West Mass Area Development Corporation Worcester Public Schools Worcester Regional Research Bureau Yarmouth Area Chamber of Commerce C. Entities that were non-responsive to repeated contacts
Black Pages of New England Boston Red Sox The Burroughs Group Cambridge Public School District Cohasset Chamber of Commerce Diversity Development – Boston Massachusetts Black Chamber of Commerce Massachusetts Institute of Technology Massachusetts Latino Chamber of Commerce Massachusetts Minority Contractors Association New Bedford Economic Development Council New England Black Chamber of Commerce New England College North Central Massachusetts Minority Coalition

301
South Shore Women’s Business Network University of Massachusetts Boston Minority Business Center D. Entities that refused to provide the requested information
The Center for Women and Enterprise – Boston chapter The Gillette Company Hispanic-American Chamber of Commerce – Boston Massachusetts Small Business Development Center Network Boston Regional Office &
Minority Business Center National Federation of Independent Business New England Minority Supplier Development Council Women Business Enterprise National Council

302
This page intentionally left blank.

303
Appendix D. Detailed Utilization, Availability & Disparity Tables
This appendix presents M/WBE utilization, availability, and disparity statistics analogous to those presented in Chapter VI, Tables 6.5 and 6.6, for M/WBEs, and Tables 6.7 and 6.8, for PBEs, according to detailed NAICS Industry Groups.393
Eight tables each are presented, four for M/WBEs and four for PBEs. Within each set, there are two for Construction and two for Design. Within each procurement category, the first table uses dollars awarded as the metric of utilization and the second table uses dollars paid.
393 Comparable statistics were calculated at the NAICS Industry level as well (five-digit and six-digit NAICS). In
the interest of space, these results are not reported here. Four-digit NAICS codes are most comparable to four-digit Standard Industrial Classification (SIC) codes, which were used prior to the advent of the NAICS system.

304
Table AD.1. M/WBE Industry Group Utilization, Availability, and Disparity Results for DCAMM Construction Contracting (Dollars Awarded)
NAICS Industry Group & M/WBE Type Utilization (%)
Availability (%)
Disparity Ratio
Building Equipment Contractors (NAICS 2382) African American 0.56 1.64 34.28 Hispanic 0.41 0.99 41.41 Asian 0.30 0.61 48.82 Native American 0.00 0.35 0.00 *** Cape Verdean 0.43 0.12 Minority 1.70 3.71 45.70 Nonminority female 13.36 6.33 M/WBE Total 15.05 10.04 Foundation, Structure, and Building Exterior Contractors (NAICS 2381)
African American 1.85 1.02 Hispanic 6.15 2.43 Asian 0.00 0.50 0.00 *** Native American 0.00 0.05 0.00 Cape Verdean 0.11 0.24 45.13 Minority 8.11 4.24 Nonminority female 9.66 8.06 M/WBE Total 17.77 12.31 Nonresidential Building Construction (NAICS 2362) African American 1.06 1.71 62.13 Hispanic 0.27 1.15 23.46 Asian 0.32 0.60 53.38 Native American 0.02 0.70 2.59 Cape Verdean 0.00 0.01 0.00 Minority 1.67 4.17 39.97 Nonminority female 0.82 9.92 8.28 *** M/WBE Total 2.49 14.09 17.66 *** Other Specialty Trade Contractors (NAICS 2389) African American 5.40 2.05 Hispanic 3.25 1.78 Asian 0.04 0.40 9.09 Native American 0.00 0.17 0.00 *** Cape Verdean 0.00 0.07 0.00 Minority 8.69 4.47 Nonminority female 16.69 9.71 M/WBE Total 25.38 14.18

305
NAICS Industry Group & M/WBE Type Utilization (%)
Availability (%)
Disparity Ratio
Building Finishing Contractors (NAICS 2383) African American 0.42 2.96 14.32 *** Hispanic 0.49 4.56 10.74 *** Asian 0.00 1.89 0.00 *** Native American 0.00 0.03 0.00 Cape Verdean 0.00 0.28 0.00 *** Minority 0.91 9.72 9.39 *** Nonminority female 14.68 9.46 M/WBE Total 15.59 19.17 81.32 Architectural, Engineering, and Related Services (NAICS 5413) African American 0.32 1.43 22.60 *** Hispanic 0.13 0.75 17.53 ** Asian 0.84 2.33 35.90 * Native American 0.20 0.13 Cape Verdean 0.00 0.17 0.00 *** Minority 1.49 4.80 30.94 *** Nonminority female 13.22 9.59 M/WBE Total 14.70 14.39 Architectural and Structural Metals Manufacturing (NAICS 3323) African American 0.01 0.00 Hispanic 0.00 1.94 0.00 *** Asian 2.94 0.82 Native American 0.00 0.00 Cape Verdean 0.00 0.01 0.00 Minority 2.96 2.77 Nonminority female 1.76 14.83 11.88 *** M/WBE Total 4.72 17.61 26.79 *** Highway, Street, and Bridge Construction (NAICS 2373) African American 0.58 0.16 Hispanic 4.30 0.32 Asian 7.23 0.48 Native American 0.00 0.00 Cape Verdean 0.00 0.00 0.00 Minority 12.11 0.96 Nonminority female 0.00 4.60 0.00 *** M/WBE Total 12.11 5.57

306
NAICS Industry Group & M/WBE Type Utilization (%)
Availability (%)
Disparity Ratio
Electric Power Generation, Transmission and Distribution (NAICS 2211)
African American 0.00 0.67 0.00 Hispanic 0.00 0.68 0.00 Asian 0.00 1.01 0.00 Native American 0.00 0.00 Cape Verdean 0.00 0.02 0.00 Minority 0.00 2.38 0.00 *** Nonminority female 0.00 2.94 0.00 *** M/WBE Total 0.00 5.32 0.00 *** Remediation and Other Waste Management Services (NAICS 5629) African American 0.87 3.86 22.53 Hispanic 57.94 8.74 Asian 0.00 1.93 0.00 *** Native American 0.00 0.00 Cape Verdean 0.00 0.04 0.00 Minority 58.81 14.57 Nonminority female 4.80 16.99 28.28 M/WBE Total 63.62 31.56 Professional and Commercial Equipment and Supplies Merchant Wholesalers (NAICS 4234)
African American 0.80 0.90 88.92 Hispanic 0.00 2.07 0.00 *** Asian 0.00 0.58 0.00 *** Native American 0.00 0.00 Cape Verdean 0.00 0.01 0.00 Minority 0.80 3.56 22.56 Nonminority female 54.30 7.46 M/WBE Total 55.10 11.02 Machinery, Equipment, and Supplies Merchant Wholesalers (NAICS 4238)
African American 0.00 0.56 0.00 *** Hispanic 0.00 1.61 0.00 *** Asian 0.00 1.62 0.00 *** Native American 0.00 0.36 0.00 *** Cape Verdean 0.00 0.02 0.00 Minority 0.00 4.17 0.00 *** Nonminority female 0.39 7.58 5.15 *** M/WBE Total 0.39 11.75 3.32 ***

307
NAICS Industry Group & M/WBE Type Utilization (%)
Availability (%)
Disparity Ratio
Services to Buildings and Dwellings (NAICS 5617) African American 0.16 2.21 7.31 Hispanic 25.85 1.40 Asian 0.00 0.47 0.00 *** Native American 0.00 0.33 0.00 Cape Verdean 0.00 0.10 0.00 Minority 26.01 4.51 Nonminority female 15.48 9.98 M/WBE Total 41.49 14.49 Other Wood Product Manufacturing (NAICS 3219) African American 3.56 0.00 Hispanic 0.00 1.44 0.00 *** Asian 0.00 0.58 0.00 Native American 0.00 0.00 Cape Verdean 0.00 0.01 0.00 Minority 3.56 2.02 Nonminority female 2.89 5.63 51.39 M/WBE Total 6.46 7.65 84.36 Management, Scientific, and Technical Consulting Services (NAICS 5416)
African American 0.00 0.37 0.00 *** Hispanic 14.44 0.78 Asian 5.75 0.87 Native American 0.00 0.02 0.00 Cape Verdean 0.00 0.03 0.00 Minority 20.19 2.06 Nonminority female 13.15 13.48 97.54 M/WBE Total 33.34 15.54 Lumber and Other Construction Materials Merchant Wholesalers (NAICS 4233)
African American 0.72 0.00 Hispanic 0.00 3.63 0.00 *** Asian 0.00 1.14 0.00 *** Native American 0.00 0.00 Cape Verdean 0.00 0.20 0.00 Minority 0.72 4.97 14.47 * Nonminority female 22.59 7.56 M/WBE Total 23.31 12.53

308
NAICS Industry Group & M/WBE Type Utilization (%)
Availability (%)
Disparity Ratio
Cement and Concrete Product Manufacturing (NAICS 3273) African American 0.00 0.00 Hispanic 0.00 4.33 0.00 *** Asian 0.00 1.93 0.00 *** Native American 0.00 0.00 Cape Verdean 0.00 0.02 0.00 Minority 0.00 6.29 0.00 *** Nonminority female 0.00 8.70 0.00 *** M/WBE Total 0.00 14.98 0.00 *** Hardware, and Plumbing and Heating Equipment and Supplies Merchant Wholesalers (NAICS 4237)
African American 0.18 1.23 14.54 Hispanic 0.25 0.30 83.74 Asian 0.00 0.30 0.00 *** Native American 0.00 0.00 Cape Verdean 0.00 0.00 0.00 Minority 0.43 1.84 23.56 Nonminority female 0.00 3.80 0.00 *** M/WBE Total 0.43 5.64 7.68 ** Metal and Mineral (except Petroleum) Merchant Wholesalers (NAICS 4235)
African American 0.00 0.43 0.00 Hispanic 0.00 1.71 0.00 *** Asian 0.77 3.84 20.15 Native American 0.00 0.00 Cape Verdean 0.00 0.01 0.00 Minority 0.77 5.99 12.94 Nonminority female 0.00 10.20 0.00 *** M/WBE Total 0.77 16.19 4.78 Office Furniture (including Fixtures) Manufacturing (NAICS 3372) African American 0.00 0.00 Hispanic 0.00 0.00 Asian 0.00 6.76 0.00 *** Native American 0.00 0.00 Cape Verdean 0.00 0.02 0.00 Minority 0.00 6.78 0.00 *** Nonminority female 0.00 8.29 0.00 *** M/WBE Total 0.00 15.07 0.00 ***
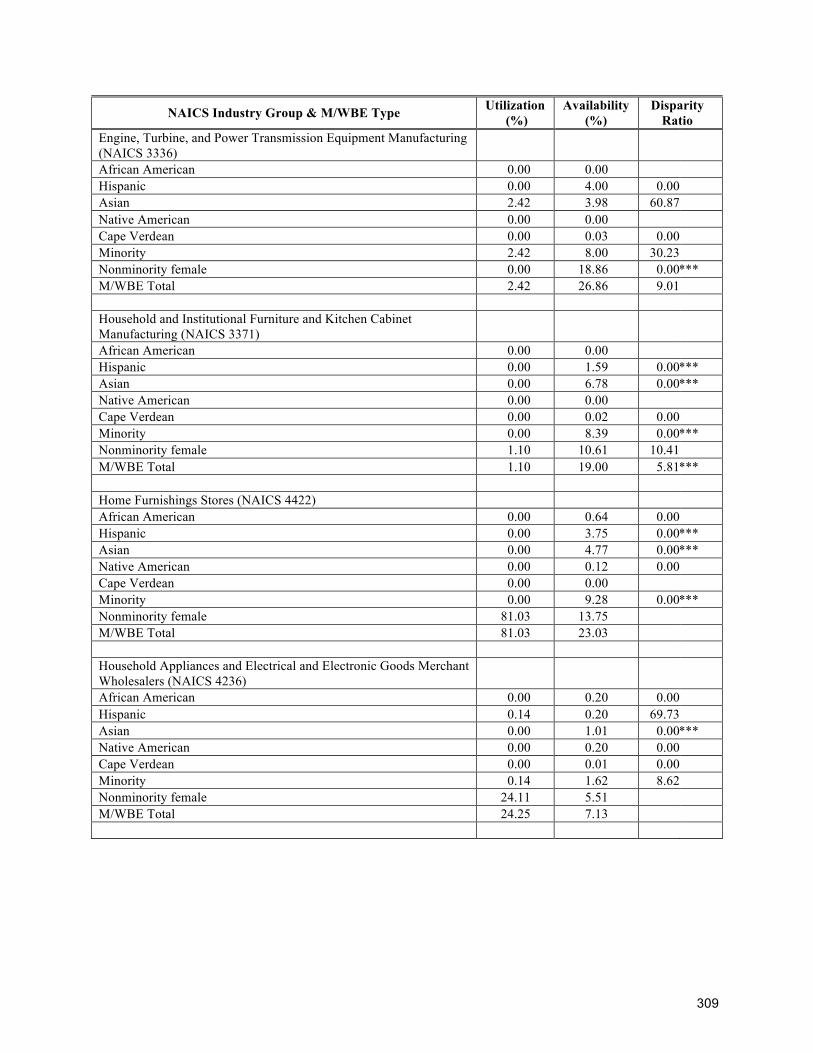
309
NAICS Industry Group & M/WBE Type Utilization (%)
Availability (%)
Disparity Ratio
Engine, Turbine, and Power Transmission Equipment Manufacturing (NAICS 3336)
African American 0.00 0.00 Hispanic 0.00 4.00 0.00 Asian 2.42 3.98 60.87 Native American 0.00 0.00 Cape Verdean 0.00 0.03 0.00 Minority 2.42 8.00 30.23 Nonminority female 0.00 18.86 0.00 *** M/WBE Total 2.42 26.86 9.01 Household and Institutional Furniture and Kitchen Cabinet Manufacturing (NAICS 3371)
African American 0.00 0.00 Hispanic 0.00 1.59 0.00 *** Asian 0.00 6.78 0.00 *** Native American 0.00 0.00 Cape Verdean 0.00 0.02 0.00 Minority 0.00 8.39 0.00 *** Nonminority female 1.10 10.61 10.41 M/WBE Total 1.10 19.00 5.81 *** Home Furnishings Stores (NAICS 4422) African American 0.00 0.64 0.00 Hispanic 0.00 3.75 0.00 *** Asian 0.00 4.77 0.00 *** Native American 0.00 0.12 0.00 Cape Verdean 0.00 0.00 Minority 0.00 9.28 0.00 *** Nonminority female 81.03 13.75 M/WBE Total 81.03 23.03 Household Appliances and Electrical and Electronic Goods Merchant Wholesalers (NAICS 4236)
African American 0.00 0.20 0.00 Hispanic 0.14 0.20 69.73 Asian 0.00 1.01 0.00 *** Native American 0.00 0.20 0.00 Cape Verdean 0.00 0.01 0.00 Minority 0.14 1.62 8.62 Nonminority female 24.11 5.51 M/WBE Total 24.25 7.13

310
NAICS Industry Group & M/WBE Type Utilization (%)
Availability (%)
Disparity Ratio
Utility System Construction (NAICS 2371) African American 0.00 2.92 0.00 *** Hispanic 25.58 1.33 Asian 0.00 0.00 Native American 0.00 0.00 Cape Verdean 0.00 1.96 0.00 Minority 25.58 6.21 Nonminority female 6.85 10.27 66.73 M/WBE Total 32.43 16.48 Miscellaneous Durable Goods Merchant Wholesalers (NAICS 4239) African American 0.00 0.62 0.00 Hispanic 0.00 1.75 0.00 Asian 0.00 3.06 0.00 Native American 0.00 0.00 Cape Verdean 0.00 0.01 0.00 Minority 0.00 5.44 0.00 *** Nonminority female 3.37 19.47 17.29 M/WBE Total 3.37 24.91 13.51 Commercial and Industrial Machinery and Equipment Rental and Leasing (NAICS 5324)
African American 0.00 0.75 0.00 *** Hispanic 0.00 1.67 0.00 *** Asian 0.00 0.33 0.00 Native American 0.00 0.08 0.00 Cape Verdean 0.00 0.03 0.00 Minority 0.00 2.86 0.00 *** Nonminority female 0.00 7.08 0.00 *** M/WBE Total 0.00 9.94 0.00 *** Furniture and Home Furnishing Merchant Wholesalers (NAICS 4232)
African American 0.00 2.66 0.00 *** Hispanic 0.00 1.69 0.00 *** Asian 1.90 1.33 Native American 0.00 0.00 Cape Verdean 0.00 1.33 0.00 *** Minority 1.90 7.02 27.04 * Nonminority female 2.27 9.07 24.96 ** M/WBE Total 4.16 16.09 25.87 ***

311
NAICS Industry Group & M/WBE Type Utilization (%)
Availability (%)
Disparity Ratio
Other General Purpose Machinery Manufacturing (NAICS 3339) African American 0.00 0.00 Hispanic 0.00 0.00 Asian 0.00 0.00 Native American 0.00 0.00 Cape Verdean 0.00 0.02 0.00 Minority 0.00 0.02 0.00 Nonminority female 0.00 33.33 0.00 *** M/WBE Total 0.00 33.35 0.00 *** Personal and Household Goods Repair and Maintenance (NAICS 8114)
African American 0.00 1.06 0.00 Hispanic 0.00 3.96 0.00 *** Asian 0.00 3.32 0.00 *** Native American 0.00 1.36 0.00 *** Cape Verdean 0.00 0.03 0.00 Minority 0.00 9.74 0.00 *** Nonminority female 33.43 26.66 M/WBE Total 33.43 36.39 91.85 Other Miscellaneous Manufacturing (NAICS 3399) African American 0.00 0.53 0.00 Hispanic 0.00 1.06 0.00 *** Asian 0.00 1.33 0.00 *** Native American 0.00 0.00 Cape Verdean 0.00 0.01 0.00 Minority 0.00 2.93 0.00 *** Nonminority female 16.69 16.61 M/WBE Total 16.69 19.54 85.44 Communications Equipment Manufacturing (NAICS 3342) African American 0.00 0.00 Hispanic 0.00 2.08 0.00 Asian 0.00 15.46 0.00 *** Native American 0.00 6.09 0.00 Cape Verdean 0.00 0.00 0.00 Minority 0.00 23.64 0.00 *** Nonminority female 0.00 1.04 0.00 M/WBE Total 0.00 24.68 0.00 ***

312
NAICS Industry Group & M/WBE Type Utilization (%)
Availability (%)
Disparity Ratio
Software Publishers (NAICS 5112) African American 0.00 0.10 0.00 Hispanic 0.00 0.20 0.00 Asian 0.00 1.74 0.00 *** Native American 0.00 0.00 Cape Verdean 0.00 0.00 0.00 Minority 0.00 2.04 0.00 *** Nonminority female 6.54 3.54 M/WBE Total 6.54 5.59 Investigation and Security Services (NAICS 5616) African American 0.00 0.00 Hispanic 7.00 1.91 Asian 0.00 1.06 0.00 Native American 0.00 0.00 Cape Verdean 0.00 0.01 0.00 Minority 7.00 2.98 Nonminority female 25.41 5.06 M/WBE Total 32.41 8.04 Ventilation, Heating, Air-Conditioning, and Commercial Refrigeration Equipment Manufacturing (NAICS 3334)
African American 0.00 0.00 Hispanic 0.00 0.00 Asian 0.00 3.70 0.00 *** Native American 0.00 0.00 Cape Verdean 0.00 0.00 0.00 Minority 0.00 3.70 0.00 *** Nonminority female 0.00 9.76 0.00 *** M/WBE Total 0.00 13.47 0.00 *** Insurance Carriers (NAICS 5241) African American 0.00 0.00 Hispanic 0.00 0.00 Asian 0.00 0.00 Native American 0.00 1.19 0.00 Cape Verdean 0.00 0.00 0.00 Minority 0.00 1.19 0.00 Nonminority female 0.00 3.10 0.00 M/WBE Total 0.00 4.29 0.00 ***

313
NAICS Industry Group & M/WBE Type Utilization (%)
Availability (%)
Disparity Ratio
Hardware Manufacturing (NAICS 3325) African American 0.00 2.35 0.00 Hispanic 0.00 0.00 Asian 0.00 0.00 Native American 0.00 0.00 Cape Verdean 0.00 0.04 0.00 Minority 0.00 2.39 0.00 Nonminority female 0.00 35.95 0.00 *** M/WBE Total 0.00 38.34 0.00 *** Commercial and Service Industry Machinery Manufacturing (NAICS 3333)
African American 0.00 0.00 Hispanic 0.00 1.63 0.00 Asian 0.00 2.44 0.00 Native American 0.00 0.00 Cape Verdean 0.00 0.00 0.00 Minority 0.00 4.07 0.00 Nonminority female 0.00 7.81 0.00 *** M/WBE Total 0.00 11.88 0.00 *** Specialized Freight Trucking (NAICS 4842) African American 5.41 0.56 Hispanic 0.00 0.56 0.00 Asian 0.03 0.00 Native American 0.00 2.26 0.00 *** Cape Verdean 0.00 0.09 0.00 Minority 5.44 3.48 Nonminority female 18.41 10.45 M/WBE Total 23.85 13.93 Medical Equipment and Supplies Manufacturing (NAICS 3391) African American 0.00 0.32 0.00 Hispanic 0.00 0.65 0.00 Asian 0.00 2.92 0.00 Native American 0.00 0.00 Cape Verdean 0.00 0.07 0.00 Minority 0.00 3.97 0.00 Nonminority female 0.00 0.33 0.00 M/WBE Total 0.00 4.29 0.00 ***

314
NAICS Industry Group & M/WBE Type Utilization (%)
Availability (%)
Disparity Ratio
Other Heavy and Civil Engineering Construction (NAICS 2379) African American 0.00 0.00 Hispanic 0.00 1.23 0.00 *** Asian 0.00 1.23 0.00 *** Native American 0.00 0.00 Cape Verdean 0.00 0.02 0.00 Minority 0.00 2.47 0.00 *** Nonminority female 22.75 8.02 M/WBE Total 22.75 10.50 Computer Systems Design and Related Services (NAICS 5415) African American 0.00 2.48 0.00 Hispanic 0.00 0.29 0.00 Asian 0.00 4.08 0.00 *** Native American 0.00 0.00 Cape Verdean 0.00 0.00 0.00 Minority 0.00 6.85 0.00 *** Nonminority female 9.40 15.17 61.97 M/WBE Total 9.40 22.02 42.69 Other Support Services (NAICS 5619) African American 0.00 0.12 0.00 Hispanic 0.00 0.39 0.00 Asian 2.80 0.12 Native American 0.00 0.01 0.00 Cape Verdean 0.00 0.08 0.00 Minority 2.80 0.72 Nonminority female 0.00 33.66 0.00 *** M/WBE Total 2.80 34.38 8.14 *** Waste Treatment and Disposal (NAICS 5622) African American 0.00 0.00 Hispanic 0.00 2.01 0.00 *** Asian 0.00 0.00 Native American 0.00 0.00 Cape Verdean 0.00 0.01 0.00 Minority 0.00 2.02 0.00 *** Nonminority female 11.43 6.38 M/WBE Total 11.43 8.40 Source and Notes: See Table 6.5.

315
Table AD.2. M/WBE Industry Group Utilization, Availability, and Disparity Results for DCAMM Construction Contracting (Dollars Paid)
NAICS Industry Group & M/WBE Type Utilization (%)
Availability (%)
Disparity Ratio
Building Equipment Contractors (NAICS 2382) African American 0.57 1.64 34.84 Hispanic 0.41 0.99 41.02 Asian 0.30 0.61 49.55 Native American 0.00 0.35 0.00 *** Cape Verdean 0.44 0.13 Minority 1.72 3.71 46.26 Nonminority female 12.25 6.33 M/WBE Total 13.97 10.04 Foundation, Structure, and Building Exterior Contractors (NAICS 2381)
African American 1.96 1.02 Hispanic 6.07 2.44 Asian 0.00 0.50 0.00 *** Native American 0.00 0.05 0.00 Cape Verdean 0.11 0.24 46.11 Minority 8.14 4.25 Nonminority female 9.83 8.08 M/WBE Total 17.97 12.33 Nonresidential Building Construction (NAICS 2362) African American 1.15 1.71 67.70 Hispanic 0.29 1.15 25.27 Asian 0.67 0.60 Native American 0.02 0.70 2.79 Cape Verdean 0.00 0.01 0.00 Minority 2.13 4.17 51.18 Nonminority female 0.87 9.92 8.82 *** M/WBE Total 3.01 14.09 21.36 *** Other Specialty Trade Contractors (NAICS 2389) African American 5.40 2.05 Hispanic 3.32 1.78 Asian 0.04 0.40 9.27 Native American 0.00 0.17 0.00 ** Cape Verdean 0.00 0.07 0.00 Minority 8.75 4.47 Nonminority female 16.78 9.71 M/WBE Total 25.53 14.18

316
NAICS Industry Group & M/WBE Type Utilization (%)
Availability (%)
Disparity Ratio
Building Finishing Contractors (NAICS 2383) African American 0.38 2.95 12.86 *** Hispanic 0.48 4.56 10.58 *** Asian 0.00 1.88 0.00 *** Native American 0.00 0.03 0.00 Cape Verdean 0.00 0.28 0.00 *** Minority 0.86 9.71 8.89 *** Nonminority female 14.92 9.47 M/WBE Total 15.78 19.18 82.28 Architectural and Structural Metals Manufacturing (NAICS 3323) African American 0.01 0.00 Hispanic 0.00 1.94 0.00 *** Asian 3.04 0.82 Native American 0.00 0.00 Cape Verdean 0.00 0.01 0.00 Minority 3.05 2.77 Nonminority female 1.74 14.85 11.71 *** M/WBE Total 4.79 17.62 27.17 *** Architectural, Engineering, and Related Services (NAICS 5413) African American 0.43 1.49 28.74 ** Hispanic 0.13 0.91 14.02 *** Asian 1.08 2.24 48.21 Native American 0.26 0.16 Cape Verdean 0.00 0.18 0.00 *** Minority 1.90 4.98 38.14 *** Nonminority female 10.52 9.85 M/WBE Total 12.41 14.83 83.71 Highway, Street, and Bridge Construction (NAICS 2373) African American 0.59 0.16 Hispanic 4.09 0.32 Asian 7.21 0.48 Native American 0.00 0.00 Cape Verdean 0.00 0.00 0.00 Minority 11.89 0.96 Nonminority female 0.00 4.60 0.00 *** M/WBE Total 11.89 5.57 Remediation and Other Waste Management Services (NAICS 5629) African American 0.93 3.86 24.13 Hispanic 55.18 8.74 Asian 0.00 1.93 0.00 *** Native American 0.00 0.00 Cape Verdean 0.00 0.04 0.00 Minority 56.12 14.57 Nonminority female 5.31 16.99 31.23 M/WBE Total 61.42 31.56

317
NAICS Industry Group & M/WBE Type Utilization (%)
Availability (%)
Disparity Ratio
Professional and Commercial Equipment and Supplies Merchant Wholesalers (NAICS 4234)
African American 0.96 0.94 Hispanic 0.00 1.96 0.00 *** Asian 0.00 0.66 0.00 ** Native American 0.00 0.00 Cape Verdean 0.00 0.01 0.00 Minority 0.96 3.57 26.79 Nonminority female 64.13 7.44 M/WBE Total 65.09 11.01 Machinery, Equipment, and Supplies Merchant Wholesalers (NAICS 4238)
African American 0.00 0.56 0.00 *** Hispanic 0.00 1.59 0.00 *** Asian 0.00 1.60 0.00 *** Native American 0.00 0.36 0.00 *** Cape Verdean 0.00 0.02 0.00 Minority 0.00 4.13 0.00 *** Nonminority female 0.32 7.55 4.27 *** M/WBE Total 0.32 11.68 2.76 *** Services to Buildings and Dwellings (NAICS 5617) African American 0.17 2.25 7.71 Hispanic 27.06 1.43 Asian 0.00 0.47 0.00 ** Native American 0.00 0.33 0.00 Cape Verdean 0.00 0.10 0.00 Minority 27.24 4.58 Nonminority female 12.59 9.96 M/WBE Total 39.82 14.54 Other Wood Product Manufacturing (NAICS 3219) African American 3.58 0.00 Hispanic 0.00 1.44 0.00 *** Asian 0.00 0.58 0.00 Native American 0.00 0.00 Cape Verdean 0.00 0.01 0.00 Minority 3.58 2.02 Nonminority female 2.93 5.63 52.13 M/WBE Total 6.51 7.65 85.09

318
NAICS Industry Group & M/WBE Type Utilization (%)
Availability (%)
Disparity Ratio
Cement and Concrete Product Manufacturing (NAICS 3273) African American 0.00 0.00 Hispanic 0.00 4.33 0.00 *** Asian 0.00 1.92 0.00 *** Native American 0.00 0.00 Cape Verdean 0.00 0.02 0.00 Minority 0.00 6.28 0.00 *** Nonminority female 0.00 8.69 0.00 *** M/WBE Total 0.00 14.97 0.00 *** Lumber and Other Construction Materials Merchant Wholesalers (NAICS 4233)
African American 0.73 0.00 Hispanic 0.00 3.64 0.00 *** Asian 0.00 1.14 0.00 *** Native American 0.00 0.00 Cape Verdean 0.00 0.20 0.00 Minority 0.73 4.98 14.74 * Nonminority female 22.59 7.55 M/WBE Total 23.33 12.53 Management, Scientific, and Technical Consulting Services (NAICS 5416)
African American 0.00 0.37 0.00 *** Hispanic 14.46 0.80 Asian 4.40 0.90 Native American 0.00 0.02 0.00 Cape Verdean 0.00 0.03 0.00 Minority 18.86 2.11 Nonminority female 14.49 13.44 M/WBE Total 33.35 15.55 Hardware, and Plumbing and Heating Equipment and Supplies Merchant Wholesalers (NAICS 4237)
African American 0.06 1.23 4.94 Hispanic 0.26 0.31 83.36 Asian 0.00 0.31 0.00 *** Native American 0.00 0.00 Cape Verdean 0.00 0.00 0.00 Minority 0.32 1.85 17.28 Nonminority female 0.00 3.89 0.00 *** M/WBE Total 0.32 5.74 5.58 **
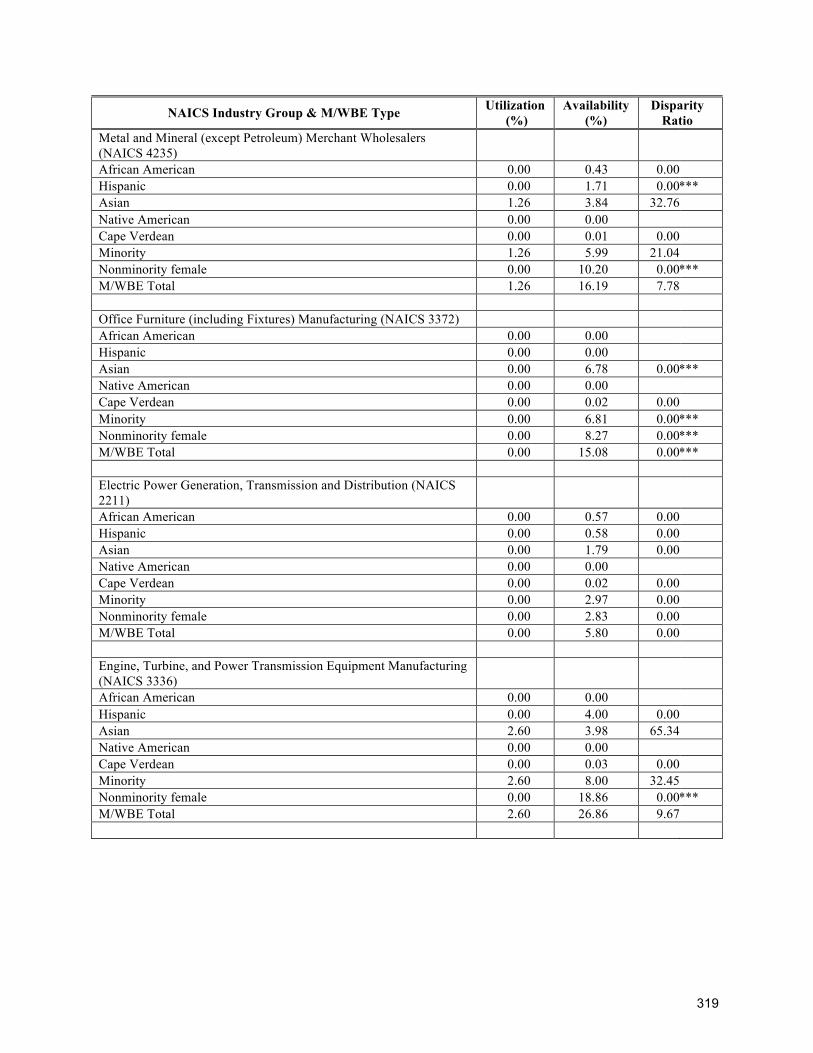
319
NAICS Industry Group & M/WBE Type Utilization (%)
Availability (%)
Disparity Ratio
Metal and Mineral (except Petroleum) Merchant Wholesalers (NAICS 4235)
African American 0.00 0.43 0.00 Hispanic 0.00 1.71 0.00 *** Asian 1.26 3.84 32.76 Native American 0.00 0.00 Cape Verdean 0.00 0.01 0.00 Minority 1.26 5.99 21.04 Nonminority female 0.00 10.20 0.00 *** M/WBE Total 1.26 16.19 7.78 Office Furniture (including Fixtures) Manufacturing (NAICS 3372) African American 0.00 0.00 Hispanic 0.00 0.00 Asian 0.00 6.78 0.00 *** Native American 0.00 0.00 Cape Verdean 0.00 0.02 0.00 Minority 0.00 6.81 0.00 *** Nonminority female 0.00 8.27 0.00 *** M/WBE Total 0.00 15.08 0.00 *** Electric Power Generation, Transmission and Distribution (NAICS 2211)
African American 0.00 0.57 0.00 Hispanic 0.00 0.58 0.00 Asian 0.00 1.79 0.00 Native American 0.00 0.00 Cape Verdean 0.00 0.02 0.00 Minority 0.00 2.97 0.00 Nonminority female 0.00 2.83 0.00 M/WBE Total 0.00 5.80 0.00 Engine, Turbine, and Power Transmission Equipment Manufacturing (NAICS 3336)
African American 0.00 0.00 Hispanic 0.00 4.00 0.00 Asian 2.60 3.98 65.34 Native American 0.00 0.00 Cape Verdean 0.00 0.03 0.00 Minority 2.60 8.00 32.45 Nonminority female 0.00 18.86 0.00 *** M/WBE Total 2.60 26.86 9.67

320
NAICS Industry Group & M/WBE Type Utilization (%)
Availability (%)
Disparity Ratio
Home Furnishings Stores (NAICS 4422) African American 0.00 0.64 0.00 Hispanic 0.00 3.75 0.00 *** Asian 0.00 4.77 0.00 *** Native American 0.00 0.12 0.00 Cape Verdean 0.00 0.00 Minority 0.00 9.28 0.00 *** Nonminority female 81.52 13.75 M/WBE Total 81.52 23.03 Household and Institutional Furniture and Kitchen Cabinet Manufacturing (NAICS 3371)
African American 0.00 0.00 Hispanic 0.00 1.45 0.00 ** Asian 0.00 8.04 0.00 *** Native American 0.00 0.00 Cape Verdean 0.00 0.03 0.00 Minority 0.00 9.51 0.00 *** Nonminority female 0.60 11.78 5.09 ** M/WBE Total 0.60 21.30 2.82 *** Household Appliances and Electrical and Electronic Goods Merchant Wholesalers (NAICS 4236)
African American 0.00 0.20 0.00 Hispanic 0.15 0.20 74.41 Asian 0.00 1.01 0.00 ** Native American 0.00 0.20 0.00 Cape Verdean 0.00 0.01 0.00 Minority 0.15 1.62 9.20 Nonminority female 25.38 5.51 M/WBE Total 25.53 7.13 Utility System Construction (NAICS 2371) African American 0.00 2.92 0.00 *** Hispanic 28.38 1.33 Asian 0.00 0.00 Native American 0.00 0.00 Cape Verdean 0.00 1.96 0.00 Minority 28.38 6.21 Nonminority female 1.44 10.27 14.03 M/WBE Total 29.82 16.48

321
NAICS Industry Group & M/WBE Type Utilization (%)
Availability (%)
Disparity Ratio
Miscellaneous Durable Goods Merchant Wholesalers (NAICS 4239) African American 0.00 0.62 0.00 Hispanic 0.00 1.75 0.00 Asian 0.00 3.06 0.00 Native American 0.00 0.00 Cape Verdean 0.00 0.01 0.00 Minority 0.00 5.44 0.00 *** Nonminority female 3.38 19.46 17.37 M/WBE Total 3.38 24.90 13.57 Commercial and Industrial Machinery and Equipment Rental and Leasing (NAICS 5324)
African American 0.00 0.75 0.00 *** Hispanic 0.00 1.67 0.00 *** Asian 0.00 0.33 0.00 Native American 0.00 0.08 0.00 Cape Verdean 0.00 0.03 0.00 Minority 0.00 2.86 0.00 *** Nonminority female 0.00 7.10 0.00 *** M/WBE Total 0.00 9.97 0.00 *** Furniture and Home Furnishing Merchant Wholesalers (NAICS 4232)
African American 0.00 2.66 0.00 *** Hispanic 0.00 1.69 0.00 *** Asian 2.02 1.33 Native American 0.00 0.00 Cape Verdean 0.00 1.33 0.00 *** Minority 2.02 7.02 28.74 * Nonminority female 2.43 9.07 26.82 ** M/WBE Total 4.45 16.09 27.66 *** Other General Purpose Machinery Manufacturing (NAICS 3339) African American 0.00 0.00 Hispanic 0.00 0.00 Asian 0.00 0.00 Native American 0.00 0.00 Cape Verdean 0.00 0.02 0.00 Minority 0.00 0.02 0.00 Nonminority female 0.00 33.33 0.00 *** M/WBE Total 0.00 33.35 0.00 ***

322
NAICS Industry Group & M/WBE Type Utilization (%)
Availability (%)
Disparity Ratio
Personal and Household Goods Repair and Maintenance (NAICS 8114)
African American 0.00 1.06 0.00 Hispanic 0.00 3.96 0.00 *** Asian 0.00 3.32 0.00 *** Native American 0.00 1.36 0.00 *** Cape Verdean 0.00 0.03 0.00 Minority 0.00 9.74 0.00 *** Nonminority female 33.59 26.66 M/WBE Total 33.59 36.39 92.31 Communications Equipment Manufacturing (NAICS 3342) African American 0.00 0.00 Hispanic 0.00 2.08 0.00 Asian 0.00 15.46 0.00 *** Native American 0.00 6.09 0.00 Cape Verdean 0.00 0.00 0.00 Minority 0.00 23.64 0.00 *** Nonminority female 0.00 1.04 0.00 M/WBE Total 0.00 24.68 0.00 *** Other Miscellaneous Manufacturing (NAICS 3399) African American 0.00 0.53 0.00 Hispanic 0.00 1.06 0.00 ** Asian 0.00 1.33 0.00 ** Native American 0.00 0.00 Cape Verdean 0.00 0.01 0.00 Minority 0.00 2.93 0.00 *** Nonminority female 17.43 16.61 M/WBE Total 17.43 19.54 89.20 Insurance Carriers (NAICS 5241) African American 0.00 0.00 Hispanic 0.00 0.00 Asian 0.00 0.00 Native American 0.00 1.19 0.00 Cape Verdean 0.00 0.00 0.00 Minority 0.00 1.19 0.00 Nonminority female 0.00 3.10 0.00 M/WBE Total 0.00 4.29 0.00 ***

323
NAICS Industry Group & M/WBE Type Utilization (%)
Availability (%)
Disparity Ratio
Ventilation, Heating, Air-Conditioning, and Commercial Refrigeration Equipment Manufacturing (NAICS 3334)
African American 0.00 0.00 Hispanic 0.00 0.00 Asian 0.00 3.70 0.00 *** Native American 0.00 0.00 Cape Verdean 0.00 0.00 0.00 Minority 0.00 3.70 0.00 *** Nonminority female 0.00 9.76 0.00 *** M/WBE Total 0.00 13.47 0.00 *** Hardware Manufacturing (NAICS 3325) African American 0.00 2.35 0.00 Hispanic 0.00 0.00 Asian 0.00 0.00 Native American 0.00 0.00 Cape Verdean 0.00 0.04 0.00 Minority 0.00 2.39 0.00 Nonminority female 0.00 35.95 0.00 *** M/WBE Total 0.00 38.34 0.00 *** Software Publishers (NAICS 5112) African American 0.00 0.10 0.00 Hispanic 0.00 0.20 0.00 Asian 0.00 1.74 0.00 *** Native American 0.00 0.00 Cape Verdean 0.00 0.00 0.00 Minority 0.00 2.04 0.00 *** Nonminority female 8.74 3.54 M/WBE Total 8.74 5.59 Commercial and Service Industry Machinery Manufacturing (NAICS 3333)
African American 0.00 0.00 Hispanic 0.00 1.63 0.00 Asian 0.00 2.44 0.00 Native American 0.00 0.00 Cape Verdean 0.00 0.00 0.00 Minority 0.00 4.07 0.00 Nonminority female 0.00 7.81 0.00 *** M/WBE Total 0.00 11.88 0.00 ***

324
NAICS Industry Group & M/WBE Type Utilization (%)
Availability (%)
Disparity Ratio
Specialized Freight Trucking (NAICS 4842) African American 3.22 0.56 Hispanic 0.00 0.56 0.00 Asian 0.03 0.00 Native American 0.00 2.26 0.00 ** Cape Verdean 0.00 0.09 0.00 Minority 3.25 3.48 93.47 Nonminority female 11.93 10.45 M/WBE Total 15.18 13.93 Medical Equipment and Supplies Manufacturing (NAICS 3391) African American 0.00 0.32 0.00 Hispanic 0.00 0.65 0.00 Asian 0.00 2.92 0.00 Native American 0.00 0.00 Cape Verdean 0.00 0.07 0.00 Minority 0.00 3.97 0.00 Nonminority female 0.00 0.33 0.00 M/WBE Total 0.00 4.29 0.00 *** Other Heavy and Civil Engineering Construction (NAICS 2379) African American 0.00 0.00 Hispanic 0.00 1.23 0.00 *** Asian 0.00 1.23 0.00 *** Native American 0.00 0.00 Cape Verdean 0.00 0.02 0.00 Minority 0.00 2.47 0.00 *** Nonminority female 22.40 8.02 M/WBE Total 22.40 10.50 Computer Systems Design and Related Services (NAICS 5415) African American 0.00 2.48 0.00 Hispanic 0.00 0.29 0.00 Asian 0.00 4.08 0.00 *** Native American 0.00 0.00 Cape Verdean 0.00 0.00 0.00 Minority 0.00 6.85 0.00 *** Nonminority female 9.76 15.17 64.32 M/WBE Total 9.76 22.02 44.32 Other Support Services (NAICS 5619) African American 0.00 0.12 0.00 Hispanic 0.00 0.39 0.00 Asian 3.88 0.12 Native American 0.00 0.01 0.00 Cape Verdean 0.00 0.08 0.00 Minority 3.88 0.72 Nonminority female 0.00 33.66 0.00 *** M/WBE Total 3.88 34.38 11.28 ***
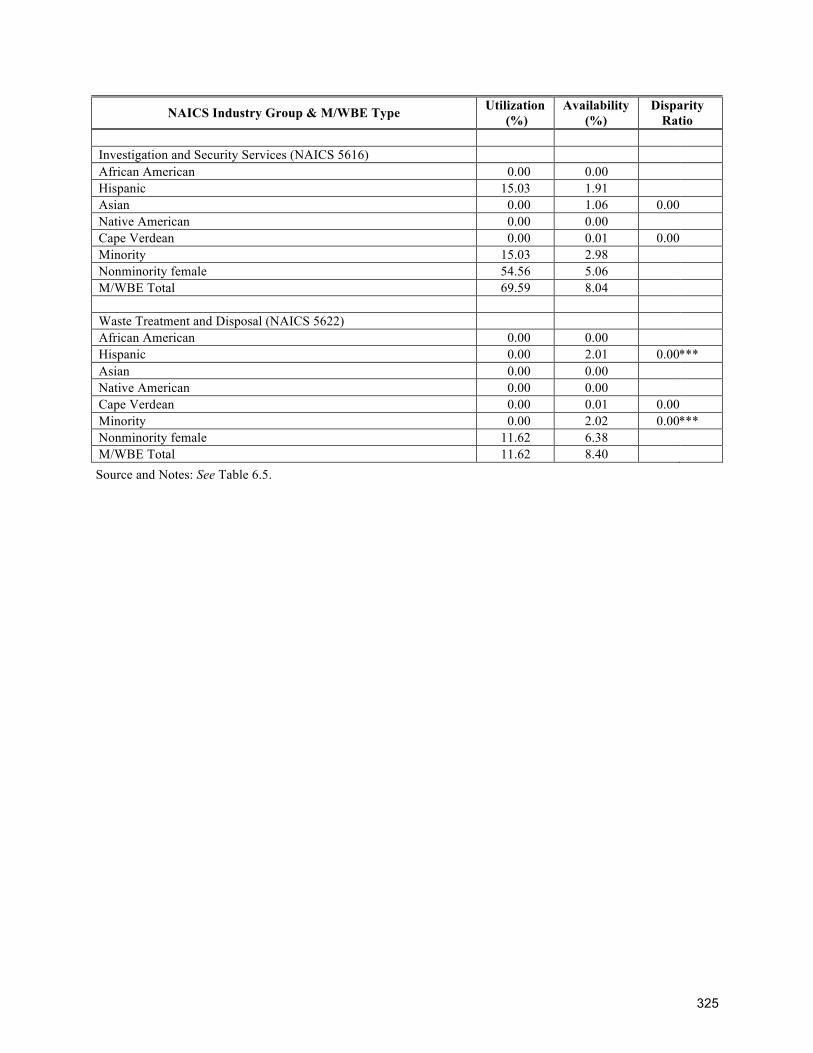
325
NAICS Industry Group & M/WBE Type Utilization (%)
Availability (%)
Disparity Ratio
Investigation and Security Services (NAICS 5616) African American 0.00 0.00 Hispanic 15.03 1.91 Asian 0.00 1.06 0.00 Native American 0.00 0.00 Cape Verdean 0.00 0.01 0.00 Minority 15.03 2.98 Nonminority female 54.56 5.06 M/WBE Total 69.59 8.04 Waste Treatment and Disposal (NAICS 5622) African American 0.00 0.00 Hispanic 0.00 2.01 0.00 *** Asian 0.00 0.00 Native American 0.00 0.00 Cape Verdean 0.00 0.01 0.00 Minority 0.00 2.02 0.00 *** Nonminority female 11.62 6.38 M/WBE Total 11.62 8.40 Source and Notes: See Table 6.5.

326
Table AD.3. M/WBE Industry Group Utilization, Availability, and Disparity Results for DCAMM Design Contracting (Dollars Awarded)
NAICS Industry Group & M/WBE Type Utilization (%)
Availability (%)
Disparity Ratio
Architectural, Engineering, and Related Services (NAICS 5413) African American 0.36 1.60 22.50 *** Hispanic 0.80 1.36 58.53 Asian 7.13 1.99 Native American 0.01 0.27 3.06 *** Cape Verdean 0.23 0.20 Minority 8.52 5.43 Nonminority female 17.38 10.52 M/WBE Total 25.89 15.94 Management, Scientific, and Technical Consulting Services (NAICS 5416)
African American 0.09 0.54 17.18 Hispanic 0.00 0.72 0.00 *** Asian 4.89 0.75 Native American 0.00 0.14 0.00 *** Cape Verdean 0.00 0.05 0.00 Minority 4.98 2.20 Nonminority female 4.20 12.65 33.21 *** M/WBE Total 9.18 14.85 61.85 ** Other Support Services (NAICS 5619) African American 0.00 0.12 0.00 Hispanic 0.00 0.39 0.00 Asian 58.96 0.12 Native American 0.00 0.01 0.00 Cape Verdean 0.00 0.08 0.00 Minority 58.96 0.72 Nonminority female 21.21 33.66 63.02 M/WBE Total 80.17 34.38 Other Professional, Scientific, and Technical Services (NAICS 5419) African American 0.00 0.00 Hispanic 0.00 1.09 0.00 Asian 0.00 1.58 0.00 *** Native American 0.00 0.10 0.00 Cape Verdean 0.00 0.02 0.00 Minority 0.00 2.80 0.00 *** Nonminority female 69.82 34.52 M/WBE Total 69.82 37.32

327
NAICS Industry Group & M/WBE Type Utilization (%)
Availability (%)
Disparity Ratio
Software Publishers (NAICS 5112) African American 0.00 0.10 0.00 Hispanic 0.00 0.20 0.00 Asian 0.00 1.74 0.00 *** Native American 0.00 0.00 Cape Verdean 0.00 0.00 0.00 Minority 0.00 2.04 0.00 *** Nonminority female 0.00 3.54 0.00 *** M/WBE Total 0.00 5.59 0.00 *** Computer Systems Design and Related Services (NAICS 5415) African American 0.00 2.48 0.00 Hispanic 0.00 0.29 0.00 Asian 0.00 4.08 0.00 *** Native American 0.00 0.00 Cape Verdean 0.00 0.00 0.00 Minority 0.00 6.85 0.00 *** Nonminority female 0.00 15.17 0.00 *** M/WBE Total 0.00 22.02 0.00 *** Specialized Design Services (NAICS 5414) African American 0.00 1.21 0.00 Hispanic 0.00 1.75 0.00 Asian 0.00 0.55 0.00 Native American 0.00 0.09 0.00 Cape Verdean 0.00 0.00 0.00 Minority 0.00 3.61 0.00 *** Nonminority female 52.63 16.82 M/WBE Total 52.63 20.43 Source and Notes: See Table 6.5.

328
Table AD.4. M/WBE Industry Group Utilization, Availability, and Disparity Results for DCAMM Design Contracting (Dollars Paid)
NAICS Industry Group & M/WBE Type Utilization (%)
Availability (%)
Disparity Ratio
Architectural, Engineering, and Related Services (NAICS 5413) African American 0.32 1.60 20.28 *** Hispanic 0.72 1.35 53.68 Asian 7.31 2.00 Native American 0.01 0.27 3.31 *** Cape Verdean 0.23 0.20 Minority 8.60 5.41 Nonminority female 18.14 10.48 M/WBE Total 26.74 15.89 Management, Scientific, and Technical Consulting Services (NAICS 5416)
African American 0.13 0.54 23.90 Hispanic 0.00 0.72 0.00 *** Asian 4.64 0.75 Native American 0.00 0.14 0.00 *** Cape Verdean 0.00 0.05 0.00 Minority 4.77 2.20 Nonminority female 3.58 12.59 28.43 *** M/WBE Total 8.34 14.79 56.42 *** Other Support Services (NAICS 5619) African American 0.00 0.12 0.00 Hispanic 0.00 0.39 0.00 Asian 62.78 0.12 Native American 0.00 0.01 0.00 Cape Verdean 0.00 0.08 0.00 Minority 62.78 0.72 Nonminority female 19.26 33.66 57.22 * M/WBE Total 82.04 34.38 Other Professional, Scientific, and Technical Services (NAICS 5419) African American 0.00 0.00 Hispanic 0.00 1.09 0.00 Asian 0.00 1.58 0.00 *** Native American 0.00 0.10 0.00 Cape Verdean 0.00 0.02 0.00 Minority 0.00 2.80 0.00 *** Nonminority female 69.63 34.52 M/WBE Total 69.63 37.32

329
NAICS Industry Group & M/WBE Type Utilization (%)
Availability (%)
Disparity Ratio
Software Publishers (NAICS 5112) African American 0.00 0.10 0.00 Hispanic 0.00 0.20 0.00 Asian 0.00 1.74 0.00 *** Native American 0.00 0.00 Cape Verdean 0.00 0.00 0.00 Minority 0.00 2.04 0.00 *** Nonminority female 0.00 3.54 0.00 *** M/WBE Total 0.00 5.59 0.00 *** Computer Systems Design and Related Services (NAICS 5415) African American 0.00 2.48 0.00 Hispanic 0.00 0.29 0.00 Asian 0.00 4.08 0.00 *** Native American 0.00 0.00 Cape Verdean 0.00 0.00 0.00 Minority 0.00 6.85 0.00 *** Nonminority female 0.00 15.17 0.00 *** M/WBE Total 0.00 22.02 0.00 *** Specialized Design Services (NAICS 5414) African American 0.00 1.21 0.00 Hispanic 0.00 1.75 0.00 Asian 0.00 0.55 0.00 Native American 0.00 0.09 0.00 Cape Verdean 0.00 0.00 0.00 Minority 0.00 3.61 0.00 *** Nonminority female 53.67 16.82 M/WBE Total 53.67 20.43 Source and Notes: See Table 6.5.

330
Table AD.5. PBE Industry Group Utilization, Availability, and Disparity Results for DCAMM Construction Contracting (Dollars Awarded)
NAICS Industry Group & PBE Type Utilization (%)
Availability (%)
Disparity Ratio
Building Equipment Contractors (NAICS 2382) Via Portugal 0.57 1.78 32.06 Via Brazil 0.08 0.78 10.71 All Portuguese 0.66 2.56 25.55 ** Foundation, Structure, and Building Exterior Contractors (NAICS 2381)
Via Portugal 23.06 1.50 Via Brazil 0.01 1.54 0.58 *** All Portuguese 23.07 3.04 Nonresidential Building Construction (NAICS 2362) Via Portugal 0.43 0.52 81.82 Via Brazil 0.02 1.31 1.84 * All Portuguese 0.45 1.83 24.75 Other Specialty Trade Contractors (NAICS 2389) Via Portugal 0.24 3.40 7.20 *** Via Brazil 0.00 1.85 0.00 *** All Portuguese 0.24 5.25 4.66 *** Building Finishing Contractors (NAICS 2383) Via Portugal 4.15 3.58 Via Brazil 0.00 2.33 0.00 *** All Portuguese 4.15 5.91 70.23 Architectural, Engineering, and Related Services (NAICS 5413) Via Portugal 0.00 0.85 0.26 *** Via Brazil 0.00 0.22 0.00 *** All Portuguese 0.00 1.07 0.21 *** Architectural and Structural Metals Manufacturing (NAICS 3323) Via Portugal 0.00 0.11 0.00 Via Brazil 0.00 0.10 0.00 All Portuguese 0.00 0.21 0.00 Highway, Street, and Bridge Construction (NAICS 2373) Via Portugal 0.42 1.04 40.79 Via Brazil 4.65 2.23 All Portuguese 5.07 3.27 Electric Power Generation, Transmission and Distribution (NAICS 2211)
Via Portugal 0.00 0.21 0.00 Via Brazil 0.00 0.08 0.00 All Portuguese 0.00 0.30 0.00

331
NAICS Industry Group & PBE Type Utilization (%)
Availability (%)
Disparity Ratio
Remediation and Other Waste Management Services (NAICS 5629) Via Portugal 0.44 0.90 49.47 Via Brazil 0.48 0.57 83.85 All Portuguese 0.92 1.46 62.81 Professional and Commercial Equipment and Supplies Merchant Wholesalers (NAICS 4234)
Via Portugal 0.00 0.45 0.00 Via Brazil 0.00 0.27 0.00 All Portuguese 0.00 0.72 0.00 *** Machinery, Equipment, and Supplies Merchant Wholesalers (NAICS 4238)
Via Portugal 0.00 0.20 0.00 Via Brazil 0.00 0.19 0.00 All Portuguese 0.00 0.38 0.00 *** Services to Buildings and Dwellings (NAICS 5617) Via Portugal 29.78 1.33 Via Brazil 0.47 2.63 17.90 All Portuguese 30.25 3.96 Other Wood Product Manufacturing (NAICS 3219) Via Portugal 0.00 0.11 0.00 Via Brazil 0.00 0.18 0.00 All Portuguese 0.00 0.29 0.00 Management, Scientific, and Technical Consulting Services (NAICS 5416)
Via Portugal 0.00 0.78 0.00 *** Via Brazil 0.00 0.10 0.00 *** All Portuguese 0.00 0.87 0.00 *** Lumber and Other Construction Materials Merchant Wholesalers (NAICS 4233)
Via Portugal 0.00 0.69 0.00 *** Via Brazil 0.00 0.43 0.00 *** All Portuguese 0.00 1.12 0.00 *** Cement and Concrete Product Manufacturing (NAICS 3273) Via Portugal 0.00 0.79 0.00 Via Brazil 0.00 0.58 0.00 All Portuguese 0.00 1.37 0.00 Hardware, and Plumbing and Heating Equipment and Supplies Merchant Wholesalers (NAICS 4237)
Via Portugal 0.00 0.05 0.00 Via Brazil 0.00 0.30 0.00 *** All Portuguese 0.00 0.35 0.00 ***

332
NAICS Industry Group & PBE Type Utilization (%)
Availability (%)
Disparity Ratio
Metal and Mineral (except Petroleum) Merchant Wholesalers (NAICS 4235)
Via Portugal 0.00 2.21 0.00 *** Via Brazil 0.00 0.18 0.00 All Portuguese 0.00 2.39 0.00 *** Office Furniture (including Fixtures) Manufacturing (NAICS 3372) Via Portugal 0.00 0.00 0.00 Via Brazil 0.00 0.03 0.00 All Portuguese 0.00 0.04 0.00 Engine, Turbine, and Power Transmission Equipment Manufacturing (NAICS 3336)
Via Portugal 0.00 0.16 0.00 Via Brazil 0.00 0.24 0.00 All Portuguese 0.00 0.40 0.00 Household and Institutional Furniture and Kitchen Cabinet Manufacturing (NAICS 3371)
Via Portugal 0.00 0.14 0.00 Via Brazil 0.00 0.03 0.00 All Portuguese 0.00 0.18 0.00 Home Furnishings Stores (NAICS 4422) Via Portugal 0.00 4.15 0.00 *** Via Brazil 0.00 1.04 0.00 All Portuguese 0.00 5.19 0.00 *** Household Appliances and Electrical and Electronic Goods Merchant Wholesalers (NAICS 4236)
Via Portugal 0.00 0.05 0.00 Via Brazil 0.00 0.03 0.00 All Portuguese 0.00 0.08 0.00 Utility System Construction (NAICS 2371) Via Portugal 0.00 3.16 0.00 *** Via Brazil 4.63 0.07 All Portuguese 4.63 3.23 Miscellaneous Durable Goods Merchant Wholesalers (NAICS 4239) Via Portugal 0.00 0.21 0.00 Via Brazil 0.00 0.28 0.00 All Portuguese 0.00 0.50 0.00 Commercial and Industrial Machinery and Equipment Rental and Leasing (NAICS 5324)
Via Portugal 0.00 0.23 0.00 Via Brazil 0.00 0.26 0.00 All Portuguese 0.00 0.49 0.00

333
NAICS Industry Group & PBE Type Utilization (%)
Availability (%)
Disparity Ratio
Furniture and Home Furnishing Merchant Wholesalers (NAICS 4232)
Via Portugal 0.00 0.15 0.00 Via Brazil 0.00 1.44 0.00 *** All Portuguese 0.00 1.58 0.00 *** Other General Purpose Machinery Manufacturing (NAICS 3339) Via Portugal 0.00 0.09 0.00 Via Brazil 0.00 0.68 0.00 All Portuguese 0.00 0.77 0.00 Personal and Household Goods Repair and Maintenance (NAICS 8114)
Via Portugal 0.00 3.17 0.00 *** Via Brazil 0.00 0.07 0.00 All Portuguese 0.00 3.23 0.00 *** Other Miscellaneous Manufacturing (NAICS 3399) Via Portugal 0.00 1.68 0.00 *** Via Brazil 0.00 2.23 0.00 *** All Portuguese 0.00 3.92 0.00 *** Communications Equipment Manufacturing (NAICS 3342) Via Portugal 0.00 0.07 0.00 Via Brazil 0.00 0.06 0.00 All Portuguese 0.00 0.13 0.00 Software Publishers (NAICS 5112) Via Portugal 0.00 0.04 0.00 Via Brazil 0.00 0.03 0.00 All Portuguese 0.00 0.06 0.00 Investigation and Security Services (NAICS 5616) Via Portugal 0.00 0.21 0.00 Via Brazil 0.00 0.16 0.00 All Portuguese 0.00 0.37 0.00 Ventilation, Heating, Air-Conditioning, and Commercial Refrigeration Equipment Manufacturing (NAICS 3334)
Via Portugal 0.00 0.00 0.00 Via Brazil 0.00 0.04 0.00 All Portuguese 0.00 0.04 0.00 Insurance Carriers (NAICS 5241) Via Portugal 0.00 0.11 0.00 Via Brazil 0.00 1.27 0.00 All Portuguese 0.00 1.37 0.00

334
NAICS Industry Group & PBE Type Utilization (%)
Availability (%)
Disparity Ratio
Hardware Manufacturing (NAICS 3325) Via Portugal 0.00 0.16 0.00 Via Brazil 0.00 9.00 0.00 All Portuguese 0.00 9.16 0.00 Commercial and Service Industry Machinery Manufacturing (NAICS 3333)
Via Portugal 0.00 0.00 Via Brazil 0.00 2.03 0.00 All Portuguese 0.00 2.03 0.00 Specialized Freight Trucking (NAICS 4842) Via Portugal 0.00 0.57 0.00 Via Brazil 0.00 6.24 0.00 *** All Portuguese 0.00 6.81 0.00 *** Medical Equipment and Supplies Manufacturing (NAICS 3391) Via Portugal 0.00 0.40 0.00 Via Brazil 0.00 0.49 0.00 All Portuguese 0.00 0.88 0.00 Other Heavy and Civil Engineering Construction (NAICS 2379) Via Portugal 0.00 0.26 0.00 Via Brazil 0.00 0.23 0.00 All Portuguese 0.00 0.50 0.00 Computer Systems Design and Related Services (NAICS 5415) Via Portugal 0.00 0.23 0.00 Via Brazil 0.00 0.47 0.00 All Portuguese 0.00 0.70 0.00 Other Support Services (NAICS 5619) Via Portugal 0.00 0.35 0.00 Via Brazil 0.00 0.56 0.00 *** All Portuguese 0.00 0.91 0.00 *** Waste Treatment and Disposal (NAICS 5622) Via Portugal 0.00 0.48 0.00 Via Brazil 0.00 0.41 0.00 All Portuguese 0.00 0.89 0.00 Source and Notes: See Table 6.5.

335
Table AD.6. PBE Industry Group Utilization, Availability, and Disparity Results for DCAMM Construction Contracting (Dollars Paid)
NAICS Industry Group & PBE Type Utilization (%)
Availability (%)
Disparity Ratio
Building Equipment Contractors (NAICS 2382) Via Portugal 0.61 1.79 33.89 Via Brazil 0.08 0.78 10.84 All Portuguese 0.69 2.57 26.88 ** Foundation, Structure, and Building Exterior Contractors (NAICS 2381)
Via Portugal 22.82 1.50 Via Brazil 0.01 1.54 0.61 *** All Portuguese 22.83 3.04 Nonresidential Building Construction (NAICS 2362) Via Portugal 0.52 0.52 99.23 Via Brazil 0.03 1.31 2.00 * All Portuguese 0.55 1.83 29.84 Other Specialty Trade Contractors (NAICS 2389) Via Portugal 0.25 3.39 7.40 *** Via Brazil 0.00 1.85 0.00 *** All Portuguese 0.25 5.25 4.79 *** Building Finishing Contractors (NAICS 2383) Via Portugal 4.10 3.59 Via Brazil 0.00 2.33 0.00 *** All Portuguese 4.10 5.92 69.31 Architectural and Structural Metals Manufacturing (NAICS 3323) Via Portugal 0.00 0.11 0.00 Via Brazil 0.00 0.10 0.00 All Portuguese 0.00 0.21 0.00 Architectural, Engineering, and Related Services (NAICS 5413) Via Portugal 0.00 0.83 0.35 *** Via Brazil 0.00 0.24 0.00 *** All Portuguese 0.00 1.08 0.27 *** Highway, Street, and Bridge Construction (NAICS 2373) Via Portugal 0.39 1.04 37.39 Via Brazil 4.42 2.23 All Portuguese 4.81 3.27 Remediation and Other Waste Management Services (NAICS 5629) Via Portugal 0.45 0.90 49.97 Via Brazil 0.48 0.57 83.76 All Portuguese 0.92 1.46 63.09

336
NAICS Industry Group & PBE Type Utilization (%)
Availability (%)
Disparity Ratio
Professional and Commercial Equipment and Supplies Merchant Wholesalers (NAICS 4234)
Via Portugal 0.00 0.50 0.00 Via Brazil 0.00 0.26 0.00 All Portuguese 0.00 0.75 0.00 ** Machinery, Equipment, and Supplies Merchant Wholesalers (NAICS 4238)
Via Portugal 0.00 0.20 0.00 Via Brazil 0.00 0.18 0.00 All Portuguese 0.00 0.38 0.00 *** Services to Buildings and Dwellings (NAICS 5617) Via Portugal 30.08 1.34 Via Brazil 0.60 2.61 22.94 All Portuguese 30.68 3.95 Other Wood Product Manufacturing (NAICS 3219) Via Portugal 0.00 0.11 0.00 Via Brazil 0.00 0.18 0.00 All Portuguese 0.00 0.29 0.00 Cement and Concrete Product Manufacturing (NAICS 3273) Via Portugal 0.00 0.79 0.00 Via Brazil 0.00 0.58 0.00 All Portuguese 0.00 1.37 0.00 Lumber and Other Construction Materials Merchant Wholesalers (NAICS 4233)
Via Portugal 0.00 0.70 0.00 *** Via Brazil 0.00 0.44 0.00 *** All Portuguese 0.00 1.14 0.00 *** Management, Scientific, and Technical Consulting Services (NAICS 5416)
Via Portugal 0.00 0.76 0.00 *** Via Brazil 0.00 0.10 0.00 *** All Portuguese 0.00 0.85 0.00 *** Hardware, and Plumbing and Heating Equipment and Supplies Merchant Wholesalers (NAICS 4237)
Via Portugal 0.00 0.05 0.00 Via Brazil 0.00 0.30 0.00 *** All Portuguese 0.00 0.35 0.00 ***

337
NAICS Industry Group & PBE Type Utilization (%)
Availability (%)
Disparity Ratio
Metal and Mineral (except Petroleum) Merchant Wholesalers (NAICS 4235)
Via Portugal 0.00 2.21 0.00 *** Via Brazil 0.00 0.18 0.00 All Portuguese 0.00 2.39 0.00 *** Office Furniture (including Fixtures) Manufacturing (NAICS 3372) Via Portugal 0.00 0.00 0.00 Via Brazil 0.00 0.03 0.00 All Portuguese 0.00 0.03 0.00 Electric Power Generation, Transmission and Distribution (NAICS 2211)
Via Portugal 0.00 0.19 0.00 Via Brazil 0.00 0.08 0.00 All Portuguese 0.00 0.26 0.00 Engine, Turbine, and Power Transmission Equipment Manufacturing (NAICS 3336)
Via Portugal 0.00 0.16 0.00 Via Brazil 0.00 0.24 0.00 All Portuguese 0.00 0.40 0.00 Home Furnishings Stores (NAICS 4422) Via Portugal 0.00 4.15 0.00 *** Via Brazil 0.00 1.04 0.00 All Portuguese 0.00 5.19 0.00 *** Household and Institutional Furniture and Kitchen Cabinet Manufacturing (NAICS 3371)
Via Portugal 0.00 0.06 0.00 Via Brazil 0.00 0.03 0.00 All Portuguese 0.00 0.09 0.00 Household Appliances and Electrical and Electronic Goods Merchant Wholesalers (NAICS 4236)
Via Portugal 0.00 0.05 0.00 Via Brazil 0.00 0.03 0.00 All Portuguese 0.00 0.08 0.00 Utility System Construction (NAICS 2371) Via Portugal 0.00 3.16 0.00 *** Via Brazil 6.26 0.07 All Portuguese 6.26 3.23 Miscellaneous Durable Goods Merchant Wholesalers (NAICS 4239) Via Portugal 0.00 0.21 0.00 Via Brazil 0.00 0.28 0.00 All Portuguese 0.00 0.50 0.00

338
NAICS Industry Group & PBE Type Utilization (%)
Availability (%)
Disparity Ratio
Commercial and Industrial Machinery and Equipment Rental and Leasing (NAICS 5324)
Via Portugal 0.00 0.23 0.00 Via Brazil 0.00 0.26 0.00 All Portuguese 0.00 0.50 0.00 Furniture and Home Furnishing Merchant Wholesalers (NAICS 4232)
Via Portugal 0.00 0.15 0.00 Via Brazil 0.00 1.44 0.00 *** All Portuguese 0.00 1.58 0.00 *** Other General Purpose Machinery Manufacturing (NAICS 3339) Via Portugal 0.00 0.09 0.00 Via Brazil 0.00 0.68 0.00 All Portuguese 0.00 0.77 0.00 Personal and Household Goods Repair and Maintenance (NAICS 8114)
Via Portugal 0.00 3.17 0.00 *** Via Brazil 0.00 0.07 0.00 All Portuguese 0.00 3.23 0.00 *** Communications Equipment Manufacturing (NAICS 3342) Via Portugal 0.00 0.07 0.00 Via Brazil 0.00 0.06 0.00 All Portuguese 0.00 0.13 0.00 Other Miscellaneous Manufacturing (NAICS 3399) Via Portugal 0.00 1.68 0.00 ** Via Brazil 0.00 2.23 0.00 *** All Portuguese 0.00 3.92 0.00 *** Insurance Carriers (NAICS 5241) Via Portugal 0.00 0.11 0.00 Via Brazil 0.00 1.27 0.00 All Portuguese 0.00 1.37 0.00 Ventilation, Heating, Air-Conditioning, and Commercial Refrigeration Equipment Manufacturing (NAICS 3334)
Via Portugal 0.00 0.00 0.00 Via Brazil 0.00 0.04 0.00 All Portuguese 0.00 0.04 0.00 Hardware Manufacturing (NAICS 3325) Via Portugal 0.00 0.16 0.00 Via Brazil 0.00 9.00 0.00 All Portuguese 0.00 9.16 0.00

339
NAICS Industry Group & PBE Type Utilization (%)
Availability (%)
Disparity Ratio
Software Publishers (NAICS 5112) Via Portugal 0.00 0.04 0.00 Via Brazil 0.00 0.03 0.00 All Portuguese 0.00 0.06 0.00 Commercial and Service Industry Machinery Manufacturing (NAICS 3333)
Via Portugal 0.00 0.00 Via Brazil 0.00 2.03 0.00 All Portuguese 0.00 2.03 0.00 Specialized Freight Trucking (NAICS 4842) Via Portugal 0.00 0.57 0.00 Via Brazil 0.00 6.24 0.00 *** All Portuguese 0.00 6.81 0.00 *** Medical Equipment and Supplies Manufacturing (NAICS 3391) Via Portugal 0.00 0.40 0.00 Via Brazil 0.00 0.49 0.00 All Portuguese 0.00 0.88 0.00 Other Heavy and Civil Engineering Construction (NAICS 2379) Via Portugal 0.00 0.26 0.00 Via Brazil 0.00 0.23 0.00 All Portuguese 0.00 0.50 0.00 Computer Systems Design and Related Services (NAICS 5415) Via Portugal 0.00 0.23 0.00 Via Brazil 0.00 0.47 0.00 All Portuguese 0.00 0.70 0.00 Other Support Services (NAICS 5619) Via Portugal 0.00 0.35 0.00 Via Brazil 0.00 0.56 0.00 *** All Portuguese 0.00 0.91 0.00 *** Investigation and Security Services (NAICS 5616) Via Portugal 0.00 0.21 0.00 Via Brazil 0.00 0.16 0.00 All Portuguese 0.00 0.37 0.00 Waste Treatment and Disposal (NAICS 5622) Via Portugal 0.00 0.48 0.00 Via Brazil 0.00 0.41 0.00 All Portuguese 0.00 0.89 0.00 Source and Notes: See Table 6.5.

340
Table AD.7. PBE Industry Group Utilization, Availability, and Disparity Results for DCAMM Design Contracting (Dollars Awarded)
NAICS Industry Group & PBE Type Utilization (%)
Availability (%)
Disparity Ratio
Architectural, Engineering, and Related Services (NAICS 5413) Via Portugal 0.32 0.79 40.21 Via Brazil 0.00 0.24 0.00 *** All Portuguese 0.32 1.03 30.73 Management, Scientific, and Technical Consulting Services (NAICS 5416)
Via Portugal 0.55 0.63 87.66 Via Brazil 0.00 0.16 0.00 *** All Portuguese 0.55 0.79 70.26 Other Support Services (NAICS 5619) Via Portugal 0.00 0.35 0.00 Via Brazil 0.00 0.56 0.00 *** All Portuguese 0.00 0.91 0.00 *** Other Professional, Scientific, and Technical Services (NAICS 5419) Via Portugal 0.00 0.47 0.00 Via Brazil 0.00 1.07 0.00 All Portuguese 0.00 1.54 0.00 *** Software Publishers (NAICS 5112) Via Portugal 0.00 0.04 0.00 Via Brazil 0.00 0.03 0.00 All Portuguese 0.00 0.06 0.00 Computer Systems Design and Related Services (NAICS 5415) Via Portugal 0.00 0.23 0.00 Via Brazil 0.00 0.47 0.00 All Portuguese 0.00 0.70 0.00 Specialized Design Services (NAICS 5414) Via Portugal 0.00 0.05 0.00 Via Brazil 0.00 0.75 0.00 All Portuguese 0.00 0.80 0.00 Source and Notes: See Table 6.5.
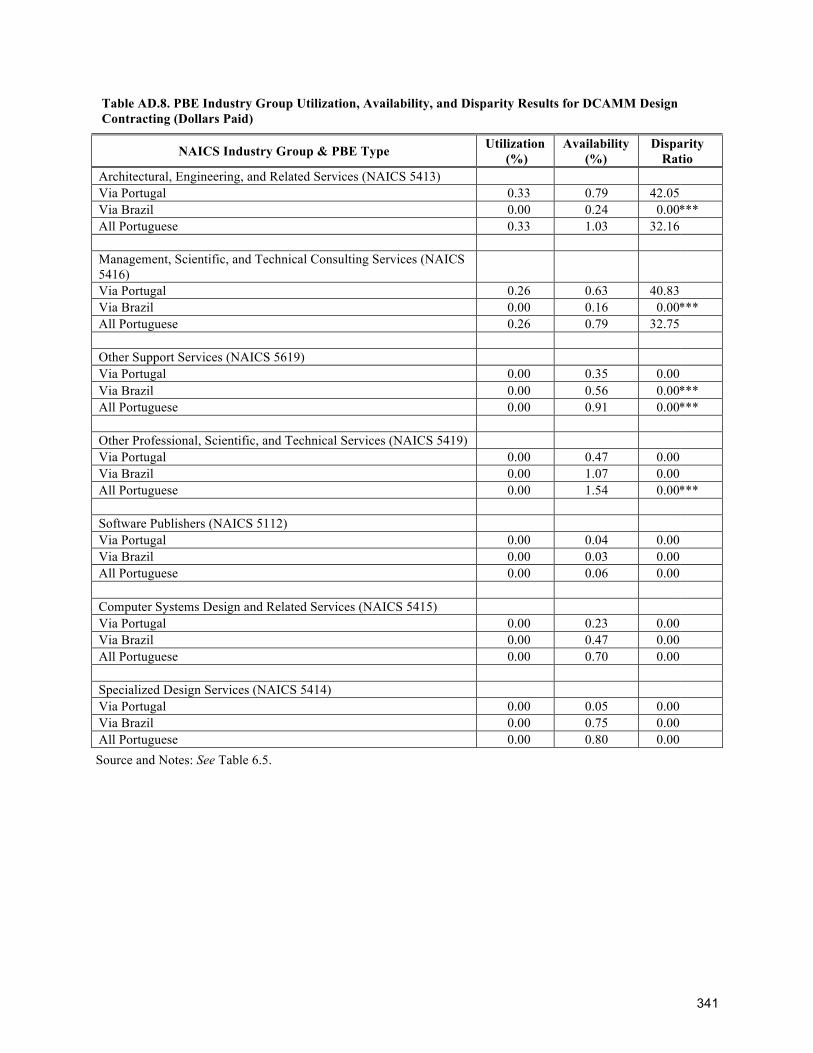
341
Table AD.8. PBE Industry Group Utilization, Availability, and Disparity Results for DCAMM Design Contracting (Dollars Paid)
NAICS Industry Group & PBE Type Utilization (%)
Availability (%)
Disparity Ratio
Architectural, Engineering, and Related Services (NAICS 5413) Via Portugal 0.33 0.79 42.05 Via Brazil 0.00 0.24 0.00 *** All Portuguese 0.33 1.03 32.16 Management, Scientific, and Technical Consulting Services (NAICS 5416)
Via Portugal 0.26 0.63 40.83 Via Brazil 0.00 0.16 0.00 *** All Portuguese 0.26 0.79 32.75 Other Support Services (NAICS 5619) Via Portugal 0.00 0.35 0.00 Via Brazil 0.00 0.56 0.00 *** All Portuguese 0.00 0.91 0.00 *** Other Professional, Scientific, and Technical Services (NAICS 5419) Via Portugal 0.00 0.47 0.00 Via Brazil 0.00 1.07 0.00 All Portuguese 0.00 1.54 0.00 *** Software Publishers (NAICS 5112) Via Portugal 0.00 0.04 0.00 Via Brazil 0.00 0.03 0.00 All Portuguese 0.00 0.06 0.00 Computer Systems Design and Related Services (NAICS 5415) Via Portugal 0.00 0.23 0.00 Via Brazil 0.00 0.47 0.00 All Portuguese 0.00 0.70 0.00 Specialized Design Services (NAICS 5414) Via Portugal 0.00 0.05 0.00 Via Brazil 0.00 0.75 0.00 All Portuguese 0.00 0.80 0.00 Source and Notes: See Table 6.5.

NERA Economic Consulting Barton Creek Plaza Building II, Suite 330 3801 S. Capital of Texas Highway Austin, Texas 78704 Tel: +1 512 383 4800 Fax: +1 512 371 9612 www.nera.com