Embed Size (px)
Citation preview

T h e co m b u stio n o f m eth an e
By W. E. Garner, F.R.S., and A. J. H am The University, Bristol
{Received 26 September 1938)
The main products formed in the oxidation of methane at 300-450° C are methyl alcohol, formaldehyde, formic acid, carbon monoxide, carbon dioxide and water (Bone and Wheeler 1903; Bone and Allum 1932). I t was suggested by Bone that these substances were produced in a series of successive steps by hydroxylation of the methane molecules, th u s :
CH4~-CH3O H -C H 2(OH)2\ OH OH
H 20 + H C H O - >C : 0 - >C : O H OH'
(H20 + C0) (H20 + C02).
I t was concluded that the initial step in this reaction was termolecular since the rate of the reaction for the mixture 2CH4 : 0 2 was Considerably faster than those for CH4 : 0 2 and 3CH4 : 0 2. In the above hydroxylation scheme, methyl alcohol is an intermediate product and the precursor of formaldehyde. This has been disputed by Norrish (1935), who taking into account the difficulty of detecting methyl alcohol in oxidations at atmospheric pressure, and the chain characteristics of the reaction, came to the conclusion that methyl alcohol is a side product of the reaction. The first result of the oxidation was regarded as being an unstable molecule, CH40*, which breaks down within a short time interval to the methylene radical and water. Methyl alcohol arises only if this molecule collides with an inert gas molecule or with the walls of the containing vessel. The results of Newitt and Haffner (1936), who obtained high yields of methyl alcohol in the combustion of methane at 100-500 atm. pressure, can be taken as confirming this view of the mode of origin of the methyl alcohol. The following reaction scheme was proposed for the decomposition of CH40*:
CH40*--C H 2 : + H 204 \ 2 2 ( 1 )
n CH3OH.
The production of formaldehyde could then occur by the addition of oxygen to methylene,
CH2 : + 0 2-^CH20 + O [ 80 ]
(2)
on May 30, 2018http://rspa.royalsocietypublishing.org/Downloaded from

The combustion of methane 81
and the oxygen atoms produced in this process would then continue the hydroxylation of the methane or interact with more methane according
I t should, however, be pointed out tha t the above mechanisms are based on analysis of the products of the slow oxidation occurring a t 300-450° C. There are very few analytical figures for the oxidation of methane in the neighbourhood of the ignition temperatures, and no information is available with regard to the nature of the organic intermediates a t these temperatures. Kowalski and co-workers (1932) have studied the products formed for the range 450-850° C using a streaming method, but they only record results for the products carbon monoxide > carbon dioxide and water. This absence of analytical data makes i t hazardous to draw conclusions with regard to the nature of the reactions a t the ignition temperatures. The temperature coefficients of the various stages in the hydroxylation scheme and hence the relative proportions, of the products at different stages of the reaction are unlikely to remain the same at 700 as at 400° C.
Several investigators have followed the reaction by means of pressure measurements. Hinshelwood and Fort (1930) found that there was a quiescent period during which there was little pressure change, and this was followed by an accelerating reaction which shows many of the properties of chain reactions. Thus, the accelerating reaction was almost completely inhibited by packing the reaction vessel with quartz tubing. Also Bone and Allum have confirmed the general form possessed by the pressure-time curves and have shown that during the quiescent period there are produced no oxides of carbon and only small quantities of formaldehyde. A theory of chain reactions was developed by Semenoff (1931) to explain the occurrence of induction periods in gaseous chemical reactions. This theory postulated that the branching of the chains was due to the production of an intermediate compound possessing a long life, which finally decomposes or undergoes reaction, thereby starting new reaction chains. This type of branching was termed degenerate or delayed branching. In such cases, the rate of development of pressure obeys the equation logp = ta +constant, and he showed (1932) that this relationship fitted the results of Hinshelwood and Fort on the oxidation of methane, and those of Bone and Hill on the oxidation of ethane. The accelerating reaction was thus regarded by Semenoff as being a degenerate branching chain reaction. Norrish and Foord (1936) have confirmed the general form for the pressuretime curve and have shown that the maximum velocity of the reaction
to the equation,CH4 + 0--C H 40*. (3)
Vol. CLXX. A. 6
on May 30, 2018http://rspa.royalsocietypublishing.org/Downloaded from

82 W. E. Garner and A. J. Ham
varies as (CH4)2(0 2)P. The reaction was retarded by the walls and completely inhibited in a packed tube. They have put forward a detailed mechanism of the reaction and obtained the required relationship for the velocity of the reaction, on the basis of the assumptions (a) the reaction is of the degenerate branching type, (b) the methane is converted into formaldehyde on collision with an oxygen atom, (c) a stationary concentration of formaldehyde is reached at the maximum rate of pressure change.
The ignition limits for the reaction have been investigated by Neumann and Serbinolf (1932, 1933). These investigations consisted in the admission of mixtures of methane and oxygen to a heated tube and measurement of the time which elapsed before ignition. They found tha t the mixture CH4 : 202 gave a flame peninsula with three flame limits similar to tha t of hydrogen and oxygen, but that this peninsula was absent in the case of mixtures appreciably richer or weaker in methane. Thus, for CH4 : 0 2 and CH4 : 302 there was only one flame limit at any temperature, and this moved to lower pressures the higher the temperature. Neumann and Egorow (1932) find that the induction period, r , | for the mixture 2CH4 : 0 2 is given by the equation p neEiRT r — constant, where p is the pressure and E an activation energy of some stage in the reaction. Since this equation is readily deduced from the Semenoff theory of flame arising from degenerate chain reactions which postulates the appearance of flame when the rate of production of heat exceeds a critical value, they came to the conclusion that the onset of flame was due to thermal causes. Norrish and Foord (loc. cit.) have also studied the transition of the slow reaction into flame using a Bourdon gauge for this purpose. They also came to the conclusion that the ignition is a thermal process following the attainm ent of a critical reaction velocity.
In the present work, measurements have been made of the changes in pressure which occur in the methane-oxygen mixture CH4 + 202 in a quartz tube over the range of pressures 2-12 cm. and over the range of temperatures 632-747° C. This was undertaken to test the applicability of the equation pne-E/RTT _ conatant and to determine the maximum rate ofreaction immediately preceding ignition with a view to throwing light on the origin of the flame. In addition, a detailed study of the oxidation processes occurring in the above mixture have been made a t 660° C at 8 cm. pressure. For this purpose a considerable fraction of the gases was withdrawn from the reaction vessel after heating the gaseous mixture for
f The induction period is taken as the tim e which elapses before ignition occurs; other authors define the induction period differently (see p. 88).
on May 30, 2018http://rspa.royalsocietypublishing.org/Downloaded from

The combustion of methane 83
varying intervals of time, and subjected to an analysis for carbon monoxide, carbon dioxide, hydrogen, methane, water and formaldehyde. From these analyses, conclusions are drawn with respect to the phenomena occurring during the acceleration of the reaction and to the causes of flame.
E xperimental
Preparation of gasesMethane was prepared by dropping water on to aluminium carbide and
the gas was washed with aqueous solutions of alkaline permanganate and silver nitrate, dried over caustic potash and liquefied. I t was fractionated, the middle third being used in the experimental work.
Fia. 1
Oxygen was prepared by heating potassium permanganate. The gas was condensed under slightly greater than atmospheric pressure using liquid air, and a middle fraction employed in making up the gaseous mixture.
The gases were stored in iron gas-holders over mercury, the latter being connected to the rest of the apparatus by flexible coils of glass tubing. Mixtures were made and stored in another iron gas-holder and the gases were dried before use by passage through columns of distilled phosphorus pentoxide, free from trioxide.
Apparatus. A diagram of the apparatus used is shown in fig. 1. The reaction vessel F was of quartz, 31 cm. long and 3 cm. diameter; the end- tubes were of 1 cm. diameter, and 11*5 cm. of these at each end was inside the furnace. The furnace consisted of a rustless steel tube with a main and
on May 30, 2018http://rspa.royalsocietypublishing.org/Downloaded from

84 W. E. Garner and A. J . Ham
two subsidiary windings. The latter placed at the end of the iron tube could be heated independently of the main winding. The temperature along the reaction vessel was kept constant to within 1°.
On the pressure gauge side of the reaction vessel a length of capillary tubing was introduced, this being partly in and partly outside the furnace and serving to minimize diffusion and subsequent condensation of water vapour. I t also prevented the smashing of the gauge by a rush of gas from an explosion. A similar length of capillary tube was placed on the other arm of the gauge to even the gas flow to the two sides of the gauge H. At the other end of the quartz vessel, a tube of large diameter was rendered necessary in order to introduce gas rapidly and to evacuate the system rapidly. An electrically operated stop was made of quartz and this was fitted close to the entrance to the furnace; it was not gas-tight, but when in position it reduced the effective diameter of the tube to a small value. This served to prevent the rapid diffusion of the products into the cold parts of the apparatus and effectively confined the flame to the heated part of the tube.
A soda-glass Bourdon gauge H of the automatically recording type was used. I t consisted of a glass spoon with the tip lengthened to carry a light mirror. I t was placed in a light-tight box and its deflexions were recorded on sensitive paper on a revolving drum. I t was used to record differences of pressure only, gas being admitted to both sides of the spoon simultaneously through tap I and put into operation by closing C. The gauge was 3-15 times as sensitive as a mercury manometer, and gave deflexions varying linearly with the pressure change.
The gas was introduced into the evacuated reaction vessel from a reservoir * beyond I. To admit the gas, tap I was turned completely round, tap C was then closed, and stop E drawn up into position. This required about 3 sec. to complete, and equilibrium was attained between the two sides of the gauge within that period, as shown by the performance of the gauge. The amount of gas entering the reaction vessel and gauge was determined from the fall in pressure of the gases in the reservoir, and the pressure in the reaction vessel calculated from the ratio of the volumes of the reservoir and tha t of the reaction system. Pressure changes were automatically recorded on the revolving drum.
The gases could be drawn off for analysis by closing tap O, lowering stop E, and opening tap D to an evacuated Winchester bottle, from which the gases were then collected by means of a Toepler pump. In order to collect condensable substances, tap D was connected to a trap with taps K and which was immersed in liquid air.
on May 30, 2018http://rspa.royalsocietypublishing.org/Downloaded from

The combustion of methane 85
AnalysisFormaldehyde was collected from some ten experiments under identical
conditions of temperature, pressure and time of heating, and the substance collected in the trap dissolved in water and 20 c.c. N NaOH added, together with 5 c.c. of iodine solution (N/50); the solution was shaken, acidified with 25 c.c. H 2S 04 and back-titrated using N /100 thiosulphate. Before adding the sulphuric acid, the solution was shaken for 10 min., keeping taps J and K closed. This method of estimation is a modified form of th a t of Romijn and gave results in agreement with those from a method based on the reaction between formaldehyde and hydrogen peroxide.
Gaseous products. The dry gaseous products amounted to 4-8 c.c. of gas a t N.T.P. and were analysed for carbon dioxide, oxygen, hydrogen, carbon monoxide and methane in the order given.
Carbon dioxide was frozen out in liquid air, oxygen being absorbed in alkaline pyrogallol, the latter being used in amounts sufficient to absorb all oxygen present but not in great excess, as it might introduce a little carbon monoxide. Carbon monoxide and hydrogen were burnt up at 270-290° C over ignited copper oxide for half an hour; this treatment did not oxidize methane to an appreciable extent. The contraction in volume on measuring the dried mixture gave the hydrogen present, while the carbon dioxide was frozen out as before. Finally, the residual methane was combusted over ignited copper oxide a t 600° C and the gas remaining was absorbed in 50 % caustic potash, the residues being negligible, as the results show. This scheme of analysis is the same as that used by Professor M. W. Travers, and we wish to thank him for his advice during the construction of the gas analysis apparatus.
Results
Pressure-time recordsThese records show that the reaction is divisible into three periods:
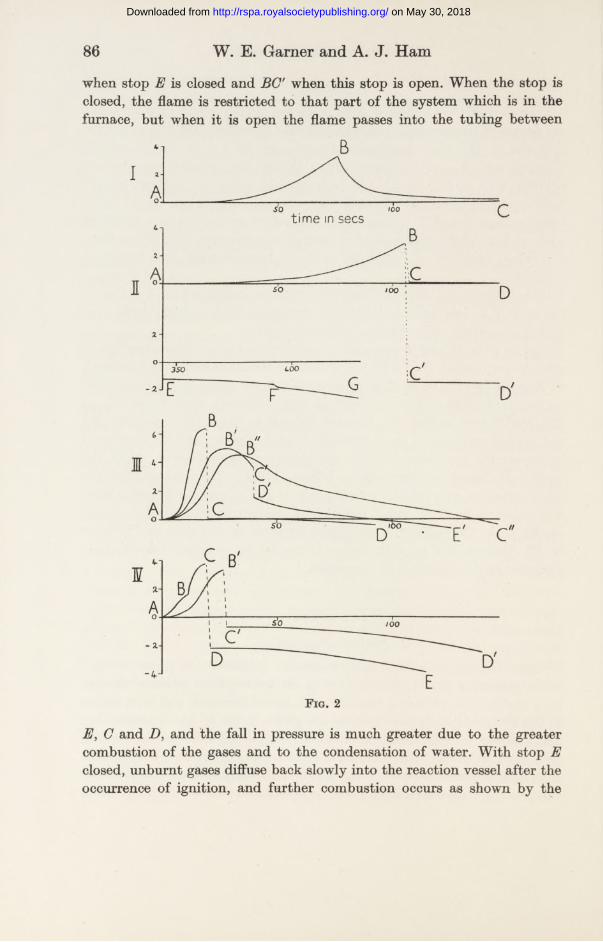
(а) a quiescent period where there is no appreciable pressure change,(б) a region of accelerating reaction with rise of pressure, and (c) a region of fall of pressure. Typical records are given in fig. 2. No. I shows that obtained just outside the upper limit, no flame being obtained, and it will be noted that the reaction with fall in pressure sets in sharply at B and that the fall in pressure is equal to the previous rise in pressure. No. I I shows the pressure-time curve when flame appears; BC gives the fall in pressure
on May 30, 2018http://rspa.royalsocietypublishing.org/Downloaded from
86 W. E. Garner and A. J . Ham
when stop E is closed and BC' when this stop is open. When the stop is closed, the flame is restricted to that part of the system which is in the furnace, but when it is open the flame passes into the tubing between
time in secs
Fig. 2
E, C and D, and the fall in pressure is much greater due to the greater combustion of the gases and to the condensation of water. With stop E closed, unburnt gases diffuse back slowly into the reaction vessel after the occurrence of ignition, and further combustion occurs as shown by the
on May 30, 2018http://rspa.royalsocietypublishing.org/Downloaded from

curve EFG, which gives rapid combustion at F. I l l and IV are recordswhich will be referred to later.
At the higher pressures a bright flash appears on ignition, but at low pressures the flash could be seen only with difficulty in a darkened room. The more distinct ignitions were accompanied by a click a t a higher pressure. When ignition occurred, there was always an abrupt fall in pressure down to the initial pressure, fig. 2, II, and the appearance of this distinct break in the pressure-time curve was taken as the criterion as to whether ignition had occurred or not. The reproducibility was poor at first but improved after several ignitions had taken place in the reaction vessel, the activity of the surface tending to a maximum after a short series of experiments. After standing full of air it was difficult to obtain ignitions in the reaction vessel; such an effect has been previously observed by Norrish. In all series of experiments the vessel was evacuated for 20 min. between each experiment. The mixture, CH4 + 202, which gives three flame limits, was employed in all of the experiments recorded in this paper.
Ignition limits. After a few preliminary experiments a series was carried out a t the following temperatures: 712, 718, 682, 671, 660, 646, 632, 640, 732-5 and 747° C in the order given, and at each temperature ten to twelve experiments were carried out over the range of pressures 10-^1 cm. These experiments covered the flame peninsula discovered by Neumann. No attem pt was made to determine the positions of the upper and lower limits accurately. The latter are difficult to determine accurately, since the induction periods in the neighbourhood of this limit are very long. Approximate values for the lower limit were:
°C ... 682 712 733-5 747cm. ... 1-4 1-9 2-1 2-5
The induction periods were in general shorter than those previously recorded but were of the same order near the limit, e.g. some 900 sec. at 682° C compared with Neumann’s values of 10-20 min. An upper limit was found at the following temperatures:
°C ... 640 646 660cm. ... 5-6 6-2 8-2
whereas the approximate values from Neumann’s graphs are 6-0, 8-0 and 11-0 cm. respectively. Thus, the upper limit was found in the same region as that recorded by Neumann and decreased with decreasing temperature; it occurred, however, at rather lower pressures than in his
The combustion of methane 87
on May 30, 2018http://rspa.royalsocietypublishing.org/Downloaded from

88 W. E. Garner and A. J. Ham
case, and was accompanied by longer induction periods. At 632° C no ignitions were obtained, so that the critical temperature for flame lies between 632 and 640° C.
Outside the region of ignition at the upper limit, the pressure-time curves were very similar to those just inside the limit, but instead of an instantaneous fall in pressure following the slow rise in pressure, it was found tha t it fell relatively slowly (see fig. 2, I). The speed of this secondary reaction increased as the limit was approached, becoming practically instantaneous a t the limit itself. I f the period which elapsed between the admission of gas and the attainment of maximum rate of rise of pressure was measured and treated as an induction period (as was done previously by Norrish and Foord (1936)), then these pseudo r values were continuous with those for real ignition when treated as a function of gas pressure.
Relation between p 0, r and T. The applicability of the Semenoff equation was tested and graphs for the plot of log10 against log10 r were made. The experiments were made starting from 10-12 cm. pressure and working downwards. Except for the first two experiments in any series, the points all lay on a straight line approximately parallel to those obtained by Neumann. The first two experiments always gave too long induction periods and this abnormality was probably due to changes in the activity of the quartz tube. I t was shown that n= 2-13, and i£ = 23*610, whereas the corresponding values from Neumann’s curves were E = 41,000 and 1-8 for in. There is a very considerable discrepancy between the two values of E, and this may be due to the differences between the range of temperatures employed in the two investigations. Neumann worked between 700-900° C, whereas our experiments were carried out in the heel of the flame peninsula between 640 and 750° C. We have not investigated further the cause of the discrepancy, being more interested in other matters. The work has, however, confirmed the general applicability of the equation, pne~EiRT T _ constant, to the oxidation of methane in the region of the flame peninsula.
Rate of pressure change before ignition. The pressure-time curves gave information not obtainable from mere observation of the duration of the induction period. In this series of experiments it was always found tha t the maximum rate of rise in pressure always occurred just before ignition, and also tha t outside the upper limit the maximum rate of reaction lay on the same curves as below this limit. The curves for the experiments above the upper limit were of the type fig. 2, I, and the maximum ra te occurred just before the inflexion on the curve at B. In fig. 3, the maximum rate is plotted against the initial pressure p Qfor the gas mixture. The dotted
on May 30, 2018http://rspa.royalsocietypublishing.org/Downloaded from

89
line, aa', shows the position of the upper limit. Except for the highest pressures, the maximum rate varies approximately linearly with the pressure. Norrish and Foord ( loc. cit.) have recorded tha t the maximum rate of the “ slow ” methane oxidation depends on the first power of the pressure of the gas mixture a t the temperatures 530 and 620° C, and the results in fig. 3 confirm this result for the ignition range 640-750° C.
The combustion of methane
A 632°C B 640 C 646 D 660 E 671 F 682 G 712 H 718 I 734 J 747
0-5 ‘ 10R ate in cm./sec. x 10-2
F ig . 3
The curves for the maximum rate of reaction are continuous across the dotted line, aa' in fig. 3, indicating that these maximum rates have no direct bearing on the production of flame or the determination of the upper limit, which must be due to the operation of some other factor. They have, however, a bearing on the occurrence of the reaction occurring with a fall of pressure, out of which flame can arise or not, depending on circumstances. This reaction sets in at the maximum rate of rise of pressure
on May 30, 2018http://rspa.royalsocietypublishing.org/Downloaded from

90 W. E. Garner and A. J. Ham
and under the condition tha t this-rate is proportional to the initial pressure of the gas. The nature of the reaction occurring with the fall of pressure has been determined, and further discussion of this point will be deferred until the analytical results are considered.
I t has also been shown that the pressure fall (fig. 2) increases with the pressure, but not linearly. The pressure fall increases slightly more rapidly than the pressure.
Effect of addition of carbon monoxide and hydrogen. A series of pressuretime curves was obtained for a mixture of CH4 : 202 with 1-84 % of carbon monoxide. The carbon monoxide retarded the ignition and narrowed the pressure range over which it occurred. Fig. 2, III, shows the type of curves obtained. In one case, AB'G'D', flame did not arise until long after the maximum pressure had been reached. The cause of the retardation is unknown. I t is doubtful if much of the added carbon monoxide is burnt to carbon dioxide during the induction period, so that the retardation cannot be definitely ascribed to the inhibition of the flame by carbon dioxide. Analyses are needed to test this point.
The addition of 1-34 % of hydrogen did not appreciably affect the length of the induction periods. There are, however, minor effects on the pressuretime curves (fig. 2, IV). The fall in pressure is, however, the same in these cases as in the absence of hydrogen, indicating that the hydrogen has been converted to water in the pre-flame period. There is little effect on the pressure-time curves other than tha t due to a contraction of volume, which occurs when the added hydrogen is converted to water.
Analytical results
Formaldehyde. A series of experiments was performed at 700° C, removing the products of the reaction through the trap immersed in liquid air. In each series, 8-10 consecutive experiments were performed, and the total condensate analysed for formaldehyde by the method described above. In three series gases were taken off some 15-20 sec. before ignition would have taken place, and in two other series, about 10 sec. after flame had occurred. The results are given below.
Before ignition A fter ignitionT° C 700 703
A A___
N um ber of runs in series 8 10 10 10 10Average pressure (cm.) 8-24 8-62 8-77 9-57 9-86N et wt. of HCHO (g. x 104) 3-33 4-04 4-44 1-42 1-48% to tal m ixture taken 0-474 0-456 0-515 0-069 0-071
on May 30, 2018http://rspa.royalsocietypublishing.org/Downloaded from

The amounts of formaldehyde formed are comparable with those found by Bone and Gardner for the mixture 2CH4 + 0 2, viz. 0*2 % for the end of the induction period at 390-420° C. That present after ignition is probably due to the oxidation of residual methane in the reaction vtessel. The quantities formed are considerably less than the amounts of condensable organic substances calculated from the gas analyses, viz. 3 % (see later).
Gas analysis. In withdrawing gas for analysis, care has to be taken that the gases are removed rapidly and tha t the fraction so removed is known accurately. A Winchester bottle, the volume of which was about nine
The combustion of methane 91
x . o
Time in sec.
F ig . 4. • • • • stop E opened for 10 sec. O O O O opened for 30 sec.
times that of the reaction vessel, was attached a t D and evacuated before each experiment. Calibrations were made by filling the reaction vessel with air and expanding this gas into the Winchester, and it was found to be necessary, in order that equilibrium be attained between the reaction vessel and the Winchester, that tap D be kept open for at least 10 sec. The length of the interval necessary was due mainly to adiabatic effects, not to the rate at which gas can be removed. In the experiments with the reaction mixture, at a suitably chosen time after the commencement of the reaction, the gases are expanded into the Winchester by opening tap D for 10-30 sec. The sudden reduction in pressure to 1/30 of its initial value will slow down the reaction in the reaction vessel very materially, so that it would be expected that no complications will arise due to reaction in the residual gases left in the reaction chamber. The gases present in the Winchester are removed through phosphorous pentoxide by means of a Toepler pump and measured. After a preliminary series of ten experiments had been carried out, which served to indicate the main features of the
on May 30, 2018http://rspa.royalsocietypublishing.org/Downloaded from

92 W. E. Gam er and A. J . Ham
chemical changes which occur, two further series were carried out which covered the pre-flame, flame and post-flame periods. The volumes available for analysis ranged from 4 to 8 c.c.
Series I. The oxidation of methane was carried out a t an average pressure of 8-10 cm. and at 666-667° C. At this temperature and pressure the induction period under standard conditions was 50*5 sec. Gases were
Time in sec.
Fig. 5. Series I. O, oxygen, □ , m ethane, • , carbon monoxide,+ hydrogen, A, carbon dioxide.
withdrawn at sixteen different times during the induction period so as to cover this thoroughly and at twelve different times after ignition over the range 50-400 sec. I t was noted tha t the volume of gas removed decreased as the reaction proceeded. The analytical results, fig. 5, showed certain irregularities which it was thought might be due to variations in the induction period, therefore another series of experiments was carried out where the induction period was measured in between each pair of experiments. There was, however, no appreciable variation in the length of the induction period throughout the series.
on May 30, 2018http://rspa.royalsocietypublishing.org/Downloaded from

The combustion of methane 93
Series I I . This series was carried out a t a pressure of 8 cm. a t 666° C, and the length of the induction period was 48-5 sec. Twelve samples were taken during the last 30 sec. of the induction period, and these served to clear up certain minor points, but in general confirmed the earlier series. They are given in the curves which follow.
Time in sec.
F ig . 6. Oxygen above, m ethane below.
Volumes removed from the reaction vessel. With an initial pressure of 8*10 cm. of air, 8-64 c.c. can be removed from the reaction vessel under the conditions outlined above. The volumes of explosive mixture so removed decrease as the reaction proceeds. The ratio of the volume of the gases removed to the above volume of air is given in fig. 4. I t will be seen from this figure that the volume of the gases removable through P 20 5 decreases even during the quiescent period which in these experiments is 20 sec.
on May 30, 2018http://rspa.royalsocietypublishing.org/Downloaded from

94 W. E. Garner and A. J . Ham
The fall is gradual, indicating tha t some progressive reaction is occurring. The results may be interpreted as due to the production of some condensable product and water, but since up to the present we have failed to detect such substances in amounts greater than 0-1 % by analytical methods during this period, the causes of the fall in volume must be regarded as uncertain. I t might be due to the difficulty of removing a very
Time in sec.
Fig. 7
reactive product from the reaction vessel and its condensation on the leading tubes. The analytical results of series I expressed in percentages are given in fig. 5, and are unsatisfaptory for theoretical treatm ent since they give no idea of the quantities of the various gases produced. They are converted into g.-mol. with the aid of fig. 4, and the results of this treatment embodied in figs. 6-8. These tables give the amounts of the various gases expressed in g.-mol. actually removed from the reaction tube by the methods described above.
on May 30, 2018http://rspa.royalsocietypublishing.org/Downloaded from

The combustion of methane 95
Series I and I I have been dealt with separately. For series I, smoothed curves are drawn using the method of least squares, and these curves have been re-drawn over the results for series II. Measurements for the after-flame period were only made in series I.
Time in sec.
Fig. 8
Disappearance of oxygen and methane. For both the oxygen and the methane curves, the smooth curve obtained for series I lies a little higher than the results of series II, especially after 30 sec., which is perhaps to be expected in view of the change in the induction period from 50-5 to 48*5 sec.
on May 30, 2018http://rspa.royalsocietypublishing.org/Downloaded from

98 W. E. Garner and A. J . Ham
I t will be noted tha t the rate of disappearance of oxygen and methane is accelerated as the reaction proceeds right up to the time of ignition, although the concentrations of these two gases in the gaseous mixture are becoming smaller. The rate of acceleration, however, slows down as the reaction proceeds. These results are in accordance with the view tha t the oxidation of methane is accelerated by one of the products of the subsequent stages of the reaction, i.e. the oxidation follows a chain mechanism. I t is also noteworthy tha t even in the first 20 sec., where there is no appreciable pressure change, a considerable fraction of the methane disappears. After ignition, about 30 % of the methane and oxygen remains unburnt, and this is partly due to the gas present in the cold parts of the apparatus escaping combustion.
Hydrogen, carbon monoxide and carbon dioxide. There are small amounts of hydrogen and more carbon monoxide produced during the first 20 sec., and marked acceleration in their production afterwards when the pressure begins to rise (fig. 7). Carbon dioxide is not produced until the acceleration of the reactions giving hydrogen and carbon monoxide. The concentrations of carbon monoxide and dioxide increase up to the moment of ignition, whereas tha t of hydrogen soon reaches a constant value. After flame the hydrogen and carbon monoxide practically disappear.
Water and condensable organic substances. Since the initial number of g.-atoms of carbon, hydrogen and oxygen in the gaseous mixture is known as well as those in the carbon dioxide, carbon monoxide, hydrogen and methane removed from the reaction vessel, it is possible to estimate the number of g.-atoms present as water and other products. This is done in fig. 8. The residues during the pre-flame period are not entirely water since the ratio H 2 : 0 2 is always less than 2 :1 . Assuming tha t water.and some condensable organic substance are the only products it can be shown that the ratio C : H : 0 in the organic compound is 1 : 3*1 : 1 a t 10 sec., 1 : 2-9 : T5 at 15 sec., and 1 : 2*8 : 2*0 at 20 sec. On the other hand, after ignition the ratio H 2 : 0 2 is 2 :1 , indicating that in this case the main condensable product is water.
Discussion of the analytical results
There are four stages in the reaction: (1) pre-acceleration, (2) acceleration with increase in pressure, (3) the occurrence of a reaction with a fall in pressure leading to flame in the present experiments, and (4) after-flame. There are three distinct induction periods, involved in the gaseous reactions occurring in the flame peninsula, viz. (a) for the production of CO, H 2 and
on May 30, 2018http://rspa.royalsocietypublishing.org/Downloaded from
The combustion of methane 97
C02 from hydroxylation compounds, (b) for the rapid oxidation of carbon monoxide, and (c) for the appearance of flame. Information which can be gained from the analyses about these periods is summarized below.
(1) Pre-acceleration (0-20 sec.). There are but slight changes of pressure during this period, so tha t if any appreciable reaction occurs it must be of such a character tha t reactions occurring with increase in pressure are balanced by others occurring with a decrease in pressure. Small quantities of carbon monoxide are produced and the production of this must occur with an increase in pressure, thus
CH4+ 1 |0 2-^C0 + 2H20 ,
or CH4 + 0 2--C 0 + H 2 + H 20.
This pressure rise is probably balanced by the production of condensable substances with a decrease in pressure. In certain cases, notably CH4 + 0 2-^CH20 + H 20, there is no change in pressure on production of the organic substance, but in others, such as 2CH4 + 0 2-^ 2CH3OH, there are decreases in pressure. The results obtained are consistent with the view that condensable substances in appreciable amounts are produced during the pre-acceleration period and that these consist of a mixture of methyl alcohol and formaldehyde. The polymerization of the latter on the walls of the exit tube is possibly responsible for the difficulty experienced in removing this product from the reaction tube.
(2) Acceleration (20 sec.-^ignition at 50-5 sec.). After 20 sec., which is the duration of the first induction period for the reaction, there commences a marked acceleration in the net rates of production of hydrogen, carbon monoxide and carbon dioxide (fig. 7), but whereas the rates in the case of carbon monoxide increase up to an approximately constant value some 20 sec. before ignition, the net rate of production of hydrogen reaches a maximum and falls to zero. The rate of combustion of methane and oxygen is also accelerated during this period and increases steadily up to the onset of ignition. I t is clear that when flame arises the reaction is proceeding at its maximum rate.
The hydrogen is probably produced by the thermal decomposition of either formaldehyde or formic acid, thus
CH2O ^ H 2 + CO,
c h 2o 2- h 2+ c o 2,
so that a fraction of the acceleration reactions will consist in thermal
Vol. CLXX. A. 7
on May 30, 2018http://rspa.royalsocietypublishing.org/Downloaded from
98 W. E. Garner and A. J. Ham
decompositions. The marked increased consumption of oxygen during this period shows, however, that there is considerable additional oxidation occurring as well. The hydrogen is unstable under the conditions of the experiment, and is converted into water, a balance being reached between its rate of production and its rate of disappearance at about 35 sec. The carbon monoxide is less readily oxidized than hydrogen, the quantities present increasing up to the time of ignition. The oxidation of carbon monoxide in silica vessels is relatively slow at 600-750° C outside the flame limits, as the work of one of us and Gomm (1928) and Cosslett (1931) has shown. About 1*5% is consumed per minute, and the rate of reaction is approximately proportional to the pressure and little affected by tem perature. The rate of oxidation is retarded by the presence of nitrogen or carbon dioxide. I t is probable, therefore, that the combustion of carbon monoxide during the induction period is negligible. I t is thus considered tha t the carbon dioxide is produced mainly by the oxidation or decomposition of some other intermediate.
(3) Oxidation of carbon monoxide? and flame. Just above the upper limit, the third stage is given by a reaction occurring with a fall of pressure which sets in abruptly (fig. 2, I). Since the rate of this reaction decreases with time, it is probable that the chain length of this process is finite, a t least in its later stages. Since the rate decreases with increase in pressure, it is very likely that the chain length of the oxidation process is decreased by the deactivation or destruction of some chain carrier by ternary collisions, as well as by carbon dioxide. Below a limiting pressure this process passes into flame. At the pressure and temperatures for which analyses have been carried out, the appearance of flame and the onset of the reaction with a decrease in pressure coincide, but this is not true when for any reason the flame is delayed. In experiments in which carbon monoxide is present initially, the reaction occurring with a fall in pressure occurs before flame (fig. 2, III).
Just before ignition, we have the following quantities of combustible substances: methane 0*05, carbon monoxide 0-06, hydrogen 0-01 g.-mol. x 10-3, together with a quantity of hydroxylation compounds. According to the direct analyses, there is a negligible quantity of formaldehyde, viz. 0-001 g.-mol. x 10~3, but according to results of fig. 8, there is 0-005- 0-01 g.-mol. of hydroxylation compounds. I t should, however, be borne in mind that the whole of the analytical errors enters into the determination of the quantities of the hydroxylation compounds by difference. Of the above substances, the hydrogen, most of the carbon monoxide, and a small fraction of the methane is burnt, so that the flame is very complex.
on May 30, 2018http://rspa.royalsocietypublishing.org/Downloaded from

The combustion of methane 99
The following figures show the balance sheets for ignition.
Series I (induction Series I I (inductionperiod 50*5 sec.) period 48-5 sec.)
0 2 used 0 2 usedCO fall 0-050 0-025 CO fall 0-057 0-029CH4 fall 0-009 0-018 CH4 fall 0-008 0-016T otal fall 0-059 T otal fall 0-065CO 2 rise 0-064 CO 2 rise 0-062H 2 fall 0-008 0-004 H 2 fall 0-010 0-005N et 0 2 used 0-047 N et 0 2 used 0-0500 2 fall 0-037 0 2 fall 0-039
The oxygen consumption calculated from the analytical figures is somewhat larger than tha t actually used, but the agreement is as near as can be expected in view of the extrapolation which is necessary to obtain the above figures. I t is clear, therefore, that the principal reaction in the flame is the oxidation of carbon monoxide. No analyses have been carried out for mixtures above the upper limit, but since the fall in pressure is the same whether flame occurs or not, it may be concluded tha t the reaction occurring with a fall in pressure above the upper limit is mainly the oxidation of carbon monoxide.
The causes of the flame in CH4 + 202 mixtures
We have seen that the principal reaction occurring in the flame is the oxidation of carbon monoxide, and it is therefore very, likely that we are dealing with a flame of carbon monoxide occurring in an environment of other gases. Of these carbon dioxide will tend to retard (Garner and Cosslett 1931) and hydrogen to accelerate the appearance of flame.* At the pressures used in these experiments, flame occurs in pure carbon monoxide and oxygen at 600° C and upwards, so that the net effect of the diluent gases is to raise slightly the temperatures of ignition. Although the flame obeys similar limiting conditions to those which hold for a pure carbon monoxide flame, there is a lag or induction period in the rapid
* In a recent study of the initiation of flame in carbon monoxide m ixtures, Buckler and Norrish (1938) have investigated the effects of the addition of hydrogen and inert gases. They pu t forward detailed mechanisms to account for the ca ta lytic effect of hydrogen, and show th a t inert gases inhibit flame in the order C 0 2> N 2> H e > A , i.e. the quenching effect is in the order of the num ber of degrees of freedom in the molecule. In this case, the quenching effect of CH4 on the carbon monoxide flame cannot be ignored. The above results only cover the range 525-585° C and do not extend to the tem peratures of the flame peninsula of the m ethane flame.
on May 30, 2018http://rspa.royalsocietypublishing.org/Downloaded from

100 W. E. Garner and A. J. Ham
oxidation of the moist carbon monoxide which does not occur, when diluent gases are absent. The rapid oxidation of the carbon monoxide produced in the oxidation of methane does not set in until the concentration of this gas has reached a high value and until the rate of the oxidation of methane has reached a critical value which is proportional to the initial pressure. I t would appear therefore th a t there are certain limiting conditions for the commencement of the rapid oxidation of carbon monoxide.
There is little information of a quantitative character available with regard to the rates of reaction of mixtures of carbon monoxide and oxygen to which carbon dioxide has been added, and hence any interpretation of the meaning of the above limiting conditions is highly speculative. There appear to be a t least two alternative explanations of the catalysis of the reaction between carbon monoxide and oxygen, one which is based on the production of chain carriers in the methane oxidation, and the other on the disturbance of the Maxwell-Boltzmann equilibrium in the gas, due to this oxidation. Either of these elfects would serve to explain the increasing chain length of the carbon monoxide oxidation which occurs with increasing rates of oxidation of methane.
During the pre-acceleration and acceleration reactions we must assume th a t the chain length of the carbon monoxide oxidation is very small, and only commences to assume large values a t high concentrations of carbon monoxide and a t rapid speeds of the methane oxidation. The abruptness with which the oxidation sets in just above the upper limit could be explained in terms of a reaction of the degenerate branching type, the rate of which is, however, rapidly reduced by the increasing concentration of carbon dioxide. Between the two flame limits, the oxidation passes into flame, and this may happen in accordance with the Semenoff theory tha t flame arises when the velocity of the oxidation becomes so high th a t heat cannot be conducted away. We have, however, found no evidence either in support of or against this view.
The sequence of processes which occurs during the generation of flame in CH4 + 2 0 2 mixtures appears to be the following: (1) The hydroxylation of methane with the production of methyl alcohol, formaldehyde, formic acid, etc. (2) The decomposition and oxidation of these substances with the production of carbon monoxide, carbon dioxide, and hydrogen, which is a complex reaction obeying the Semenoff equations for processes with delayed branching. (3) The oxidation of carbon monoxide, which only occurs rapidly when the rate of the overall reaction exceeds a critical value which increases proportionately with the pressure. (4) A flame of carbon monoxide and oxygen in which certain quantities of methane and
on May 30, 2018http://rspa.royalsocietypublishing.org/Downloaded from

The combustion of methane 101
hydrogen disappear, which occurs between two limiting pressures and arises out of the rapid oxidation of the carbon monoxide.
One of us (A. J . H.) is indebted to Imperial Chemical Industries (Nobel Section) for a personal grant, and we wish to acknowledge a grant in aid of the purchase of apparatus from the same firm, and from the Colston Research Society.
Summary
1. The ignition limits for flame in mixtures of CH4 + 202 have been investigated over a range of temperatures and pressures. The relationships between the pressure, temperature, and length of induction period in the region 640-750° C are in agreement with the SemenofF equation, p ne~E/RT r = const. I t is found, however, that, whereas is in substantial agreement with the value obtained by Neumann, E is much smaller.
2. I t is shown that the rate of change of pressure with time just before ignition and the maximum rate when ignition does not occur increases linearly with the pressure.
3. Analyses have been made of carbon dioxide, carbon monoxide, hydrogen, methane, oxygen and formaldehyde present in the gases at various times during the pre-flame, flame and after-flame periods for the temperature 666° C and 8 cm. pressure and from the results conclusions are drawn with respect to the course of the reactions and the generation of flame in the mixture CH4 + 20a.
References
Bone and Allum 1932 Proc. Roy. Soc. A, 134, 578.Bone and W heeler 1903 Trans. Chem. Soc. p. 1074.Buckler and Norrish 1938 Proc. Roy. Soc. A , 167, 292, 318.Garner and Cosslett 1931 Trans. Faraday Soc. 27, 176.Garner and Gomm 1928 Trans. Faraday Soc. 24, 470.Hinshelwood and F o rt 1930 Proc. Roy. Soc. A, 129, 2847.Kowalski, Sadownikow and Tschirkow 1932 phys. Chem. Soviet. 1, 451.N eum ann and Egorow 1932 Z. phys. Chem. Sowjet. 1, 700.N eum ann and Serbinoff 1932 Z . phys. Chem. Sowjet. 1, 536.
-------- 1933 phys. Chem. Sowjet. 4, 433.N ew itt and Haffner 1936 Proc. Roy. Soc. A, 154, 329.Norrish 1935 Proc. Roy. Soc. A, 150, 36.Norrish and Foord 1936 Proc. Roy. Soc. A, 157, 503.Semenoff 1931 Z . phys. Chem. B, 11, 464.— 1932 Z . phys. Chem. Sowjet. 1, 546.
on May 30, 2018http://rspa.royalsocietypublishing.org/Downloaded from


![The combustion mitigation of methane as a non-CO2 ... · significant contributor to anthropogenic methane emissions, . The main at around 30% [7] activities causing methane emissions](https://img.pdfslide.us/doc/110x75/5fb2384183d05b18f61f7684/the-combustion-mitigation-of-methane-as-a-non-co2-significant-contributor-to.jpg)