Embed Size (px)
Citation preview
International Journal of Control and Automation
Vol.10, No.8 (2017), pp.155-170
http://dx.doi.org/10.14257/ijca.2017.10.8.14
ISSN: 2005-4297 IJCA
Copyright ⓒ 2017 SERSC Australia
The Combination of DEMATEL, ANP, and IPMS Methods for
Performance Measurement System Design: A Case Study in
KOLAT KOARMATIM
Marsetio1, Amarulla Octavian
1, Siswo Hadi Sumantri
2, Ahmadi
2, Rajab Ritonga
3
and Supartono2
1Indonesia Defense University, Bogor, West Java, Indonesia
2Sekolah Tinggi Angkatan Laut, Surabaya, East Java, Indonesia
3Universitas Prof Dr Moestopo (Beragama), Jalan Hang Lekir, Jakarta, Indonesia
4Biro Klasifikasi Indonesia, Jakarta, Indonesia
*Corresponding author: [email protected]
Abstract
The use of Integrated Performance Measurement System (IPMS) method in an
institution under Indonesian Naval Forces (TNI AL) is intended to improve the integrated
performance measurement system which generally is only based on financial
accountability report. This paper presents the combination of DEMATEL, ANP, and
IPMS methods for performance measurement system design. The method was designed at
KOLAT KOARMATIM to analyze the achievement of the 2015 and 2016 Work Programs
with 23 Key Performance Indicators (KPIs), based on stakeholders’ requirements of
KOLAT KOARMATIM. To indicate the impact among criteria, DEMATEL is used to then
determine the weight of each sub criteria and their respective KPIs identified. Based on
the scoring system using Objective Matrix (OMAX), from the 2015 performance
measurement conducted, the Total Performance Index obtained is amounted to 7.697; in
addition, by using Traffic Light System, it is situated in the Yellow category, meaning that
the performance measurement target (achievement) in 2015 has not been reached despite
nearing the desired threshold target; there are 11 green KPIs, 11 yellow KPIs, and 1 red
KPI. The performance measurement results in 2016 show that the Total Performance
Index is amounted to 8.344 as a result of scoring by using OMAX, and by using the
Traffic Light System, it is situated in the Green category, meaning that the performance
measurement target (achievement) has been reached (satisfactory) with the dispersion
including 16 green KPIs, 6 yellow KPIs and 1 red KPI. Red KPI is the KPI below the
targets set by KOLAT KOARMATIM; hence it becomes a top priority for the
implementation of improvement. Two KPIs in the red indicator include the Combat Task
Exercise of The Republic of Indonesia Warship (GLAGASPUR KRI (U)) and the
Development Planning (RENBANG).
Keywords: ANP; DEMATEL; IPMS; KPI; OMAX; Traffic light system
1. Introduction
The Training Command of Eastern Region Fleet of the Indonesian Navy or abbreviated
as KOLAT KOARMATIM is the educational executive command structured directly
below the Commander-in-Chief of Eastern Region Fleet. KOLAT KOARMATIM
principal duty is to foster professionalism among the Eastern Region Fleet Command
(KOARMATIM) personnel through the Integrated Fleet Weapons System (SSAT),
courses and trainings on naval warfare tactics and techniques. The Development of
Human Resources (HR) is a continuous process in line with the expectation of the
Indonesian Naval Forces (TNI-AL) to generate professional personnel with high integrity
International Journal of Control and Automation
Vol.10, No.8 (2017)
156 Copyright ⓒ 2017 SERSC Australia
in order to be able to face the challenges of the increasingly complex and dynamic task
ahead as the result of the development of the strategic environment and rapid
development of technology. One of the efforts of the initial development of human
resources in the KOLAT KOARMATIM personnel is through training that is directed,
programmed and measured on the KOLAT KOARMATIM which serves as a training
center. KOLAT KOARMATIM is a training center which has the main task in the
development of operational capability in the field of maritime, engineering, informatics,
electronic communications, navigation electronics, electronic control of weapons, and
consolidation of combat ships team through the implementation of various forms of
exercises by using the instructional equipment and the instructional supporting equipment
(alongins) available.
The operation and exercise activities executed by KOLAT KOARMATIM are quite
many, covering a wide area, including almost all regions of eastern Indonesia. As an
overview of the activities carried out in 2015, they included 16 course activities, 13 In-
Service-Training (LDD) activities, 13 Training Administration (Binlat) activities, the
implementation of 25 Combat Task Exercise Tests of the Republic Indonesia Warship
Level 1 (Uji Glagaspur KRI L1), the implementation of 25 Uji Glagaspur KRI L2, the
implementation Glagaspur Test of Special Forces (Pasukan Khusus) K.1: 9 times, K.2: 6
times and K.3: 4 times, the implementation of Pangkalan Glagaspur Test P.1: 10 times
and P.2: 10 times, as well as the implementation of the Glagaspur Test of Aircraft U1: 3
times. Certainly, this is not an easy task for the limited personnel and limited
facilities/infrastructure. According to the data derived from KOARMATIM Operational
Staff, it is mentioned that, in 2015, there were accidents of 4 Indonesian warships (KRI),
and 3 similar cases in 2016. This shows a decrease in the level of skills and
professionalism of the KOARMATIM crew; thus, the role of KOLAT KOARMATIM as a
training institution needs to be improved through Courses and KRI, Head of Machinery
Department Course (Kursus Kadepsin) or Duty Officer Course, so that the readiness of
the naval soldiers in manning the Main Equipment and Weapon System (Alutsista) can be
justified.
The performance measurement is not only necessary to evaluate the activities that have
been carried out, but further expected to be able to provide better solutions and planning
ahead. KOLAT KOARMATIM should be able to conquer more complex challenges and
coordinate the needs of the stakeholders, in this case KRI and Naval Bases under the
KOARMATIM lines. Performance measurement within an organization is an important
thing to do, for all organizations need to evaluate and plan the working performance,
resulting in the improved performance process that is continuous and consistent [1-3]. The
existing difficulty is that the performance measurement of an organization focuses more
on the financial perspective of the organization [4-7]. Certainly, the measurement process
would be a little more complicated for a non-profit organization. However, along with the
rapid development of performance measurement study, such matter is not a big problem.
Now, there have been a lot of performance measurement methods, such as Balanced
Scorecard [8-12], Performance Prism [13-16], and Integrated Performance Measurement
System (IPMS) [17-21].
According to Maulidia, et al. in [20], Integrated Performance Measurement System
(IPMS) is a method aiming to describe the performance measurement system in a proper
sense, in the form of integration as effectively and efficiently as possible. This method
can be used to complement the performance measurement that has been based solely on
the principle of accounting, conducted by an independent auditor. Yet, other aspects also
affect the performance of companies, such as the condition of employees, customer
satisfaction, and etc., because essentially, a company is an integration of multiple
stakeholders. The implementation also has done well on profit and non-profit
organizations; in which IPMS method emphasizes on non-profit organizations and on the
interests of stakeholders. According to Liang et al. in [22], the application of Decision-
International Journal of Control and Automation
Vol.10, No.8 (2017)
Copyright ⓒ 2017 SERSC Australia 157
Making Trial and Evaluation Laboratory (DEMATEL) is used to determine the
relationship that occurs between performance measurement criteria existing in an
organization as well as to determine the dominant criteria. The DEMATEL uses direct
relationship diagram divided into two groups, namely, case group and consequence group
[23-26]. The DEMATEL is an effective method for building and analyzing structure
models generally used to find the relationship of social phenomena and solution of
dependency on each element. According to [23-26], DEMATEL can be said as a “filter”
method, used before the criteria are processed by expert respondents who are competent
in the company. This would affect the determination of more focused criteria,
representing the major conditions of the company. In addition, the network formed by
DEMATEL can be used in ANP. To obtain the Scoring System, the method of Objective
Matrix (OMAX) and Traffic Light System (TLS) are used. By looking at the benefits of
the use of the methods above, it is proper to implement them on KOLAT KOARMATIM
performance measurement, so that the results can be more relevant.
Based on above explanation, this paper presents the combination of DEMATEL,
Analytic Network Process (ANP), and IPMS methods for performance measurement
system design. The method was designed at KOLAT KOARMATIM to analyze the
achievement of the 2015 and 2016 Work Programs with 23 Key Performance Indicators
(KPIs), based on stakeholders’ requirements of KOLAT KOARMATIM.
The rest of this paper is organized as follow: Section 2 presents review on KOLAT
KOARMATIM organization, integrated performance measurement system, decision
making trial evaluation and laboratory, analytic network process, and OMAX scoring and
traffic light systems. Section 3 presents proposed method. Section 4 presents obtained
results and following by discussion. Finally, Section 5 concludes this work.
2. Rudimentary
2.1. KOLAT KOARMATIM Organization
The Training Command of Eastern Region Fleet of the Indonesian Navy (KOLAT
KOARMATIM) is an educational executive command in the scope Eastern Fleet which
has a strategic role. KOLAT KOARMATIM has the task of fostering professionalism of
KOARMATIM naval soldiers, through organizing courses and trainings in all fields related
to the development and improvement of the KOARMATIM crews. In the implementation
of these duties, the Eastern Region Fleet C-in-C (Pangarmatim) mentioned that KOLAT
KOARMATIM organizes some functions including to prepare and implement training
guidance plans and programs for both trainings related to the position and trainings in the
service of KOARMATIM environment, as well as to organize and prepare technical
instructions in the field of education and training (Organization, Duties, and Procedure
Execution Manual/Bujuklak Orgaspros of the KOLAT KOARMATIM).
2.2. Integrated Performance Measurement System (IPMS)
Integrated Performance Measurement System (IPMS) model is a model of performance
measurement system developed by the Centre for Strategic Manufacturing of the
University of Strathclyde, the UK. This model was developed in order to provide
performance measurement system that provides structure as well as robust, integrated,
efficient, and effective component selection as a new model. IPMS model is constructed
based on the work of the academicians based on best industry practices in the past and in
the present [27-29]. The starting point of this model uses stakeholder requirements. The
design of the performance measurement system is only performed on one business unit.
This causes several phases that should be conducted, such as reference model and audit
methods that are no longer used. From the best experiences, similar industry directly
designs the performance measurement system in four levels identified as metrics that can
International Journal of Control and Automation
Vol.10, No.8 (2017)
158 Copyright ⓒ 2017 SERSC Australia
be measured, known as the key performance indicator (KPI). KPI is determined by
stakeholder requirements, external monitor, and objectives. The performance
measurement system design process runs in a top-down system, from the business level to
the level of activity. Each element will be explained as follows:
a. The Identification of Stakeholder Requirements
On every level of business (organization), stakeholders or parties interested in the
business should be identified. Furthermore, their demands or requirements on the
businesses (stakeholder requirements) are identified. Stakeholders may include;
shareholders, social environment, employees, government/other institutions.
b. The Determination of Objectives
The setting of the objectives should be based on the engagement and priority of
common interest development along with appropriate targets and timescales. The
objectives should also be based on the ideas of several inputs, namely: stakeholder
requirements, world-class business performance and practices, competitive gaps and plans
of competitors. The existing level of performance in which the organization is able to
achieve although with various constraints is called a realistic target. The existing level of
performance in which the organization has the ability to achieve by eliminating various
constraints is called potential targets.
c. KPI Setting
Having obtained the objectives, then measurements on each objective to determine the
level of success are conducted. To do these measurements, the indicators of success of the
objectives must be determined. These indicators are called the key performance indicators
(KPIs). In other words, KPI is a measure to determine the achievement level of each
objective.
d. Performance Measures
An organization must have performance measurements that really show the
performance level achieved, and demonstrate how successful the achievement of
objectives at each level is. The performance measurements for each business have
differences, therefore, they requires carefulness and good understanding of the business in
order to obtain the correct performance measurement. To obtain the exact performance
measurement or the right KPI, a validation of the KPI created needs to be done. Then,
when the KPI is valid, it is specified to facilitate the measurement process. KPI
specification process is performed to determine a clear description of KPIs, objectives,
relevance to the objectives, targets and thresholds, formula/ways of measuring KPIs,
measurement frequency, review frequency, the ones who measure and what they do (See
Table 1).
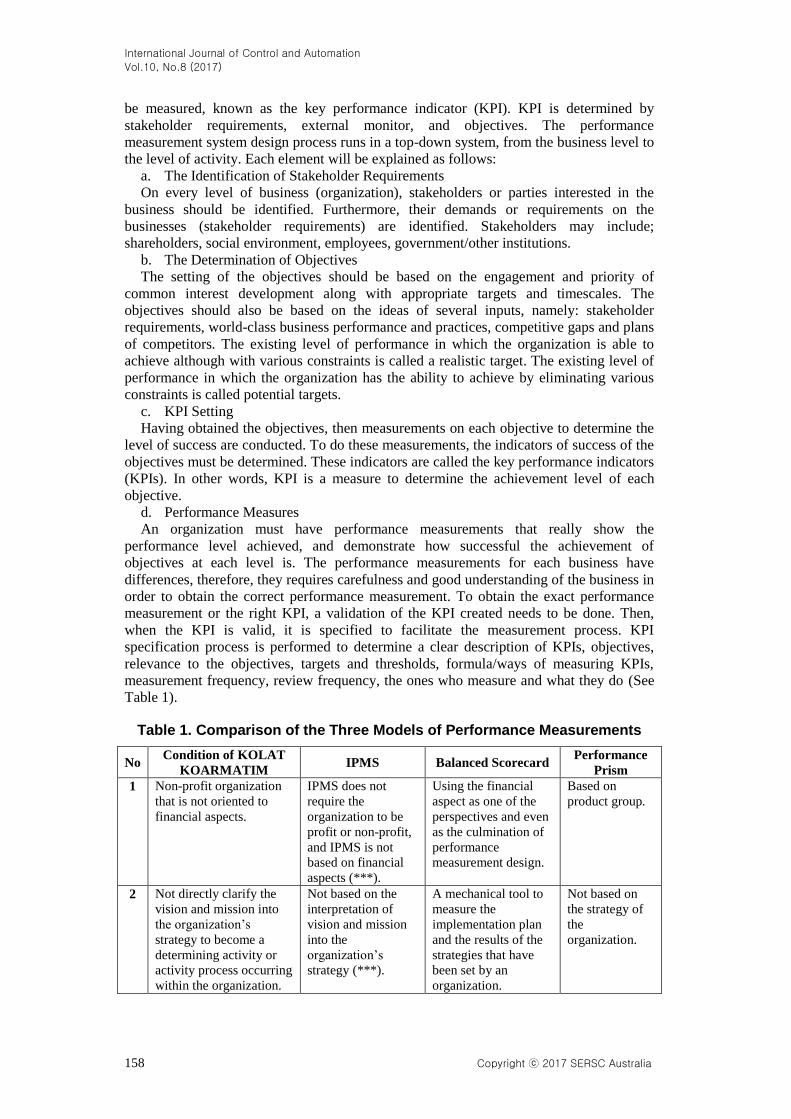
Table 1. Comparison of the Three Models of Performance Measurements
No Condition of KOLAT
KOARMATIM IPMS Balanced Scorecard
Performance
Prism
1 Non-profit organization
that is not oriented to
financial aspects.
IPMS does not
require the
organization to be
profit or non-profit,
and IPMS is not
based on financial
aspects (***).
Using the financial
aspect as one of the
perspectives and even
as the culmination of
performance
measurement design.
Based on
product group.
2 Not directly clarify the
vision and mission into
the organization’s
strategy to become a
determining activity or
activity process occurring
within the organization.
Not based on the
interpretation of
vision and mission
into the
organization’s
strategy (***).
A mechanical tool to
measure the
implementation plan
and the results of the
strategies that have
been set by an
organization.
Not based on
the strategy of
the
organization.
International Journal of Control and Automation
Vol.10, No.8 (2017)
Copyright ⓒ 2017 SERSC Australia 159
3 Having multiple
stakeholders and multiple
activities in which each
stakeholder plays a very
important role on its
development.
IPMS is based on
stakeholder
requirements (***).
Not based on
stakeholder
requirement.
Not based on
stakeholder
requirement.
4 Kolat aims to improve
the professionalism and
carry out the aptitude
test.
Key performance
indicator is a direct
measure and pseudo
measure (***).
Key performance
indicator is
quantitative and
qualitative (***).
Key
performance
indicator is
qualitative.
Note: *** demonstrates the excellence of the model compared to the other models
2.3. Decision Making Trial Evaluation and Laboratory (DEMATEL)
The DEMATEL method is a method that was first developed by the Battelle Memorial
Institute (BMA) in 1971 at the Geneva Research Center [30]. In that year, DEMATEL
method was used to assist in the research and analysis of complex problems. The original
DEMATEL aimed to fragment antagonistic phenomena in social field and integration of
decision-making. According to Wu and Lee [31] in Ranjbar and Shirazi [32], DEMATEL
is an appropriate method used to design and analyze complex problems by creating a
structured model of causal relationship between factors in a system. Complex problem
solving using DEMATEL will be presented graphically, so as to facilitate the researchers
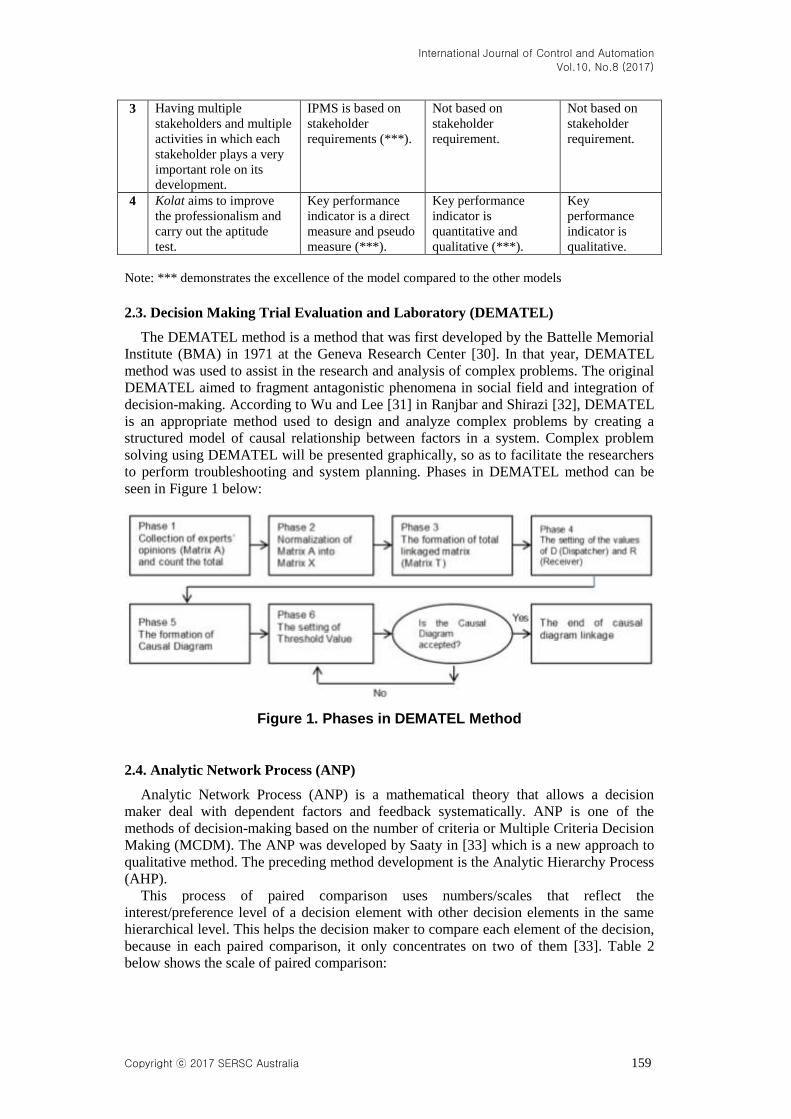
to perform troubleshooting and system planning. Phases in DEMATEL method can be
seen in Figure 1 below:
Figure 1. Phases in DEMATEL Method
2.4. Analytic Network Process (ANP)
Analytic Network Process (ANP) is a mathematical theory that allows a decision
maker deal with dependent factors and feedback systematically. ANP is one of the
methods of decision-making based on the number of criteria or Multiple Criteria Decision
Making (MCDM). The ANP was developed by Saaty in [33] which is a new approach to
qualitative method. The preceding method development is the Analytic Hierarchy Process
(AHP).
This process of paired comparison uses numbers/scales that reflect the
interest/preference level of a decision element with other decision elements in the same
hierarchical level. This helps the decision maker to compare each element of the decision,
because in each paired comparison, it only concentrates on two of them [33]. Table 2
below shows the scale of paired comparison:
International Journal of Control and Automation
Vol.10, No.8 (2017)
160 Copyright ⓒ 2017 SERSC Australia
Table 2. Paired Comparison Scale [33]
Interest Level Definition
1 Both elements are equally important.
3 One element is quite more important than other elements.
5 One element is actually more important than other
elements.
7 One element is clearly more important than other elements.
9 One element is absolutely more important than other
elements.
2,4,6,8 The median between two adjacent values.
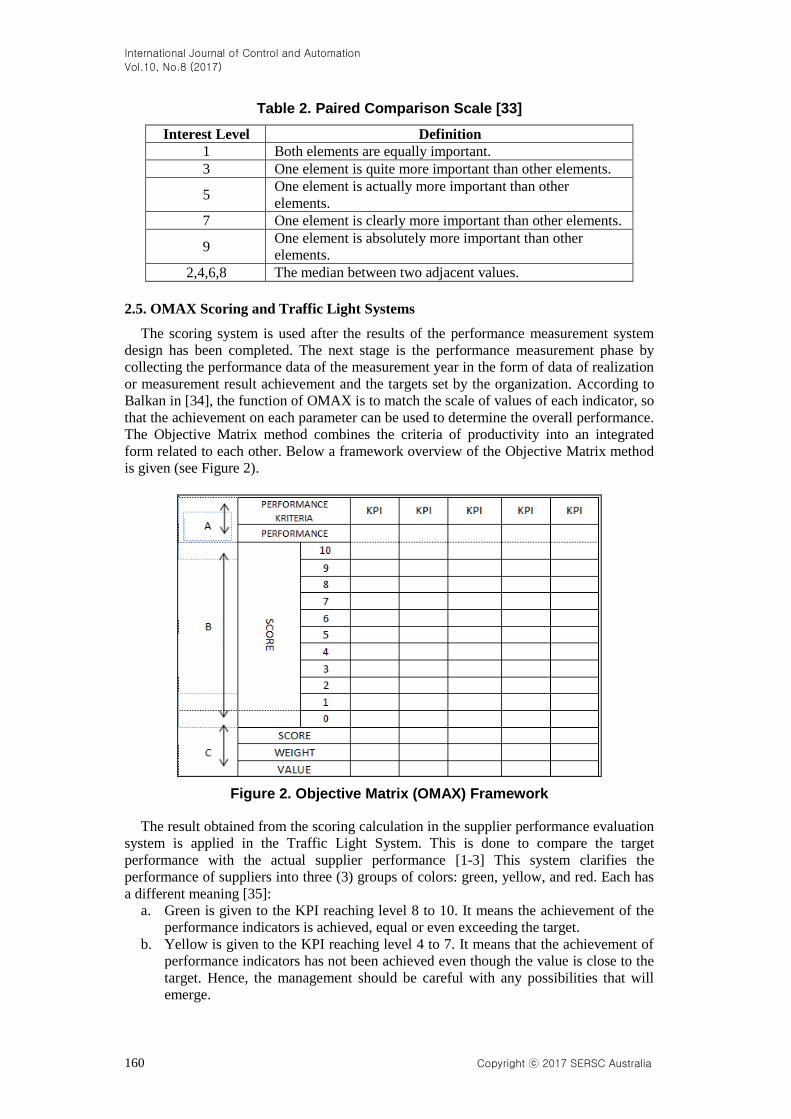
2.5. OMAX Scoring and Traffic Light Systems
The scoring system is used after the results of the performance measurement system
design has been completed. The next stage is the performance measurement phase by
collecting the performance data of the measurement year in the form of data of realization
or measurement result achievement and the targets set by the organization. According to
Balkan in [34], the function of OMAX is to match the scale of values of each indicator, so
that the achievement on each parameter can be used to determine the overall performance.
The Objective Matrix method combines the criteria of productivity into an integrated
form related to each other. Below a framework overview of the Objective Matrix method
is given (see Figure 2).
Figure 2. Objective Matrix (OMAX) Framework
The result obtained from the scoring calculation in the supplier performance evaluation
system is applied in the Traffic Light System. This is done to compare the target
performance with the actual supplier performance [1-3] This system clarifies the
performance of suppliers into three (3) groups of colors: green, yellow, and red. Each has
a different meaning [35]:
a. Green is given to the KPI reaching level 8 to 10. It means the achievement of the
performance indicators is achieved, equal or even exceeding the target.
b. Yellow is given to the KPI reaching level 4 to 7. It means that the achievement of
performance indicators has not been achieved even though the value is close to the
target. Hence, the management should be careful with any possibilities that will
emerge.
International Journal of Control and Automation
Vol.10, No.8 (2017)
Copyright ⓒ 2017 SERSC Australia 161
c. Red is given to the KPI reaching level 0 to 3. It means that the achievement of the
performance indicators is really below the set targets and it requires immediate
upgrading.
3. Proposed Method
The research was conducted by collecting data and information directly from the
stakeholders of KOLAT KOARMATIM. Instruments used in this study are
questionnaires. Questionnaires were distributed to all stakeholders of KOLAT
KOARMATIM, namely, KRI, staff, Special Forces, Navy Main Base (Lantamal/Lanal),
as well as KOLAT KOARMATIM staff. In addition to using questionnaires, the data
collection was conducted by observation, interview, documentation, and literature review
to obtain primary data for the study. The procedure in this study begins with field study
and literature study, and then proceeds by identifying the issues on the company and
setting the objective of the study. The next step is to collect the data both primary data
and secondary data needed in the study. Then the data are processed by using methods of
IPMS, DEMATEL, ANP, and scoring systems that includes OMAX and the Traffic Light
System. From the data processing results and analysis, conclusions and suggestions are
taken.
4. Results and Discussion
This section presents obtained results and following by discussion.
4.2. Validated Stakeholder Requirements
Table 3 below presents the results of stakeholder requirements that have been
validated.
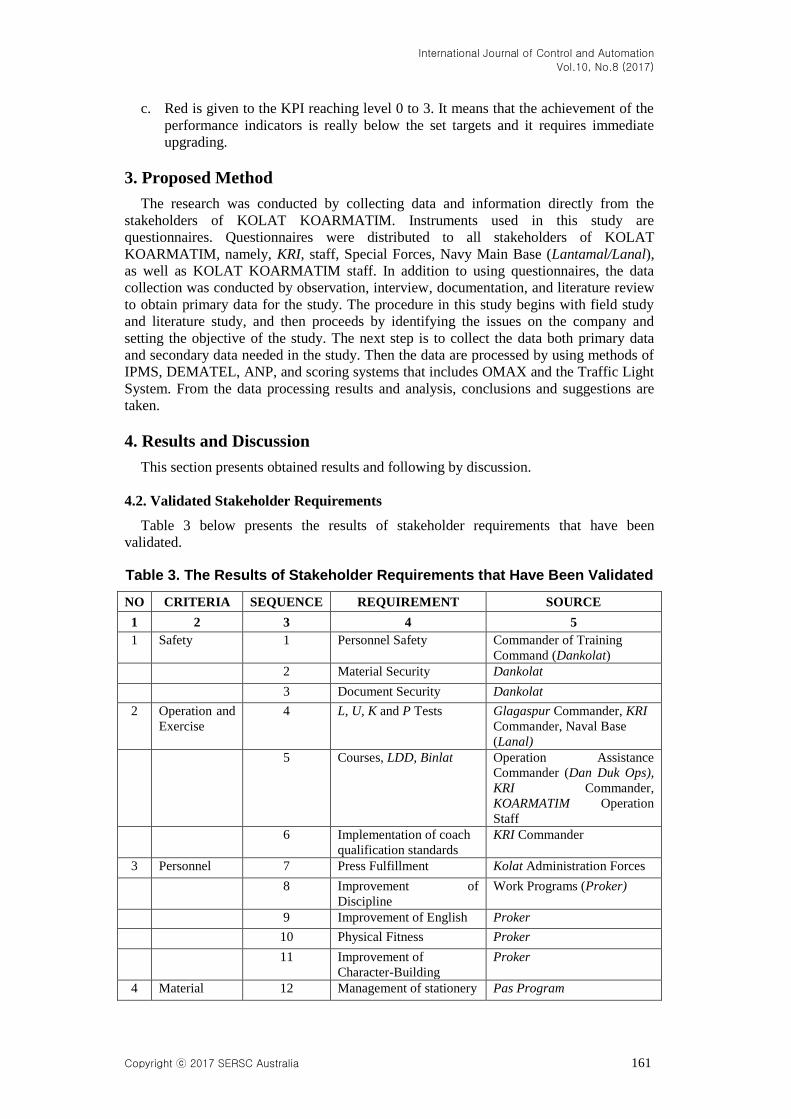
Table 3. The Results of Stakeholder Requirements that Have Been Validated
NO CRITERIA SEQUENCE REQUIREMENT SOURCE
1 2 3 4 5
1 Safety 1 Personnel Safety Commander of Training
Command (Dankolat)
2 Material Security Dankolat
3 Document Security Dankolat
2 Operation and
Exercise
4 L, U, K and P Tests Glagaspur Commander, KRI
Commander, Naval Base
(Lanal)
5 Courses, LDD, Binlat Operation Assistance
Commander (Dan Duk Ops),
KRI Commander,
KOARMATIM Operation
Staff
6 Implementation of coach
qualification standards
KRI Commander
3 Personnel 7 Press Fulfillment Kolat Administration Forces
8 Improvement of
Discipline
Work Programs (Proker)
9 Improvement of English Proker
10 Physical Fitness Proker
11 Improvement of
Character-Building
Proker
4 Material 12 Management of stationery Pas Program
International Journal of Control and Automation
Vol.10, No.8 (2017)
162 Copyright ⓒ 2017 SERSC Australia
13 Report of State
Possession Accounting
System (Simak BMN)
Proker
14 Addition of Instructional
Equipment
Proker, KRI Commander
5 Programs and
Budgets
15 Development Planning
(Renbang)
Proker
16 Budgeting Management Proker
6 Methods 17 Software Training KRI Commander, Lanal,
Proker
18 Completion of the
Curriculum
KRI Commander, Proker,
Kolat Staff
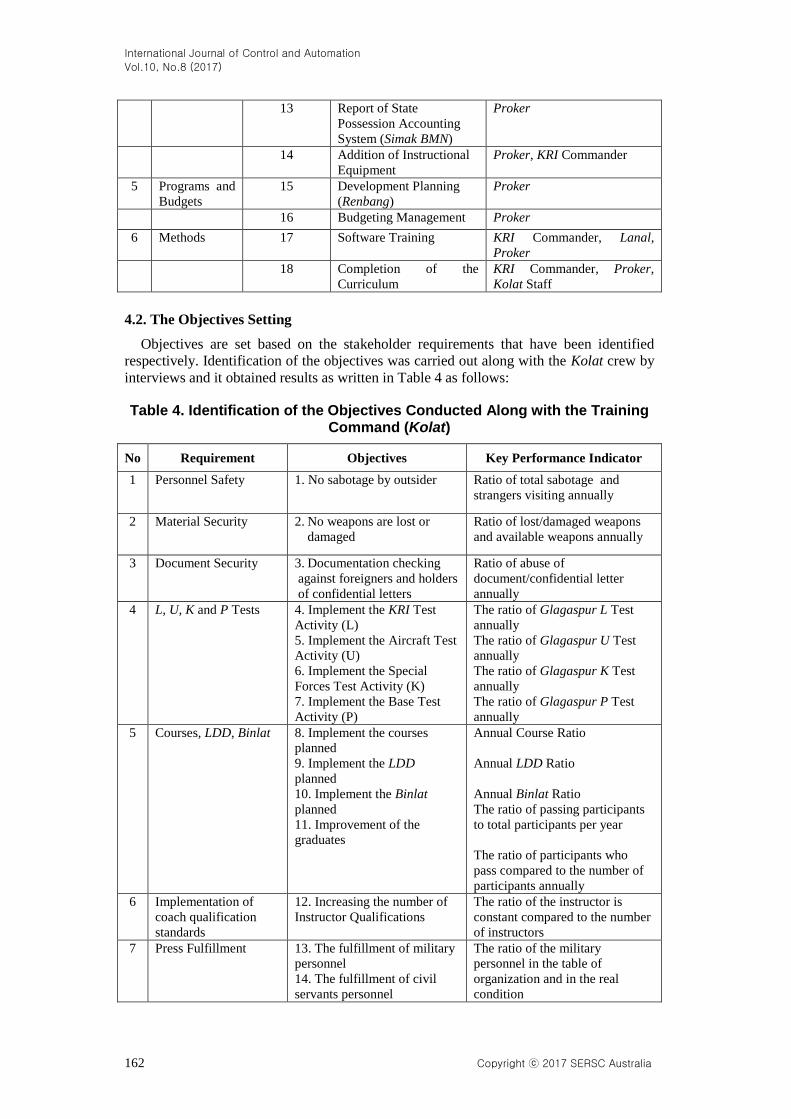
4.2. The Objectives Setting
Objectives are set based on the stakeholder requirements that have been identified
respectively. Identification of the objectives was carried out along with the Kolat crew by
interviews and it obtained results as written in Table 4 as follows:
Table 4. Identification of the Objectives Conducted Along with the Training Command (Kolat)
No Requirement Objectives Key Performance Indicator
1 Personnel Safety 1. No sabotage by outsider Ratio of total sabotage and
strangers visiting annually
2 Material Security 2. No weapons are lost or
damaged
Ratio of lost/damaged weapons
and available weapons annually
3 Document Security 3. Documentation checking
against foreigners and holders
of confidential letters
Ratio of abuse of
document/confidential letter
annually
4 L, U, K and P Tests 4. Implement the KRI Test
Activity (L)
5. Implement the Aircraft Test
Activity (U)
6. Implement the Special
Forces Test Activity (K)
7. Implement the Base Test
Activity (P)
The ratio of Glagaspur L Test
annually
The ratio of Glagaspur U Test
annually
The ratio of Glagaspur K Test
annually
The ratio of Glagaspur P Test
annually
5 Courses, LDD, Binlat 8. Implement the courses
planned
9. Implement the LDD
planned
10. Implement the Binlat
planned
11. Improvement of the
graduates
Annual Course Ratio
Annual LDD Ratio
Annual Binlat Ratio
The ratio of passing participants
to total participants per year
The ratio of participants who
pass compared to the number of
participants annually
6 Implementation of
coach qualification
standards
12. Increasing the number of
Instructor Qualifications
The ratio of the instructor is
constant compared to the number
of instructors
7 Press Fulfillment 13. The fulfillment of military
personnel
14. The fulfillment of civil
servants personnel
The ratio of the military
personnel in the table of
organization and in the real
condition
International Journal of Control and Automation
Vol.10, No.8 (2017)
Copyright ⓒ 2017 SERSC Australia 163
The ratio of the civil servant
personnel in the table of
organization and in the real
condition
8 Improvement of
Discipline
15. Reducing the number of
violations by personnel
The ratio of the number of
violation annually
9 Improvement of
English
16. Increasing the personnel
who pass the American
Language Course Placement
Test (ALCPT)
The ratio of personnel who pass
ALCPT
10 Physical Fitness 17. Increasing the grades of
physical fitness
The ratio of personnel who pass
the physical test
11 Improvement of
Character-Building
18. Decreasing the number of
divorce
The ratio of divorced personnel
12 Management of
stationery
19. Distribution of stationery The ratio of stationery received
annually
13 Report of State
Possessions
Accounting System
(Simak BMN)
20. The completion of Simak
BMN report
The ratio of report made
14 Addition of
Instructional
Equipment
21. The fulfillment of
Instructional Equipment
needed
The ratio of Instructional
Equipment supported
15 Development Planning
(Renbang)
22. The proposal of
Development Planning
The ratio of proposed and
realized development
16 Budgeting
Management
23. Punctual budget allocation The ratio of annual used budget
17 Software Training 24. Upgrading of the existing
software
The ratio of upgraded software
18 Completion of the
Curriculum
25. The improvement of
Instruction Packages (PI)
The ratio of Instruction
Packages (PI) making
4.3. KPI Validation Test
KPI validation is a process to ensure and prove the correctness and accuracy of an
indicator towards the real system. This validation is significant because the indicators in
the performance measurement system of KOLAT KOARMATIM should really be
accountable in terms of truth and accuracy. The validation is carried out by three officers,
namely:
KOLAT KOARMATIM Commander: Navy Colonel (P) O.C Budi Susanto
KOARMATIM Operational Aid Officer for Planning (Pabanrensops): Navy
Lieutenant Colonel (P) Bambang Warsito
KRI Dewaruci Commander: Navy Lieutenant Colonel (P) Widyatmoko Baruno Aji
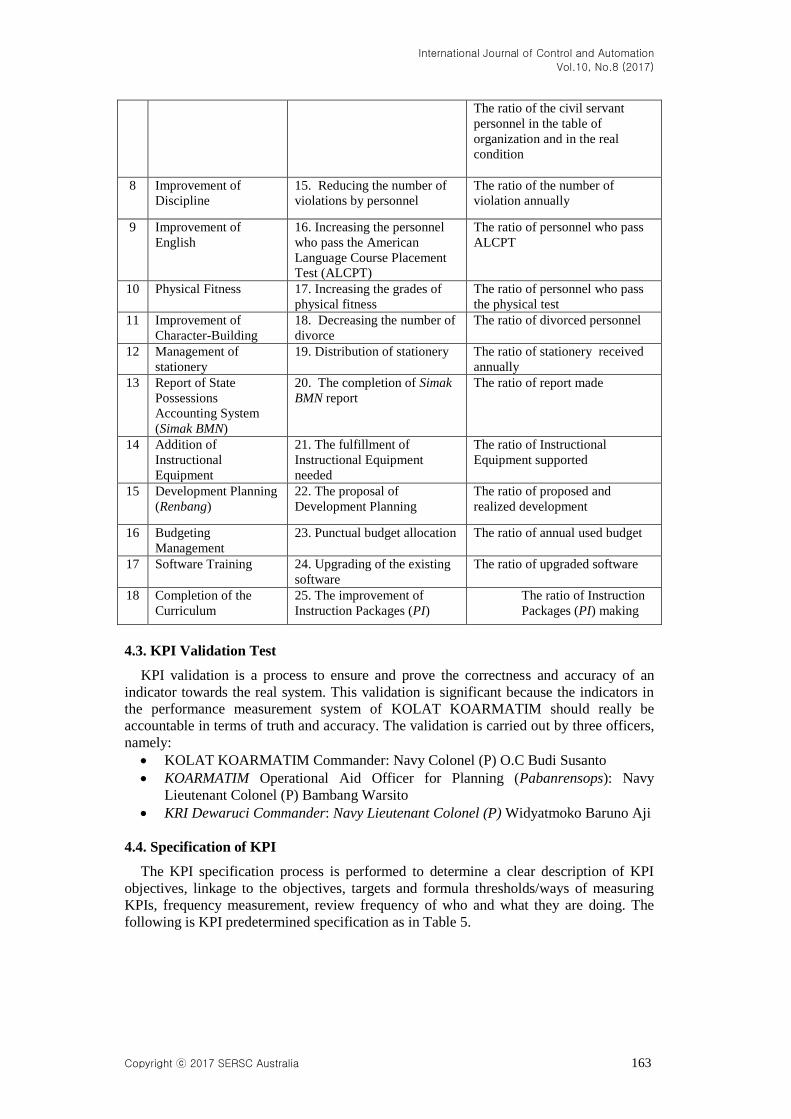
4.4. Specification of KPI
The KPI specification process is performed to determine a clear description of KPI
objectives, linkage to the objectives, targets and formula thresholds/ways of measuring
KPIs, frequency measurement, review frequency of who and what they are doing. The
following is KPI predetermined specification as in Table 5.
International Journal of Control and Automation
Vol.10, No.8 (2017)
164 Copyright ⓒ 2017 SERSC Australia
Table 5. KPI Specification of KOLAT KOARMATIM
No. of KPI 1
Description Personnel Safety
Objective Measuring the level of security against foreigners
Linkage to the objective Personnel losses caused by the negligence of soldiers of
KOLAT KOARMATIM or external personnel.
Threshold target There is no loss of personnel due to negligence
Measurement formula Ratio of strangers abusing and visiting KOLAT
KOARMATIM
Measurement frequency 1 year
Review frequency 1 year
The unit who measure KOLAT KOARMATIM Chief of Security Unit
(Kasatpam)
Data source KOLAT KOARMATIM Chief of Security Unit
(Kasatpam)
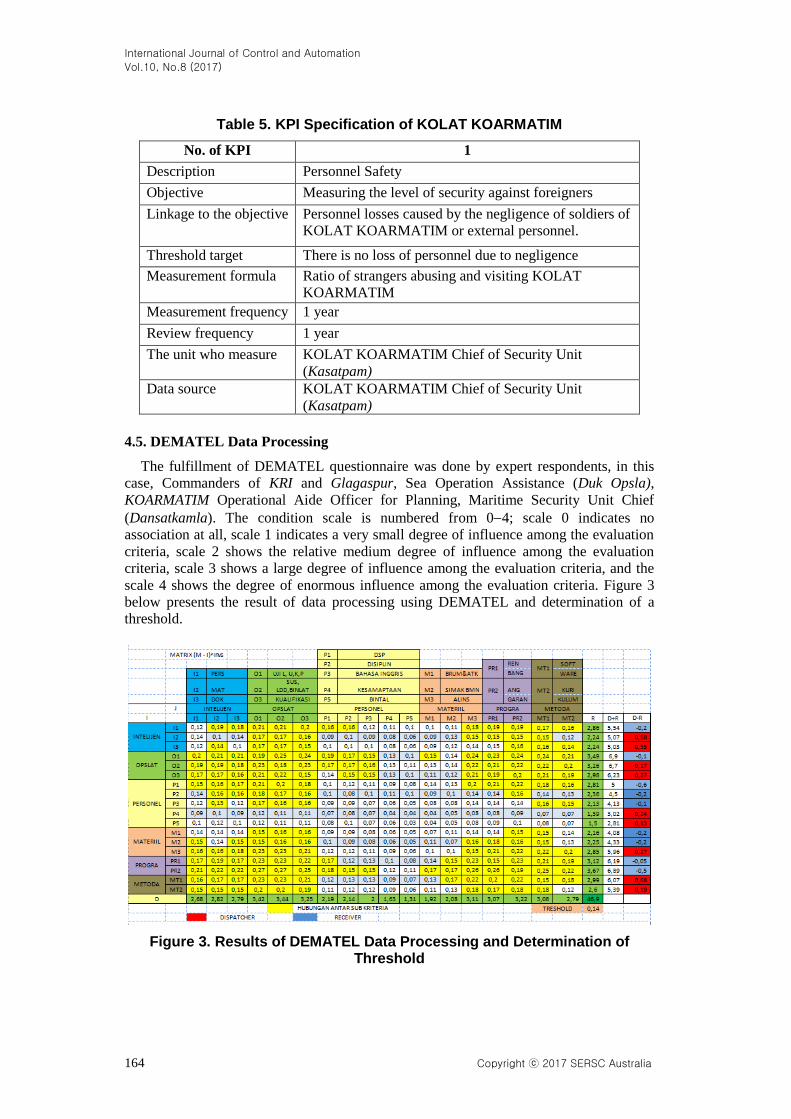
4.5. DEMATEL Data Processing
The fulfillment of DEMATEL questionnaire was done by expert respondents, in this
case, Commanders of KRI and Glagaspur, Sea Operation Assistance (Duk Opsla),
KOARMATIM Operational Aide Officer for Planning, Maritime Security Unit Chief
(Dansatkamla). The condition scale is numbered from 04; scale 0 indicates no
association at all, scale 1 indicates a very small degree of influence among the evaluation
criteria, scale 2 shows the relative medium degree of influence among the evaluation
criteria, scale 3 shows a large degree of influence among the evaluation criteria, and the
scale 4 shows the degree of enormous influence among the evaluation criteria. Figure 3
below presents the result of data processing using DEMATEL and determination of a
threshold.
Figure 3. Results of DEMATEL Data Processing and Determination of Threshold
International Journal of Control and Automation
Vol.10, No.8 (2017)
Copyright ⓒ 2017 SERSC Australia 165
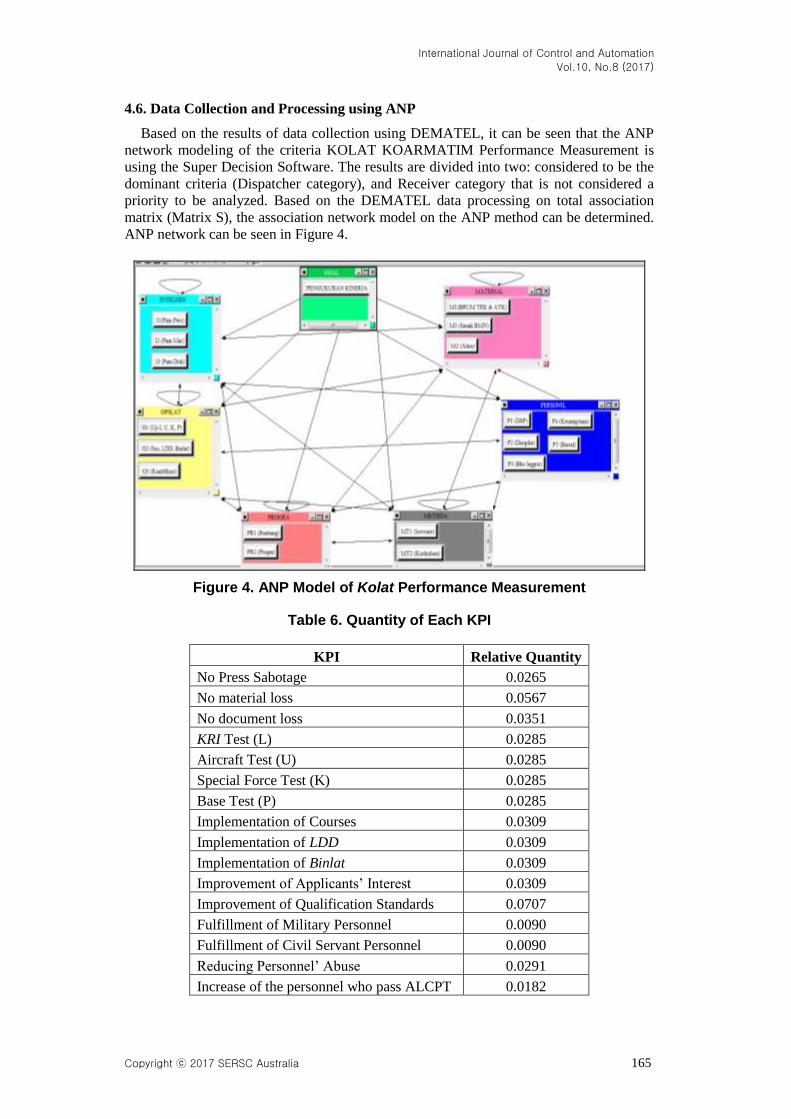
4.6. Data Collection and Processing using ANP
Based on the results of data collection using DEMATEL, it can be seen that the ANP
network modeling of the criteria KOLAT KOARMATIM Performance Measurement is
using the Super Decision Software. The results are divided into two: considered to be the
dominant criteria (Dispatcher category), and Receiver category that is not considered a
priority to be analyzed. Based on the DEMATEL data processing on total association
matrix (Matrix S), the association network model on the ANP method can be determined.
ANP network can be seen in Figure 4.
Figure 4. ANP Model of Kolat Performance Measurement
Table 6. Quantity of Each KPI
KPI Relative Quantity
No Press Sabotage 0.0265
No material loss 0.0567
No document loss 0.0351
KRI Test (L) 0.0285
Aircraft Test (U) 0.0285
Special Force Test (K) 0.0285
Base Test (P) 0.0285
Implementation of Courses 0.0309
Implementation of LDD 0.0309
Implementation of Binlat 0.0309
Improvement of Applicants’ Interest 0.0309
Improvement of Qualification Standards 0.0707
Fulfillment of Military Personnel 0.0090
Fulfillment of Civil Servant Personnel 0.0090
Reducing Personnel’ Abuse 0.0291
Increase of the personnel who pass ALCPT 0.0182
International Journal of Control and Automation
Vol.10, No.8 (2017)
166 Copyright ⓒ 2017 SERSC Australia
Distribution of stationery 0.0135
The completion of Simak BMN 0.0059
The fulfillment of proposed Instructional
Equipment 0.0919
Development Completion 0.0614
Budget Allocation 0.1846
Software Upgrade 0.0933
Creation of Instruction Package 0.0574
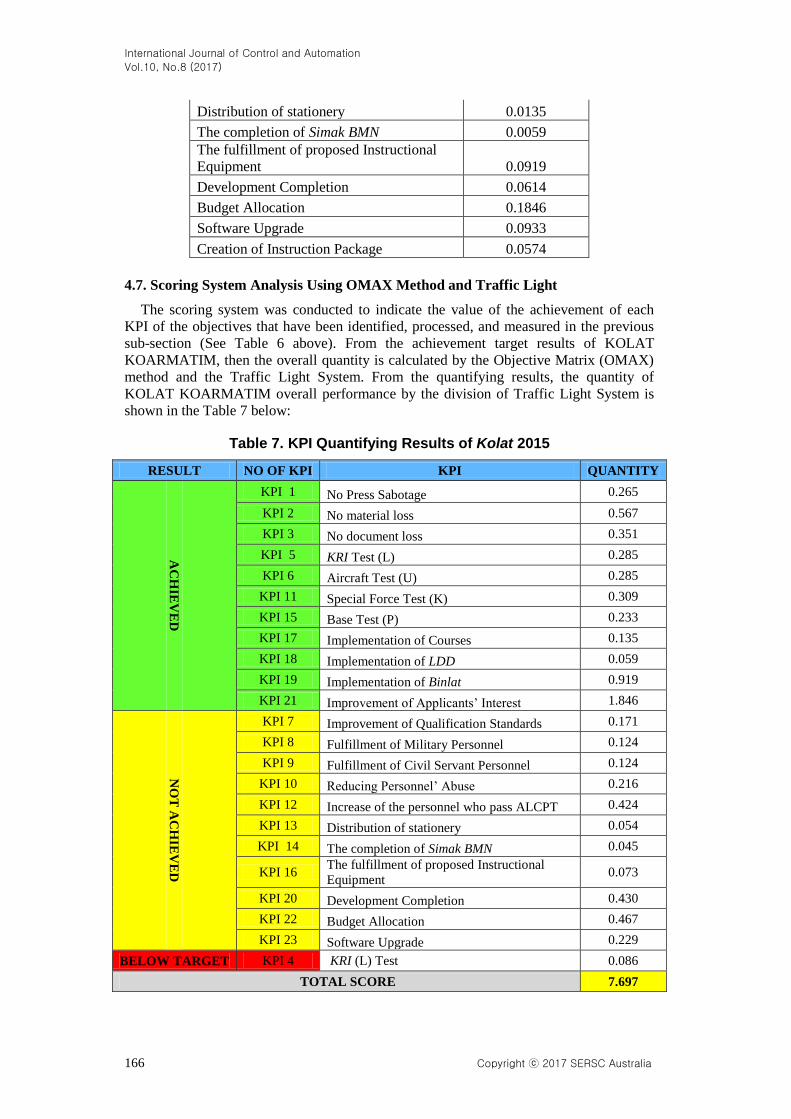
4.7. Scoring System Analysis Using OMAX Method and Traffic Light
The scoring system was conducted to indicate the value of the achievement of each
KPI of the objectives that have been identified, processed, and measured in the previous
sub-section (See Table 6 above). From the achievement target results of KOLAT
KOARMATIM, then the overall quantity is calculated by the Objective Matrix (OMAX)
method and the Traffic Light System. From the quantifying results, the quantity of
KOLAT KOARMATIM overall performance by the division of Traffic Light System is
shown in the Table 7 below:
Table 7. KPI Quantifying Results of Kolat 2015
RESULT NO OF KPI KPI QUANTITY
AC
HIE
VE
D
KPI 1 No Press Sabotage 0.265
KPI 2 No material loss 0.567
KPI 3 No document loss 0.351
KPI 5 KRI Test (L) 0.285
KPI 6 Aircraft Test (U) 0.285
KPI 11 Special Force Test (K) 0.309
KPI 15 Base Test (P) 0.233
KPI 17 Implementation of Courses 0.135
KPI 18 Implementation of LDD 0.059
KPI 19 Implementation of Binlat 0.919
KPI 21 Improvement of Applicants’ Interest 1.846
NO
T A
CH
IEV
ED
KPI 7 Improvement of Qualification Standards 0.171
KPI 8 Fulfillment of Military Personnel 0.124
KPI 9 Fulfillment of Civil Servant Personnel 0.124
KPI 10 Reducing Personnel’ Abuse 0.216
KPI 12 Increase of the personnel who pass ALCPT 0.424
KPI 13 Distribution of stationery 0.054
KPI 14 The completion of Simak BMN 0.045
KPI 16 The fulfillment of proposed Instructional
Equipment 0.073
KPI 20 Development Completion 0.430
KPI 22 Budget Allocation 0.467
KPI 23 Software Upgrade 0.229
BELOW TARGET KPI 4 KRI (L) Test 0.086
TOTAL SCORE 7.697
International Journal of Control and Automation
Vol.10, No.8 (2017)
Copyright ⓒ 2017 SERSC Australia 167
Table 7 above clearly shows KOLAT KOARMATIM performance achievement in
2015; of 23 KPIs, the performance measurement can be explained as follows:
a. There are 11 green KPIs with a threshold of 8 to 10; it means the achievement of a
KPI has been reached.
b. There are 11 yellow KPIs with a threshold of 4 to 7; it means the achievement of a
KPI is not reached, even though the value is close to the target.
c. There is 1 red KPI with a threshold of less than or equal to 3; it means the
achievement of a KPI is below the target set by KOLAT KOARMATIM.
The overall score of the KOLAT KOARMATIM performance measurement is 7.697;
which means the target of performance measurement (achievement) still has not been
achieved despite nearing the desired threshold target (See Table 8).
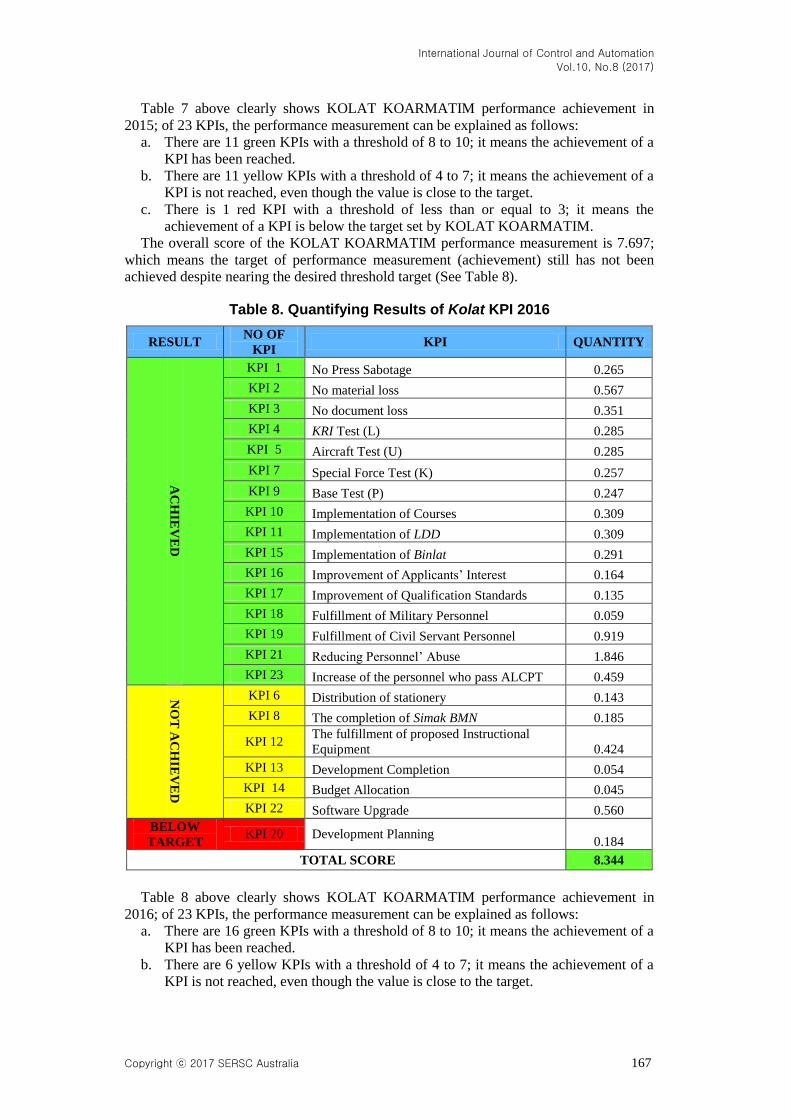
Table 8. Quantifying Results of Kolat KPI 2016
RESULT NO OF
KPI KPI QUANTITY
AC
HIE
VE
D
KPI 1 No Press Sabotage 0.265
KPI 2 No material loss 0.567
KPI 3 No document loss 0.351
KPI 4 KRI Test (L) 0.285
KPI 5 Aircraft Test (U) 0.285
KPI 7 Special Force Test (K) 0.257
KPI 9 Base Test (P) 0.247
KPI 10 Implementation of Courses 0.309
KPI 11 Implementation of LDD 0.309
KPI 15 Implementation of Binlat 0.291
KPI 16 Improvement of Applicants’ Interest 0.164
KPI 17 Improvement of Qualification Standards 0.135
KPI 18 Fulfillment of Military Personnel 0.059
KPI 19 Fulfillment of Civil Servant Personnel 0.919
KPI 21 Reducing Personnel’ Abuse 1.846
KPI 23 Increase of the personnel who pass ALCPT 0.459
NO
T A
CH
IEV
ED
KPI 6 Distribution of stationery 0.143
KPI 8 The completion of Simak BMN 0.185
KPI 12 The fulfillment of proposed Instructional
Equipment 0.424
KPI 13 Development Completion 0.054
KPI 14 Budget Allocation 0.045
KPI 22 Software Upgrade 0.560
BELOW
TARGET KPI 20 Development Planning
0.184
TOTAL SCORE 8.344
Table 8 above clearly shows KOLAT KOARMATIM performance achievement in
2016; of 23 KPIs, the performance measurement can be explained as follows:
a. There are 16 green KPIs with a threshold of 8 to 10; it means the achievement of a
KPI has been reached.
b. There are 6 yellow KPIs with a threshold of 4 to 7; it means the achievement of a
KPI is not reached, even though the value is close to the target.
International Journal of Control and Automation
Vol.10, No.8 (2017)
168 Copyright ⓒ 2017 SERSC Australia
c. There is 1 red KPI with a threshold of less than or equal to 3; it means the
achievement of a KPI is below the target set by KOLAT KOARMATIM.
The overall score of the KOLAT KOARMATIM performance measurement is 8.344
meaning that the target of performance measurement (achievement) has been achieved.
This suggests that there is an increase in the performance of KOLAT KOARMATIM in
2016 compared to 2015; and it is expected that this condition will always be maintained
for the coming period although there are some KPIs that should be noted not to decrease,
and there are also KPIs that should receive serious attention in order not to be below the
target.
4.8. Discussion
Based on the data processing results, the implementation and design of KOLAT
KOARMATIM Performance Measurement with IPMS method, DEMATEL, ANP
continued with scoring using OMAX and Traffic Light System, it could be concluded as
follows:
a. From the KOLAT KOARMATIM Performance Measurement results using
Integrated Performance Measurement System, it obtains 6 (six) criteria, 16
(sixteen) sub-criteria, and 23 (twenty three) KPIs which include 3 KPIs for
intelligence criteria, 9 KPIs for operations and exercises criteria, 4 KPIs for
personnel criteria, 3 KPI for material criteria, 2 KPIs for the program and budget
criteria, 2 KPIs for method criteria.
b. From the measurement of 2015 performance conducted, it gains 7.697 of Total
Performance Index as a result of scoring by using Objective Matrix (OMAX);
while by using the Traffic Light System, the results are in the yellow category, that
means the target of performance measurement (achievement) of 2015 was not
achieved despite nearing the desired threshold target; there are 11 green KPIs
which means the achievement of a KPI has been achieved; there are 11 yellow
KPIs which means the achievement of a KPI is not achieved; and one red KPI
which means the achievement of a KPI is below the set target.
c. From the measurement of 2016 performance conducted, it gains 8.344 of Total
Performance Index as a result of scoring by using Objective Matrix (OMAX);
while by using the Traffic Light System, the results are in green category, that
means the target of performance measurement (achievement) has been achieved
with a distribution; 16 green KPIs which means the achievement of a KPI has been
achieved; there are 6 yellow KPIs which means the achievement of a KPI is not
achieved; and one red KPI which means the achievement of a KPI is below the set
target.
d. In the performance measurement in 2015 and 2016, there is an increase in total
quantity of 0.647, which means the performance measurement target of KOLAT
KOARMATIM in 2016 has increased, although there is one KPI that is below the
target; the 20 KPIs of development planning. It is because the development
planning decision is made in the level of Navy Headquarters (MABESAL).
e. Recommendations for improvements are not only given to KPIs that are below the
target, but to all KPIs. They are expected to give positive feedback to the KOLAT
KOARMATIM Commander.
f. In general, Kolat performance assessment is based on the expectations of
stakeholders. Duties and responsibilities of KOLAT KOARMATIM can be carried
out properly in accordance with the planning and implementation.
g. As a final conclusion to answer the questions on the formulation of the problem
and the research objectives, KOLAT KOARMATIM Performance Measurement
can be carried out by using the method of Integrated Performance Measurement
System, DEMATEL, ANP, and continued by scoring using OMAX and Traffic
Light System.
International Journal of Control and Automation
Vol.10, No.8 (2017)
Copyright ⓒ 2017 SERSC Australia 169
5. Conclusion and Recommendation
This paper has presented the combination of DEMATEL, ANP, and IPMS methods for
performance measurement system design. The method has been successfully designed at
KOLAT KOARMATIM to analyze the achievement of the 2015 and 2016 Work
Programs with 23 Key Performance Indicators (KPIs), based on stakeholders’
requirements of KOLAT KOARMATIM. Based on the research conducted, several
suggestions found in this study can be addressed to future researches as well as to the
authorities of the decision maker, in this case, the Commander of KOLAT
KOARMATIM: In the subsequent studies, they are suggested to integrate the
performance measurement system with the evaluation system and information technology
as a supporting means, so that the process of measurement and performance evaluation
can be quickly updated. As suggestions for KOLAT KOARMATIM, the results of
performance measurement system design conducted by the approach of Integrated
Performance Measurement System may be the solution for the problems of measurement
that has been done, but it requires that the data collection of the performance achievement
value should be conducted continuously.
Acknowledgement
This research is supported by Research Grant from Sekolah Tinggi Teknologi
Angkatan Laut, Indonesia.
References
[1] I. Vanany. “ANP pada Perancangan Sistem Pengukuran Kinerja (Studi Kasus pada P.T. X)”, Journal
Teknik Industri. vol. 5, no. 1, (2003), pp. 50-62.
[2] I. Vanany and D. Tanukhidah, “Perancangan dan Implementasi Sistem Pengukuran Kinerja dengan
Metode Performance Prism pada Bisnis Hotel”, Jurnal Teknik Industri, Universitas Petra, (2004).
[3] I. Vanany, “Performance Measurement: Model dan Aplikasi (Revision Second Print)”, Penerbit ITS
Press, Surabaya, (2009).
[4] R. F. Speklé and F. H. Verbeeten, “The use of performance measurement systems in the public sector:
Effects on performance”, Management Accounting Research, vol. 25, no. 2, (2014), pp.131-146.
[5] L. Siham, B. J. Claude, G. Laurent, D. Yves and J. Zied, “Designing supply chain performance
measurement and management systems: A systemic perspective”, In Advanced Logistics and Transport
(ICALT), 2015 4th International Conference on, IEEE, (2015), pp. 211-216.
[6] M. C. Wall, K. Kraus and M. Messner, “Performance measurement systems and the enactment of
different institutional logics: insights from a football organization”, Management Accounting Research,
vol. 32, (2016), pp.45-61.
[7] F. Landy, S. Zedeck and J. Cleveland, “Performance measurement and theory”, Taylor & Francis,
(2017).
[8] P. L. Indah, P. Suwignjo and I. Vanany, “Perancangan Sistem Pengukuran Kinerja dengan Balanced
Scorecard: Bentuk, Mekanisme, dan Prospek Aplikasinya pada BUMN”, Journal Ekonomi dan Bisnis
Indonesia, vol. 12, no. 2, (2002).
[9] K. S. Robert and N. B. David, “Translating Strategy into Action: The balanced Scorecard”, Harvard
Business school Press, Boston, Massachusetts, (1996).
[10] K. S. Robert and N. B. David, “Linking the Balanced Scorecard to Strategy”, California Management
Review fall into Action, S., 1996. Balanced scorecard. Harvard Business School Press, Boston, MA, vol.
39, no. 1, (1996).
[11] Martello, M., Watson, J.G. and Fischer, M.J., 2016. Implementing a balanced scorecard in a not-for-
profit organization. Journal of Business & Economics Research (Online), 14(3), p.61.
[12] Neely, A., Adams, C. and Crowe, P., 2001. The performance prism in practice. Measuring business
excellence, 5(2), pp.6-13.
[13] Neely, A. and Adams, C., 2000. Perspectives on performance: the performance prism. Focus Magazine
for the Performance Management Professional, 4.
[14] Neely, A.D., Adams, C. and Kennerley, M., 2002. The performance prism: The scorecard for measuring
and managing business success. London: Financial Times/Prentice Hall.
[15] Kusuma, W. (2006). “Perancangan dan Pengukuran Kinerja dengan Menggunakan Metode Performance
Prism di PT Kangsen Kenko Indonesia Cabang Surabaya”, Proceeding of the National Seminar on
Technology Management III Program MMT-ITS, Surabaya, February 4, 2006.
International Journal of Control and Automation
Vol.10, No.8 (2017)
170 Copyright ⓒ 2017 SERSC Australia
[16] Anita (2003). “Perancangan dan Implementasi Sistem Pengukuran Kinerja Yayasan dengan Metode
Integrated Performance Measurement System pada YDSF Surabaya”. Jurnal Industrial Engineering, RSI
658. 312 5 Ani p, 2003.
[17] Bititci, U.S, Carrie A.S., McDevitt L. (1997). “Integrated Performance Measurement System: An Audit
Development Guide”, International Journal of Operations and Production Management, 17(5), pp.522-
534.
[18] Susetyo, J (2013). “Penerapan Sistem Pengukuran Kinerja Perusahaan dengan Metode Integrated
Performance Measurement Systems (IPMS) pada PT X”. Jurnal Teknologi, Volume 6 Nomor 1, Juni
2013, p. 98.
[19] Maulidia, F.R., Setyanto, N.W. and Rahman, A., 2014. Perancangan Sistem Pengukuran Kinerja Dengan
Metode Integrated Performance Measurement System (IPMS) (Studi Kasus: KPRI Universitas
Brawijaya). Jurnal Rekayasa dan Manajemen Sistem Industri, 2(1), pp.p1-10.
[20] Indrawati, I. (2005) “Perancangan dan Sistem Pengukuran Kinerja dengan Pendekatan IPMS”
Undergraduete Thesis, Industrial Enginering, RSI 658.312 45 Ind p, 2005.
[21] Liang, T.L., Hsu, S.L., Huang, C.H. and Chen, M.T., 2013. A Study on the Causal Relationship of
Evaluation and Selection Criteria for the Professional Capabilities in School’s Administrative Operation.
Journal of Applied Sciences, 13(3), pp.354-365.
[22] Tzeng, G.H., Chiang, C.H. and Li, C.W., 2007. Evaluating intertwined effects in e-learning programs: A
novel hybrid MCDM model based on factor analysis and DEMATEL. Expert systems with
Applications, 32(4), pp.1028-1044.
[23] Lin, R.J., 2013. Using fuzzy DEMATEL to evaluate the green supply chain management practices.
Journal of Cleaner Production, 40, pp.32-39.
[24] Govindan, K., Khodaverdi, R. and Vafadarnikjoo, A., 2016. A grey DEMATEL approach to develop
third-party logistics provider selection criteria. Industrial Management & Data Systems, 116(4), pp.690-
722.
[25] Büyüközkan, G. and Güleryüz, S., 2016. An integrated DEMATEL-ANP approach for renewable energy
resources selection in Turkey. International Journal of Production Economics, 182, pp.435-448.
[26] Bititci, U.S., Carrie, A.S., Turner, T. and Lutz, S., 1998. Integrated performance measurement systems:
implementation case studies. In Strategic Management of the Manufacturing Value Chain (pp. 177-184).
Springer US.
[27] P. Suwignjo, U. Bititci, A. Carrie and T. Turner, “Performance measurement systems: auditing and
prioritisation of performance measures”, In Internation conference on Performance Measurement,
(1998).
[28] U. S. Bititci, U. Turner and C. Begemann, “Dynamics of performance measurement systems”,
International Journal of Operations & Production Management, vol. 20, no. 6, (2000), pp.692-704.
[29] E. Fontela and A. Gabus, “DEMATEL Report No. 2. Analytical Methods, Battelle”, (1973).
[30] W. W. Wu and Y. T. Lee, “Developing global managers’ competencies using the fuzzy DEMATEL
method”, Expert systems with applications, vol. 32, no. 2, (2007), pp.499-507.
[31] M. S. Ranjbar, M. A. Shirazi and M. L. Blooki, “Interaction among intra-organizational factors effective
in successful strategy execution: An analytical view”, Journal of Strategy and Management, vol. 7, no.
2, (2014), pp.127-154.
[32] T. L. Saaty, “Analytic network process”, In Encyclopedia of Operations Research and Management
Science, Springer US, (2001), pp. 28-35.
[33] D. Balkan, “Enterprise productivity measurement in services by OMAX (Objective Matrix) method and
an application with Turkish emergency service”, In Reser Conference, Productivity of Services Next
Gen–Beyond Output/Input. Hamburg, (2011), pp. 1-13.
[34] W. Wiwin, “Pengembangan Model Risiko pada Implementasi Lean Manufacturing di P.T. Dirgantara
Indonesia (Indonesian AeroSpace) dengan Pendekatan Terintegrasi”, (2015).