Embed Size (px)
Citation preview

MORTALITY
The combination of cardiorespiratory fitness and muscle strength,and mortality risk
Youngwon Kim1,2• Tom White1 • Katrien Wijndaele1 • Kate Westgate1 • Stephen J. Sharp1 •
Jørn W. Helge3 • Nick J. Wareham1• Soren Brage1
Received: 24 August 2017 / Accepted: 21 March 2018 / Published online: 28 March 2018� The Author(s) 2018
AbstractLittle is known about the combined associations of cardiorespiratory fitness (CRF) and hand grip strength (GS) with
mortality in general adult populations. The purpose of this study was to compare the relative risk of mortality for CRF, GS,
and their combination. In UK Biobank, a prospective cohort of[ 0.5 million adults aged 40–69 years, CRF was measured
through submaximal bike tests; GS was measured using a hand-dynamometer. This analysis is based on data from 70,913
men and women (832 all-cause, 177 cardiovascular and 503 cancer deaths over 5.7-year follow-up) who provided valid
CRF and GS data, and with no history of heart attack/stroke/cancer at baseline. Compared with the lowest CRF category,
the hazard ratio (HR) for all-cause mortality was 0.76 [95% confidence interval (CI) 0.64–0.89] and 0.65 (95% CI
0.55–0.78) for the middle and highest CRF categories, respectively, after adjustment for confounders and GS. The highest
GS category had an HR of 0.79 (95% CI 0.66–0.95) for all-cause mortality compared with the lowest, after adjustment for
confounders and CRF. Similar results were found for cardiovascular and cancer mortality. The HRs for the combination of
highest CRF and GS were 0.53 (95% CI 0.39–0.72) for all-cause mortality and 0.31 (95% CI 0.14–0.67) for cardiovascular
mortality, compared with the reference category of lowest CRF and GS: no significant association for cancer mortality (HR
0.70; 95% CI 0.48–1.02). CRF and GS are both independent predictors of mortality. Improving both CRF and muscle
strength, as opposed to either of the two alone, may be the most effective behavioral strategy to reduce all-cause and
cardiovascular mortality risk.
Keywords Cardiorespiratory fitness � Grip strength � Mortality � UK Biobank
Introduction
Low cardio-respiratory fitness (CRF) is a strong predictor
of numerous health outcomes, including mortality, not only
in general adult populations [1] but also in obese [2],
hypertensive [3, 4], or diabetic [5] adults. Poor muscular
strength, another component of fitness, has also been
indicated as an important marker of mortality [6, 7] as well
as adverse health outcomes such as frailty and sarcopenia
[8]. Recent clinical trials [9–12] have demonstrated that
compared with improving either CRF or muscle strength
alone, improving both CRF and muscle strength simulta-
neously led to more favorable changes on intermediate
cardio-metabolic risk factors and functional status; these
intermediate outcomes are important predictors for clinical
end-points [13, 14]. However, the prior clinical trials
[9–12] did not include clinical end-points, and it would, in
fact, be nearly impossible to establish clinical trials with
Electronic supplementary material The online version of this article(https://doi.org/10.1007/s10654-018-0384-x) contains supplementarymaterial, which is available to authorized users.
& Youngwon Kim
1 MRC Epidemiology Unit, University of Cambridge School of
Clinical Medicine, Box 285 Institute of Metabolic Science,
Cambridge Biomedical Campus, Cambridge,
Cambridgeshire CB2 0QQ, UK
2 Department of Health, Kinesiology, and Recreation, College
of Health, University of Utah, 250 South 1850 East Room
204, Salt Lake City, UT 84112, USA
3 Department of Biomedical Sciences, Center of Healthy
Aging, University of Copenhagen, Blegdamsvej 3, 2200 N,
Copenhagen, Denmark
123
European Journal of Epidemiology (2018) 33:953–964https://doi.org/10.1007/s10654-018-0384-x(012 3456789().,- volV)(0123456789().,-volV)

sufficient statistical power to do so. In contrast, large-scale
prospective observational studies can provide such evi-
dence. However, a few observational studies evaluating
combined impacts of CRF and muscle strength in relation
to mortality risk merely included data from highly select
populations of men (i.e. men who were either hypertensive
[15] or adolescent [16] at baseline). This limitation pre-
cludes the ability to draw robust conclusions for general
adult populations of men and women. Given that current
public health guidelines [17] recommend that men and
women engage in both aerobic and muscle-strengthening
activities across the whole lifespan, it is critical from
clinical and public health standpoints to examine the
combined impacts of CRF and muscle strength for mor-
tality risk for a broader adult population.
The UK Biobank study is an ongoing prospective
national cohort of over half a million middle-aged UK men
and women. Data collection at baseline and repeat-
assessment visit included submaximal stationary bike tests
to assess CRF as well as grip strength (GS) to evaluate
overall muscle strength [18–20]. This provides an oppor-
tunity to disentangle the interplay between CRF, muscle
strength and mortality in general adult populations.
Therefore, the purpose of this study was to explore the
relative risk of mortality from all causes, cardiovascular
disease (CVD) and cancer for CRF, GS and the combina-
tion of both.
Methods
Study design and participants
Approximately 9.2 million adults who were within \ 25
miles of one of 22 assessment centres across the UK and
registered with the National Health Service were initially
contacted for participation in the UK Biobank study.
Between 2006 and 2010,[ 500,000 participants underwent
baseline data collection which included a wide variety of
physical measurements and biological samples, as well as
questionnaires on prevalent morbidities, socio-demo-
graphic factors, family history/early-life exposures, life-
style, and environmental factors. Repeated assessments of
the variables were carried out between 2012 and 2013 in a
sub-sample of over 20,000 individuals. From 2009, the
baseline protocol was extended to include submaximal
stationary bike tests to assess CRF; this was offered to
96,550 participants (79,209 from baseline; 20,218 from the
repeat-measures visit), totaling 99,427 measurements
(2877 at both time points). More details about the UK
Biobank methodology are provided elsewhere [21]; Fig. 1
provides an overview of participants included in the pre-
sent analysis. All participants signed informed written
consent prior to participation, and the UK Biobank protocol
was approved by the North West Multi-Centre Research
Ethics Committee.
Exposures
Cardiorespiratory fitness
Prior to performing a submaximal exercise test on a sta-
tionary bike (eBike Comfort Ergometer, General Electric,
firmware version 1.7), participants were categorized into
one of five risk categories (S1 Material in Appendix) [22].
The risk categorization determined allocation to an indi-
vidualized exercise protocol (S2 Material in Appendix), a
methodology aimed at increasing the number of partici-
pants with exposure information whilst at the same time
reducing the likelihood that participants experience any
adverse medical events during the exercise test. Individuals
with ‘minimal risk’ (n = 72,715) and ‘small risk’
(n = 11,257) carried out standard bike protocols, which
consisted of (1) an initial 15-s seated-rest period, (2) a
2-min phase at constant power (30 watts for women; 40
watts for men), (3) a 4-min ramp phase with linear
increases in power from their initial constant power to their
individually assigned peak power (to 50 and 35% of pre-
dicted maximal workload for ‘minimal’ and ‘small’ risk,
respectively), and (4) a 1-min recovery period. Individuals
with ‘medium risk’ (n = 2812) cycled at the constant
power level for 6 min. Participants were asked to cycle at
60 revolutions-per-minute (RPM) during all cycling pha-
ses. Individuals in the ‘high’ risk (n = 11,162) category
only did a 2-min seated-rest assessment and were excluded
from this analysis, as were those ‘ineligible’ for electro-
cardiograph testing (n = 1481).
Participants’ electrocardiograms were recorded at
500 Hz with a 4-lead electrocardiograph device (CAM-
USB 6.5, Cardiosoft v6.51; two electrocardiograph elec-
trodes on each upper limb) throughout the full test. The
electrocardiograph signal was processed using the Phys-
ioNet Toolkit [23] implementation of the SQRS algorithm
[24], which applies a digital filter to the signal and iden-
tifies the distinctive downward slopes of QRS complexes.
The resultant inter-beat-intervals were converted to beats-
per-minute values, using ‘‘ihr’’ of the PhysioNet Toolkit
[25] (restricting beat-to-beat heart rate changes to
B 10 bpm), after which linear interpolation was applied to
derive heart rate at 1-s resolution. In addition, we imple-
mented data cleaning and quality control procedures (S3
Material in Appendix). Linear regression was performed to
predict workload from heart rate (S4 Material in Appen-
dix); the established linear relationship was then extrapo-
lated to age-predicted maximum heart rate [26] to estimate
an individual’s maximal power (watts) as an indicator of
954 Y. Kim et al.
123

CRF. Consolidation procedures were applied to obtain the
most robust CRF estimate (S5 Material in Appendix). To
account for differences in body size, CRF was expressed as
maximal power per fat-free mass (kg) (i.e. body mass–fat
mass), the latter measured using bio-impedance analysis
(Tanita BC-418MA). Individuals with heart rate missing for
[ 2 min (50%) during the ramp phase (n = 116) or with
maximum power of 0 (n = 156; a sign of the cycle
ergometer/ECG acquisition system malfunctioning) or
outliers with [ 20 watts/fat-free mass (n = 41) were
excluded from analyses.
Grip strength
GS was assessed once in each hand using a hydraulic hand
dynamometer (Jamar J00105), which can measure iso-
metric grip force and was calibrated by staff at the start of
each measurement day. Each participant grasped the han-
dle of the device in their right hand while sitting upright on
a chair with their forearm on the armrest, and whilst
maintaining a 90� angle of their elbow, squeezed the
handle as strongly as possible for about 3 s. The same
protocol was undertaken with the left hand. GS measures
have good reliability and reproducibility [27]. For the
current primary analysis, values from the two hands were
averaged if available; otherwise, the value from a single
Fig. 1 A flow diagram showing the number of data cases included or excluded at each stage. Note: ‘‘N’’ indicates numbers of total participants
(i.e. participants who provided repeated measures are treated as separate data cases) and ‘‘n’’ indicates numbers of unique participants
The combination of cardiorespiratory fitness and muscle strength, and mortality risk 955
123
hand was used in a small subsample (n = 204). Values of
GS (kg) were also divided by fat-free mass (kg) to account
for differences in body size.
Outcomes
Mortality status was ascertained by linking the Biobank
data with death records from the National Health Service
Information Centre and the Scottish Morbidity Record. For
the present analyses, we used mortality cases accrued until
February 15th 2016. Mortality from CVD and cancer were
classified according to the International Classification of
Diseases-10 codes F01 and I00-I99, and C00-D48,
respectively. The median follow-up period was 5.7 years
(interquartile range 5.6–5.9 years).
Covariates
The following variables were included as covariates in the
analyses: sex, waist circumference (centimeters), ethnicity
(White, mixed, Asian/Asian British, Black/Black British,
other), smoking status (never, previous, current), employ-
ment (unemployed, employed), Townsend Deprivation
Index (a composite score of employment, car ownership,
home ownership and household overcrowding; based on
postcode, with higher values indicating a higher degree of
deprivation), alcohol consumption (never, previously,
currently \ 3 times/week, currently C 3 times/week),
processed/red meat consumption (days/week), beta-blocker
use (yes, no), hypertension, and diabetes. Hypertension was
defined as systolic/diastolic blood pressure C 140/
90 mmHg, a physician diagnosis of hypertension, and/or
reported medication used to regulate blood pressure. Par-
ticipants were considered having diabetes if they reported a
physician diagnosis of diabetes or were taking glucose-
lowering medication. Participants with a self-reported
history of heart attack, stroke or cancer were excluded,
resulting in a final sample of 70,913 participants (2005 with
repeated measures) with no missing values included in the
analyses (Fig. 1).
Statistical analyses
Sex- and age-specific categories of CRF and GS were
calculated based on tertiles of their baseline distributions to
categorize individuals into either low, medium or high
CRF/GS at both baseline and the repeated exposure
assessment (S1 Table in Appendix). Cox regression, with
age as the underlying time scale, was used to estimate
associations of CRF and GS with mortality, including the
categories of CRF and GS at both baseline and follow-up
as time-updated covariates. Models were fitted with no
adjustment (Model 1), adjustment for potential
confounders (Model 2), and further adjustment for GS in
models for CRF or for CRF in models for GS (Model 3).
Parallel sets of models were performed using standardized
variables (i.e. per 1-standard deviation increment) of CRF
and GS. Interactions of CRF or GS with sex were tested.
Joint associations of CRF and GS with mortality were
estimated using low GS/low CRF as the common reference
group; the multiplicative interaction between CRF and GS
was tested. Log–log plots provided support for the pro-
portional hazards assumptions. The following sensitivity
analyses were performed: (1) a random-effects meta-anal-
ysis across the different individualized protocols to exam-
ine the impacts of protocol assignment on fitness-mortality
associations, (2) an analysis after excluding mortality cases
occurring during the first 2 years of follow-up to address
reverse causality, and (3) an analysis with CRF and GS
both normalized for body weight to examine whether dif-
ferent handling of the scaling for body size influences
mortality associations. Analyses were performed in Stata/
SE Version 14 (StataCorp LP, College Station, TX).
Results
Table 1 summarizes characteristics of the participants
across CRF and GS categories. Individuals with greater
CRF or GS were more likely to be smokers, or alcohol
drinkers, be employed, live in less deprived areas, and have
no hypertension or diabetes at baseline. The Pearson cor-
relation between CRF and GS was moderate (0.55) [28].
Table 2 shows associations of CRF and GS with all-
cause, CVD and cancer mortality. Over 379,682 person-
years of follow-up, there were 832, 177 and 503 deaths
from all causes, CVD and cancer, respectively. Crude
mortality rates from all causes, CVD and cancer were
consistently lower in those with higher levels of CRF or
GS. Interactions of each exposure with sex were not sig-
nificant (p-values\ 0.05), so associations were estimated
for men and women combined. Compared with the lowest
category of CRF, the hazard ratios (HR) of all-cause
mortality were lower for the higher CRF categories (p for
trend: \ 0.0001), after adjustment for potential con-
founders. Additional adjustment for GS made almost no
difference to the results. Every 1-standard deviation
increase in CRF was associated with 23% (95% CI
13–31%) lower hazard of all-cause mortality. A meta-
analysis across the different individualized protocols
(sensitivity analysis) revealed similar inverse (although
less linear) associations (S2 Table in Appendix). Analyses
using CRF estimates only from the constant phase also
found similar inverse associations (data not shown).
Compared with the lowest category of GS, the highest
category had a significant HR of 0.80 (95% CI 0.67–0.96)
956 Y. Kim et al.
123

while the HR for the middle category (HR 0.88; 95% CI
0.75–1.04) was not statistically significant after adjustment
for confounders. Nonetheless, the linear trend across the
three groups was significant (p for trend: 0.014). Additional
adjustment for CRF made no meaningful differences to the
associations (p for trend: 0.010). The HR of all-cause
mortality for every 1-standard deviation increase in GS was
0.93 (95% CI 0.86–1.01), which was weaker than that for
CRF.
Higher CRF was associated with lower hazards of CVD
(p for trend: 0.001) and cancer (p for trend: 0.003) mor-
tality, compared with the lowest category, after adjustment
for confounders and GS. The highest CRF category had
51% (95% CI 26–68%) and 28% (95% CI 10–42%) lower
Table 1 Participants’ characteristics
All Cardiorespiratory fitness Grip strength
(N = 72,918;
n = 70,913)
Low
(N = 24,267;
n = 23,723)
Middle
(N = 24,058;
n = 23,394)
High
(N = 24,593;
n = 23,796)
Low
(N = 27,500;
n = 26,676)
Middle
(N = 23,487;
n = 22,871)
High
(N = 21,931;
n = 21,366)
Cardiorespiratory
fitness, watts
188.4 (83.5) 128.2 (51.3) 184.4 (59.1) 251.6 (84.0) 188.6 (85.5) 190.0 (83.3) 186.3 (80.9)
Grip strength, kg 29.4 (10.7) 28.7 (10.7) 29.5 (10.8) 30.0 (10.5) 23.0 (8.5) 30.3 (8.9) 36.3 (10.2)
Fat-free mass, kg 53.2 (11.4) 52.7 (11.6) 53.1 (11.4) 53.7 (11.1) 54.2 (12.0) 53.2 (11.3) 51.9 (10.6)
Age, years 57.2 (8.2) 57.7 (8.4) 57.1 (8.2) 56.6 (8.0) 57.8 (8.3) 57.0 (8.1) 56.4 (8.1)
Sex, %
Women 53.1% 53.4% 53.4% 52.4% 53.4% 52.8% 52.8%
Men 47.0% 46.6% 46.6% 47.6% 46.6% 47.2% 47.2%
Waist
circumference, cm
89.6 (13.0) 90.6 (13.8) 89.5 (12.8) 88.6 (12.3) 92.7 (13.9) 89.2 (12.4) 86.1 (11.5)
Ethnicity, %
White 92.5% 88.9% 93.0% 95.5% 91.9% 92.9% 92.8%
Others 7.5% 11.1% 7.0% 4.5% 8.1% 7.2% 7.2%
Smoking status, %
Never 57.8% 60.1% 57.6% 55.8% 58.6% 57.6% 57.1%
Previously 34.1% 32.2% 34.6% 35.4% 34.0% 34.2% 34.0%
Currently 8.1% 7.8% 7.8% 8.8% 7.5% 8.2% 8.9%
Employment, %
Unemployed 42.9% 46.9% 42.3% 39.3% 46.1% 41.7% 40.0%
Townsend
deprivation index
- 1.35 (2.90) - 1.14 (3.01) - 1.39 (2.88) - 1.52 (2.79) - 1.16 (2.99) - 1.40 (2.89) - 1.53 (2.80)
Alcohol
consumption, %
Never 4.2% 5.8% 4.0% 2.7% 5.0% 4.0% 3.3%
Previously 3.0% 3.4% 3.1% 2.6% 3.5% 3.1% 2.5%
Currently
(\ 3 times/week)
48.0% 51.3% 48.4% 44.4% 50.5% 47.3% 45.7%
Currently
(C 3 times/
week)
44.8% 39.4% 44.5% 50.3% 41.1% 45.6% 48.5%
Processed/red meat
consumption, days/
week
0.89 (0.56) 0.92 (0.58) 0.88 (0.55) 0.86 (0.55) 0.91 (0.58) 0.88 (0.55) 0.87 (0.55)
Beta-blocker use, % 4.7% 3.6% 3.5% 6.8% 5.6% 4.5% 3.7%
Hypertension, % 51.5% 63.2% 48.4% 42.9% 53.6% 50.7% 49.7%
Diabetes, % 4.7% 6.5% 4.2% 3.5% 6.8% 4.2% 2.6%
Values are means (standard deviations) unless otherwise indicated. Age- and sex-specific cut-points were used to create categories of car-
diorespiratory fitness and grip strength. Note: ‘‘N’’ indicates numbers of total participants (i.e. participants who provided repeated measures are
treated as separate data cases) and ‘‘n’’ indicates numbers of unique participants
The combination of cardiorespiratory fitness and muscle strength, and mortality risk 957
123
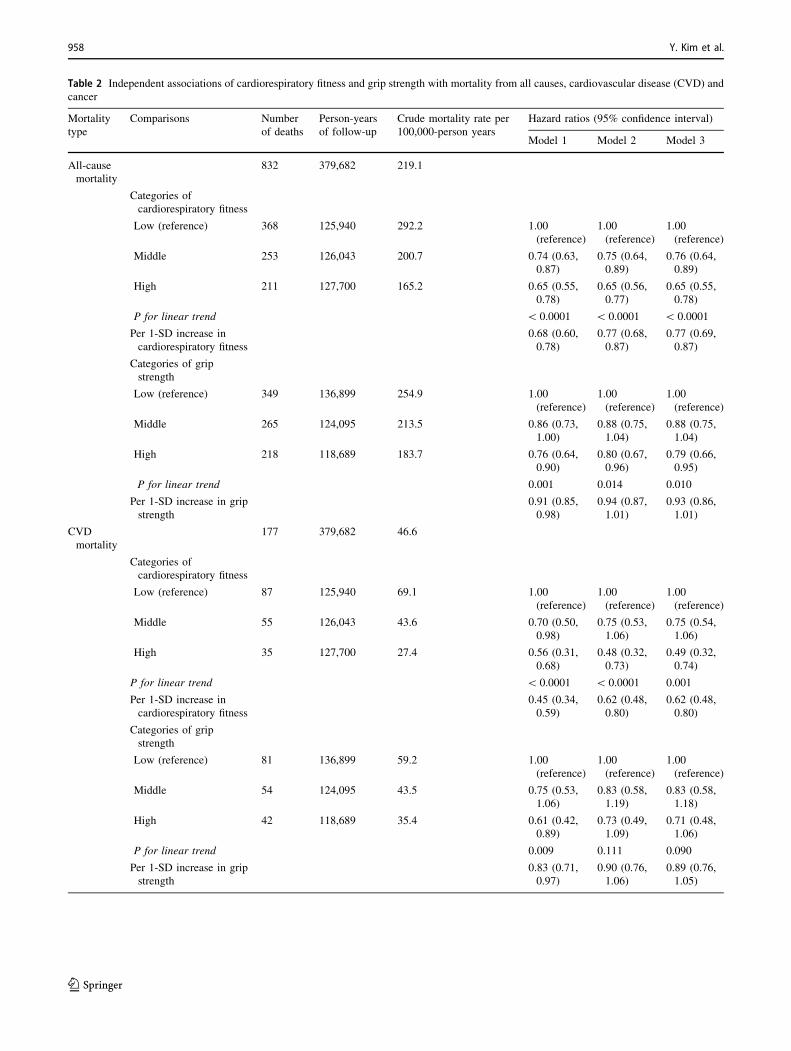
Table 2 Independent associations of cardiorespiratory fitness and grip strength with mortality from all causes, cardiovascular disease (CVD) and
cancer
Mortality
type
Comparisons Number
of deaths
Person-years
of follow-up
Crude mortality rate per
100,000-person years
Hazard ratios (95% confidence interval)
Model 1 Model 2 Model 3
All-cause
mortality
832 379,682 219.1
Categories of
cardiorespiratory fitness
Low (reference) 368 125,940 292.2 1.00
(reference)
1.00
(reference)
1.00
(reference)
Middle 253 126,043 200.7 0.74 (0.63,
0.87)
0.75 (0.64,
0.89)
0.76 (0.64,
0.89)
High 211 127,700 165.2 0.65 (0.55,
0.78)
0.65 (0.56,
0.77)
0.65 (0.55,
0.78)
P for linear trend \ 0.0001 \ 0.0001 \ 0.0001
Per 1-SD increase in
cardiorespiratory fitness
0.68 (0.60,
0.78)
0.77 (0.68,
0.87)
0.77 (0.69,
0.87)
Categories of grip
strength
Low (reference) 349 136,899 254.9 1.00
(reference)
1.00
(reference)
1.00
(reference)
Middle 265 124,095 213.5 0.86 (0.73,
1.00)
0.88 (0.75,
1.04)
0.88 (0.75,
1.04)
High 218 118,689 183.7 0.76 (0.64,
0.90)
0.80 (0.67,
0.96)
0.79 (0.66,
0.95)
P for linear trend 0.001 0.014 0.010
Per 1-SD increase in grip
strength
0.91 (0.85,
0.98)
0.94 (0.87,
1.01)
0.93 (0.86,
1.01)
CVD
mortality
177 379,682 46.6
Categories of
cardiorespiratory fitness
Low (reference) 87 125,940 69.1 1.00
(reference)
1.00
(reference)
1.00
(reference)
Middle 55 126,043 43.6 0.70 (0.50,
0.98)
0.75 (0.53,
1.06)
0.75 (0.54,
1.06)
High 35 127,700 27.4 0.56 (0.31,
0.68)
0.48 (0.32,
0.73)
0.49 (0.32,
0.74)
P for linear trend \ 0.0001 \ 0.0001 0.001
Per 1-SD increase in
cardiorespiratory fitness
0.45 (0.34,
0.59)
0.62 (0.48,
0.80)
0.62 (0.48,
0.80)
Categories of grip
strength
Low (reference) 81 136,899 59.2 1.00
(reference)
1.00
(reference)
1.00
(reference)
Middle 54 124,095 43.5 0.75 (0.53,
1.06)
0.83 (0.58,
1.19)
0.83 (0.58,
1.18)
High 42 118,689 35.4 0.61 (0.42,
0.89)
0.73 (0.49,
1.09)
0.71 (0.48,
1.06)
P for linear trend 0.009 0.111 0.090
Per 1-SD increase in grip
strength
0.83 (0.71,
0.97)
0.90 (0.76,
1.06)
0.89 (0.76,
1.05)
958 Y. Kim et al.
123

hazards of CVD and cancer mortality, respectively, com-
pared with the lowest category. CVD and cancer mortality
rates were also lower in higher categories of GS, although
the HRs were not statistically significant. Nonetheless,
associations were stronger for CVD mortality compared to
all-cause mortality. The HRs comparing CRF categories
were larger than those for GS for all three mortality out-
comes. Similar findings were identified in sensitivity
analyses where CRF and GS were both normalized for
body weight (S3 Table in Appendix), and deaths within the
first 2-years of follow-up were excluded (S4 Table in
Appendix).
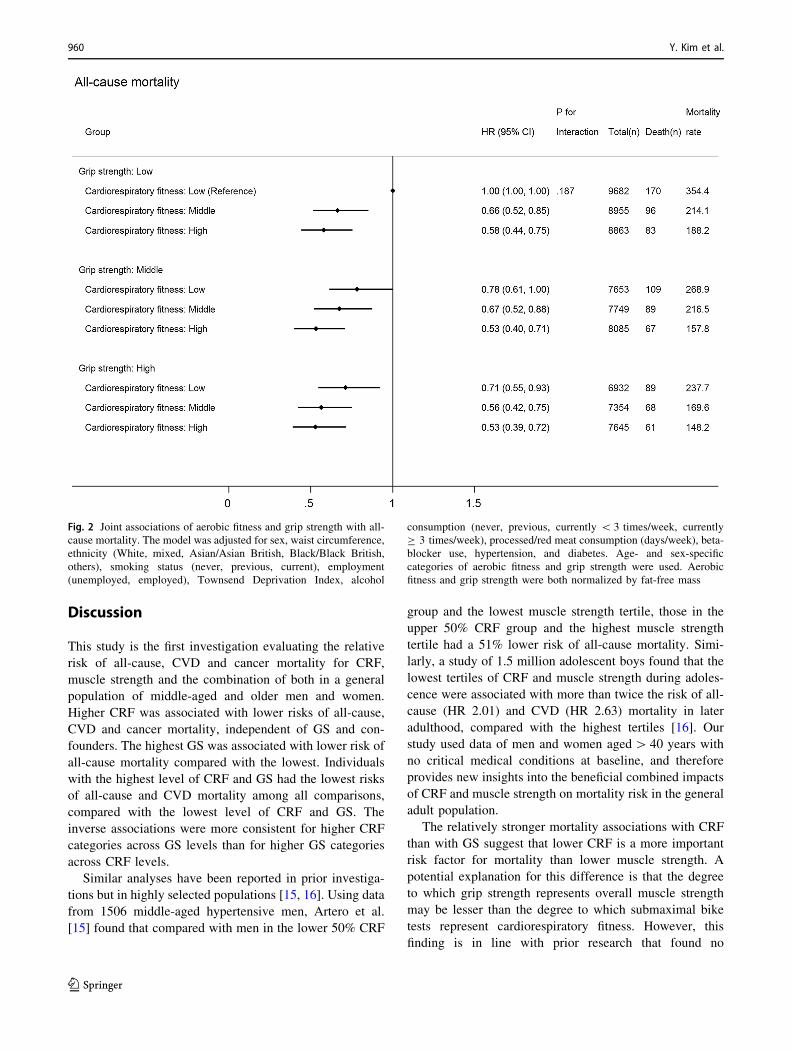
Figure 2 shows joint associations between CRF, GS and
all-cause mortality (p for interaction: 0.187). Compared
with individuals with the lowest CRF and GS, those with
higher levels of both CRF and GS had lower hazards of all-
cause mortality. The HR (compared with low GS and low
CRF) in the highest CRF but lowest GS group (HR 0.58;
95% CI 0.44–0.75) was stronger than that in the lowest
CRF but highest GS group (HR 0.71; 95% CI 0.55–0.93),
although the 95% CIs around these two estimates over-
lapped. Compared with those with the lowest CRF and GS,
individuals in the highest category of CRF and GS had a
47% (95% CI 28–61%) lower hazard of all-cause mortality
and a 69% (95% CI 33–86%) lower hazard of CVD (Fig. 3;
p for interaction: 0.412): no significant association for
cancer mortality (HR 0.70; 95% CI 0.48–1.02) (Fig. 4;
p for interaction: 0.374).
Table 2 (continued)
Mortality
type
Comparisons Number
of deaths
Person-years
of follow-up
Crude mortality rate per
100,000-person years
Hazard ratios (95% confidence interval)
Model 1 Model 2 Model 3
Cancer
mortality
503 379,682 132.5
Categories of
cardiorespiratory fitness
Low (reference) 214 125,940 169.9 1.00
(reference)
1.00
(reference)
1.00
(reference)
Middle 152 126,043 120.6 0.77 (0.62,
0.95)
0.76 (0.62,
0.94)
0.76 (0.61,
0.94)
High 137 127,700 107.3 0.74 (0.60,
0.93)
0.72 (0.58,
0.90)
0.72 (0.58,
0.90)
P for linear trend 0.006 0.003 0.003
Per 1-SD increase in
cardiorespiratory fitness
0.75 (0.64,
0.89)
0.80 (0.68,
0.94)
0.80 (0.68,
0.94)
Categories of grip
strength
Low (reference) 199 136,899 145.4 1.00
(reference)
1.00
(reference)
1.00
(reference)
Middle 163 124,095 131.4 0.93 (0.75,
1.14)
0.94 (0.76,
1.16)
0.94 (0.76,
1.16)
High 141 118,689 118.8 0.88 (0.71,
1.10)
0.91 (0.72,
1.14)
0.90 (0.72,
1.13)
P for linear trend 0.259 0.393 0.352
Per 1-SD increase in grip
strength
1.00 (0.91,
1.10)
1.02 (0.92,
1.12)
1.01 (0.92,
1.12)
All models used age as the underlying time variable. Categories of aerobic fitness and grip strength were defined based on age and sex specific-
categories of the baseline distribution. Aerobic fitness and grip strength were both normalized by fat-free mass
Model 1: No adjustment
Model 2: Adjusted for sex, waist circumference, ethnicity (White, mixed, Asian/Asian British, Black/Black British, other), smoking status (never,
previous, current), employment (unemployed, employed), Townsend Deprivation Index, alcohol consumption (never, previous, currently
\ 3 times/week, currently C 3 times/week), processed/red meat consumption (days/week), beta-blocker use, hypertension, and diabetes
Model 3: Model 2 plus grip strength in models where cardiorespiratory fitness was the exposure, or cardiorespiratory fitness in models where grip
strength was the exposure
CVD cardiovascular disease, SD standard deviation
The combination of cardiorespiratory fitness and muscle strength, and mortality risk 959
123
Discussion
This study is the first investigation evaluating the relative
risk of all-cause, CVD and cancer mortality for CRF,
muscle strength and the combination of both in a general
population of middle-aged and older men and women.
Higher CRF was associated with lower risks of all-cause,
CVD and cancer mortality, independent of GS and con-
founders. The highest GS was associated with lower risk of
all-cause mortality compared with the lowest. Individuals
with the highest level of CRF and GS had the lowest risks
of all-cause and CVD mortality among all comparisons,
compared with the lowest level of CRF and GS. The
inverse associations were more consistent for higher CRF
categories across GS levels than for higher GS categories
across CRF levels.
Similar analyses have been reported in prior investiga-
tions but in highly selected populations [15, 16]. Using data
from 1506 middle-aged hypertensive men, Artero et al.
[15] found that compared with men in the lower 50% CRF
group and the lowest muscle strength tertile, those in the
upper 50% CRF group and the highest muscle strength
tertile had a 51% lower risk of all-cause mortality. Simi-
larly, a study of 1.5 million adolescent boys found that the
lowest tertiles of CRF and muscle strength during adoles-
cence were associated with more than twice the risk of all-
cause (HR 2.01) and CVD (HR 2.63) mortality in later
adulthood, compared with the highest tertiles [16]. Our
study used data of men and women aged[ 40 years with
no critical medical conditions at baseline, and therefore
provides new insights into the beneficial combined impacts
of CRF and muscle strength on mortality risk in the general
adult population.
The relatively stronger mortality associations with CRF
than with GS suggest that lower CRF is a more important
risk factor for mortality than lower muscle strength. A
potential explanation for this difference is that the degree
to which grip strength represents overall muscle strength
may be lesser than the degree to which submaximal bike
tests represent cardiorespiratory fitness. However, this
finding is in line with prior research that found no
Fig. 2 Joint associations of aerobic fitness and grip strength with all-
cause mortality. The model was adjusted for sex, waist circumference,
ethnicity (White, mixed, Asian/Asian British, Black/Black British,
others), smoking status (never, previous, current), employment
(unemployed, employed), Townsend Deprivation Index, alcohol
consumption (never, previous, currently \ 3 times/week, currently
C 3 times/week), processed/red meat consumption (days/week), beta-
blocker use, hypertension, and diabetes. Age- and sex-specific
categories of aerobic fitness and grip strength were used. Aerobic
fitness and grip strength were both normalized by fat-free mass
960 Y. Kim et al.
123

significant [29] or inconsistent [30] associations of muscle
strength (e.g., GS, sit-ups and push-ups [29]; bench press,
leg press and sit-ups [30]) with mortality when CRF (e.g.,
predicted VO2max [29]; maximal-treadmill test [30]) was
adjusted for in the analyses. Nonetheless, other studies
using data of men concluded that muscle strength (e.g.,
bench press and leg press) was a strong predictor of mor-
tality independent of CRF (e.g., maximal treadmill test)
[31, 32]. In other studies, the combination of low CRF and
muscle strength was associated with increased risks of
developing stroke [33], type 2 diabetes [34], cardiovascular
events and arrhythmia [35], all of which are strong mor-
tality risk factors [36].
In addition to the evidence from observational studies,
numerous intervention studies have demonstrated the syn-
ergistic effects of combining resistance training and aero-
bic exercise on eliciting favorable changes in intermediate
health indicators. A recent 26-week randomized controlled
trial of dieting obese older adults [9] found that individuals
who received an intervention consisting of both aerobic
and resistance exercise (3 days/week; 75–90 min each)
plus a weight-management program showed relatively
larger improvements in functional status and body com-
position in comparison with individuals who, in conjunc-
tion with a weight-management program, carried out either
aerobic (3 days/week; 60 min each) or resistance exercise
alone (3 days/week; 60 min each). Moreover, in a 9-month
randomized-controlled trial of individuals with type 2
diabetes [10], hemoglobin A1c levels significantly
decreased in the intervention group who undertook a
combined program of resistance training (2 days/week) and
aerobic exercise (expending 10 kcal/kg/week) compared
with the control group. Notably, this effect was not
observed in the other intervention groups who received
either resistance training (3 days/week) or aerobic exercise
(expending 12 kcal/kg/week) [10]. Similarly, in an
8-month randomized controlled trial of 196 overweight
adults aged 18–70 years [11], a combined protocol of
resistance (3 days/week) and aerobic training (running 12
miles/week) resulted in significant improvements in insulin
Fig. 3 Joint associations of cardiorespiratory fitness and grip strength
with cardiovascular disease (CVD) mortality. The model was adjusted
for sex, waist circumference, ethnicity (White, mixed, Asian/Asian
British, Black/Black British, others), smoking status (never, previous,
current), employment (unemployed, employed), Townsend Depriva-
tion Index, alcohol consumption (never, previous, currently
\ 3 times/week, currently C 3 times/week), processed/red meat
consumption (days/week), beta-blocker use, hypertension, and dia-
betes. Age- and sex-specific categories of cardiorespiratory fitness
and grip strength were used. Cardiorespiratory fitness and grip
strength were both normalized by fat-free mass
The combination of cardiorespiratory fitness and muscle strength, and mortality risk 961
123

sensitivity, which was not achieved with either resistance
or aerobic training alone. While clinical trials are needed to
formally determine causality for the joint effects of CRF
and muscle strength on mortality risk, these would be
difficult to undertake in the general population; therefore,
for the foreseeable future, public health action has to be
informed by the combined evidence from exercise trials on
intermediate risk factors and prospective observational
epidemiological studies on clinical endpoints.
The current physical activity guidelines [17] recommend
that adults do both moderate-to-vigorous intensity aerobic
physical activity for 150 min/week and muscle-strength-
ening activities at least twice a week. Previous research
found that meeting the guidelines for muscle-strengthening
activities in addition to aerobic physical activity was
associated with further reductions in the risks of comor-
bidity [37] and mortality [38]. Nonetheless, fewer than
30% of UK [39] and US [40] adults meet both the aerobic
physical activity and muscle-strengthening guidelines.
Furthermore, the prevalence of meeting these guidelines
declines drastically with age [41]. Public health efforts
should, therefore, be focused on encouraging adults of all
ages to engage in both aerobic and resistance exercise to
reduce mortality risk through increased CRF and muscle
strength.
The following limitations should be considered when
interpreting the findings. First, the findings of this study
may not be generalizable to the whole UK population or
adults in other countries as no sampling strategies were
used in UK Biobank to select representative samples of
adults. Another potential selection bias may exist with the
sub-sample of individuals who performed bike tests.
However, the UK Biobank employed less rigorous pre-test
screening procedures compared with prior studies [15, 16],
and those individuals who performed bike tests had virtu-
ally identical demographic and biological characteristics
(e.g. sex ratio, GS, fat-free mass, resting pulse rate) to those
who did not perform bike tests. In addition, there is risk of
residual confounding due to the use of self-reported
information (e.g., behaviors and comorbidities). Moreover,
Fig. 4 Joint associations of cardiorespiratory fitness and grip strength
with cancer mortality. The model was adjusted for sex, waist
circumference, ethnicity (White, mixed, Asian/Asian British, Black/
Black British, others), smoking status (never, previous, current),
employment (unemployed, employed), Townsend Deprivation Index,
alcohol consumption (never, previous, currently \ 3 times/week,
currently C 3 times/week), processed/red meat consumption (days/
week), beta-blocker use, hypertension, and diabetes. Age- and sex-
specific categories of cardiorespiratory fitness and grip strength were
used. Cardiorespiratory fitness and grip strength were both normal-
ized by fat-free mass
962 Y. Kim et al.
123

the findings may not be applicable to individuals with
cancer, stroke or heart attack as these prevalent medical
conditions were excluded from the present analyses. Fur-
thermore, we may not have full follow-up information on
individuals who migrated to other countries after partici-
pation in baseline assessment. Another limitation is the
inability to draw firm conclusions about causal relation-
ships of CRF and GS with mortality due to the observa-
tional nature of this study.
Conclusions
Individuals with higher CRF showed lower risks of all-
cause, CVD and cancer mortality; those with higher GS
had lower all-cause mortality. All-cause and CVD mor-
tality risk was lowest in adults with both higher CRF and
higher. Improving both CRF and muscle strength, as
opposed to either of the two alone, may be the most
effective behavioral strategy to reduce all-cause and car-
diovascular mortality risk.
Acknowledgements This work was supported by the UK Medical
Research Council [MC_UU_12015/1 and MC_UU_12015/3], a PhD
studentship from MedImmune (to TW), and an Intermediate Basic
Science Research Fellowship of British Heart Foundation (FS/12/58/
29709 to KWi). The funders had no role in study design, data col-
lection and analysis, decision to publish, or preparation of the
manuscript. YK had full access to all of the data in the study and takes
responsibility for the integrity of the data and the accuracy of the data
analysis. This research has been conducted using the UK Biobank
Resource under Application Number 408. We also thank the Danish
National Health Examination Survey for sharing maximal power and
predictor data, used to individualise the UK Biobank exercise
protocols.
Compliance with ethical standards
Conflict of interest The authors declare that they have no conflict of
interest.
Ethical approval All procedures performed in the UK Biobank
involving human participants were in accordance with the ethical
standards of the institutional and/or national research committee.
Open Access This article is distributed under the terms of the Creative
Commons Attribution 4.0 International License (http://creative
commons.org/licenses/by/4.0/), which permits unrestricted use, dis-
tribution, and reproduction in any medium, provided you give
appropriate credit to the original author(s) and the source, provide a
link to the Creative Commons license, and indicate if changes were
made.
References
1. Kodama S, Saito K, Tanaka S, et al. Cardiorespiratory fitness as a
quantitative predictor of all-cause mortality and cardiovascular
events in healthy men and women a meta-analysis. JAMA J Am
Med Assoc. 2009;301(19):2024–35.
2. Barry VW, Baruth M, Beets MW, Durstine JL, Liu JH, Blair SN.
Fitness vs. Fatness on all-cause mortality: a meta-analysis. Prog
Cardiovasc Dis. 2014;56(4):382–90. https://doi.org/10.1016/j.
pcad.2013.09.002.
3. Church TS, Kampert JB, Gibbons LW, Barlow CE, Blair SN.
Usefulness of cardiorespiratory fitness as a predictor of all-cause
and cardiovascular disease mortality in men with systemic
hypertension. Am J Cardiol. 2001;88(6):651–6.
4. Evenson KR, Stevens J, Thomas R, Cai J. Effect of cardiores-
piratory fitness on mortality among hypertensive and normoten-
sive women and men. Epidemiology. 2004;15(5):565–72.
5. Church TS, LaMonte MJ, Barlow CE, Blair SN. Cardiorespira-
tory fitness and body mass index as predictors of cardiovascular
disease mortality among men with diabetes. Arch Intern Med.
2005;165(18):2114–20. https://doi.org/10.1001/archinte.165.18.
2114.
6. Cooper R, Kuh D, Hardy R, Mortality Review Group, FALCon
and HALCyon Study Teams. Objectively measured physical
capability levels and mortality: systematic review and meta-
analysis. BMJ. 2010;341:c4467. https://doi.org/10.1136/bmj.
c4467.
7. Leong DP, Teo KK, Rangarajan S, et al. Prognostic value of grip
strength: findings from the Prospective Urban Rural Epidemiol-
ogy (PURE) study. Lancet. 2015;386(9990):266–73. https://doi.
org/10.1016/S0140-6736(14)62000-6.
8. Sayer AA, Kirkwood TB. Grip strength and mortality: a bio-
marker of ageing? Lancet. 2015;386(9990):226–7. https://doi.org/
10.1016/S0140-6736(14)62349-7.
9. Villareal DT, Aguirre L, Gurney AB, et al. Aerobic or resistance
exercise, or both, in dieting obese older adults. N Engl J Med.
2017;376(20):1943–55. https://doi.org/10.1056/
NEJMoa1616338.
10. Church TS, Blair SN, Cocreham S, et al. Effects of aerobic and
resistance training on hemoglobin A1c levels in patients with
type 2 diabetes: a randomized controlled trial. JAMA.
2010;304(20):2253–62. https://doi.org/10.1001/jama.2010.1710.
11. AbouAssi H, Slentz CA, Mikus CR, et al. The effects of aerobic,
resistance, and combination training on insulin sensitivity and
secretion in overweight adults from STRRIDE AT/RT: a ran-
domized trial. J Appl Physiol. 2015;118(12):1474–82. https://doi.
org/10.1152/japplphysiol.00509.2014.
12. Ho SS, Dhaliwal SS, Hills AP, Pal S. The effect of 12 weeks of
aerobic, resistance or combination exercise training on cardio-
vascular risk factors in the overweight and obese in a randomized
trial. BMC Public Health. 2012;12:704. https://doi.org/10.1186/
1471-2458-12-704.
13. Cawthon PM, Marshall LM, Michael Y, et al. Frailty in older
men: prevalence, progression, and relationship with mortality.
J Am Geriatr Soc. 2007;55(8):1216–23. https://doi.org/10.1111/j.
1532-5415.2007.01259.x.
14. Cappuccio FP, D’Elia L, Strazzullo P, Miller MA. Sleep duration
and all-cause mortality: a systematic review and meta-analysis of
prospective studies. Sleep. 2010;33(5):585–92.
15. Artero EG, Lee DC, Ruiz JR, et al. A prospective study of
muscular strength and all-cause mortality in men with hyper-
tension. J Am Coll Cardiol. 2011;57(18):1831–7. https://doi.org/
10.1016/j.jacc.2010.12.025.
16. Crump C, Sundquist J, Winkleby MA, Sundquist K. Interactive
effects of aerobic fitness, strength, and obesity on mortality in
men. Am J Prev Med. 2016. https://doi.org/10.1016/j.amepre.
2016.10.002.
17. Global Recommendations on Physical Activity for Health. World
Health Organization. Geneva. 2010.
The combination of cardiorespiratory fitness and muscle strength, and mortality risk 963
123

18. Lauretani F, Russo CR, Bandinelli S, et al. Age-associated
changes in skeletal muscles and their effect on mobility: an
operational diagnosis of sarcopenia. J Appl Physiol.
2003;95(5):1851–60. https://doi.org/10.1152/japplphysiol.00246.
2003.
19. Bohannon RW. Hand-grip dynamometry provides a valid indi-
cation of upper extremity strength impairment in home care
patients. J Hand Therapy. 1998;11(4):258–60.
20. Rantanen T, Era P, Heikkinen E. Maximal isometric strength and
mobility among 75-year-old men and women. Age Ageing.
1994;23(2):132–7.
21. UK Biobank Coordinating Centre. UK Biobank: protocol for a
large-scale prospective epidemiological resource. Design.
2007;06:1–112.
22. UK Biobank: Cardio Assessment Version 1.0. 2011.
23. PhysioNet. Physio Toolkit. https://www.physionet.org/physio
tools/wag/sqrs-1.htm. Accessed 1st Dec 2015.
24. Engelse WAH, Zeelenberg C. A single scan algorithm for QRS-
detection and feature extraction. Comput Cardiol. 1979;6:37–42.
25. PhysioNet-ihr. Physio Toolkit. https://physionet.org/physiotools/
wag/ihr-1.htm. Accessed 1st Dec 2015.
26. Tanaka H, Monahan KD, Seals DR. Age-predicted maximal heart
rate revisited. J Am Coll Cardiol. 2001;37(1):153–6.
27. Roberts HC, Denison HJ, Martin HJ, et al. A review of the
measurement of grip strength in clinical and epidemiological
studies: towards a standardised approach. Age Ageing.
2011;40(4):423–9. https://doi.org/10.1093/ageing/afr051.
28. Evans JD. Straightforward statistics for the behavioral sciences.
Pacific Grove: Brooks/Cole Publishing Co.; 1996.
29. Katzmarzyk PT, Craig CL. Musculoskeletal fitness and risk of
mortality. Med Sci Sports Exerc. 2002;34(5):740–4.
30. FitzGerald SJ, Barlow CE, Kampert JB, Morrow JR Jr, Jackson
AW, Blair SN. Muscular fitness and all-cause mortality:
prospective observations. J Phys Activity Health. 2004;1:7–18.
31. Ruiz JR, Sui X, Lobelo F, et al. Association between muscular
strength and mortality in men: prospective cohort study. BMJ.
2008;337:a439. https://doi.org/10.1136/bmj.a439.
32. Ruiz JR, Sui X, Lobelo F, et al. Muscular strength and adiposity
as predictors of adulthood cancer mortality in men. Cancer Epi-
demiol Biomark Prev. 2009;18(5):1468–76. https://doi.org/10.
1158/1055-9965.EPI-08-1075.
33. Aberg ND, Kuhn HG, Nyberg J, et al. Influence of cardiovascular
fitness and muscle strength in early adulthood on long-term risk
of stroke in swedish men. Stroke. 2015;46(7):1769–76. https://
doi.org/10.1161/STROKEAHA.115.009008.
34. Crump C, Sundquist J, Winkleby MA, Sieh W, Sundquist K.
Physical fitness among Swedish military conscripts and long-term
risk for type 2 diabetes mellitus a cohort study. Ann Intern Med.
2016;164(9):577–84. https://doi.org/10.7326/M15-2002.
35. Andersen K, Rasmussen F, Held C, Neovius M, Tynelius P,
Sundstrom J. Exercise capacity and muscle strength and risk of
vascular disease and arrhythmia in 1.1 million young Swedish
men: cohort study. BMJ. 2015;351:h4543. https://doi.org/10.
1136/bmj.h4543.
36. Lozano R, Naghavi M, Foreman K, et al. Global and regional
mortality from 235 causes of death for 20 age groups in 1990 and
2010: a systematic analysis for the Global Burden of Disease
Study 2010. Lancet. 2012;380(9859):2095–128. https://doi.org/
10.1016/S0140-6736(12)61728-0.
37. Dankel SJ, Loenneke JP, Loprinzi PD. Combined associations of
muscle-strengthening activities and accelerometer-assessed
physical activity on multimorbidity: findings from NHANES. Am
J Health Promot AJHP. 2016. https://doi.org/10.4278/ajhp.
150520-QUAN-894.
38. Zhao GX, Li CY, Ford ES, et al. Leisure-time aerobic physical
activity, muscle-strengthening activity and mortality risks among
US adults: the NHANES linked mortality study. Br J Sports Med.
2014;48(3):244–9. https://doi.org/10.1136/bjsports-2013-092731.
39. Bromley C. Chapter 6: Physical activity. In: Rutherford L,
Hinchliffe S, Sharp C, editors. The Scottish Health Survey 2012
volume 1: main report. Edinburgh: The Scottish Government;
2013.
40. Blackwell DL, Clarke TC. Occupational differences among
employed adults who met 2008 federal guidelines for both aer-
obic and muscle-strengthening activities: United States,
2008–2014. National health statistics reports. 2016;94:1–12.
41. Percentage of Adults Aged C 65 Years Meeting 2008 Federal
Guidelines for Leisure-Time Aerobic section sign and Muscle-
Strengthening paragraph sign Activities, by Age and Type of
Activity—United States, 2000–2002 and 2013–2015. MMWR.
Morbidity and mortality weekly report. 2016;65(37):1019.
https://doi.org/10.15585/mmwr.mm6537a9.
964 Y. Kim et al.
123


![Cardiorespiratory fitness, muscular strength and risk of ... · muscular fitness [9], which is a construct encompassing muscu-lar strength, power and endurance [ 10]. Cardiorespiratory](https://img.pdfslide.us/doc/110x75/5dd12452d6be591ccb646c34/cardiorespiratory-fitness-muscular-strength-and-risk-of-muscular-fitness-9.jpg)