Embed Size (px)
Citation preview

arX
iv:a
stro
-ph/
0505
603v
1 3
0 M
ay 2
005
The composition and size distribution of the dust inthe coma of comet Hale-Bopp
M. Min, a J. W. Hovenier,a A. de Koter,a L. B. F. M. Waters,a,b
C. Dominika
aAstronomical institute Anton Pannekoek, University of Amsterdam, Kruislaan 403, 1098SJ Amsterdam, The Netherlands
bInstituut voor Sterrenkunde, Katholieke Universiteit Leuven, Celestijnenlaan 200B, 3001Heverlee, Belgium
Abstract
We discuss the composition and size distribution of the dustin the coma of comet Hale-Bopp. We do this using a model fit for the infrared emission measured by the infrared spaceobservatory (ISO) and the measured degree of linear polarization of scattered light at var-ious phase angles and wavelengths. The effects of particle shape on the modeled opticalproperties of the dust grains are taken into account. Both the short wavelength (7-44µm)and the long wavelength (44-120µm) infrared spectrum are fitted using the same dust pa-rameters, as well as the degree of linear polarization at 12 different wavelengths in theoptical to near infrared domains. We constrain our fit by forcing the abundances of themajor rock forming chemical elements to be equal to those observed in meteorites. Theinfrared spectrum at long wavelengths reveals that large grains are needed in order to fit thespectral slope. The size and shape distribution we employ allows us to estimate the sizes ofthe crystalline silicates. The ratios of the strength of various forsterite features show that thecrystalline silicate grains in Hale-Bopp must be submicronsized. On the basis of our analy-sis the presence of large crystalline silicate grains in thecoma can be excluded. Because ofthis lack of large crystalline grains combined with the factthat we do need large amorphousgrains to fit the emission spectrum at long wavelengths, we need only approximately 4%of crystalline silicates by mass (forsterite and enstatite) to reproduce the observed spectralfeatures. After correcting for possible hidden crystalline material included in large amor-phous grains, our best estimate of the total mass fraction ofcrystalline material is∼7.5%,which is significantly lower than deduced in previous studies in which the typical derivedcrystallinity is∼20− 30%. The implications of this low abundance of crystalline materialon the possible origin and evolution of the comet are discussed. We conclude that the crys-tallinity we observe in Hale-Bopp is consistent with the production of crystalline silicatesin the inner solar system by thermal annealing and subsequent radial mixing to the cometforming region (∼30 AU).
Key words: comets, composition, comets, Hale-Bopp, infrared observations, polarimetry
Preprint submitted to Elsevier Science 2 July 2019

1 Introduction
Comet Hale-Bopp is undoubtedly the best studied long periodcomet in the solarsystem. The unusual brightness of this comet allowed for itsdiscovery when itwas still at 7 AU distance from the Earth, and a long term monitoring of the dustactivity after perihelion up to almost 13 AU (Weiler et al., 2003). The infrared spec-trum taken by the Infrared Space Observatory (ISO) provideda unique opportunityto study the composition of cometary dust (Crovisier et al.,1997; Lellouch et al.,1998). The strong resonances visible in this spectrum were attributed to the pres-ence of crystalline silicates.
The relatively sharp 9.8µm feature in the ISO spectrum together with observationsof an extremely high degree of linear polarization lead to the conclusion that thedust in the coma of Hale-Bopp has an overabundance of submicron sized grains(see e.g. Hanner et al., 1999; Mason et al., 2001, and references therein).
The composition of the dust in Hale-Bopp has been modeled frequently in the liter-ature applying various approaches (see e.g Lellouch et al.,1998; Li and Greenberg,1998; Brucato et al., 1999; Wooden et al., 1999; Harker et al., 2002; Bouwman et al.,2003; Moreno et al., 2003). The interpretation of the results obtained from theobservations lead to discussions in the literature on the origin and evolution ofcometary dust (for a review see Wooden, 2002). Cometary dustis believed to be themost primitive material present in the solar system. The high crystallinity found bymost studies of the infrared emission spectrum presents a problem for this scenario.Since the dust that entered the proto-solar nebula from the interstellar medium isalmost completely amorphous (Li and Draine, 2001; Kemper etal., 2004), the crys-talline silicates in Hale-Bopp have to be products of processing in the early solarsystem. Crystalline silicates can only be produced in high temperature environ-ments (& 1000 K), so close to the Sun, while comets form in regions where thetemperatures are low enough for water ice to exist (. 160 K). Thus, the crystallinesilicates have to be transported outwards to the regions where the comets form,or the dust temperature must be locally increased due to for example lightningor shock annealing (Harker and Desch, 2002; Pilipp et al., 1998; Desch and Cuzzi,2000).
It is clear that in order to constrain the models explaining the crystalline silicatesin cometary material, accurate knowledge of the abundancesof the various com-ponents in the dust is required. However, the large differences in the derived crys-talline silicate abundances published in the literature sofar make progress in thisarea difficult. All studies agree that the abundance of sub-micron sized crystallinesilicates is very high (although again with considerable spread), but the questionremains open what the crystallinity of the larger grain population is, where most of
Email address:[email protected] (M. Min,).
2

the mass resides. This is because modeling the optical properties of large, irregu-larly shaped particles composed of material with high refractive index is difficult.
In this study, we combine for the first time both the availableobservations of thethermal emission as obtained by ISO (Crovisier et al., 1997;Lellouch et al., 1998)and the degree of linear polarization taken from Ganesh et al. (1998); Jockers et al.(1999); Hasegawa et al. (1999); Manset and Bastien (2000) and Jones and Gehrz(2000), with a single dust model. In contrast with previous studies we calculatethe optical properties of the dust grains using a method where we can take intoaccount both size and shape effects. With this method, we obtaininformation onthe composition and mass of the large grain component. Also we constrain thechemical abundances as known from studies of meteorites. Thus, we are able tobetter constrain the dust composition and size distribution in the model than pre-vious studies. As we will show, the size distributions of crystalline and amorphoussilicates are very different, and we are able to rule out the presence of substan-tial amounts of large (1-10µm) crystalline silicates. This results in a much loweroverall crystallinity than most other studies found.
In section 2 we explain the fitting procedure and the dust model we employ. Theresults of the best fit model are presented in section 3. The implications of theseresults are discussed in section 4.
2 Method
In this section we will outline the method used to interpret the observations of thethermal infrared emission and the degree of linear polarization of comet Hale-Boppin terms of the properties of the particles in the coma. The method we use has a fewimportant characteristics:
• Both size and shape effects of the dust grains are taken into account when cal-culating the optical properties, i.e. the absorption (emission) cross sections andthe degree of linear polarization of scattered light. In contrast with previous stud-ies, our shape distribution enables us to use the same particle shapes for all dustcomponents and grain sizes. This implies that we can, for thefirst time, includethe effects of grain size on the optical properties of crystalline silicate grains.
• The parameters of the size distributions and the abundancesof the various com-ponents are determined using an ’objective’ least squares fitting routine.
• We require the best fit model to fulfill the constraint that thedust in comet Hale-Bopp has the same abundances of the chemical elements of the major solid statematerials as observed in interplanetary dust particles andmeteorites.
3

2.1 Size and shape of the dust grains
The optical properties at a particular wavelength, i.e. theabsorption and scatteringcross sections as well as the scattering matrix, of a dust grain are determined by itssize, shape, orientation, structure and chemical composition. Throughout this paperthe size of a dust grain is defined as the radius of a volume equivalent sphere,r. Weuse for the size distribution a powerlaw given by
n(r) =
C · r β, rmin ≤ r ≤ rmax,
0, elsewhere.(1)
Heren(r)dr is the number of dust particles of an ensemble with sizes betweenr andr + dr; rmin andrmax are the minimum and maximum grain size, respectively, in thesize distribution;β is the index of the powerlaw, andC is a normalization constant.We chooseC so that
rmax∫
rmin
43πρr3n(r)dr = 1, (2)
whereρ is the density of the material considered. Hence,n(r)dr is the number ofdust particles with sizes betweenr andr + dr per unit mass. The effective radius,reff, and the effective variance,veff, are often used to characterize a size distribution.They are defined by (Mishchenko et al., 2002)
reff =1〈G〉
rmax∫
rmin
πr3n(r)dr, (3)
veff =1
〈G〉 r2eff
rmax∫
rmin
πr2(r − reff)2n(r)dr, (4)
where
〈G〉 =
rmax∫
rmin
πr2n(r)dr, (5)
is the average geometrical shadow of the dust grains. Thereff is simply the surface-area weighted mean whereasveff is the surface-area weighted variance of the distri-bution.
4

The shape of the dust grains is an important parameter determining their opti-cal properties. Pictures of interplanetary dust particles(IDPs) show very complexshapes and structures (Warren et al., 1994). To model these complex shapes in de-tail requires much computing time, which limits the number of other particle pa-rameters that can be studied. In Min et al. (2003) it is shown that when the absorp-tion cross sections of small particles are considered theirshapes can be roughlydivided into two categories. The first category contains homogeneous spherical par-ticles, whereas the second category contains all other particle shapes. Effects of thespecific particle shape distribution on the absorption properties in the second cate-gory are present, but small compared to the differences with homogeneous spheres.This implies that the exact shape of the particles is, in a first approximation, notimportant as long as we brake the homogeneity or perfect spherical symmetry of ahomogeneous sphere. This approach is an example of the statistical approach (seee.g. Kahnert et al., 2002; Kahnert, 2004). In this approach the absorption proper-ties of an ensemble of irregular particles are simulated by the average absorptionproperties of an ensemble of particles with simple shapes.
In this paper we use a distribution of hollow spherical particles (DHS). In this distri-bution a uniform average is taken over the fraction,f , of the total volume occupiedby the central vacuum inclusion in the range 0≤ f < fmax, where fmax ≤ 1. Allparticles in this distribution have the same material volume, so that the particleswith higher values off have larger outer radii. For details regarding this distribu-tion we refer to Min et al. (2003). In order to reproduce the wavelength positionsof the spectral features of crystalline silicate grains, wehave to choosefmax = 1(Min et al., 2003). Numerical computations for particles with f = 1 are not pos-sible since these would have an infinitely large outer radius. For particles muchsmaller than the wavelength, integrating the optical properties up to f = 1 canbe done analytically (Min et al., 2003). For larger particles numerical computa-tions are necessary. We then choosefmax large enough to reach convergence to thevalues for fmax = 1. For most cases we considered, it suffices to integrate up tof = 0.98. The optical properties of hollow spherical particles are calculated us-ing a simple extension of Mie theory (Aden and Kerker, 1951).The calculationswere done using the layered sphere code for which the basic ideas are explained inToon and Ackerman (1981). We would like to stress that we do not allege that hol-low spheres are a good approximation for the real shape of cometary dust grains.Rather, the properties of the particles in the DHS determining the absorption andpolarization behavior of the entire ensemble represent in astatistical way those ofan ensemble of realistically shaped dust grains.
One of the advantages of the DHS is that the scattering and absorption propertiescan be calculated easily for almost all grain sizes and wavelengths. This meansthat we can calculate the absorption cross sections as well as the degree of linearpolarization for incident unpolarized light as a function of scattering angle, whichenables us to fit simultaneously the observed infrared emission spectrum and thedegree of linear polarization using the same dust parameters. In Min et al. (2003)
5

it is shown that good agreement between calculations for thedistribution of hollowspheres and measurements of the mass absorption coefficients of small forsteritegrains as a function of wavelength can be obtained. Also, as is shown by Min et al.(2005), the degree of linear polarization as calculated using the DHS is in goodagreement with laboratory measurements of irregularly shaped quartz particles.
A cometary dust grain consists most likely of a mixture of various componentssuch as, for example, olivine, carbon and ironsulfide. In using the model describedabove we assume that the optical properties of such a mixed particle can be rep-resented by the average properties of homogeneous particles for each of the sepa-rate components. The validity of this approach for core-mantle grains is studied byLi et al. (2002) and shown to be dependent on the shape of the dust grains. In gen-eral, whether it is a valid assumption depends on the compactness of the compositeparticle. When the grains are very ’fluffy’ aggregates composed of homogeneousmonomers, the grain components will approximately interact with the incominglight as if they were separate. However, in a more compact structure, the effects ofinteraction between the separate components can become visible.
Throughout the paper we will first average over particle shape (f ) which will bedenoted by〈..〉. The averaging over particle shape and size will be denoted by 〈〈..〉〉.
2.2 Thermal emission
To compute the radiation emitted by an ensemble of monodisperse dust grains inrandom orientation as a function of wavelength we need two ingredients,i) theorientation averaged absorption cross section as a function of wavelength, andii)the temperature of the dust grains. When both are known we cancalculate theobserved thermal radiation of a dust grain averaged over allorientations as follows
F (λ) =Cabs(λ)Bλ(T)
D2. (6)
HereF (λ) is the flux density at distanceD, λ is the wavelength of radiation,T isthe temperature of the dust grain,Bλ(T) is the Planck function, andCabs(λ) is theorientation averaged absorption cross section of the dust grains at wavelengthλ.The thermal radiation of grains with the temperatures we consider is mainly emittedin the infrared part of the spectrum. At these wavelengths the effect of scattering ofsolar radiation on the total observed flux is negligible.
The temperature of the dust grains is calculated by assumingthermal equilibrium,i.e. the energy absorbed is equal to the energy emitted. Notethat dust grains withequal sizer and composition but different shapes and/or orientations can have dif-ferent equilibrium temperatures. However, we assume that all dust grains with the
6

same volume and composition have the same temperature determined by the shapeand orientation averaged absorption properties (as is usually done).
The coma of Hale-Bopp is optically thin. Therefore, we only need to consider directillumination of the coma grains by the Sun and we may ignore the diffuse radiationfield caused by, e.g., scattering of solar light by the coma material. We assume theSun to radiate like a black body with a temperature ofT = 5777 K.
Since the absorption cross section, and, therefore, the temperature, depends on thesize and chemical composition of the particles we determinethe temperature foreach different dust particle size and material separately. Using thesize distributiongiven by Eq. (1) the flux per unit mass from dust componentj is given by
〈〈F (λ)〉〉 j =1
D2
rmax, j∫
rmin, j
n j(r)⟨
Cabs, j(λ, r)⟩
Bλ(T j(r)) dr. (7)
In this equationn j(r) is the size distribution of componentj with minimum andmaximum radiirmin, j andrmax, j;
⟨
Cabs, j(λ, r)⟩
is the orientation and shape averagedabsorption cross section of an ensemble of dust grains of material j with size r,andT j(r) is the temperature of the dust grains in this ensemble. Since the coma ofcomet Hale-Bopp is optically thin, the total flux averaged over particle size, shape,orientation and composition is simply the sum over the various components
Fmodel(λ) =∑
j
M j 〈〈F (λ)〉〉 j , (8)
whereM j is the total mass of dust componentj.
2.3 Degree of linear polarization of scattered light
In the visible part of the spectrum the radiation from the cometary halo is dominatedby sunlight scattered once by dust grains. The intensity andpolarization of thescattered light depend on the angle of scattering and the wavelength. For a comet itis possible to obtain measurements of the degree of linear polarization for variousscattering angles by observing the comet at various momentsduring its orbit aroundthe Sun. All information on the angular dependence of the scattering behavior ofan optically thin ensemble of dust grains is contained in its4× 4 scattering matrix.When the size and shape distributions and the abundances of all dust species areknown, we can calculate the average 4× 4 scattering matrix of the ensemble ifenough data of the refractive index is available. From this matrix we can obtain the
7

degree of linear polarization for incident unpolarized light of dust componentj
〈〈P(α)〉〉 j = −〈〈F21(α)〉〉 j〈〈F11(α)〉〉 j
, (9)
whereα is the phase angle and〈〈Fnk〉〉 j is then, kth element of the scattering matrixaveraged over size and shape of the dust grains (for details see van de Hulst, 1957).It should be noted that for calculations and measurements presented in the literatureoften the scattering angle,θ, is used instead of the phase angle,α. For comets it ismore convenient to use the phase angle. Since multiple scattering can be neglectedfor comets we haveα = 180◦ − θ.
In order to calculate the degree of linear polarization of anensemble of particles notonly averaged over particle size and shape distributions but also over dust materials,we have to average the matrix elements〈〈Fnk〉〉 j. Thus the average polarization isgiven by
Pmodel(α) = −
∑
j M j 〈〈F21(α)〉〉 j∑
j M j 〈〈F11(α)〉〉 j. (10)
2.4 Least squares fitting procedure
To make a fit to the observations of Hale-Bopp we need to fine-tune the free pa-rameters in the model in such a way that we minimize the differences between theresults of the model computations and the observations in a well defined way. Themodel we constructed has 4Nd free parameters, whereNd is the number of dustspecies we include in the fitting procedure. By choosing the index of the powerlaw,β, the same for all dust species this reduces to 3Nd + 1 free parameters, namely(
{rmin, j, rmax, j,M j, j = 1..Nd}, β)
. The error on the infrared emission spectrum is de-fined as
χ2spec=
Nλ∑
i=1
∣
∣
∣
∣
∣
Fmodel(λi) − Fobs(λi)σF (λi)
∣
∣
∣
∣
∣
2
. (11)
In this equationλi (i = 1..Nλ) is a chosen wavelength grid;Fobs(λi) is the obser-vational value of the flux at wavelengthλi, andσF (λi) is the error of the observedflux at wavelengthλi. In order to estimateσF (λi) we assume that the error in thespectral observations is proportional to the square root ofthe observed flux. Theposition of the minimum value ofχ2
spec is independent of the absolute value of theerror. Note that, since we do not have the values of the absolute errors of the spectralmeasurements, theχ2
spec is not equal to the reducedχ2specand cannot be interpreted
as the statistical goodness of fit.
8

The error of the degree of linear polarization is defined as
χ2pol =
N′λ∑
j
Nα∑
i
∣
∣
∣
∣
∣
∣
Pobs(αi , λ j) − Pmodel(αi , λ j)
σP(αi , λ j)
∣
∣
∣
∣
∣
∣
2
. (12)
In this equationPobs(αi , λ j) is the degree of linear polarization observed at phaseangleαi (i = 1..Nα) and wavelengthλ j ( j = 1..N′
λ), whileσP(αi , λ j) is the error in
the observed polarization at phase angleαi and wavelengthλ j. Note that the numberof phase angles at which observations are available may varywith wavelength.
The most straightforward way to define the totalχ2 is to take the sum ofχ2specand
χ2pol. However, since we have many more measurements of the infrared flux than we
have observations of the degree of linear polarization and we are unable to computethe reducedχ2
spec, this would lead to a stronger weight of the spectral measurementsthan the polarization observations. Therefore, we chose tominimize
χ2 = χ2spec· χ
2pol. (13)
The minimization ofχ2 as defined by Eq. (13) is done using a combination of twomethods. Since the total spectrum is a linear combination ofthe separate spectrafor the different components (see Eq. 8), we are able to separate the fitting probleminto a non-linear and a linear part. The non-linear part consists of minimizing forall rmin, j, rmax, j andβ, and the linear part does the minimization for allM j.
For the non-linear part of the minimization we use a genetic optimization algorithmcalled (Charbonneau, 1995). This algorithm tries to find a global maximumof an arbitrary function in a large parameter space by using concepts from evolutiontheory. Every set of parameters
(
{rmin, j , rmax, j, j = 1..Nd}, β)
is called an individual,the parameters are the ’genes’. The procedure starts with a randomly initializedpopulation ofNpop individuals and calculates theχ2 for each individual. The indi-viduals with the highest values of 1/χ2 (lowest values ofχ2) are then given the bestchance to ’reproduce’ into the next generation of individuals. This reproduction isdone by mixing the genes of two individuals into a new individual. When this pro-cedure is repeated through several generations, the individuals with low values of1/χ2 will die out and only individuals with high values of 1/χ2 will survive. In theend (afterNgen generations) the best individual, which represents the best fit pa-rameters, will survive. To ensure convergence also mutations – random variationson the parameters – are included in the algorithm. An extensive description canbe found in Charbonneau (1995). Although the algorithm is not very fast – manymodels need to be calculated – it is very robust in the sense that it will (almost)always find the global maximum, whereas other optimization codes frequently endup with a local maximum.
9

The ’fittest’individual represents
the best fit
A firstgenerationindividual
A firstgenerationindividual
A secondgenerationindividual
A secondgenerationindividual
A finalgenerationindividual
A finalgenerationindividual
The ’fitness’ of this individual1/χ2
The ’genes’ of this indivual(
{rmin, j , rmax, j, j = 1..N}, β)
A first generationindividual
χ2 = χ2spec· χ
2pol
{V j , j = 1,N} are calculated by minimizingχ2
specusing a linear least square fittingprocedure
Using the(
{rmin, j, rmax, j , j = 1..N}, β)
and the obtained values for{V j , j = 1,N},χ2
pol is computed
Given the set of parameters(
{rmin, j , rmax, j, j = 1..N}, β)
Genetic algorithm
EvolveNgen timesThe chance that an individual ’reproduces’ itselfinto a next generation is proportional to its fitness
Final generation
Second generation(evolved from the first generation)
Npop individuals
Npop individuals
First generation(randomly initialized)
Npop individuals
Fig. 1. A schematic representation of the fitting procedure.
For every individual in the genetic algorithm we determine the best values for theM j by minimizing theχ2
spec using a linear least squares fitting procedure. Linearleast squares fitting amounts to solving an overdetermined matrix equation in aleast squares sense. To ensure that allM j are positive we need a robust linear leastsquares fitting procedure with extra linear equality and inequality constraints. Weuse the subroutine from the library1 . The inequality constraints areused to ensure thatM j > 0. The equality constraints are used to constrain the chem-ical abundances as will be explained in section 2.6. Using the M j thus derived, wecalculateχ2
pol andχ2. Although in this way we might miss the absolute minimum,we can use this approach since the infrared spectrum is more sensitive to the exactdust composition than the degree of linear polarization is,which is more sensitiveto the size distribution.
In order to estimate the errors on the derived abundances of the dust species weconsider all individuals from all generations with a value of χ2 smaller than 1.1times the minimum value ofχ2. The value 1.1 was chosen such that all fits withinthis range are still in reasonable agreement with the observations.
The entire fit procedure is schematically outlined in Fig. 1.
1 The library is publicly available for download at: http://www.netlib.org/slatec/
10

2.5 Dust components
In this section we will discuss the dust components we chose for our model com-putations. Based on previous studies and on the compositionof IDPs we make thefollowing selection of components.
• Amorphous Carbon (C). We assume that most of the Carbon atoms that are inthe solid state phase will be present as amorphous carbon. The emission spec-trum of amorphous carbon gives a smooth continuum contribution without clearspectral structure. From thein situmeasurements by the Vega spacecraft when itencountered the coma of comet Halley, we know that approximately half of thetotal available C is present in the solid state phase (Geiss,1987). Carbon prob-ably acts as a matrix in which the other materials are embedded. The refractiveindex as a function of wavelength is taken from Preibisch et al. (1993).
• Amorphous Olivine (Mg2xFe2−2xSiO4). Amorphous olivine is one of the mostabundant dust species in circumstellar and interstellar material (see e.g. Molster et al.,1999; Bouwman et al., 2001; Li and Draine, 2001; Forrest et al., 2004; Kemper et al.,2004). The silicate dust in the diffuse interstellar medium is dominated by amor-phous olivine (Kemper et al., 2004). The emission by small amorphous olivinegrains shows broad spectral features at 10 and 20µm. Both are detected in thespectrum of Hale-Bopp. T he data for the refractive indices are taken from Dorschner et al.(1995).
• Amorphous Pyroxene (MgxFe1−xSiO3). Amorphous pyroxene is spectroscopi-cally hard to distinguish from amorphous olivine. Pyroxeneis often found inIDPs. The emission by small amorphous pyroxene grains showsa spectral struc-ture which is similar to that of amorphous olivine grains. However, the maximumof the 10µm feature is shifted towards slightly shorter wavelengths and the shapeof the 20µm feature is slightly different. The refractive indices for amorphouspyroxene are taken from Dorschner et al. (1995).
• Crystalline Forsterite (Mg2SiO4). Crystalline forsterite is the magnesium richend member of the crystalline olivine family. Experiments indicate that whenamorphous olivine is annealed under certain conditions, the iron is removedfrom the lattice structure and crystalline forsterite is formed. The most impor-tant resonances in the emission spectrum of small crystalline forsterite grains arelocated at wavelengths 11.3, 19.5, 23.6 and 33.6µm. These features are observedin the spectra of, for example, AGB stars and protoplanetarydisks (see e.g.Waters et al., 1996; Bouwman et al., 2001) and are clearly visible in the spec-trum of Hale-Bopp (Crovisier et al., 1997). For the refractive indices of forsteritewe use the data of Servoin and Piriou (1973).
• Crystalline Enstatite (MgSiO3). Crystalline enstatite is the magnesium rich endmember of the crystalline pyroxene family. Under the right conditions, enstatitecan form from a reaction between forsterite and silica. Also, from IDPs thereare indications that some enstatite grains formed directlyfrom gas phase con-densation (Bradley et al., 1983). The spectrum of small enstatite grains shows
11

prominent features at 9.3, 10.5, 19.5, 28 and 44.5µm. Although we have no di-rect evidence for the presence of most of these features, we include enstatite inthe fitting procedure because enstatite features have been reported in the groundbased spectrum of Hale-Bopp when it was at 1.2 AU (Wooden et al., 1999). Thedata for the refractive indices are taken from Jager et al. (1998).
• Amorphous Silica (SiO2). Laboratory measurements show that when amorphoussilicates are annealed to form crystalline silicates, a certain amount of silica isalso produced (Fabian et al., 2000). The emission spectrum of small amorphoussilica grains shows features at 9, 12.5 and 21µm. We take the refractive indicesas a function of wavelength measured by Spitzer and Kleinman(1960).
•Metallic Iron (Fe). When amorphous silicates are annealed to form magnesiumrich crystalline silicates, the iron is removed from the lattice. The spectral sig-nature of metallic iron grains is very smooth but slightly different than that ofamorphous carbon. Although it is not crucial in obtaining a reasonable fit, weinclude the possibility of metallic iron grains in the fitting procedure for com-pleteness. The refractive indices of metallic iron are taken from Henning et al.(1996).
• Iron Sulfide (FeS). In IDPs all available sulfur is present as iron sulfide. Thespectral structure of emission from iron sulfide grains shows a broad featurearound 23µm. The fact that this feature is not prominent in the spectrumof Hale-Bopp is probably due to the fact that the iron sulfide grains are relatively large,which reduces the spectral structure significantly. We use the refractive indicesmeasured by Begemann et al. (1994).
To decrease the number of free parameters, we have chosen equal size distributionsfor both amorphous silicate species (amorphous olivine andamorphous pyroxene)and equal size distributions for both crystalline silicatespecies (forsterite and en-statite). Furthermoreβ, the index of the powerlaw, is the same for all materials.
2.6 Chemical abundance constraints
The number of free parameters in the method as described above is very large.When we apply no extra constraints we encounter a large set ofsolutions that allhave a more or less equalχ2, but with totally different size distributions and ma-terial abundances. We also run the risk of obtaining a best fitsolution with veryimplausible values for the fit parameters. To avoid these problems we constrain thesolution by requiring that the major elements for solid state materials (Si, Mg, Feand S) are all in the solid phase and that their chemical abundances are the sameas those found in meteorites. Furthermore, we take the abundance of Carbon in thesolid phase to be half the solar abundance, consistent within situ measurementsof the dust in the coma of comet Halley (Geiss, 1987). This gives us four extraconstraints on the model. These extra constraints prove to be sufficient to obtainconsistent results with the fitting procedure.
12

Chemical element Meteorites Solar Constraints
C/Si - 9.33 4.67
Mg/Si 1.05 1.07 1.05
Fe/Si 0.87 0.89 0.87
S/Si 0.44 0.60 0.44Table 1Abundance constraints as applied in the fitting procedure. These values are taken fromGrevesse and Sauval (1998). For Carbon we take half of the solar abundance, consistentwith in situ measurements of dust in the coma of comet Halley (Geiss, 1987).
We constrain the abundances of C, Mg, Fe and S relative to Si. For the Carbonabundance we take half of the total solar abundance to be in the solid phase,the remaining Carbon is in the the gas phase. Magnesium, iron, sulfur and sili-con are assumed to be completely in the solid phase. The abundances we use aretaken from Grevesse and Sauval (1998) and are summarized in Table 1. Note thatthe sulfur abundance measured in meteorites is lower than the solar abundance.Thus by taking the constraints from meteorites for the solidstate particles we as-sume there is also sulfur in the gas phase. This is consistentwith observations(Bockelee-Morvan et al., 2000; Irvine et al., 2000). All abundance constraints areincorporated as linear equality constraints to the linear least squares fitting part ofthe minimization procedure.
To use the chemical abundance constraints we have to introduce an extra free pa-rameter,x, the magnesium fraction in the amorphous silicates. In section 3.2 wewill show that the bulk of the material consists of olivine, pyroxene, carbon and ironsulfide. Using this information we can already make a simple but reliable estimateof the value ofx by adopting these four species only and applying the abundanceconstraints discussed above (as this implies that we have four constraints and fourunknown parameters the material abundances are uniquely defined). The results ofthis simple calculation are summarized in Table 2, and givex = 0.7. Note thathere it is not possible to distinguish between amorphous andcrystalline material.The results from the fitting procedure will be slightly different due to a differentcomposition of crystalline and amorphous silicates and thefact that in the fittingprocedure we also added silica and metallic iron.
13

Dust component Chemical formula Abundance (Mass %)
Carbon C 24.6
Olivine Mg2xFe2−2xSiO4 33.4
Pyroxene MgxFe1−xSiO3 25.0
Iron Sulfide FeS 17.0Table 2Abundances as calculated from chemical abundances found inmeteorites. In order to satisfythe chemical abundances given in Table 1, we have to takex = 0.7.
3 Results
3.1 Observations
The spectroscopic observations we use are the infrared spectra obtained by theShort Wavelength Spectrometer (SWS) and the Long Wavelength Spectrometer(LWS) on board the Infrared Space Observatory (ISO) (Crovisier et al., 1997; Lellouch et al.,1998). These spectra were taken when the comet was at 2.9 AU distance from theSun and 3 AU distance from the Earth. The SWS and LWS spectra have a smalloverlapping wavelength range (42µm< λ < 45µm). Since the LWS has a largerbeam size, it catches emission from a larger part of the coma,resulting in a higherabsolute flux level. We assume that the properties of the dustcausing the emissiondoes not change as a function of distance from the core of the comet, so we cansimply scale the LWS spectrum to match the SWS spectrum in theoverlappingwavelength region. We have to note here that there are indications that the size dis-tribution or the compactness of the particles varies slightly as a function of positionin the coma (see e.g. Kolokolova et al., 2004, and referencestherein). When theparticles move away from the comet nucleus, the particles might fall apart resultingin more fluffy, or smaller structures. Therefore, one might argue that taking intoaccount the extended region covered by the LWS might bias ourresults towards aslightly higher fraction of small grains. However, we believe that this effect is onlyminor since these differences are largest when considering the region very closeto the coma, which is covered by both the SWS and the LWS (Kolokolova et al.,2004). For the fitting procedure we used the wavelength rangefrom 7 to 120µm.
For the observational data of the degree of linear polarization we used the com-bined measurements from various studies in the optical to near infrared part of thespectrum. The measurements were taken from Ganesh et al. (1998); Jockers et al.(1999); Hasegawa et al. (1999); Manset and Bastien (2000) and Jones and Gehrz(2000). The observations also provide the errorsσP. Combining the observationswe have polarization data at twelve different wavelengths for various phase angles.We note that in order to obtain observations at different phase angles, the comethas to be observed at different phases during its orbit around the Sun. Therefore, in
14
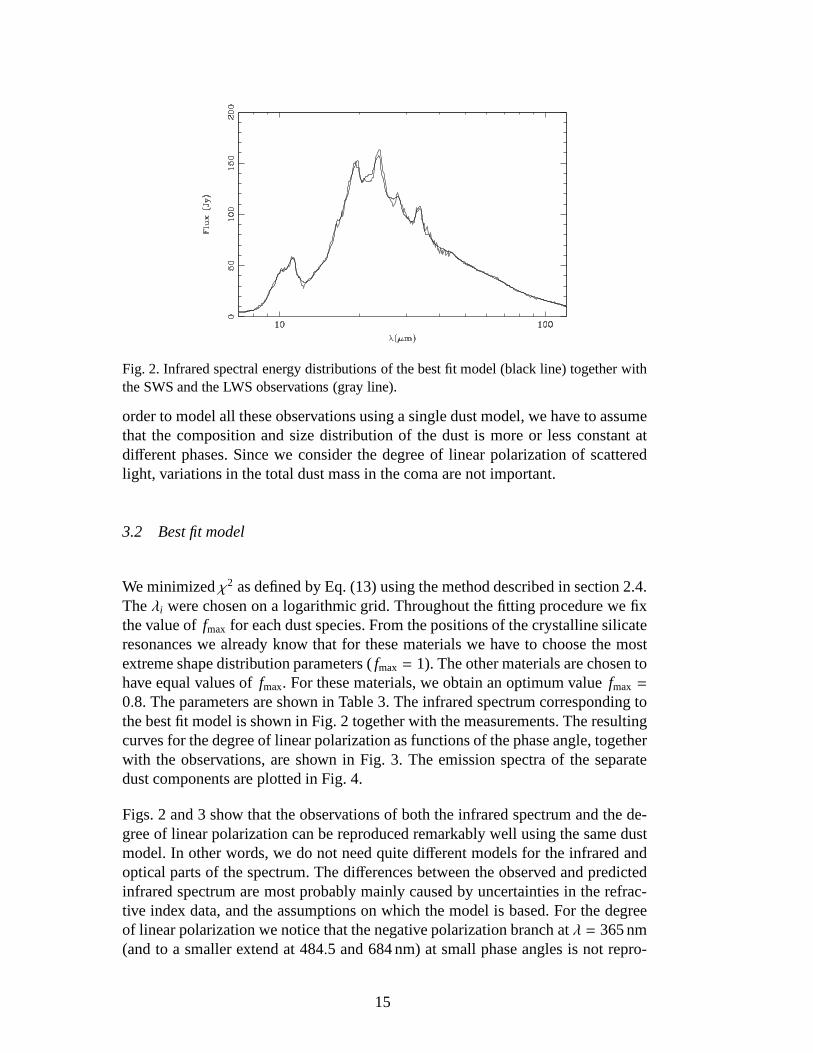
Fig. 2. Infrared spectral energy distributions of the best fit model (black line) together withthe SWS and the LWS observations (gray line).
order to model all these observations using a single dust model, we have to assumethat the composition and size distribution of the dust is more or less constant atdifferent phases. Since we consider the degree of linear polarization of scatteredlight, variations in the total dust mass in the coma are not important.
3.2 Best fit model
We minimizedχ2 as defined by Eq. (13) using the method described in section 2.4.Theλi were chosen on a logarithmic grid. Throughout the fitting procedure we fixthe value offmax for each dust species. From the positions of the crystallinesilicateresonances we already know that for these materials we have to choose the mostextreme shape distribution parameters (fmax = 1). The other materials are chosen tohave equal values offmax. For these materials, we obtain an optimum valuefmax =
0.8. The parameters are shown in Table 3. The infrared spectrumcorresponding tothe best fit model is shown in Fig. 2 together with the measurements. The resultingcurves for the degree of linear polarization as functions ofthe phase angle, togetherwith the observations, are shown in Fig. 3. The emission spectra of the separatedust components are plotted in Fig. 4.
Figs. 2 and 3 show that the observations of both the infrared spectrum and the de-gree of linear polarization can be reproduced remarkably well using the same dustmodel. In other words, we do not need quite different models for the infrared andoptical parts of the spectrum. The differences between the observed and predictedinfrared spectrum are most probably mainly caused by uncertainties in the refrac-tive index data, and the assumptions on which the model is based. For the degreeof linear polarization we notice that the negative polarization branch atλ = 365 nm(and to a smaller extend at 484.5 and 684 nm) at small phase angles is not repro-
15

Material Chemical Formula Bulk density fmax Volume (min / max) Mass rmin rmax β
(g/cm3) (%) (%) (µm) (µm)
Amorphous Carbon C 1.80 0.8 39.1 (39.0/ 39.3) 23.8 7.0 11.6 -3.48
Amorphous Olivine Mg2xFe2−2xSiO4 3.71 0.8 25.7 (22.9/ 32.7) 32.3 0.01 92.8 -3.48
Amorphous Pyroxene MgxFe1−xSiO3 3.20 0.8 18.3 ( 7.8 / 23.5) 19.8 0.01 92.8 -3.48
Amorphous Silica SiO2 2.60 0.8 2.2 ( 0.8 / 5.6 ) 1.9 6.5 7.5 -3.48
Crystalline Forsterite Mg2SiO4 3.33 1.0 2.7 ( 2.5 / 3.0 ) 3.1 0.05 0.1 -3.48
Crystalline Enstatite MgSiO4 2.80 1.0 1.3 ( 0.9 / 1.7 ) 1.2 0.05 0.1 -3.48
Metallic Iron Fe 7.87 0.8 0.6 ( 0.3 / 1.1 ) 1.5 0.2 0.3 -3.48
Iron Sulfide FeS 4.83 0.8 10.1 (10.0/ 10.1) 16.4 0.8 4.3 -3.48
Table 3. Results for the best fit model. The error estimates are obtained by considering all possible fits withχ2 ≤ 1.1χ2min. The total dust mass in the
beam of the SWS as found from the fit is 4.6 · 109 kg.
16
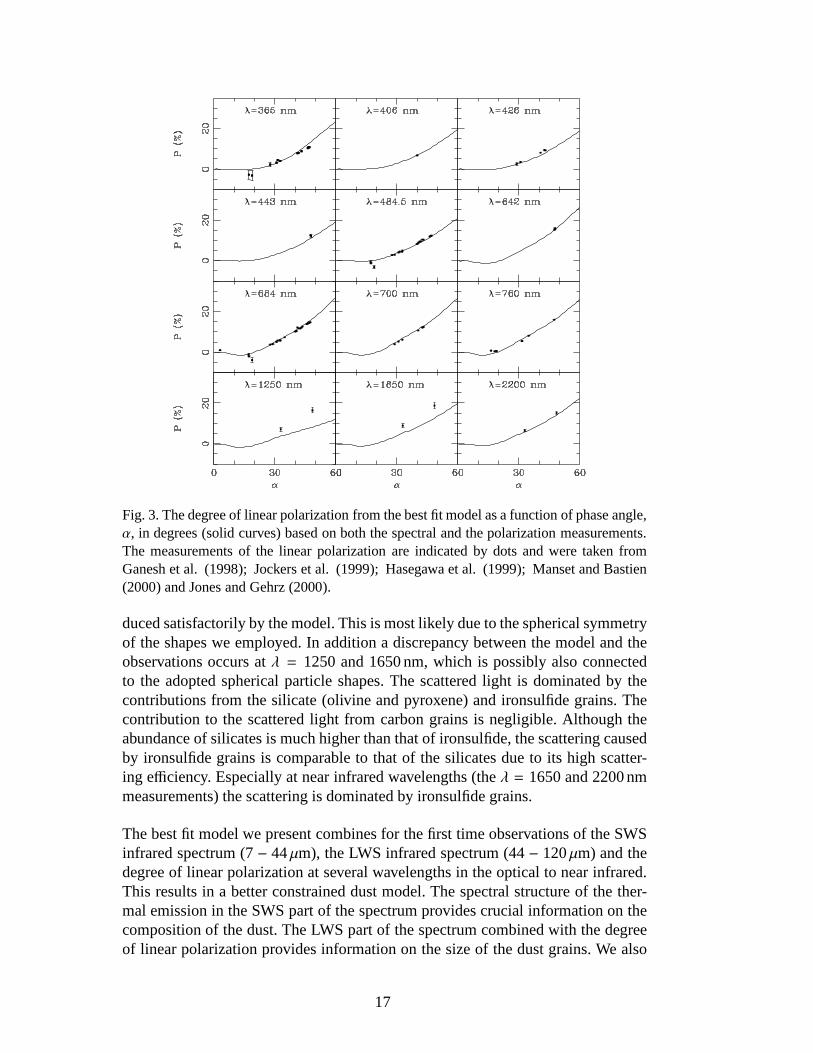
Fig. 3. The degree of linear polarization from the best fit model as a function of phase angle,α, in degrees (solid curves) based on both the spectral and thepolarization measurements.The measurements of the linear polarization are indicated by dots and were taken fromGanesh et al. (1998); Jockers et al. (1999); Hasegawa et al. (1999); Manset and Bastien(2000) and Jones and Gehrz (2000).
duced satisfactorily by the model. This is most likely due tothe spherical symmetryof the shapes we employed. In addition a discrepancy betweenthe model and theobservations occurs atλ = 1250 and 1650 nm, which is possibly also connectedto the adopted spherical particle shapes. The scattered light is dominated by thecontributions from the silicate (olivine and pyroxene) andironsulfide grains. Thecontribution to the scattered light from carbon grains is negligible. Although theabundance of silicates is much higher than that of ironsulfide, the scattering causedby ironsulfide grains is comparable to that of the silicates due to its high scatter-ing efficiency. Especially at near infrared wavelengths (theλ = 1650 and 2200 nmmeasurements) the scattering is dominated by ironsulfide grains.
The best fit model we present combines for the first time observations of the SWSinfrared spectrum (7− 44µm), the LWS infrared spectrum (44− 120µm) and thedegree of linear polarization at several wavelengths in theoptical to near infrared.This results in a better constrained dust model. The spectral structure of the ther-mal emission in the SWS part of the spectrum provides crucialinformation on thecomposition of the dust. The LWS part of the spectrum combined with the degreeof linear polarization provides information on the size of the dust grains. We also
17

Fig. 4. The contributions of all small (dots), and large (dashes) grain components to the totalspectrum (upper panel). The gray line indicates the observations, the black line indicatesthe best fit model. Also plotted are the contributions to the emission spectrum of the variousdust components (lower panels).
constructed fits excluding some of the observations from themodel. An attempt tofit only the SWS part of the spectrum resulted in an underestimate of the fraction oflarge grains, which in turn resulted in a higher fraction of crystalline silicates, morecomparable to that found in, for example, Bouwman et al. (2003). Fitting both theSWS and the LWS part of the spectrum without the linear polarization resulted ina dust composition only slightly different (i.e. within the given error bars) fromthat presented in Table 3. The size distribution is affected more significantly. Also,
18

using observations of the linear polarization at less wavelength points changed theparameters of the best fit model. For example, the best fit model when the observa-tion of the degree of linear polarization atλ = 1650 and 2200 nm are removed fromthe model contains no amorphous pyroxene and 8.5% amorphous silica. This canbe explained in part by the interchangeability of olivine and pyroxene grains (seealso van Boekel et al., 2005). The size distribution of this best fit model is changedsuch that the upper size limit of the amorphous olivine component is only 30µmbut the slope of the size distribution is more weigthed towards the larger grains,α = 3.0. The other parameters are only affected mildly.
The total dust mass in the SWS beam derived from the best fit model is 4.6 ·109 kg.This dust mass is comparable to that estimated by Bouwman et al. (2003) whichis 4.2 · 109 kg. Note that the dust mass derived in this way is a lower limitonthe real mass of the solid state material in the coma of Hale-Bopp since the massmost likely resides predominantly in the very large grains.Using data obtained atsubmillimeter wavelengths, which provides information onmillimeter sized dustgrains, Jewitt and Matthews (1999) derive a total dust mass of ∼2 · 1011 kg within abeam size comparable to that of the ISO SWS.
In our model the temperature of all dust species is determined self-consistently.However, from the ratio of the strengths of the forsterite features it can be seenthat the temperature of the forsterite grains is higher thanwould be determinedfrom thermal equilibrium calculations using pure forsterite grains (Harker et al.,2002). Pure forsterite grains are not very efficient absorbers in the UV and the op-tical part of the spectrum where a large part of the solar energy is emitted. Theyare very efficient emitters in the infrared. Therefore, pure forsteritegrains will becold compared to other dust species. The fact that they are observed to be rel-atively warm is probably an effect of thermal contact between the various dustspecies (Bouwman et al., 2003). An aggregated structure where all dust species arein thermal contact is also consistent with pictures of interplanetary dust particles.To calculate the optical properties of an aggregated structure in a completely con-sistent way is very computationally intensive which makes it extremely difficultto examine the entire parameter space of dust abundances andgrains sizes. Somework on this has been done by Moreno et al. (2003) consideringfixed values ofthe material abundances. To simulate thermal contact we polluted the forsterite andenstatite grains with 3% of small metallic iron inclusions.We calculated an effec-tive refractive index using the Maxwell-Garnet effective medium theory (see e.g.Bohren and Huffman, 1983). When we pollute the crystalline silicates in this way,the equilibrium temperature is in agreement with the observations.
19
3.3 Dust composition and size distribution
When discussing the size distribution of the dust we have to consider the grain sizesthat our analysis is sensitive to. For grains smaller than a few micron (. 3µm) wehave a strong spectroscopic diagnostic. At relatively short wavelengths (around∼10µm) we are mainly sensitive to the composition of these small grains. If wego to longer wavelengths, we are also sensitive to the composition of larger grains.Using the SWS and LWS range fromλ = 7 − 120µm, we have a spectroscopicdiagnostic for the composition of grains with a volume equivalent radius up to∼10-15µm. Although larger grains do show spectral structure (Min etal., 2004),their emission efficiency is too low to be detected.
When we compare our best fit parameters with those obtained byothers (Brucato et al.,1999; Galdemard et al., 1999; Wooden et al., 1999; Hayward etal., 2000; Harker et al.,2002; Bouwman et al., 2003) there are a few differences. First of all the amount ofcrystalline silicates is much smaller than that found in most of these studies. Thisis caused by the fact that previous studies mainly considered the small (submicronsized) grain component. In our model, we find that in order to reproduce the spec-tral features, the crystalline silicate grains have to be very small and thus they havea high emission efficiency. From, i.e. the LWS spectrum, we find that the amor-phous grains are relatively large, and thus emit less efficiently. Thus, if one onlyconsiders the small grain component, the crystallinity is increased with respect toour findings. The crystalline grains have to be small in orderto reproduce the ratiosof the strengths of the different emission features. However, these ratios are alsoinfluenced by the temperature of the dust grains. Fortunately, we can distinguishtemperature effects from grain size effects in the following way. In determiningthe absorption cross sections of dust particles the most important parameter is|mx|wherem is the complex refractive index andx = 2πr/λ is the size parameter of thedust grain. When|mx| << 1 the grains are in the Rayleigh domain and strong spec-tral emission resonances occur. When|mx| increases, the spectral features decreasein strength. For very large grains (|mx| >> 1) the emission features will changeinto emission dips (see Min et al., 2004). When the grain sizeis increased, first thefeatures caused by resonances with high values of|m/λ| become weaker and thenthe features with smaller values of|m/λ|. This means that this effect depends on thewavelength but also on the refractive index; the strongest features (with the highestvalues of|m|) will go down first. However, when going from high temperatures tolow temperatures, the effect on the strength of the features shifts with the maximumof the underlying Planck function, so this effect only depends on the wavelengthposition of the features. This difference allows us to distinguish between size andtemperature effects by carefully looking at the feature strength ratios.
To test if the ratios of the forsterite resonances can be explained using temperatureeffects instead of a difference in grain size between amorphous and crystalline sili-cates, we calculated the strengths of the 19.5, 23.6 and 33.6µm features above the
20

Fig. 5. The ratios of the peak strengths at 19.5, 23.6 and 33.6µm of forsterite calculated forvarious grain sizes and temperatures. The star indicates the measured peak strength ratiosof comet Hale-Bopp. Grains smaller than 0.1µm are in the Rayleigh limit. In this limit, theshape of the spectrum is independent of the particle size.
local continuum using the DHS for different grain sizes and temperatures. Thesestrengths are denoted byS19.5,S23.6 andS33.6 respectively. The strength ratios areplotted in Fig. 5 for various grain sizes and temperatures. The temperatures werevaried from 10− 1500K. Also plotted in Fig. 5 is the peak ratio measured in thespectrum of Hale-Bopp. We see that there is no correspondingset of temperatureand grain size in Fig. 5 that reproduces the ratios measured in Hale-Bopp. To getthe best fit we need to go to very small and relatively warm forsterite grains. Thefact that the forsterite has to be warm also indicates that the grains must be smalland most probably are in thermal contact with (at least) a strong absorbing materiallike carbon or iron.
The fact that we cannot find a set of temperature and grain sizewith peak ratios inFig. 5 corresponding to those observed in the infrared spectrum could be caused by
21
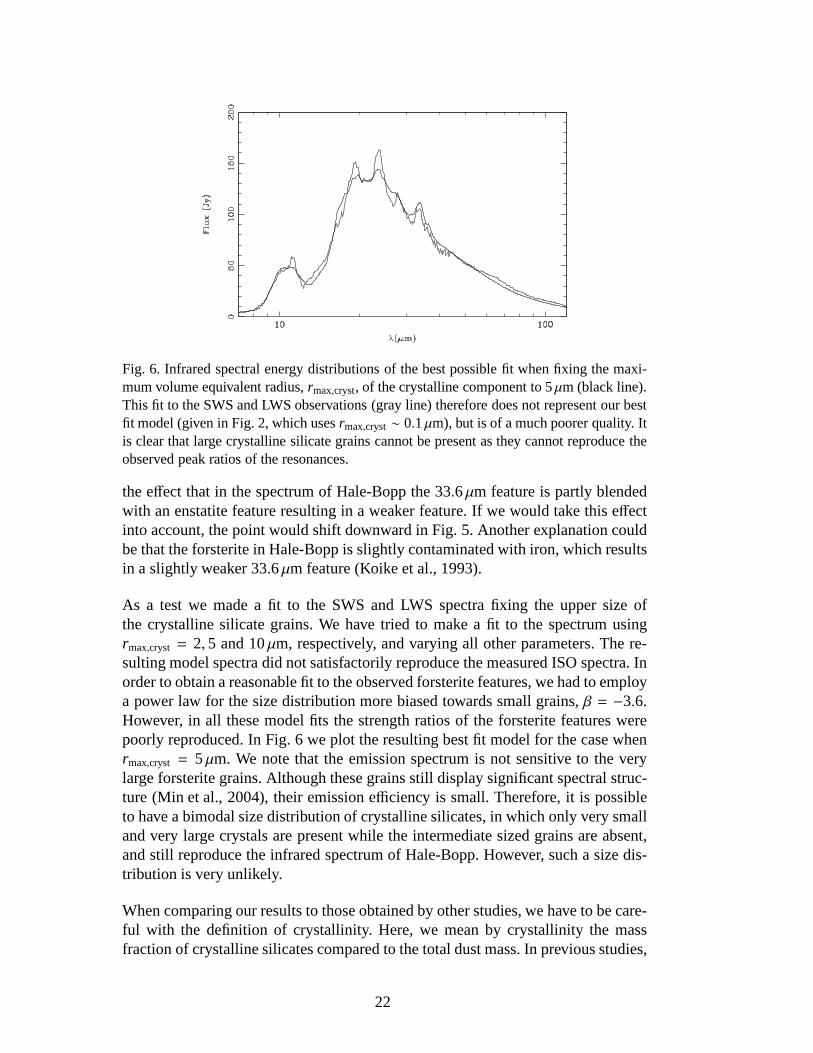
Fig. 6. Infrared spectral energy distributions of the best possible fit when fixing the maxi-mum volume equivalent radius,rmax,cryst, of the crystalline component to 5µm (black line).This fit to the SWS and LWS observations (gray line) thereforedoes not represent our bestfit model (given in Fig. 2, which usesrmax,cryst ∼ 0.1µm), but is of a much poorer quality. Itis clear that large crystalline silicate grains cannot be present as they cannot reproduce theobserved peak ratios of the resonances.
the effect that in the spectrum of Hale-Bopp the 33.6µm feature is partly blendedwith an enstatite feature resulting in a weaker feature. If we would take this effectinto account, the point would shift downward in Fig. 5. Another explanation couldbe that the forsterite in Hale-Bopp is slightly contaminated with iron, which resultsin a slightly weaker 33.6µm feature (Koike et al., 1993).
As a test we made a fit to the SWS and LWS spectra fixing the upper size ofthe crystalline silicate grains. We have tried to make a fit tothe spectrum usingrmax,cryst = 2, 5 and 10µm, respectively, and varying all other parameters. The re-sulting model spectra did not satisfactorily reproduce themeasured ISO spectra. Inorder to obtain a reasonable fit to the observed forsterite features, we had to employa power law for the size distribution more biased towards small grains,β = −3.6.However, in all these model fits the strength ratios of the forsterite features werepoorly reproduced. In Fig. 6 we plot the resulting best fit model for the case whenrmax,cryst = 5µm. We note that the emission spectrum is not sensitive to the verylarge forsterite grains. Although these grains still display significant spectral struc-ture (Min et al., 2004), their emission efficiency is small. Therefore, it is possibleto have a bimodal size distribution of crystalline silicates, in which only very smalland very large crystals are present while the intermediate sized grains are absent,and still reproduce the infrared spectrum of Hale-Bopp. However, such a size dis-tribution is very unlikely.
When comparing our results to those obtained by other studies, we have to be care-ful with the definition of crystallinity. Here, we mean by crystallinity the massfraction of crystalline silicates compared to the total dust mass. In previous studies,
22

sometimes the crystallinity is defined as the mass fraction of crystalline silicatescompared to the total mass in the silicate component. In our fit, approximately 40%of the dust mass is contained in non silicate materials like carbon and ironsulfide.When comparing with other studies we have to correct for this.
Since previous studies of the mineralogy of the dust in the coma of Hale-Boppfocused on the SWS part of the spectrum, little information was available on thelarge grain component. As can be seen from Fig. 4 the LWS spectrum (longward of∼44µm) displays a long wavelength slope that can only be explained using largegrains at approximately blackbody temperature (see also Lellouch et al., 1998). Wehave just shown that this large grain component cannot be crystalline. Since thelarge grains contain most of the mass, the resulting abundance of crystalline sil-icates is small, 4.3% (Table 3). We should note here that part of the crystallinesilicates are probably not spectroscopically detectable since these are hidden insidelarge amorphous silicate or carbon grains. Therefore the 4.3% crystallinity we de-rive is a lower limit. We can make a quantitative estimate of the true fraction ofcrystalline grains by only considering grains smaller thana certain size, for whichwe assume that we observe the properties of the entire grain.In order to assurethat the resulting mixture still has solar abundances, we fixthe total abundance ofsilicates (crystalline and amorphous olivine and pyroxene). Considering only thesilicate component, we compute the crystalline over amorphous ratio excluding thelarger silicate grains. We then use this crystalline over amorphous ratio to computethe fraction of crystalline silicates in the total mixture.We choose a volume equiv-alent radius of 10µm as the maximum grain size, which represents approximatelyhalf of the total dust mass. The crystallinity derived in this way depends on the as-sumption of this grain size, and detailed calculations are required to obtain a betterestimate of the appropriate size. We thus derive a crystallinity of ∼7.5% (∼5% ofcrystalline forsterite and∼2.5% of crystalline enstatite). Note that most previousstudies on the SWS spectrum of Hale-Bopp only included forsterite, no enstatite.In contrast with our findings, these studies typically find forsterite fractions of∼20-30%. The fraction of crystalline silicates in our best fit model increases when weconsider only smaller grains. The submicron grain component contains approxi-mately 30% forsterite and 14% enstatite. This fraction of forsterite is consistentwith the results from previous studies that focused on the submicron grain compo-nent (see e.g. Brucato et al., 1999).
It can be noted from Table 3 that the dust components with a high abundance residein relatively large grains. Although the large grains contribute much to the totaldust mass, they contribute only little to the infrared emission at short wavelengths.Therefore, we conclude that the long wavelength part of the spectrum and the de-gree of linear polarization contain crucial information onthe large dust grains, and,therefore, on a large fraction of the total dust mass.
We can calculate the effective radius and variance,reff andveff, of the dust grainsin our model using Eqs. (3) and (4). For our best fit modelreff = 1.0µm and
23
veff = 16.8. Typical values for the effective volume equivalent radii computed fromthe size distributions found in other studies are 0.5µm (Bouwman et al., 2003) and0.6µm (Moreno et al., 2003). The largerreff that we find is most likely due to theadditional information contained in the long wavelength slope. Employing a simplemodel for porous dust grains, Li and Greenberg (1998) argue that the average grainsize in Hale-Bopp might be much larger (∼8-25µm) and that the fraction of sub-micron grains might be negligible. Perhaps cometary dust grains are indeed veryfluffy aggregates of small particles. However, it is probably difficult to discrimi-nate between a large fluffy grain and a large number of small separate grains usingspectroscopy or observations of the degree of linear polarization.
The fact that the most abundant dust species reside in the largest grains is a naturalconsequence of the formation mechanism of the larger dust grains. Larger dustgrains are believed to form by coagulation of smaller grains. The materials that aremore abundant, can form large clusters of this material, whereas the less abundantspecies may be distributed in the aggregate as separate monomers. If the aggregateis very fluffy, the low abundance of the latter species causes the distance betweenthe inclusions to be on average relatively large. Thus, one could argue that theseinclusions will not interact very strongly with each other,and their resulting opticalproperties will be those of small particles. On the other hand, the larger clustersformed by the more abundant dust species will produce optical properties more likethose of large grains. This hypothesis may be tested by simulations of the opticalproperties of fluffy composite particles with extreme abundance differences.
We conclude that the crystalline silicates in the coma of comet Hale-Bopp are sub-micron sized. This is much smaller than the typical grain size found for the otherdust components. In agreement with these findings, the crystalline silicates foundin IDPs are predominantly submicron sized (Bradley et al., 1999). This differencein grain size between the amorphous and crystalline components results in a rela-tively low overall abundance of crystalline silicates. Theabundance of crystallinesilicates and the difference in grain size are important constraints when consideringmodels of the processing and dynamical history of dust in theearly solar system.
4 Discussion: Origin and evolution of cometary dust
Since comets are small bodies that have been frozen all of their lifetime, the cometmaterial is expected to have undergone little processing since the comet’s forma-tion. In larger bodies, like planets, the material has experienced severe parent bodyprocessing erasing the information on the original dust grains. Therefore, cometscontain a unique diagnostic of the mineralogy of the dust in the protoplanetary diskat times when the planets and comets were formed. The fraction of crystalline sil-icates in the diffuse interstellar medium (ISM) is very low. Li and Draine (2001)derive an upper limit for the crystallinity of the dust in theISM of 5%, while
24

Kemper et al. (2004) even derive an upper limit of 0.4%. In addition, the crys-tallinity of the ISM dust derived by van Boekel et al. (2005) is∼1%. This impliesthat the dust in Hale-Bopp has undergone at least some processing in the solar neb-ula, before it got incorporated into the comet. In order to form crystalline silicates,the amorphous silicates have to be heated above the glass temperature of∼1000 K.Comets form in the outer regions of the disk where the temperatures are low enoughfor water ice to exist. 160 K. There are two possible ways to explain the pres-ence of crystalline silicates in cometary dust grains. The first is that the amorphoussilicates are crystallized by thermal annealing in the hot inner regions of the pro-toplanetary disk. The crystalline silicates are then mixedout to the regions wherethe comets form. Another possibility is that the crystalline silicates are producedlocally. Processes that have been proposed for this are, forexample, shock anneal-ing (Harker and Desch, 2002) and lightning (Pilipp et al., 1998; Desch and Cuzzi,2000). Recent evidence for radial mixing in protoplanetarydisks is presented invan Boekel et al. (2004) on the basis of interferometric measurements of the dustin the inner disk regions. In that paper it is found that the crystallinity in the in-ner disk regions is higher than that in the outer disk regions. This difference, alongwith a varying forsterite over enstatite ratio, is consistent with predictions fromradial mixing models (Gail, 2004).
Several studies have tried to explain the presence of crystalline silicates in cometsby considering radial mixing. In these studies only the evolution of the silicate com-ponent is computed. For comparison with our computations, we therefore have tocorrect for the additional components included in the fit. The fraction of crystallinesilicates in the silicate component (amorphous and crystalline olivine and pyrox-ene) is approximately 12.5%. In Gail (2004) a detailed model for the protosolar diskis presented in which dust chemistry, thermal annealing andradial mixing are in-corporated. The computations in this paper are for a stationary model, so an equilib-rium situation is calculated. The crystallinity that follows from this detailed modeldepends strongly on the distance to the star. Close to the star, the crystallinity is veryhigh (∼70% at 3 AU), while in the comet forming region (∼20 AU) the crystallinefraction equals approximately 24% (8% crystalline olivineand 16% crystalline py-roxene). The author concludes that the results from the stationary model cannot beextrapolated to distances beyond 20 AU, and can only be considered an approxi-mation for the mineral composition of the inner 20 AU at several times 105 years.Wehrstedt and Gail (2002) present a time depend model of radial mixing. From theresults of this paper, it is apparent that the equilibrium situation as computed inGail (2004) is already attained after∼105 years. This is slightly shorter than the an-ticipated typical timescale for comet formation (which is afew times 105 years, seeWeidenschilling, 1997). The crystallinity computed by Wehrstedt and Gail (2002)at a distance of 30 AU is approximately 7% after 106 years. Bockelee-Morvan et al.(2002) also present a model describing time-dependent radial mixing in a proto-planetary disk. In this paper, three different solar nebula models are presented, awarm, a nominal, and a cold model referring to the temperature structure in the so-lar nebula. This temperature structure is set by the viscosity parameterα; the higher
25

the values ofα the lower the temperature. They derive an extremely well mixednebula, in which, after∼106 years, the crystallinity at distances> 10 AU is inde-pendent of the distance. They arrive at a final crystallinityin the outer solar system(> 10 AU) of approximately 58, 12 and 2% according to the warm, nominal, andcold solar nebula model. Note that the parameters chosen by Wehrstedt and Gail(2002) and Gail (2004) correspond to the warm to nominal solar nebula model ofBockelee-Morvan et al. (2002). The predicted crystallinity in the comet formingregion from both Gail (2004) and Bockelee-Morvan et al. (2002) shows that ther-mal annealing and radial mixing are more than sufficiently efficient mechanisms toexplain the crystalline silicates in Hale-Bopp. The most important free parameterin the above models is the viscosity parameter. The crystallinity of cometary dustcan be used to constrain this parameter, providing a better insight in the dynamicsof protoplanetary disks. While the crystallinity derived for Hale-Bopp in previousstudies could only be explained employing a viscosity parameter that is represen-tative for a warm solar nebula model, the crystallinity we derive for Hale-Bopp isconsistent with a viscosity parameter that is typical for anapproximately nominalsolar nebula and a formation distance of some 30 AU from the central star.
The crystalline silicates we find are all submicron sized, consistent with studiesof IDPs, in which the crystalline inclusions are predominantly submicron sized(Bradley et al., 1999). There are two possible explanationsfor this. The first ex-planation is that the crystalline silicates are formed before efficient grain growthsets in. Due to the low crystallinity this would result in a dust grain that has thecrystalline silicates scattered in the aggregate as small separate inclusions. How-ever, this possibility can likely be excluded on the basis ofthe results presentedby van Boekel et al. (2005). From the analysis of a large sample of protoplanetarydisks, it is concluded that grain growth occurs before efficient crystallization setsin. Another explanation might be that the mechanism that produces the crystallinesilicates in the comet forming region is more efficient for small grains than for largegrains. Both local flash heating events (like shock annealing and lightning) as wellas radial mixing are more efficient for small grains. For the local production mech-anisms this is due to the fact that small grains are more easily heated than largegrains. In the radial mixing models this is due to the fact that small grains moreeasily couple to the gas, and are thus more easily mixed outwards by, for example,turbulent radial mixing. It is, however, unclear if the sizedependencies of the var-ious models are strong enough to explain the absence of largecrystalline silicategrains in the coma of Hale-Bopp.
5 Conclusions
We have successfully modeled the thermal emission and the degree of linear po-larization of radiation scattered by grains in the coma of comet Hale-Bopp. Ourmethod has the following important characteristics relative to previous studies.
26

• Both grain size and grain shape effects are taken into account in the calculationsof the optical properties.
• The parameters of the best fit model are determined using an objective leastsquares fitting routine.
• The abundances of the chemical elements observed in interplanetary dust parti-cles and meteorites could be used as constraints for the model.
• The resulting model is consistent with the infrared emission spectrum observedin the wavelength range 7− 120µm and with observations of the degree of lin-ear polarization at various phase angles and twelve different wavelengths in theoptical to near infrared part of the spectrum.
To model the effects of grain shape on the optical properties, we employed the dis-tribution of hollow spheres. In this distribution we average over the volume fractionoccupied by the central vacuum inclusion while preserving the material volume ofthe particles. We showed that this shape distribution is successful in reproducingthe observed properties of cometary grains.
We deduced from the ratios of the strengths of various forsterite features in theobserved spectrum of Hale-Bopp that the crystalline silicate grains have a volumeequivalent radiusr . 1µm. This is much smaller than the typical grain size of theother dust components and is in agreement with the sizes of the crystalline silicateinclusions found in fluffy interplanetary dust particles. The crystalline inclusions inthese grains are predominantly submicron sized (Bradley etal., 1999).
The long wavelength observations showed that most of the mass resides in rela-tively large grains. The lack of large crystalline silicategrains in our model thusimplies that the amount of mass in this component is small. Our best fit modelhas a relative amount of crystalline silicates that is significantly lower than foundin previous studies of the infrared spectrum. If we consideronly the grains witha volume equivalent radius smaller than 10µm, the fraction of the total dust masscontained in crystalline silicates is only∼7.5%. The fraction of crystalline silicatesin the silicate component (both amorphous and crystalline olivine and pyroxene)is ∼12.5%. This crystallinity can easily be produced by models in which the crys-talline silicates are formed close to the Sun by thermal annealing and then mixedoutwards to the comet forming region (∼20-30 AU). The crystallinity derived byus for comet Hale-Bopp is in agreement with these models assuming an approxi-mately nominal model of the protosolar nebula and a formation of the comet at adistance of∼30 AU from the Sun. This crystallinity is also in agreement with thatfound in interplanetary dust particles.
27

Acknowledgments
It is a pleasure to express our gratitude to M. S. Hanner, C. Dijkstra and L. Kolokolovafor enlightening discussions. We are grateful to J. Crovisier for providing us withthe reduced data of the LWS spectrum of Hale-Bopp.
References
Aden, A. L., Kerker, M., 1951. Scattering of electromagnetic waves from two con-centric spheres. Journal of Applied Physics 22, 1242–1246.
Begemann, B., Dorschner, J., Henning, T., Mutschke, H., Thamm, E., Mar. 1994. Alaboratory approach to the interstellar sulfide dust problem. ApJ 423, L71–L74.
Bockelee-Morvan, D., Gautier, D., Hersant, F., Hure, J.-M., Robert, F., Mar. 2002.Turbulent radial mixing in the solar nebula as the source of crystalline silicatesin comets. A&A 384, 1107–1118.
Bockelee-Morvan, D., Lis, D. C., Wink, J. E., Despois, D., Crovisier, J., Bachiller,R., Benford, D. J., Biver, N., Colom, P., Davies, J. K., Gerard, E., Germain, B.,Houde, M., Mehringer, D., Moreno, R., Paubert, G., Phillips, T. G., Rauer, H.,Jan. 2000. New molecules found in comet C/1995 O1 (Hale-Bopp). Investigatingthe link between cometary and interstellar material. A&A 353, 1101–1114.
Bohren, C. F., Huffman, D. R., 1983. Absorption and scattering of light by smallparticles. New York: Wiley.
Bouwman, J., de Koter, A., Dominik, C., Waters, L. B. F. M., Apr. 2003. The originof crystalline silicates in the Herbig Be star HD 100546 and in comet Hale-Bopp.A&A 401, 577–592.
Bouwman, J., Meeus, G., de Koter, A., Hony, S., Dominik, C., Waters, L. B. F. M.,Sep. 2001. Processing of silicate dust grains in Herbig Ae/Be systems. A&A 375,950–962.
Bradley, J. P., Brownlee, D. E., Veblen, D. R., Feb. 1983. Pyroxene whiskers andplatelets in interplanetary dust - Evidence of vapour phasegrowth. Nature 301,473–477.
Bradley, J. P., Snow, T. P., Brownlee, D. E., Hanner, M. S., 1999. Sollid Interstel-lar Matter: The ISO Revolution. No. 11 in Centre de Physique des Houches.Springer, Berlin, p. 297.
Brucato, J. R., Colangeli, L., Mennella, V., Palumbo, P., Bussoletti, E., Jun. 1999.Silicates in Hale-Bopp: hints from laboratory studies. Planet. Space Sci. 47, 773–779.
Charbonneau, P., Dec. 1995. Genetic Algorithms in Astronomy and Astrophysics.ApJS 101, 309–+.
Crovisier, J., Leech, K., Bockelee-Morvan, D., Brooke, T. Y., Hanner, M. S., Al-tieri, B., Keller, H. U., Lellouch, E., 1997. The spectrum ofComet Hale-Bopp
28

(C/1995 01) observed with the Infrared Space Observatory at 2.9AU from theSun. Science 275, 1904–1907.
Desch, S. J., Cuzzi, J. N., Jan. 2000. The Generation of Lightning in the SolarNebula. Icarus 143, 87–105.
Dorschner, J., Begemann, B., Henning, T., Jager, C., Mutschke, H., Aug. 1995.Steps toward interstellar silicate mineralogy. II. Study of Mg-Fe-silicate glassesof variable composition. A&A 300, 503–+.
Fabian, D., Jager, C., Henning, T., Dorschner, J., Mutschke, H., Dec. 2000. Stepstoward interstellar silicate mineralogy. V. Thermal Evolution of AmorphousMagnesium Silicates and Silica. A&A 364, 282–292.
Forrest, W. J., Sargent, B., Furlan, E., D’Alessio, P., Calvet, N., Hartmann, L.,Uchida, K. I., Green, J. D., Watson, D. M., Chen, C. H., Kemper, F., Keller,L. D., Sloan, G. C., Herter, T. L., Brandl, B. R., Houck, J. R.,Barry, D. J., Hall,P., Morris, P. W., Najita, J., Myers, P. C., Sep. 2004. Mid-infrared Spectroscopyof Disks around Classical T Tauri Stars. ApJS 154, 443–447.
Gail, H.-P., Jan. 2004. Radial mixing in protoplanetary accretion disks. IV. Meta-morphosis of the silicate dust complex. A&A 413, 571–591.
Galdemard, P., Lagage, P. O., Dubreuil, D., Jouan, R., Masse, P., Pantin, E.,Bockelee-Morvan, D., 1999. Mid-Infrared Spectro-Imaging Observations OfComet Hale-Bopp. Earth Moon and Planets 78, 271–277.
Ganesh, S., Joshi, U. C., Baliyan, K. S., Deshpande, M. R., May 1998. Polarimetricobservations of the comet Hale-Bopp. A&AS 129, 489–493.
Geiss, J., Nov. 1987. Composition measurements and the history of cometary mat-ter. A&A 187, 859–866.
Grevesse, N., Sauval, A. J., Aug. 1998. Standard Solar Composition. Space ScienceReviews 85, 161–174.
Hanner, M. S., Gehrz, R. D., Harker, D. E., Hayward, T. L., Lynch, D. K., Mason,C. C., Russell, R. W., Williams, D. M., Wooden, D. H., Woodward, C. E., 1999.Thermal Emission from the Dust Coma of Comet Hale-Bopp and the Composi-tion of the Silicate Grains. Earth Moon and Planets 79, 247–264.
Harker, D. E., Desch, S. J., Feb. 2002. Annealing of SilicateDust by NebularShocks at 10 AU. ApJ 565, L109–L112.
Harker, D. E., Wooden, D. H., Woodward, C. E., Lisse, C. M., Nov. 2002. GrainProperties of Comet C/1995 O1 (Hale-Bopp). ApJ 580, 579–597.
Hasegawa, H., Ichikawa, T., Abe, S., Hamamura, S., Ohnishi,K., Watanabe, J.,1999. Near-Infrared Photometric and Polarimetric Observations Of Comet Hale-Bopp. Earth Moon and Planets 78, 353–358.
Hayward, T. L., Hanner, M. S., Sekanina, Z., Jul. 2000. Thermal Infrared Imagingand Spectroscopy of Comet Hale-Bopp (C/1995 O1). ApJ 538, 428–455.
Henning, T., Chan, S. J., Assendorp, R., Aug. 1996. The nature of objects with a21-µm feature. A&A 312, 511–520.
Irvine, W. M., Senay, M., Lovell, A. J., Matthews, H. E., McGonagle, D., Meier,R., Feb. 2000. NOTE: Detection of Nitrogen Sulfide in Comet Hale-Bopp. Icarus143, 412–414.
Jager, C., Molster, F. J., Dorschner, J., Henning, T., Mutschke, H., Waters,
29

L. B. F. M., Nov. 1998. Steps toward interstellar silicate mineralogy. IV. Thecrystalline revolution. A&A 339, 904–916.
Jewitt, D., Matthews, H., Feb. 1999. Particulate Mass Loss from Comet Hale-Bopp.AJ 117, 1056–1062.
Jockers, K., Rosenbush, V. K., Bonev, T., Credner, T., 1999.Images of Polarizationand Colour in the Inner Coma of Comet Hale-Bopp. Earth Moon and Planets 78,373–379.
Jones, T. J., Gehrz, R. D., Feb. 2000. Infrared Imaging Polarimetry of CometC/1995 01 (Hale-Bopp). Icarus 143, 338–346.
Kahnert, F. M., Stamnes, J. J., Stamnes, K., Jul. 2002. Usingsimple particle shapesto model the Stokes scattering matrix of ensembles of wavelength-sized parti-cles with complex shapes: possibilities and limitations. Journal of QuantitativeSpectroscopy and Radiative Transfer 74, 167–182.
Kahnert, M., May 2004. Reproducing the optical properties of fine desert dustaerosols using ensembles of simple model particles. Journal of QuantitativeSpectroscopy and Radiative Transfer 85, 231–249.
Kemper, F., Vriend, W. J., Tielens, A. G. G. M., Jul. 2004. TheAbsence of Crys-talline Silicates in the Diffuse Interstellar Medium. ApJ 609, 826–837.
Koike, C., Shibai, H., Tuchiyama, A., Oct. 1993. Extinctionof Olivine and Pyrox-ene in the Mid Infrared and Far Infrared. MNRAS 264, 654–+.
Kolokolova, L., Hanner, M. S., Levasseur-Regourd, A. C., Gustafson, B.A. S.,2004. Physical properties of cometary dust from light scattering and thermalemission. Comets II. Arizona Press.
Lellouch, E., Crovisier, J., Lim, T., Bockelee-Morvan, D.,Leech, K., Hanner, M. S.,Altieri, B., Schmitt, B., Trotta, F., Keller, H. U., Nov. 1998. Evidence for waterice and estimate of dust production rate in comet Hale-Bopp at 2.9 AU from theSun. A&A 339, L9–L12.
Li, A., Draine, B. T., Apr. 2001. On Ultrasmall Silicate Grains in the Diffuse Inter-stellar Medium. ApJ 550, L213–L217.
Li, A., Greenberg, J. M., May 1998. From Interstellar Dust toComets: InfraredEmission from Comet Hale-Bopp (C/1995 O1). ApJ 498, L83–+.
Li, A., Greenberg, J. M., Zhao, G., Aug. 2002. Modelling the astronomical silicatefeatures - I. On the spectrum subtraction method. MNRAS 334,840–846.
Manset, N., Bastien, P., May 2000. Polarimetric Observations of Comets C/1995O1 Hale-Bopp and C/1996 B2 Hyakutake. Icarus 145, 203–219.
Mason, C. G., Gehrz, R. D., Jones, T. J., Woodward, C. E., Hanner, M. S., Williams,D. M., Mar. 2001. Observations of Unusually Small Dust Grains in the Coma ofComet Hale-Bopp C/1995 O1. ApJ 549, 635–646.
Min, M., Dominik, C., Waters, L. B. F. M., Jan. 2004. Spectroscopic diagnostic forthe mineralogy of large dust grains. A&A 413, L35–L38.
Min, M., Hovenier, J. W., de Koter, A., Jun. 2003. Shape effects in scattering andabsorption by randomly oriented particles small compared to the wavelength.A&A 404, 35–46.
Min, M., Hovenier, J. W., de Koter, A., 2005. Modeling optical properties of cosmicdust grains using a distribution of hollow spheres. A&A 432,909–920.
30

Mishchenko, M. I., Travis, L. D., Lacis, A. A., 2002. Scattering, Absorption andEmission of Light by Small Particles. Cambridge UniversityPress, Cambridge.
Molster, F. J., Waters, L. B. F. M., Trams, N. R., Van Winckel,H., Decin, L., vanLoon, J. T., Jager, C., Henning, T., Kaufl, H.-U., de Koter,A., Bouwman, J., Oct.1999. The composition and nature of the dust shell surrounding the binary AFGL4106. A&A 350, 163–180.
Moreno, F., Munoz, O., Vilaplana, R., Molina, A., Sep. 2003. Irregular Particlesin Comet C/1995 O1 Hale-Bopp Inferred from its Mid-Infrared Spectrum.ApJ595, 522–530.
Pilipp, W., Hartquist, T. W., Morfill, G. E., Levy, E. H., Mar.1998. Chondruleformation by lightning in the Protosolar Nebula? A&A 331, 121–146.
Preibisch, T., Ossenkopf, V., Yorke, H. W., Henning, T., Nov. 1993. The influenceof ice-coated grains on protostellar spectra. A&A 279, 577–588.
Servoin, J. L., Piriou, B., 1973. Infrared reflectivity and Raman scattering ofMg2SiO4 single crystal. Phys. Stat. Sol. (b) 55, 677–686.
Spitzer, W. G., Kleinman, D. A., 1960. Infrared lattice bands of quartz. PhysicalReview 121, 1324–1335.
Toon, O. B., Ackerman, T. P., Oct. 1981. Algorithms for the calculation of scatter-ing by stratified spheres. Appl. Opt. 20, 3657–3660.
van Boekel, R., Min, M., Leinert, C., Waters, L. B. F. M., Richichi, A., Chesneau,O., Dominik, C., Jaffe, W., Dutrey, A., Graser, U., Henning, T., de Jong, J.,Kohler, R., de Koter, A., Lopez, B., Malbet, F., Morel, S., Paresce, F., Perrin,G., Preibisch, T., Przygodda, F., Scholler, M., Wittkowski, M., Nov. 2004. Thebuilding blocks of planets within the ‘terrestrial’ regionof protoplanetary disks.Nature 432, 479–482.
van Boekel, R., Min, M., Waters, L. B. F. M., de Koter, A., Dominik, C., van denAncker, M. E., Bouwman, J., 2005. A 10µm spectroscopic survey of Herbig Aestar disks: grain growth and crystallization. A&A ,in press.
van de Hulst, H. C., 1957. Light Scattering by Small Particles. Wiley, New York.Warren, J. L., Barret, R. A., Dodson, A. L., Watts, L. A., Zolensky, M. E. (Eds.),
1994. Cosmic Dust Catalog. Vol. 14. NASA Johnson Space Center, Houston.Waters, L. B. F. M., Molster, F. J., de Jong, T., Beintema, D. A., Waelkens, C.,
Boogert, A. C. A., Boxhoorn, D. R., de Graauw, T., Drapatz, S., Feuchtgruber,H., Genzel, R., Helmich, F. P., Heras, A. M., Huygen, R., Izumiura, H., Just-tanont, K., Kester, D. J. M., Kunze, D., Lahuis, F., Lamers, H. J. G. L. M., Leech,K. J., Loup, C., Lutz, D., Morris, P. W., Price, S. D., Roelfsema, P. R., Salama,A., Schaeidt, S. G., Tielens, A. G. G. M., Trams, N. R., Valentijn, E. A., Van-denbussche, B., van den Ancker, M. E., van Dishoeck, E. F., Van Winckel, H.,Wesselius, P. R., Young, E. T., Nov. 1996. Mineralogy of oxygen-rich dust shells.A&A 315, L361–L364.
Wehrstedt, M., Gail, H.-P., Apr. 2002. Radial mixing in protoplanetary accretiondisks. II. Time dependent disk models with annealing and carbon combustion.A&A 385, 181–204.
Weidenschilling, S. J., Jun. 1997. The Origin of Comets in the Solar Nebula: AUnified Model. Icarus 127, 290–306.
31

Weiler, M., Rauer, H., Knollenberg, J., Jorda, L., Helbert,J., May 2003. The dustactivity of comet C/1995 O1 (Hale-Bopp) between 3 AU and 13 AU from theSun. A&A 403, 313–322.
Wooden, D. H., 2002. Comet Grains: Their IR Emission and Their Relation to ISmGrains. Earth Moon and Planets 89, 247–287.
Wooden, D. H., Harker, D. E., Woodward, C. E., Butner, H. M., Koike, C., Witte-born, F. C., McMurtry, C. W., Jun. 1999. Silicate Mineralogyof the Dust in theInner Coma of Comet C/1995 01 (Hale-Bopp) Pre- and Postperihelion. ApJ 517,1034–1058.
32


![Large Aperture [O I] 6300 Å Observations of Comet Hyakutake: Implications for the Photochemistry of OH and [O I] Production in Comet Hale-Bopp Jeffrey](https://img.pdfslide.us/doc/110x75/56649d1f5503460f949f3a38/large-aperture-o-i-6300-a-observations-of-comet-hyakutake-implications.jpg)