Embed Size (px)
Citation preview

The CO Mapping Array Pathfinder (COMAP)
Kieran Cleary (Caltech) AME Workshop, June 23, 2016
1
CO
MA
P
What is COMAP? • Aim: ultimately, to trace LSS at EoR. In short term, focus on lower-redshift science
• CO
• Common star-formation tracer at low redshift
• Bright, even at high z
• Traces photon sources responsible for the ionization
• Emits in line ‘ladder’
• Mapping• Intensity mapping:
• aggregate line emission from unresolved galaxies
• Measure spectra: trace evolution with redshift - ‘tomography’
• Array
• Single-dish, focal-plane array
• All-sky, 1000-element arrays, broadband backends ultimately required
• Pathfinder
• Test technology and focus on intermediate redshift, z~2-3. 2
CO
MA
P
Fig. 1.—(a) Correlation between HCN and IR luminosities in 65 galaxies. Some limits in HCN luminosities are indicated with arrows. (b) Correlation betweenLCO and LIR for the same HCN sample. The sample is divided into luminous infrared galaxies (LIGs) and ultraluminous infrared galaxies (ULIGs) withLIR ! 1011 L" and less luminous ‘‘normal’’ spiral galaxies. The solid lines are the fits to the less luminous galaxies with a slope fixed at unity. A single slope fitsHCN data for both low and high IR luminosities, but not for the CO data.
Fig. 1a
Fig. 1b
Gao & Solomon (2004)
58 Carilli & Walter
Table 2: Factors to calculate L′CO(1−0) from higher–J transitions up to J=5. For
the SMGs and QSOs average values are quoted based on all available literatureestimates. For the CSG the ratio is taken from Dannerbauer et al. (2009) andAravena et al. (2010); their LVG model 1. The values for the Milky Way and thecentre of M82 are from Weiß et al. (2005b) ‘–’ indicates that no well–constrainedvalue is available. We assume the same excitation as for the CSG for the LBGs,SFRGs. We adopt QSO excitation for the RGs and SMG excitation for the 24µmand ERO sources.source SMG QSO CSG MW M82L′CO(2−1)/L
′CO(1−0) 0.85 0.99 0.97 0.5 0.98
L′CO(3−2)/L
′CO(1−0) 0.66 0.97 0.56 0.27 0.93
L′CO(4−3)/L
′CO(1−0) 0.46 0.87 0.2 0.17 0.85
L′CO(5−4)/L
′CO(1−0) 0.39 0.69 – 0.08 0.75
Figure 1: Redshifted frequencies νobs of CO transitions (left) and other keytracers of the starforming ISM (right) as a function of redshift z, followingνobs = νrest/(1 + z). The shaded areas indicate the frequency bands coveredby various telescopes. Highlighted are the ALMA frequency bands as well as the‘high–frequency’ bands of the JVLA. The colored points indicate detection of allhigh redshift (z> 1) lines. The color of the points refer to the different sourcetypes, as explained in the left panel.
Carilli & Walter (2013)
�⌫ �⌫Observed frequency <-> distance
COMAP collaboration
3
CO
MA
P
K. Cleary (PI) Tony Readhead
Tim Pearson James Lamb David Woody
Sarah Church Risa Wechsler
Tony Li Dongwoo Chung
Andrew Harris Joshua GundersenTodd Gaier Charles Lawrence Brandon Hensley
Clive Dickinson Stuart Harper
Hans Kristian Eriksen Ingunn Wehus

COMAP Phase I
4
CO
MA
P
MMIC$HEMT$$amplifiers$
polarizer$
feed
horn$
LO$
IQ$m
ixers$
EX$
EY$
AMPLIFIER$MODULE$ MIXER/IF$BOARD$
BandEpass$filters$ IF
$am
plifiers$
QY$
IX$
QX$
IY$
900$
900$
USBX$
LSBX$
USBY$
LSBY$
polarizer)feedhorn) AMPLIFIER))
MODULE)
MIXER/IF)BOARD)
Observefor2years10mtelescopeatOVRO
NSF AAG
NSF MRI
COMAP Phase I
26-34GHzFocal-planearray19single-pol
pixels
10mtelescope
19x8GHzbackendCASPER-based
COMAP

COMAP Phase I
5
CO
MA
P
MMIC$HEMT$$amplifiers$
polarizer$
feed
horn$
LO$
IQ$m
ixers$
EX$
EY$
AMPLIFIER$MODULE$ MIXER/IF$BOARD$
BandEpass$filters$ IF
$am
plifiers$
QY$
IX$
QX$
IY$
900$
900$
USBX$
LSBX$
USBY$
LSBY$
polarizer)feedhorn) AMPLIFIER))
MODULE)
MIXER/IF)BOARD)
Observefor2years10mtelescopeatOVRO
NSF AAG
NSF MRI
COMAP Phase I
26-34GHzFocal-planearray19single-pol
pixels
10mtelescope
19x8GHzbackendCASPER-based
COMAP

COMAP LNA modulesCO
MA
P
0.0#
5.0#
10.0#
15.0#
20.0#
25.0#
30.0#
26# 28# 30# 32# 34# 36# 38# 40#
Noise&Tem
perature&(K
)&
Freqency&(GHz)&
40 LNA modules already built (JPL R&TD) Using existing MMIC LNA designs (100 nm) Evaluating new 35 nm designs (<12 K noise from 26-34 GHz noise) Nominal Tsys=44 K (assumes 16 K amplifier noise)

Experiment Parameters
7
CO
MA
P
COMAP Parameters Angular resolution (arcmin) ~4’
Number of pixels 19
System temperature (K) 44
Frequency coverage (GHz) 26-30 30-34
Spectral resolution (R) ~800
Final map sensitivity per 4 GHz band in single field (μK) 1.33
-Four fields, each 2.5 sq deg -2,000 hrs observing -Chosen to overlap with galaxy surveys, e.g. COSMOS, DES

Phase I sensitivity
8
CO
MA
P
10�2 10�1 100
k [Mpc�1]
10�2
10�1
100
101
102
k3 P(k
)/2⇡
2[µ
K2 ]
26-30 GHzCO(1-0)z ⇠ 2.8 � 3.4
COMAP 10m
Fiducial⇠ Pullen+2013, B⇠ Righi+2008Pullen+2013, AVisbal+Loeb 2010
10�2 10�1 100
k [Mpc�1]
0
5
10
15
20
P(k
)/�
P(k
)1�
3�
5�
26-30 GHzCO(1-0)z ⇠ 2.8 � 3.4
COMAP 10m (detection significance)FiducialRighi+2008 (approx.)Visbal+Loeb 2010Pullen+2013, APullen+2013, B (approx.)
Tony Li
Single 4-GHz band

Phase I sensitivity
9
CO
MA
P
10�2 10�1 100
k [Mpc�1]
10�2
10�1
100
101
102
k3 P(k
)/2⇡
2[µ
K2 ]
26-30 GHzCO(1-0)z ⇠ 2.8 � 3.4
COMAP 10m
Fiducial⇠ Pullen+2013, B⇠ Righi+2008Pullen+2013, AVisbal+Loeb 2010
10�2 10�1 100
k [Mpc�1]
0
5
10
15
20
P(k
)/�
P(k
)1�
3�
5�
26-30 GHzCO(1-0)z ⇠ 2.8 � 3.4
COMAP 10m (detection significance)FiducialRighi+2008 (approx.)Visbal+Loeb 2010Pullen+2013, APullen+2013, B (approx.)
Tony Li
Single 4-GHz band
Keating et al.
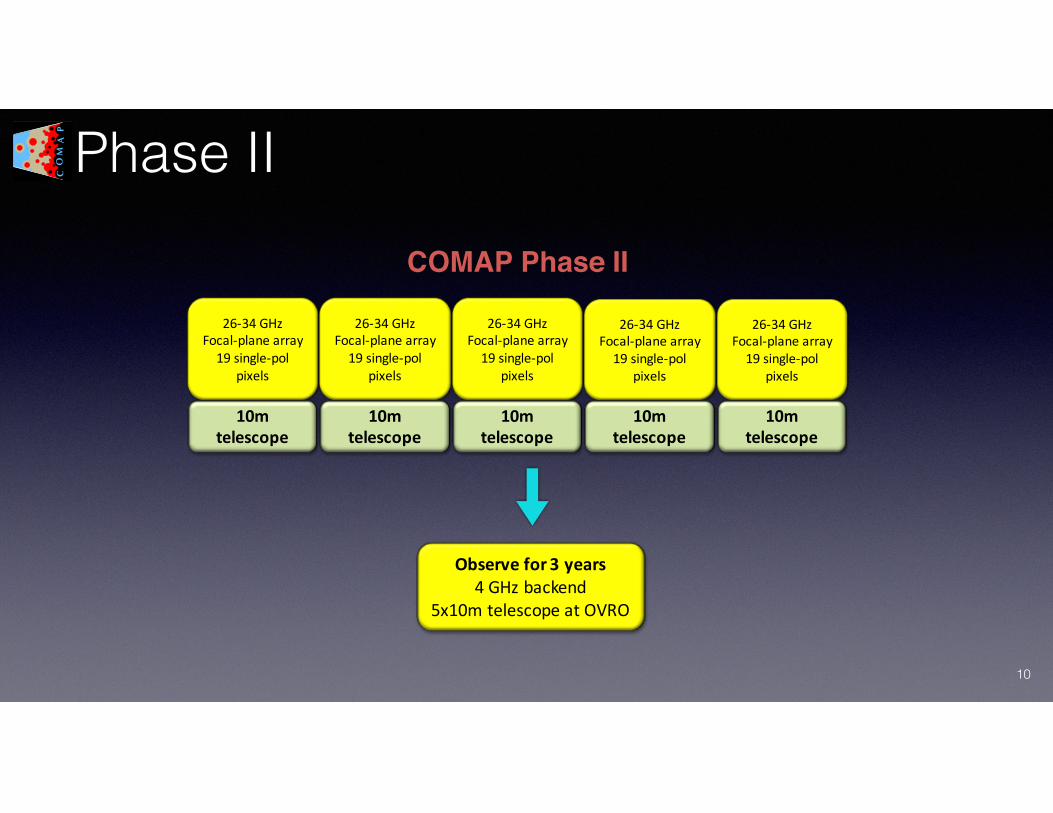
Phase II
10
CO
MA
P
26-34GHzFocal-planearray19single-pol
pixels
COMAP Phase II
26-34GHzFocal-planearray19single-pol
pixels
26-34GHzFocal-planearray19single-pol
pixels
26-34GHzFocal-planearray19single-pol
pixels
26-34GHzFocal-planearray19single-pol
pixels
10mtelescope
10mtelescope
10mtelescope
10mtelescope
10mtelescope
Observefor3years4GHzbackend
5x10mtelescopeatOVRO

Phase II sensitivity
11
CO
MA
P
10�2 10�1 100
k [Mpc�1]
10�2
10�1
100
101
102
k3 P(k
)/2⇡
2[µ
K2 ]
30-34 GHzCO(1-0)z ⇠ 2.4 � 2.8
COMAP 10m: x5 dishes
Fiducial⇠ Pullen+2013, B⇠ Righi+2008Pullen+2013, AVisbal+Loeb 2010
10�2 10�1 100
k [Mpc�1]
0
5
10
15
20
P(k
)/�
P(k
)1�
3�
5�
30-34 GHzCO(1-0)z ⇠ 2.4 � 2.8
COMAP 10m: x5 dishes (detection significance)FiducialRighi+2008 (approx.)Visbal+Loeb 2010Pullen+2013, APullen+2013, B (approx.)
COMAP Phase II
Tony Li
Tony Li

COMAP Phase III
12
CO
MA
P
Observefor2years10mtelescopeatOVRO
NSF AAG
NSF MRI
COMAP Phase I
26-34GHzFocal-planearray19single-pol
pixels
10mtelescope
19x8GHzbackendCASPER-based
COMAP
Ka
KaCOMAP Ku

Foregrounds
13
CO
MA
P
•Continuum foregrounds •Free-free •CMB
•Synchrotron •Point sources
•Foreground continuua fitted out as low-order modes
•Line foregrounds•Other lines redshifted into 26-34 GHz band
•HCN (1-0), CN (1-0), CS (1-0), HCO+
•Brightest line foreground sub-dominant
Foreground
Foreground Galactic synchrotron from the Global Sky model (de Oliveira-Costa et al. 2008).Free-Free emission from the Planck Sky Model (Delabrouille 2013)Point sources (PSM model with limit between strong and faint sources = 100 mJy)CMB (Commander-Ruler CMB intensity map)
Mollview projectionSky at 30 GHz
Galactic free-freeGalactic synchrotron
Faint point sourcesCMB
K_CMB 3

Foregrounds
14
CO
MA
P
•Continuum foregrounds •Free-free •CMB
•Synchrotron •Point sources
•Foreground continua fitted out as low-order modes
•Line foregrounds•Other lines redshifted into 26-34 GHz band
•HCN (1-0), CN (1-0), CS (1-0), HCO+
•Brightest line foreground sub-dominant
10�1 100
10�310�210�1100101102103104105106
�2 (k)
(µK2 )
model A
10�1 100
k (Mpc�1)
10�1100101102
(CO
+HCN
)/CO
Figure 5: 3D spherically-averaged power spectra (left panels) and averageC` over all frequency channels (right panels), for varied HCN line luminos-ity models. Median spectrum values and 95% interval at each ` are shownfor each model, with log-space residuals between uncontaminated and con-taminated CO spectra shown below each spectra plot.
10
COHCNCO + HCN
Figure 5: 3D spherically-averaged power spectra (left panels) and averageC` over all frequency channels (right panels), for varied HCN line luminos-ity models. Median spectrum values and 95% interval at each ` are shownfor each model, with log-space residuals between uncontaminated and con-taminated CO spectra shown below each spectra plot.
10
Dongwoo Chung

AME Science
15
CO
MA
P
COMAP Parameters Angular resolution (arcmin) ~4’
Number of pixels 19
System temperature (K) 44
Frequency coverage (GHz) 26-30 30-34
Spectral resolution (R) ~800
Final map sensitivity per 4 GHz band in single field (μK) 1.33
Mapping of extended areas: - Galactic: NCP, compact targets - Nearby galaxies
1 MHz spectral resolution (higher possible?)

Schedule
• COMAP Phase I fully funded by NSF (AAG + MRI), KISS, Caltech, Stanford, JPL, Miami, Manchester, Oslo
• 4-year project: 2-year build, 2-year observation
• Start observing October 2017!


![Comap Electronic Engined Support 2009-2010[1]](https://img.pdfslide.us/doc/110x75/5534a5584a79594d6f8b4ab8/comap-electronic-engined-support-2009-20101.jpg)