Embed Size (px)
Citation preview
This article was downloaded by: [Pennsylvania State University]On: 11 August 2014, At: 11:38Publisher: Taylor & FrancisInforma Ltd Registered in England and Wales Registered Number: 1072954 Registered office: Mortimer House,37-41 Mortimer Street, London W1T 3JH, UK
Click for updates
International Journal of Systems SciencePublication details, including instructions for authors and subscription information:http://www.tandfonline.com/loi/tsys20
The clustering-based case-based reasoning forimbalanced business failure prediction: a hybridapproach through integrating unsupervised processwith supervised processHui Lia, Jun-Ling Yua, Le-An Yubc & Jie Sunad
a School of Economics and Management, Zhejiang Normal University, Jinhua, Zhejiang,Chinab School of Economics and Management, Beijing University of Chemical Technology, Beijing,Chinac Center for Forecasting Science, Chinese Academy of Sciences, Beijing, Chinad College of Management & Tourism, Dongguk University, 707 Seokjang-Dong, Gyeongju,Gyeonbuk, KoreaPublished online: 15 Jan 2013.
To cite this article: Hui Li, Jun-Ling Yu, Le-An Yu & Jie Sun (2014) The clustering-based case-based reasoning forimbalanced business failure prediction: a hybrid approach through integrating unsupervised process with supervised process,International Journal of Systems Science, 45:5, 1225-1241, DOI: 10.1080/00207721.2012.748105
To link to this article: http://dx.doi.org/10.1080/00207721.2012.748105
PLEASE SCROLL DOWN FOR ARTICLE
Taylor & Francis makes every effort to ensure the accuracy of all the information (the “Content”) containedin the publications on our platform. However, Taylor & Francis, our agents, and our licensors make norepresentations or warranties whatsoever as to the accuracy, completeness, or suitability for any purpose of theContent. Any opinions and views expressed in this publication are the opinions and views of the authors, andare not the views of or endorsed by Taylor & Francis. The accuracy of the Content should not be relied upon andshould be independently verified with primary sources of information. Taylor and Francis shall not be liable forany losses, actions, claims, proceedings, demands, costs, expenses, damages, and other liabilities whatsoeveror howsoever caused arising directly or indirectly in connection with, in relation to or arising out of the use ofthe Content.
This article may be used for research, teaching, and private study purposes. Any substantial or systematicreproduction, redistribution, reselling, loan, sub-licensing, systematic supply, or distribution in anyform to anyone is expressly forbidden. Terms & Conditions of access and use can be found at http://www.tandfonline.com/page/terms-and-conditions
International Journal of Systems Science, 2014Vol. 45, No. 5, 1225–1241, http://dx.doi.org/10.1080/00207721.2012.748105
The clustering-based case-based reasoning for imbalanced business failure prediction: a hybridapproach through integrating unsupervised process with supervised process
Hui Lia,∗, Jun-Ling Yua, Le-An Yub,c and Jie Suna,d
aSchool of Economics and Management, Zhejiang Normal University, Jinhua, Zhejiang, China; bSchool of Economics and Management,Beijing University of Chemical Technology, Beijing, China; cCenter for Forecasting Science, Chinese Academy of Sciences, Beijing,
China; dCollege of Management & Tourism, Dongguk University, 707 Seokjang-Dong, Gyeongju, Gyeonbuk, Korea
(Received 26 April 2012; final version received 4 November 2012)
Case-based reasoning (CBR) is one of the main forecasting methods in business forecasting, which performs well inprediction and holds the ability of giving explanations for the results. In business failure prediction (BFP), the number offailed enterprises is relatively small, compared with the number of non-failed ones. However, the loss is huge when anenterprise fails. Therefore, it is necessary to develop methods (trained on imbalanced samples) which forecast well forthis small proportion of failed enterprises and performs accurately on total accuracy meanwhile. Commonly used methodsconstructed on the assumption of balanced samples do not perform well in predicting minority samples on imbalanced samplesconsisting of the minority/failed enterprises and the majority/non-failed ones. This article develops a new method calledclustering-based CBR (CBCBR), which integrates clustering analysis, an unsupervised process, with CBR, a supervisedprocess, to enhance the efficiency of retrieving information from both minority and majority in CBR. In CBCBR, variouscase classes are firstly generated through hierarchical clustering inside stored experienced cases, and class centres arecalculated out by integrating cases information in the same clustered class. When predicting the label of a target case,its nearest clustered case class is firstly retrieved by ranking similarities between the target case and each clustered caseclass centre. Then, nearest neighbours of the target case in the determined clustered case class are retrieved. Finally, labelsof the nearest experienced cases are used in prediction. In the empirical experiment with two imbalanced samples fromChina, the performance of CBCBR was compared with the classical CBR, a support vector machine, a logistic regressionand a multi-variant discriminate analysis. The results show that compared with the other four methods, CBCBR performedsignificantly better in terms of sensitivity for identifying the minority samples and generated high total accuracy meanwhile.The proposed approach makes CBR useful in imbalanced forecasting.
Keywords: business failure prediction; clustering-based case-based reasoning (CBCBR); imbalanced case-based reasoning;integration of unsupervised learning with supervised learning
1. Introduction and motivation
Case-based reasoning (CBR) is an analogy method, whichprovides an approach to construct expert systems by themeans of problem-solving mechanism of imitating humanbeings. With CBR, new problems are solved by consider-ing results of similar experienced cases retrieved from casebase, or called case library. Thus, CBR, deriving from hu-man cognitive science, emphasizes reuse of past experienceand wisdom. This mechanism is particularly suitable to thefield whose theorem is difficult to be expressed as reason-ing rules but is easy to be represented as cases that can beabundantly accumulated, such as the field of business fore-casting. The use of CBR in business forecasting belongsto the type of supervised learning. Each stored experiencedcase has a corresponding solution, i.e. a case class label forbusiness forecasting. The known class labels of experiencedcases are used to guild further problem solving.
∗Corresponding author. Email: [email protected]
Clustering analysis is an important research topic in thedomain of data mining. This method classifies samples ac-cording to their data characteristics and relationships, withthe goal that samples in the same clustered class have largevalue of similarity and samples in different clustered classesare extraneous to each other. The advantages of clusteringanalysis include the following points: (1) The processing isquick in terms of time cost; and the time required is linearlycorrelated with the number of samples. Thus, clustering isable to process massive data with numerous dimensionsexcellently. (2) No distribution assumption is required forinput samples, which makes clustering very applicable inbusiness area. (3) The result has no relation with the order ofthe data inputted, which makes clustering stable in problemsolving. Clustering is an unsupervised learning approach.When using clustering in CBR, the corresponding solu-tions of stored experienced cases are not used. Only sample
C© 2012 Taylor & Francis
Dow
nloa
ded
by [
Penn
sylv
ania
Sta
te U
nive
rsity
] at
11:
38 1
1 A
ugus
t 201
4
1226 H. Li et al.
characteristics are used when clustering experienced casesinto various clustered case classes. The clustered caseclasses from unsupervised process are not surely the samevalues as the actual solutions of cases. Clustered case classis generated from the unsupervised process of clustering ex-perienced cases, and case class label is the actual solutionof a case for supervised learning.
Business failure prediction (BFP) is a vital problemin business forecasting. Every enterprise is described byavailable financial ratios and a case base will be generatedthrough collecting a certain number of failed enterprisesamples and non-failed samples. The business status of atarget case is forecasted by retrieving similar stored experi-enced cases from case base and reusing the correspondingcase class labels. If an enterprise is forecasted to fail, CBRis able to illustrate why and how to solve it for decisionmakers if the solving solutions are available for the re-trieved similar cases. Thus, CBR is particularly suitable forsolving the problem of BFP.
In real-world tasks, data are usually imbalanced (Kim2007). For example, the number of the failed enterprisesis smaller than the number of non-failed ones. Commonly,the majority of firms will survive through effective op-erations, while the minority of firms will fall into busi-ness failure when they fail to operate the firms success-fully. However, the loss is huge when an enterprise fails,which will cause loss to managers, investors, employeesand consumers of the firm. Series failures of large firmsare even able to cause economic crisis, which is witnessedby the global financial crisis happened a few years ago.However, when using CBR in BFP, the situation of im-balanced samples should be handled. Classical CBR maynot perform well on imbalanced samples. Therefore, it isnecessary to develop an effective CBR method which fore-casts business status well for this small part of failed enter-prises, and meanwhile which is able to generate high totalaccuracy.
Motivated by the necessity of providing a CBR methodfor BFP which is able to handle the situation of imbal-anced samples from real world effectively, this article de-veloped a method called clustering-based CBR (CBCBR)which integrates clustering analysis into CBR to solve thisproblem. CBCBR is a hybrid method through combiningunsupervised process with supervised process. In CBCBR,various clustered case classes are generated through hierar-chical clustering inside stored experienced cases. Centresof each clustered case class are calculated out by integrat-ing information of experienced cases in the same clusteredcase class. The nearest clustered case class to the targetcase is firstly retrieved by ranking similarities between thetarget case and each clustered case class centre. Then, val-ues of actual case class labels of nearest neighbours in theretrieved clustered case class are used to generate a pre-diction. Experimental results show that CBCBR performedsignificantly better in terms of sensitivity for identifying the
minority samples and the performance of generating hightotal accuracy.
The paper is organized as follows. Section 2 gives anoverview of prediction with imbalanced data sets and theapplication of clustering analysis in CBR. Section 3 designsspecific approaches of CBCBR. The data sets applied ascase base and features/variables are described in Section 4.Section 5 introduces the method of data pre-processingand performance evaluation. Section 6 presents the experi-mental results and analysis. Finally, Section 7 draws someconclusions and describes the limitations.
2. Literature review
2.1. Processing imbalanced samples
The information revealed from minority samples is insuffi-cient compared to that from majority samples. Many meth-ods developed with the assumption of balanced samples donot perform well in identifying the minority samples if thedata set is an imbalanced one consisting of minority andmajority samples. They yield to over-fit the informationfrom majority sample, which leads to misclassifying lots ofminority sample. However, minority samples usually playan important role. Some examples are as follows: the recog-nition of cheating in credit card transaction, the predictionof telecommunication equipment failure and the forecastof business failure, among others. Hence, explorations formethods suitable for imbalanced samples are becoming ahot research topic. Approaches for processing imbalancedsamples can be classified into two types, namely, data pro-cessing method and model adjustment method.
Exploration on pre-processing imbalanced samples todeal with the problem of imbalanced data sets is necessary(Fernandez, Garcıa, Jesus, and Herrera 2008). Data process-ing for imbalanced samples changes the distribution of databy reducing the phenomena of imbalance. A representativemethod is random sampling, which rebuilds the data setthrough over-sampling or under-sampling. Over-samplingapproaches are to increase the number of minority samples.The simplest method in this category is randomly duplicat-ing minority samples directly. According to Batista, Prati,and Monard (2004), random over-sampling is very com-petitive to several more complex over-sampling methods inimproving model performance with imbalanced samples.This approach may cause the problem of over-fitting sincethis method does not add any new information to the mi-nority. While, under-sampling approaches are to cut downthe number of majority samples (Kubat and Matwin 1997).However, this type of approaches leads to losing some use-ful information and may cause a decrease on estimationperformance for the majority. Besides the use of random-ness in sampling, genetic algorithm is an alternative in con-structing under-sampling approach (Garcıa, Fernandez, andHerrera 2009).
Dow
nloa
ded
by [
Penn
sylv
ania
Sta
te U
nive
rsity
] at
11:
38 1
1 A
ugus
t 201
4
International Journal of Systems Science 1227
The adjustment of algorithm aims to improve the per-formance of a classifier constructed with the assumptionof balanced samples by introducing some revisions tothe specific algorithms for handling imbalanced samples.Thus, model adjustment has the characteristic of modeldependent, which is unlike the model-independent char-acteristic of data processing approaches. Some specificmeans are as follows: (1) Construction of new models un-der the assumption of imbalanced samples is an effectivemeans for imbalanced sample modelling. For example, Nu-groho, Kuroyanagi, and Iwata (2002), Huang, Yang, andKing (2006), Orriols-Puig and Bernado-Mansilla (2009)and Orriols-Puig, Bernado-Mansilla, Goldberg, Sastry, andLanzi (2009), respectively, developed competitive learn-ing network combined with multiple perceptions, a modelcalled biased minimax probability machine and learningclassifier systems to solve specific imbalanced tasks. (2)Revision of mature techniques under the assumption of im-balanced samples is an alternative. For example, focusingon imbalanced sample modelling with support vector ma-chine (SVM), Wu and Amari (2002), Wu and Chang (2003)and Nguwi and Cho (2010), respectively, employed adap-tive conformal transformation algorithm, kernel boundaryalignment algorithm and emergent self-organizing map toimprove SVM’s modelling ability on imbalanced samples.(3) Construction of cost-sensitive models for imbalancedsample modelling is another alternative. For example, bothLing and Sheng (2006) and Pendharkar (2009) made inves-tigations on this issue with the assumption that the costs ofdifferent classes are different.
2.2. The use of clustering analysis in CBR
The implementation of CBR commonly consists of caserepresentation, case retrieval, case revision and case retrain(Garrell, Golobardes, Bernado-Mansilla, and Llora 1999).Case base is the foundation of CBR, where all historicalcases are stored. The current use of clustering in CBR isto improve performance of CBR from the views of caseindexing, case retrieval and case base maintenance. Caseindexing refers to reduce the time needed for case retrieval.The use of clustering in case indexing aims to improveindexing efficiency. Case retrieval refers to retrieve similarcases from case base. The use of clustering in case retrievalaims to retrieve similar cases from case base faster. Casebase maintenance refers to add, delete and revise casesstored in case base. The use of clustering in case base aimsto reduce the volume of case base or manage stored casesin a more effective or efficient means. Related literaturesare reviewed as follows.
2.2.1. The use of clustering to improve efficiencyof case indexing
Kim and Han (2001) used self-organizing maps and learn-ing vector quantisation as a type of clustering analysis to
establish case index for CBR. Their experimental resultsshowed that clustering-based case indexing was superior toconventional indexing technique and inductive-based caseindexing technique in CBR. Similarly, Wang and Lin (2010)established a clustering-based case indexing technique byemploying a back-propagation network and genetic algo-rithm. Liu and Dong (2010) proposed a weighted featureC-means clustering algorithm to classify all primary casesin case base into several clusters, based on which they pre-sented a clustering-based case indexing. The shortcomingof using clustering in case indexing of case base is that theindexes are static. Further approaches should be involvedwhen new cases are added into the case base or old casesare deleted from case base.
2.2.2. The use of clustering to retrieve similarcases faster
Kuo, Wang, Hu, and Chou (2004) developed an ant systembased on clustering algorithm, and Kuo, Kuo, and Chen(2005) further adopted it for clustering cases in order toreduce the number of cases needed in searching. Chang,Fan, and Dzan (2010) generated a data pre-clustering ap-proach with fuzzy decision trees to assist case retrieval.With a group of adaptation rules, they transformed a largecase base to a small one, which greatly improved the re-trieval efficiency and reduced the time needed. Qiao andJiang (2011) designed a case retrieval algorithm whichmaps a target case to a similar case region. Zarandi, Razaee,and Karbasia (2011) used fuzzy clustering model for fuzzydata to facilitate case retrieval and reduce the time com-plexity of CBR. The main objective and function of as-sisting case retrieval with clustering is to reduce the timeneeded.
2.2.3. The use of clustering to maintain case base
The volume control of case base is the work of casebase maintenance. Geng, Xiao, Zu, and Cai (2005) applieddistanced-based clustering in determination of adding newcases and deleting old cases for maintaining case base.Perner (2006) attempted to maintain case library by con-ceptual clustering of graphs. Case library maintenance isan important issue in CBR. For case base maintenance,threshold values for each class of cases in a case base arecommonly set up to decide whether or not a new case shouldbe stored in the base.
2.3. The contribution of this research
Two necessity of the current research are as follows.
• From the views of CBR, the current research is valu-able for the following two reasons. (1) The objec-tive of injecting clustering into CBR of the current
Dow
nloa
ded
by [
Penn
sylv
ania
Sta
te U
nive
rsity
] at
11:
38 1
1 A
ugus
t 201
4
1228 H. Li et al.
research, namely, improving retrieval efficiency onimbalanced samples, is different from previous re-searches of cluster-based CBR, namely, improvingcase indexing efficiency, reducing retrieval time andreducing the volume of case base. (2) The above re-searches of clustering analysis and the use of cluster-ing in CBR are mostly on the assumption of balancedsamples. They commonly assumed that the numbersof positive and negative samples in training set arealmost the same. These methods are useful in mod-elling on balanced data sets. However, in real-wordtasks, data sets for specific problems are not alwaysbalanced. In fact, lots of real-world tasks are com-posed of imbalanced samples. Previous researchesseldom address prediction with CBR on imbalancedsamples, which limits the applicability of CBR inbusiness forecasting. Thus, it is necessary to developsome new CBR methods with the capability of pro-cessing imbalanced business samples.
• From the view of BFP, current researches aremainly on the assumption of balanced data sets, e.g.Atiya (2001), Bose (2006), Bose and Pal (2006),Chandra, Ravi, and Bose (2009), Estebanez, Valls,and Aler (2008), Li and Sun (2010, 2011), Quin-tana, Saez, Mochon, and Isasi (2008), Ryu and Yue(2005) and Youn and Gu (2010); namely, predictivemodels were constructed and trained on balancedsamples for forecasting business failure. The numberof failed firms is far smaller than that of non-failedfirms. The predictive models constructed on the as-sumptions of balanced samples do not perform wellon identifying failed firms. However, one failed firmwill bring lots of loss to people, e.g. investors, man-agers, employees, governmental officers. The draw-back of neglecting forecasting business failure onimbalanced samples will make the tool less useful inpractice. Thus, it is urgent to conduct researches onIBFP.
The contribution of this research is to pioneer an inves-tigation for imbalanced BFP by using clustering to adjustthe specific algorithm of CBR. To fulfil this objective, weproposed the CBCBR method for processing imbalancedsamples and applied it to forecast business failure. Beingdifferent from previous researches of integrating cluster-ing with CBR, results of clustering analysis are not usedto re-represent experienced cases to decrease the numberof cases in case base or to index experienced cases, whichdeduces the time needed in case retrieval. Instead, resultsof clustering are used to help CBR locate the most usefulexperienced cases related to the current problem more ac-curately from an imbalanced case base. This research helpsto push the methodology of CBR into a new stage, namely,imbalanced CBR, by combining clustering to process im-balanced samples with classical CBR. The use of CBCBR
to forecast business failure also helps to push the tool intothe new stage of IBFP, or called imbalanced bankruptcyprediction, imbalanced financial distress prediction, etc.
More generally, from above review on imbalance-oriented approaches, we can find that sampling approachesand model adjustment approaches are independently de-veloped for handling the problem of imbalanced samples.Imbalance-oriented approaches are valuable in improvingpredictive performance and reduce business loss. In thisresearch, we made an early investigation to combine bothof data processing and model adjustment approaches tohandle imbalance in BFP, namely, adjusting case retrievalalgorithm of CBR by re-sampling imbalanced BFP sam-ples with clustering on both majority and minority sam-ples. Clustering is an unsupervised process. CBR for BFPbelongs to a supervised process. CBCBR is constructed bycombining the unsupervised process with the supervisedprocess for solving the task of BFP on imbalanced sam-ples, which demonstrates the possibility and effectivenessof integrating both unsupervised process and supervisedprocess for business forecasting.
3. CBCBR: a hybrid approach from integratingunsupervised process with supervised process
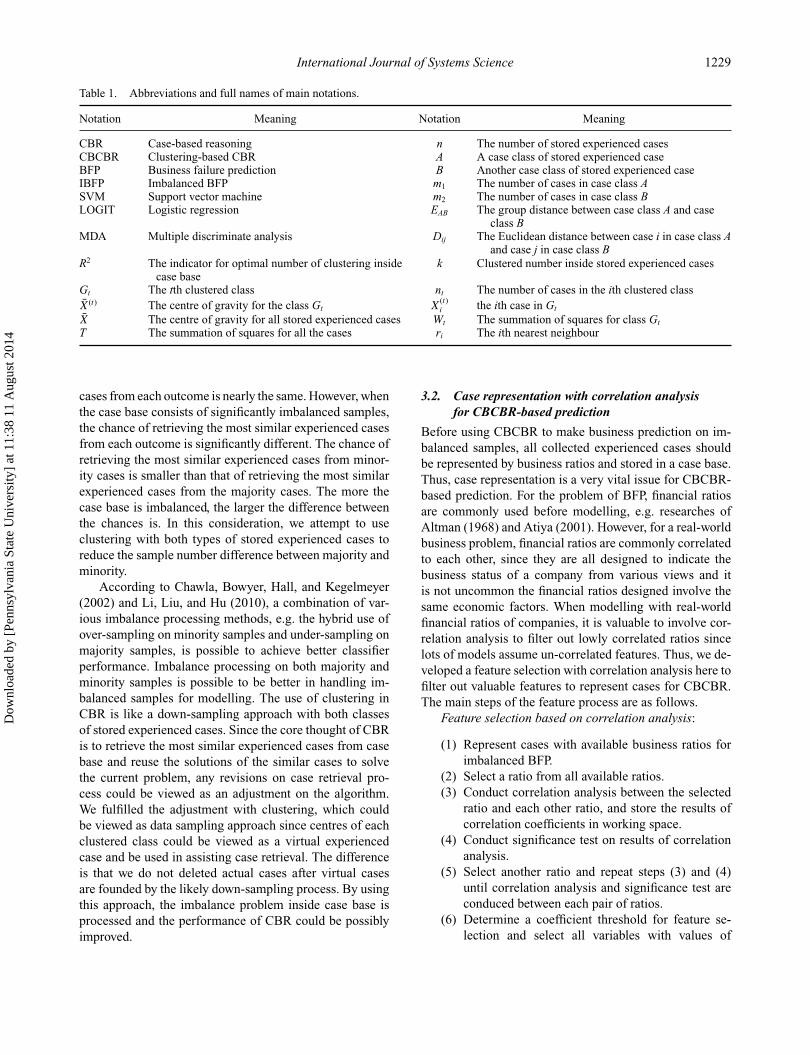
By injecting clustering analysis into CBR to process imbal-anced business samples, we chiefly focus on improving theefficiency of case retrieval in CBR on imbalanced data set.Clustering analysis is integrated with CBR to retrieve use-ful stored experienced cases from imbalanced business caselibrary. Accurate predictions can only be made by integrat-ing accurate similar stored experienced cases of the targetcase from case base. With this approach, we attempt to solvethe traditional CBR’s shortcoming of retrieving insufficientinformation from imbalanced case base for identifying mi-nority/failed cases. Case representation, case reuse and caseretain are the same as those of classical CBR. For better un-derstanding of this section, main abbreviations and theirfull names are listed in Table 1.
3.1. The working principle of CBCBR-basedprediction on imbalanced case base
The working principles of integrating clustering with CBRare as follows. The inside principle of CBR-based predic-tion is to retrieve several most similar stored experiencedcases to the current case and to use the solutions of themost similar stored experienced cases to estimate the out-put of the current case. Consider the situation that the cur-rent case is equally similar to the two types of cases, i.e.failed and non-failed cases. The summation of similaritiesof the current case to negative experienced cases is equalto the summation of similarities of the current case to posi-tive experienced cases. When the case base is composed ofbalanced samples, the chance of retrieving the most similar
Dow
nloa
ded
by [
Penn
sylv
ania
Sta
te U
nive
rsity
] at
11:
38 1
1 A
ugus
t 201
4
International Journal of Systems Science 1229
Table 1. Abbreviations and full names of main notations.
Notation Meaning Notation Meaning
CBR Case-based reasoning n The number of stored experienced casesCBCBR Clustering-based CBR A A case class of stored experienced caseBFP Business failure prediction B Another case class of stored experienced caseIBFP Imbalanced BFP m1 The number of cases in case class ASVM Support vector machine m2 The number of cases in case class BLOGIT Logistic regression EAB The group distance between case class A and case
class BMDA Multiple discriminate analysis Dij The Euclidean distance between case i in case class A
and case j in case class BR2 The indicator for optimal number of clustering inside
case basek Clustered number inside stored experienced cases
Gt The tth clustered class nt The number of cases in the ith clustered classX(t) The centre of gravity for the class Gt X
(t)i the ith case in Gt
X The centre of gravity for all stored experienced cases Wt The summation of squares for class Gt
T The summation of squares for all the cases ri The ith nearest neighbour
cases from each outcome is nearly the same. However, whenthe case base consists of significantly imbalanced samples,the chance of retrieving the most similar experienced casesfrom each outcome is significantly different. The chance ofretrieving the most similar experienced cases from minor-ity cases is smaller than that of retrieving the most similarexperienced cases from the majority cases. The more thecase base is imbalanced, the larger the difference betweenthe chances is. In this consideration, we attempt to useclustering with both types of stored experienced cases toreduce the sample number difference between majority andminority.
According to Chawla, Bowyer, Hall, and Kegelmeyer(2002) and Li, Liu, and Hu (2010), a combination of var-ious imbalance processing methods, e.g. the hybrid use ofover-sampling on minority samples and under-sampling onmajority samples, is possible to achieve better classifierperformance. Imbalance processing on both majority andminority samples is possible to be better in handling im-balanced samples for modelling. The use of clustering inCBR is like a down-sampling approach with both classesof stored experienced cases. Since the core thought of CBRis to retrieve the most similar experienced cases from casebase and reuse the solutions of the similar cases to solvethe current problem, any revisions on case retrieval pro-cess could be viewed as an adjustment on the algorithm.We fulfilled the adjustment with clustering, which couldbe viewed as data sampling approach since centres of eachclustered class could be viewed as a virtual experiencedcase and be used in assisting case retrieval. The differenceis that we do not deleted actual cases after virtual casesare founded by the likely down-sampling process. By usingthis approach, the imbalance problem inside case base isprocessed and the performance of CBR could be possiblyimproved.
3.2. Case representation with correlation analysisfor CBCBR-based prediction
Before using CBCBR to make business prediction on im-balanced samples, all collected experienced cases shouldbe represented by business ratios and stored in a case base.Thus, case representation is a very vital issue for CBCBR-based prediction. For the problem of BFP, financial ratiosare commonly used before modelling, e.g. researches ofAltman (1968) and Atiya (2001). However, for a real-worldbusiness problem, financial ratios are commonly correlatedto each other, since they are all designed to indicate thebusiness status of a company from various views and itis not uncommon the financial ratios designed involve thesame economic factors. When modelling with real-worldfinancial ratios of companies, it is valuable to involve cor-relation analysis to filter out lowly correlated ratios sincelots of models assume un-correlated features. Thus, we de-veloped a feature selection with correlation analysis here tofilter out valuable features to represent cases for CBCBR.The main steps of the feature process are as follows.
Feature selection based on correlation analysis:
(1) Represent cases with available business ratios forimbalanced BFP.
(2) Select a ratio from all available ratios.(3) Conduct correlation analysis between the selected
ratio and each other ratio, and store the results ofcorrelation coefficients in working space.
(4) Conduct significance test on results of correlationanalysis.
(5) Select another ratio and repeat steps (3) and (4)until correlation analysis and significance test areconduced between each pair of ratios.
(6) Determine a coefficient threshold for feature se-lection and select all variables with values of
Dow
nloa
ded
by [
Penn
sylv
ania
Sta
te U
nive
rsity
] at
11:
38 1
1 A
ugus
t 201
4
1230 H. Li et al.
all correlation coefficients no larger than thethreshold.
(7) Use selected ratios to represent collected experi-enced cases and target case.
3.3. The process of generating case classes inCBCBR: the unsupervised process
Case classes are generated by injecting clustering analysisinto CBR, and the main steps are as follows.
Generating case classes in CBCBR:
(1) Assume that each case represents a case class by it-self. The number of the initial case class is assumedto be n if there are n cases in case base.
(2) Measure distances between each pair of case classesby Euclidean distance and combine the nearest twocase classes to be one case class. Then, the numberof case class becomes n-1.
(3) The rest of n-1 case classes are measured by groupdistance, which is defined as follows. And the near-est two case classes are also combined to be onecase class. For a case class A composed by m1 casesand a case class B composed by m2 cases, mark theirdistance of group distance as EAB, where Dij ex-presses the Euclidean distance between case i (i = 1,2, . . ., m1) in case class A and case j (j = 1, 2, . . . ,m2) in case class B.
EAB = 1
m1m2
m1∑
i=1
m2∑
j=1
Dij. (1)
(4) Repeat step (3) until all case classes have beencombined to be one biggest case class.
In clustering inside stored experienced cases, how manyclasses should be unsupervised generated in order to im-prove predictive performance of CBR should be deter-mined. The detailed process is illustrated as follows.
3.4. The choice of clustering number in CBCBR:optimising the unsupervised process
3.4.1. Clustering inside case base
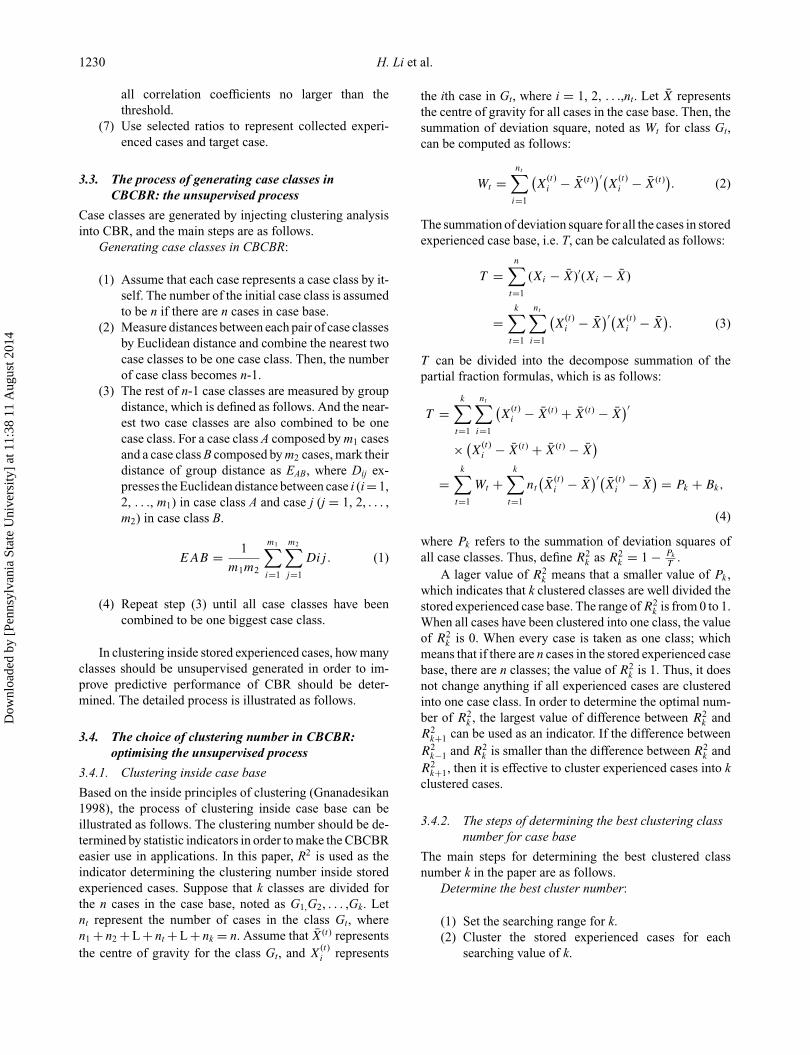
Based on the inside principles of clustering (Gnanadesikan1998), the process of clustering inside case base can beillustrated as follows. The clustering number should be de-termined by statistic indicators in order to make the CBCBReasier use in applications. In this paper, R2 is used as theindicator determining the clustering number inside storedexperienced cases. Suppose that k classes are divided forthe n cases in the case base, noted as G1,G2, . . . ,Gk. Letnt represent the number of cases in the class Gt, wheren1 + n2 + L + nt + L + nk = n. Assume that X(t) representsthe centre of gravity for the class Gt, and X
(t)i represents
the ith case in Gt, where i = 1, 2, . . .,nt. Let X representsthe centre of gravity for all cases in the case base. Then, thesummation of deviation square, noted as Wt for class Gt,can be computed as follows:
Wt =nt∑
i=1
(X
(t)i − X(t)
)′(X
(t)i − X(t)
). (2)
The summation of deviation square for all the cases in storedexperienced case base, i.e. T, can be calculated as follows:
T =n∑
t=1
(Xi − X)′(Xi − X)
=k∑
t=1
nt∑
i=1
(X
(t)i − X
)′(X
(t)i − X
). (3)
T can be divided into the decompose summation of thepartial fraction formulas, which is as follows:
T =k∑
t=1
nt∑
i=1
(X
(t)i − X(t) + X(t) − X
)′
× (X
(t)i − X(t) + X(t) − X
)
=k∑
t=1
Wt +k∑
t=1
nt
(X
(t)i − X
)′(X
(t)i − X
) = Pk + Bk,
(4)
where Pk refers to the summation of deviation squares ofall case classes. Thus, define R2
k as R2k = 1 − Pk
T.
A lager value of R2k means that a smaller value of Pk ,
which indicates that k clustered classes are well divided thestored experienced case base. The range of R2
k is from 0 to 1.When all cases have been clustered into one class, the valueof R2
k is 0. When every case is taken as one class; whichmeans that if there are n cases in the stored experienced casebase, there are n classes; the value of R2
k is 1. Thus, it doesnot change anything if all experienced cases are clusteredinto one case class. In order to determine the optimal num-ber of R2
k , the largest value of difference between R2k and
R2k+1 can be used as an indicator. If the difference between
R2k−1 and R2
k is smaller than the difference between R2k and
R2k+1, then it is effective to cluster experienced cases into k
clustered cases.
3.4.2. The steps of determining the best clustering classnumber for case base
The main steps for determining the best clustered classnumber k in the paper are as follows.
Determine the best cluster number:
(1) Set the searching range for k.(2) Cluster the stored experienced cases for each
searching value of k.
Dow
nloa
ded
by [
Penn
sylv
ania
Sta
te U
nive
rsity
] at
11:
38 1
1 A
ugus
t 201
4
International Journal of Systems Science 1231
(3) Evaluate every clustered result with R2k and choose
the best value of k, according to the differencesbetween each pair of R2
k and R2k+1.
In the current paper, the searching range for k is from√n to n/2, where n represents the number of cases in train-
ing set, i.e. the stored experienced case base. In classicalclustering, the searching range for k is usually confined tobe form 2 to
√n (Zhang, Wang, and Chai 2009). And a case
which belongs to none of any classes is often taken as noisyand interferential case, and is removed from the data set(Geng et al. 2005). While integrating clustering with CBR,the noisy case may become very important as it may be thepivotal case. The expansion of the searching range will helpretain more extreme cases and making the case base moreuseful. Therefore, this paper set the searching range for theclustering number k to be from
√n to n/2.
3.4.3. The algorithm of selecting optimalclustering number
We use the following algorithm to implement the abovesteps.
The algorithm of cluster number optimisation://Obtain the number of stored experienced cases in the
training set n;For k = √
n to n/2//Cluster all stored experienced cases into k classesCluster(k, stored_experienced_cases);//Calculate the values of T and Bk
Get_distance(k);//Calculate the value of R2
k
Get_R2k (k);
EndFor k = √
n+ 1 to n/2//Calculate the difference between R2
k−1 and R2k
Compare (R2k−1, R2
k );EndFor k = √
n+ 1 to n/2//Rank the differences between each pair of R2
k−1 andR2
k , and get the biggest one and the corresponding value ofk.
Rank_difference (R2k−1, R2
k );End
3.5. Retrieval of case class and cases in CBCBR:the supervised process
After clustered case classes are generated and the optimalvalue of k (the number of clustered classes) is found, caseretrieval will be implemented in the following steps.
Case retrieval in CBCBR:
(1) Get k class centres by calculating the mean valueof each feature in each case class.
(2) Calculate the Euclidean distances between the tar-get case and each of the k class centres, and retrievethe most similar clustered case class by finding theclass centre which is most similar to the target case.
(3) Retrieve several nearest neighbours from the clus-tered case class whose case centre is the most sim-ilar to the target case.
(4) For binary prediction problem, whose labels are 0and 1, assume that the label value of the s near-est neighbours denotes as ri (here, i = 1, 2, . . . ,s). Num(ri = 1) expresses the number of nearestneighbours whose label values are 1. For a targetcase T0, assume the final prediction value as h0. Forthe condition that the number of cases in the mostsimilar case class, denoted as Q, is larger than s.Make prediction with retrieved stored experiencedcases by the following rule.
If Num(ri = 1) > (s + 1)/2 then h0 = 1 Else h0 = 0.
(5)For the situation that Q is smaller than s, all the Q casesshould be used as the nearest neighbours. Thus, the predic-tive rule is as follows:
If Num(ri = 1) > (Q + 1)/2 h0 = 1 Else h0 = 0. (6)
3.6. Differences between CBCBRand classical CBR
This paper proposed a CBCBR method which integratesconvergent hierarchical clustering into CBR to help retrievemore accurate information from imbalanced samples forprediction. CBCBR divides case base into several clusteredcase classes and obtains each class centre. Case class cen-tre is used to locate the set of the most similar experiencedcases to the target case. Then, the most similar cases to thetarget case are retrieved in the set of most similar experi-enced case class. Compared with CBCBR, CBR directlyretrieves the most similar experienced cases to the targetcase. Thus, (1) the most similar cases retrieved by classicalCBR may be not in the set of the most similar experiencedcase class. The retrieved most similar experienced cases byCBCBR and CBR are not the same, since different retrievalmechanism is involved. (2) The other difference is thatCBR may retrieve too much inaccurate information frommajority experienced samples, when case base consists ofmajority samples and minority samples. For example, con-sider the problem of IBFP and assume the actual label of thetarget case is failure. If CBR retrieves five neighbours fromcase library and there are only two most similar experiencedcases from failure, the prediction of the target case will benon-failure. This prediction is wrong since CBR retrievedthe other three wrong experienced cases just because thenumber of failed samples is too small. CBCBR will not
Dow
nloa
ded
by [
Penn
sylv
ania
Sta
te U
nive
rsity
] at
11:
38 1
1 A
ugus
t 201
4
1232 H. Li et al.
conduct this mistake, since CBCBR will not retrieve theother wrong information if there are only two historicalcases in the set of the most similar experienced case class.
4. Imbalanced samples and variables
Firms with two consecutive years’ negative net profit wereregarded as failed samples. The reasons are as follows:(1) Previous researches, e.g. Sun and Shenoy (2007) andWu and Gray (2010), in the area of business failure pre-diction consider firms with two consecutive years’ negativenet profit as failed samples. We followed their procedures.(2) Consider the actual situation of listed companies inChina. If a listed company has two consecutive years’ neg-ative net profit, it will be labelled ‘Specially Treated’ to in-dicate high risk of the firm to business people. The companywill be monitored more strictly on their public statementsand stock trades by Chinese Securities Regulatory Com-mission, and will be terminated from listing if it cannotachieve positive net income in the following year. Listedfirms with two years’ consecutive negative profit can beconsidered as samples that fail to operate. Thus, this typeof enterprises is taken as failed business samples.
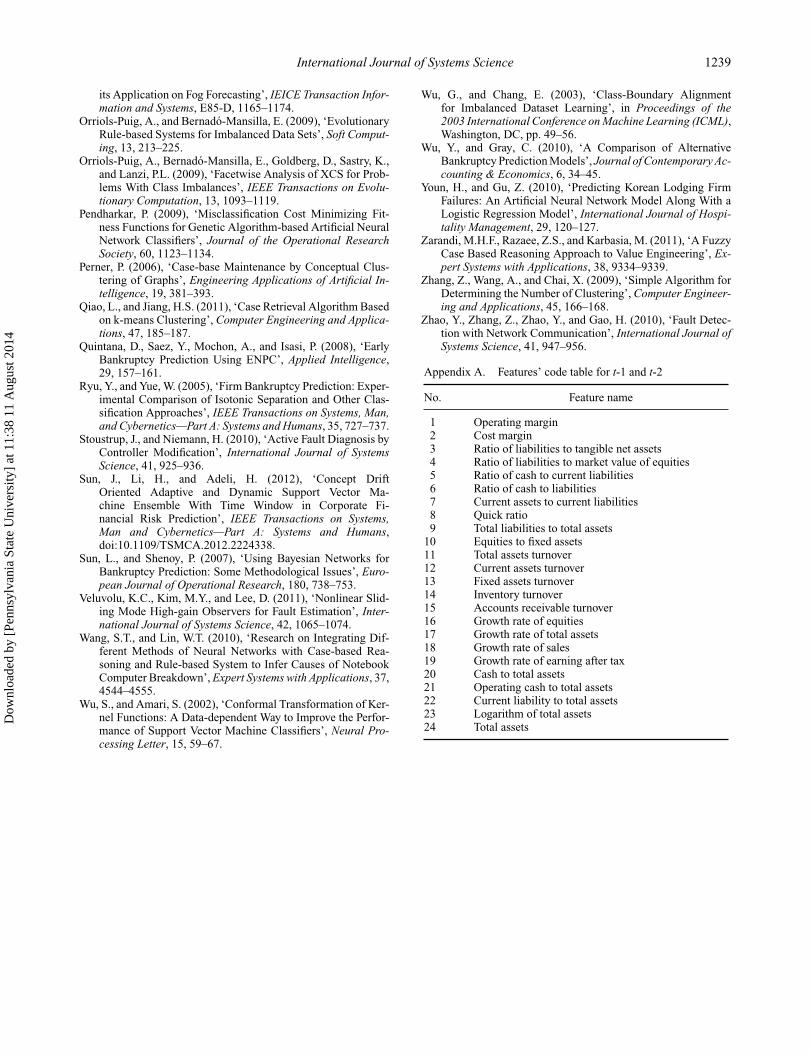
Assume that the year a firm failed is expressed as t. t-1and t-2 mean one year and two years before failure. In thet-1 and t-2 data sets, failed cases were collected and repre-sented by financial ratios one year prior to failure and twoyears prior to failure. And non-failed cases were collectedand represented with financial ratios in the same year withthe failed cases. Financial ratio values were obtained fromShenzhen Stock Exchange and Shanghai Stock Exchange.All cases belonged to manufacturing industry, since thisindustry is important to Chinese economic. Financial ratioswhich have direct relationships with net profit were removedto better test the prediction ability of each method. Detailedinformation about t-1 and t-2 data sets is listed in Table 2.
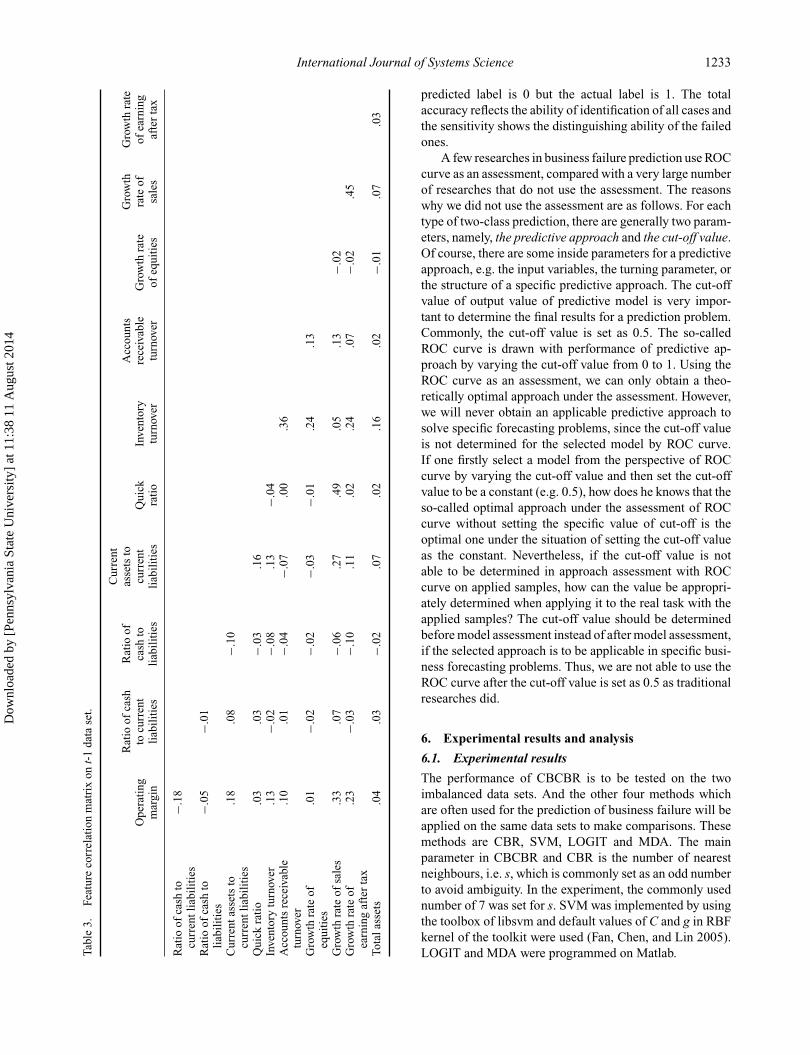
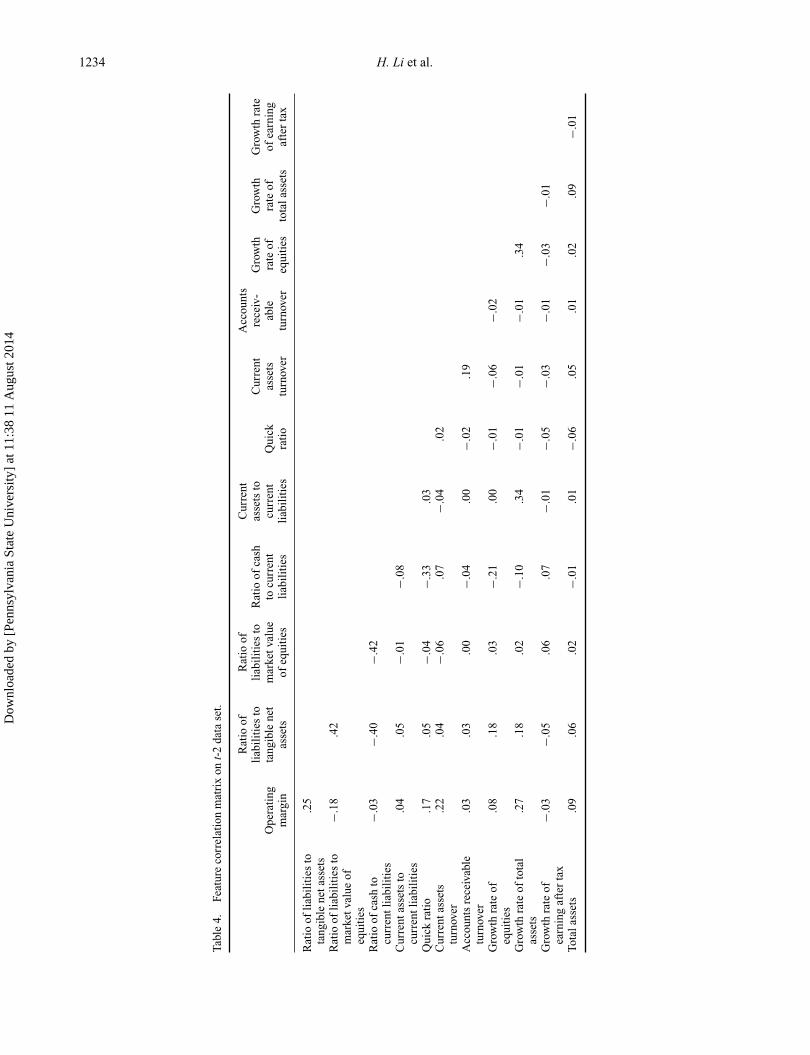
Results of correlation analysis and significance test oninitial features are put in the Appendices, and correlationcoefficients which are more than .5 are marked with redcolour. Highly correlated features in red were deleted insequence from the one with the largest value of correlationcoefficients to the one with the least value of correlationcoefficients. The final used features and feature correlationmetric between each pair of them for t-1 and t-2 data setsare presented in Tables 3 and 4. From the two tables, we canfind that the used features are less correlated to each other.
5. Data pre-processing and performance evaluation
5.1. Data pre-processing
Features with large values will dominate distance calcula-tion. However, features with large values are not the sameas features with large weights. In order to eliminate theinfluence of feature values, a normalization process wasimplemented. Assume Xij ′ is the original sample, X′
ij ′ isthe sample after pre-processing:
X′ij ′ = Xi ′j ′ − min(X•j ′ )
max(X•j ′) − min(X•j ′), (7)
where i = 1, 2, . . ... , n expresses the ith case, j′ = 1,2, . . .,p expresses j′th feature, max(X•j ′) and min(X•j ′) expressthe maximum and minimum values in feature j′.
5.2. Performance evaluation
A random sampling process was used for data division inhold-out method. One-third failed cases and 1/3 non-failedcases were selected randomly to constitute a set of tar-get cases. The other 2/3 failed cases and 2/3 non-failedcases constitute a case base. This random sampling pro-cess was repeated for 100 times to generate experimentalresults which make sense in statistics. In order to facilitateperformance evaluation, all labels of failed cases were setto be 1 and all labels of non-failed cases were set to be 0.Three measurements of performance evaluation were used,since we focus on improving the performance of identifyingfailed cases from failed ones while not decreasing the per-formance of total identification with imbalanced data sets.They are as follows:
Accuracy : ACC = (TP + TN)/(TP + TN + FP + FN),(8)
Sensitivity : TPR = TP/(TP + FN), (9)
Specificity : TNR = TN/(TN + FP), (10)
where TP refers to the hit times when both the predictedlabel and the actual are 1 and TN refers to the hit timeswhen both the predicted label and the actual are 0. FPrefers to the times when the predicted label is 1 butthe actual label is 0. FN refers to the times when the
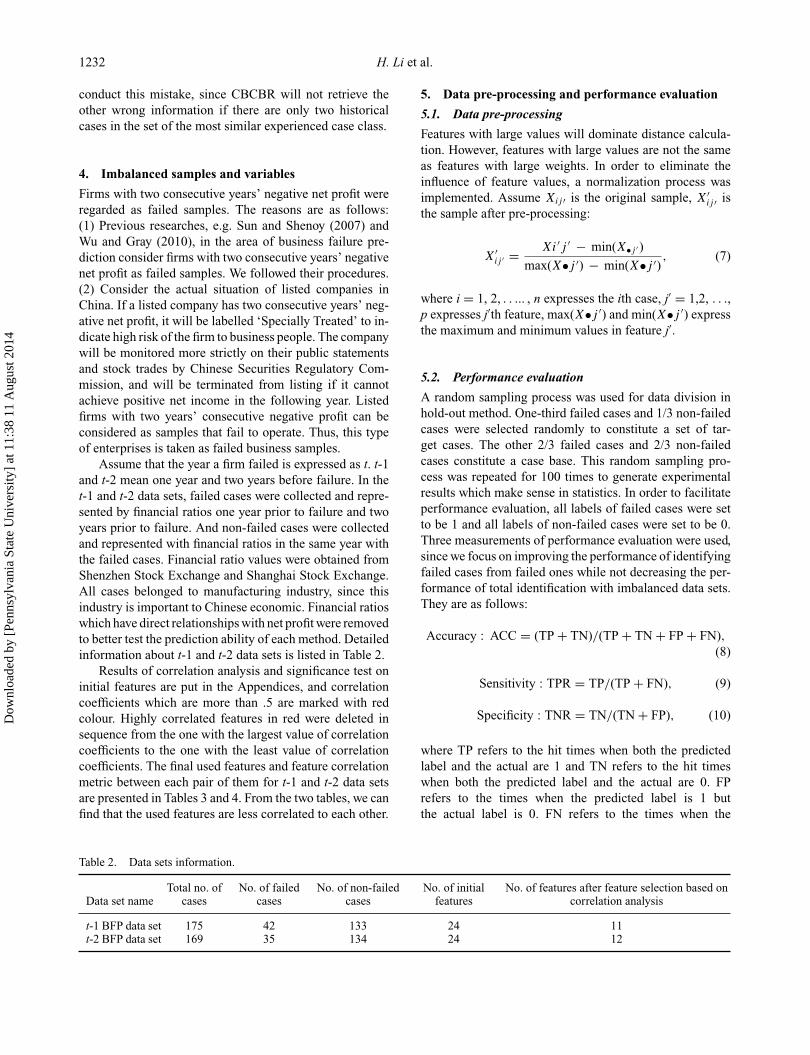
Table 2. Data sets information.
Data set nameTotal no. of
casesNo. of failed
casesNo. of non-failed
casesNo. of initial
featuresNo. of features after feature selection based on
correlation analysis
t-1 BFP data set 175 42 133 24 11t-2 BFP data set 169 35 134 24 12
Dow
nloa
ded
by [
Penn
sylv
ania
Sta
te U
nive
rsity
] at
11:
38 1
1 A
ugus
t 201
4
International Journal of Systems Science 1233
Tabl
e3.
Feat
ure
corr
elat
ion
mat
rix
ont-
1da
tase
t.
Ope
rati
ngm
argi
n
Rat
ioof
cash
tocu
rren
tli
abil
itie
s
Rat
ioof
cash
toli
abil
itie
s
Cur
rent
asse
tsto
curr
ent
liab
ilit
ies
Qui
ckra
tio
Inve
ntor
ytu
rnov
er
Acc
ount
sre
ceiv
able
turn
over
Gro
wth
rate
ofeq
uiti
es
Gro
wth
rate
ofsa
les
Gro
wth
rate
ofea
rnin
gaf
ter
tax
Rat
ioof
cash
tocu
rren
tlia
bili
ties
−.18
Rat
ioof
cash
toli
abil
itie
s−.
05−.
01
Cur
rent
asse
tsto
curr
entl
iabi
liti
es.1
8.0
8−.
10
Qui
ckra
tio
.03
.03
−.03
.16
Inve
ntor
ytu
rnov
er.1
3−.
02−.
08.1
3−.
04A
ccou
nts
rece
ivab
letu
rnov
er.1
0.0
1−.
04−.
07.0
0.3
6
Gro
wth
rate
ofeq
uiti
es.0
1−.
02−.
02−.
03−.
01.2
4.1
3
Gro
wth
rate
ofsa
les
.33
.07
−.06
.27
.49
.05
.13
−.02
Gro
wth
rate
ofea
rnin
gaf
ter
tax
.23
−.03
−.10
.11
.02
.24
.07
−.02
.45
Tota
lass
ets
.04
.03
−.02
.07
.02
.16
.02
−.01
.07
.03
predicted label is 0 but the actual label is 1. The totalaccuracy reflects the ability of identification of all cases andthe sensitivity shows the distinguishing ability of the failedones.
A few researches in business failure prediction use ROCcurve as an assessment, compared with a very large numberof researches that do not use the assessment. The reasonswhy we did not use the assessment are as follows. For eachtype of two-class prediction, there are generally two param-eters, namely, the predictive approach and the cut-off value.Of course, there are some inside parameters for a predictiveapproach, e.g. the input variables, the turning parameter, orthe structure of a specific predictive approach. The cut-offvalue of output value of predictive model is very impor-tant to determine the final results for a prediction problem.Commonly, the cut-off value is set as 0.5. The so-calledROC curve is drawn with performance of predictive ap-proach by varying the cut-off value from 0 to 1. Using theROC curve as an assessment, we can only obtain a theo-retically optimal approach under the assessment. However,we will never obtain an applicable predictive approach tosolve specific forecasting problems, since the cut-off valueis not determined for the selected model by ROC curve.If one firstly select a model from the perspective of ROCcurve by varying the cut-off value and then set the cut-offvalue to be a constant (e.g. 0.5), how does he knows that theso-called optimal approach under the assessment of ROCcurve without setting the specific value of cut-off is theoptimal one under the situation of setting the cut-off valueas the constant. Nevertheless, if the cut-off value is notable to be determined in approach assessment with ROCcurve on applied samples, how can the value be appropri-ately determined when applying it to the real task with theapplied samples? The cut-off value should be determinedbefore model assessment instead of after model assessment,if the selected approach is to be applicable in specific busi-ness forecasting problems. Thus, we are not able to use theROC curve after the cut-off value is set as 0.5 as traditionalresearches did.
6. Experimental results and analysis
6.1. Experimental results
The performance of CBCBR is to be tested on the twoimbalanced data sets. And the other four methods whichare often used for the prediction of business failure will beapplied on the same data sets to make comparisons. Thesemethods are CBR, SVM, LOGIT and MDA. The mainparameter in CBCBR and CBR is the number of nearestneighbours, i.e. s, which is commonly set as an odd numberto avoid ambiguity. In the experiment, the commonly usednumber of 7 was set for s. SVM was implemented by usingthe toolbox of libsvm and default values of C and g in RBFkernel of the toolkit were used (Fan, Chen, and Lin 2005).LOGIT and MDA were programmed on Matlab.
Dow
nloa
ded
by [
Penn
sylv
ania
Sta
te U
nive
rsity
] at
11:
38 1
1 A
ugus
t 201
4
1234 H. Li et al.
Tabl
e4.
Feat
ure
corr
elat
ion
mat
rix
ont-
2da
tase
t.
Ope
rati
ngm
argi
n
Rat
ioof
liab
ilit
ies
tota
ngib
lene
tas
sets
Rat
ioof
liab
ilit
ies
tom
arke
tval
ueof
equi
ties
Rat
ioof
cash
tocu
rren
tli
abil
itie
s
Cur
rent
asse
tsto
curr
ent
liab
ilit
ies
Qui
ckra
tio
Cur
rent
asse
tstu
rnov
er
Acc
ount
sre
ceiv
-ab
letu
rnov
er
Gro
wth
rate
ofeq
uiti
es
Gro
wth
rate
ofto
tala
sset
s
Gro
wth
rate
ofea
rnin
gaf
ter
tax
Rat
ioof
liab
ilit
ies
tota
ngib
lene
tass
ets
.25
Rat
ioof
liab
ilit
ies
tom
arke
tval
ueof
equi
ties
−.18
.42
Rat
ioof
cash
tocu
rren
tlia
bili
ties
−.03
−.40
−.42
Cur
rent
asse
tsto
curr
entl
iabi
liti
es.0
4.0
5−.
01−.
08
Qui
ckra
tio
.17
.05
−.04
−.33
.03
Cur
rent
asse
tstu
rnov
er.2
2.0
4−.
06.0
7−.
04.0
2
Acc
ount
sre
ceiv
able
turn
over
.03
.03
.00
−.04
.00
−.02
.19
Gro
wth
rate
ofeq
uiti
es.0
8.1
8.0
3−.
21.0
0−.
01−.
06−.
02
Gro
wth
rate
ofto
tal
asse
ts.2
7.1
8.0
2−.
10.3
4−.
01−.
01−.
01.3
4
Gro
wth
rate
ofea
rnin
gaf
ter
tax
−.03
−.05
.06
.07
−.01
−.05
−.03
−.01
−.03
−.01
Tota
lass
ets
.09
.06
.02
−.01
.01
−.06
.05
.01
.02
.09
−.01
Dow
nloa
ded
by [
Penn
sylv
ania
Sta
te U
nive
rsity
] at
11:
38 1
1 A
ugus
t 201
4
International Journal of Systems Science 1235
Table 5. Experimental results for different methods.
Data set and methods ACC (%) TPR (%) TNR (%)
t-1 CBCBR 97.95 93.29 99.43CBR 95.67 83.50 99.55SVM 86.69 46.29 99.55LOGIT 89.19 79.21 92.36MDA 91.72 83.86 94.23
t-2 CBCBR 92.73 72.55 97.77CBR 91.64 67.09 97.77SVM 84.78 29.00 98.73LOGIT 86.51 55.55 94.25MDA 84.15 45.45 93.82
Note: When performance of a method is the best in a column, the value is in bold; when performance of amethod is the second best in a column, the value is underlined.
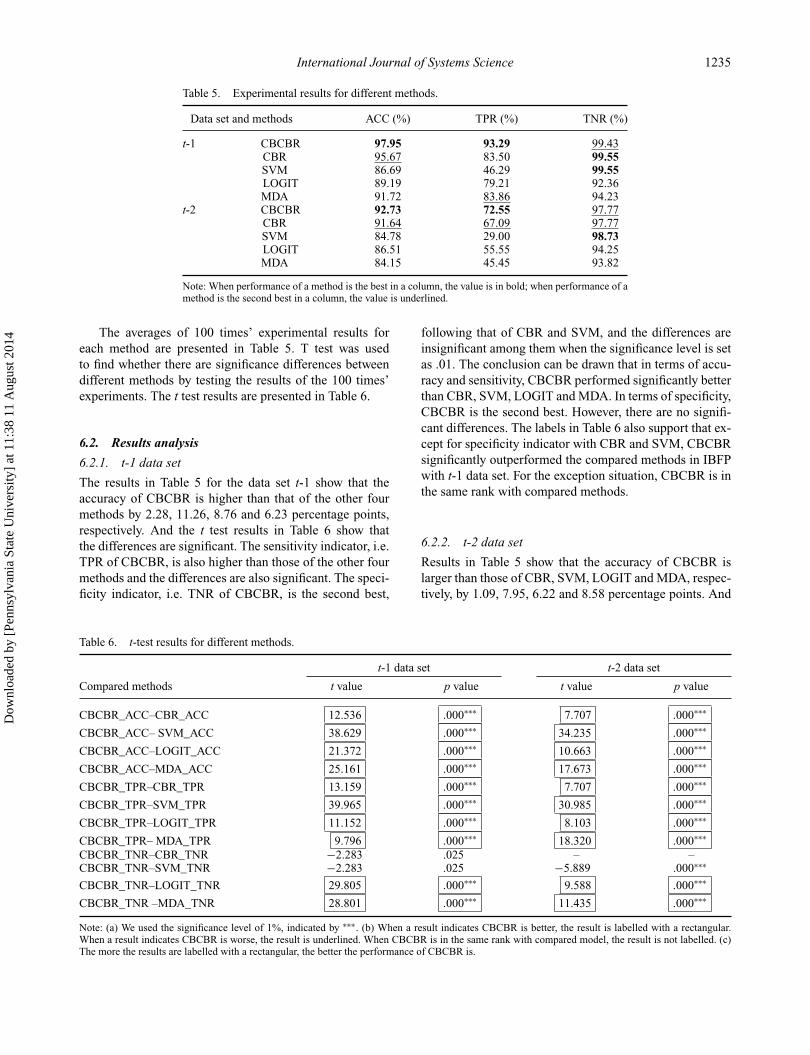
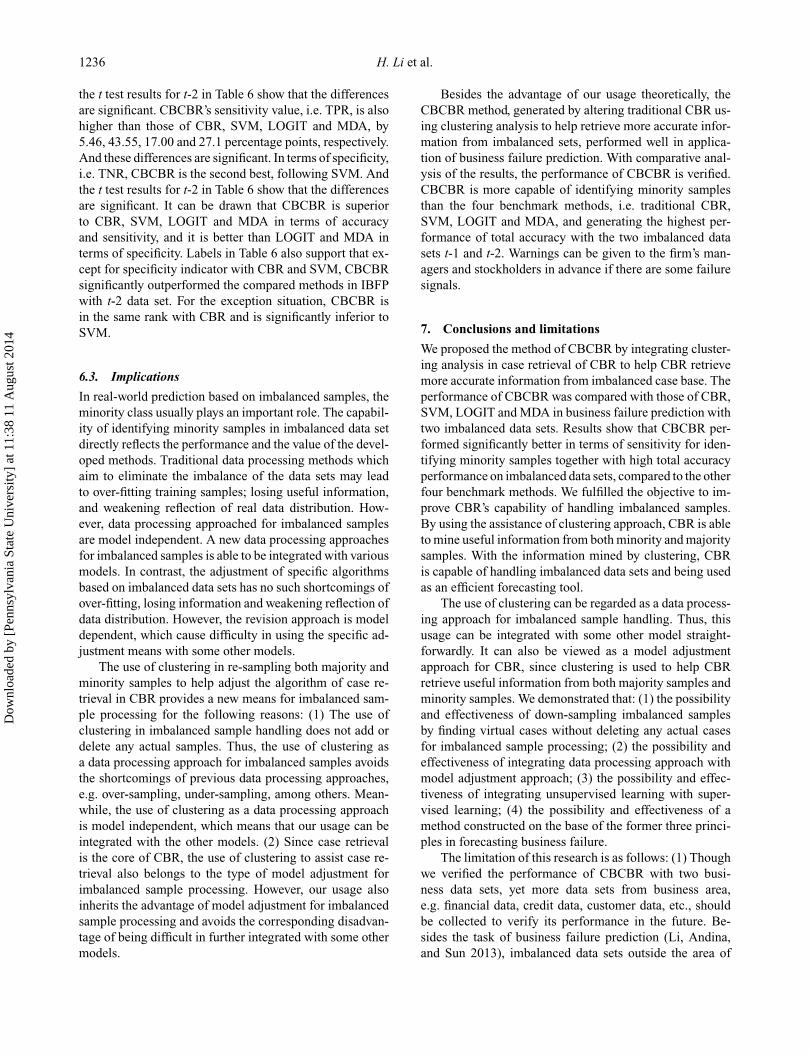
The averages of 100 times’ experimental results foreach method are presented in Table 5. T test was usedto find whether there are significance differences betweendifferent methods by testing the results of the 100 times’experiments. The t test results are presented in Table 6.
6.2. Results analysis
6.2.1. t-1 data set
The results in Table 5 for the data set t-1 show that theaccuracy of CBCBR is higher than that of the other fourmethods by 2.28, 11.26, 8.76 and 6.23 percentage points,respectively. And the t test results in Table 6 show thatthe differences are significant. The sensitivity indicator, i.e.TPR of CBCBR, is also higher than those of the other fourmethods and the differences are also significant. The speci-ficity indicator, i.e. TNR of CBCBR, is the second best,
following that of CBR and SVM, and the differences areinsignificant among them when the significance level is setas .01. The conclusion can be drawn that in terms of accu-racy and sensitivity, CBCBR performed significantly betterthan CBR, SVM, LOGIT and MDA. In terms of specificity,CBCBR is the second best. However, there are no signifi-cant differences. The labels in Table 6 also support that ex-cept for specificity indicator with CBR and SVM, CBCBRsignificantly outperformed the compared methods in IBFPwith t-1 data set. For the exception situation, CBCBR is inthe same rank with compared methods.
6.2.2. t-2 data set
Results in Table 5 show that the accuracy of CBCBR islarger than those of CBR, SVM, LOGIT and MDA, respec-tively, by 1.09, 7.95, 6.22 and 8.58 percentage points. And
Table 6. t-test results for different methods.
t-1 data set t-2 data set
Compared methods t value p value t value p value
CBCBR_ACC–CBR_ACC 12.536 .000∗∗∗ 7.707 .000∗∗∗
CBCBR_ACC– SVM_ACC 38.629 .000∗∗∗ 34.235 .000∗∗∗
CBCBR_ACC–LOGIT_ACC 21.372 .000∗∗∗ 10.663 .000∗∗∗
CBCBR_ACC–MDA_ACC 25.161 .000∗∗∗ 17.673 .000∗∗∗
CBCBR_TPR–CBR_TPR 13.159 .000∗∗∗ 7.707 .000∗∗∗
CBCBR_TPR–SVM_TPR 39.965 .000∗∗∗ 30.985 .000∗∗∗
CBCBR_TPR–LOGIT_TPR 11.152 .000∗∗∗ 8.103 .000∗∗∗
CBCBR_TPR– MDA_TPR 9.796 .000∗∗∗ 18.320 .000∗∗∗
CBCBR_TNR–CBR_TNR −2.283 .025 – –CBCBR_TNR–SVM_TNR −2.283 .025 −5.889 .000∗∗∗
CBCBR_TNR–LOGIT_TNR 29.805 .000∗∗∗ 9.588 .000∗∗∗
CBCBR_TNR –MDA_TNR 28.801 .000∗∗∗ 11.435 .000∗∗∗
Note: (a) We used the significance level of 1%, indicated by ∗∗∗. (b) When a result indicates CBCBR is better, the result is labelled with a rectangular.When a result indicates CBCBR is worse, the result is underlined. When CBCBR is in the same rank with compared model, the result is not labelled. (c)The more the results are labelled with a rectangular, the better the performance of CBCBR is.
Dow
nloa
ded
by [
Penn
sylv
ania
Sta
te U
nive
rsity
] at
11:
38 1
1 A
ugus
t 201
4
1236 H. Li et al.
the t test results for t-2 in Table 6 show that the differencesare significant. CBCBR’s sensitivity value, i.e. TPR, is alsohigher than those of CBR, SVM, LOGIT and MDA, by5.46, 43.55, 17.00 and 27.1 percentage points, respectively.And these differences are significant. In terms of specificity,i.e. TNR, CBCBR is the second best, following SVM. Andthe t test results for t-2 in Table 6 show that the differencesare significant. It can be drawn that CBCBR is superiorto CBR, SVM, LOGIT and MDA in terms of accuracyand sensitivity, and it is better than LOGIT and MDA interms of specificity. Labels in Table 6 also support that ex-cept for specificity indicator with CBR and SVM, CBCBRsignificantly outperformed the compared methods in IBFPwith t-2 data set. For the exception situation, CBCBR isin the same rank with CBR and is significantly inferior toSVM.
6.3. Implications
In real-world prediction based on imbalanced samples, theminority class usually plays an important role. The capabil-ity of identifying minority samples in imbalanced data setdirectly reflects the performance and the value of the devel-oped methods. Traditional data processing methods whichaim to eliminate the imbalance of the data sets may leadto over-fitting training samples; losing useful information,and weakening reflection of real data distribution. How-ever, data processing approached for imbalanced samplesare model independent. A new data processing approachesfor imbalanced samples is able to be integrated with variousmodels. In contrast, the adjustment of specific algorithmsbased on imbalanced data sets has no such shortcomings ofover-fitting, losing information and weakening reflection ofdata distribution. However, the revision approach is modeldependent, which cause difficulty in using the specific ad-justment means with some other models.
The use of clustering in re-sampling both majority andminority samples to help adjust the algorithm of case re-trieval in CBR provides a new means for imbalanced sam-ple processing for the following reasons: (1) The use ofclustering in imbalanced sample handling does not add ordelete any actual samples. Thus, the use of clustering asa data processing approach for imbalanced samples avoidsthe shortcomings of previous data processing approaches,e.g. over-sampling, under-sampling, among others. Mean-while, the use of clustering as a data processing approachis model independent, which means that our usage can beintegrated with the other models. (2) Since case retrievalis the core of CBR, the use of clustering to assist case re-trieval also belongs to the type of model adjustment forimbalanced sample processing. However, our usage alsoinherits the advantage of model adjustment for imbalancedsample processing and avoids the corresponding disadvan-tage of being difficult in further integrated with some othermodels.
Besides the advantage of our usage theoretically, theCBCBR method, generated by altering traditional CBR us-ing clustering analysis to help retrieve more accurate infor-mation from imbalanced sets, performed well in applica-tion of business failure prediction. With comparative anal-ysis of the results, the performance of CBCBR is verified.CBCBR is more capable of identifying minority samplesthan the four benchmark methods, i.e. traditional CBR,SVM, LOGIT and MDA, and generating the highest per-formance of total accuracy with the two imbalanced datasets t-1 and t-2. Warnings can be given to the firm’s man-agers and stockholders in advance if there are some failuresignals.
7. Conclusions and limitations
We proposed the method of CBCBR by integrating cluster-ing analysis in case retrieval of CBR to help CBR retrievemore accurate information from imbalanced case base. Theperformance of CBCBR was compared with those of CBR,SVM, LOGIT and MDA in business failure prediction withtwo imbalanced data sets. Results show that CBCBR per-formed significantly better in terms of sensitivity for iden-tifying minority samples together with high total accuracyperformance on imbalanced data sets, compared to the otherfour benchmark methods. We fulfilled the objective to im-prove CBR’s capability of handling imbalanced samples.By using the assistance of clustering approach, CBR is ableto mine useful information from both minority and majoritysamples. With the information mined by clustering, CBRis capable of handling imbalanced data sets and being usedas an efficient forecasting tool.
The use of clustering can be regarded as a data process-ing approach for imbalanced sample handling. Thus, thisusage can be integrated with some other model straight-forwardly. It can also be viewed as a model adjustmentapproach for CBR, since clustering is used to help CBRretrieve useful information from both majority samples andminority samples. We demonstrated that: (1) the possibilityand effectiveness of down-sampling imbalanced samplesby finding virtual cases without deleting any actual casesfor imbalanced sample processing; (2) the possibility andeffectiveness of integrating data processing approach withmodel adjustment approach; (3) the possibility and effec-tiveness of integrating unsupervised learning with super-vised learning; (4) the possibility and effectiveness of amethod constructed on the base of the former three princi-ples in forecasting business failure.
The limitation of this research is as follows: (1) Thoughwe verified the performance of CBCBR with two busi-ness data sets, yet more data sets from business area,e.g. financial data, credit data, customer data, etc., shouldbe collected to verify its performance in the future. Be-sides the task of business failure prediction (Li, Andina,and Sun 2013), imbalanced data sets outside the area of
Dow
nloa
ded
by [
Penn
sylv
ania
Sta
te U
nive
rsity
] at
11:
38 1
1 A
ugus
t 201
4

International Journal of Systems Science 1237
business forecasting are also valuable to be used, in order tomake CBCBR applicable in some other areas, e.g. electricload forecasting (Alfares and Nazeeruddin 2002), imagerecognition (Buchala, Davey, Gale, and Frank 2005), faultdetection (Desforges, Jacob, and Ball 2000; Stoustrup andNiemann 2010; Zhao, Zhang, Zhao, and Gao 2010; Habbi,Kidouche, Kinnaert, and Zelmat 2011; He, Wang, Ji, andZhou 2011; Veluvolu, Kim, and Lee 2011), dynamic finan-cial risk prediction (Sun, Li, and Adeli 2012), among others.(2) After the performance of CBR is enhanced on predic-tion on imbalanced samples, further investigations shouldbe conducted on performance of the CBCBR with someother imbalance-oriented approaches. (3) It is valuable touse CBCBR with some balanced samples to see if CBCBRis capable of handling balanced samples efficiently. (4) Itis valuable to extending the usage of clustering as a dataprocessing approach for imbalanced sample handling withsome other predictive models, e.g. SVM, neural network,Bayesian models and decision tree, among others.
AcknowledgementsThis research is partially supported by the National Natural Sci-ence Foundation of China (Grant Nos. 71171179 and 90924024),the Zhejiang Provincial Philosophy and Social Science Founda-tion of China (Grant Nos. 11ZJQN081YB and 11ZJQN082YB,the QianJiang Young Talent Project of Zhejiang Province for So-cial Science (Grant No. 201112P3434#) granted by ZheRenSheFa[2011] 367#, and the National Science Fund for DistinguishedYoung Scholars (Grant No. 71025005). The authors gratefullythank anonymous referees for their useful comments, recommen-dations and editors for their work.
Notes on contributorsHui Li received his BS, MS and PhD de-grees all with honours from Harbin Instituteof Technology (HIT), Harbin, Heilongjiang,China. The author’s major field of study in-cludes case-based reasoning, business fore-casting, business computing, business datamining and business intelligence, amongothers. He is currently a professor of Zhe-jiang Normal University, Jinhua, Zhejiang,
China and was a visiting scholar of The Ohio State University,Columbus, OH, US. His 50+ researches were or will be publishedin African Journal of Business Management, Annals of Manage-ment Science, Applied Soft Computing, Computers & IndustrialEngineering, Computers & Operations Research, European Jour-nal of Operational Research, Expert Systems—The Journal ofKnowledge Engineering, Expert Systems with Applications, IEEETransactions on Systems, Man and Cybernetics—Part A, Informa-tion & Management, Information Sciences, International Journalof Systems Science, Journal of Forecasting, Knowledge-BasedSystems, Recent Patents on Computers Science, Technologicaland Economic Development of Economy, Tourism Management,among others. Dr Li is a young researcher of World Federationon Soft Computing, a member of Association for InformationSystems, a member of the Professional Risk Managers’ Interna-tional Association and a Zhijiang Young Talent in Social Science.He led six national and provincial fundings, and serves as Inter-national Committee Member of several international conferences,
Editorial Board Member of several international journals, e.g. An-nals of Management Science, and referees of many leading jour-nals. He received the Outstanding MS Dissertation Award of HITin 2004, the Outstanding MS Dissertation Award of HeilongjiangProvince in 2006, the Outstanding PhD Dissertation Award ofHIT in 2009, the Award of Outstanding Young Talents of Zhe-jiang Province in 2009, the Science Research Awards of ZhejiangProvincial Universities in 2010, 2011 and 2013, the Social ScienceResearch Awards of Jinhua in 2010 and 2012, the Outstanding Re-search Project Award and the Outstanding Research Paper Awardof “ShiYiWu” Zhejiang Provincial Natural Science Foundation ofChina, and is listed on Marquis Who’s Who in the World since2010.
Jun-Ling Yu received her BS degree fromHenan University of Science and Technol-ogy, Luoyang, Henan, China, and receivedher MS degree from Zhejiang Normal Uni-versity, Jinhua, Zhejiang, China. The au-thor’s major study field includes businessforecasting, business intelligence, and case-based reasoning. Her researches were or willbe published in International Journal of Sys-
tems Science, Recent Patents on Computer Science, etc. She re-ceived the fostering funding of outstanding MS dissertation fromZhejiang Normal University.
Le-An Yu received the PhD degree in Man-agement Science and Engineering from theAcademy of Mathematics and Systems Sci-ence, Chinese Academy of Sciences (CAS),Beijing in 2005. He has published morethan 50 papers in journals including AppliedSoft Computing, Computers & OperationsResearch, Decision Support Systems, IEEETransactions on Evolutionary Computation,
IEEE Transactions on Knowledge and Data Engineering, EnergyEconomics, European Journal of Operational Research, ExpertSystems with Applications, Information Fusion, Information Sci-ences, International Journal of Intelligent Systems, Neurocomput-ing, etc. He is currently a professor and the Dean of the Schoolof Economics and Management, Beijing University of ChemicalTechnology. His research interests include business intelligence,computer simulation, decision support systems, knowledge man-agement and financial forecasting. He received the funding of theChina National Funds for Distinguished Young Scientists and theNational Youth Outstanding Talent Support Program.
Jie Sun received her BS, MS and PhDdegrees with honours from Harbin Insti-tute of Technology, Harbin, China. The au-thor’s major field of study includes finan-cial risk management, neural networks ineconomics, concept drift and financial in-telligence. She is an associate professor ofZhejiang Normal University, Jinhua, Zhe-jiang, China, and a guest professor of Dong-
guk University, Gyeongju, Korea. Her research studies were pub-lished or will appear in Applied Soft Computing, Computers &Operations Research, Expert Systems with Applications, IEEETransactions on Systems, Man and Cybernetics—Part A, Informa-tion & Management, Intelligent Systems in Accounting, Financeand Management, Knowledge-Based Systems, Recent Patents onComputers Science, Technological and Economic Development ofEconomy, Tourism Management, etc. Her current research inter-est is imbalance computing, concept drift oriented support vector
Dow
nloa
ded
by [
Penn
sylv
ania
Sta
te U
nive
rsity
] at
11:
38 1
1 A
ugus
t 201
4
1238 H. Li et al.
machine ensemble in financial crisis management. She servesas principal investigators of several national funded researchprojects: including the National Natural Science Foundation ofChina, the Zhejiang Provincial Natural Science Foundation ofChina, and Zhejiang Provincial Philosophy and Social ScienceFoundation of China. She received the Outstanding MS Disser-tation Award of HIT in 2004, the Outstanding PhD DissertationAward of HIT in 2008, the Science Research Awards of ZhejiangProvincial Universities in 2010, 2011, and 2013 and the SocialScience Research Awards of Jinhua City in 2010 and 2012. She islisted in the Marquis Who’s Who in the World since 2010.
ReferencesAlfares, H., and Nazeeruddin, M. (2002), ‘Electric Load Fore-
casting: Literature Survey and Classification of Methods’,International Journal Systems Science, 33, 931–942.
Altman, E.I. (1968), ‘Financial Ratios, Discriminate Analysis andthe Prediction of Corporate Bankruptcy’, Journal of Finance,23, 589–609.
Atiya, A.F. (2001), ‘Bankruptcy Prediction for Credit Risk usingNeural Network: A Survey and New Results’, IEEE Transac-tions on Neural Networks, 12, 929–935.
Batista, G.E., Prati, R.C., and Monard, M.C. (2004), ‘A Studyof the Behavior of Several Methods for Balancing Ma-chine Learning Training Data’, SIGKDD Explorations, 6, 20–29.
Bose, I. (2006), ‘Deciding the Financial Health of Dot-coms UsingRough Sets’, Information & Management, 43, 835–846.
Bose, I., and Pal, R. (2006), ‘Predicting the Survival or Failureof Click-and-mortar Corporations: A Knowledge DiscoveryApproach’, European Journal of Operational Research, 174,959–982.
Buchala, S, Davey, N, Gale, T., and Frank, R. (2005), ‘Analysis ofLinear and Nonlinear Dimensionality Reduction Methods forGender Classification of Face Images’, International JournalSystems Science, 36, 931–942.
Chandra, D., Ravi, V., and Bose, I. (2009), ‘Failure Predictionof Dotcom Companies Using Hybrid Intelligent Techniques’,Expert Systems with Applications, 36, 4830–4837.
Chang, P.C., Fan, C.Y., and Dzan, W.Y. (2010), ‘A CBR-basedFuzzy Decision Tree Approach for Database Classification’,Expert Systems with Applications, 37, 214–225.
Chawla, N., Bowyer, K., Hall, L., and Kegelmeyer, W. (2002),‘SMOTE: Synthetic Minority Over-Sampling Technique’,Journal of Artificial Intelligence Research, 16, 321–357.
Desforges, M.J., Jacob, P.J., and Ball, A.D. (2000), ‘Fault Detec-tion in Rotating Machinery Using Kernel-based ProbabilityDensity Estimation’, International Journal of Systems Sci-ence, 31, 1411–1426.
Estebanez, C., Valls, J.M., and Aler, R. (2008), ‘GPPE: A Methodto Generate Ad-hoc Feature Extractors for Prediction in Fi-nancial Domains’, Applied Intelligence, 29, 174–185.
Fan, R.-E., Chen, P.-H., and Lin, C.-J. (2005), ‘Working Set Se-lection Using Second Order Information for Training SVM’,Journal of Machine Learning Research, 6, 1889–1918.
Fernandez, A., Garcıa, S., Jesus, M.J., and Herrera, F. (2008),‘A Study of the Behavior of Linguistic Fuzzy Rule BasedClassification Systems in the Framework of Imbalanced Data-sets’, Fuzzy Sets and Systems, 159, 2378–2398.
Garcıa, S., Fernandez, A., and Herrera, F. (2009), ‘Enhancing theEffectiveness and Interpretability of Decision Tree and RuleInduction Classifiers With Evolutionary Training Set Selec-tion Over Imbalanced Problems’, Applied Soft Computing, 9,1304–1314.
Garrell, J.M., Golobardes, E., Bernado-Mansilla, E., and Llora, X.(1999), ‘Automatic Diagnosis with Genetic Algorithms andCase-Based Reasoning’, Artificial Intelligence in Engineer-ing, 13, 367–372.
Geng, H.T., Xiao, M.J., Zu, X., and Cai, Q.S. (2005), ‘Researchon Application of Clustering Algorithm in CBM’, ComputerEngineering, 31, 166–168.
Gnanadesikan, R. (1998), Discriminant Analysis and Clustering,Washington, DC: National Academy Press.
Habbi, H., Kidouche, M., Kinnaert, M., and Zelmat, M. (2011),‘Fuzzy Model-based Fault Detection and Diagnosis for a PilotHeat Exchanger’, International Journal of Systems Science,42, 587–599.
He, X., Wang, Z., Ji, Y., and Zhou, D. (2011), ‘Fault Detection forDiscrete-time Systems in a Networked Environment’, Inter-national Journal of Systems Science, 41, 957–970.
Huang, K.Z., Yang, H.Q., and King, I. (2006), ‘Correspon-dence: Imbalanced Learning with a Biased Minimax Prob-ability Machine’, IEEE Transactions on Systems, Man andCybernetics—Part B, 36, 913–923.
Kim, M.S. (2007), ‘An Effective Under-sampling Method forClass Imbalance Data Problem’, in Proceedings of theEighth Symposium on Advanced Intelligent Systems, pp. 825–829.
Kim, K.S., and Han, I. (2001), ‘The Cluster-indexing Methodfor Case-based Reasoning Using Self-organizing Maps andLearning Vector Quantization for Bond Rating Cases’, ExpertSystems with Applications, 21, 147–156.
Kubat, M., and Matwin, S. (1997), ‘Addressing the Curse of Im-balanced Training Sets: One-Sided Selection’, in Proceedingsof the 14th International Conference on Machine Learning(ICML), Morgan Kaufmann, pp. 179–186.
Kuo, R.J., Kuo, Y.P., and Chen, Y.P. (2005), ‘Developing a Di-agnostic System Through Integration of Fuzzy Case-basedReasoning and Fuzzy Ant Colony System’, Expert Systemswith Applications, 28, 783–797.
Kuo, R.J., Wang, H.S., Hu, T.-L., and Chou, S.H. (2004), ‘Ap-plication of Ant Colony System for Clustering Analysis’,in Proceedings of the 9th Annual International Conferenceon Industrial Engineering Theory, Applications and Practice,Auckland, New Zealand, pp. 55–59.
Li, D.C., Liu, C.W., and Hu, S.C. (2010), ‘A Learning Methodfor the Class Imbalance Problem With Medical Data Sets’,Computers in Biology and Medicine, 40, 509–518.
Li, H., Andina, D., and Sun, J. (2013), ‘Multiple Proportion Case-basing Driven CBRE and its Application in the Evaluation ofPossible Failure of Firms’, International Journal of SystemsScience, 44(8), 1409–1425.
Li, H., and Sun, J. (2010), ‘Forecasting Business Failure in ChinaUsing Case-based Reasoning With Hybrid Representation’,Journal of Forecasting, 29, 486–501.
Li, H., and Sun, J. (2011), ‘Principal Component Case-based Rea-soning Ensemble for Business Failure Prediction’, Informa-tion & Management, 48, 486–501.
Ling, C.X., and Sheng, V.S. (2006), ‘Test Strategies for Cost-sensitive Decision Trees’, IEEE Transactions on Knowledgeand Data Engineering, 18, 1055–1067.
Liu, C.Z., and Dong, D. (2010), ‘Case Indexing and RetrievalBased on Clustering Algorithm of Weighted Feature C-Means’, Computer Applications and Software, 27, 111–114.
Nguwi, Y.Y., and Cho, S.Y. (2010), ‘An Unsupervised Self-organizing Learning With Support Vector Ranking for Im-balanced Datasets’, Expert Systems with Applications, 37,8303–8312.
Nugroho, A., Kuroyanagi, S., and Iwata, A. (2002), ‘A Solutionfor Imbalanced Training Sets Problem by combNET-II and
Dow
nloa
ded
by [
Penn
sylv
ania
Sta
te U
nive
rsity
] at
11:
38 1
1 A
ugus
t 201
4
International Journal of Systems Science 1239
its Application on Fog Forecasting’, IEICE Transaction Infor-mation and Systems, E85-D, 1165–1174.
Orriols-Puig, A., and Bernado-Mansilla, E. (2009), ‘EvolutionaryRule-based Systems for Imbalanced Data Sets’, Soft Comput-ing, 13, 213–225.
Orriols-Puig, A., Bernado-Mansilla, E., Goldberg, D., Sastry, K.,and Lanzi, P.L. (2009), ‘Facetwise Analysis of XCS for Prob-lems With Class Imbalances’, IEEE Transactions on Evolu-tionary Computation, 13, 1093–1119.
Pendharkar, P. (2009), ‘Misclassification Cost Minimizing Fit-ness Functions for Genetic Algorithm-based Artificial NeuralNetwork Classifiers’, Journal of the Operational ResearchSociety, 60, 1123–1134.
Perner, P. (2006), ‘Case-base Maintenance by Conceptual Clus-tering of Graphs’, Engineering Applications of Artificial In-telligence, 19, 381–393.
Qiao, L., and Jiang, H.S. (2011), ‘Case Retrieval Algorithm Basedon k-means Clustering’, Computer Engineering and Applica-tions, 47, 185–187.
Quintana, D., Saez, Y., Mochon, A., and Isasi, P. (2008), ‘EarlyBankruptcy Prediction Using ENPC’, Applied Intelligence,29, 157–161.
Ryu, Y., and Yue, W. (2005), ‘Firm Bankruptcy Prediction: Exper-imental Comparison of Isotonic Separation and Other Clas-sification Approaches’, IEEE Transactions on Systems, Man,and Cybernetics—Part A: Systems and Humans, 35, 727–737.
Stoustrup, J., and Niemann, H. (2010), ‘Active Fault Diagnosis byController Modification’, International Journal of SystemsScience, 41, 925–936.
Sun, J., Li, H., and Adeli, H. (2012), ‘Concept DriftOriented Adaptive and Dynamic Support Vector Ma-chine Ensemble With Time Window in Corporate Fi-nancial Risk Prediction’, IEEE Transactions on Systems,Man and Cybernetics—Part A: Systems and Humans,doi:10.1109/TSMCA.2012.2224338.
Sun, L., and Shenoy, P. (2007), ‘Using Bayesian Networks forBankruptcy Prediction: Some Methodological Issues’, Euro-pean Journal of Operational Research, 180, 738–753.
Veluvolu, K.C., Kim, M.Y., and Lee, D. (2011), ‘Nonlinear Slid-ing Mode High-gain Observers for Fault Estimation’, Inter-national Journal of Systems Science, 42, 1065–1074.
Wang, S.T., and Lin, W.T. (2010), ‘Research on Integrating Dif-ferent Methods of Neural Networks with Case-based Rea-soning and Rule-based System to Infer Causes of NotebookComputer Breakdown’, Expert Systems with Applications, 37,4544–4555.
Wu, S., and Amari, S. (2002), ‘Conformal Transformation of Ker-nel Functions: A Data-dependent Way to Improve the Perfor-mance of Support Vector Machine Classifiers’, Neural Pro-cessing Letter, 15, 59–67.
Wu, G., and Chang, E. (2003), ‘Class-Boundary Alignmentfor Imbalanced Dataset Learning’, in Proceedings of the2003 International Conference on Machine Learning (ICML),Washington, DC, pp. 49–56.
Wu, Y., and Gray, C. (2010), ‘A Comparison of AlternativeBankruptcy Prediction Models’, Journal of Contemporary Ac-counting & Economics, 6, 34–45.
Youn, H., and Gu, Z. (2010), ‘Predicting Korean Lodging FirmFailures: An Artificial Neural Network Model Along With aLogistic Regression Model’, International Journal of Hospi-tality Management, 29, 120–127.
Zarandi, M.H.F., Razaee, Z.S., and Karbasia, M. (2011), ‘A FuzzyCase Based Reasoning Approach to Value Engineering’, Ex-pert Systems with Applications, 38, 9334–9339.
Zhang, Z., Wang, A., and Chai, X. (2009), ‘Simple Algorithm forDetermining the Number of Clustering’, Computer Engineer-ing and Applications, 45, 166–168.
Zhao, Y., Zhang, Z., Zhao, Y., and Gao, H. (2010), ‘Fault Detec-tion with Network Communication’, International Journal ofSystems Science, 41, 947–956.
Appendix A. Features’ code table for t-1 and t-2
No. Feature name
1 Operating margin2 Cost margin3 Ratio of liabilities to tangible net assets4 Ratio of liabilities to market value of equities5 Ratio of cash to current liabilities6 Ratio of cash to liabilities7 Current assets to current liabilities8 Quick ratio9 Total liabilities to total assets
10 Equities to fixed assets11 Total assets turnover12 Current assets turnover13 Fixed assets turnover14 Inventory turnover15 Accounts receivable turnover16 Growth rate of equities17 Growth rate of total assets18 Growth rate of sales19 Growth rate of earning after tax20 Cash to total assets21 Operating cash to total assets22 Current liability to total assets23 Logarithm of total assets24 Total assets
Dow
nloa
ded
by [
Penn
sylv
ania
Sta
te U
nive
rsity
] at
11:
38 1
1 A
ugus
t 201
4
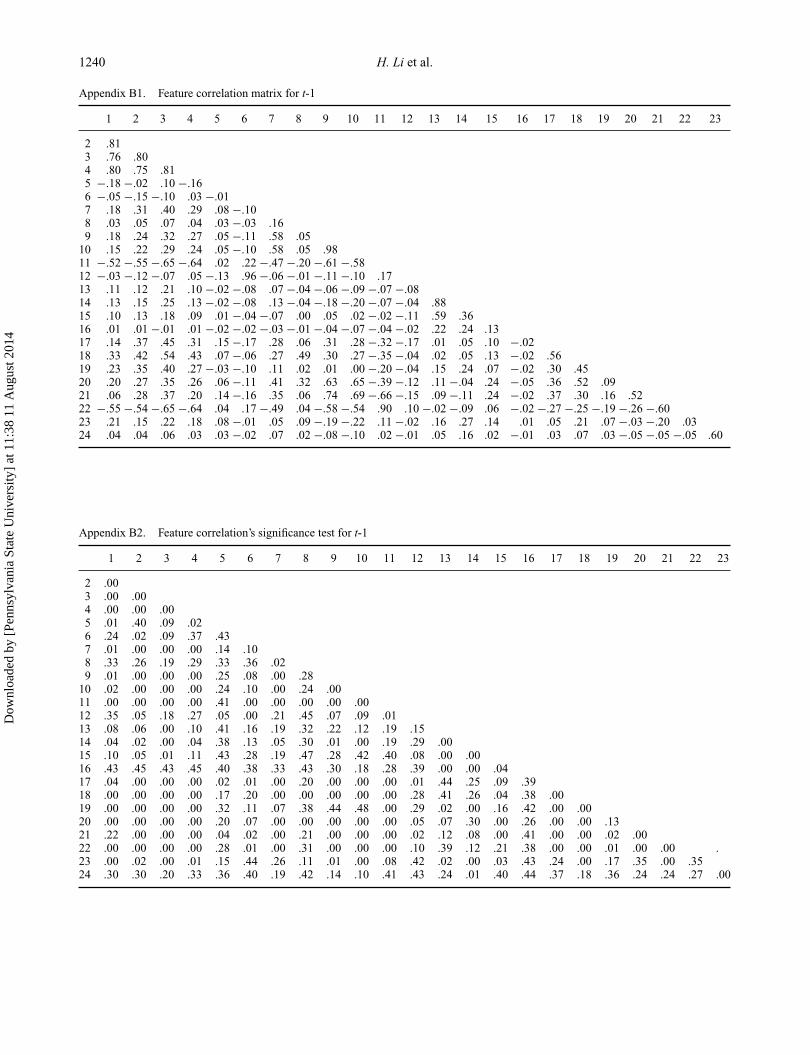
1240 H. Li et al.
Appendix B1. Feature correlation matrix for t-1
1 2 3 4 5 6 7 8 9 10 11 12 13 14 15 16 17 18 19 20 21 22 23
2 .813 .76 .804 .80 .75 .815 −.18 −.02 .10 −.166 −.05 −.15 −.10 .03 −.017 .18 .31 .40 .29 .08 −.108 .03 .05 .07 .04 .03 −.03 .169 .18 .24 .32 .27 .05 −.11 .58 .05
10 .15 .22 .29 .24 .05 −.10 .58 .05 .9811 −.52 −.55 −.65 −.64 .02 .22 −.47 −.20 −.61 −.5812 −.03 −.12 −.07 .05 −.13 .96 −.06 −.01 −.11 −.10 .1713 .11 .12 .21 .10 −.02 −.08 .07 −.04 −.06 −.09 −.07 −.0814 .13 .15 .25 .13 −.02 −.08 .13 −.04 −.18 −.20 −.07 −.04 .8815 .10 .13 .18 .09 .01 −.04 −.07 .00 .05 .02 −.02 −.11 .59 .3616 .01 .01 −.01 .01 −.02 −.02 −.03 −.01 −.04 −.07 −.04 −.02 .22 .24 .1317 .14 .37 .45 .31 .15 −.17 .28 .06 .31 .28 −.32 −.17 .01 .05 .10 −.0218 .33 .42 .54 .43 .07 −.06 .27 .49 .30 .27 −.35 −.04 .02 .05 .13 −.02 .5619 .23 .35 .40 .27 −.03 −.10 .11 .02 .01 .00 −.20 −.04 .15 .24 .07 −.02 .30 .4520 .20 .27 .35 .26 .06 −.11 .41 .32 .63 .65 −.39 −.12 .11 −.04 .24 −.05 .36 .52 .0921 .06 .28 .37 .20 .14 −.16 .35 .06 .74 .69 −.66 −.15 .09 −.11 .24 −.02 .37 .30 .16 .5222 −.55 −.54 −.65 −.64 .04 .17 −.49 .04 −.58 −.54 .90 .10 −.02 −.09 .06 −.02 −.27 −.25 −.19 −.26 −.6023 .21 .15 .22 .18 .08 −.01 .05 .09 −.19 −.22 .11 −.02 .16 .27 .14 .01 .05 .21 .07 −.03 −.20 .0324 .04 .04 .06 .03 .03 −.02 .07 .02 −.08 −.10 .02 −.01 .05 .16 .02 −.01 .03 .07 .03 −.05 −.05 −.05 .60
Appendix B2. Feature correlation’s significance test for t-1
1 2 3 4 5 6 7 8 9 10 11 12 13 14 15 16 17 18 19 20 21 22 23
2 .003 .00 .004 .00 .00 .005 .01 .40 .09 .026 .24 .02 .09 .37 .437 .01 .00 .00 .00 .14 .108 .33 .26 .19 .29 .33 .36 .029 .01 .00 .00 .00 .25 .08 .00 .28
10 .02 .00 .00 .00 .24 .10 .00 .24 .0011 .00 .00 .00 .00 .41 .00 .00 .00 .00 .0012 .35 .05 .18 .27 .05 .00 .21 .45 .07 .09 .0113 .08 .06 .00 .10 .41 .16 .19 .32 .22 .12 .19 .1514 .04 .02 .00 .04 .38 .13 .05 .30 .01 .00 .19 .29 .0015 .10 .05 .01 .11 .43 .28 .19 .47 .28 .42 .40 .08 .00 .0016 .43 .45 .43 .45 .40 .38 .33 .43 .30 .18 .28 .39 .00 .00 .0417 .04 .00 .00 .00 .02 .01 .00 .20 .00 .00 .00 .01 .44 .25 .09 .3918 .00 .00 .00 .00 .17 .20 .00 .00 .00 .00 .00 .28 .41 .26 .04 .38 .0019 .00 .00 .00 .00 .32 .11 .07 .38 .44 .48 .00 .29 .02 .00 .16 .42 .00 .0020 .00 .00 .00 .00 .20 .07 .00 .00 .00 .00 .00 .05 .07 .30 .00 .26 .00 .00 .1321 .22 .00 .00 .00 .04 .02 .00 .21 .00 .00 .00 .02 .12 .08 .00 .41 .00 .00 .02 .0022 .00 .00 .00 .00 .28 .01 .00 .31 .00 .00 .00 .10 .39 .12 .21 .38 .00 .00 .01 .00 .00 .23 .00 .02 .00 .01 .15 .44 .26 .11 .01 .00 .08 .42 .02 .00 .03 .43 .24 .00 .17 .35 .00 .3524 .30 .30 .20 .33 .36 .40 .19 .42 .14 .10 .41 .43 .24 .01 .40 .44 .37 .18 .36 .24 .24 .27 .00
Dow
nloa
ded
by [
Penn
sylv
ania
Sta
te U
nive
rsity
] at
11:
38 1
1 A
ugus
t 201
4
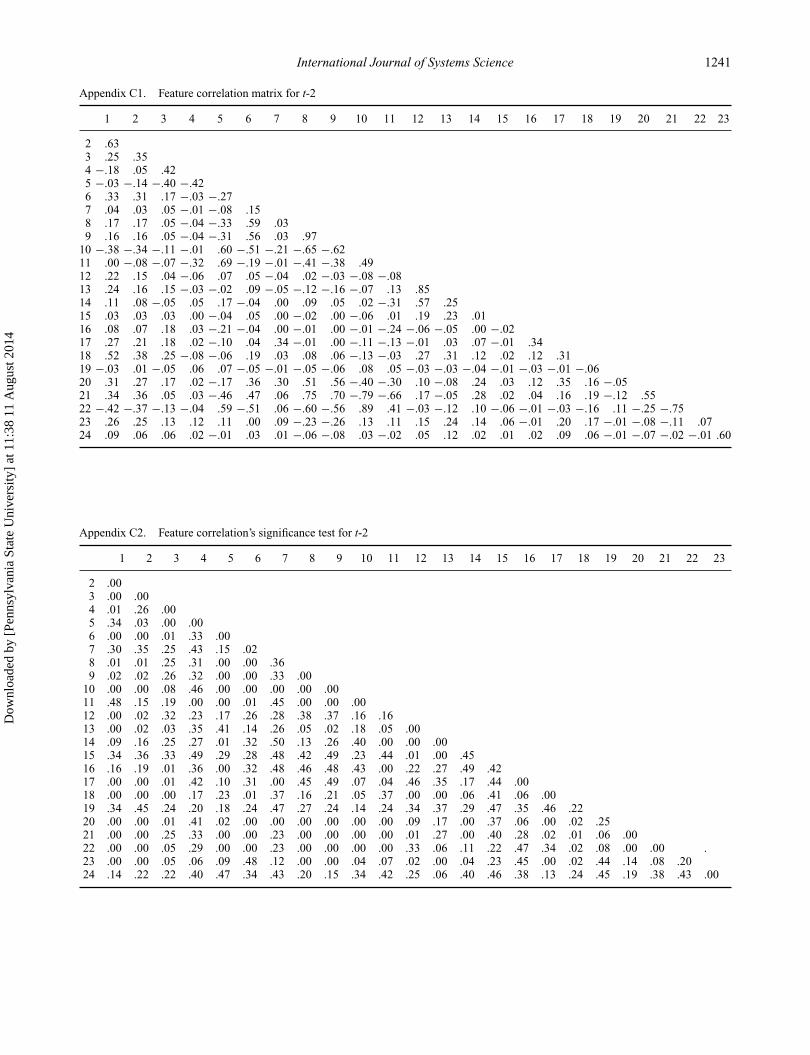
International Journal of Systems Science 1241
Appendix C1. Feature correlation matrix for t-2
1 2 3 4 5 6 7 8 9 10 11 12 13 14 15 16 17 18 19 20 21 22 23
2 .633 .25 .354 −.18 .05 .425 −.03 −.14 −.40 −.426 .33 .31 .17 −.03 −.277 .04 .03 .05 −.01 −.08 .158 .17 .17 .05 −.04 −.33 .59 .039 .16 .16 .05 −.04 −.31 .56 .03 .97
10 −.38 −.34 −.11 −.01 .60 −.51 −.21 −.65 −.6211 .00 −.08 −.07 −.32 .69 −.19 −.01 −.41 −.38 .4912 .22 .15 .04 −.06 .07 .05 −.04 .02 −.03 −.08 −.0813 .24 .16 .15 −.03 −.02 .09 −.05 −.12 −.16 −.07 .13 .8514 .11 .08 −.05 .05 .17 −.04 .00 .09 .05 .02 −.31 .57 .2515 .03 .03 .03 .00 −.04 .05 .00 −.02 .00 −.06 .01 .19 .23 .0116 .08 .07 .18 .03 −.21 −.04 .00 −.01 .00 −.01 −.24 −.06 −.05 .00 −.0217 .27 .21 .18 .02 −.10 .04 .34 −.01 .00 −.11 −.13 −.01 .03 .07 −.01 .3418 .52 .38 .25 −.08 −.06 .19 .03 .08 .06 −.13 −.03 .27 .31 .12 .02 .12 .3119 −.03 .01 −.05 .06 .07 −.05 −.01 −.05 −.06 .08 .05 −.03 −.03 −.04 −.01 −.03 −.01 −.0620 .31 .27 .17 .02 −.17 .36 .30 .51 .56 −.40 −.30 .10 −.08 .24 .03 .12 .35 .16 −.0521 .34 .36 .05 .03 −.46 .47 .06 .75 .70 −.79 −.66 .17 −.05 .28 .02 .04 .16 .19 −.12 .5522 −.42 −.37 −.13 −.04 .59 −.51 .06 −.60 −.56 .89 .41 −.03 −.12 .10 −.06 −.01 −.03 −.16 .11 −.25 −.7523 .26 .25 .13 .12 .11 .00 .09 −.23 −.26 .13 .11 .15 .24 .14 .06 −.01 .20 .17 −.01 −.08 −.11 .0724 .09 .06 .06 .02 −.01 .03 .01 −.06 −.08 .03 −.02 .05 .12 .02 .01 .02 .09 .06 −.01 −.07 −.02 −.01 .60
Appendix C2. Feature correlation’s significance test for t-2
1 2 3 4 5 6 7 8 9 10 11 12 13 14 15 16 17 18 19 20 21 22 23
2 .003 .00 .004 .01 .26 .005 .34 .03 .00 .006 .00 .00 .01 .33 .007 .30 .35 .25 .43 .15 .028 .01 .01 .25 .31 .00 .00 .369 .02 .02 .26 .32 .00 .00 .33 .00
10 .00 .00 .08 .46 .00 .00 .00 .00 .0011 .48 .15 .19 .00 .00 .01 .45 .00 .00 .0012 .00 .02 .32 .23 .17 .26 .28 .38 .37 .16 .1613 .00 .02 .03 .35 .41 .14 .26 .05 .02 .18 .05 .0014 .09 .16 .25 .27 .01 .32 .50 .13 .26 .40 .00 .00 .0015 .34 .36 .33 .49 .29 .28 .48 .42 .49 .23 .44 .01 .00 .4516 .16 .19 .01 .36 .00 .32 .48 .46 .48 .43 .00 .22 .27 .49 .4217 .00 .00 .01 .42 .10 .31 .00 .45 .49 .07 .04 .46 .35 .17 .44 .0018 .00 .00 .00 .17 .23 .01 .37 .16 .21 .05 .37 .00 .00 .06 .41 .06 .0019 .34 .45 .24 .20 .18 .24 .47 .27 .24 .14 .24 .34 .37 .29 .47 .35 .46 .2220 .00 .00 .01 .41 .02 .00 .00 .00 .00 .00 .00 .09 .17 .00 .37 .06 .00 .02 .2521 .00 .00 .25 .33 .00 .00 .23 .00 .00 .00 .00 .01 .27 .00 .40 .28 .02 .01 .06 .0022 .00 .00 .05 .29 .00 .00 .23 .00 .00 .00 .00 .33 .06 .11 .22 .47 .34 .02 .08 .00 .00 .23 .00 .00 .05 .06 .09 .48 .12 .00 .00 .04 .07 .02 .00 .04 .23 .45 .00 .02 .44 .14 .08 .2024 .14 .22 .22 .40 .47 .34 .43 .20 .15 .34 .42 .25 .06 .40 .46 .38 .13 .24 .45 .19 .38 .43 .00
Dow
nloa
ded
by [
Penn
sylv
ania
Sta
te U
nive
rsity
] at
11:
38 1
1 A
ugus
t 201
4