Embed Size (px)
Citation preview

THE CITY OF NEW YORK PROPOSED ACTION PLAN AMENDMENT 14
Effective [HUD approval date]
For CDBG-DR Funds Disaster Relief Appropriations Act of 2013 (Public Law 113-2, January 29, 2013)

The City of New York Proposed Substantial Action Plan Amendment 14
Rebuild By Design – Hunts Point Resiliency Project
April 14, 2017
Dear Friends,
It has been over four years since Hurricane Sandy devastated our City taking the lives of 44 New
Yorkers and causing over $19 billion in economic damages. The City of New York launched an
unparalleled effort not only to rebuild those neighborhoods hardest hit, but also to improve the
City’s infrastructure to help mitigate the risk from future extreme weather events.
In the aftermath of Hurricane Sandy, the City released A Stronger, More Resilient New York, which
identified Hunts Point as a priority area given its vulnerability to threats from climate change, its
residential population, and the critical importance of the Hunts Point food markets to the region’s
food supply. This Substantial Action Plan Amendment outlines the City’s plan, now part of
OneNYC, to implement a resilient energy project in Hunts Point to protect the community from
increasing risks associated with flooding and other climate threats.
In June 2014, HUD awarded New York City $20 million through its Rebuild by Design (RBD)
competition for the Hunts Point Lifelines conceptual proposal for continued study, planning and
community engagement, as well as, for the design and construction of a pilot project. RBD seeks
to promote innovative design in resilience projects and incorporate community engagement in the
rebuilding process. To provide financial support, the City committed an additional $25 million in
federal Disaster Recovery (CDBG-DR) funds.
In 2015, the City initiated a robust community engagement process with local residents and
stakeholders to obtain input as to neighborhood RBD priorities. Participants included over 40
representatives from community-based organizations, the food manufacturing and distribution
industry, business leaders, and local government representatives. Additionally, several public
meetings were held to engage the public at-large. This engagement helped to develop the Hunts
Point Resiliency project, which aims to implement a resilient energy pilot project and analyze
long-term protections from storm surge and sea level rise.
This Substantial Action Plan Amendment identifies the preferred energy resiliency pilot project
that will be implemented with HUD CDBG-DR funds. The Hunts Point Resiliency project will
provide reliable and resilient energy to critical local and citywide facilities in the Hunts Point
peninsula during emergency events such as flooding and power outages.
Hurricane Sandy reminded us of the extent of our vulnerability to climate change. The Hunts Point
Resiliency project, now a $45 million innovative effort, sets forth a framework for developing
community-led resiliency projects in the future. Through public engagement, innovative planning
and engineering, the City will ensure that this vital neighborhood is prepared for extreme weather
and other natural disasters. As described in this Substantial Action Plan Amendment, the City is
making steady progress towards a stronger, more resilient New York.
Jainey Bavishi
Director
Mayor’s Office of Recovery and Resiliency

Overview
The City of New York (“City” or “NYC”) is the recipient of $4.214 billion of Community Development
Block Grant – Disaster Recovery (CDBG-DR) funding from the U.S. Department of Housing and Urban
Development (HUD) to assist in disaster recovery and rebuilding efforts resulting from Hurricane Sandy.
Included within that $4.214 billion is a $20 million Rebuild by Design award for what is now referred to
as the Hunts Point Resiliency project. The City allocated an additional $25 million of CDBG-DR funds
to the project, so the approved Action Plan has represented $45 million in CDBG-DR funds from HUD
for this project.
The City's Action Plan provides details on how the City plans to spend grant funds on eligible Hurricane
Sandy disaster recovery and rebuilding activities, including the Hunt Point Resiliency project.
Any change greater than $1 million in funding committed to a certain program, the addition or deletion of
any program, or change in eligibility criteria or designated beneficiaries of a program constitutes a
substantial amendment and such amendment will be available for review by the public and approval by
HUD.
The City is publishing proposed Amendment 14 for public comment. This Amendment makes changes to
and provides updates on the Hunts Point Resiliency project.
The comment period on the proposed CDBG-DR Action Plan Amendment 14 is now open. Comments
must be received no later than May 14, 2017, at 11:59 PM (EST). The proposed CDBG-DR Action
Amendment 14 and the public commenting forms are available at http://www.nyc.gov/cdbg. Individuals
will be able to read the amendment and the currently approved Action Plan and comment on the
amendment in English, Spanish, Russian and Chinese (simplified). The online materials will also be
accessible for the visually impaired. Written comments may also be directed by mail to Calvin Johnson,
Assistant Director, CDBG-DR, NYC Office of Management and Budget, 255 Greenwich Street, 8th
Floor, New York, NY 10007. Public comments may be given in person at the public hearing listed below.
The public hearing schedule for proposed Amendment 14 is below. The schedule is subject to change.
Please call 311 or 212-NEW-YORK (212-639-9675) from outside New York City or check
http://www.nyc.gov/cdbg for the most updated information.
Thursday, April 27, 2016, at 7:00PM-8:30PM
Hunts Point Recreation Center
765 Manida St, Bronx, NY 10474
Paper copies of the Action Plan Amendment 14, including in large print format (18pt. font size), are
available at the following address in both English and the languages listed above:
New York City Office of Management and Budget
255 Greenwich Street, 8th Floor Reception Area
New York, NY 10007
At the end of the comment period, all comments shall be reviewed and a City response will be
incorporated into the City’s Responses to Public Comments document. A summary of the comments and
the City’s responses will be submitted to HUD for approval in the final CDBG-DR Action Plan
Amendment 14. The revised Action Plan Amendment 14 including the public comments and responses
will be posted on the City’s CDBG-DR website at http://www.nyc.gov/cdbg.

Some notes about the formatting of this substantial Action Plan amendment document:
The changes that this substantial amendment (Amendment 14) proposes for the City of New York are
described below. Changes will be made to section of the Coastal Resiliency chapter that describes the
Hunts Point Resiliency project within the currently approved Action Plan incorporating all prior
amendments. This document can be found on the City’s website at
http://www.nyc.gov/html/cdbg/html/approved/action_plan.shtml
Once Amendment 14 is approved by HUD, the text of this amendment will be incorporated into the
City’s overall approved Action Plan. Then, the approved Action Plan, without indication of the changes
made through this amendment, will be published at
http://www.nyc.gov/html/cdbg/html/approved/action_plan.shtml
In addition to the current approved Action Plan, the City’s CDBG-DR website includes a full history of
all amendments associated with the Plan.
Hunts Point Resiliency – Action Plan Amendment
April 14, 2017
Technical Benefit Cost Analysis
Table of Contents
Executive Summary ...................................................................................................................................... 1
1 Introduction ........................................................................................................................................... 3
2 BCA Overview and Approach ............................................................................................................... 3
3 Project Description ................................................................................................................................ 4
3.1 Base Case and Alternative ............................................................................................................ 5
3.2 Project Impacts .............................................................................................................................. 8
4 Benefits Measurement, Data, and Assumptions .................................................................................... 9
4.1 Life Cycle Costs ............................................................................................................................ 9
4.1.1 Capital Costs ............................................................................................................................. 9
4.1.2 Annual Costs ............................................................................................................................. 9
4.1.3 Annual Savings ....................................................................................................................... 11
4.1.4 Life Cycle Costs Summary ..................................................................................................... 12
4.2 Resiliency Value ......................................................................................................................... 13
4.2.1 Methodology and Key Assumptions ....................................................................................... 13
4.2.2 Benefit Estimates .................................................................................................................... 19
4.3 Environmental Value .................................................................................................................. 19
4.3.1 Methodology and Key Assumptions ....................................................................................... 20
4.3.2 Benefit Estimates .................................................................................................................... 21
4.4 Social Value ................................................................................................................................ 21
4.4.1 Methodology and Key Assumptions ....................................................................................... 22
4.4.2 Benefit Estimates .................................................................................................................... 22
4.5 Economic Revitalization ............................................................................................................. 23
4.6 Other Non-monetized Impacts .................................................................................................... 23
5 Project Risks and Implementation Challenges .................................................................................... 23
5.1 Risks to Ongoing Project Benefits .............................................................................................. 24
5.2 Project Implementation Challenges ............................................................................................ 24
6 Summary of Findings and BCA Outcomes ......................................................................................... 25
7 Sensitivity Analysis ............................................................................................................................. 27
7.1 Results Using a 3% Discount Rate ............................................................................................. 27


List of Tables
TABLE 1: TABLE DESCRIBING BCA COSTS AND BENEFITS ........................................................................................................................ 1
TABLE 2: PROJECT EQUIPMENT SPECIFICATIONS ........................................................................................................................................ 5
TABLE 3: PROJECT IMPACTS .............................................................................................................................................................................. 8
TABLE 4: CAPITAL COSTS ................................................................................................................................................................................... 9
TABLE 5: ANNUAL COSTS ................................................................................................................................................................................. 10
TABLE 6: ANNUAL SAVINGS ............................................................................................................................................................................ 12
TABLE 7: LIFE CYCLE COSTS SUMMARY ...................................................................................................................................................... 12
TABLE 8: ESTIMATED ECONOMIC IMPACTS OF A 12-HOUR POWER OUTAGE TO THE MARKETS AND BUSINESSES ................. 15
TABLE 9: ESTIMATED ECONOMIC IMPACTS OF A 24-HOUR POWER OUTAGE TO THE MARKETS AND BUSINESSES ................. 16
TABLE 10: ESTIMATED ECONOMIC IMPACTS OF A 36-HOUR POWER OUTAGE TO THE MARKETS AND BUSINESSES ............... 17
TABLE 11: ESTIMATED ECONOMIC IMPACTS OF A 72-HOUR POWER OUTAGE TO THE MARKETS AND BUSINESSES ............... 18
TABLE 13: INDIRECT ECONOMIC IMPACTS FROM RESILIENCY IMPROVEMENTS............................................................................... 19
TABLE 14: ENVIRONMENTAL AND SOCIAL VALUE KEY INPUTS ............................................................................................................ 21
TABLE 15: ENVIRONMENTAL VALUE IMPACTS SUMMARY ..................................................................................................................... 21
TABLE 16: SOCIAL VALUE IMPACTS SUMMARY ......................................................................................................................................... 22
TABLE 17: EMPLOYMENT ................................................................................................................................................................................. 23
TABLE 18: SUMMARY OF MONETIZED IMPACTS......................................................................................................................................... 25
TABLE 19: BCA RESULTS ................................................................................................................................................................................... 26
TABLE 20: SUMMARY OF MONETIZED IMPACTS (SENSITIVITY – 3% DISCOUNT RATE) .................................................................... 28
TABLE 21: BCA RESULTS (SENSITIVITY – 3% DISCOUNT RATE) .............................................................................................................. 28
List of Figures
FIGURE 1: BASE CASE CRITICAL FACILITIES AND THREATS ..................................................................................................................... 7
FIGURE 2: ALTERNATIVE CASE SOLUTIONS .................................................................................................................................................. 7
FIGURE 3: NATURAL GAS PRICE FORECAST ................................................................................................................................................ 10
FIGURE 4: DIESEL PRICE FORECAST .............................................................................................................................................................. 10
FIGURE 5: NEW YORK CITY AVERAGE LBMP PRICE FORECAST ............................................................................................................. 11
FIGURE 6: GENERATION CAPACITY COST ESTIMATES .............................................................................................................................. 12
FIGURE 7: HUNTS POINT FLOODPLAIN MAP ................................................................................................................................................ 14
FIGURE 8: CRITERIA AIR CONTAMINANT EMISSIONS ............................................................................................................................... 23
FIGURE 9: MONETIZED HEALTH IMPACTS.................................................................................................................................................... 23
FIGURE 10: SUMMARY OF MONETIZED COSTS AND BENEFITS ............................................................................................................... 27
FIGURE 11: SUMMARY OF MONETIZED COSTS AND BENEFITS (SENSITIVITY – 3% DISCOUNT RATE) .......................................... 29

1
Executive Summary A total investment of $45 million in Community Development Block Grant Disaster Recovery (CDBG-
DR) funds ($20 million via the Rebuild by Design program, and $25 million contribution from New York
City’s larger CDBG-DR allocation) is dedicated to the “continued robust planning and study related to the
future of the food market and a small pilot/demonstration project (to be selected by the City)” in Hunts
Point. The Hunts Point Resiliency Project meets the project purpose and need by identifying an Energy
Resiliency pilot project and providing a sustainable, reliable and resilient energy solution to the Hunts Point
area through a combination of power generation solutions. The pilot project incorporates rooftop solar
photovoltaic (PV) generation with battery energy storage systems, a combustion turbine-powered
microgrid, and backup generators for the supply of short- and long-term, dispatchable energy resiliency.
All of the individual energy components that make up the complete Energy Resiliency pilot project have
independent utility.
In conjunction with the implementation of the pilot project, there is a separate but related initiative to add
rooftop solar PV generation under a community solar structure that would provide residents the option to
purchase power directly from a solar developer and, in turn, receive monthly deductions on their Con Edison
bills. The community shared solar project does not affect the independent utility of the Energy Resiliency
pilot project.
The pilot project consists of the following components:
Produce Market Microgrid – This component of the project involves the installation of a nominal 7.5 MW simple
cycle combustion turbine that will supply electrical power to the Produce Market via the use of Con Edison’s existing
infrastructure.
Fish Market Generation – Resilient energy sourcing to the New Fulton Fish Market will be in the form of 1.2 MW of
resilient, natural gas fired engine generator(s) and battery energy storage sized for eight hours of facility operation.
Community Facility Solar/Storage Installations – To provide sustainable and resilient power supply to some of the
primary community facilities, the project will involve the installation of rooftop solar photovoltaic generation and
battery energy storage for both the Middle School (MS) 424 and Primary School (PS) 48.
Emergency Backup Generation for Businesses – To provide resilient power supply to some of the other buildings
outside of the markets, the project includes the purchase of nominally six mobile diesel generators with the installation
of transfer switches to allow the connection of these generators during emergency periods.
The Benefit-Cost Analysis (BCA) of the pilot project was prepared in line with US Department of Housing and Urban
Development (HUD) requirements, other federal guidelines, and industry best practices. The analysis period of 20
years reflects the average useful life of equipment, all values are estimated using constant 2016 prices (depicted as
2016$), no general inflation is used to escalate any values, and a 7% base discount rate is used to bring all future
values to a present value (PV) in 2016$. The sensitivity section of the report also presents results using a 3% discount
rate as is common practice for publicly funded projects as a proxy for the long-term federal government borrowing
rate.
Overall, the BCA shows positive outcomes with a $38.5 million net present value, 2.22 benefit-cost ratio (BCR),
and an internal rate of return (20.8%) that is well above the 7% hurdle rate. With a 3% discount rate commonly
used to assess publicly funded projects, the NPV increases to $80 million and a BCR of 3.03. The top monetized
project impacts are summarized in Table 1 and described in detail throughout this appendix.
Table 1: Table Describing BCA Costs and Benefits

2
1 Based on HUD guidelines – assessment of the certainty of the effect on a scale from 1 (very certain) to 5 (very uncertain).
Cost and Benefit
by Category
Page # in
Narrative
Description
Qualitative Description of Effect and
Rationale for Including in BCA
Quantitative Assessment Monetized
Effect, NPV
($000s)
Uncer-
tainty1
Life Cycle Costs
Capital Costs Pg. 9 Upfront one-time costs to implement
the project and bring to operations.
Estimated by the Energy Resiliency Engineering
Team based on costs of comparable recent
project costs.
($28,950) 2
O&M Costs Pg. 9 Costs required to operate and maintain
the system in a state of good repair
during its service life.
Estimated by the Energy Resiliency Engineering
Team based on costs of comparable recent
project costs.
($2,259) 2
Fuel Costs Pg. 9 Cost of fuel (diesel or natural gas)
consumed by power generating
equipment.
Fuel consumption estimated by the Energy
Resiliency Engineering Team. Fuel price
forecasts from NY State Energy Plan and EIA
2017 Annual Energy Outlook.
($281) 2
Energy Cost
Savings
Pg. 11 Reduction in demand for electricity from
the grid.
Electricity price are based on Bronx location-
based marginal price forecasts from the NYISO
2015 CARIS.
$1,645 2
Generation
Capacity Cost
Savings
Pg. 11
Avoided costs from deferring the need
to invest in new bulk power generation.
Estimated reduction in demand for peaking
capacity through demand response program
participation and NYISO 2015 CARIS cost of
generation.
$964 2
Resiliency Value
Power Outage
Reduction
Benefits -
Markets and
Businesses
Pg. 13 Avoided revenue and inventory losses
from shut down operations during a
major power outage event.
Revenue loss and inventory loss estimated
based on market data and interviews with
market representatives.
$66,726 4
Power Outage
Reduction
Benefits - Direct
Wages
Pg. 13 Reduced impacts on FDC businesses
prevent the loss of wages of workers
that would be out of work until the
market could come back online.
Wage losses derived based on the number of
employees obtained from NYCEDC Business
Reporting and average employee wages – EMSI
labor market data.
$1,236
(excluded
from BCA
total)
4
Power Outage
Reduction
Benefits - Indirect
Impacts
Pg. 13 Indirect losses from impacts on FDC
businesses’ sales.
Direct revenue losses derived from the market
impacts; Regional multipliers obtained from
IMPLAN.
$10,539
(excluded
from BCA
total)
4
Power Outage
Reduction
Benefits -
Community
Facilities
Pg. 19 Energy packages enable community
facilities to provide refuge to those in
need during major weather and outage
events, and other services to community
members.
Estimated based on 1,200 person capacity and
a value of $331 per person per day based on
US General Services Administration guidelines
for federal per diem reimbursable expenses.
$459 4
Reliability
Improvements
Pg. 19 Avoided costs associated with the
reduction in the frequency or duration of
minor power outages.
Estimated annual cost of service interruption
for each class of electricity customer with
state-specific inputs using the US Department
of Energy Interruption Cost Estimate
Calculator.
$65.10 2

3
1 Introduction This report presents the technical BCA of the Energy Resiliency pilot project for the Hunts Point Resiliency Project.
This overall study process has been guided by a Sustainable Return on Investment (SROI) approach where several
technology and project packages were developed, screened and evaluated. Ultimately, three project packages were
formally evaluated using SROI, where preliminary BCA results for each package were reviewed, discussed and refined
during a workshop session with the City, project team, and stakeholders. Based on this evaluation, one preferred pilot
project was identified. The pilot project and BCA is summarized in the sections that follow.
2 BCA Overview and Approach The BCA of the Energy Resiliency project is developed using a SROI process whereby the analysis and assumptions
are developed and then reviewed and refined with key stakeholders in a workshop environment. Using this approach,
effects that can be quantified and expressed in monetary terms are monetized. Other effects which are relevant but
which cannot be expressed in monetary terms are discussed qualitatively.
The BCA methodology employed is consistent with the general principles outlined in Office of Management and
Budget (OMB) Circular A-94, “Guidelines and Discount Rates for Benefit-Cost Analysis of Federal Programs” as
well as National Disaster Resilience Competition (NDRC) and other BCA guidelines relevant to the energy generation
sector.2
2 This includes HUD BCA Guidelines, the New York Public Service Commission Order establishing the Benefit Cost Analysis Framework Proceeding on Motion of the Commission in Regard to Reforming the Energy Vision (January 21, 2016) and the New York State Energy Research
and Development Authority’s Community Microgrid Benefit-Cost Analysis guide.
Environmental
Values
Greenhouse Gas
(GHG) Emissions
Pg. 20 Change in environmental damages from
GHG emissions, net impacts of avoided
GHG emissions from bulk energy
suppliers, and increased emissions from
implemented energy solutions.
Emission allowance prices are based on the
NYISO 2015 CARIS. CO2 emission damage costs
are based on the Interagency Working Group
on Social Cost of Greenhouse Gases, Technical
Update of the Social Cost of Carbon for
Regulatory Impact. NY grid marginal emission
rates derived from the New York Public Service
Commission Case 15-E-0703, the USEPA
National Emissions Inventory and the
Commission for Environmental Cooperation
(North American Power Plant Emissions).
$113 2
Social Values
Health Impacts Pg. 22 Net impacts of avoided criteria air
pollutants causing mortality and
respiratory issues from bulk energy
suppliers and increased pollution from
implemented energy solutions.
Criteria air contaminant emission costs are
estimated based on the USEPA Cost-Benefit
Risk Assessment Screening Model.
$42 2
Food Supply Pg. 23 Maintaining power to the markets would
maintain food distribution to the region
and avoid supply disruptions that could
result in higher food prices.
+ (qualitative scale) n/a 4
Economic Revitalization
Employment
Opportunity
Pg. 23 The project will create temporary and
permanent job opportunities during
construction and operations.
+ (qualitative scale) 73 people
construction
+ 8
permanent &
6 on-call
2

4
BCA is a conceptual framework that quantifies in monetary terms as many of the costs and benefits of a project as
possible. Benefits are broadly defined. They represent the extent to which people impacted by the project are made
better off. In other words, central to BCA is the idea that people are best able to judge what is “good” for them, or
what improves their well-being or welfare.
BCA also adopts the view that a net increase in welfare (as measured by the summation of individual welfare changes)
is a good thing, even if some parties benefit, while others do not. A project or proposal would be rated positively if
the benefits to some are large enough to compensate the losses of others.
Finally, BCA is typically a forward-looking exercise, seeking to anticipate the welfare impacts of a project or proposal
over its entire life cycle. Future welfare changes are weighted against today’s changes through discounting, which is
meant to reflect society’s general preference for the present, as well as broader inter-generational concerns.
The specific methodology developed for this Energy Resiliency pilot project was developed using core
BCA principles and is consistent with HUD guidelines. In particular, the methodology involves:
Establishing existing and future conditions under the alternative (build) and base (no-build) scenarios;
Assessing benefits with respect to each of the five long-term outcomes identified in HUD’s requirements
for Rebuild by Design projects3 which are in line with NDRC BCA Guidance;
Measuring benefits in dollar terms, whenever possible, and expressing benefits and costs in a common unit
of measurement;
Using standard benefit value assumptions adopted by federal agencies (i.e., Federal Emergency
Management Agency - FEMA, Department of Transportation - DOT, etc.) while relying on industry best
practices for the valuation of other effects;
Estimating benefits and costs over a project life cycle that includes the project development period plus 20
years of operations consistent with the expected useful life of project assets;
Discounting future benefits and costs with the real discount rates recommended by HUD (7%, and an
alternative of 3% based on common industry practices and informed by federal guidance); and
Engaging the City, technical experts and stakeholders in a workshop review to vet and refine project options,
types of benefit and cost impacts, and key assumptions.
3 Project Description
The Hunts Point Resiliency Project meets the project purpose and need by reducing the peninsula’s vulnerability to
coastal flooding through a pilot project that provides a reliable and resilient energy solution to the Hunts Point area
through a combination of power generation solutions. The pilot project incorporates rooftop solar photovoltaic (PV)
generation, battery energy storage, a combustion turbine powered microgrid, and other fossil fueled energy generation
technologies for the supply of short- and long-term, dispatchable energy resiliency. In conjunction with the
implementation of the pilot project, there is a separate but related initiative to add rooftop solar PV generation to a
number of businesses under a community solar structure that would provide residents the option to purchase power
directly from a solar developer and, in turn, receive monthly deductions on their Con Edison electricity bills.
The pilot project outlined herein consists of the following components, all of which offer independent utility.
Produce Market and Anchor Microgrid – This component of the project involves the installation of a
microgrid powered by a 7.5 MW simple cycle combustion turbine (see Figure 2) that will supply electrical
power to the Produce Market. The microgrid will use Con Edison’s existing infrastructure and will be
completely separable from the larger grid so that the microgrid can operate independently from Con Edition
in the event of an emergency. The unit will control criteria air contaminants via the use of the latest
3 US Department of Housing and Urban Development: CDBG-DR Rebuild by Design: Guidance regarding content and format of materials for approval of CDBG-DR Action Plan Amendments releasing funds for construction of Rebuild by Design projects, including guidance for Benefit-
Cost Analysis, April 2016.

5
emissions control equipment. The anchor microgrid has independent utility and can provide full resiliency
to the Produce Market. It can also potentially be expanded to include other facilities if desired in the future.
The anchor microgrid would prevent inventory spoilage and enable the Produce Market to continue full
produce distribution operations in the event of an emergency.
Fish Market Energy Storage and Backup Generation – Resilient energy for the New Fulton Fish Market
will be provided in the form of a combination of battery energy storage (sized for eight hours of facility
operation), and 1.2 MW of resilient, natural gas fired engine generator(s) as a second-tier power backup to
the battery storage system. The battery and backup generation system is designed to support facility’s
critical load to avoid inventory spoilage and enable the Fish Market to continue full operations during an
emergency.
Community Facility Solar/Storage Installations – To provide sustainable and resilient power supply to two
primary community facilities, the project will involve the installation of rooftop solar PV generation and
battery energy storage for both the Middle School (MS) 424 and Primary School (PS) 48. The total
supported installation is approximately 0.5 MW of solar capacity with eight hours of energy storage
capacity for facility critical loads. This level of power will enable the facilities to provide shelter, refuge,
or gathering spaces in emergency situations.
Emergency Backup Generation – To provide resilient power supply to other important citywide food
distributors and employers in the Food Distribution Center that are also, the Energy Resiliency pilot project
includes the purchase of four 275 kW, mobile diesel generators with the installation of transfer switches to
allow the connection of these generators during emergency periods. This fleet of mobile generators enables
immediate energy resiliency with minimal capital construction and costs for additional facilities that are
critical to the city’s food supply chain.
The locations, capacities, and utilization of the various installations are summarized below in Table 2.
Table 2: Project Equipment Specifications
Table 2: Project Equipment Specifications
Project Location Generation Type Capacity
(MW) Purpose
Produce Market Combustion Turbine 7.5 Produce Market Resiliency / Microgrid Anchor
Fish Market Battery Storage 1.2 Fish Market Resiliency
Engine Generator 1.2
MS 424 Rooftop Solar PV 0.45 Community Resiliency
Battery Storage 0.09
PS 48 Rooftop Solar PV 0.04
Battery Storage 0.06
Other Businesses Mobile Diesel Generators
1.1 Business Resiliency
Total Installed Capacity
11.6 MW
3.1 Base Case and Alternative
Base Case

6
The Base Case is defined as existing conditions and without the pilot project. The Hunts Point Resiliency
study area as a whole faces its greatest threats from storm surge along areas of the coastline, building and
system-level outages, and extreme heat. Economic resilience in the industrial area depends on physical
resilience, i.e., staying in business, and the Food Distribution Center (FDC) businesses are part of a regional
network of sellers and purchasers. Social resilience is directly dependent on the physical resiliency of
community facilities and the ability of any new proposed project to address environmental justice concerns
within the community.
Key points pertaining to the Base Case conditions include:
1. Building and system-level power outages are a significant and shared threat to residents and businesses in
Hunts Point.
2. Due to considerable elevation change, the low-lying areas face significant threats from coastal flooding while
the upland residential area does not.
3. Extreme rain/snow storms are not a major threat in Hunts Point.
4. The number of community organizations and history of organizing in Hunts Point can lay the foundation for
strong social resiliency.
Several key economic centers including FDC facilities are vulnerable to a combination of building and
system-level energy outages, storm surge, and extreme heat events. Food Center Drive, the main street to
and from the FDC, would be under water in a 100-year storm tide and 2050 sea level rise. Social services
in the residential areas and, specifically, the schools that serve as community centers and emergency shelters
(PS 48 and MS 424), are vulnerable to energy outages and extreme heat due to the potential displacement
of schoolchildren and employees during an outage or if these facilities could not be used during an
emergency because of a lack of power or air conditioning. The future threats and vulnerable critical facilities
based on an assessment of the base case completed for the Hunts Point Resiliency Project are summarized
in Figure 1.

7
Figure 1: Base Case Critical Facilities and Threats
Alternative Case
The Alternative Case assumes that the Energy Resiliency pilot project is implemented as described above in the
Introduction and Project Description. A summary of the implemented solutions is presented below in Figure 2.
Figure 2: Alternative Case Solutions
8
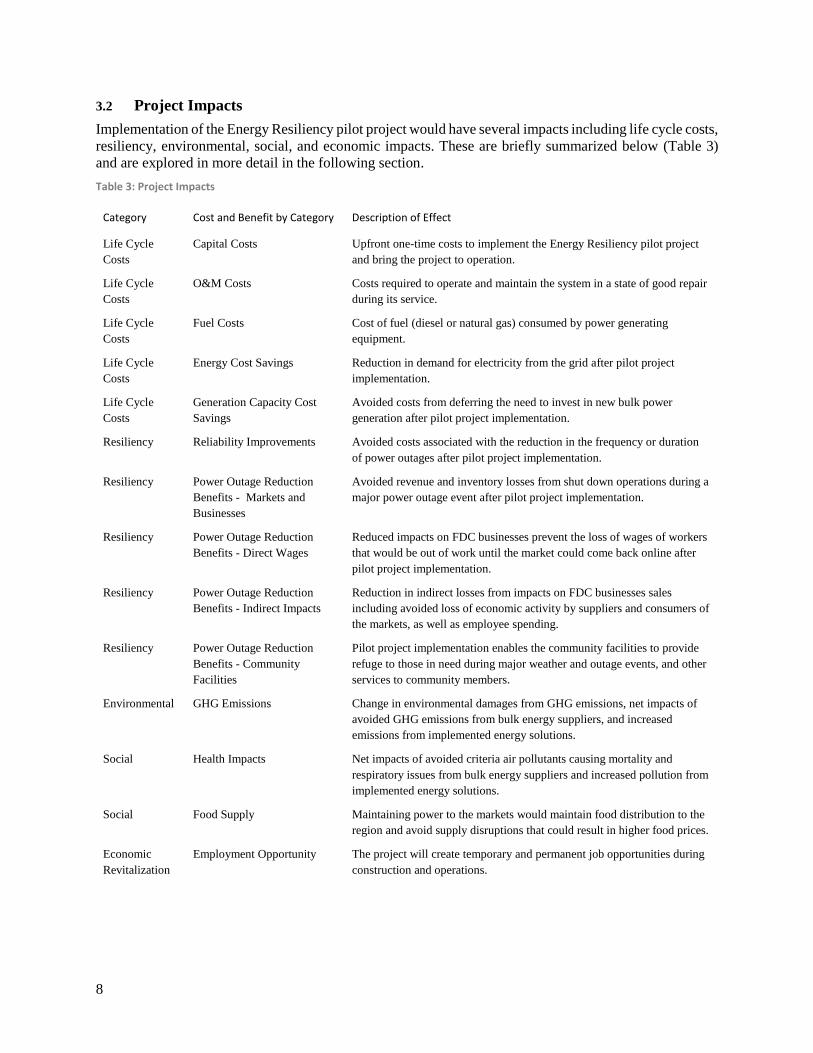
3.2 Project Impacts
Implementation of the Energy Resiliency pilot project would have several impacts including life cycle costs,
resiliency, environmental, social, and economic impacts. These are briefly summarized below (Table 3)
and are explored in more detail in the following section.
Table 3: Project Impacts
Category Cost and Benefit by Category Description of Effect
Life Cycle
Costs
Capital Costs Upfront one-time costs to implement the Energy Resiliency pilot project
and bring the project to operation.
Life Cycle
Costs
O&M Costs Costs required to operate and maintain the system in a state of good repair
during its service.
Life Cycle
Costs
Fuel Costs Cost of fuel (diesel or natural gas) consumed by power generating
equipment.
Life Cycle
Costs
Energy Cost Savings Reduction in demand for electricity from the grid after pilot project
implementation.
Life Cycle
Costs
Generation Capacity Cost
Savings
Avoided costs from deferring the need to invest in new bulk power
generation after pilot project implementation.
Resiliency Reliability Improvements Avoided costs associated with the reduction in the frequency or duration
of power outages after pilot project implementation.
Resiliency Power Outage Reduction
Benefits - Markets and
Businesses
Avoided revenue and inventory losses from shut down operations during a
major power outage event after pilot project implementation.
Resiliency Power Outage Reduction
Benefits - Direct Wages
Reduced impacts on FDC businesses prevent the loss of wages of workers
that would be out of work until the market could come back online after
pilot project implementation.
Resiliency Power Outage Reduction
Benefits - Indirect Impacts
Reduction in indirect losses from impacts on FDC businesses sales
including avoided loss of economic activity by suppliers and consumers of
the markets, as well as employee spending.
Resiliency Power Outage Reduction
Benefits - Community
Facilities
Pilot project implementation enables the community facilities to provide
refuge to those in need during major weather and outage events, and other
services to community members.
Environmental GHG Emissions Change in environmental damages from GHG emissions, net impacts of
avoided GHG emissions from bulk energy suppliers, and increased
emissions from implemented energy solutions.
Social Health Impacts Net impacts of avoided criteria air pollutants causing mortality and
respiratory issues from bulk energy suppliers and increased pollution from
implemented energy solutions.
Social Food Supply Maintaining power to the markets would maintain food distribution to the
region and avoid supply disruptions that could result in higher food prices.
Economic
Revitalization
Employment Opportunity The project will create temporary and permanent job opportunities during
construction and operations.
9
4 Benefits Measurement, Data, and Assumptions
The BCA was prepared in line with HUD requirements, other federal guidelines, and industry best practices. The
analysis period of 20 years reflects the average useful life of equipment, all values are estimated using constant 2016
prices (depicted as 2016$), no general inflation is used to escalate any values, and a 7% base discount rate is used
to bring all future values to a present value (PV) in 2016$. The sensitivity section of the report also presents results
using a 3% discount rate as is common practice for publicly funded projects as a proxy for the long-term federal
government borrowing rate.
4.1 Life Cycle Costs
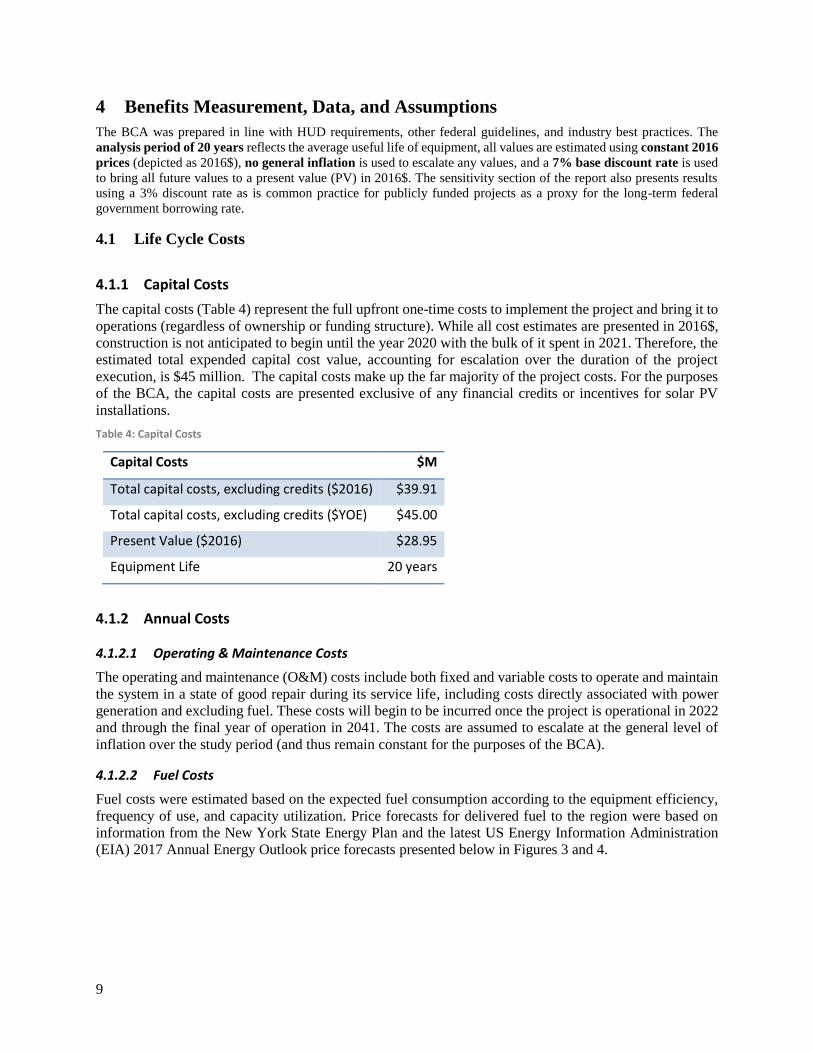
4.1.1 Capital Costs
The capital costs (Table 4) represent the full upfront one-time costs to implement the project and bring it to
operations (regardless of ownership or funding structure). While all cost estimates are presented in 2016$,
construction is not anticipated to begin until the year 2020 with the bulk of it spent in 2021. Therefore, the
estimated total expended capital cost value, accounting for escalation over the duration of the project
execution, is $45 million. The capital costs make up the far majority of the project costs. For the purposes
of the BCA, the capital costs are presented exclusive of any financial credits or incentives for solar PV
installations.
Table 4: Capital Costs
Capital Costs $M
Total capital costs, excluding credits ($2016) $39.91
Total capital costs, excluding credits ($YOE) $45.00
Present Value ($2016) $28.95
Equipment Life 20 years
4.1.2 Annual Costs
4.1.2.1 Operating & Maintenance Costs
The operating and maintenance (O&M) costs include both fixed and variable costs to operate and maintain
the system in a state of good repair during its service life, including costs directly associated with power
generation and excluding fuel. These costs will begin to be incurred once the project is operational in 2022
and through the final year of operation in 2041. The costs are assumed to escalate at the general level of
inflation over the study period (and thus remain constant for the purposes of the BCA).
4.1.2.2 Fuel Costs
Fuel costs were estimated based on the expected fuel consumption according to the equipment efficiency,
frequency of use, and capacity utilization. Price forecasts for delivered fuel to the region were based on
information from the New York State Energy Plan and the latest US Energy Information Administration
(EIA) 2017 Annual Energy Outlook price forecasts presented below in Figures 3 and 4.

10
Figure 3: Natural Gas Price Forecast
Figure 4: Diesel Price Forecast
The sum of O&M and fuel costs adds up to approximately $0.4 million per year. Given the 2022 in service
date and a 7% discount rate, the discounted costs over 20 years sum to a total of $2.5 million (Table 5).
Table 5: Annual Costs
Millions 2016$ Present Value Annual Average
O&M Costs $2.26 $0.34
Fuel Costs $0.28 $0.04
Total Annual Costs $2.54 $0.38
11
4.1.3 Annual Savings
4.1.3.1 Energy Cost Savings
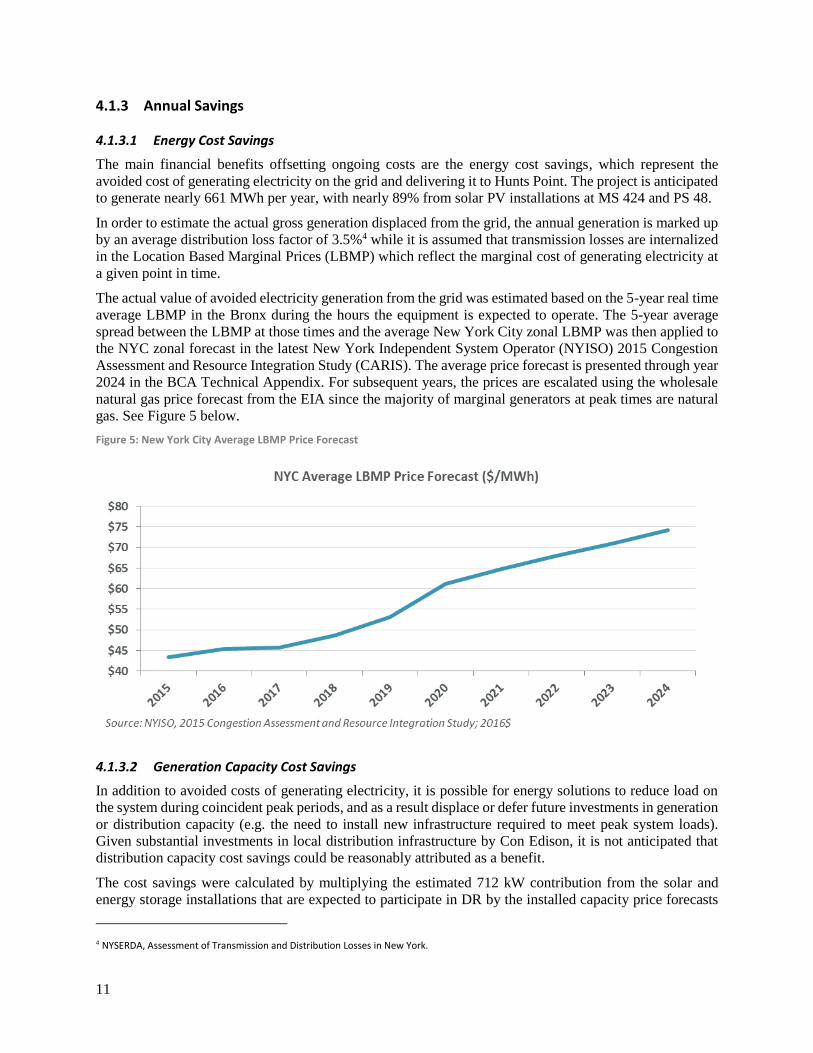
The main financial benefits offsetting ongoing costs are the energy cost savings, which represent the
avoided cost of generating electricity on the grid and delivering it to Hunts Point. The project is anticipated
to generate nearly 661 MWh per year, with nearly 89% from solar PV installations at MS 424 and PS 48.
In order to estimate the actual gross generation displaced from the grid, the annual generation is marked up
by an average distribution loss factor of 3.5%4 while it is assumed that transmission losses are internalized
in the Location Based Marginal Prices (LBMP) which reflect the marginal cost of generating electricity at
a given point in time.
The actual value of avoided electricity generation from the grid was estimated based on the 5-year real time
average LBMP in the Bronx during the hours the equipment is expected to operate. The 5-year average
spread between the LBMP at those times and the average New York City zonal LBMP was then applied to
the NYC zonal forecast in the latest New York Independent System Operator (NYISO) 2015 Congestion
Assessment and Resource Integration Study (CARIS). The average price forecast is presented through year
2024 in the BCA Technical Appendix. For subsequent years, the prices are escalated using the wholesale
natural gas price forecast from the EIA since the majority of marginal generators at peak times are natural
gas. See Figure 5 below.
Figure 5: New York City Average LBMP Price Forecast
4.1.3.2 Generation Capacity Cost Savings
In addition to avoided costs of generating electricity, it is possible for energy solutions to reduce load on
the system during coincident peak periods, and as a result displace or defer future investments in generation
or distribution capacity (e.g. the need to install new infrastructure required to meet peak system loads).
Given substantial investments in local distribution infrastructure by Con Edison, it is not anticipated that
distribution capacity cost savings could be reasonably attributed as a benefit.
The cost savings were calculated by multiplying the estimated 712 kW contribution from the solar and
energy storage installations that are expected to participate in DR by the installed capacity price forecasts
4 NYSERDA, Assessment of Transmission and Distribution Losses in New York.

12
in line with NY DPS BCA Guidance5 based on 2015 Gold Book with updates through January 2016 as
presented in the charts above. The estimates account for the reserve margin that regulated utilities must
maintain above anticipated peak load and are relatively small in comparison to the energy cost savings. See
Figure 7 and Table 6 below.
Figure 6: Generation Capacity Cost Estimates
Table 6: Annual Savings
Millions 2016$ Present Value Annual Average
Energy Cost Savings $1.65 $0.23
Generation Capacity Cost Savings $0.96 $0.13
Total Annual Savings $2.61 $0.35
4.1.4 Life Cycle Costs Summary
Overall, the project is expected to cost $29 million over its life cycle from a societal perspective (without
accounting for renewable energy financial incentives or customer electricity bill savings which are
considered to be a transfer of wealth). Once operational, the project is expected to offset nearly all ongoing
costs with energy and generation capacity cost savings (Table 7).
Table 7: Life Cycle Costs Summary
Millions 2016$ Present Value Annual Average
Capital Costs ($28.95)
O&M Costs ($2.26) ($0.34)
Fuel Costs ($0.28) ($0.04)
Energy Cost Savings $1.65 $0.23
5 New York Public Service Commission Case 14-M-0101 – Proceeding on Motion of the Commission in Regard to Reforming the Energy Vision, Order Establishing the Benefit Cost Analysis Framework.

13
Generation Capacity Cost Savings $0.96 $0.13
Total Life Cycle Costs ($28.88) ($0.02)
4.2 Resiliency Value
The project provides several resiliency benefit streams, some of which can reasonably be monetized.
Specifically, new local generation will allow the local markets and businesses to continue operating, or at
least maintain critical loads to prevent inventory losses, during a major power outage and provide shelter
at community facilities. Installed permanent generation (like solar PV and the Produce Market turbines)
will further improve power reliability for those facilities in cases of minor power outages.
4.2.1 Methodology and Key Assumptions
Major Outage Probability
The probability of a major power outage due to storm surge was estimated based on anticipated inundation
rates of Con Edison transformers at Hunts Point and floodplain data for each transformer and the impacted
facilities from FEMA Preliminary Flood Insurance Rate Maps. It was determined that Krasdale, Sultana,
and Citarella could benefit most from mobile generators during a major inundation event, which would
allow them to preserve inventory for up to three days. In discussions with Con Edison, it was established
that in the event of a major storm event power may be shut off a few of hours in advance as a preventative
measure, and it could take as long as 48 hours to reinstate assuming that the transformer is not completely
inundated (and would thus have to be replaced with an even longer outage time). Subsequently, storm surge
durations of 6 to 24 hours are anticipated to result in a 2-3 day outage to the impacted facilities.
In addition to storm surge modeling estimates, it was assumed that a major outage event would occur once
every 20 years (in other words with a 5% probability per year) and would cause a 3-day power outage to
the peninsula. The event could range from a major Hurricane Sandy-like event to extreme heat, or anything
else that causes a major system shut down. Based on historical data on the frequency and duration of
outages, the assumption was deemed to be a reasonable representation of the project’s true resiliency
benefits.
All power outage reduction benefits in this section are estimated based on these major outage probabilities,
while reliability improvements are estimated based on Con Edison minor outage statistics for the Bronx.

14
Figure 7: Hunts Point Floodplain Map
Power Outage Reduction – Markets and Businesses
Preventing and reducing power outages to local markets and businesses is the overall biggest benefit to the
project. Avoiding revenue and inventory losses from shutting down operations during a storm or other
major outage event preserves the substantial economic activity generated by the facilities.
The impacts of major outages on specific FDC facilities were estimated in discrete blocks of outage time
(12 hours, 24 hour, 36 hours, and 72 hours without power) based on certain assumptions that were derived
from interviews with market representatives and subsequently vetted with stakeholders for reasonableness.
The key assumptions included the share of inventory lost due to spoilage (based on the type of inventory,
turnover rates, ability to use existing backup generators, etc.), and the days to return to business (influenced
by facility lighting, cleanup of lost stock, ability to conduct offsite operations, etc.) which generated direct
revenue and inventory loss estimates.
Only the direct revenue and inventory economic impacts were considered for the BCA as they represent
the consumer willingness to pay for these goods and services. The direct impacts were subsequently used
to derive other key economic impact metrics that are not additive benefits within the BCA as they serve to
measure the impact on economic activity rather than social welfare. “Wage losses,” a derived impact, was
based on the number of employees from New York City Economic Development Corporation (NYCEDC)
Business Reporting and average employee wages based on EMSI labor market data. The other derived is
“regional economic benefits” based on the multiplier effect of reduced FDC business sales using IMPLAN
economic multipliers.

15
Table 8: Estimated Economic Impacts of a 12-hour Power Outage to the Markets and Businesses
Produce Market
Hunts Point Cooperative Meat Market
New Fulton Fish Market Krasdale
Baldor Specialty Foods
Sultana + Citarella
Anheuser-Busch
GrowNYC Regional
Greenmarket
Dairyland/ Chef's
Warehouse
Days Power Outage 0.5 0.5 0.5 0.5 0.5 0.5 0.5 0.5 0.5
Inventory Lost 0.5 0.25 0.15 0 0 0 0 0 0
Days to return to business 0.5 0.5 0.5 0.5 0.5 0.5 0.5 0.5 0.5
Assumptions on inventory lost and number of days to return to business based upon interviews with Market representatives. Number of days to return to business may be influenced by facility lighting (daylight versus all indoor lighting), cleanup of lost stock, or ability to conduct offsite operations. Greenmarket inventory and operations are assumed to be similar to the Produce Market. Baldor and Dairyland have emergency generators that would prevent damages for 24 hours.
Direct Damages
Building Damage
Other Property Damage
Inventory Loss $13,800,000 $5,000,000 $1,260,000 $0 $0 $0 $0 $0 $0
Revenue Loss $4,600,000 $3,334,000 $2,800,000 $4,166,000 $1,044,000 $1,016,000 $994,000 $404,000 $1,320,000
Wages Loss $330,000 $224,000 $105,400 $34,760 $110,000 $11,000 $45,500 $9,680 $16,830
Estimated Direct Damages $18,400,000 $8,334,000 $4,060,000 $4,166,000 $1,044,000 $1,016,000 $994,000 $404,000 $1,320,000
Lost wages are provided for reference and are not included in the total since wages paid are a component of Total Revenue.
Indirect Damages
Building Damage
Other Property Damage
Inventory Loss
Revenue Loss $2,324,453 $1,475,357 $1,414,884 $2,105,146 $527,550 $513,401 $502,284 $204,148 $667,017
Impacts of Wages Lost $82,670 $83,164 $26,404 $8,708 $27,557 $2,756 $11,398 $2,425 $4,216
Estimated Indirect Damages $2,324,453 $1,475,357 $1,414,884 $2,105,146 $527,550 $513,401 $502,284 $204,148 $667,017
Lost wages are provided for reference and are not included in the total since wages paid are a component of Total Revenue.
16
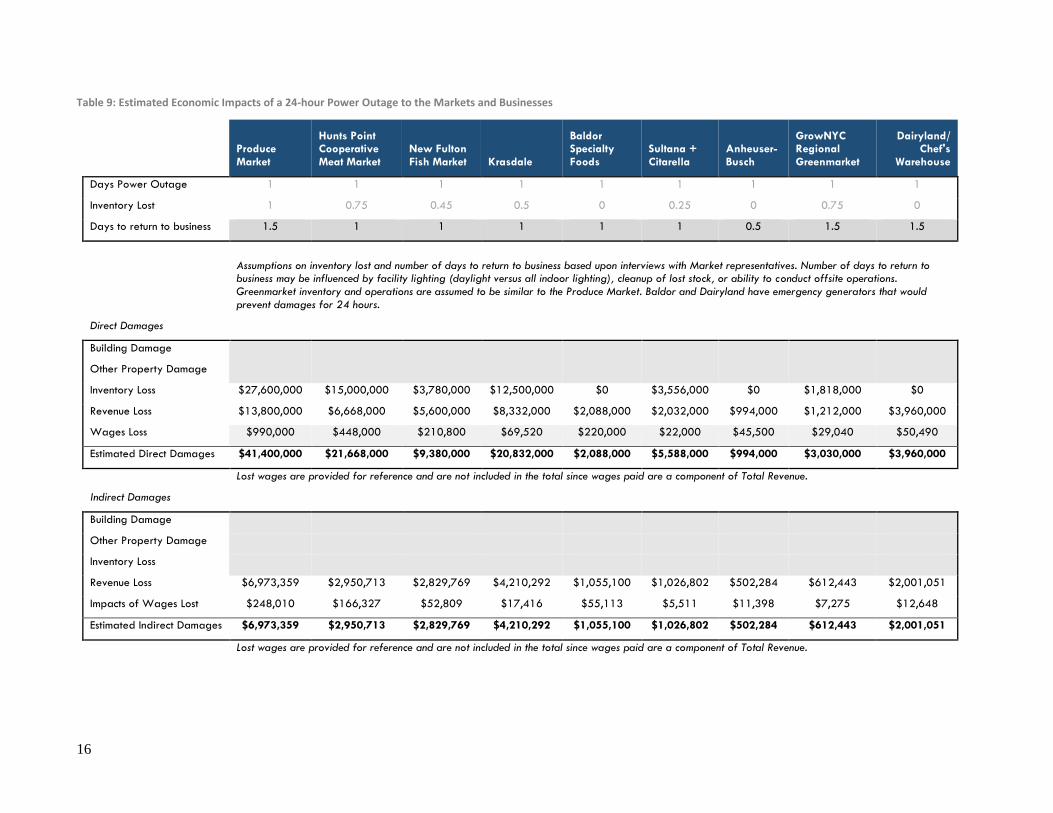
Table 9: Estimated Economic Impacts of a 24-hour Power Outage to the Markets and Businesses
Produce Market
Hunts Point Cooperative Meat Market
New Fulton Fish Market Krasdale
Baldor Specialty Foods
Sultana + Citarella
Anheuser-Busch
GrowNYC Regional Greenmarket
Dairyland/ Chef's
Warehouse
Days Power Outage 1 1 1 1 1 1 1 1 1
Inventory Lost 1 0.75 0.45 0.5 0 0.25 0 0.75 0
Days to return to business 1.5 1 1 1 1 1 0.5 1.5 1.5
Assumptions on inventory lost and number of days to return to business based upon interviews with Market representatives. Number of days to return to business may be influenced by facility lighting (daylight versus all indoor lighting), cleanup of lost stock, or ability to conduct offsite operations. Greenmarket inventory and operations are assumed to be similar to the Produce Market. Baldor and Dairyland have emergency generators that would prevent damages for 24 hours.
Direct Damages
Building Damage
Other Property Damage
Inventory Loss $27,600,000 $15,000,000 $3,780,000 $12,500,000 $0 $3,556,000 $0 $1,818,000 $0
Revenue Loss $13,800,000 $6,668,000 $5,600,000 $8,332,000 $2,088,000 $2,032,000 $994,000 $1,212,000 $3,960,000
Wages Loss $990,000 $448,000 $210,800 $69,520 $220,000 $22,000 $45,500 $29,040 $50,490
Estimated Direct Damages $41,400,000 $21,668,000 $9,380,000 $20,832,000 $2,088,000 $5,588,000 $994,000 $3,030,000 $3,960,000
Lost wages are provided for reference and are not included in the total since wages paid are a component of Total Revenue.
Indirect Damages
Building Damage
Other Property Damage
Inventory Loss
Revenue Loss $6,973,359 $2,950,713 $2,829,769 $4,210,292 $1,055,100 $1,026,802 $502,284 $612,443 $2,001,051
Impacts of Wages Lost $248,010 $166,327 $52,809 $17,416 $55,113 $5,511 $11,398 $7,275 $12,648
Estimated Indirect Damages $6,973,359 $2,950,713 $2,829,769 $4,210,292 $1,055,100 $1,026,802 $502,284 $612,443 $2,001,051
Lost wages are provided for reference and are not included in the total since wages paid are a component of Total Revenue.
17
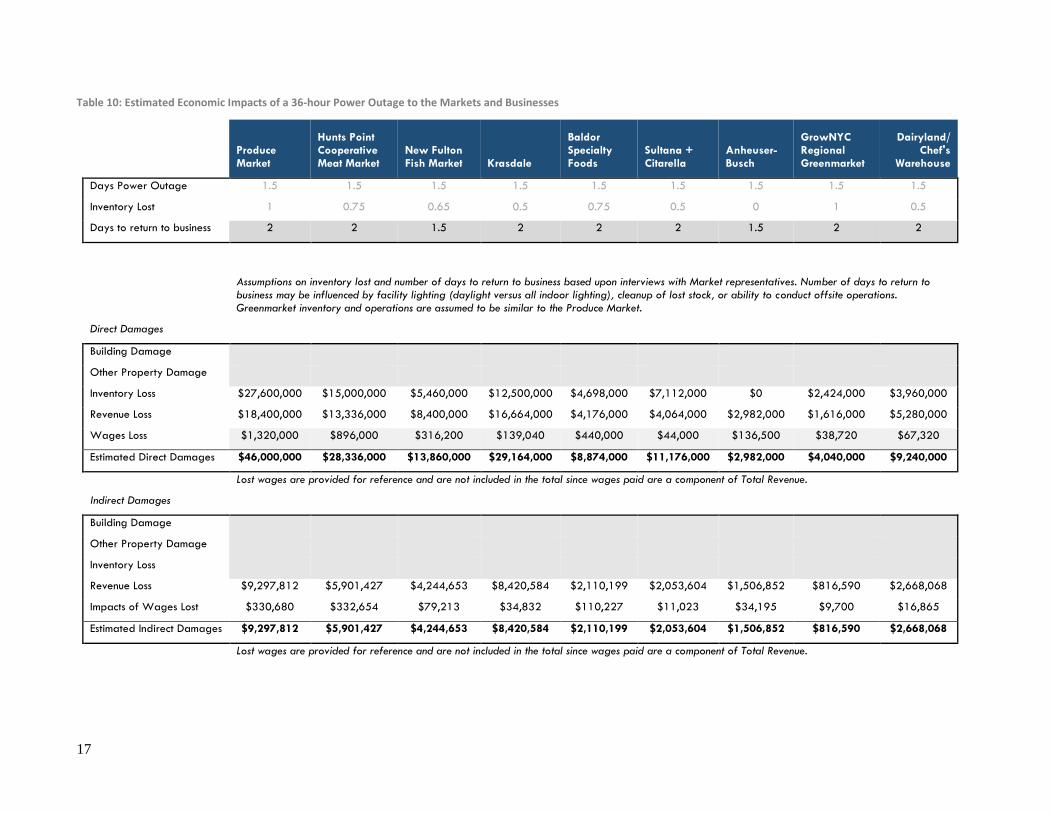
Table 10: Estimated Economic Impacts of a 36-hour Power Outage to the Markets and Businesses
Produce Market
Hunts Point Cooperative Meat Market
New Fulton Fish Market Krasdale
Baldor Specialty Foods
Sultana + Citarella
Anheuser-Busch
GrowNYC Regional Greenmarket
Dairyland/ Chef's
Warehouse
Days Power Outage 1.5 1.5 1.5 1.5 1.5 1.5 1.5 1.5 1.5
Inventory Lost 1 0.75 0.65 0.5 0.75 0.5 0 1 0.5
Days to return to business 2 2 1.5 2 2 2 1.5 2 2
Assumptions on inventory lost and number of days to return to business based upon interviews with Market representatives. Number of days to return to business may be influenced by facility lighting (daylight versus all indoor lighting), cleanup of lost stock, or ability to conduct offsite operations. Greenmarket inventory and operations are assumed to be similar to the Produce Market.
Direct Damages
Building Damage
Other Property Damage
Inventory Loss $27,600,000 $15,000,000 $5,460,000 $12,500,000 $4,698,000 $7,112,000 $0 $2,424,000 $3,960,000
Revenue Loss $18,400,000 $13,336,000 $8,400,000 $16,664,000 $4,176,000 $4,064,000 $2,982,000 $1,616,000 $5,280,000
Wages Loss $1,320,000 $896,000 $316,200 $139,040 $440,000 $44,000 $136,500 $38,720 $67,320
Estimated Direct Damages $46,000,000 $28,336,000 $13,860,000 $29,164,000 $8,874,000 $11,176,000 $2,982,000 $4,040,000 $9,240,000
Lost wages are provided for reference and are not included in the total since wages paid are a component of Total Revenue.
Indirect Damages
Building Damage
Other Property Damage
Inventory Loss
Revenue Loss $9,297,812 $5,901,427 $4,244,653 $8,420,584 $2,110,199 $2,053,604 $1,506,852 $816,590 $2,668,068
Impacts of Wages Lost $330,680 $332,654 $79,213 $34,832 $110,227 $11,023 $34,195 $9,700 $16,865
Estimated Indirect Damages $9,297,812 $5,901,427 $4,244,653 $8,420,584 $2,110,199 $2,053,604 $1,506,852 $816,590 $2,668,068
Lost wages are provided for reference and are not included in the total since wages paid are a component of Total Revenue.

18
Table 11: Estimated Economic Impacts of a 72-hour Power Outage to the Markets and Businesses
Produce Market
Hunts Point Cooperative Meat Market
New Fulton Fish Market Krasdale
Baldor Specialty Foods
Sultana + Citarella
Anheuser-Busch
GrowNYC Regional Greenmarket
Dairyland/ Chef's
Warehouse
Days Power Outage 3 3 3 3 3 3 3 3 3
Inventory Lost 1 1 1 0.5 1 0.5 0 1 1
Days to return to business 4 4 3 4 4 4 2.5 4 4
Assumptions on inventory lost and number of days to return to business based upon interviews with Market representatives. Number of days to return to business may be influenced by facility lighting (daylight versus all indoor lighting), cleanup of lost stock, or ability to conduct offsite operations. Greenmarket inventory and operations are assumed to be similar to the Produce Market.
Direct Damages
Building Damage
Other Property Damage
Inventory Loss $27,600,000 $20,000,000 $8,400,000 $12,500,000 $6,264,000 $7,112,000 $0 $2,424,000 $7,920,000
Revenue Loss $36,800,000 $26,672,000 $16,800,000 $33,328,000 $8,352,000 $8,128,000 $4,970,000 $3,232,000 $10,560,000
Wages Loss $2,640,000 $1,792,000 $632,400 $278,080 $880,000 $88,000 $227,500 $77,440 $134,640
Estimated Direct Damages $64,400,000 $46,672,000 $25,200,000 $45,828,000 $14,616,000 $15,240,000 $4,970,000 $5,656,000 $18,480,000
Lost wages are provided for reference and are not included in the total since wages paid are a component of Total Revenue.
Indirect Damages
Building Damage
Other Property Damage
Inventory Loss
Revenue Loss $18,595,624 $11,802,853 $8,489,307 $16,841,167 $4,220,398 $4,107,207 $2,511,420 $1,633,181 $5,336,136
Impacts of Wages Lost $661,359 $665,308 $158,426 $69,663 $220,453 $22,045 $56,992 $19,400 $33,729
Estimated Indirect Damages $18,595,624 $11,802,853 $8,489,307 $16,841,167 $4,220,398 $4,107,207 $2,511,420 $1,633,181 $5,336,136
Lost wages are provided for reference and are not included in the total since wages paid are a component of Total Revenue.

Power Outage Reduction - Community Facilities
The rooftop solar PV and energy storage installations at MS 424 and PS 48 will add redundancy and allow
the community facilities to ensure the provision of refuge to those in need during major weather and outage
events, and other services to community members (cell phone charging, bathrooms, gathering point,
information, etc.). Informed directly by NYC Emergency Management, the BCA accounted for at least
1,200 people to be accommodated at the schools in a major event. (Additional discussions with stakeholders
indicated that the capacity could even accommodate more.) A monetary value of $331 per person per day
was used based on U.S. General Services Administration guidelines for federal per diem reimbursable
expenses (including an average of $257 for lodging and $74 for meals and incidentals in New York City).
Reliability Improvements
Reliability improvements were estimated using average annual frequency (SAIFI6 of 16.56 outages per
1000 customers served) and duration (CAIDI7 of 384.6 minutes) of minor outages based on Con Edison’s
5 year historical performance statistics in the Bronx. The outage statistics along with other customer
attributes were entered into the U.S. Department of Energy Interruption Cost Estimate (ICE) Calculator to
generate the avoided annual cost of service interruptions.
The value of interruption costs is based on an econometric modeling of several surveys and studies of customer
willingness-to-pay to avoid service unreliability or willingness to accept compensation for service interruptions.
4.2.2 Benefit Estimates
Overall, the power outage reduction benefits to the local markets and businesses is the biggest monetized
resiliency benefit of the project, and collectively, resiliency benefits make up the majority of the total project
benefits. See Table 12 and 13.
Table 12: Resiliency Value Impacts Summary
Millions 2016$ Present Value Annual Average
Power Outage Reduction – Markets and Businesses $66.73 $8.83
Power Outage Reduction - Community Facilities $0.459 $0.0608
Reliability Improvements $0.065 $0.0086
Total Resiliency Benefits $67.25 $8.90
Table 13: Indirect Economic Impacts from Resiliency Improvements
Millions 2016$ Present Value Annual Average
Avoidance of Wage Losses $1.24 $0.16
Regional Economic Benefits $10.54 $1.40
4.3 Environmental Value
Because all ongoing generation is from solar PV installations, another benefit is the reduction in fossil fuel
energy consumption and the reduction in greenhouse gas (GHG) emissions compared to the base case that
relies upon fossil fuels. All of the energy system components that make up the Energy Resiliency pilot
6 System Average Interruption Frequency Index.
7 Customer Average Interruption Duration Index.

20
project also have environmental benefits because they provide energy at the source and avoid transmission
and distribution losses, which would require additional gross generation from the grid.
4.3.1 Methodology and Key Assumptions
Local GHG emissions were estimated based on technical specifications for the turbines and generators, as
well as their operating characteristics, while emissions savings were estimated based on the equivalent
amount of generation displaced from the grid (adjusted for transmission and distribution losses). The
emission rates for the grid were based on the probable types of fuel on the margin and the average emission
rates of plants with the same primary fuel source in New York State. The emission rates were compiled and
cross-examined primarily from the U.S. Environmental Protection Agency (EPA) National Emissions
Inventory; Commission for Environmental Cooperation (North American Power Plant Emissions),8 and net
metering case documents from the New York State Public Service Commission published in December
2015.9
The value of net GHG emissions in CO2-equivalent (CO2e) tons was determined based on value per ton from the
Interagency Working Group on Social Cost of Greenhouse Gases, Technical Update of the Social Cost of Carbon for
Regulatory Impact using the widely recommended 3% discount rate.
In addition to the estimated social value of GHG emissions, utilities in New York are subject to certain
emission allowance costs for CO2, NOx, and SO2 emissions which are internalized in LBMP prices.
Consequently, while the approach to estimating the social value of changes in GHG emissions (as well as
the social value or the health impacts of other pollutants in the next section) is appropriate, the benefits of
avoided allowance costs are already captured as part of the LBMP in the “energy cost savings” impact
category. As such, an adjustment is made to the overall BCA analysis results to deduct the overlap in
benefits. A forecast for the actual values of allowances by pollutants were derived from the same NYISO
2015 Congestion Assessment and Resource Integration Study as the average LBMP price forecast.
Table 14 outlines the key inputs for estimating the environmental and social values of the project.
8 Data last accessed and extracted January 2017.
9 New York Public Service Commission Case 15-E-0703 – In the Matter of Performing a Study on the Economic and Environmental Benefits and Costs of Net Metering Pursuant to Public Service Law §66-n.

21
Table 14: Environmental and Social Value Key Inputs
Emission Factors (lb/MWh) Grid Turbines/Generators
CO₂ Emissions 1,077
Varies by Equipment
NOx Emissions 0.5616
SO₂ Emissions 0.5609
PM2.5 Emissions 0.0601
VOC Emissions 0.0435
Emission Damage Cost ($/ton)
CO₂ $43.49 $43.49
NOx $13,288 $49,661
SO₂ $58,254 $201,216
PM2.5 $410,548 $1,973,626
VOC $287 $1,843
Emission Allowance Prices ($/ton)
CO₂ Emission Allowance per Ton $6.53 n/a
NOx Emission Allowance per Ton $154.64 n/a
SO₂ Emission Allowance per Ton $0 n/a
4.3.2 Benefit Estimates
Unlike the impacts of criteria air contaminants which have more localized impacts, GHG emissions have a
much broader impact on the Earth’s atmosphere. The project is anticipated to reduce GHG emissions by
260 tons per year resulting in a total benefit of $113,000 over the study period (Table 15).
Table 15: Environmental Value Impacts Summary
Net GHG Emissions Impacts
Present Value (thousand 2016$) $113
Annual Average (thousand 2016$) $15.3
Change in GHG Emissions (CO2e tons/yr) (260)
4.4 Social Value
The project is anticipated to generate social value through a reduction in pollution, resilient community
development, potential economic savings that could be passed on to low-moderate income residents and
households in the area, increased public awareness fostering energy savings, and maintenance of food
supply during power outages – all of which are primarily qualitative considerations either due to the
difficulty to defensibly monetize the impacts, or due to a lack of reliable and accurate data. The impacts on
health from exposure to pollution are estimated for the purposes of the BCA. To account for existing air
quality concerns in the Hunts Point community, the BCA took a conservative approach weighing negative
health impacts in the local project area more heavily than the benefits for the greater regional area.
22
4.4.1 Methodology and Key Assumptions
Criteria air contaminant (CAC) emissions were derived using the same approach as the greenhouse gas
emissions in the Environmental Value section above, and included NOx, SO2, PM2.5, and VOC emissions.
The social value of each pollutant per ton of emissions was estimated using EPA’s Co-Benefit Risk
Assessment Screening Model (COBRA). The model estimates the potential risk of health issues including
asthma, heart or lung disease, and other respiratory issues associated with a change in levels of specific
pollutants.
The BCA aimed to properly reflect differences of localized emissions in the more densely populated and
environmental justice community of Hunts Point relative to offsetting emissions from the grid, which could
impact utilities all across the State. Industry and federal BCA guidance typically uses a single average value
of CAC emissions (which would have yielded a net health benefit). However, for this BCA, increases in
local emissions were estimated based on Bronx County values, while reduction in grid emissions were
estimated based on New York State-wide values. The resulting estimates were substantially higher for the
Bronx, valuing local emissions nearly five times higher than those displaced from the grid.
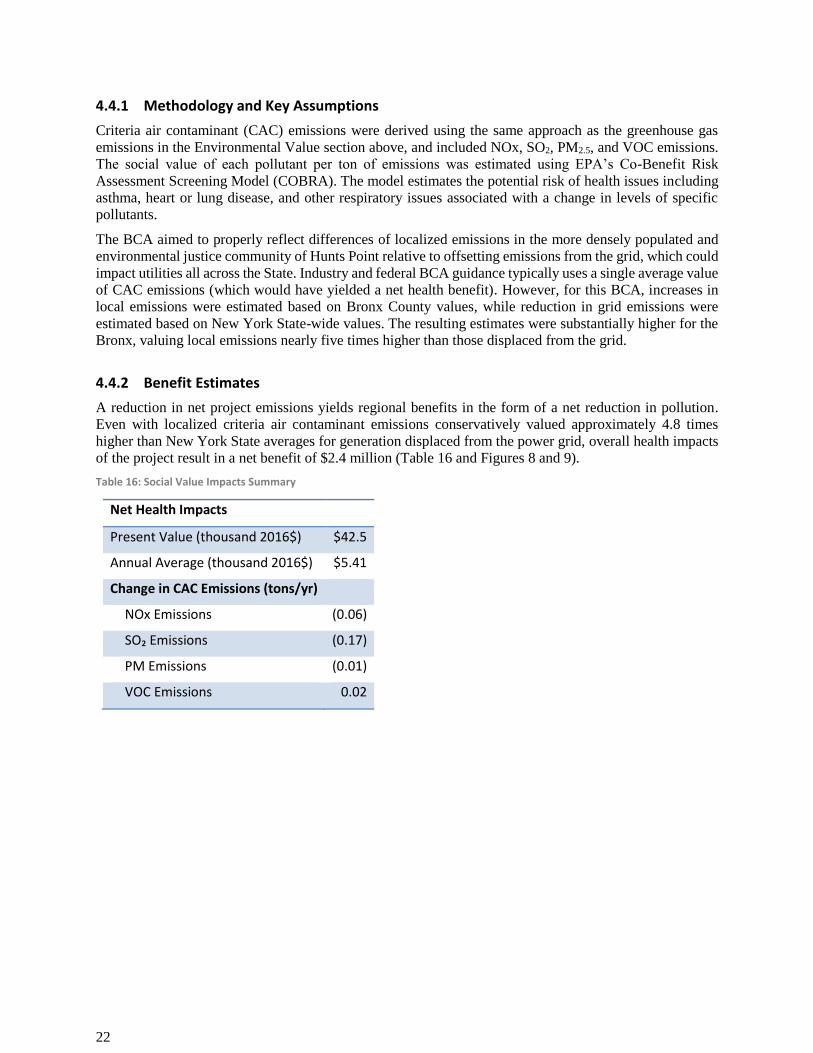
4.4.2 Benefit Estimates
A reduction in net project emissions yields regional benefits in the form of a net reduction in pollution.
Even with localized criteria air contaminant emissions conservatively valued approximately 4.8 times
higher than New York State averages for generation displaced from the power grid, overall health impacts
of the project result in a net benefit of $2.4 million (Table 16 and Figures 8 and 9).
Table 16: Social Value Impacts Summary
Net Health Impacts
Present Value (thousand 2016$) $42.5
Annual Average (thousand 2016$) $5.41
Change in CAC Emissions (tons/yr)
NOx Emissions (0.06)
SO₂ Emissions (0.17)
PM Emissions (0.01)
VOC Emissions 0.02

23
Figure 8: Criteria Air Contaminant Emissions
Figure 9: Monetized Health Impacts
4.5 Economic Revitalization
The project will create both temporary and permanent job opportunities during construction and operations.
These employment estimates are based on labor required for past comparable installation projects. The
project construction duration varies from only 2 months for the community generators, to 6-18 months for
solar PV and energy storage installations, and 20 months for the Produce Market turbine resulting in an
estimated peak construction workforce of 73 people, as well as 8 permanent and 6 on-call employees going
forward. These estimates assume staff required for individual installations and do not account for potential
efficiencies between buildings where the same employees could service different equipment
simultaneously.
In addition to direct employment, the project will provide training and development opportunities as well as serve to
improve the competitive advantage of the Peninsula (Table 17).
Table 17: Employment
Construction Jobs
Construction Workforce 73
Permanent Employment 8 permanent,
6 on-call
4.6 Other Non-monetized Impacts
There are other potential effects that have not been monetized in the analysis that provide value to the community.
These include:
The ability for the Middle School (MS) 424 and Primary School (PS) 48 to support community and
emergency functions in major power outages. This will enable the schools to either be used as
emergency gathering locations for the community, or to maintain core administrative functions.

24
The BCA does not anticipate that the schools will stay open for students in major power outage
circumstances.
The FDC provides food products throughout NYC. Maintaining business function in major power
outages secures food supply to the region. Without a secure supply during major outages, there will
be food shortages that potentially result in higher food prices throughout the study area.
5 Project Risks and Implementation Challenges
5.1 Risks to Ongoing Project Benefits
The major ongoing benefit from the Energy Resiliency pilot project is maintaining business functions at
the Produce and Fish Markets in the FDC, including the preservation of existing inventories at these
facilities.
One risk that could disrupt this benefit is a major flood or storm event that disrupts business activity at the
markets such that one cannot access the markets for an extended period of time or an event that results in
significant property damage at the facilities that requires operations to be shut down for repairs. In this
situation, while power is maintained from the Energy Resiliency pilot project which includes flood
protections as part of conceptual design, there could still be a loss of business function. The inventory would
still be maintained, but ongoing revenues would not be preserved.
5.2 Project Implementation Challenges
The screening of Energy Resiliency technologies and project packages considered constructability and
implementation challenges as key criteria. Overall, the screening criteria were developed based on HUD
funding requirements, the AWG’s Implementation Principles (see Appendix A), and industry standards as
referenced. The output of this screening process was a list of technologies with limited implementation
challenges. In addition, only proven technologies were considered; project technologies were evaluated for
their proven capability to provide the intended service.
From a constructability perspective, the following was considered:
Available & Suitable Space: Project space requirements were evaluated against available useable
space in the vicinity of the proposed application. Functionality was evaluated based on sufficient
space, disposition (purchase, easement, or other agreement), geotechnical, hazardous waste, and
underground utility constraints.
Ease of Permitting: Projects were evaluated for regulatory and permitting considerations that may
require more significant coordination, approvals, and/or schedules for implementation due to
anticipated environmental impact or administrative considerations.
Required Infrastructure: Projects were evaluated against the quantity and types of infrastructure
improvements that would be required for the installation and operation of the facility. Availability
of gas, water, structures, electrical interconnection, and other factors were considered.
From an implementation perspective, the following was considered:
Potential to Leverage Public or Private Funds: Projects were evaluated for their potential to leverage public
or private funds, with the identification of potential funding sources that have been successfully utilized for
precedent projects/investments being evaluated more highly. Projects could also be evaluated highly for
potential to capitalize upon avoided losses, such as lowered flood insurance premiums.
Schedule (in years) to Plan, Design and Construct: Projects were evaluated on the estimated time to plan,
design, permit, and construct from completion of conceptual design in 2017.

25
As such, only the most realistic and feasible Energy Resiliency technologies and project packages passed the screening
process at the outset. Some key requirements or risks are outlined below.
o Con Edison Agreement: Con Edison is a key partner for the design and construction of a first
phase microgrid and solar plus storage project package. In addition, significant dependence upon
utilization of the existing Con Edison infrastructure for the microgrid will require agreement on the
terms and conditions of equipment utilization and system control, including the conditions under
which Con Edison will depower its lines (for example, during a tidal surge when generation might
be needed). This is not expected to be an issue with the pilot project as the initial microgrid
infrastructure is outside identified flood zone areas. The City and Con Edison have also been
coordinating regularly to ensure successful design and implementation of the pilot project and plan
to draft an agreement regarding the terms and conditions of the project.
o Regulatory: Implementation of the Hunts Point Resiliency Project will involve federal, state, and
local permits and authorizations. Permits and authorizations cannot be obtained until the project
design is further advanced. Coordination with federal, state, and city agencies that are potentially
involved in the environmental review and regulatory permitting processes have already begun.
Further coordination will continue after the identification of the pilot project to ensure that all
required permits and authorizations will be obtained prior to groundbreaking.
o Stakeholder buy-in: The City is conducting a robust stakeholder engagement process with design
and facilitation support from the Interaction Institute for Social Change and additional outreach and
engagement leadership from The Point Community Development Corporation. The City and
community’s engagement activities began in 2015 to inform the project scope before kickoff.
Building upon efforts in 2015, engagement for the Hunts Point Resiliency Project now includes a
multi-pronged approach designed to:
o Disseminate information in order to educate the public;
o Incorporate input directly into technical analyses; and
o Coordinate with other community-based resiliency efforts, leadership training, and workforce/
economic development opportunities.
The engagement process and structure for this project are viewed as contributing factors to resiliency in the Hunts
Point community by ensuring transparency, robust information flows, social learning, skill development and
relationship/trust building. The stakeholders will continue to be engaged throughout conceptual design and
environmental review for the pilot project.
6 Summary of Findings and BCA Outcomes
Overall, the BCA shows positive outcomes with a $39 million net present value, 2.22 BCR, and an internal
rate of return (20.8%) that is well above the 7% hurdle rate. Tables 18 and 19 as well as Figure 10 below
summarize the results by monetized impact category.
Table 18: Summary of Monetized Impacts

26
All Monetized Impacts (M 2016$) Undiscounted NPV (7%)
Energy Cost Savings $4.52 $1.65
Generation Capacity Cost Savings $2.55 $0.96
Power Outage Reduction Benefits - Markets and Businesses $176.68 $66.73
Power Outage Reduction Benefits - Community Facilities $1.22 $0.46
Reliability Improvements $0.17 $0.07
GHG Emissions $0.31 $0.11
Health Impacts $0.11 $0.04
Adjustment for Grid Emission Compliance Costs ($0.10) ($0.04)
Total Benefits $185.45 $69.98
Capital Costs ($39.91) ($28.95)
O&M Costs ($6.74) ($2.26)
Fuel Costs ($0.76) ($0.28)
Total Costs ($47.41) ($31.49)
Net Impact $138.05 $38.49
Table 19: BCA Results
Millions of 2016$ - Discounted at 7%
Benefits (PV) $69.98
Costs (PV) ($31.49)
Net Present Value (NPV) $38.49
Benefit-Cost Ratio (BCR) 2.22
Internal Rate of Return (IRR) 20.8%
Discounted Pay-back Period (yrs) 8.64
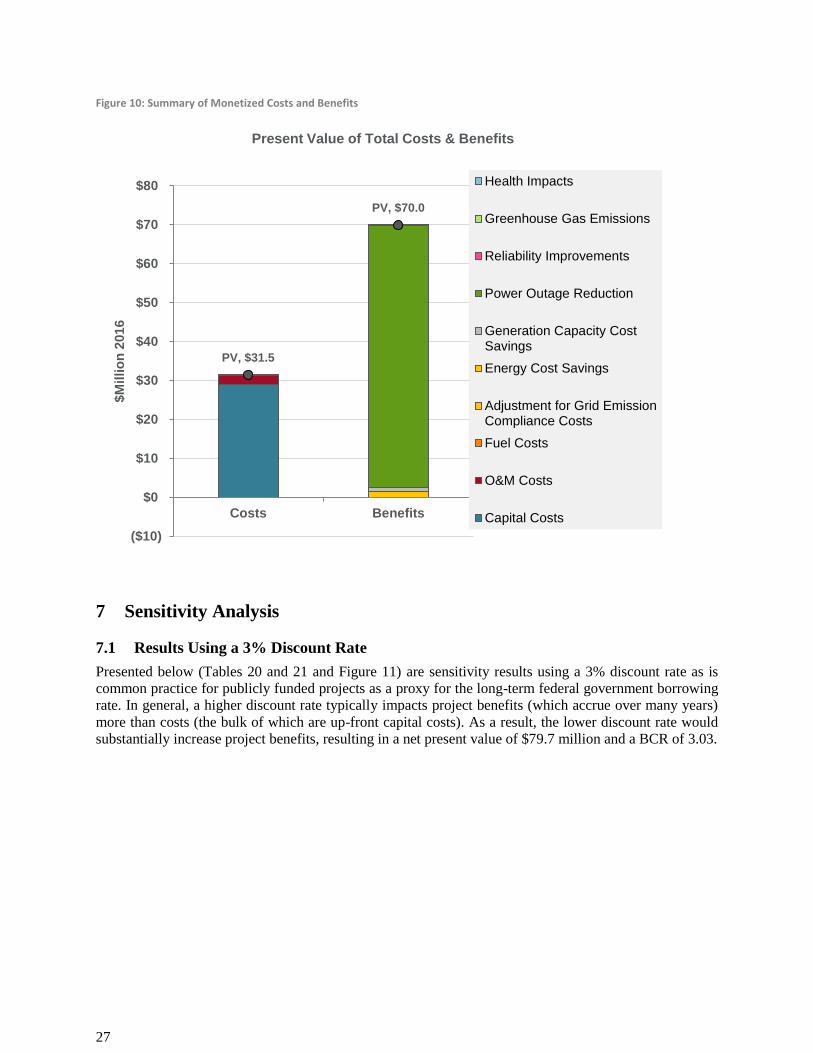
27
Figure 10: Summary of Monetized Costs and Benefits
7 Sensitivity Analysis
7.1 Results Using a 3% Discount Rate
Presented below (Tables 20 and 21 and Figure 11) are sensitivity results using a 3% discount rate as is
common practice for publicly funded projects as a proxy for the long-term federal government borrowing
rate. In general, a higher discount rate typically impacts project benefits (which accrue over many years)
more than costs (the bulk of which are up-front capital costs). As a result, the lower discount rate would
substantially increase project benefits, resulting in a net present value of $79.7 million and a BCR of 3.03.
PV, $31.5
PV, $70.0
($10)
$0
$10
$20
$30
$40
$50
$60
$70
$80
Costs Benefits
$M
illio
n 2
016
Present Value of Total Costs & Benefits
Health Impacts
Greenhouse Gas Emissions
Reliability Improvements
Power Outage Reduction
Generation Capacity CostSavings
Energy Cost Savings
Adjustment for Grid EmissionCompliance Costs
Fuel Costs
O&M Costs
Capital Costs

28
Table 20: Summary of Monetized Impacts (Sensitivity – 3% Discount Rate)
All Monetized Impacts (M 2016$) NPV (3%)
Energy Cost Savings $2.85
Generation Capacity Cost Savings $1.64
Power Outage Reduction Benefits - Markets $113.37
Power Outage Reduction Benefits - Community Facilities $0.78
Reliability Improvements $0.11
GHG Emissions $0.19
Health Impacts $0.07
Adjustment for Grid Emission Compliance Costs ($0.06)
Total Benefits $118.95
Capital Costs ($34.68)
O&M Costs ($4.09)
Fuel Costs ($0.48)
Total Costs ($39.26)
Net Impact $79.69
Table 21: BCA Results (Sensitivity – 3% Discount Rate)
Millions of 2016$ - Discounted at 3%
Benefits (PV) $118.95
Costs (PV) ($39.26)
Net Present Value (NPV) $79.69
Benefit-Cost Ratio (BCR) 3.03
Internal Rate of Return (IRR) 20.8%
Discounted Pay-back Period (yrs) 7.89

29
Figure 1: Summary of Monetized Costs and Benefits (Sensitivity – 3% Discount Rate)
.
PV, $39.3
PV, $119.0
($20)
$0
$20
$40
$60
$80
$100
$120
$140
Costs Benefits
$M
illio
n 2
016
Present Value of Total Costs & Benefits
Health Impacts
Greenhouse GasEmissions
Reliability Improvements
Power Outage Reduction
Generation CapacityCost Savings
Energy Cost Savings
Fuel Costs
O&M Costs
Capital Costs