Embed Size (px)
Citation preview

THE
CH
UG
OK
U B
AN
K, LTD
. AN
NU
AL R
EP
OR
T 2015
2 0 1 5ANNUAL REPORT
Chugin Heart
T H E C H U G O K U B A N K , L T D .
005_0410501372709.indd 3 2015/09/11 20:27:55
Okayama(Head Office)
Yonago
HiroshimaKobe
Osaka
Takamatsu
Tokyo
Shanghai
Hong Kong
Bangkok
Okayama
Singapore
New York
Hiroshima
Okayama
Tottori
Hyogo
Kagawa
Ehime
Hiroshima Port of MizushimaOkayama Kobe
Okayama Airport
Takamatsu
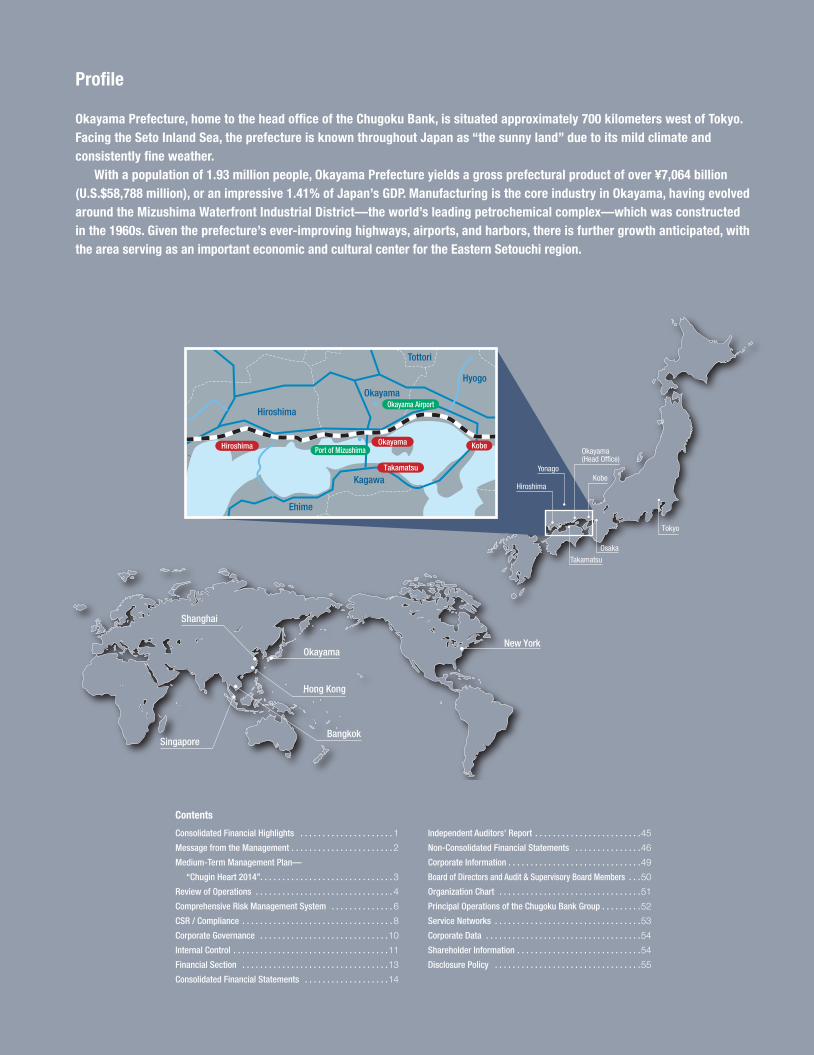
Profile
Okayama Prefecture, home to the head office of the Chugoku Bank, is situated approximately 700 kilometers west of Tokyo. Facing the Seto Inland Sea, the prefecture is known throughout Japan as “the sunny land” due to its mild climate and consistently fine weather.
With a population of 1.93 million people, Okayama Prefecture yields a gross prefectural product of over ¥7,064 billion (U.S.$58,788 million), or an impressive 1.41% of Japan’s GDP. Manufacturing is the core industry in Okayama, having evolved around the Mizushima Waterfront Industrial District—the world’s leading petrochemical complex—which was constructed in the 1960s. Given the prefecture’s ever-improving highways, airports, and harbors, there is further growth anticipated, with the area serving as an important economic and cultural center for the Eastern Setouchi region.
Consolidated Financial Highlights . . . . . . . . . . . . . . . . . . . . . 1
Message from the Management . . . . . . . . . . . . . . . . . . . . . . . 2
Medium-Term Management Plan—
“Chugin Heart 2014” . . . . . . . . . . . . . . . . . . . . . . . . . . . . . . 3
Review of Operations . . . . . . . . . . . . . . . . . . . . . . . . . . . . . . . 4
Comprehensive Risk Management System . . . . . . . . . . . . . . 6
CSR / Compliance . . . . . . . . . . . . . . . . . . . . . . . . . . . . . . . . . . 8
Corporate Governance . . . . . . . . . . . . . . . . . . . . . . . . . . . . .10
Internal Control . . . . . . . . . . . . . . . . . . . . . . . . . . . . . . . . . . .11
Financial Section . . . . . . . . . . . . . . . . . . . . . . . . . . . . . . . . .13
Consolidated Financial Statements . . . . . . . . . . . . . . . . . . .14
Independent Auditors’ Report . . . . . . . . . . . . . . . . . . . . . . . .45
Non-Consolidated Financial Statements . . . . . . . . . . . . . . .46
Corporate Information . . . . . . . . . . . . . . . . . . . . . . . . . . . . . .49
Board of Directors and Audit & Supervisory Board Members . . .50
Organization Chart . . . . . . . . . . . . . . . . . . . . . . . . . . . . . . . .51
Principal Operations of the Chugoku Bank Group . . . . . . . . .52
Service Networks . . . . . . . . . . . . . . . . . . . . . . . . . . . . . . . . .53
Corporate Data . . . . . . . . . . . . . . . . . . . . . . . . . . . . . . . . . . .54
Shareholder Information . . . . . . . . . . . . . . . . . . . . . . . . . . . .54
Disclosure Policy . . . . . . . . . . . . . . . . . . . . . . . . . . . . . . . . .55
Contents
005_0410501372709.indd 4 2015/09/11 20:27:55
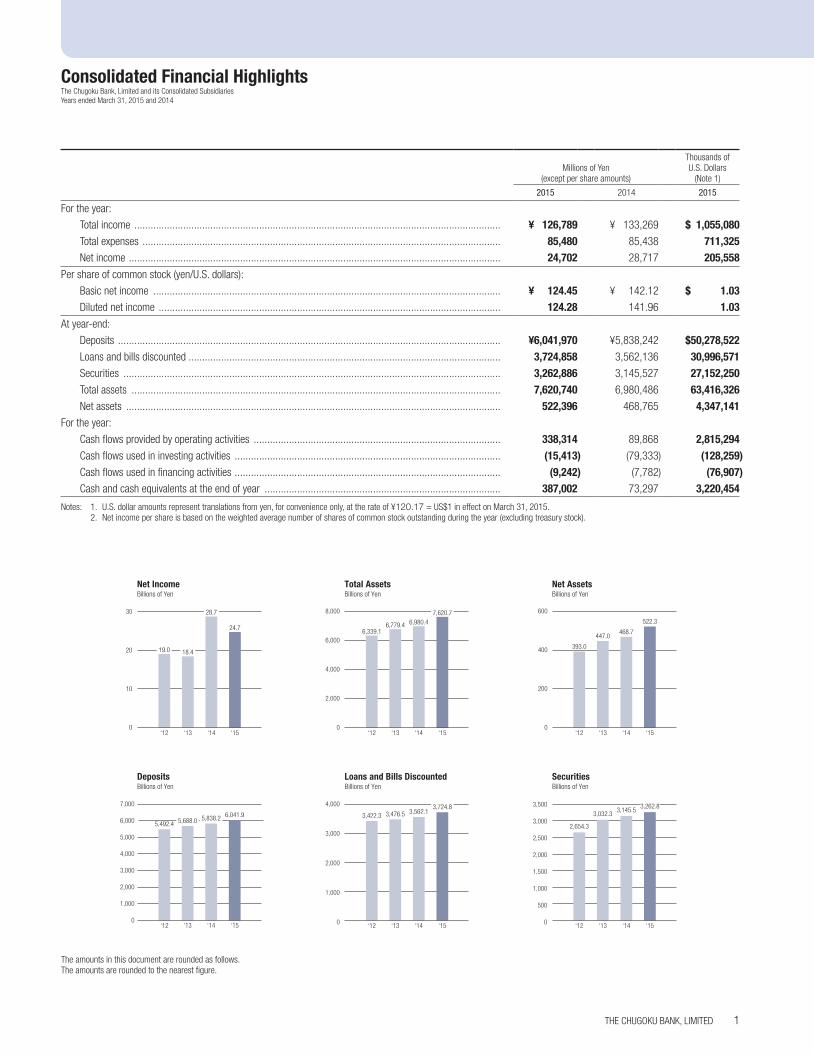
Consolidated Financial HighlightsThe Chugoku Bank, Limited and its Consolidated SubsidiariesYears ended March 31, 2015 and 2014
Millions of Yen(except per share amounts)
Thousands ofU.S. Dollars
(Note 1)
2015 2014 2015
For the year:
Total income ....................................................................................................................................... ¥ 126,789 ¥ 133,269 $ 1,055,080 Total expenses .................................................................................................................................... 85,480 85,438 711,325 Net income ......................................................................................................................................... 24,702 28,717 205,558
Per share of common stock (yen/U.S. dollars):
Basic net income ................................................................................................................................ ¥ 124.45 ¥ 142.12 $ 1.03 Diluted net income .............................................................................................................................. 124.28 141.96 1.03
At year-end:
Deposits ............................................................................................................................................. ¥6,041,970 ¥5,838,242 $50,278,522 Loans and bills discounted ................................................................................................................... 3,724,858 3,562,136 30,996,571 Securities ........................................................................................................................................... 3,262,886 3,145,527 27,152,250 Total assets ........................................................................................................................................ 7,620,740 6,980,486 63,416,326 Net assets .......................................................................................................................................... 522,396 468,765 4,347,141
For the year:
Cash flows provided by operating activities ........................................................................................... 338,314 89,868 2,815,294 Cash flows used in investing activities .................................................................................................. (15,413) (79,333) (128,259)Cash flows used in financing activities .................................................................................................. (9,242) (7,782) (76,907)Cash and cash equivalents at the end of year ....................................................................................... 387,002 73,297 3,220,454
Notes: 1. U.S. dollar amounts represent translations from yen, for convenience only, at the rate of ¥120.17 = US$1 in effect on March 31, 2015. 2. Net income per share is based on the weighted average number of shares of common stock outstanding during the year (excluding treasury stock).
Loans and Bills Discounted Billions of Yen
Securities Billions of Yen
Net Income Billions of Yen
Net AssetsBillions of Yen
Total Assets Billions of Yen
Deposits Billions of Yen
0
1,000
2,000
3,000
4,000
0
500
1,000
1,500
2,000
3,500
3,000
2,500
0
2,000
8,000
4,000
6,000
0
10
30
20
0
3,000
2,000
1,000
4,000
5,000
6,000
7,000
0
200
400
600
‘15 ‘15 ‘15
‘15 ‘15 ‘15
‘13 ‘13 ‘13
‘13 ‘13 ‘13
‘12 ‘12 ‘12
‘12 ‘12 ‘12
6,339.1
393.0
2,654.3
3,422.35,492.4
19.0
6,779.4
447.0
3,032.33,476.55,688.0
18.4
‘14 ‘14 ‘14
‘14 ‘14 ‘14
6,980.4
468.7
3,145.53,562.15,838.2
28.7 7,620.7522.3
3,262.83,724.86,041.9
24.7
The amounts in this document are rounded as follows.The amounts are rounded to the nearest figure.
THE CHUGOKU BANK, LIMITED 1
010_0410501372709.indd 1 2015/09/08 18:44:10

Message from the Management
No matter how the times or the economic conditions may change, we retain the same mission of following a path of co-existence and co-prosperity with our customers, and the same philosophy of contributing to the local community through comprehensive financial services.
Returning to the basic concept that growth of the region is what will fuel the growth of our Bank, our vision is to create a virtuous cycle where the satisfaction and impact our customers feel in turn expands our management base and motivates our employees.
Under such circumstances, under the belief that building more strengthened relationship with local customers by providing excellent comprehensive financial services will support the sustainable growth of the local community, we are steadily implementing each main measure of Medium-Term Management Plan “Chugin Heart 2014.”
Strengthening Sales Capabilities1. Corporate Sales Business“Promotion of new loans and community-based financial services”The Bank newly opened Nishinomiya branch in December 2014 to expand the network of branches even more. As a result, a line was formed between Hiroshima city and Osaka city by filling the gap in branches in Kobe and Osaka and we are promoting more community-based operation.
We vested more authority of financing to the heads of branches and revised the performance award system to encourage them to take on risks proactively. Our headquarters and domestic branches will continue closely reviewing various projects together and we will work as one to promote community-based financial services.
“Supporting growth fields and regional revitalization”Under the philosophy that no development is possible for the Bank without regional development, we established an internal system to support the “Long-Term Vision for the Vitalization of Towns, People, and Jobs,” and the “Comprehensive Strategy for the Vitalization of Towns, People, and Jobs” established by the Cabinet in December 2014. Each head of branches are appointed as “personnel in charge of vitalization” and are actively participating in activities including attending and offering opinions at development meetings of the localized comprehensive strategies, and providing various services.
Aiming to enhance cooperation between private and public sectors with respect to regional vitalization, the Bank entered into a comprehensive agreement with Okayama prefecture and newly launched the “Chugin Harenokuni Financing Program for Establishment of New Business Facilities” and a preferential housing loan program for people relocating or permanently moving to Okayama prefecture.
The Bank will continue to actively supporting various growth sectors such as medical and nursing services, environmental energy, and agribusiness.
“Supporting customers for overseas expansion”The Bank is working on a planned migration to offer overseas remittance operations at all branches excluding those specialized in services for individual customers.
The Bank entered into an agreement in September 2014 with participants of the TSUBASA Project (The Chiba Bank, Ltd., The Daishi Bank, Ltd., The Toho Bank, Ltd., The Iyo Bank, Ltd., and The Hokkoku Bank,Ltd.,) to strengthen ties in international operations.
We worked jointly to exchange human resources such as accepting and dispatching trainees, to utilize overseas bases, to organize business discussion meetings and seminars, and to develop market –related instruments. The Bank will provide optimized solutions for our customers by further sharing and efficiently utilizing management resources and know-how.
“Supporting management improvement and business rehabilitation”The “Okayama Revitalization Fund,” which is mainly aimed at corporate rehabilitation, was expanded in scope of use to include management improvement and business succession.
We will further enhance utilization of “V-Support Loan,” new-loan program for customers changing conditions and commit to fostering staff’s capabilities in judgment.
2. Individual Sales Business“Development of framework of business structure”To offer proposals of asset building for a broad range of customers, we launched the “Chugin Insurance Call Center” and the “Chugin Insurance Plaza at Okayama station” and we will strive to offer services more actively to meet needs of customers. As for credit card business, we started issuance of regional cards (“Harenokuni Cards”) aimed at contributing to the local economy by promoting issue and use of credit card points within the region.
As for unsecured individual loans, we enhanced sales promotions through website improvement and TV advertising and created promotional tools.
We aim to become a lifelong bank for customers and work to build a business structure that matches the life plans of our customers.
“Coordination with affiliates”The Bank’s securities subsidiary, Chugin Securities Co., Ltd., shall seek for improvement of customer convenience through the expansion and optimization of its
securities business domain in line with those of the Bank’s banking operations, and also develop a business structure fully equipped to capitalize on the unified taxation system on income from all financial products, which commences from January 2016.
Chugin Asset Management Company Limited has established and commenced handling of the third public investment trust.
We will continue providing the best possible services to regional customers, with full coordination with other affiliates across the Group.
3. Investing in Securities We will engage in flexible asset allocation, based on continuous and constant earnings in order to disperse risks and further sophisticate and diversify operations.
Cultivation of Human Resources4. Reforming Organizational CultureWe will practice “Chugin’s Mind,” with all the officers and employees of the Chugoku Bank Group working toward the same goal and strive to improve organization strength to impress and provide satisfaction to our customers.
5. Systematic Cultivation of Human Resources We started new training system, restructuring the training for each grade and work type. We will continue to work on establishing an internal system to evaluate and improve practical sales capabilities of our employees.
6. Creating Opportunities for Diversified TalentsWe have launched the “Nijiiro Heart Project” organized with the Bank’s female employees to widen the access to opportunities for women. We will work toward creation of work place where employees can take pride and pleasure, sophisticating policies related to human resources based on issues discussed in the project.
Management administrative system7. Low Cost StructureWe are implementing adequate expense management system by initiatives including establishing a cost management center and launching the cost management committee. We will continue our efforts to improve earnings through adequate cost control.
8. Implementation of Efficient OperationsWe have organized a reform project of branch operations and are implementing various measures to streamline administrative operations.
9. Compliance and System StrategiesWe are determined to strictly enforce compliance, from the prevention of misconduct to compliance with various regulations. With respect to system strategies, we are working on the steady development of the TSUBASA collaboration system toward its commencement of operations in May 2017.
Corporate Social ResponsibilityWe will remain engaged in regional contributions through our financial operations as well as wider social action programs that go beyond the boundary of the financial business.
June 2015
Masato Miyanaga,President
We aim to create a virtuous cycle of growth with our community and customers.
THE CHUGOKU BANK, LIMITED2
010_0410501372709.indd 2 2015/09/08 18:44:10
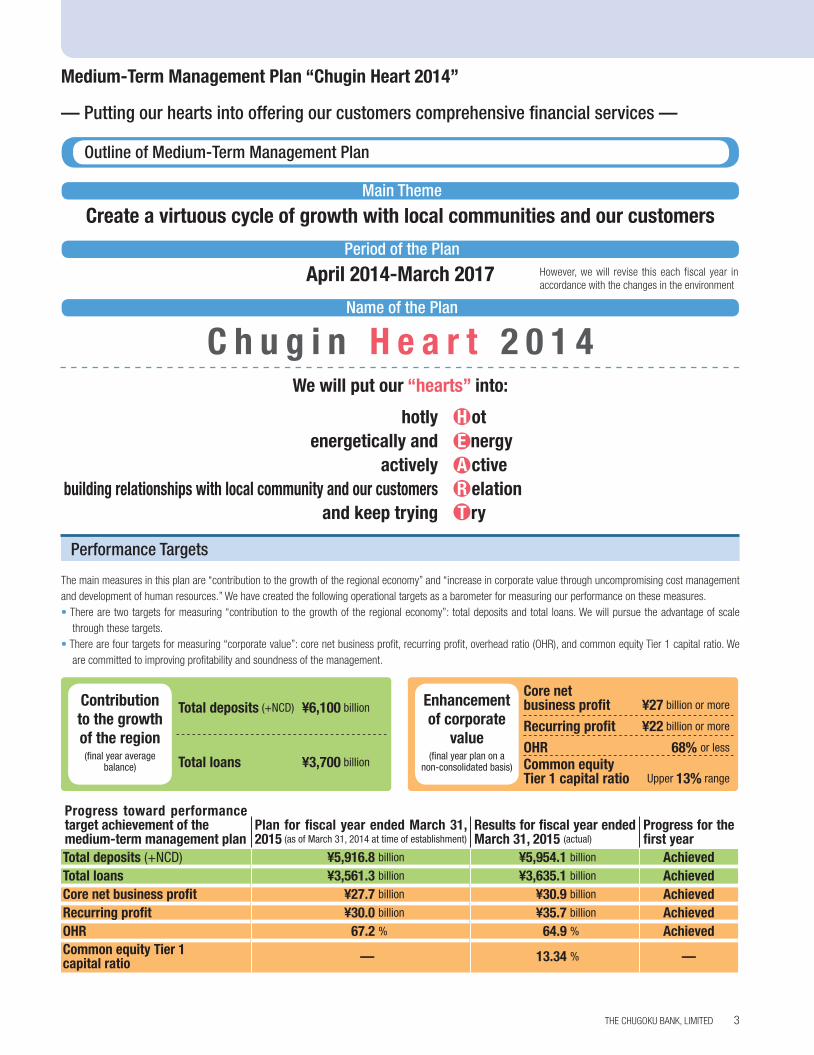
Create a virtuous cycle of growth with local communities and our customers
C h u g i n H e a r t 2 0 1 4
Performance Targets
The main measures in this plan are “contribution to the growth of the regional economy” and “increase in corporate value through uncompromising cost management and development of human resources.” We have created the following operational targets as a barometer for measuring our performance on these measures.• There are two targets for measuring “contribution to the growth of the regional economy”: total deposits and total loans. We will pursue the advantage of scale
through these targets.• There are four targets for measuring “corporate value”: core net business profit, recurring profit, overhead ratio (OHR), and common equity Tier 1 capital ratio. We
are committed to improving profitability and soundness of the management.
Main Theme
Period of the Plan
Name of the Plan
April 2014-March 2017 However, we will revise this each fiscal year in accordance with the changes in the environment
Contribution to the growth of the region(final year average
balance)
Enhancement of corporate
value(final year plan on a
non-consolidated basis)
Total deposits (+NCD) ¥6,100 billion
Total loans ¥3,700 billion
Core net business profit ¥27 billion or more
Recurring profit ¥22 billion or more
OHR 68% or less
Common equity Tier 1 capital ratio Upper 13% range
We will put our “hearts” into:
hotly H ot energetically and E nergy actively A ctive building relationships with local community and our customers R elation and keep trying T ry
Outline of Medium-Term Management Plan
Progress toward performance target achievement of the medium-term management plan
Plan for fiscal year ended March 31, 2015 (as of March 31, 2014 at time of establishment)
Results for fiscal year ended March 31, 2015 (actual)
Progress for the first year
Total deposits (+NCD) ¥5,916.8 billion ¥5,954.1 billion AchievedTotal loans ¥3,561.3 billion ¥3,635.1 billion AchievedCore net business profit ¥27.7 billion ¥30.9 billion AchievedRecurring profit ¥30.0 billion ¥35.7 billion AchievedOHR 67.2 % 64.9 % AchievedCommon equity Tier 1 capital ratio — 13.34 % —
Medium-Term Management Plan “Chugin Heart 2014”
— Putting our hearts into offering our customers comprehensive financial services —
THE CHUGOKU BANK, LIMITED 3
010_0410501372709.indd 3 2015/09/08 18:44:10
Financial ConditionResults by business segment are as follows.
Banking businessIn the banking business, recurring income decreased by ¥8,546 million year on year, or 7.2%, to ¥109,307 million, while recurring profit decreased by ¥8,379 million year on year, or 18.9%, to ¥35,770 million.
Leasing businessIn the leasing business, recurring income decreased by ¥3 million year on year, or 0.0%, to ¥11,378 million, while recurring profit decreased by ¥75 million year on year, or 9.4%, to ¥721 million.
Securities businessIn the securities business, recurring income increased by ¥690 million year on year, or 20.5%, to ¥4,047 million, while recurring profit increased by ¥111 million year on year, or 14.4%, to ¥877 million.
OtherFor other business, recurring income increased by ¥161 million year on year, or 3.3%, to ¥4,972 million, while recurring profit decreased by ¥150 million year on year, or 6.3%, to ¥2,207 million.
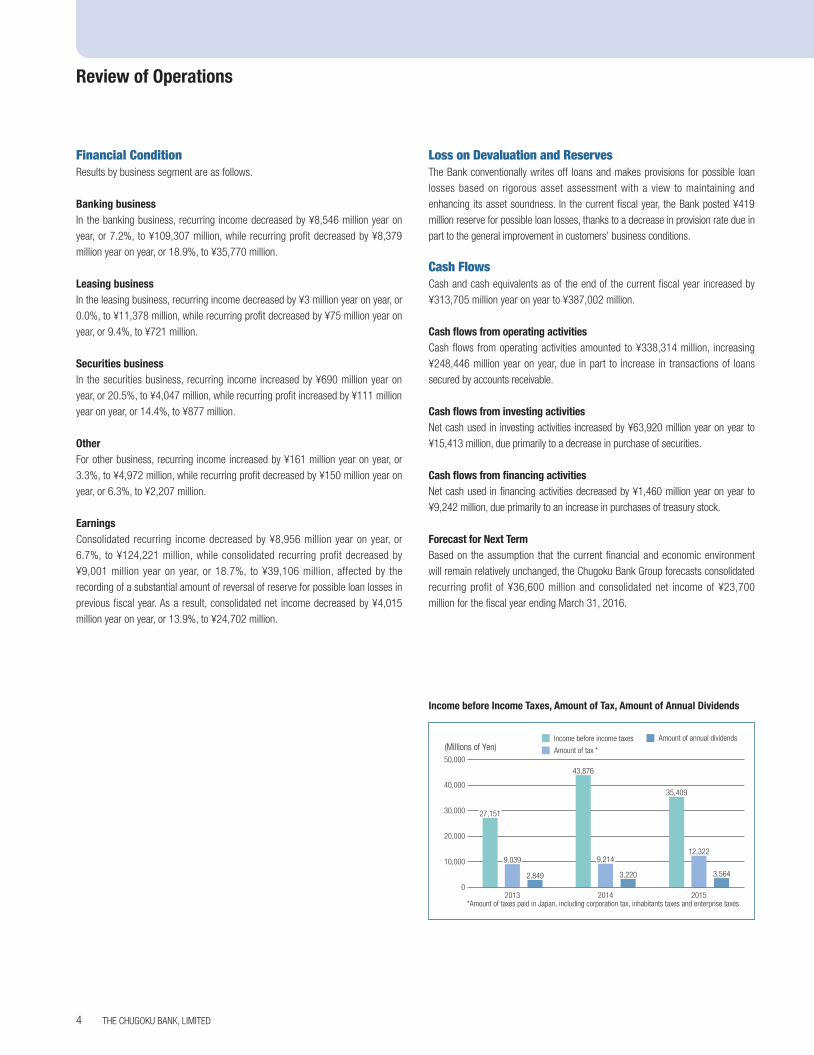
EarningsConsolidated recurring income decreased by ¥8,956 million year on year, or 6.7%, to ¥124,221 million, while consolidated recurring profit decreased by ¥9,001 million year on year, or 18.7%, to ¥39,106 million, affected by the recording of a substantial amount of reversal of reserve for possible loan losses in previous fiscal year. As a result, consolidated net income decreased by ¥4,015 million year on year, or 13.9%, to ¥24,702 million.
Loss on Devaluation and ReservesThe Bank conventionally writes off loans and makes provisions for possible loan losses based on rigorous asset assessment with a view to maintaining and enhancing its asset soundness. In the current fiscal year, the Bank posted ¥419 million reserve for possible loan losses, thanks to a decrease in provision rate due in part to the general improvement in customers’ business conditions.
Cash FlowsCash and cash equivalents as of the end of the current fiscal year increased by ¥313,705 million year on year to ¥387,002 million.
Cash flows from operating activitiesCash flows from operating activities amounted to ¥338,314 million, increasing ¥248,446 million year on year, due in part to increase in transactions of loans secured by accounts receivable.
Cash flows from investing activitiesNet cash used in investing activities increased by ¥63,920 million year on year to ¥15,413 million, due primarily to a decrease in purchase of securities.
Cash flows from financing activitiesNet cash used in financing activities decreased by ¥1,460 million year on year to ¥9,242 million, due primarily to an increase in purchases of treasury stock.
Forecast for Next TermBased on the assumption that the current financial and economic environment will remain relatively unchanged, the Chugoku Bank Group forecasts consolidated recurring profit of ¥36,600 million and consolidated net income of ¥23,700 million for the fiscal year ending March 31, 2016.
Income before Income Taxes, Amount of Tax, Amount of Annual Dividends
0
10,000
20,000
30,000
50,000
40,000
Income before income taxes
Amount of tax *
Amount of annual dividends(Millions of Yen)
*Amount of taxes paid in Japan, including corporation tax, inhabitants taxes and enterprise taxes2015
35,409
12,322
3,564
2014
43,876
9,214
3,220
2013
9,039
2,849
27,151
Review of Operations
THE CHUGOKU BANK, LIMITED4
010_0410501372709.indd 4 2015/09/08 18:44:10
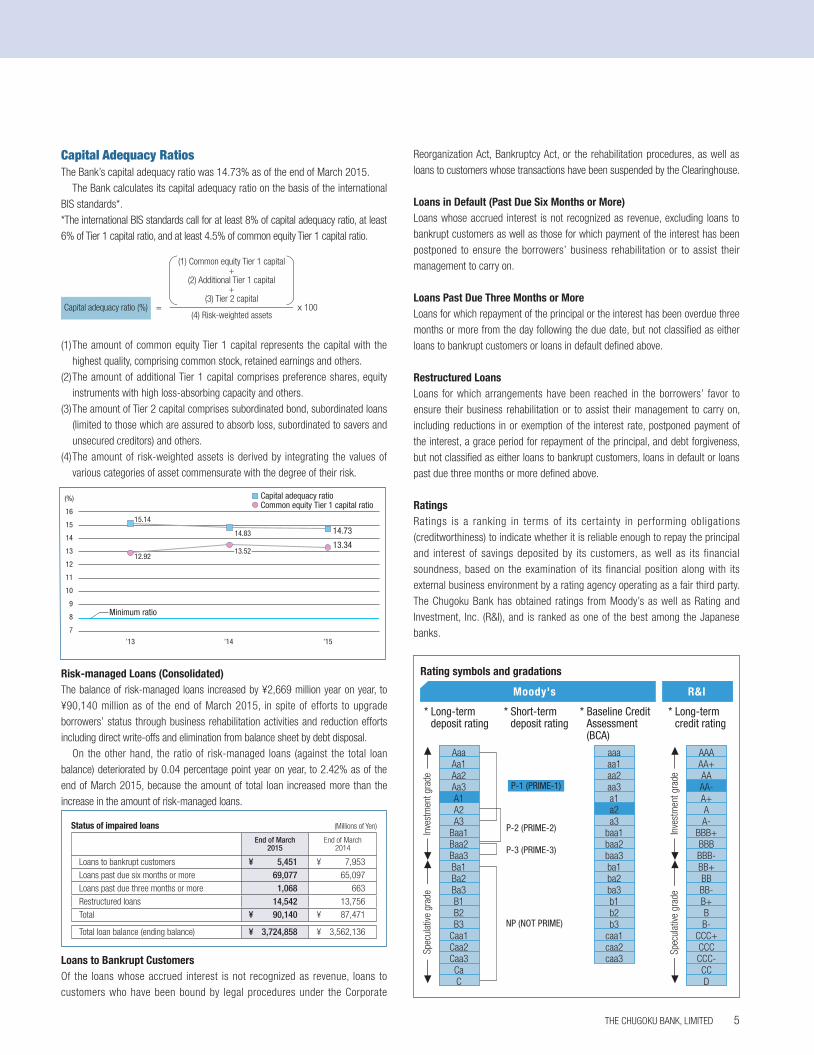
Capital Adequacy RatiosThe Bank’s capital adequacy ratio was 14.73% as of the end of March 2015.
The Bank calculates its capital adequacy ratio on the basis of the international BIS standards*.*The international BIS standards call for at least 8% of capital adequacy ratio, at least 6% of Tier 1 capital ratio, and at least 4.5% of common equity Tier 1 capital ratio.
Capital adequacy ratio (%) = x 100
(1) Common equity Tier 1 capital+
(2) Additional Tier 1 capital+
(3) Tier 2 capital
(4) Risk-weighted assets
(1) The amount of common equity Tier 1 capital represents the capital with the highest quality, comprising common stock, retained earnings and others.
(2) The amount of additional Tier 1 capital comprises preference shares, equity instruments with high loss-absorbing capacity and others.
(3) The amount of Tier 2 capital comprises subordinated bond, subordinated loans (limited to those which are assured to absorb loss, subordinated to savers and unsecured creditors) and others.
(4) The amount of risk-weighted assets is derived by integrating the values of various categories of asset commensurate with the degree of their risk.
Risk-managed Loans (Consolidated)The balance of risk-managed loans increased by ¥2,669 million year on year, to ¥90,140 million as of the end of March 2015, in spite of efforts to upgrade borrowers’ status through business rehabilitation activities and reduction efforts including direct write-offs and elimination from balance sheet by debt disposal.
On the other hand, the ratio of risk-managed loans (against the total loan balance) deteriorated by 0.04 percentage point year on year, to 2.42% as of the end of March 2015, because the amount of total loan increased more than the increase in the amount of risk-managed loans.
Loans to Bankrupt CustomersOf the loans whose accrued interest is not recognized as revenue, loans to customers who have been bound by legal procedures under the Corporate
(%)
7
8
9
10
11
12
13
15
14
16
Minimum ratio
Capital adequacy ratioCommon equity Tier 1 capital ratio
’13 ’14
15.14
12.92
’15
14.73
13.3414.83
13.52
Status of impaired loans (Millions of Yen)
End of March 2015
End of March 2014
Loans to bankrupt customers ¥ 5,451 ¥ 7,953
Loans past due six months or more 69,077 65,097
Loans past due three months or more 1,068 663
Restructured loans 14,542 13,756
Total ¥ 90,140 ¥ 87,471
Total loan balance (ending balance) ¥ 3,724,858 ¥ 3,562,136
Reorganization Act, Bankruptcy Act, or the rehabilitation procedures, as well as loans to customers whose transactions have been suspended by the Clearinghouse.
Loans in Default (Past Due Six Months or More)Loans whose accrued interest is not recognized as revenue, excluding loans to bankrupt customers as well as those for which payment of the interest has been postponed to ensure the borrowers’ business rehabilitation or to assist their management to carry on.
Loans Past Due Three Months or MoreLoans for which repayment of the principal or the interest has been overdue three months or more from the day following the due date, but not classified as either loans to bankrupt customers or loans in default defined above.
Restructured LoansLoans for which arrangements have been reached in the borrowers’ favor to ensure their business rehabilitation or to assist their management to carry on, including reductions in or exemption of the interest rate, postponed payment of the interest, a grace period for repayment of the principal, and debt forgiveness, but not classified as either loans to bankrupt customers, loans in default or loans past due three months or more defined above.
RatingsRatings is a ranking in terms of its certainty in performing obligations (creditworthiness) to indicate whether it is reliable enough to repay the principal and interest of savings deposited by its customers, as well as its financial soundness, based on the examination of its financial position along with its external business environment by a rating agency operating as a fair third party. The Chugoku Bank has obtained ratings from Moody’s as well as Rating and Investment, Inc. (R&I), and is ranked as one of the best among the Japanese banks.
Rating symbols and gradationsIn
vest
men
t gra
deSp
ecul
ative
gra
de
AAAAA+AAAA-A+AA-
BBB+BBBBBB-BB+BBBB-B+BB-
CCC+CCCCCC-CCD
* Long-term credit rating
P-1 (PRIME-1)
P-2 (PRIME-2)
P-3 (PRIME-3)
NP (NOT PRIME)
* Short-term deposit rating
* Baseline Credit Assessment(BCA)
* Long-term deposit rating
Inve
stm
ent g
rade
Spec
ulat
ive g
rade
AaaAa1Aa2Aa3A1A2A3
Baa1Baa2Baa3Ba1Ba2Ba3B1B2B3
Caa1Caa2Caa3CaC
aaaaa1aa2aa3a1a2a3
baa1baa2baa3ba1ba2ba3b1b2b3
caa1caa2caa3
R&IMoody's
THE CHUGOKU BANK, LIMITED 5
010_0410501372709.indd 5 2015/09/08 18:44:10
Comprehensive Risk Management SystemThe Bank defines risk management as one of its critical management agenda and aims at well-balanced management in pursuit of enhanced profitability while maintaining operational soundness through further development of comprehensive risk management. To this end, risks are managed in accordance with the basic risk management rules which set out policies and framework of risk management for the entire Bank along with other basic matters on the subject.
Risks assumed by banks include credit risks, market risks, liquidity risks and operational risks. At the Chugoku Bank, we have established a system for managing the various types of risks comprehensively through the establishment of a controller for risk management as well as various committees such as the Asset and Liability Management (ALM) Committee. We also designate sections in charge of each risk and analyze the status of these risks by risk category, and evaluate and manage them for the entire bank. We have also established a system to ensure proper risk management on a continual basis under which the Audit & Inspection Department monitors the status of risk management by the various divisions.
In order to ensure the effectiveness of the comprehensive risk management, the Bank assesses and verifies the degree of capital adequacy by comparing its own capital with the total amount of risk the Bank is exposed to, as derived by aggregating the amounts of credit, market and operational risks calculated by statistical and other methods. Meanwhile, stress tests are conducted to assess and verify the risk events, for which amount of each category of risk is unlikely to have been fully identified. The results of such assessment and verification are utilized for the development and review of the operation plan and risk management policies, to ensure operational soundness while enhancing profitability at the same time. Furthermore, to ensure operational soundness on a constant basis, the Bank makes it a principle to conduct risk taking within the limit of the common equity Tier 1 capital excluding losses that are actualized under certain stress situations and net unrealized gains on available-for-sale-securities if its value is positive (unrealized gain), whereby risk amounts are monitored and managed within the risk limits established for each risk category.
Credit Risk ManagementCredit risk refers to the risks of losses incurred when the value of assets (including off-balance-sheet assets) declines or becomes worthless due to changes in the financial status of those to whom credit is provided.
The Bank’s basic credit risk management policy is, (within the scope of its management capabilities), to ensure that return is commensurate with risks in its transactions and to appropriately manage the credit risks of the diverse transactions of each of its divisions and business sections using credit risk assessment and management methods that suit the special characteristics of each transaction in order to maintain a sound asset structure. The Bank carries out its credit risk management appropriately based on its Credit Risk Management Standards and various detailed management methods provided for in the Bank’s operating regulations.
Based on this framework, the Credit Rating Center and Credit Supervision Department manage the risks of the individual loans of the operational divisions (branches and loan sales departments at the headquarters). The Risk Management Department, which is completely independent of the loan sale, screening, and approval process, is responsible for managing overall credit risks. The Bank has also established an auditing system for credit risks, appointing a Credit Screening Supervisor in the Audit & Inspection Department who bears the responsibility for conducting internal audits for credit risks.
Specifically, credit risk management entails determining the overall condition of the customer’s business through credit ratings, self-assessment, and other methods. This information is utilized to carry out credit screening for individual loans, administer the loans after they have been extended, and properly determine write-offs and reserves. From the perspective of loan portfolio
management, the Chugoku Bank strives to strengthen control of credit risks and its ability to earn stable income by monitoring the loan balance composition and credit risks and cost adjusted income.
Risk managers verify that calculated credit risk exposure is within the credit risk limits set under the credit risk management plan, conduct stress tests to assess the Bank’s degree of capital adequacy, and report results regularly to the Board of Directors and other management bodies.
Credit concentration risks are managed by grasping and controlling credit exposure by debtor, industry and country, the status of which is reported to the Board of Directors and other management bodies on a regular basis.
In addition, the Bank’s “Large Borrowers Credit Review Committee” investigates and analyzes large borrowers with regard to their multidimensional conditions to discuss appropriate policies to cope with their current financial status. These policies are subsequently deliberated on by the Board of Managing Directors; their decisions are regularly reported to the Board of Directors, with a view to conducting proper management of large borrowers’ credit risks.
Market Risk ManagementMarket risk refers to the risks of incurring losses from fluctuations in profits arising from assets and liabilities and the risks of incurring losses from fluctuations in the value of assets and liabilities (including those off balance sheet) due to fluctuations in market risk factors such as interest rates, exchange rates and share prices.
The Bank’s basic risk management policy for market risks is to determine and analyze risks from the point of view of both price and return on asset movements as well as assessing the risks from various angles, using stress tests and other methods. The Bank carries out its market risk management appropriately based on its Market Risk Management Standards, which stipulate the framework and systems for market risk management, and various detailed management methods provided for in the Bank’s operating regulations.
The structure for market risk management is divided into the business operations division (front office) and the administrative division (back office). We have also established a risk management division (middle office). These serve as reciprocal restraints.
Trading limits and loss limits have been set for trading operations, the goal of which is to earn trading profit from buying and selling securities in market operations. These are managed to ensure that losses in excess of a certain amount do not occur. Banking operations (investment securities) are managed for risks by taking the risk-return balance into consideration through ALM analysis, Value at Risk (VaR) analysis and other means to ensure stable profits over the medium and long term. We have also established a system for the flexible management of market risks as well as credit risks and liquidity risks related to market operations.
Market risk management for the entire bank, including lending and deposit services, is carried out by analyzing risks from multiple aspects, such as the calculation of interest rate risks. The Risk Management Committee and the ALM Committee discuss the overall management of assets and liabilities and consider management and lending policies.
Liquidity Risk ManagementLiquidity risk refers to the risks of incurring losses (hereafter, “fund procurement risks”) when it becomes difficult to secure the requisite funds or when procuring funds at a much higher than normal interest rate becomes necessary due to a mismatch between the timing of use and procurement or to an unexpected outflow of funds, or to risks incurred when transactions cannot be conducted or must be conducted at prices that are much more disadvantageous than normal due to market disruptions or other factors (hereafter, “market liquidity risks”).
The Bank recognizes fund procurement as an important management issue and its basic fund procurement risks policy is to ensure a stable supply of funds.
Comprehensive Risk Management System
THE CHUGOKU BANK, LIMITED6
010_0410501372709.indd 6 2015/09/08 18:44:10
The Bank’s basic policy for managing market liquidity risks is to take into consideration the special features of markets for individual products, such as market size, liquidity, and other factors and pay careful attention to their market liquidity. The Bank carries out its fund procurement risks and market liquidity risk management appropriately based on its Market Liquidity Risk Management Standards, which stipulate the framework and systems for fund procurement risks and market liquidity risk management.
Funds procurement risks are subject to strict management and this is divided between the funds procurement division, which procures funds, and the funds procurement risk management division, which monitors the status of the procurement of those funds.
The funds procurement management division carefully monitors the daily status of funds procurement for market operations and other operations and works to limit the risks involved in the procurement of funds. The funds procurement risk management division determines the management policies for risks of procuring funds such as policies on holding highly liquid assets and setting limits on procurement from the market. The funds procurement risk management division monitors developments to ensure there are no problems with the status of funds procurement in the funds procurement management division.
Deposits comprise the vast majority of procurement for the Chugoku Bank and the procurement of funds is stable. However, we are working to diversify the means of procurement to prepare for unforeseen circumstances by procurement from the market utilizing marketable securities held by the Bank.
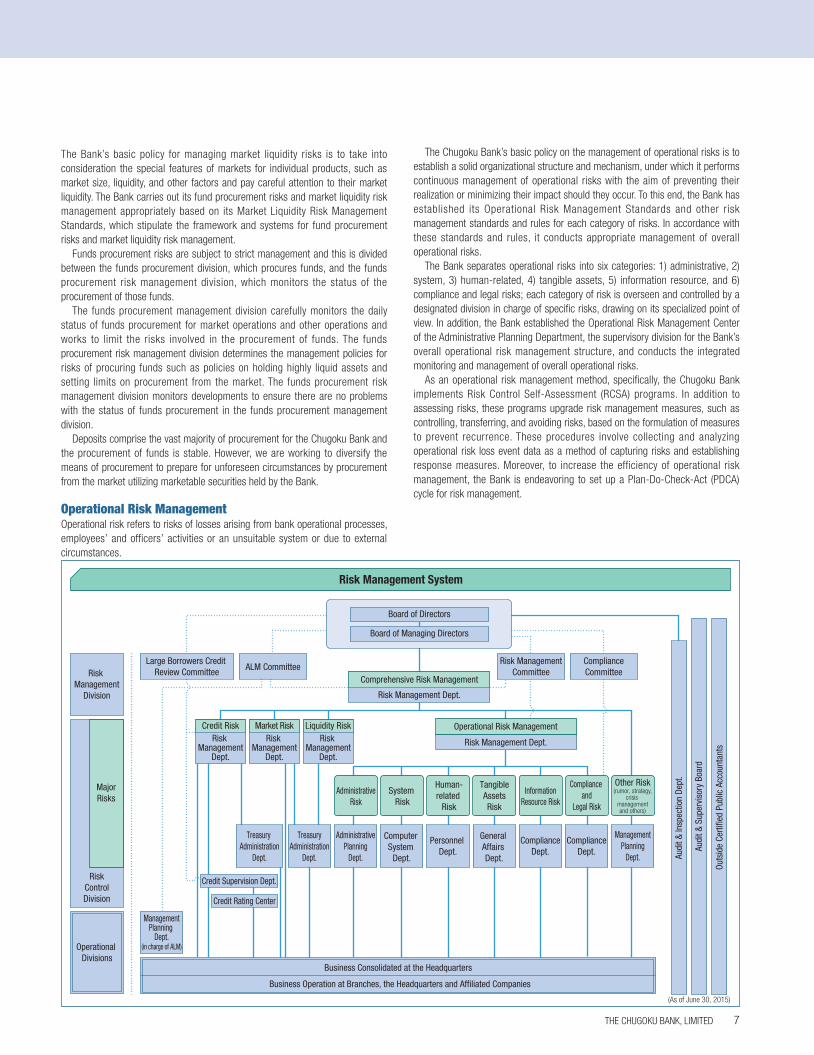
Operational Risk ManagementOperational risk refers to risks of losses arising from bank operational processes, employees’ and officers’ activities or an unsuitable system or due to external circumstances.
The Chugoku Bank’s basic policy on the management of operational risks is to establish a solid organizational structure and mechanism, under which it performs continuous management of operational risks with the aim of preventing their realization or minimizing their impact should they occur. To this end, the Bank has established its Operational Risk Management Standards and other risk management standards and rules for each category of risks. In accordance with these standards and rules, it conducts appropriate management of overall operational risks.
The Bank separates operational risks into six categories: 1) administrative, 2) system, 3) human-related, 4) tangible assets, 5) information resource, and 6) compliance and legal risks; each category of risk is overseen and controlled by a designated division in charge of specific risks, drawing on its specialized point of view. In addition, the Bank established the Operational Risk Management Center of the Administrative Planning Department, the supervisory division for the Bank’s overall operational risk management structure, and conducts the integrated monitoring and management of overall operational risks.
As an operational risk management method, specifically, the Chugoku Bank implements Risk Control Self-Assessment (RCSA) programs. In addition to assessing risks, these programs upgrade risk management measures, such as controlling, transferring, and avoiding risks, based on the formulation of measures to prevent recurrence. These procedures involve collecting and analyzing operational risk loss event data as a method of capturing risks and establishing response measures. Moreover, to increase the efficiency of operational risk management, the Bank is endeavoring to set up a Plan-Do-Check-Act (PDCA) cycle for risk management.
Risk Management System
Operational Divisions
Audi
t & S
uper
viso
ry B
oard
Outs
ide
Certi
fied
Publ
ic A
ccou
ntan
ts
RiskControlDivision
Risk Management
Division
Treasury Administration
Dept.
Personnel Dept.
ManagementPlanning
Dept.
General Affairs Dept.
AdministrativePlanning
Dept.
Computer System
Dept.
(in charge of ALM)
ComplianceCommittee
Risk ManagementCommitteeALM Committee
Audi
t & In
spec
tion
Dept
.
Credit Rating Center
Risk Management Dept.
ComplianceDept.
ComplianceDept.
Operational Risk Management
Comprehensive Risk Management
Risk Management Dept.
Liquidity RiskRisk
ManagementDept.
Market RiskRisk
ManagementDept.
MajorRisks
TreasuryAdministration
Dept.
Business Consolidated at the Headquarters
Business Operation at Branches, the Headquarters and Affiliated Companies
ManagementPlanning
Dept.
System Risk
Human-related
Risk
TangibleAssetsRisk
Other RiskInformation
Resource Risk
Compliance and
Legal Risk
AdministrativeRisk
(rumor, strategy,crisis
managementand others)
Board of Directors
Board of Managing Directors
Credit Supervision Dept.
Large Borrowers Credit Review Committee
Credit RiskRisk
ManagementDept.
(As of June 30, 2015)
THE CHUGOKU BANK, LIMITED 7
010_0410501372709.indd 7 2015/09/08 18:44:10
CSR ActivitiesThe Bank has established a CSR Committee with the president as chairman. We consider our stakeholders to be current and future customers, shareholders, the regional community and bank employees, and the Bank’s approach to CSR activities underlines this broad view.
At the heart of CSR activities is the Bank’s integrity upheld through compliance and corporate governance in order to ensure the Bank is an upstanding corporate citizen when conducting its operations.
In activities contributing to society, the Bank places the highest priority on contributions to the region in its capacity as a regional financial institution. We are continuously considering bold, new approaches beyond our core operations in order to contribute to society.
Through these activities we will grow and develop hand in hand with our local communities.
Social Contribution through BusinessPolicy on Initiatives Related to Management Support for SMEs (Basic policy concerning promotion of regional financing)The Bank is promoting community-based financial services based on the following three basic policies.1. Making Full Use of Our Consulting Function According to the Life Stage of Our CustomersThe Bank’s policy is to enhance our relationships of trust with our customers through ongoing day-to-day transactions, and to fully comprehend their management challenges on financial and business terms, and also to commit to fulfilling our consulting function in coordination with outside experts as appropriate.
(1) Supporting start-ups/new businesses, development of sales channels and general business deploymentWe are strengthening our consulting function by cultivating staff with specialized skills and extending the practice of seminars for branch employees and that of visits to branches by headquarters employees.
(2) Management Improvement and Business Rehabilitation Supporting FieldWe propose the right solutions at the right time, based on accurate evaluation of our customer’s life stage as a business through integration among the Bank’s branches and headquarters to further enhance our supporting activities for management improvement. In addition, we actively employ outside experts and expert organizations to provide more advanced methods of assistance in the management improvement and business rehabilitation supporting field.
2. Contributing to Revitalization of Regional EconomiesWith a view to revitalizing the regional economy, the Bank collects and analyzes various forms of information from the region, and continues to play an active role in industry-academic-government cooperation. In addition, the Bank is strengthening its efforts to support the cultivation of growth fields and collaborative efforts with NGOs and other organizations to promote and contribute to the region.
We are therefore working to enhance the finance skills (proficiency in judgment) of our employees including younger employees mainly through various types of seminars, while moving ahead to strengthen preparations for supporting new fields such as agricultural business.
3. Actively offering Information to the Regional Society and Our CustomersThe Bank actively offers information about specific activities and their results with regard to efforts related to community-based financial services. We will strive to improve our services even further in order to earn the trust and support of our regional customers.
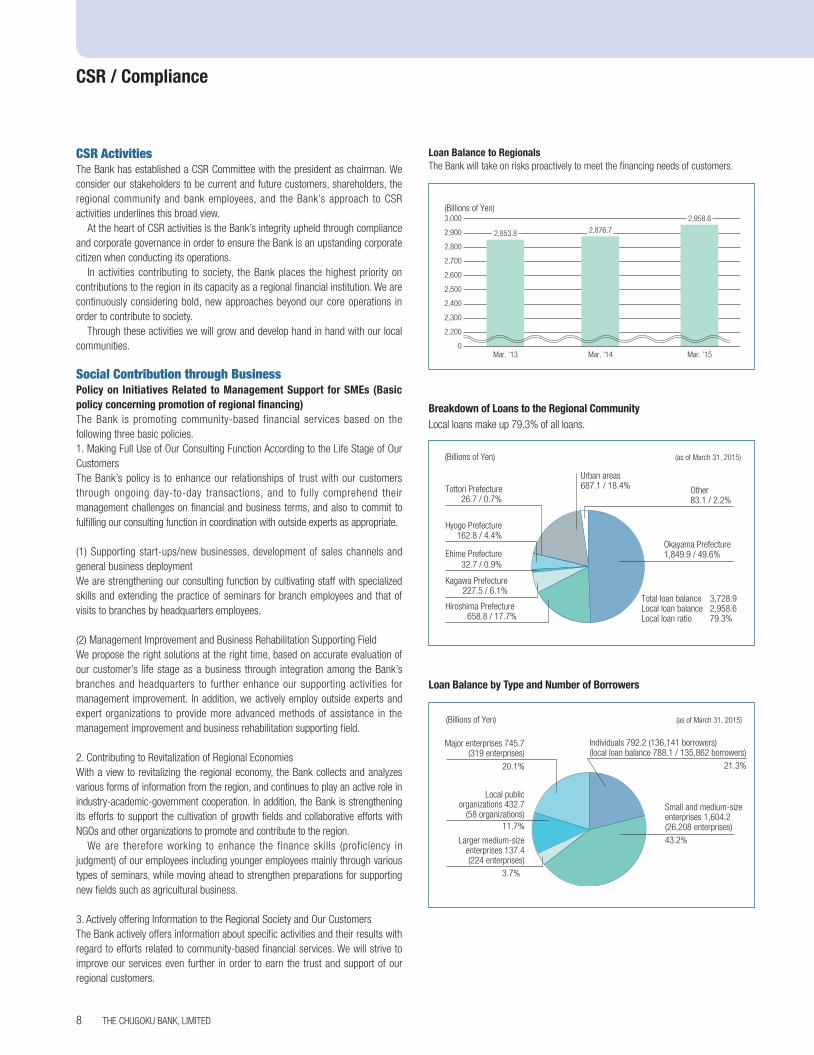
Breakdown of Loans to the Regional CommunityLocal loans make up 79.3% of all loans.
Loan Balance by Type and Number of Borrowers
21.3%
43.2%
3.7%
11.7%
20.1%
Small and medium-size enterprises 1,604.2(26,208 enterprises)
Larger medium-sizeenterprises 137.4(224 enterprises)
Local publicorganizations 432.7
(58 organizations)
Major enterprises 745.7(319 enterprises)
Individuals 792.2 (136,141 borrowers) (local loan balance 788.1 / 135,862 borrowers)
(Billions of Yen) (as of March 31, 2015)
Total loan balance 3,728.9Local loan balance 2,958.6Local loan ratio 79.3%
Urban areas 687.1 / 18.4%
Okayama Prefecture 1,849.9 / 49.6%
Hiroshima Prefecture 658.8 / 17.7%
Kagawa Prefecture227.5 / 6.1%
Ehime Prefecture32.7 / 0.9%
Hyogo Prefecture162.8 / 4.4%
Tottori Prefecture26.7 / 0.7%
Other83.1 / 2.2%
(as of March 31, 2015)(Billions of Yen)
Loan Balance to RegionalsThe Bank will take on risks proactively to meet the financing needs of customers.
(Billions of Yen)
0
2,200
2,300
2,400
2,500
2,600
2,700
3,000
2,900
2,800
2,958.6
Mar. ’15
2,853.8
Mar. ’13
2,876.7
Mar. ’14
CSR / Compliance
THE CHUGOKU BANK, LIMITED8
010_0410501372709.indd 8 2015/09/08 18:44:10
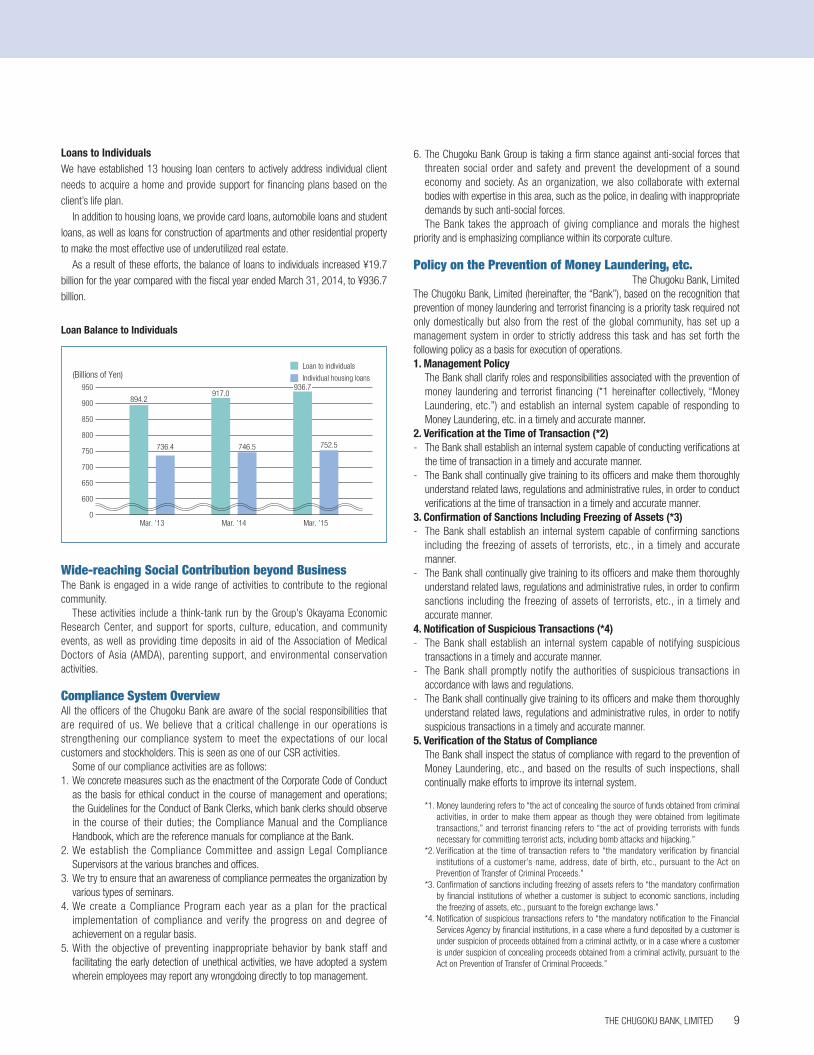
Loans to IndividualsWe have established 13 housing loan centers to actively address individual client needs to acquire a home and provide support for financing plans based on the client’s life plan.
In addition to housing loans, we provide card loans, automobile loans and student loans, as well as loans for construction of apartments and other residential property to make the most effective use of underutilized real estate.
As a result of these efforts, the balance of loans to individuals increased ¥19.7 billion for the year compared with the fiscal year ended March 31, 2014, to ¥936.7 billion.
Loan Balance to Individuals
Wide-reaching Social Contribution beyond BusinessThe Bank is engaged in a wide range of activities to contribute to the regional community.
These activities include a think-tank run by the Group’s Okayama Economic Research Center, and support for sports, culture, education, and community events, as well as providing time deposits in aid of the Association of Medical Doctors of Asia (AMDA), parenting support, and environmental conservation activities.
Compliance System OverviewAll the officers of the Chugoku Bank are aware of the social responsibilities that are required of us. We believe that a critical challenge in our operations is strengthening our compliance system to meet the expectations of our local customers and stockholders. This is seen as one of our CSR activities.
Some of our compliance activities are as follows:1. We concrete measures such as the enactment of the Corporate Code of Conduct
as the basis for ethical conduct in the course of management and operations; the Guidelines for the Conduct of Bank Clerks, which bank clerks should observe in the course of their duties; the Compliance Manual and the Compliance Handbook, which are the reference manuals for compliance at the Bank.
2. We establish the Compliance Committee and assign Legal Compliance Supervisors at the various branches and offices.
3. We try to ensure that an awareness of compliance permeates the organization by various types of seminars.
4. We create a Compliance Program each year as a plan for the practical implementation of compliance and verify the progress on and degree of achievement on a regular basis.
5. With the objective of preventing inappropriate behavior by bank staff and facilitating the early detection of unethical activities, we have adopted a system wherein employees may report any wrongdoing directly to top management.
Loan to individuals
Individual housing loans
0
650
600
700
750
800
850
900
950
(Billions of Yen)
752.5
Mar. ’15
936.7
746.5
Mar. ’14
917.0
736.4
Mar. ’13
894.2
6. The Chugoku Bank Group is taking a firm stance against anti-social forces that threaten social order and safety and prevent the development of a sound economy and society. As an organization, we also collaborate with external bodies with expertise in this area, such as the police, in dealing with inappropriate demands by such anti-social forces. The Bank takes the approach of giving compliance and morals the highest
priority and is emphasizing compliance within its corporate culture.
Policy on the Prevention of Money Laundering, etc.The Chugoku Bank, Limited
The Chugoku Bank, Limited (hereinafter, the “Bank”), based on the recognition that prevention of money laundering and terrorist financing is a priority task required not only domestically but also from the rest of the global community, has set up a management system in order to strictly address this task and has set forth the following policy as a basis for execution of operations.1. Management Policy
The Bank shall clarify roles and responsibilities associated with the prevention of money laundering and terrorist financing (*1 hereinafter collectively, “Money Laundering, etc.”) and establish an internal system capable of responding to Money Laundering, etc. in a timely and accurate manner.
2. Verification at the Time of Transaction (*2)- The Bank shall establish an internal system capable of conducting verifications at
the time of transaction in a timely and accurate manner.- The Bank shall continually give training to its officers and make them thoroughly
understand related laws, regulations and administrative rules, in order to conduct verifications at the time of transaction in a timely and accurate manner.
3. Confirmation of Sanctions Including Freezing of Assets (*3)- The Bank shall establish an internal system capable of confirming sanctions
including the freezing of assets of terrorists, etc., in a timely and accurate manner.
- The Bank shall continually give training to its officers and make them thoroughly understand related laws, regulations and administrative rules, in order to confirm sanctions including the freezing of assets of terrorists, etc., in a timely and accurate manner.
4. Notification of Suspicious Transactions (*4)- The Bank shall establish an internal system capable of notifying suspicious
transactions in a timely and accurate manner.- The Bank shall promptly notify the authorities of suspicious transactions in
accordance with laws and regulations.- The Bank shall continually give training to its officers and make them thoroughly
understand related laws, regulations and administrative rules, in order to notify suspicious transactions in a timely and accurate manner.
5. Verification of the Status of ComplianceThe Bank shall inspect the status of compliance with regard to the prevention of Money Laundering, etc., and based on the results of such inspections, shall continually make efforts to improve its internal system.
*1. Money laundering refers to “the act of concealing the source of funds obtained from criminal activities, in order to make them appear as though they were obtained from legitimate transactions,” and terrorist financing refers to “the act of providing terrorists with funds necessary for committing terrorist acts, including bomb attacks and hijacking.”
*2. Verification at the time of transaction refers to “the mandatory verification by financial institutions of a customer’s name, address, date of birth, etc., pursuant to the Act on Prevention of Transfer of Criminal Proceeds.”
*3. Confirmation of sanctions including freezing of assets refers to “the mandatory confirmation by financial institutions of whether a customer is subject to economic sanctions, including the freezing of assets, etc., pursuant to the foreign exchange laws.”
*4. Notification of suspicious transactions refers to “the mandatory notification to the Financial Services Agency by financial institutions, in a case where a fund deposited by a customer is under suspicion of proceeds obtained from a criminal activity, or in a case where a customer is under suspicion of concealing proceeds obtained from a criminal activity, pursuant to the Act on Prevention of Transfer of Criminal Proceeds.”
THE CHUGOKU BANK, LIMITED 9
010_0410501372709.indd 9 2015/09/08 18:44:10
Corporate GovernanceThe Bank will try to enhance the corporate governance in order to develop along with
local communities as a bank to be selected and trusted through comprehensive
financial services from the view of a sustainable growth and a medium- to long-term
improvement of the corporate value in accordance with the fundamental concepts as
follows.
(1) The Bank will try to establish the environment where the rights of shareholders are
respected and properly executed as well as ensure the real equality of
shareholders.
(2) The Bank will make efforts to cooperate appropriately with the wide range of
stakeholder such as shareholders, customers, employees and local communities
and foster the corporate culture and climate where sound business activities are
respected.
(3) The Bank will work on proper disclosures of the corporate information including
nonfinancial information as well as ensuring the transparency of the corporate
business.
(4) The Bank will try to ensure the effectiveness of supervision of the business
executions and audits while the Board of Directors and the Audit & Supervisory
Board recognize the fiduciary responsibility to the shareholders to enhance the
Bank’s sustainable growth and a medium- to long-term improvement of the
corporate value.
The total number of the Bank’s Directors, which reached 20 Directors in 1998,
stood at 13 as of June 30, 2015 (including one Outside Director). The current
framework ensures fruitful discussions and quick decision-making. The Board of
Directors deliberates on important matters such as formulation of business plans
and fundamental risk management policies. The progress of the execution of duties
by Directors is reported at a meeting of the Board of Directors.
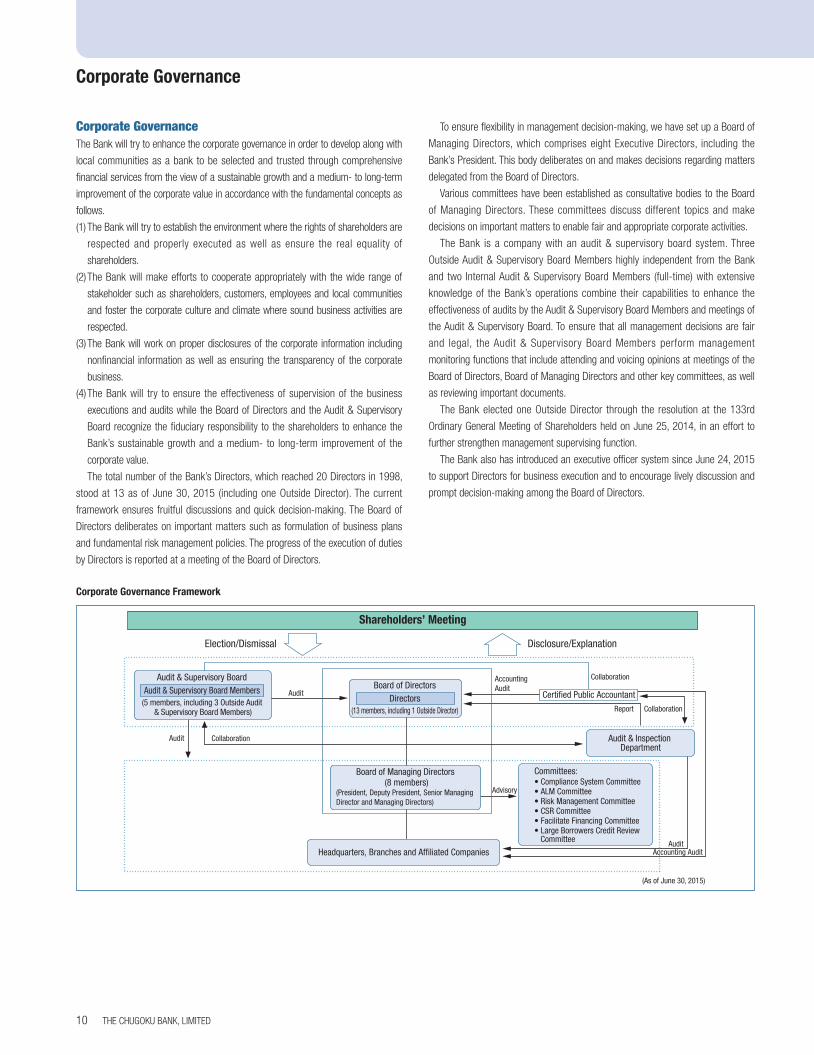
Corporate Governance Framework
Shareholders’ Meeting
Committees:• Compliance System Committee• ALM Committee• Risk Management Committee• CSR Committee• Facilitate Financing Committee• Large Borrowers Credit Review Committee
Collaboration
Collaboration
(As of June 30, 2015)
Collaboration
Audit
Audit
Advisory
Report
Accounting Audit
AuditAccounting Audit
Election/Dismissal Disclosure/Explanation
Certified Public Accountant
Audit & Supervisory Board
(5 members, including 3 Outside Audit & Supervisory Board Members)
Audit & Supervisory Board Members Board of Directors
(13 members, including 1 Outside Director)Directors
Board of Managing Directors (8 members)
(President, Deputy President, Senior Managing Director and Managing Directors)
Headquarters, Branches and Affiliated Companies
Audit & Inspection Department
Corporate Governance
To ensure flexibility in management decision-making, we have set up a Board of
Managing Directors, which comprises eight Executive Directors, including the
Bank’s President. This body deliberates on and makes decisions regarding matters
delegated from the Board of Directors.
Various committees have been established as consultative bodies to the Board
of Managing Directors. These committees discuss different topics and make
decisions on important matters to enable fair and appropriate corporate activities.
The Bank is a company with an audit & supervisory board system. Three
Outside Audit & Supervisory Board Members highly independent from the Bank
and two Internal Audit & Supervisory Board Members (full-time) with extensive
knowledge of the Bank’s operations combine their capabilities to enhance the
effectiveness of audits by the Audit & Supervisory Board Members and meetings of
the Audit & Supervisory Board. To ensure that all management decisions are fair
and legal, the Audit & Supervisory Board Members perform management
monitoring functions that include attending and voicing opinions at meetings of the
Board of Directors, Board of Managing Directors and other key committees, as well
as reviewing important documents.
The Bank elected one Outside Director through the resolution at the 133rd
Ordinary General Meeting of Shareholders held on June 25, 2014, in an effort to
further strengthen management supervising function.
The Bank also has introduced an executive officer system since June 24, 2015
to support Directors for business execution and to encourage lively discussion and
prompt decision-making among the Board of Directors.
THE CHUGOKU BANK, LIMITED10
010_0410501372709.indd 10 2015/09/08 18:44:10
Fundamental Policy for Establishment of Internal Control System (Excerpt)
The Bank has formulated a fundamental policy concerning the establishment of an internal control system to ensure appropriateness of operations pursuant to a resolution of the Board of Directors. An outline of the policy is as follows.
1. System ensuring that the execution of duties by Directors conforms to applicable laws, regulations and the Articles of Incorporation
(1) Directors shall execute their duties based on the Corporate Code of Conduct, which sets forth the Bank’s corporate ethics, and the Guidelines for the Conduct of Bank Clerks, which must be taken into account in the course of duties, and comply with the Rules for Directors, which codify basic considerations for Directors.
In principle, Board of Directors meetings shall be held once a month, and on other occasions as required, to promote communication among Directors and enable mutual supervision of the execution of duties. The Board shall be operated in accordance with the Board of Directors Regulations in order to prevent violations of laws and the Articles of Incorporation by ensuring proper business activities.
The Bank is a company with an audit & supervisory board system, wherein each Audit & Supervisory Board Member audits the progress of the execution of duties by Directors according to the policy and the division of tasks set forth by the Audit & Supervisory Board and, when necessary, voices opinion, prohibits action by a Director and/or devises other appropriate measures.
(2) The Board of Directors shall establish systems to cut off and resolutely eliminate any and all relationships with anti-social forces.
2. System for retaining and maintaining information regarding the execution of duties by DirectorsWith respect to information concerning the execution of duties by Directors, the Bank shall retain the minutes of the Board of Directors meetings, along with other relevant materials, for a period of 10 years in accordance with the Board of Directors Regulations, and maintain them in a state that renders them accessible as needed. Other important documents shall also be maintained in an appropriate manner, depending on the storage medium, in accordance with the Information Asset Management Standards and internal regulations, and shall be maintained in a state that renders this information accessible as needed.
3. Regulations and other systems concerning managing exposure to loss
(1) The Bank recognizes (a) credit risks, (b) market risks, (c) liquidity risks, (d) operational risks and (e) other risks which could have a serious impact to the business as key risks involved in the execution of the Bank’s operations. Specific risks shall be identified and managed, and a comprehensive risk management system established. A detailed definition of each risk shall be provided in the basic risk management rules.
(2) The Bank shall establish an equity capital management system and an asset evaluation management system to ensure the soundness and appropriateness of the Bank’s operations through sufficient capital adequacy proportionate to the risks.
(3) Each type of risk shall be managed in accordance with the basic risk management policy set forth in the basic risk management rules and other regulations pertaining to risk management. The Risk Management Department shall be responsible for the comprehensive management of
the Bank’s risks, a responsible department shall be assigned to each type of risk and such committees as the Risk Management Committee shall be established to ensure appropriate risk management.
(4) A risk management plan shall be created when formulating strategic objectives, such as business plans or the Medium-Term Management Plan. The management status of each type of risk shall be reported to the Board of Directors on a regular basis.
(5) The Bank shall establish necessary systems, including the Emergency Countermeasures Headquarters in the event of unforeseen circumstances, and respond appropriately to prevent the spread of damage in accordance with the Risk Management Manual.
4. System to ensure the efficient execution of duties by Directors
(1) Matters that impact the Bank’s operations, deemed to be significant matters requiring the resolution of the Board of Directors, shall be discussed and deliberated on in advance in the presence of the Audit & Supervisory Board Members by the Board of Managing Directors, which is comprised of the Chairman, Deputy Chairman, President, Deputy President, Senior Managing Director and Managing Directors.
(2) Business execution pursuant to a resolution of the Board of Directors shall be in accordance with the decision-making authority and procedures stipulated in the Rules Defining the Extent of Job Authority and various other rules.
5. System ensuring that the execution of duties by employees conforms to applicable laws, regulations and the Articles of Incorporation
(1) The Bank shall establish the Corporate Code of Conduct, the Guidelines for the Conduct of Bank Clerks, the Rules on Compliance with Laws and Regulations etc., and the Compliance Manual in order to ensure a compliance framework. The contents of employment regulations and other rules, as well as guidelines for the handling of business affairs and other guidelines, shall be in compliance with all pertinent laws and the Articles of Incorporation.
(2) A Compliance Committee chaired by the president shall be established to foster a corporate culture that emphasizes compliance, enhancing compliance systems and monitoring the status of legal compliance. The Compliance Department shall be responsible for overall compliance management and shall examine various measures related to the compliance.
(3) Various measures shall be taken in a systematic manner in order to establish a compliance framework, such as the formulation and review of the annual Compliance Program, which serves as the Bank’s basic compliance policy and implementation plan, as well as periodic compliance-related checks and compliance training.
(4) The Audit & Inspection Department shall be established as an internal audit department independent from the business execution departments, and shall perform audits to ensure that employee duties are in compliance with laws, regulations, the Articles of Incorporation and other obligations.
(5) Should legal violations or other compliance-related facts be detected, an appropriate response shall be taken in accordance with employee regulations via the Management Help Line and other means as an internal reporting system.
Internal Control
THE CHUGOKU BANK, LIMITED 11
010_0410501372709.indd 11 2015/09/08 18:44:10
6. System ensuring the appropriateness of operations throughout the Chugoku Bank Group comprising the Bank and its subsidiaries
(1) Chugoku Bank Group Management Regulations shall be formulated in order to ensure appropriateness of business operations and effective business management with respect to each company of the Chugoku Bank Group. Each Group company shall formulate its own rules in accordance with the Bank’s rules and establish systems befitting its business content and organizational structure to ensure the appropriateness of its business operations.
(2) The Bank shall formulate standards related to deliberation and reporting for each company in the Chugoku Bank Group and shall manage the business of the Group companies based on a system for making final decisions and receiving reports in accordance with said standards. Of the final decisions to be made by the Bank and reporting matters, those of importance shall be reported to the Bank’s Audit & Supervisory Board Members. The Bank shall conclude an audit agreement with each Group company and conduct internal audits.
(3) Each group company shall formulate the basic risk management rules to assess and manage each type of risk as well as to establish the system of a comprehensive risk management while they deliberate and report the predetermined matters in accordance with the Chugoku Bank Group Management Regulations. The Bank shall respond appropriately to prevent the spread of damage in accordance with the Risk Management Manual in the event of unforeseen circumstances.
(4) Business execution pursuant to a resolution of the Board of Directors in each Chugoku Bank Group company shall be in accordance with the decision-making authority and procedures stipulated in the Rules Defining the Extent of Job Authority and various other rules.
(5) Each group company of the Chugoku Bank Group shall establish the Corporate Code of Conduct, the Guidelines for the Conduct of Bank Clerks and the Compliance Manual to ensure a compliance framework. The contents of employment regulations and other rules shall be in compliance with laws, regulations and the Articles of Incorporation.
(6) The Chugoku Bank Group shall formulate regulations concerning the Management Help Line, an internal reporting system whereby employees can report any wrongdoing directly to top management in order to maintain the sound operation thereof.
(7) Each Group company shall report any legal violations in business management or content of management guidance by the Bank as well as any other compliance-related issues to the Bank’s Audit & Supervisory Board Members.
(8) The Chugoku Bank Group shall comply with all laws, standards and other obligations concerning accounting practices and establish an internal control system to ensure the appropriateness of the Group’s financial reporting.
7. Provisions for system of hiring assistants to the Audit & Supervisory Board Members, if required, their independence from Directors and ensuring of the effectiveness of directions to the assistants by the Board Members
(1) The Bank shall place assistants to the Audit & Supervisory Board Members in the Secretariat as employees who are to assist the Audit & Supervisory Board Members with their duties.
(2) The assistants to the Audit & Supervisory Board Members shall be stipulated to perform investigation, planning, management and instruction concerning the audits of the Board Members, which is ordered by the Members, without performing additional work related to the execution of duties by Directors. The Audit & Supervisory Board Members shall be consulted and their agreement obtained before a decision is made regarding the evaluation, appointment and reassignment of such assistants to ensure independence from Directors.
8. System for reporting to the Audit & Supervisory Board Members
(1) In accordance with the Standards of Reporting to Audit & Supervisory Board Members, Directors and employees shall report to the Audit & Supervisory Board Members matters that may have a significant impact on the Bank’s business and other matters essential to report in a timely manner. Notwithstanding the foregoing, the Audit & Supervisory Board Members may also request reports from Directors and employees as required.
(2) In accordance with the Chugoku Bank Group Management Regulations and the Standards Related to Deliberation and Reporting for Subsidiaries, those who are reported from Directors, Audit & Supervisory Board Members and the others in the subsidiaries shall report to the Audit & Supervisory Board Members important matters which may have impact on the Bank’s business and other matters essential to report, to the Audit & Supervisory Board Members in a timely manner.
(3) The Bank and the subsidiaries shall not give any disadvantageous treatment such as dismissal to Directors and employees who reported the matter due to the report.
9. Matters for policies for procedures of advance payment or reimbursement of expense incurred from the execution of duties by the Audit & Supervisory Board Members and for handling of the other expense or debt incurred regarding the execution of the dutiesIn accordance with the Auditing Standards for Audit & Supervisory Board Members, the Bank shall include a budget in advance for the expenses acknowledged by the Audit & Supervisory Board to be necessary for the execution of duties. Expenses expended urgently or temporary may be claimed to the Bank for reimbursement after the event.
10. System to ensure that audits of the Audit & Supervisory Board Members are implemented effectivelyThe Bank works to ensure the effectiveness of the audits performed by the Audit & Supervisory Board Members by having them attend meetings where decisions that have a significant impact on business management are made, as well as through the circulation of important documents to them and their collaboration with the Internal Audit Department, certified public accountants and outside certified public accountants in accordance with the Audit & Supervisory Board Regulations and the Auditing Standards for Audit & Supervisory Board Members. Representative Directors shall exchange opinions with the Audit & Supervisory Board on a regular basis, and enhance mutual awareness of such matters as to the issues to be addressed by the Bank and improvement of the environment for Audit & Supervisory Board Members’ audits.
THE CHUGOKU BANK, LIMITED12
010_0410501372709.indd 12 2015/09/08 18:44:11
Financial Section
THE CHUGOKU BANK, LIMITED 13
010_0410501372709.indd 13 2015/09/08 18:44:11
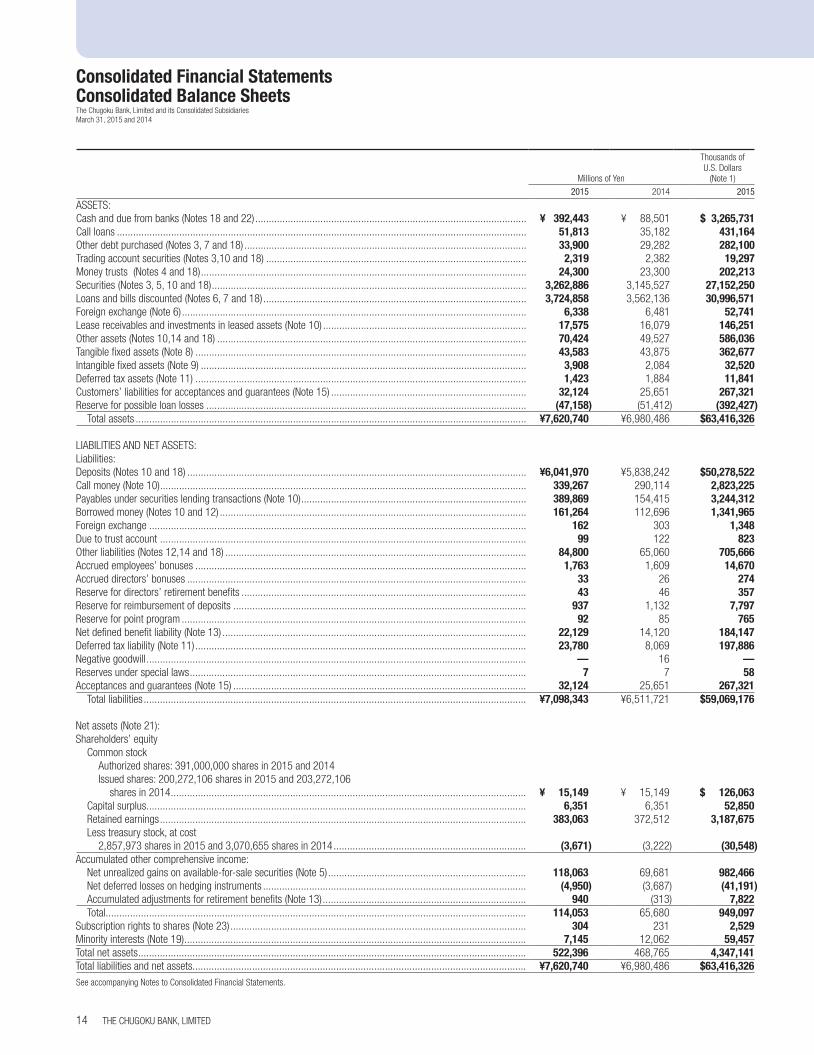
Consolidated Financial StatementsConsolidated Balance SheetsThe Chugoku Bank, Limited and its Consolidated SubsidiariesMarch 31, 2015 and 2014
Millions of Yen
Thousands of U.S. Dollars
(Note 1)
2015 2014 2015
ASSETS:Cash and due from banks (Notes 18 and 22) .................................................................................................... ¥ 392,443 ¥ 88,501 $ 3,265,731 Call loans ....................................................................................................................................................... 51,813 35,182 431,164 Other debt purchased (Notes 3, 7 and 18) ........................................................................................................ 33,900 29,282 282,100 Trading account securities (Notes 3,10 and 18) ................................................................................................ 2,319 2,382 19,297 Money trusts (Notes 4 and 18) ........................................................................................................................ 24,300 23,300 202,213 Securities (Notes 3, 5, 10 and 18) .................................................................................................................... 3,262,886 3,145,527 27,152,250 Loans and bills discounted (Notes 6, 7 and 18) ................................................................................................. 3,724,858 3,562,136 30,996,571 Foreign exchange (Note 6) ............................................................................................................................... 6,338 6,481 52,741 Lease receivables and investments in leased assets (Note 10) ........................................................................... 17,575 16,079 146,251 Other assets (Notes 10,14 and 18) .................................................................................................................. 70,424 49,527 586,036 Tangible fixed assets (Note 8) .......................................................................................................................... 43,583 43,875 362,677 Intangible fixed assets (Note 9) ........................................................................................................................ 3,908 2,084 32,520 Deferred tax assets (Note 11) .......................................................................................................................... 1,423 1,884 11,841 Customers’ liabilities for acceptances and guarantees (Note 15) ........................................................................ 32,124 25,651 267,321 Reserve for possible loan losses ...................................................................................................................... (47,158) (51,412) (392,427)
Total assets ................................................................................................................................................ ¥7,620,740 ¥6,980,486 $63,416,326
LIABILITIES AND NET ASSETS:Liabilities:Deposits (Notes 10 and 18) ............................................................................................................................. ¥6,041,970 ¥5,838,242 $50,278,522 Call money (Note 10) ....................................................................................................................................... 339,267 290,114 2,823,225 Payables under securities lending transactions (Note 10) ................................................................................... 389,869 154,415 3,244,312 Borrowed money (Notes 10 and 12) ................................................................................................................. 161,264 112,696 1,341,965 Foreign exchange ........................................................................................................................................... 162 303 1,348 Due to trust account ....................................................................................................................................... 99 122 823 Other liabilities (Notes 12,14 and 18) ............................................................................................................... 84,800 65,060 705,666 Accrued employees’ bonuses .......................................................................................................................... 1,763 1,609 14,670 Accrued directors’ bonuses ............................................................................................................................. 33 26 274 Reserve for directors’ retirement benefits ......................................................................................................... 43 46 357 Reserve for reimbursement of deposits ............................................................................................................ 937 1,132 7,797 Reserve for point program ............................................................................................................................... 92 85 765 Net defined benefit liability (Note 13) ................................................................................................................ 22,129 14,120 184,147 Deferred tax liability (Note 11) .......................................................................................................................... 23,780 8,069 197,886 Negative goodwill ............................................................................................................................................ — 16 —Reserves under special laws ............................................................................................................................ 7 7 58 Acceptances and guarantees (Note 15) ............................................................................................................ 32,124 25,651 267,321
Total liabilities ............................................................................................................................................. ¥7,098,343 ¥6,511,721 $59,069,176
Net assets (Note 21):Shareholders’ equity
Common stockAuthorized shares: 391,000,000 shares in 2015 and 2014Issued shares: 200,272,106 shares in 2015 and 203,272,106
shares in 2014 ................................................................................................................................... ¥ 15,149 ¥ 15,149 $ 126,063 Capital surplus ............................................................................................................................................ 6,351 6,351 52,850 Retained earnings ....................................................................................................................................... 383,063 372,512 3,187,675 Less treasury stock, at cost
2,857,973 shares in 2015 and 3,070,655 shares in 2014 ....................................................................... (3,671) (3,222) (30,548)Accumulated other comprehensive income:
Net unrealized gains on available-for-sale securities (Note 5) ......................................................................... 118,063 69,681 982,466 Net deferred losses on hedging instruments ................................................................................................. (4,950) (3,687) (41,191)Accumulated adjustments for retirement benefits (Note 13) ........................................................................... 940 (313) 7,822 Total........................................................................................................................................................... 114,053 65,680 949,097
Subscription rights to shares (Note 23) ............................................................................................................. 304 231 2,529 Minority interests (Note 19) .............................................................................................................................. 7,145 12,062 59,457 Total net assets ............................................................................................................................................... 522,396 468,765 4,347,141 Total liabilities and net assets........................................................................................................................... ¥7,620,740 ¥6,980,486 $63,416,326 See accompanying Notes to Consolidated Financial Statements.
THE CHUGOKU BANK, LIMITED14
010_0410501372709.indd 14 2015/09/08 18:44:11
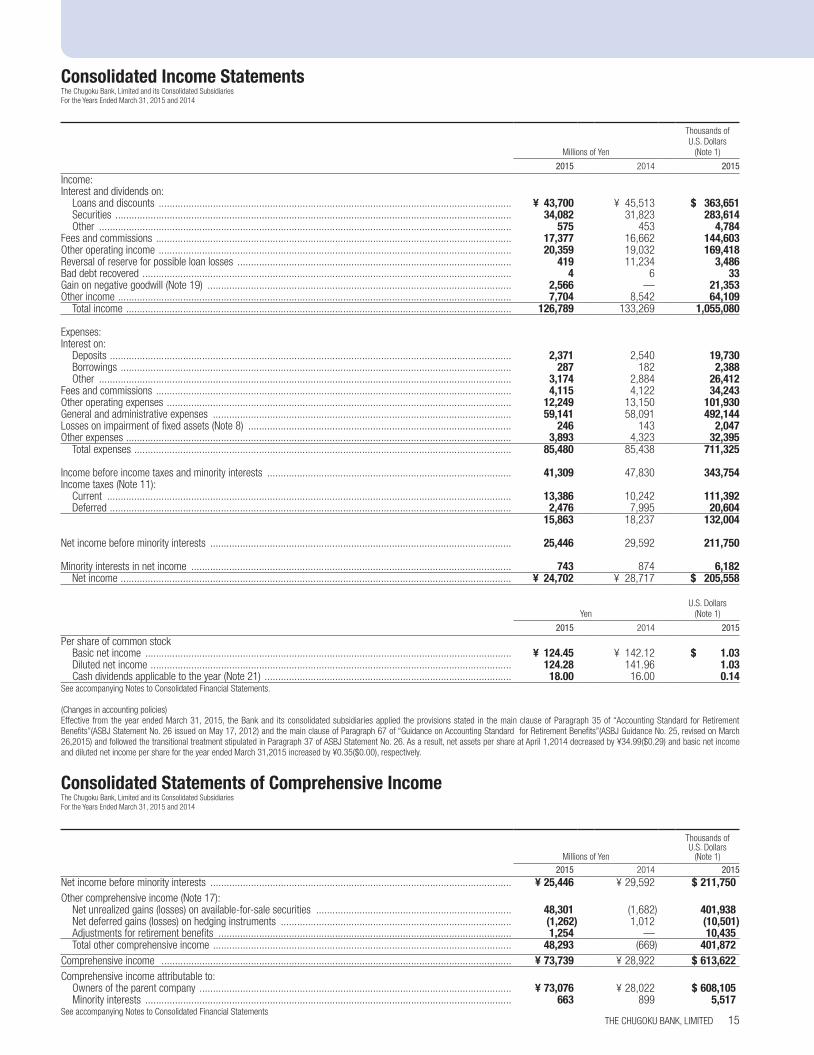
Consolidated Income Statements The Chugoku Bank, Limited and its Consolidated SubsidiariesFor the Years Ended March 31, 2015 and 2014
Millions of Yen
Thousands of U.S. Dollars
(Note 1)
2015 2014 2015
Income:Interest and dividends on:
Loans and discounts .................................................................................................................................. ¥ 43,700 ¥ 45,513 $ 363,651 Securities .................................................................................................................................................. 34,082 31,823 283,614 Other ........................................................................................................................................................ 575 453 4,784
Fees and commissions ................................................................................................................................... 17,377 16,662 144,603 Other operating income .................................................................................................................................. 20,359 19,032 169,418 Reversal of reserve for possible loan losses ..................................................................................................... 419 11,234 3,486 Bad debt recovered ........................................................................................................................................ 4 6 33 Gain on negative goodwill (Note 19) ................................................................................................................ 2,566 — 21,353 Other income ................................................................................................................................................. 7,704 8,542 64,109
Total income .............................................................................................................................................. 126,789 133,269 1,055,080
Expenses:Interest on:
Deposits .................................................................................................................................................... 2,371 2,540 19,730 Borrowings ................................................................................................................................................ 287 182 2,388 Other ........................................................................................................................................................ 3,174 2,884 26,412
Fees and commissions ................................................................................................................................... 4,115 4,122 34,243 Other operating expenses ............................................................................................................................... 12,249 13,150 101,930 General and administrative expenses .............................................................................................................. 59,141 58,091 492,144 Losses on impairment of fixed assets (Note 8) ................................................................................................. 246 143 2,047 Other expenses .............................................................................................................................................. 3,893 4,323 32,395
Total expenses ........................................................................................................................................... 85,480 85,438 711,325
Income before income taxes and minority interests .......................................................................................... 41,309 47,830 343,754 Income taxes (Note 11):
Current ..................................................................................................................................................... 13,386 10,242 111,392 Deferred .................................................................................................................................................... 2,476 7,995 20,604
15,863 18,237 132,004
Net income before minority interests ............................................................................................................... 25,446 29,592 211,750
Minority interests in net income ...................................................................................................................... 743 874 6,182 Net income ................................................................................................................................................ ¥ 24,702 ¥ 28,717 $ 205,558
YenU.S. Dollars
(Note 1)
2015 2014 2015
Per share of common stock Basic net income ....................................................................................................................................... ¥ 124.45 ¥ 142.12 $ 1.03 Diluted net income ..................................................................................................................................... 124.28 141.96 1.03 Cash dividends applicable to the year (Note 21) ........................................................................................... 18.00 16.00 0.14
See accompanying Notes to Consolidated Financial Statements.
(Changes in accounting policies)Effective from the year ended March 31, 2015, the Bank and its consolidated subsidiaries applied the provisions stated in the main clause of Paragraph 35 of “Accounting Standard for Retirement Benefits”(ASBJ Statement No. 26 issued on May 17, 2012) and the main clause of Paragraph 67 of “Guidance on Accounting Standard for Retirement Benefits”(ASBJ Guidance No. 25, revised on March 26,2015) and followed the transitional treatment stipulated in Paragraph 37 of ASBJ Statement No. 26. As a result, net assets per share at April 1,2014 decreased by ¥34.99($0.29) and basic net income and diluted net income per share for the year ended March 31,2015 increased by ¥0.35($0.00), respectively.
Consolidated Statements of Comprehensive IncomeThe Chugoku Bank, Limited and its Consolidated SubsidiariesFor the Years Ended March 31, 2015 and 2014
Millions of Yen
Thousands of U.S. Dollars
(Note 1)2015 2014 2015
Net income before minority interests ............................................................................................................... ¥ 25,446 ¥ 29,592 $ 211,750 Other comprehensive income (Note 17):
Net unrealized gains (losses) on available-for-sale securities ........................................................................ 48,301 (1,682) 401,938 Net deferred gains (losses) on hedging instruments ..................................................................................... (1,262) 1,012 (10,501)Adjustments for retirement benefits ............................................................................................................ 1,254 — 10,435 Total other comprehensive income .............................................................................................................. 48,293 (669) 401,872
Comprehensive income ................................................................................................................................. ¥ 73,739 ¥ 28,922 $ 613,622 Comprehensive income attributable to:
Owners of the parent company ................................................................................................................... ¥ 73,076 ¥ 28,022 $ 608,105 Minority interests ....................................................................................................................................... 663 899 5,517
See accompanying Notes to Consolidated Financial StatementsTHE CHUGOKU BANK, LIMITED 15
010_0410501372709.indd 15 2015/09/08 18:44:11
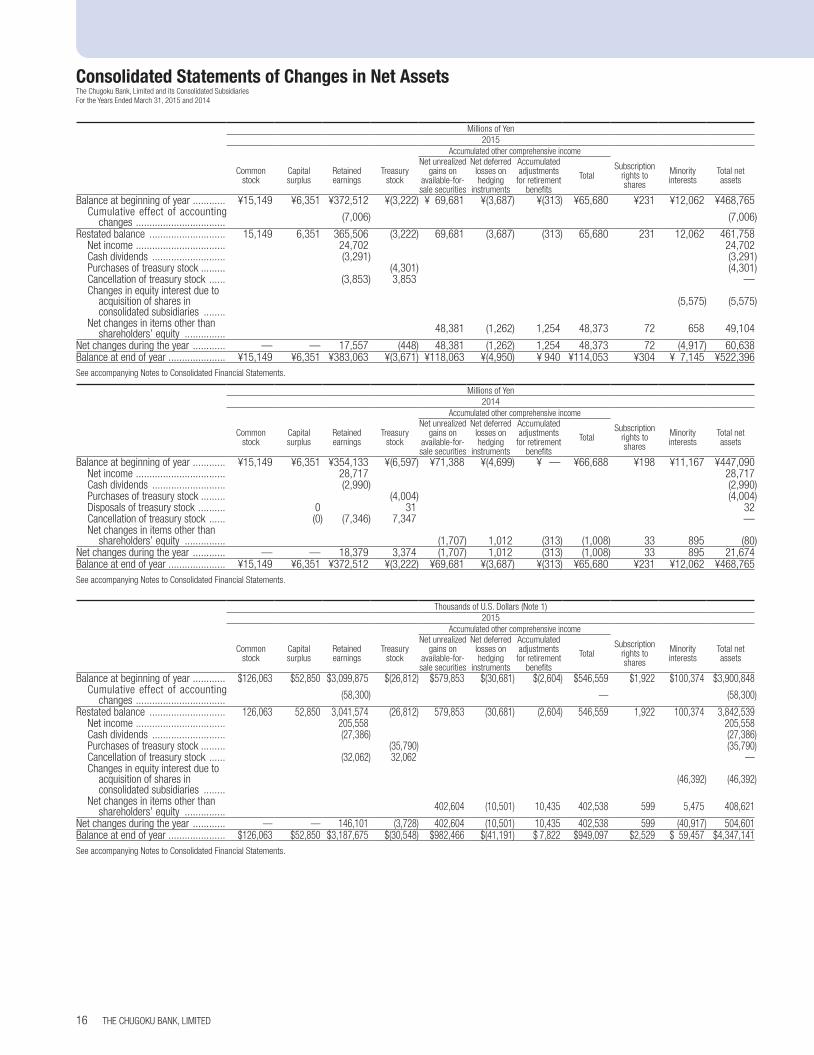
Consolidated Statements of Changes in Net AssetsThe Chugoku Bank, Limited and its Consolidated SubsidiariesFor the Years Ended March 31, 2015 and 2014
Millions of Yen2015
Accumulated other comprehensive income
Common stock
Capital surplus
Retained earnings
Treasury stock
Net unrealized gains on
available-for-sale securities
Net deferred losses on hedging
instruments
Accumulated adjustments
for retirement benefits
TotalSubscription
rights to shares
Minority interests
Total netassets
Balance at beginning of year ............ ¥15,149 ¥6,351 ¥372,512 ¥(3,222) ¥ 69,681 ¥(3,687) ¥(313) ¥65,680 ¥231 ¥12,062 ¥468,765 Cumulative effect of accounting
changes ................................. (7,006) (7,006)
Restated balance ............................ 15,149 6,351 365,506 (3,222) 69,681 (3,687) (313) 65,680 231 12,062 461,758 Net income ................................. 24,702 24,702 Cash dividends ........................... (3,291) (3,291)Purchases of treasury stock ......... (4,301) (4,301)Cancellation of treasury stock ...... (3,853) 3,853 —Changes in equity interest due to
acquisition of shares in consolidated subsidiaries ........
(5,575) (5,575)
Net changes in items other than shareholders’ equity ............... 48,381 (1,262) 1,254 48,373 72 658 49,104
Net changes during the year ............ — — 17,557 (448) 48,381 (1,262) 1,254 48,373 72 (4,917) 60,638 Balance at end of year ..................... ¥15,149 ¥6,351 ¥383,063 ¥(3,671) ¥118,063 ¥(4,950) ¥ 940 ¥114,053 ¥304 ¥ 7,145 ¥522,396 See accompanying Notes to Consolidated Financial Statements.
Thousands of U.S. Dollars (Note 1)2015
Accumulated other comprehensive income
Common stock
Capital surplus
Retained earnings
Treasury stock
Net unrealized gains on
available-for-sale securities
Net deferred losses on hedging
instruments
Accumulated adjustments
for retirement benefits
TotalSubscription
rights to shares
Minority interests
Total netassets
Balance at beginning of year ............ $126,063 $52,850 $3,099,875 $(26,812) $579,853 $(30,681) $(2,604) $546,559 $1,922 $100,374 $3,900,848 Cumulative effect of accounting
changes ................................. (58,300) — (58,300)
Restated balance ............................ 126,063 52,850 3,041,574 (26,812) 579,853 (30,681) (2,604) 546,559 1,922 100,374 3,842,539 Net income ................................. 205,558 205,558 Cash dividends ........................... (27,386) (27,386)Purchases of treasury stock ......... (35,790) (35,790)Cancellation of treasury stock ...... (32,062) 32,062 —Changes in equity interest due to
acquisition of shares in consolidated subsidiaries ........
(46,392) (46,392)
Net changes in items other than shareholders’ equity ............... 402,604 (10,501) 10,435 402,538 599 5,475 408,621
Net changes during the year ............ — — 146,101 (3,728) 402,604 (10,501) 10,435 402,538 599 (40,917) 504,601 Balance at end of year ..................... $126,063 $52,850 $3,187,675 $(30,548) $982,466 $(41,191) $ 7,822 $949,097 $2,529 $ 59,457 $4,347,141 See accompanying Notes to Consolidated Financial Statements.
Millions of Yen2014
Accumulated other comprehensive income
Common stock
Capital surplus
Retained earnings
Treasury stock
Net unrealized gains on
available-for-sale securities
Net deferred losses on hedging
instruments
Accumulated adjustments
for retirement benefits
TotalSubscription
rights to shares
Minority interests
Total netassets
Balance at beginning of year ............ ¥15,149 ¥6,351 ¥354,133 ¥(6,597) ¥71,388 ¥(4,699) ¥ — ¥66,688 ¥198 ¥11,167 ¥447,090Net income ................................. 28,717 28,717Cash dividends ........................... (2,990) (2,990)Purchases of treasury stock ......... (4,004) (4,004)Disposals of treasury stock .......... 0 31 32Cancellation of treasury stock ...... (0) (7,346) 7,347 —Net changes in items other than
shareholders’ equity ............... (1,707) 1,012 (313) (1,008) 33 895 (80)Net changes during the year ............ — — 18,379 3,374 (1,707) 1,012 (313) (1,008) 33 895 21,674Balance at end of year ..................... ¥15,149 ¥6,351 ¥372,512 ¥(3,222) ¥69,681 ¥(3,687) ¥(313) ¥65,680 ¥231 ¥12,062 ¥468,765See accompanying Notes to Consolidated Financial Statements.
THE CHUGOKU BANK, LIMITED16
010_0410501372709.indd 16 2015/09/08 18:44:11
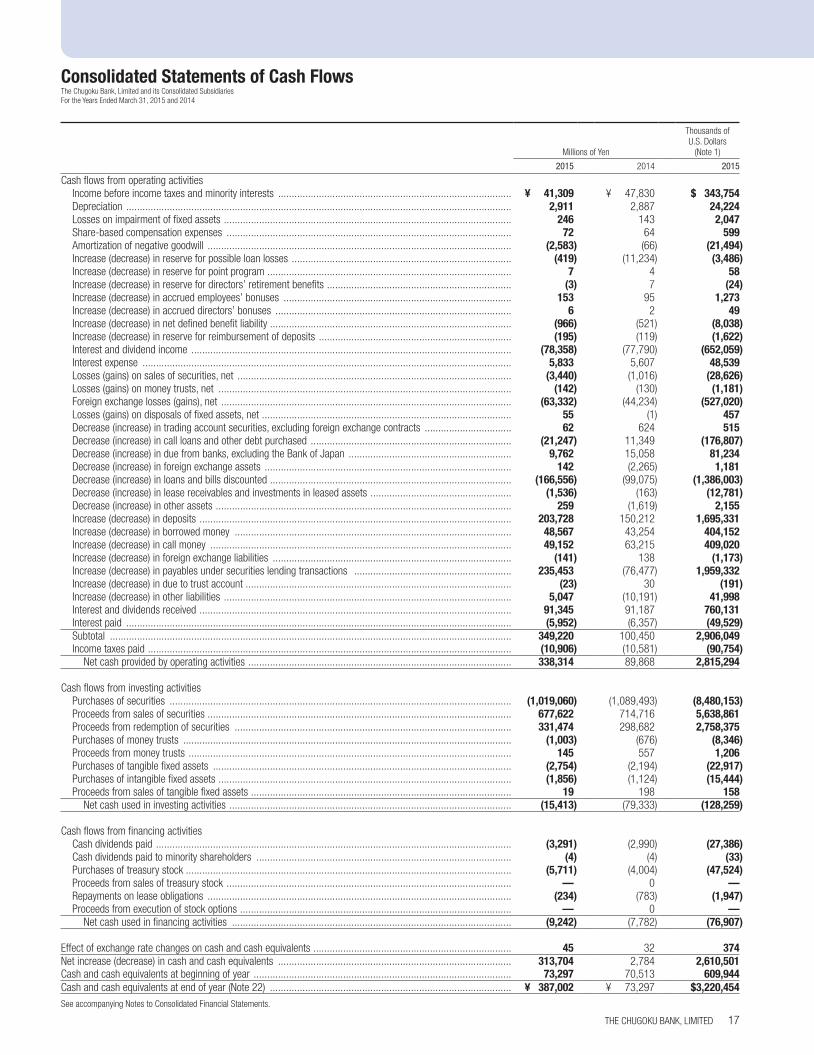
Consolidated Statements of Cash FlowsThe Chugoku Bank, Limited and its Consolidated SubsidiariesFor the Years Ended March 31, 2015 and 2014
Millions of Yen
Thousands of U.S. Dollars
(Note 1)
2015 2014 2015
Cash flows from operating activitiesIncome before income taxes and minority interests ...................................................................................... ¥ 41,309 ¥ 47,830 $ 343,754 Depreciation .............................................................................................................................................. 2,911 2,887 24,224 Losses on impairment of fixed assets .......................................................................................................... 246 143 2,047 Share-based compensation expenses ......................................................................................................... 72 64 599 Amortization of negative goodwill ................................................................................................................ (2,583) (66) (21,494)Increase (decrease) in reserve for possible loan losses ................................................................................. (419) (11,234) (3,486)Increase (decrease) in reserve for point program .......................................................................................... 7 4 58 Increase (decrease) in reserve for directors’ retirement benefits .................................................................... (3) 7 (24)Increase (decrease) in accrued employees’ bonuses .................................................................................... 153 95 1,273 Increase (decrease) in accrued directors’ bonuses ....................................................................................... 6 2 49 Increase (decrease) in net defined benefit liability ......................................................................................... (966) (521) (8,038)Increase (decrease) in reserve for reimbursement of deposits ....................................................................... (195) (119) (1,622)Interest and dividend income ...................................................................................................................... (78,358) (77,790) (652,059)Interest expense ........................................................................................................................................ 5,833 5,607 48,539 Losses (gains) on sales of securities, net ..................................................................................................... (3,440) (1,016) (28,626)Losses (gains) on money trusts, net ............................................................................................................ (142) (130) (1,181)Foreign exchange losses (gains), net ........................................................................................................... (63,332) (44,234) (527,020)Losses (gains) on disposals of fixed assets, net ............................................................................................ 55 (1) 457 Decrease (increase) in trading account securities, excluding foreign exchange contracts ................................ 62 624 515 Decrease (increase) in call loans and other debt purchased .......................................................................... (21,247) 11,349 (176,807)Decrease (increase) in due from banks, excluding the Bank of Japan ............................................................ 9,762 15,058 81,234 Decrease (increase) in foreign exchange assets ........................................................................................... 142 (2,265) 1,181 Decrease (increase) in loans and bills discounted ......................................................................................... (166,556) (99,075) (1,386,003)Decrease (increase) in lease receivables and investments in leased assets .................................................... (1,536) (163) (12,781)Decrease (increase) in other assets ............................................................................................................. 259 (1,619) 2,155 Increase (decrease) in deposits ................................................................................................................... 203,728 150,212 1,695,331 Increase (decrease) in borrowed money ...................................................................................................... 48,567 43,254 404,152 Increase (decrease) in call money ............................................................................................................... 49,152 63,215 409,020 Increase (decrease) in foreign exchange liabilities ........................................................................................ (141) 138 (1,173)Increase (decrease) in payables under securities lending transactions .......................................................... 235,453 (76,477) 1,959,332 Increase (decrease) in due to trust account .................................................................................................. (23) 30 (191)Increase (decrease) in other liabilities .......................................................................................................... 5,047 (10,191) 41,998 Interest and dividends received ................................................................................................................... 91,345 91,187 760,131 Interest paid .............................................................................................................................................. (5,952) (6,357) (49,529)Subtotal .................................................................................................................................................... 349,220 100,450 2,906,049 Income taxes paid ...................................................................................................................................... (10,906) (10,581) (90,754)
Net cash provided by operating activities ................................................................................................. 338,314 89,868 2,815,294
Cash flows from investing activitiesPurchases of securities .............................................................................................................................. (1,019,060) (1,089,493) (8,480,153)Proceeds from sales of securities ................................................................................................................ 677,622 714,716 5,638,861 Proceeds from redemption of securities ...................................................................................................... 331,474 298,682 2,758,375 Purchases of money trusts ......................................................................................................................... (1,003) (676) (8,346)Proceeds from money trusts ....................................................................................................................... 145 557 1,206 Purchases of tangible fixed assets .............................................................................................................. (2,754) (2,194) (22,917)Purchases of intangible fixed assets ............................................................................................................ (1,856) (1,124) (15,444)Proceeds from sales of tangible fixed assets ................................................................................................ 19 198 158
Net cash used in investing activities ........................................................................................................ (15,413) (79,333) (128,259)
Cash flows from financing activitiesCash dividends paid ................................................................................................................................... (3,291) (2,990) (27,386)Cash dividends paid to minority shareholders .............................................................................................. (4) (4) (33)Purchases of treasury stock ........................................................................................................................ (5,711) (4,004) (47,524)Proceeds from sales of treasury stock ......................................................................................................... — 0 —Repayments on lease obligations ................................................................................................................ (234) (783) (1,947)Proceeds from execution of stock options .................................................................................................... — 0 —
Net cash used in financing activities ....................................................................................................... (9,242) (7,782) (76,907)
Effect of exchange rate changes on cash and cash equivalents ......................................................................... 45 32 374 Net increase (decrease) in cash and cash equivalents ...................................................................................... 313,704 2,784 2,610,501 Cash and cash equivalents at beginning of year ............................................................................................... 73,297 70,513 609,944 Cash and cash equivalents at end of year (Note 22) ......................................................................................... ¥ 387,002 ¥ 73,297 $3,220,454 See accompanying Notes to Consolidated Financial Statements.
THE CHUGOKU BANK, LIMITED 17
010_0410501372709.indd 17 2015/09/08 18:44:11
Notes to Consolidated Financial StatementsThe Chugoku Bank, Limited and its Consolidated Subsidiaries
1. Basis of Presenting Consolidated Financial StatementsThe accompanying consolidated financial statements of The Chugoku Bank, Limited (the “Bank”) and its consolidated subsidiaries (collectively, the “Group”) have been prepared in accordance with the provisions set forth in the Japanese Financial Instruments and Exchange Law and its related accounting regulations, the Japanese Banking Law and the Japanese Uniform Rules for Bank Accounting and in conformity with accounting principles generally accepted in Japan (“Japanese GAAP”), which are different in certain respects as to application and disclosure requirements from International Financial Reporting Standards.
The accompanying consolidated financial statements have been reformatted and translated into English with some expanded descriptions from the consolidated financial statements of the Bank prepared in accordance with Japanese GAAP and filed with the appropriate Local Finance Bureau of the Ministry of Finance as required by the Financial Instruments and Exchange Act. Certain supplementary information included in the statutory Japanese language consolidated financial statements is not presented in the accompanying consolidated financial statements.
As permitted by the Financial Instruments and Exchange Law, amounts of less than one million yen have been rounded down. As a result, the totals shown in the accompanying consolidated financial statements (both in yen and U.S. dollars) do not necessarily agree with the sums of the individual amounts.
The translations of the Japanese yen amounts into U.S. dollar amounts were included solely for the convenience of readers outside Japan, using the prevailing exchange rate at March 31, 2015, which was ¥120.17 to US$1.00. The translations should not be construed as representations that the Japanese yen amounts have been, could have been or could in the future be converted into U.S. dollars at this or any other rate of exchange. 2. Significant Accounting Policies(a) Principals of ConsolidationScope of Consolidated Subsidiaries and Affiliates Accounted for by the Equity Method The consolidated financial statements include the accounts of the Bank and its seven significant subsidiaries after elimination of all significant intercompany transactions, balances and unrealized profits.
Three investment partnerships of which the Bank owns a majority of voting rights were excluded from the scope of consolidation for the years ended March 31, 2015 and 2014 because the total amounts of their assets, net income and retained earnings were so immaterial that their exclusion from the scope of consolidation would not hinder a rational judgment regarding the consolidated financial position or results of operations. Investments in the three investment partnerships and two affiliated companies also were not accounted for by the equity method for the year ended March 31, 2015 because their exclusion had no significant effect on the consolidated financial statements.
As of March 31, 2015, The Vegeta Corporation, of which the Bank owns voting rights (execution rights) between 20% and 50%, was not recognized as an affiliate accounted for using the equity method because it is held by the Bank’s unconsolidated subsidiary for the purpose of incubating investees or earning capital gains through business transactions and not for the purpose of controlling the entity.
Balance Sheet Date of SubsidiariesThe balance sheet date of all consolidated subsidiaries is March 31, the same as that of the Bank.
Goodwill Goodwill is amortized using the straight-line method over a period of five years. Goodwill which is immaterial is fully charged as loss when incurred.
On December 26, 2010, the Accounting Standards Board of Japan (“ASBJ”) issued a revised accounting standard for business combinations, ASBJ Statement No. 21, “Accounting Standard for Business Combinations,” and revised ASBJ Guidance No. 10, “Guidance for Accounting Standard for Business Combinations and Business Divestitures.” The Bank adopted the revised accounting standard and guidance effective April 1, 2010. The revised accounting standard requires the recognition of negative goodwill (bargain purchase) as gain upon the acquisition. However, as a transitional measure prescribed by the revised standard, negative goodwill recognized prior to April 1, 2010 continues to be amortized using the straight-line method over a period of five years.
(b) Securities and Money TrustsTrading account securities are stated at fair value. Gains and losses realized on disposal and unrealized gains and losses from market value fluctuations of these securities are recognized as gains and losses in the period of the change. Held-to-maturity debt securities are stated at amortized cost. Investments in affiliated companies which are not accounted for by the equity method are stated at cost determined by the moving average method. Available-for-sale securities with available fair values are, in principle, stated at fair value based on the market price as of the balance sheet date. Unrealized gains and losses on these securities, net of applicable income taxes, are reported as a separate component of net assets. Realized gains and losses on the sale of such securities are computed using moving average cost.
Available-for-sale securities for which the fair value is extremely difficult to determine are stated at moving average cost.
Securities constituting trust assets of money trusts are stated in the same manner as trading account securities.
(c) Derivatives and Hedge AccountingThe Bank applies the deferred method of hedge accounting for transactions entered into to hedge the interest rate risks associated with various financial assets and liabilities as stipulated in “Accounting and Auditing Treatment of Accounting Standards for Financial Instruments in the Banking Industry” (Industry Audit Committee Report No. 24) issued by the Japanese Institute of Certified Public Accountants (“JICPA”). The effectiveness of the hedges is assessed for each identified group of hedged loans and securities and the corresponding group of hedging instruments, such as interest rate swaps, in the same maturity bucket.
The Bank applies the deferral method of hedge accounting for transactions entered into to hedge foreign exchange risks associated with various foreign currency denominated monetary assets and liabilities as stipulated in “Accounting and Auditing Concerning Accounting for Foreign Currency Transactions in the Banking Industry” (JICPA Industry Audit Committee Report No. 25). The effectiveness of the currency swap transactions, exchange swap transactions and similar transactions that hedge the foreign exchange risks of monetary assets and liabilities denominated in foreign currencies is assessed based on a comparison of the foreign currency position of the hedged monetary assets and liabilities and the hedging instruments.
In addition to the above methods, the Bank applies the fair value hedge method to portfolio hedges for foreign exchange risks associated with foreign securities, except for bonds, identified as hedged items in advance as long as the amount of foreign currency payables of spot and forward foreign exchange contracts exceeds the acquisition cost of the hedged foreign securities in foreign currency.
THE CHUGOKU BANK, LIMITED18
010_0410501372709.indd 18 2015/09/08 18:44:11
(d) Tangible Fixed AssetsTangible fixed assets owned by the Bank and its consolidated subsidiaries are generally stated at cost less accumulated depreciation. Depreciation is computed by the declining balance method over the estimated useful life of the asset.
For the Bank, estimated useful lives are mainly as follows: Buildings............................. 4 to 40 years Other…….......................... 2 to 20 years
For consolidated subsidiaries, the useful life of an asset is based on the Corporation Tax Law of Japan.
Lease assets with respect to finance leases that do not transfer ownership of the lease assets and that are recorded in “Tangible fixed assets” are depreciated using the straight-line method over the term of the lease, assumed to be the useful life, with a salvage value of zero or the guaranteed amount.
(e) Intangible Fixed AssetsIntangible fixed assets are depreciated using the straight-line method.
(f) Foreign Currency TranslationThe Bank’s assets and liabilities denominated in foreign currencies are translated into Japanese yen at the exchange rates prevailing at the end of the fiscal year.
(g) Reserve for Possible Loan LossesThe Bank writes off loans and makes provisions for possible loan losses. For loans to insolvent customers who are undergoing bankruptcy or other collection proceedings or who are in a similar financial condition, the reserve for possible loan losses is provided in the full amount of such loans, excluding the portion estimated to be recoverable due to security interests or guarantees.
For large borrowers who are likely to become bankrupt and borrowers with restructured loans, if the cash flows from collection of principal and interest can be reasonably estimated, a reserve is provided based on the difference between the relevant cash flows discounted by the initial contractual interest rates and the carrying amounts of the loans.
For unsecured and unguaranteed portions of loans to customers not presently in these circumstances but who face a high probability of so becoming, the reserve for possible loan losses is provided for the estimated unrecoverable amounts determined after an evaluation of the customer’s overall financial condition. For other loans such as normal loans and loans requiring special attention, the reserve for possible loan losses is provided based on the Bank’s actual rate of loan losses in the past. A specific reserve for loans to borrowers in certain countries has been established in accordance with the regulations of the Ministry of Finance to cover potential losses from specific overseas loans.
An assessment and classification is conducted by each business department and credit supervision department and is audited by the Risk Management Department, an independent department. The reserve for possible loan losses is provided based on the auditing results.
Reserves for possible loan losses of the consolidated subsidiaries are provided for general claims in the amount deemed necessary based on historical loan loss ratios and for certain doubtful claims in the amount deemed uncollectable based on individual assessments.
(h) Accrued Employees’ BonusesAccrued employees’ bonuses are provided for the future payment of bonuses to employees in the amounts of the estimated bonuses attributable to the current fiscal year.
(i) Accrued Directors’ BonusesAccrued directors’ bonuses of the Bank’s consolidated subsidiaries are provided for the payment of bonuses to directors and corporate auditors based on an estimated amount.
(j) Reserve for Directors’ Retirement BenefitsThe Bank’s consolidated subsidiaries provide for severance and retirement benefits to directors and corporate auditors based on the required amounts determined by in-house regulations.
(k) Reserve for Reimbursement of DepositsA reserve for reimbursement of deposits is provided for reimbursement of deposits that were derecognized from liabilities and credited to income. The amount is determined based on the Bank’s historical reimbursement ratio for such accounts.
(l) Reserve for Point ProgramA reserve for the point program is provided for the accumulation of points granted to credit card holders. The amount of reserve is determined based on the past usage ratio of points by cardholders.
(m) Reserve Under Special LawsA reserve under special laws is provided for contingent liabilities from financial instruments and exchange. This is a reserve pursuant to Article 46-5 of the Financial Instruments and Exchange Act and Article 175 of Cabinet Office Ordinance on the Financial Instruments Business to indemnify losses incurred in connection with the purchase and sale of securities and derivatives and other transactions.
(n) Accounting for Employees’ Severance and Retirement BenefitsIn determining projected benefit obligation, the estimated amount of retirement benefits is attributed to periods based on a benefit formula basis.
Prior service cost of the cash balance pension plans is recognized as expense using the straight-line method over ten years, which is within the average of the estimated remaining service years, commencing with the period in which it arises.
Actuarial gains and losses are recognized as expenses using the straight-line method over ten years, which is within the average of the estimated remaining service years, commencing with the following period.
In calculating the liability for retirement benefits and retirement benefit expenses, the consolidated subsidiaries apply a simplified method under which the amount required to be paid if all the employees voluntarily retired at the fiscal year end is regarded as projected benefit obligation.
(o) LeasesAs lessee:Finance leases are capitalized to recognize lease assets and lease obligations in the balance sheet. However, finance leases which commenced prior to April 1, 2008 and do not transfer ownership of the leased property to the lessee are accounted for in the same manner as operating lease transactions as permitted by the accounting standard for lease transactions (ASBJ Statement No. 13).
As lessor:Income from finance leases and related leasing costs are recognized when lease payments are received.
THE CHUGOKU BANK, LIMITED 19
010_0410501372709.indd 19 2015/09/08 18:44:11
(p) Income TaxesDeferred income taxes are recognized for loss carryforwards and taxable temporary differences between carrying amounts for financial reporting purposes and tax bases. In Japan, income taxes applicable to the Bank and its consolidated subsidiaries consist of corporation tax (national), inhabitant taxes (local) and enterprise taxes (local). The statutory tax rate used for calculating deferred tax assets and liabilities at March 31, 2015 was 32.8% for the temporary differences expected to be eliminated in the fiscal year beginning on April 1, 2015 and 32.1% for those expected to be eliminated in the fiscal years beginning on and after April 1, 2016. The statutory tax rate used for calculating deferred tax assets and liabilities at March 31, 2014 was 35.4%.
(q) Consumption TaxesNational and local consumption taxes are mainly accounted for on a tax excluded basis. However, any nondeductible consumption taxes associated with asset purchases are recorded as expense during the fiscal year.
(r) Per Share InformationBasic net income per share is based on the weighted average number of shares of common stock outstanding during the year, excluding treasury stock. Diluted net income per share reflects the potential dilution that could occur if outstanding stock options were exercised. Diluted net income per share of common stock assumes full exercise of the outstanding stock options at the beginning of the year or at the time of the grant.
(s) Accounting ChangeAccounting Standard for Retirement Benefits Effective from the year ended March 31, 2015, the Bank and its consolidated subsidiaries have applied the provisions stated in the main clause of Paragraph 35 of the Accounting Standard for Retirement Benefits (ASBJ Statement No. 26, issued on May 17, 2012) and the main clause of Paragraph 67 of Guidance on Accounting Standard for Retirement Benefits (ASBJ Guidance No. 25, revised on March 26, 2015). Accordingly, the Bank and its consolidated subsidiaries have reviewed the methods used to calculate retirement benefit obligation and service cost, changed the method used to attribute projected benefit obligation to periods of service from a straight-line basis to a benefit formula basis and changed the method used to determine the discount rate from the method based on the average period up to the estimated payment date of retirement benefits in reference to the period of bonds which serves as a basis for determining discount rates to the method of using a single weighted average discount rate that reflects the estimated period and amount of benefit payments in each period.
In applying Accounting Standard for Retirement Benefits, the Bank and its consolidated subsidiaries followed the transitional treatment prescribed in Paragraph 37 of Accounting Standard for Retirement Benefits and the effects of the changes in the methods used to calculate retirement benefit obligation and service cost were deducted from retained earnings at April 1, 2014. As a result, net defined benefit liability increased by ¥10,845 million ($90,247 thousand) and retained earnings decreased by ¥7,006 million ($58,300 thousand) as of April 1, 2014. Income before income taxes and minority interests increased by ¥110 million ($915 thousand). The effect of this change on per share information is described in Note 26.
(t) Issued but not yet Adopted Accounting Standard and Others “Accounting Standard for Business Combinations” (ASBJ Statement No. 21, September 13, 2013) and its Related Accounting Standards and Guidance(1) OverviewThese accounting standards and guidance were revised principally concerning (i) “Accounting treatment for changes in a parent’s ownership interest in a subsidiary that does not result in loss of control in the additional acquisition of shares in a subsidiary,” (ii) “Accounting for acquisition related costs,” “Provisional accounting treatment” and “Presentation of net income and change from minority interests to non-controlling interests.”
(2) Scheduled Date of ApplicationThe Bank is scheduled to apply these revised accounting standards and guidance from the beginning of the fiscal year starting on April 1, 2015.
(3) Effects of Application of These Accounting Standards and GuidanceThe effect of the application of these accounting standards and guidance is currently under consideration.
3. SecuritiesSecurities include investments in interests and equity securities of unconsolidated subsidiaries and affiliates in the amounts of ¥439 million ($3,653 thousand) and ¥23 million ($191 thousand) at March 31, 2015 and ¥459 million and ¥23 million at March 31, 2014.
The amounts shown in the following tables include trust certificates classified as “Other debt purchased” and trading account securities, in addition to “Securities” stated in the consolidated balance sheet.
The amounts of liabilities for guarantees on corporate bonds included in securities issued by private placement (Article 2, Paragraph 3 of the Financial Instrument and Exchange Law) were ¥45,521 million ($378,805 thousand) and ¥38,451 million at March 31, 2015 and 2014, respectively.
THE CHUGOKU BANK, LIMITED20
010_0410501372709.indd 20 2015/09/08 18:44:11
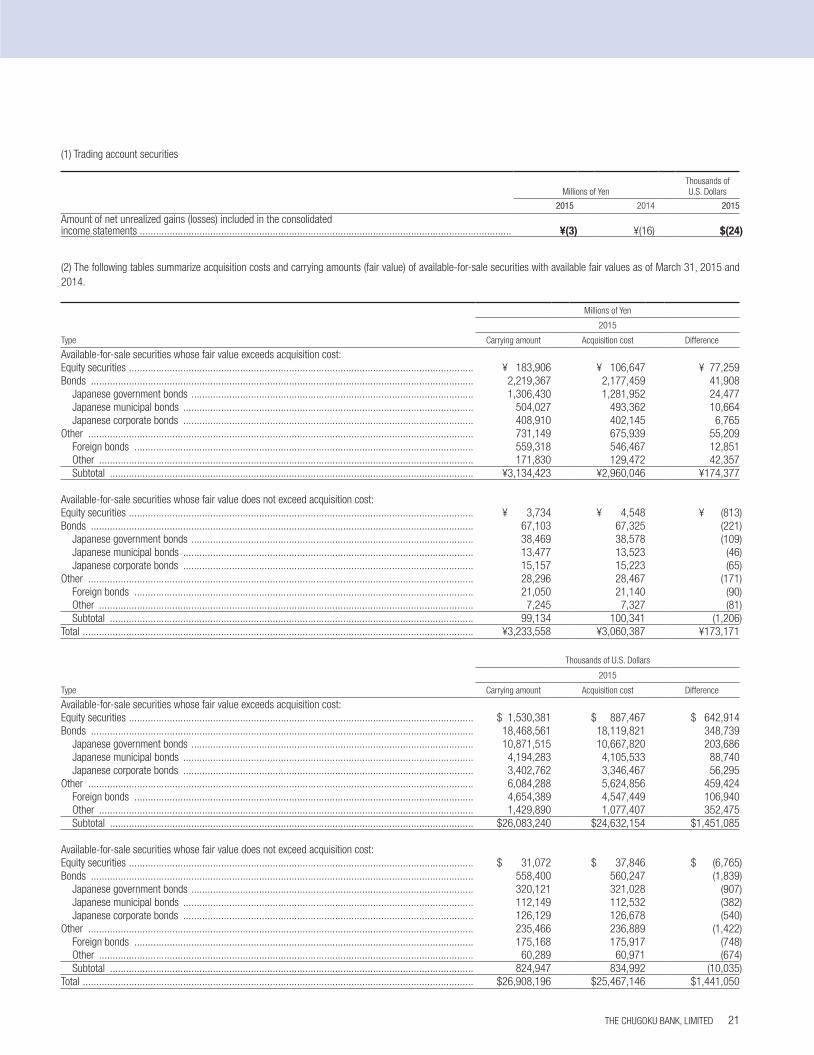
(2) The following tables summarize acquisition costs and carrying amounts (fair value) of available-for-sale securities with available fair values as of March 31, 2015 and 2014.
Millions of Yen
2015
Type Carrying amount Acquisition cost Difference
Available-for-sale securities whose fair value exceeds acquisition cost:Equity securities ............................................................................................................................... ¥ 183,906 ¥ 106,647 ¥ 77,259Bonds ............................................................................................................................................. 2,219,367 2,177,459 41,908
Japanese government bonds ........................................................................................................ 1,306,430 1,281,952 24,477Japanese municipal bonds ........................................................................................................... 504,027 493,362 10,664Japanese corporate bonds ........................................................................................................... 408,910 402,145 6,765
Other .............................................................................................................................................. 731,149 675,939 55,209Foreign bonds ............................................................................................................................. 559,318 546,467 12,851Other .......................................................................................................................................... 171,830 129,472 42,357Subtotal ...................................................................................................................................... ¥3,134,423 ¥2,960,046 ¥174,377
Available-for-sale securities whose fair value does not exceed acquisition cost:Equity securities ............................................................................................................................... ¥ 3,734 ¥ 4,548 ¥ (813)Bonds ............................................................................................................................................. 67,103 67,325 (221)
Japanese government bonds ........................................................................................................ 38,469 38,578 (109)Japanese municipal bonds ........................................................................................................... 13,477 13,523 (46)Japanese corporate bonds ........................................................................................................... 15,157 15,223 (65)
Other .............................................................................................................................................. 28,296 28,467 (171)Foreign bonds ............................................................................................................................. 21,050 21,140 (90)Other .......................................................................................................................................... 7,245 7,327 (81)Subtotal ...................................................................................................................................... 99,134 100,341 (1,206)
Total ................................................................................................................................................ ¥3,233,558 ¥3,060,387 ¥173,171
Thousands of U.S. Dollars
2015
Type Carrying amount Acquisition cost Difference
Available-for-sale securities whose fair value exceeds acquisition cost:Equity securities ............................................................................................................................... $ 1,530,381 $ 887,467 $ 642,914Bonds ............................................................................................................................................. 18,468,561 18,119,821 348,739
Japanese government bonds ........................................................................................................ 10,871,515 10,667,820 203,686Japanese municipal bonds ........................................................................................................... 4,194,283 4,105,533 88,740Japanese corporate bonds ........................................................................................................... 3,402,762 3,346,467 56,295
Other .............................................................................................................................................. 6,084,288 5,624,856 459,424Foreign bonds ............................................................................................................................. 4,654,389 4,547,449 106,940Other .......................................................................................................................................... 1,429,890 1,077,407 352,475Subtotal ...................................................................................................................................... $26,083,240 $24,632,154 $1,451,085
Available-for-sale securities whose fair value does not exceed acquisition cost:Equity securities ............................................................................................................................... $ 31,072 $ 37,846 $ (6,765)Bonds ............................................................................................................................................. 558,400 560,247 (1,839)
Japanese government bonds ........................................................................................................ 320,121 321,028 (907)Japanese municipal bonds ........................................................................................................... 112,149 112,532 (382)Japanese corporate bonds ........................................................................................................... 126,129 126,678 (540)
Other .............................................................................................................................................. 235,466 236,889 (1,422)Foreign bonds ............................................................................................................................. 175,168 175,917 (748)Other .......................................................................................................................................... 60,289 60,971 (674)Subtotal ...................................................................................................................................... 824,947 834,992 (10,035)
Total ................................................................................................................................................ $26,908,196 $25,467,146 $1,441,050
(1) Trading account securities
Millions of YenThousands of U.S. Dollars
2015 2014 2015
Amount of net unrealized gains (losses) included in the consolidated income statements ......................................................................................................................................... ¥(3) ¥(16) $(24)
THE CHUGOKU BANK, LIMITED 21
010_0410501372709.indd 21 2015/09/08 18:44:11
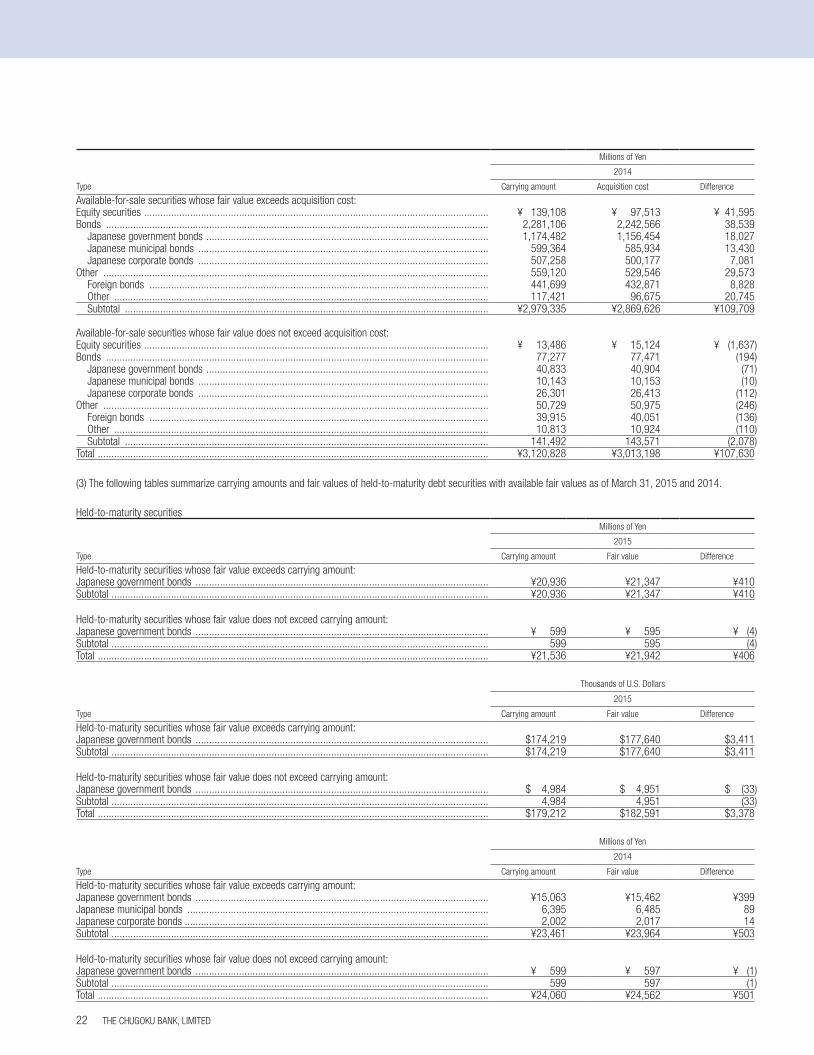
Millions of Yen
2014
Type Carrying amount Acquisition cost Difference
Available-for-sale securities whose fair value exceeds acquisition cost:Equity securities ............................................................................................................................... ¥ 139,108 ¥ 97,513 ¥ 41,595Bonds ............................................................................................................................................. 2,281,106 2,242,566 38,539
Japanese government bonds ........................................................................................................ 1,174,482 1,156,454 18,027Japanese municipal bonds ........................................................................................................... 599,364 585,934 13,430Japanese corporate bonds ........................................................................................................... 507,258 500,177 7,081
Other .............................................................................................................................................. 559,120 529,546 29,573Foreign bonds ............................................................................................................................. 441,699 432,871 8,828Other .......................................................................................................................................... 117,421 96,675 20,745Subtotal ...................................................................................................................................... ¥2,979,335 ¥2,869,626 ¥109,709
Available-for-sale securities whose fair value does not exceed acquisition cost:Equity securities ............................................................................................................................... ¥ 13,486 ¥ 15,124 ¥ (1,637)Bonds ............................................................................................................................................. 77,277 77,471 (194)
Japanese government bonds ........................................................................................................ 40,833 40,904 (71)Japanese municipal bonds ........................................................................................................... 10,143 10,153 (10)Japanese corporate bonds ........................................................................................................... 26,301 26,413 (112)
Other .............................................................................................................................................. 50,729 50,975 (246)Foreign bonds ............................................................................................................................. 39,915 40,051 (136)Other .......................................................................................................................................... 10,813 10,924 (110)Subtotal ...................................................................................................................................... 141,492 143,571 (2,078)
Total ................................................................................................................................................ ¥3,120,828 ¥3,013,198 ¥ 107,630
(3) The following tables summarize carrying amounts and fair values of held-to-maturity debt securities with available fair values as of March 31, 2015 and 2014.
Held-to-maturity securitiesMillions of Yen
2015
Type Carrying amount Fair value Difference
Held-to-maturity securities whose fair value exceeds carrying amount:Japanese government bonds ............................................................................................................ ¥20,936 ¥21,347 ¥410Subtotal ........................................................................................................................................... ¥20,936 ¥21,347 ¥410
Held-to-maturity securities whose fair value does not exceed carrying amount:Japanese government bonds ............................................................................................................ ¥ 599 ¥ 595 ¥ (4)Subtotal ........................................................................................................................................... 599 595 (4)Total ................................................................................................................................................ ¥21,536 ¥21,942 ¥406
Thousands of U.S. Dollars
2015
Type Carrying amount Fair value Difference
Held-to-maturity securities whose fair value exceeds carrying amount:Japanese government bonds ............................................................................................................ $174,219 $177,640 $3,411Subtotal ........................................................................................................................................... $174,219 $177,640 $3,411
Held-to-maturity securities whose fair value does not exceed carrying amount:Japanese government bonds ............................................................................................................ $ 4,984 $ 4,951 $ (33)Subtotal ........................................................................................................................................... 4,984 4,951 (33)Total ................................................................................................................................................ $179,212 $182,591 $3,378
Millions of Yen
2014
Type Carrying amount Fair value Difference
Held-to-maturity securities whose fair value exceeds carrying amount:Japanese government bonds ............................................................................................................ ¥15,063 ¥15,462 ¥399Japanese municipal bonds ............................................................................................................... 6,395 6,485 89Japanese corporate bonds ................................................................................................................ 2,002 2,017 14Subtotal ........................................................................................................................................... ¥23,461 ¥23,964 ¥503
Held-to-maturity securities whose fair value does not exceed carrying amount:Japanese government bonds ............................................................................................................ ¥ 599 ¥ 597 ¥ (1)Subtotal ........................................................................................................................................... 599 597 (1)Total ................................................................................................................................................ ¥24,060 ¥24,562 ¥501
THE CHUGOKU BANK, LIMITED22
010_0410501372709.indd 22 2015/09/08 18:44:11
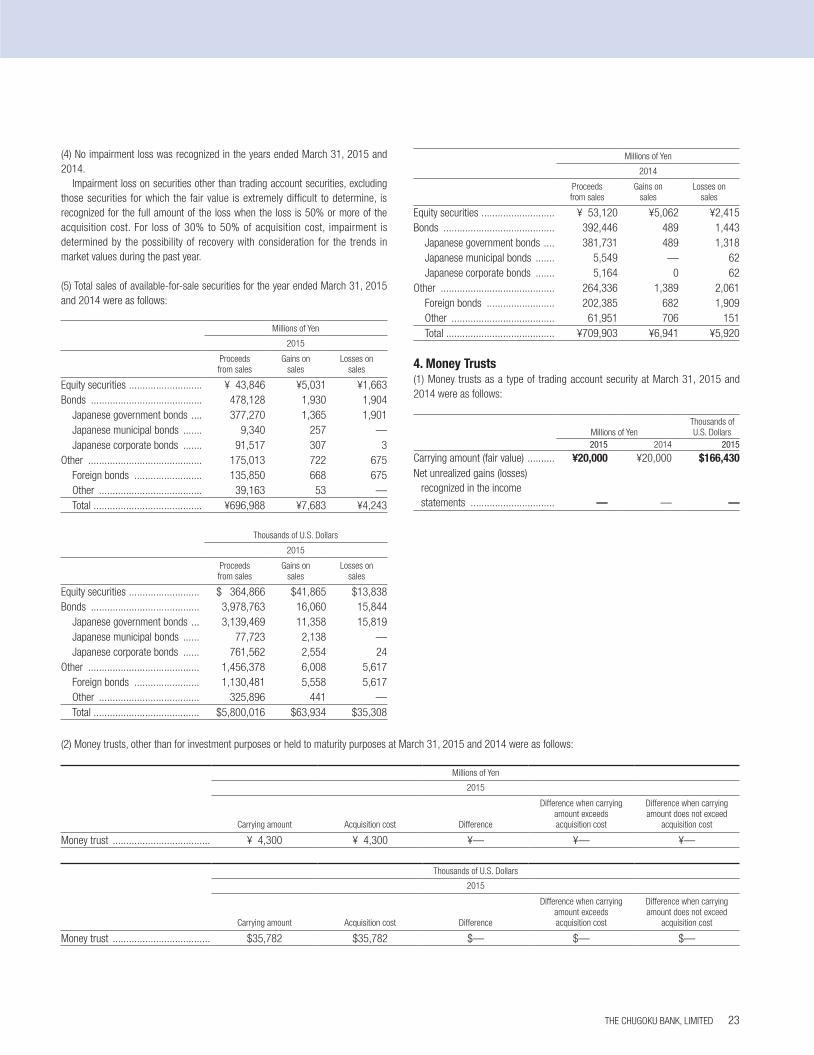
(4) No impairment loss was recognized in the years ended March 31, 2015 and 2014.
Impairment loss on securities other than trading account securities, excluding those securities for which the fair value is extremely difficult to determine, is recognized for the full amount of the loss when the loss is 50% or more of the acquisition cost. For loss of 30% to 50% of acquisition cost, impairment is determined by the possibility of recovery with consideration for the trends in market values during the past year.
(5) Total sales of available-for-sale securities for the year ended March 31, 2015 and 2014 were as follows:
Millions of Yen
2015
Proceeds from sales
Gains on sales
Losses on sales
Equity securities ........................... ¥ 43,846 ¥5,031 ¥1,663Bonds ......................................... 478,128 1,930 1,904
Japanese government bonds .... 377,270 1,365 1,901Japanese municipal bonds ....... 9,340 257 —Japanese corporate bonds ....... 91,517 307 3
Other .......................................... 175,013 722 675Foreign bonds ......................... 135,850 668 675Other ...................................... 39,163 53 —Total ........................................ ¥696,988 ¥7,683 ¥4,243
Thousands of U.S. Dollars
2015
Proceeds from sales
Gains on sales
Losses on sales
Equity securities .......................... $ 364,866 $41,865 $13,838Bonds ........................................ 3,978,763 16,060 15,844
Japanese government bonds ... 3,139,469 11,358 15,819Japanese municipal bonds ...... 77,723 2,138 —Japanese corporate bonds ...... 761,562 2,554 24
Other ......................................... 1,456,378 6,008 5,617Foreign bonds ........................ 1,130,481 5,558 5,617Other ..................................... 325,896 441 —Total ....................................... $5,800,016 $63,934 $35,308
Millions of Yen
2014
Proceeds from sales
Gains on sales
Losses on sales
Equity securities ........................... ¥ 53,120 ¥5,062 ¥2,415Bonds ......................................... 392,446 489 1,443
Japanese government bonds .... 381,731 489 1,318Japanese municipal bonds ....... 5,549 — 62Japanese corporate bonds ....... 5,164 0 62
Other .......................................... 264,336 1,389 2,061Foreign bonds ......................... 202,385 682 1,909Other ...................................... 61,951 706 151Total ........................................ ¥709,903 ¥6,941 ¥5,920
4. Money Trusts(1) Money trusts as a type of trading account security at March 31, 2015 and 2014 were as follows:
Millions of YenThousands ofU.S. Dollars
2015 2014 2015
Carrying amount (fair value) .......... ¥20,000 ¥20,000 $166,430Net unrealized gains (losses)
recognized in the income statements ............................... — — —
(2) Money trusts, other than for investment purposes or held to maturity purposes at March 31, 2015 and 2014 were as follows:
Millions of Yen
2015
Carrying amount Acquisition cost Difference
Difference when carrying amount exceeds acquisition cost
Difference when carrying amount does not exceed
acquisition cost
Money trust .................................... ¥ 4,300 ¥ 4,300 ¥— ¥— ¥—
Thousands of U.S. Dollars
2015
Carrying amount Acquisition cost Difference
Difference when carrying amount exceeds acquisition cost
Difference when carrying amount does not exceed
acquisition cost
Money trust .................................... $35,782 $35,782 $— $— $—
THE CHUGOKU BANK, LIMITED 23
010_0410501372709.indd 23 2015/09/08 18:44:11
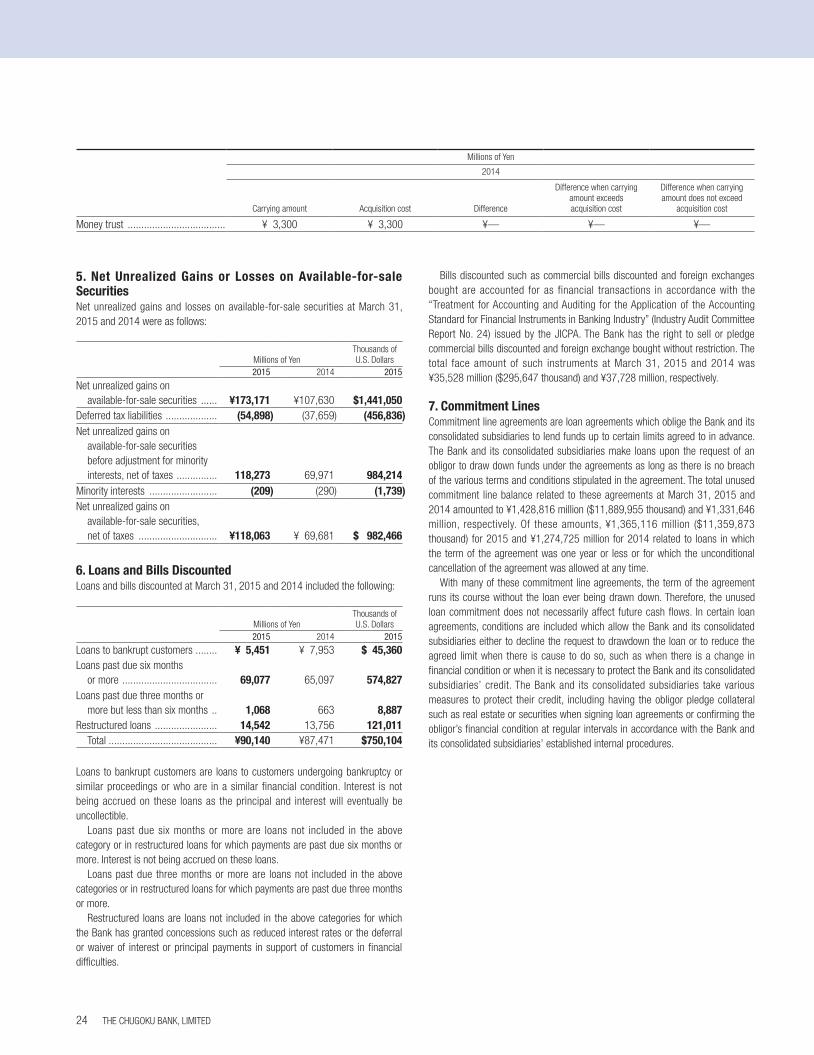
Millions of Yen
2014
Carrying amount Acquisition cost Difference
Difference when carrying amount exceeds acquisition cost
Difference when carrying amount does not exceed
acquisition cost
Money trust .................................... ¥ 3,300 ¥ 3,300 ¥— ¥— ¥—
5. Net Unrealized Gains or Losses on Available-for-sale SecuritiesNet unrealized gains and losses on available-for-sale securities at March 31, 2015 and 2014 were as follows:
Millions of YenThousands ofU.S. Dollars
2015 2014 2015
Net unrealized gains on available-for-sale securities ...... ¥173,171 ¥107,630 $1,441,050
Deferred tax liabilities ................... (54,898) (37,659) (456,836)Net unrealized gains on
available-for-sale securities before adjustment for minority interests, net of taxes ............... 118,273 69,971 984,214
Minority interests ......................... (209) (290) (1,739)Net unrealized gains on
available-for-sale securities, net of taxes ............................. ¥118,063 ¥ 69,681 $ 982,466
6. Loans and Bills DiscountedLoans and bills discounted at March 31, 2015 and 2014 included the following:
Millions of YenThousands ofU.S. Dollars
2015 2014 2015
Loans to bankrupt customers ........ ¥ 5,451 ¥ 7,953 $ 45,360Loans past due six months
or more ................................... 69,077 65,097 574,827Loans past due three months or
more but less than six months .. 1,068 663 8,887Restructured loans ....................... 14,542 13,756 121,011
Total ........................................ ¥90,140 ¥87,471 $750,104
Loans to bankrupt customers are loans to customers undergoing bankruptcy or similar proceedings or who are in a similar financial condition. Interest is not being accrued on these loans as the principal and interest will eventually be uncollectible.
Loans past due six months or more are loans not included in the above category or in restructured loans for which payments are past due six months or more. Interest is not being accrued on these loans.
Loans past due three months or more are loans not included in the above categories or in restructured loans for which payments are past due three months or more.
Restructured loans are loans not included in the above categories for which the Bank has granted concessions such as reduced interest rates or the deferral or waiver of interest or principal payments in support of customers in financial difficulties.
Bills discounted such as commercial bills discounted and foreign exchanges bought are accounted for as financial transactions in accordance with the “Treatment for Accounting and Auditing for the Application of the Accounting Standard for Financial Instruments in Banking Industry” (Industry Audit Committee Report No. 24) issued by the JICPA. The Bank has the right to sell or pledge commercial bills discounted and foreign exchange bought without restriction. The total face amount of such instruments at March 31, 2015 and 2014 was ¥35,528 million ($295,647 thousand) and ¥37,728 million, respectively.
7. Commitment LinesCommitment line agreements are loan agreements which oblige the Bank and its consolidated subsidiaries to lend funds up to certain limits agreed to in advance. The Bank and its consolidated subsidiaries make loans upon the request of an obligor to draw down funds under the agreements as long as there is no breach of the various terms and conditions stipulated in the agreement. The total unused commitment line balance related to these agreements at March 31, 2015 and 2014 amounted to ¥1,428,816 million ($11,889,955 thousand) and ¥1,331,646 million, respectively. Of these amounts, ¥1,365,116 million ($11,359,873 thousand) for 2015 and ¥1,274,725 million for 2014 related to loans in which the term of the agreement was one year or less or for which the unconditional cancellation of the agreement was allowed at any time.
With many of these commitment line agreements, the term of the agreement runs its course without the loan ever being drawn down. Therefore, the unused loan commitment does not necessarily affect future cash flows. In certain loan agreements, conditions are included which allow the Bank and its consolidated subsidiaries either to decline the request to drawdown the loan or to reduce the agreed limit when there is cause to do so, such as when there is a change in financial condition or when it is necessary to protect the Bank and its consolidated subsidiaries’ credit. The Bank and its consolidated subsidiaries take various measures to protect their credit, including having the obligor pledge collateral such as real estate or securities when signing loan agreements or confirming the obligor’s financial condition at regular intervals in accordance with the Bank and its consolidated subsidiaries’ established internal procedures.
THE CHUGOKU BANK, LIMITED24
010_0410501372709.indd 24 2015/09/08 18:44:11
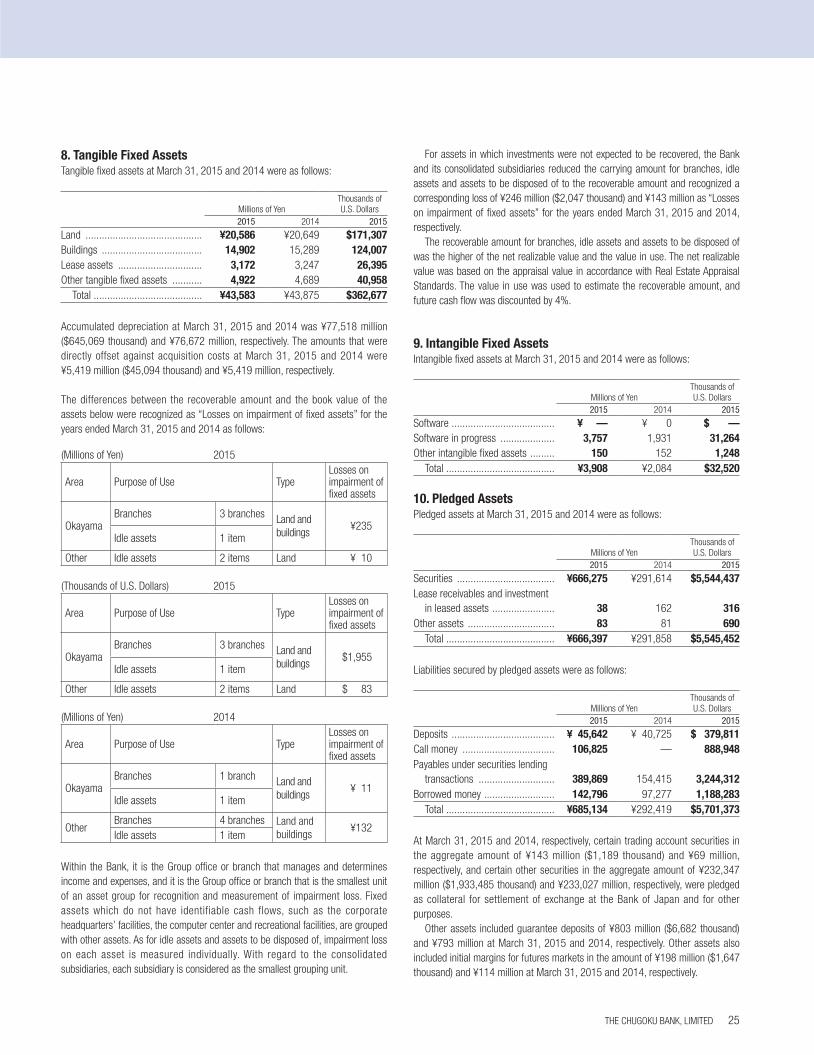
8. Tangible Fixed AssetsTangible fixed assets at March 31, 2015 and 2014 were as follows:
Millions of YenThousands ofU.S. Dollars
2015 2014 2015
Land ........................................... ¥20,586 ¥20,649 $171,307Buildings ..................................... 14,902 15,289 124,007Lease assets ............................... 3,172 3,247 26,395Other tangible fixed assets ........... 4,922 4,689 40,958
Total ........................................ ¥43,583 ¥43,875 $362,677
Accumulated depreciation at March 31, 2015 and 2014 was ¥77,518 million ($645,069 thousand) and ¥76,672 million, respectively. The amounts that were directly offset against acquisition costs at March 31, 2015 and 2014 were ¥5,419 million ($45,094 thousand) and ¥5,419 million, respectively.
The differences between the recoverable amount and the book value of the assets below were recognized as “Losses on impairment of fixed assets” for the years ended March 31, 2015 and 2014 as follows:
(Millions of Yen) 2015
Area Purpose of Use TypeLosses on impairment of fixed assets
OkayamaBranches 3 branches Land and
buildings¥235
Idle assets 1 item
Other Idle assets 2 items Land ¥ 10
(Thousands of U.S. Dollars) 2015
Area Purpose of Use TypeLosses on impairment of fixed assets
OkayamaBranches 3 branches Land and
buildings$1,955
Idle assets 1 item
Other Idle assets 2 items Land $ 83
(Millions of Yen) 2014
Area Purpose of Use TypeLosses on impairment of fixed assets
OkayamaBranches 1 branch Land and
buildings¥ 11
Idle assets 1 item
OtherBranches 4 branches Land and
buildings¥132
Idle assets 1 item
Within the Bank, it is the Group office or branch that manages and determines income and expenses, and it is the Group office or branch that is the smallest unit of an asset group for recognition and measurement of impairment loss. Fixed assets which do not have identifiable cash flows, such as the corporate headquarters’ facilities, the computer center and recreational facilities, are grouped with other assets. As for idle assets and assets to be disposed of, impairment loss on each asset is measured individually. With regard to the consolidated subsidiaries, each subsidiary is considered as the smallest grouping unit.
For assets in which investments were not expected to be recovered, the Bank and its consolidated subsidiaries reduced the carrying amount for branches, idle assets and assets to be disposed of to the recoverable amount and recognized a corresponding loss of ¥246 million ($2,047 thousand) and ¥143 million as “Losses on impairment of fixed assets” for the years ended March 31, 2015 and 2014, respectively.
The recoverable amount for branches, idle assets and assets to be disposed of was the higher of the net realizable value and the value in use. The net realizable value was based on the appraisal value in accordance with Real Estate Appraisal Standards. The value in use was used to estimate the recoverable amount, and future cash flow was discounted by 4%.
9. Intangible Fixed AssetsIntangible fixed assets at March 31, 2015 and 2014 were as follows:
Millions of YenThousands ofU.S. Dollars
2015 2014 2015
Software ...................................... ¥ — ¥ 0 $ —Software in progress .................... 3,757 1,931 31,264Other intangible fixed assets ......... 150 152 1,248
Total ........................................ ¥3,908 ¥2,084 $32,520
10. Pledged AssetsPledged assets at March 31, 2015 and 2014 were as follows:
Millions of YenThousands ofU.S. Dollars
2015 2014 2015
Securities .................................... ¥666,275 ¥291,614 $5,544,437Lease receivables and investment
in leased assets ....................... 38 162 316Other assets ................................ 83 81 690
Total ........................................ ¥666,397 ¥291,858 $5,545,452
Liabilities secured by pledged assets were as follows:
Millions of YenThousands ofU.S. Dollars
2015 2014 2015
Deposits ...................................... ¥ 45,642 ¥ 40,725 $ 379,811Call money .................................. 106,825 — 888,948Payables under securities lending
transactions ............................ 389,869 154,415 3,244,312Borrowed money .......................... 142,796 97,277 1,188,283
Total ........................................ ¥685,134 ¥292,419 $5,701,373
At March 31, 2015 and 2014, respectively, certain trading account securities in the aggregate amount of ¥143 million ($1,189 thousand) and ¥69 million, respectively, and certain other securities in the aggregate amount of ¥232,347 million ($1,933,485 thousand) and ¥233,027 million, respectively, were pledged as collateral for settlement of exchange at the Bank of Japan and for other purposes.
Other assets included guarantee deposits of ¥803 million ($6,682 thousand) and ¥793 million at March 31, 2015 and 2014, respectively. Other assets also included initial margins for futures markets in the amount of ¥198 million ($1,647 thousand) and ¥114 million at March 31, 2015 and 2014, respectively.
THE CHUGOKU BANK, LIMITED 25
010_0410501372709.indd 25 2015/09/08 18:44:12
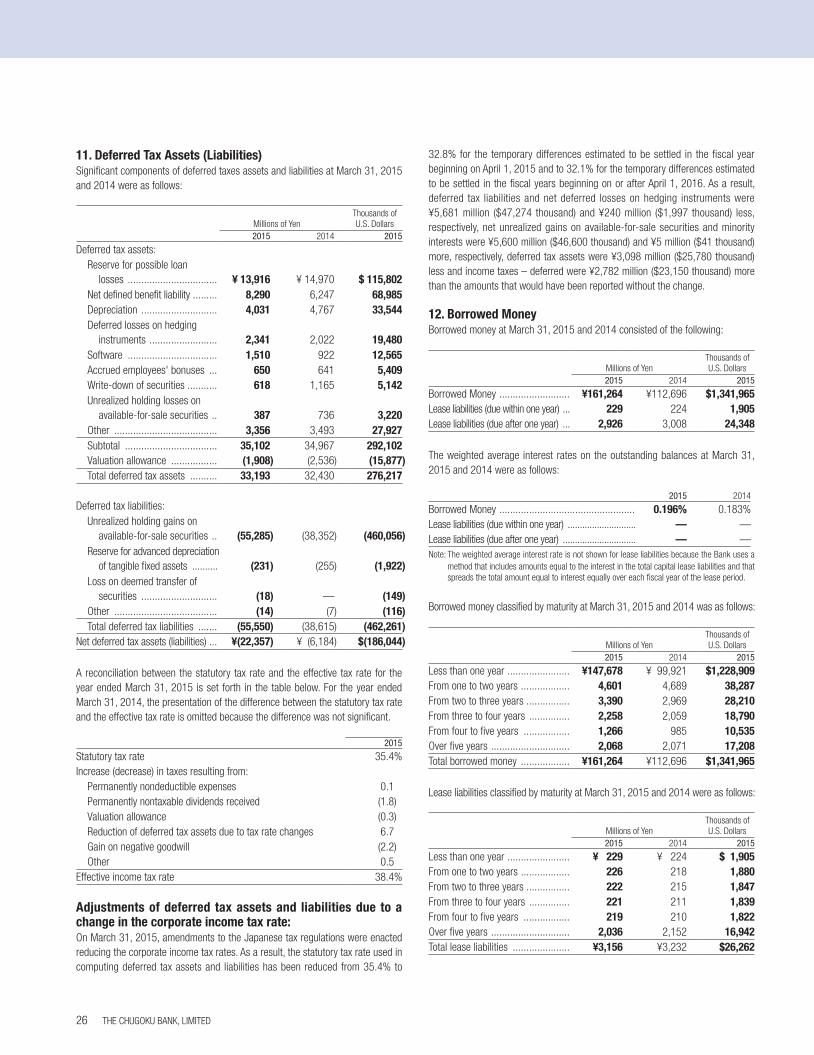
11. Deferred Tax Assets (Liabilities)Significant components of deferred taxes assets and liabilities at March 31, 2015 and 2014 were as follows:
Millions of YenThousands ofU.S. Dollars
2015 2014 2015
Deferred tax assets:Reserve for possible loan
losses ................................. ¥ 13,916 ¥ 14,970 $ 115,802Net defined benefit liability ......... 8,290 6,247 68,985Depreciation ............................ 4,031 4,767 33,544Deferred losses on hedging
instruments ......................... 2,341 2,022 19,480Software ................................. 1,510 922 12,565Accrued employees' bonuses ... 650 641 5,409Write-down of securities ........... 618 1,165 5,142Unrealized holding losses on
available-for-sale securities .. 387 736 3,220Other ...................................... 3,356 3,493 27,927Subtotal .................................. 35,102 34,967 292,102Valuation allowance ................. (1,908) (2,536) (15,877)Total deferred tax assets .......... 33,193 32,430 276,217
Deferred tax liabilities:Unrealized holding gains on
available-for-sale securities .. (55,285) (38,352) (460,056)Reserve for advanced depreciation
of tangible fixed assets .......... (231) (255) (1,922)Loss on deemed transfer of
securities ............................ (18) — (149)Other ...................................... (14) (7) (116)Total deferred tax liabilities ....... (55,550) (38,615) (462,261)
Net deferred tax assets (liabilities) ... ¥(22,357) ¥ (6,184) $(186,044)
A reconciliation between the statutory tax rate and the effective tax rate for the year ended March 31, 2015 is set forth in the table below. For the year ended March 31, 2014, the presentation of the difference between the statutory tax rate and the effective tax rate is omitted because the difference was not significant.
2015
Statutory tax rate 35.4%Increase (decrease) in taxes resulting from:
Permanently nondeductible expenses 0.1Permanently nontaxable dividends received (1.8)Valuation allowance (0.3)Reduction of deferred tax assets due to tax rate changes 6.7Gain on negative goodwill (2.2)Other 0.5
Effective income tax rate 38.4%
Adjustments of deferred tax assets and liabilities due to a change in the corporate income tax rate:On March 31, 2015, amendments to the Japanese tax regulations were enacted reducing the corporate income tax rates. As a result, the statutory tax rate used in computing deferred tax assets and liabilities has been reduced from 35.4% to
32.8% for the temporary differences estimated to be settled in the fiscal year beginning on April 1, 2015 and to 32.1% for the temporary differences estimated to be settled in the fiscal years beginning on or after April 1, 2016. As a result, deferred tax liabilities and net deferred losses on hedging instruments were ¥5,681 million ($47,274 thousand) and ¥240 million ($1,997 thousand) less, respectively, net unrealized gains on available-for-sale securities and minority interests were ¥5,600 million ($46,600 thousand) and ¥5 million ($41 thousand) more, respectively, deferred tax assets were ¥3,098 million ($25,780 thousand) less and income taxes – deferred were ¥2,782 million ($23,150 thousand) more than the amounts that would have been reported without the change.
12. Borrowed MoneyBorrowed money at March 31, 2015 and 2014 consisted of the following:
Millions of YenThousands ofU.S. Dollars
2015 2014 2015
Borrowed Money .......................... ¥161,264 ¥112,696 $1,341,965Lease liabilities (due within one year) ... 229 224 1,905Lease liabilities (due after one year) ... 2,926 3,008 24,348
The weighted average interest rates on the outstanding balances at March 31, 2015 and 2014 were as follows:
2015 2014
Borrowed Money .................................................. 0.196% 0.183%Lease liabilities (due within one year) ............................ — —Lease liabilities (due after one year) .............................. — —Note: The weighted average interest rate is not shown for lease liabilities because the Bank uses a
method that includes amounts equal to the interest in the total capital lease liabilities and that spreads the total amount equal to interest equally over each fiscal year of the lease period.
Borrowed money classified by maturity at March 31, 2015 and 2014 was as follows:
Millions of YenThousands ofU.S. Dollars
2015 2014 2015
Less than one year ....................... ¥147,678 ¥ 99,921 $1,228,909From one to two years .................. 4,601 4,689 38,287From two to three years ................ 3,390 2,969 28,210From three to four years ............... 2,258 2,059 18,790From four to five years ................. 1,266 985 10,535Over five years ............................. 2,068 2,071 17,208Total borrowed money .................. ¥161,264 ¥112,696 $1,341,965
Lease liabilities classified by maturity at March 31, 2015 and 2014 were as follows:
Millions of YenThousands ofU.S. Dollars
2015 2014 2015
Less than one year ....................... ¥ 229 ¥ 224 $ 1,905From one to two years .................. 226 218 1,880From two to three years ................ 222 215 1,847From three to four years ............... 221 211 1,839From four to five years ................. 219 210 1,822Over five years ............................. 2,036 2,152 16,942Total lease liabilities ..................... ¥3,156 ¥3,232 $26,262
THE CHUGOKU BANK, LIMITED26
010_0410501372709.indd 26 2015/09/08 18:44:12
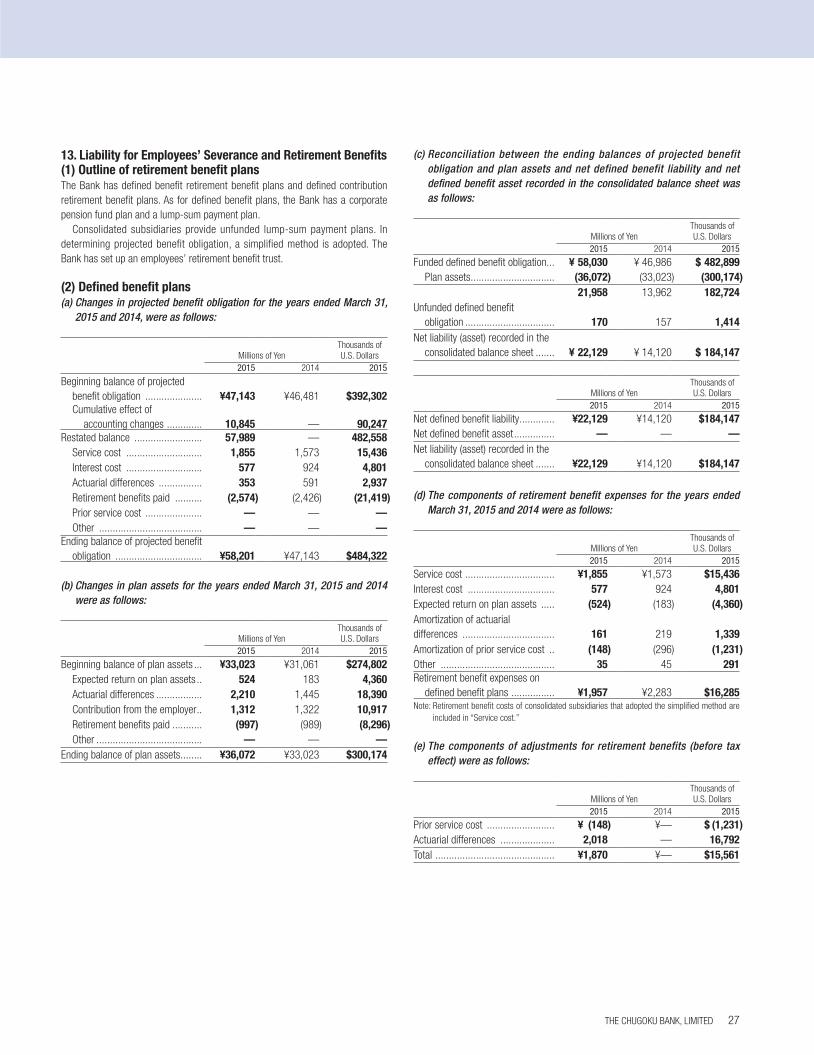
13. Liability for Employees’ Severance and Retirement Benefits(1) Outline of retirement benefit plansThe Bank has defined benefit retirement benefit plans and defined contribution retirement benefit plans. As for defined benefit plans, the Bank has a corporate pension fund plan and a lump-sum payment plan.
Consolidated subsidiaries provide unfunded lump-sum payment plans. In determining projected benefit obligation, a simplified method is adopted. The Bank has set up an employees’ retirement benefit trust.
(2) Defined benefit plans(a) Changes in projected benefit obligation for the years ended March 31,
2015 and 2014, were as follows:
Millions of YenThousands ofU.S. Dollars
2015 2014 2015
Beginning balance of projected benefit obligation ..................... ¥47,143 ¥46,481 $392,302Cumulative effect of
accounting changes ............. 10,845 — 90,247Restated balance ......................... 57,989 — 482,558
Service cost ............................ 1,855 1,573 15,436Interest cost ............................ 577 924 4,801Actuarial differences ................ 353 591 2,937Retirement benefits paid .......... (2,574) (2,426) (21,419)Prior service cost ..................... — — —Other ...................................... — — —
Ending balance of projected benefit obligation ................................ ¥58,201 ¥47,143 $484,322
(b) Changes in plan assets for the years ended March 31, 2015 and 2014 were as follows:
Millions of YenThousands ofU.S. Dollars
2015 2014 2015
Beginning balance of plan assets ... ¥33,023 ¥31,061 $274,802Expected return on plan assets .. 524 183 4,360Actuarial differences ................. 2,210 1,445 18,390Contribution from the employer .. 1,312 1,322 10,917Retirement benefits paid ........... (997) (989) (8,296)Other ....................................... — — —
Ending balance of plan assets ........ ¥36,072 ¥33,023 $300,174
(c) Reconciliation between the ending balances of projected benefit obligation and plan assets and net defined benefit liability and net defined benefit asset recorded in the consolidated balance sheet was as follows:
Millions of YenThousands ofU.S. Dollars
2015 2014 2015
Funded defined benefit obligation... ¥ 58,030 ¥ 46,986 $ 482,899Plan assets ............................... (36,072) (33,023) (300,174)
21,958 13,962 182,724Unfunded defined benefit
obligation ................................. 170 157 1,414Net liability (asset) recorded in the
consolidated balance sheet ....... ¥ 22,129 ¥ 14,120 $ 184,147
Millions of YenThousands ofU.S. Dollars
2015 2014 2015
Net defined benefit liability ............. ¥22,129 ¥14,120 $184,147Net defined benefit asset ............... — — —Net liability (asset) recorded in the
consolidated balance sheet ....... ¥22,129 ¥14,120 $184,147
(d) The components of retirement benefit expenses for the years ended March 31, 2015 and 2014 were as follows:
Millions of YenThousands ofU.S. Dollars
2015 2014 2015
Service cost ................................. ¥1,855 ¥1,573 $15,436Interest cost ................................ 577 924 4,801Expected return on plan assets ..... (524) (183) (4,360)Amortization of actuarial differences .................................. 161 219 1,339Amortization of prior service cost .. (148) (296) (1,231)Other .......................................... 35 45 291Retirement benefit expenses on
defined benefit plans ................ ¥1,957 ¥2,283 $16,285Note: Retirement benefit costs of consolidated subsidiaries that adopted the simplified method are
included in “Service cost.”
(e) The components of adjustments for retirement benefits (before tax effect) were as follows:
Millions of YenThousands ofU.S. Dollars
2015 2014 2015
Prior service cost ......................... ¥ (148) ¥— $ (1,231)Actuarial differences .................... 2,018 — 16,792Total ............................................ ¥1,870 ¥— $15,561
THE CHUGOKU BANK, LIMITED 27
010_0410501372709.indd 27 2015/09/08 18:44:12
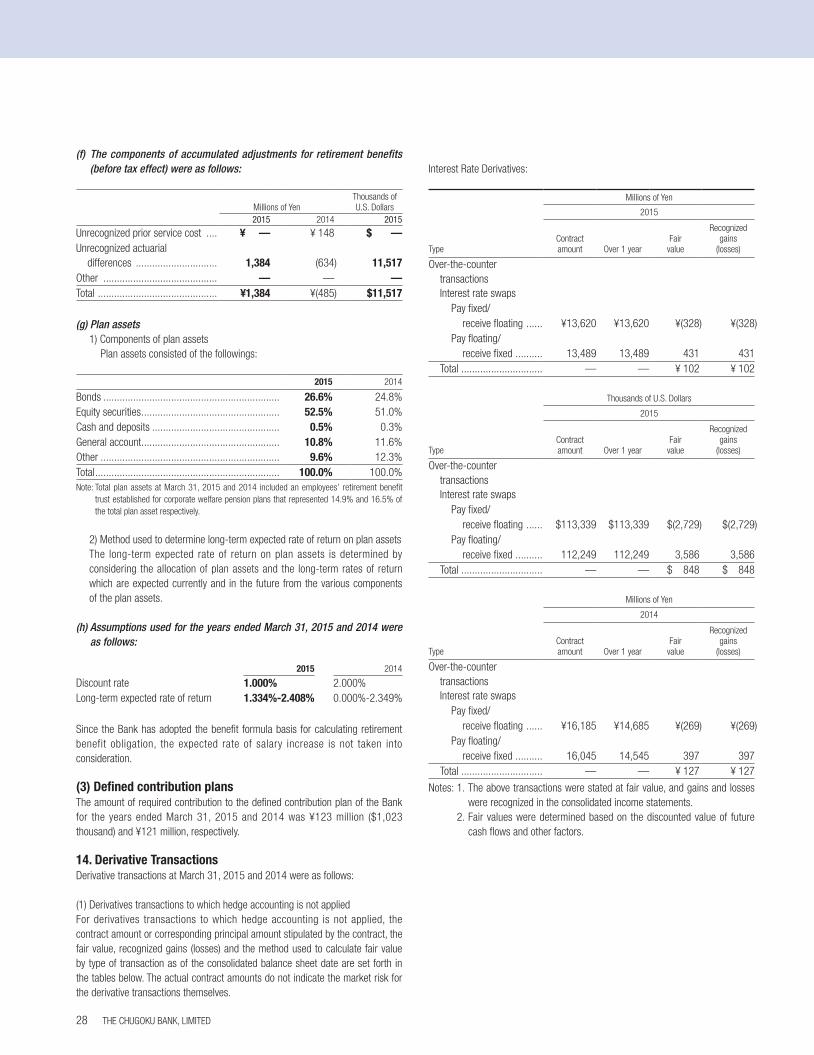
(f) The components of accumulated adjustments for retirement benefits (before tax effect) were as follows:
Millions of YenThousands ofU.S. Dollars
2015 2014 2015
Unrecognized prior service cost .... ¥ — ¥ 148 $ —Unrecognized actuarial
differences .............................. 1,384 (634) 11,517Other .......................................... — — —Total ............................................ ¥1,384 ¥(485) $11,517
(g) Plan assets1) Components of plan assets
Plan assets consisted of the followings:
2015 2014
Bonds ................................................................. 26.6% 24.8%Equity securities ................................................... 52.5% 51.0%Cash and deposits ............................................... 0.5% 0.3%General account ................................................... 10.8% 11.6%Other .................................................................. 9.6% 12.3%Total .................................................................... 100.0% 100.0%Note: Total plan assets at March 31, 2015 and 2014 included an employees’ retirement benefit
trust established for corporate welfare pension plans that represented 14.9% and 16.5% of the total plan asset respectively.
2) Method used to determine long-term expected rate of return on plan assetsThe long-term expected rate of return on plan assets is determined by considering the allocation of plan assets and the long-term rates of return which are expected currently and in the future from the various components of the plan assets.
(h) Assumptions used for the years ended March 31, 2015 and 2014 were as follows:
2015 2014
Discount rate 1.000% 2.000%Long-term expected rate of return 1.334%-2.408% 0.000%-2.349%
Since the Bank has adopted the benefit formula basis for calculating retirement benefit obligation, the expected rate of salary increase is not taken into consideration.
(3) Defined contribution plansThe amount of required contribution to the defined contribution plan of the Bank for the years ended March 31, 2015 and 2014 was ¥123 million ($1,023 thousand) and ¥121 million, respectively.
14. Derivative TransactionsDerivative transactions at March 31, 2015 and 2014 were as follows:
(1) Derivatives transactions to which hedge accounting is not appliedFor derivatives transactions to which hedge accounting is not applied, the contract amount or corresponding principal amount stipulated by the contract, the fair value, recognized gains (losses) and the method used to calculate fair value by type of transaction as of the consolidated balance sheet date are set forth in the tables below. The actual contract amounts do not indicate the market risk for the derivative transactions themselves.
Interest Rate Derivatives:
Millions of Yen
2015
TypeContract amount Over 1 year
Fair value
Recognized gains
(losses)
Over-the-counter transactionsInterest rate swaps
Pay fixed/receive floating ...... ¥13,620 ¥13,620 ¥(328) ¥(328)
Pay floating/receive fixed .......... 13,489 13,489 431 431
Total .............................. — — ¥ 102 ¥ 102
Thousands of U.S. Dollars
2015
TypeContract amount Over 1 year
Fair value
Recognized gains
(losses)
Over-the-counter transactionsInterest rate swaps
Pay fixed/receive floating ...... $113,339 $113,339 $(2,729) $(2,729)
Pay floating/receive fixed .......... 112,249 112,249 3,586 3,586
Total .............................. — — $ 848 $ 848
Millions of Yen
2014
TypeContract amount Over 1 year
Fair value
Recognized gains
(losses)
Over-the-counter transactionsInterest rate swaps
Pay fixed/receive floating ...... ¥16,185 ¥14,685 ¥(269) ¥(269)
Pay floating/receive fixed .......... 16,045 14,545 397 397
Total .............................. — — ¥ 127 ¥ 127
Notes: 1. The above transactions were stated at fair value, and gains and losses were recognized in the consolidated income statements.
2. Fair values were determined based on the discounted value of future cash flows and other factors.
THE CHUGOKU BANK, LIMITED28
010_0410501372709.indd 28 2015/09/08 18:44:12
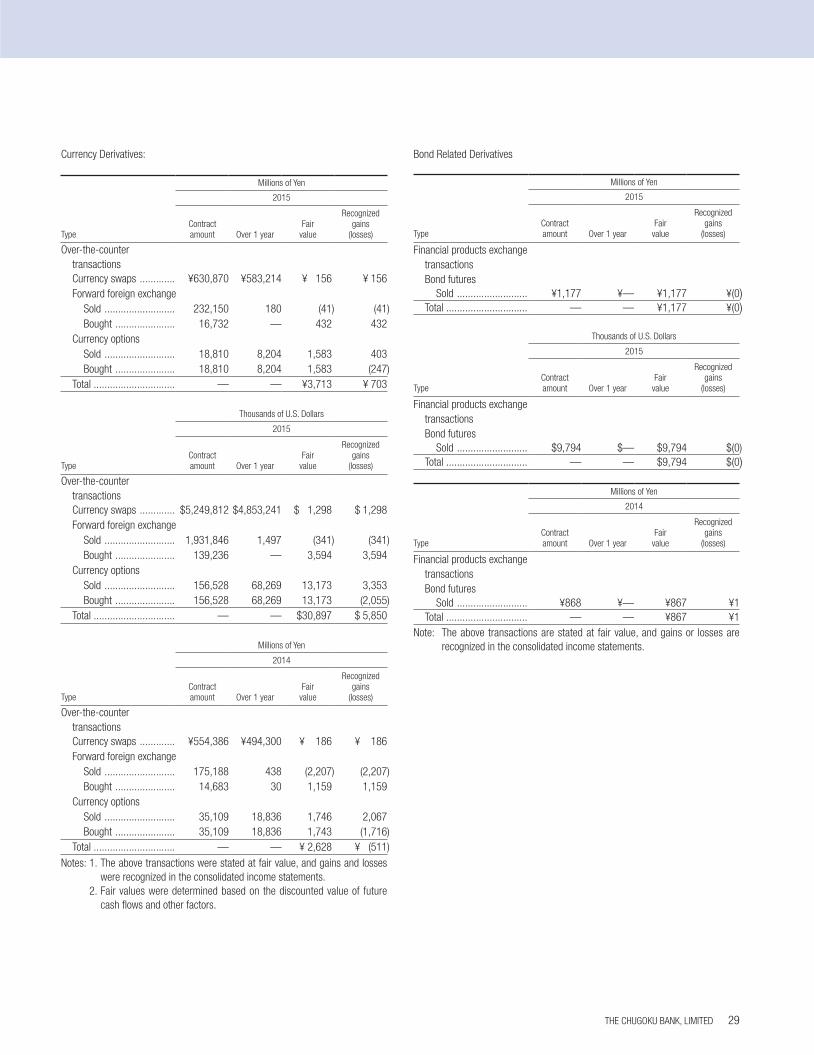
Currency Derivatives:
Millions of Yen
2015
TypeContract amount Over 1 year
Fair value
Recognized gains
(losses)
Over-the-counter transactionsCurrency swaps ............. ¥630,870 ¥583,214 ¥ 156 ¥ 156Forward foreign exchange
Sold .......................... 232,150 180 (41) (41)Bought ...................... 16,732 — 432 432
Currency optionsSold .......................... 18,810 8,204 1,583 403Bought ...................... 18,810 8,204 1,583 (247)
Total .............................. — — ¥3,713 ¥ 703
Thousands of U.S. Dollars
2015
TypeContract amount Over 1 year
Fair value
Recognized gains
(losses)
Over-the-counter transactionsCurrency swaps ............. $5,249,812 $4,853,241 $ 1,298 $ 1,298Forward foreign exchange
Sold .......................... 1,931,846 1,497 (341) (341)Bought ...................... 139,236 — 3,594 3,594
Currency optionsSold .......................... 156,528 68,269 13,173 3,353Bought ...................... 156,528 68,269 13,173 (2,055)
Total .............................. — — $30,897 $ 5,850
Millions of Yen
2014
TypeContract amount Over 1 year
Fair value
Recognized gains
(losses)
Over-the-counter transactionsCurrency swaps ............. ¥554,386 ¥494,300 ¥ 186 ¥ 186Forward foreign exchange
Sold .......................... 175,188 438 (2,207) (2,207)Bought ...................... 14,683 30 1,159 1,159
Currency optionsSold .......................... 35,109 18,836 1,746 2,067Bought ...................... 35,109 18,836 1,743 (1,716)
Total .............................. — — ¥ 2,628 ¥ (511)
Notes: 1. The above transactions were stated at fair value, and gains and losses were recognized in the consolidated income statements.
2. Fair values were determined based on the discounted value of future cash flows and other factors.
Bond Related Derivatives
Millions of Yen
2015
TypeContract amount Over 1 year
Fair value
Recognized gains
(losses)
Financial products exchange transactionsBond futures
Sold .......................... ¥1,177 ¥— ¥1,177 ¥(0)Total .............................. — — ¥1,177 ¥(0)
Thousands of U.S. Dollars
2015
TypeContract amount Over 1 year
Fair value
Recognized gains
(losses)
Financial products exchange transactionsBond futures
Sold .......................... $9,794 $— $9,794 $(0)Total .............................. — — $9,794 $(0)
Millions of Yen
2014
TypeContract amount Over 1 year
Fair value
Recognized gains
(losses)
Financial products exchange transactionsBond futures
Sold .......................... ¥868 ¥— ¥867 ¥1Total .............................. — — ¥867 ¥1
Note: The above transactions are stated at fair value, and gains or losses are recognized in the consolidated income statements.
THE CHUGOKU BANK, LIMITED 29
010_0410501372709.indd 29 2015/09/08 18:44:12
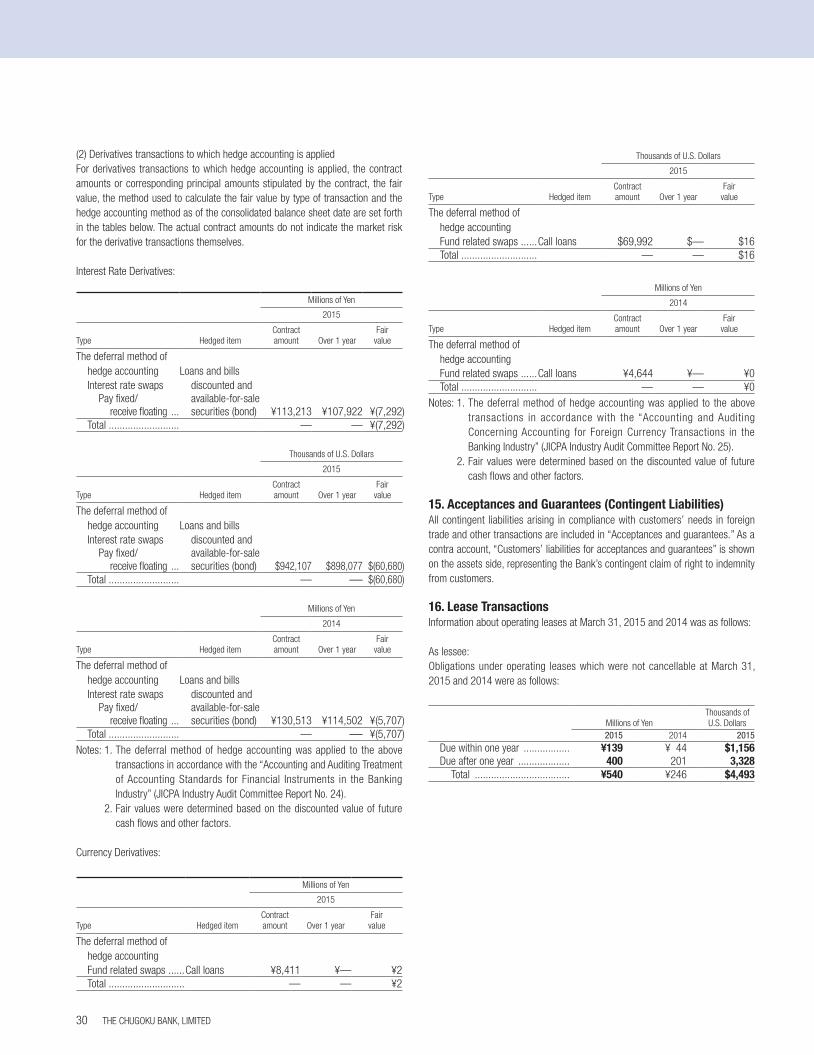
Thousands of U.S. Dollars
2015
Type Hedged itemContract amount Over 1 year
Fair value
The deferral method of hedge accountingFund related swaps ......Call loans $69,992 $— $16Total ............................ — — $16
Millions of Yen
2014
Type Hedged itemContract amount Over 1 year
Fair value
The deferral method of hedge accountingFund related swaps ......Call loans ¥4,644 ¥— ¥0Total ............................ — — ¥0
Notes: 1. The deferral method of hedge accounting was applied to the above transactions in accordance with the “Accounting and Auditing Concerning Accounting for Foreign Currency Transactions in the Banking Industry” (JICPA Industry Audit Committee Report No. 25).
2. Fair values were determined based on the discounted value of future cash flows and other factors.
15. Acceptances and Guarantees (Contingent Liabilities)All contingent liabilities arising in compliance with customers’ needs in foreign trade and other transactions are included in “Acceptances and guarantees.” As a contra account, “Customers’ liabilities for acceptances and guarantees” is shown on the assets side, representing the Bank’s contingent claim of right to indemnity from customers.
16. Lease TransactionsInformation about operating leases at March 31, 2015 and 2014 was as follows:
As lessee:Obligations under operating leases which were not cancellable at March 31, 2015 and 2014 were as follows:
Millions of YenThousands ofU.S. Dollars
2015 2014 2015Due within one year ................. ¥139 ¥ 44 $1,156Due after one year ................... 400 201 3,328
Total ................................... ¥540 ¥246 $4,493
(2) Derivatives transactions to which hedge accounting is appliedFor derivatives transactions to which hedge accounting is applied, the contract amounts or corresponding principal amounts stipulated by the contract, the fair value, the method used to calculate the fair value by type of transaction and the hedge accounting method as of the consolidated balance sheet date are set forth in the tables below. The actual contract amounts do not indicate the market risk for the derivative transactions themselves.
Interest Rate Derivatives:
Millions of Yen
2015
Type Hedged itemContract amount Over 1 year
Fair value
The deferral method of hedge accounting Loans and billsInterest rate swaps discounted and
Pay fixed/ available-for-sale receive floating ... securities (bond) ¥113,213 ¥107,922 ¥(7,292)
Total .......................... — — ¥(7,292)
Thousands of U.S. Dollars
2015
Type Hedged itemContract amount Over 1 year
Fair value
The deferral method of hedge accounting Loans and billsInterest rate swaps discounted and
Pay fixed/ available-for-sale receive floating ... securities (bond) $942,107 $898,077 $(60,680)
Total .......................... — — $(60,680)
Millions of Yen
2014
Type Hedged itemContract amount Over 1 year
Fair value
The deferral method of hedge accounting Loans and billsInterest rate swaps discounted and
Pay fixed/ available-for-sale receive floating ... securities (bond) ¥130,513 ¥114,502 ¥(5,707)
Total .......................... — — ¥(5,707)Notes: 1. The deferral method of hedge accounting was applied to the above
transactions in accordance with the “Accounting and Auditing Treatment of Accounting Standards for Financial Instruments in the Banking Industry” (JICPA Industry Audit Committee Report No. 24).
2. Fair values were determined based on the discounted value of future cash flows and other factors.
Currency Derivatives:
Millions of Yen
2015
Type Hedged itemContract amount Over 1 year
Fair value
The deferral method of hedge accountingFund related swaps ......Call loans ¥8,411 ¥— ¥2Total ............................ — — ¥2
THE CHUGOKU BANK, LIMITED30
010_0410501372709.indd 30 2015/09/08 18:44:12
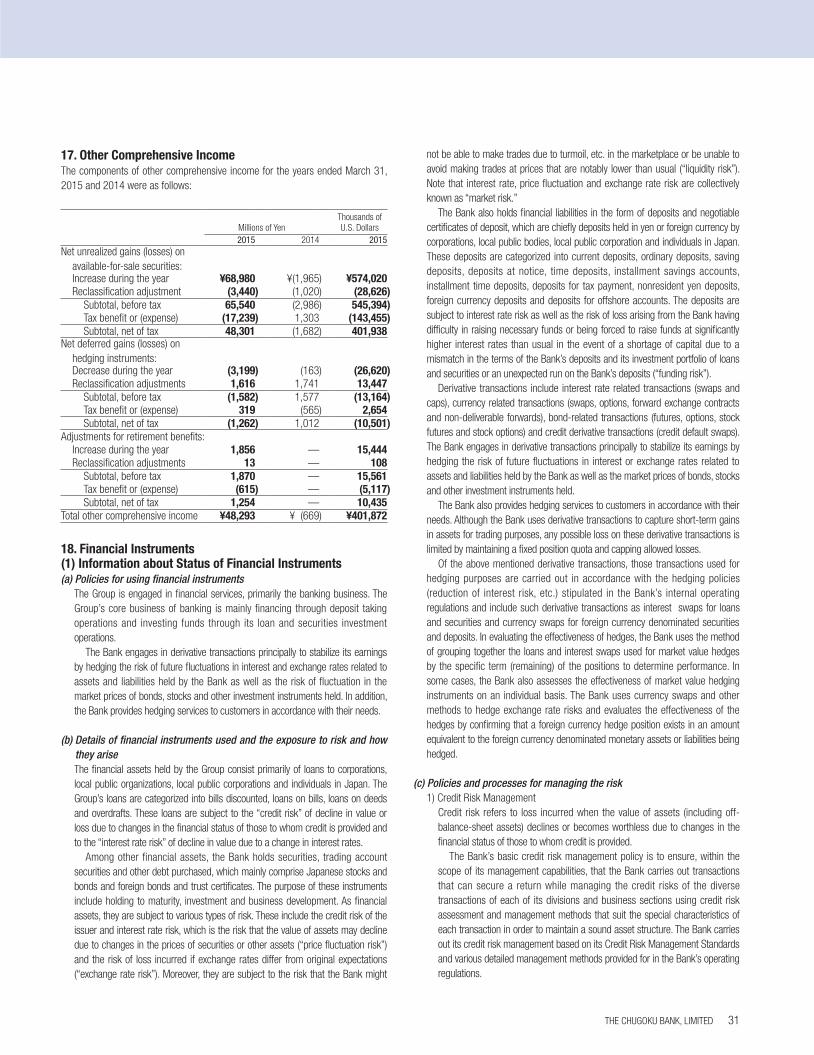
17. Other Comprehensive IncomeThe components of other comprehensive income for the years ended March 31, 2015 and 2014 were as follows:
Millions of YenThousands ofU.S. Dollars
2015 2014 2015Net unrealized gains (losses) on
available-for-sale securities:Increase during the year ¥68,980 ¥(1,965) ¥574,020Reclassification adjustment (3,440) (1,020) (28,626)
Subtotal, before tax 65,540 (2,986) 545,394)Tax benefit or (expense) (17,239) 1,303 (143,455)Subtotal, net of tax 48,301 (1,682) 401,938
Net deferred gains (losses) on hedging instruments:Decrease during the year (3,199) (163) (26,620)Reclassification adjustments 1,616 1,741 13,447
Subtotal, before tax (1,582) 1,577 (13,164)Tax benefit or (expense) 319 (565) 2,654Subtotal, net of tax (1,262) 1,012 (10,501)
Adjustments for retirement benefits: Increase during the year 1,856 — 15,444Reclassification adjustments 13 — 108
Subtotal, before tax 1,870 — 15,561Tax benefit or (expense) (615) — (5,117)Subtotal, net of tax 1,254 — 10,435
Total other comprehensive income ¥48,293 ¥ (669) ¥401,872
18. Financial Instruments(1) Information about Status of Financial Instruments(a) Policies for using financial instruments
The Group is engaged in financial services, primarily the banking business. The Group’s core business of banking is mainly financing through deposit taking operations and investing funds through its loan and securities investment operations.
The Bank engages in derivative transactions principally to stabilize its earnings by hedging the risk of future fluctuations in interest and exchange rates related to assets and liabilities held by the Bank as well as the risk of fluctuation in the market prices of bonds, stocks and other investment instruments held. In addition, the Bank provides hedging services to customers in accordance with their needs.
(b) Details of financial instruments used and the exposure to risk and how they ariseThe financial assets held by the Group consist primarily of loans to corporations, local public organizations, local public corporations and individuals in Japan. The Group’s loans are categorized into bills discounted, loans on bills, loans on deeds and overdrafts. These loans are subject to the “credit risk” of decline in value or loss due to changes in the financial status of those to whom credit is provided and to the “interest rate risk” of decline in value due to a change in interest rates.
Among other financial assets, the Bank holds securities, trading account securities and other debt purchased, which mainly comprise Japanese stocks and bonds and foreign bonds and trust certificates. The purpose of these instruments include holding to maturity, investment and business development. As financial assets, they are subject to various types of risk. These include the credit risk of the issuer and interest rate risk, which is the risk that the value of assets may decline due to changes in the prices of securities or other assets (“price fluctuation risk”) and the risk of loss incurred if exchange rates differ from original expectations (“exchange rate risk”). Moreover, they are subject to the risk that the Bank might
not be able to make trades due to turmoil, etc. in the marketplace or be unable to avoid making trades at prices that are notably lower than usual (“liquidity risk”). Note that interest rate, price fluctuation and exchange rate risk are collectively known as “market risk.”
The Bank also holds financial liabilities in the form of deposits and negotiable certificates of deposit, which are chiefly deposits held in yen or foreign currency by corporations, local public bodies, local public corporation and individuals in Japan. These deposits are categorized into current deposits, ordinary deposits, saving deposits, deposits at notice, time deposits, installment savings accounts, installment time deposits, deposits for tax payment, nonresident yen deposits, foreign currency deposits and deposits for offshore accounts. The deposits are subject to interest rate risk as well as the risk of loss arising from the Bank having difficulty in raising necessary funds or being forced to raise funds at significantly higher interest rates than usual in the event of a shortage of capital due to a mismatch in the terms of the Bank’s deposits and its investment portfolio of loans and securities or an unexpected run on the Bank’s deposits (“funding risk”).
Derivative transactions include interest rate related transactions (swaps and caps), currency related transactions (swaps, options, forward exchange contracts and non-deliverable forwards), bond-related transactions (futures, options, stock futures and stock options) and credit derivative transactions (credit default swaps). The Bank engages in derivative transactions principally to stabilize its earnings by hedging the risk of future fluctuations in interest or exchange rates related to assets and liabilities held by the Bank as well as the market prices of bonds, stocks and other investment instruments held.
The Bank also provides hedging services to customers in accordance with their needs. Although the Bank uses derivative transactions to capture short-term gains in assets for trading purposes, any possible loss on these derivative transactions is limited by maintaining a fixed position quota and capping allowed losses.
Of the above mentioned derivative transactions, those transactions used for hedging purposes are carried out in accordance with the hedging policies (reduction of interest risk, etc.) stipulated in the Bank’s internal operating regulations and include such derivative transactions as interest swaps for loans and securities and currency swaps for foreign currency denominated securities and deposits. In evaluating the effectiveness of hedges, the Bank uses the method of grouping together the loans and interest swaps used for market value hedges by the specific term (remaining) of the positions to determine performance. In some cases, the Bank also assesses the effectiveness of market value hedging instruments on an individual basis. The Bank uses currency swaps and other methods to hedge exchange rate risks and evaluates the effectiveness of the hedges by confirming that a foreign currency hedge position exists in an amount equivalent to the foreign currency denominated monetary assets or liabilities being hedged.
(c) Policies and processes for managing the risk1) Credit Risk Management
Credit risk refers to loss incurred when the value of assets (including off-balance-sheet assets) declines or becomes worthless due to changes in the financial status of those to whom credit is provided.
The Bank’s basic credit risk management policy is to ensure, within the scope of its management capabilities, that the Bank carries out transactions that can secure a return while managing the credit risks of the diverse transactions of each of its divisions and business sections using credit risk assessment and management methods that suit the special characteristics of each transaction in order to maintain a sound asset structure. The Bank carries out its credit risk management based on its Credit Risk Management Standards and various detailed management methods provided for in the Bank’s operating regulations.
THE CHUGOKU BANK, LIMITED 31
010_0410501372709.indd 31 2015/09/08 18:44:12
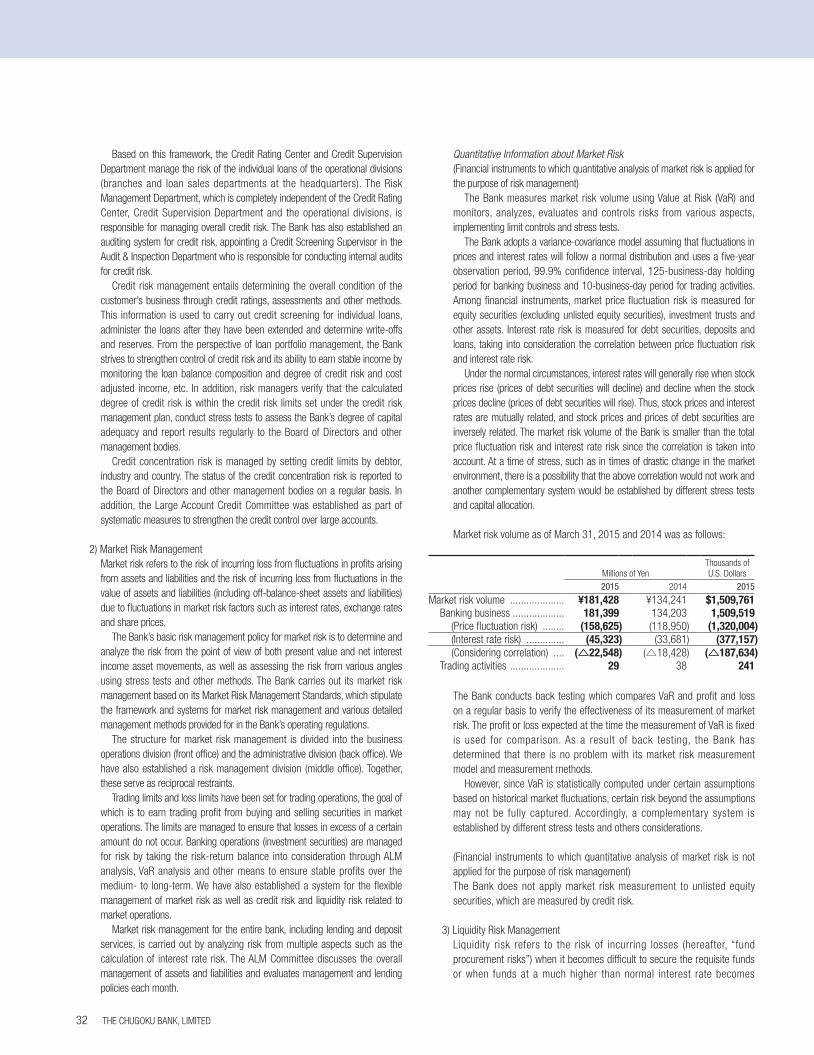
Based on this framework, the Credit Rating Center and Credit Supervision Department manage the risk of the individual loans of the operational divisions (branches and loan sales departments at the headquarters). The Risk Management Department, which is completely independent of the Credit Rating Center, Credit Supervision Department and the operational divisions, is responsible for managing overall credit risk. The Bank has also established an auditing system for credit risk, appointing a Credit Screening Supervisor in the Audit & Inspection Department who is responsible for conducting internal audits for credit risk.
Credit risk management entails determining the overall condition of the customer’s business through credit ratings, assessments and other methods. This information is used to carry out credit screening for individual loans, administer the loans after they have been extended and determine write-offs and reserves. From the perspective of loan portfolio management, the Bank strives to strengthen control of credit risk and its ability to earn stable income by monitoring the loan balance composition and degree of credit risk and cost adjusted income, etc. In addition, risk managers verify that the calculated degree of credit risk is within the credit risk limits set under the credit risk management plan, conduct stress tests to assess the Bank’s degree of capital adequacy and report results regularly to the Board of Directors and other management bodies.
Credit concentration risk is managed by setting credit limits by debtor, industry and country. The status of the credit concentration risk is reported to the Board of Directors and other management bodies on a regular basis. In addition, the Large Account Credit Committee was established as part of systematic measures to strengthen the credit control over large accounts.
2) Market Risk ManagementMarket risk refers to the risk of incurring loss from fluctuations in profits arising from assets and liabilities and the risk of incurring loss from fluctuations in the value of assets and liabilities (including off-balance-sheet assets and liabilities) due to fluctuations in market risk factors such as interest rates, exchange rates and share prices.
The Bank’s basic risk management policy for market risk is to determine and analyze the risk from the point of view of both present value and net interest income asset movements, as well as assessing the risk from various angles using stress tests and other methods. The Bank carries out its market risk management based on its Market Risk Management Standards, which stipulate the framework and systems for market risk management and various detailed management methods provided for in the Bank’s operating regulations.
The structure for market risk management is divided into the business operations division (front office) and the administrative division (back office). We have also established a risk management division (middle office). Together, these serve as reciprocal restraints.
Trading limits and loss limits have been set for trading operations, the goal of which is to earn trading profit from buying and selling securities in market operations. The limits are managed to ensure that losses in excess of a certain amount do not occur. Banking operations (investment securities) are managed for risk by taking the risk-return balance into consideration through ALM analysis, VaR analysis and other means to ensure stable profits over the medium- to long-term. We have also established a system for the flexible management of market risk as well as credit risk and liquidity risk related to market operations.
Market risk management for the entire bank, including lending and deposit services, is carried out by analyzing risk from multiple aspects such as the calculation of interest rate risk. The ALM Committee discusses the overall management of assets and liabilities and evaluates management and lending policies each month.
Quantitative Information about Market Risk(Financial instruments to which quantitative analysis of market risk is applied for the purpose of risk management)
The Bank measures market risk volume using Value at Risk (VaR) and monitors, analyzes, evaluates and controls risks from various aspects, implementing limit controls and stress tests.
The Bank adopts a variance-covariance model assuming that fluctuations in prices and interest rates will follow a normal distribution and uses a five-year observation period, 99.9% confidence interval, 125-business-day holding period for banking business and 10-business-day period for trading activities. Among financial instruments, market price fluctuation risk is measured for equity securities (excluding unlisted equity securities), investment trusts and other assets. Interest rate risk is measured for debt securities, deposits and loans, taking into consideration the correlation between price fluctuation risk and interest rate risk.
Under the normal circumstances, interest rates will generally rise when stock prices rise (prices of debt securities will decline) and decline when the stock prices decline (prices of debt securities will rise). Thus, stock prices and interest rates are mutually related, and stock prices and prices of debt securities are inversely related. The market risk volume of the Bank is smaller than the total price fluctuation risk and interest rate risk since the correlation is taken into account. At a time of stress, such as in times of drastic change in the market environment, there is a possibility that the above correlation would not work and another complementary system would be established by different stress tests and capital allocation.
Market risk volume as of March 31, 2015 and 2014 was as follows:
Millions of YenThousands of U.S. Dollars
2015 2014 2015
Market risk volume .................... ¥181,428 ¥134,241 $1,509,761Banking business ................... 181,399 134,203 1,509,519
(Price fluctuation risk) ........ (158,625) (118,950) (1,320,004)(Interest rate risk) .............. (45,323) (33,681) (377,157)(Considering correlation) .... (△22,548) (△18,428) (△187,634)
Trading activities .................... 29 38 241
The Bank conducts back testing which compares VaR and profit and loss on a regular basis to verify the effectiveness of its measurement of market risk. The profit or loss expected at the time the measurement of VaR is fixed is used for comparison. As a result of back testing, the Bank has determined that there is no problem with its market risk measurement model and measurement methods.
However, since VaR is statistically computed under certain assumptions based on historical market fluctuations, certain risk beyond the assumptions may not be fully captured. Accordingly, a complementary system is established by different stress tests and others considerations.
(Financial instruments to which quantitative analysis of market risk is not applied for the purpose of risk management)The Bank does not apply market risk measurement to unlisted equity securities, which are measured by credit risk.
3) Liquidity Risk Management
Liquidity risk refers to the risk of incurring losses (hereafter, “fund procurement risks”) when it becomes difficult to secure the requisite funds or when funds at a much higher than normal interest rate becomes
THE CHUGOKU BANK, LIMITED32
010_0410501372709.indd 32 2015/09/08 18:44:12
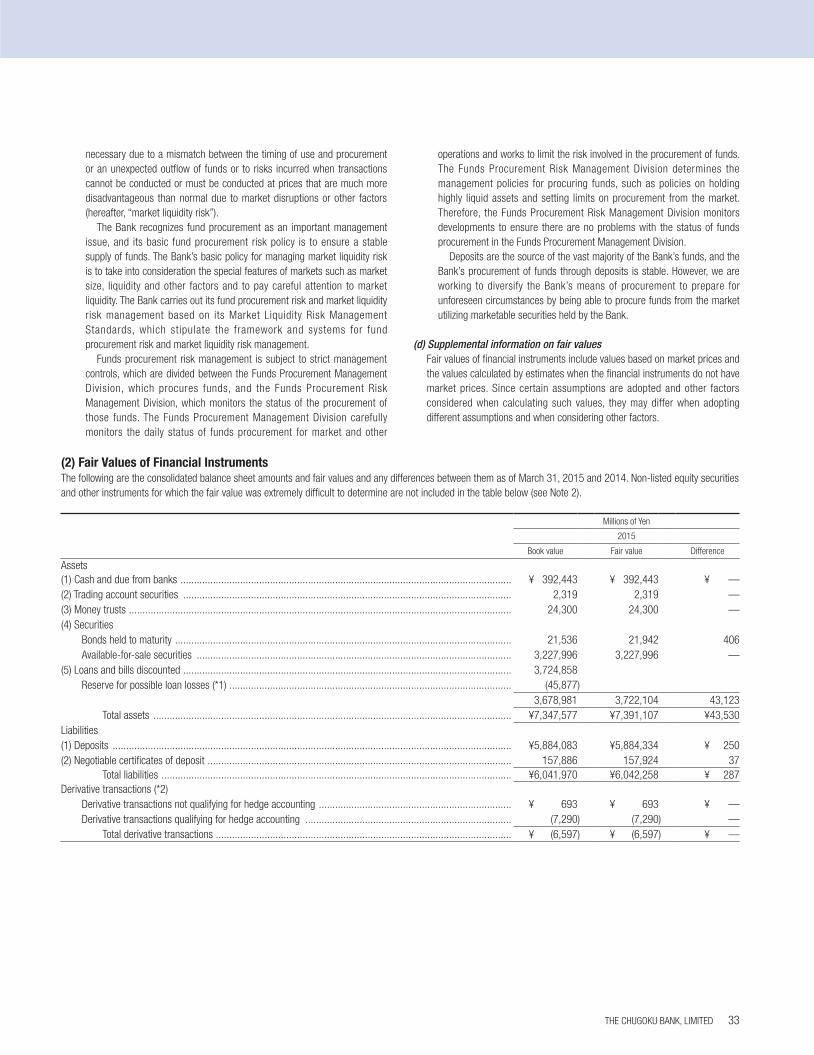
necessary due to a mismatch between the timing of use and procurement or an unexpected outflow of funds or to risks incurred when transactions cannot be conducted or must be conducted at prices that are much more disadvantageous than normal due to market disruptions or other factors (hereafter, “market liquidity risk”).
The Bank recognizes fund procurement as an important management issue, and its basic fund procurement risk policy is to ensure a stable supply of funds. The Bank’s basic policy for managing market liquidity risk is to take into consideration the special features of markets such as market size, liquidity and other factors and to pay careful attention to market liquidity. The Bank carries out its fund procurement risk and market liquidity risk management based on its Market Liquidity Risk Management Standards, which stipulate the framework and systems for fund procurement risk and market liquidity risk management.
Funds procurement risk management is subject to strict management controls, which are divided between the Funds Procurement Management Division, which procures funds, and the Funds Procurement Risk Management Division, which monitors the status of the procurement of those funds. The Funds Procurement Management Division carefully monitors the daily status of funds procurement for market and other
operations and works to limit the risk involved in the procurement of funds. The Funds Procurement Risk Management Division determines the management policies for procuring funds, such as policies on holding highly liquid assets and setting limits on procurement from the market. Therefore, the Funds Procurement Risk Management Division monitors developments to ensure there are no problems with the status of funds procurement in the Funds Procurement Management Division.
Deposits are the source of the vast majority of the Bank’s funds, and the Bank’s procurement of funds through deposits is stable. However, we are working to diversify the Bank’s means of procurement to prepare for unforeseen circumstances by being able to procure funds from the market utilizing marketable securities held by the Bank.
(d) Supplemental information on fair valuesFair values of financial instruments include values based on market prices and the values calculated by estimates when the financial instruments do not have market prices. Since certain assumptions are adopted and other factors considered when calculating such values, they may differ when adopting different assumptions and when considering other factors.
(2) Fair Values of Financial InstrumentsThe following are the consolidated balance sheet amounts and fair values and any differences between them as of March 31, 2015 and 2014. Non-listed equity securities and other instruments for which the fair value was extremely difficult to determine are not included in the table below (see Note 2).
Millions of Yen
2015
Book value Fair value Difference
Assets(1) Cash and due from banks .......................................................................................................................... ¥ 392,443 ¥ 392,443 ¥ —(2) Trading account securities ......................................................................................................................... 2,319 2,319 —(3) Money trusts ............................................................................................................................................. 24,300 24,300 —(4) Securities
Bonds held to maturity ............................................................................................................................ 21,536 21,942 406Available-for-sale securities .................................................................................................................... 3,227,996 3,227,996 —
(5) Loans and bills discounted ......................................................................................................................... 3,724,858Reserve for possible loan losses (*1) ........................................................................................................ (45,877)
3,678,981 3,722,104 43,123Total assets .................................................................................................................................... ¥7,347,577 ¥7,391,107 ¥43,530
Liabilities(1) Deposits ................................................................................................................................................... ¥5,884,083 ¥5,884,334 ¥ 250(2) Negotiable certificates of deposit ................................................................................................................ 157,886 157,924 37
Total liabilities ................................................................................................................................. ¥6,041,970 ¥6,042,258 ¥ 287Derivative transactions (*2)
Derivative transactions not qualifying for hedge accounting ....................................................................... ¥ 693 ¥ 693 ¥ —Derivative transactions qualifying for hedge accounting ............................................................................ (7,290) (7,290) —
Total derivative transactions ............................................................................................................. ¥ (6,597) ¥ (6,597) ¥ —
THE CHUGOKU BANK, LIMITED 33
010_0410501372709.indd 33 2015/09/08 18:44:12
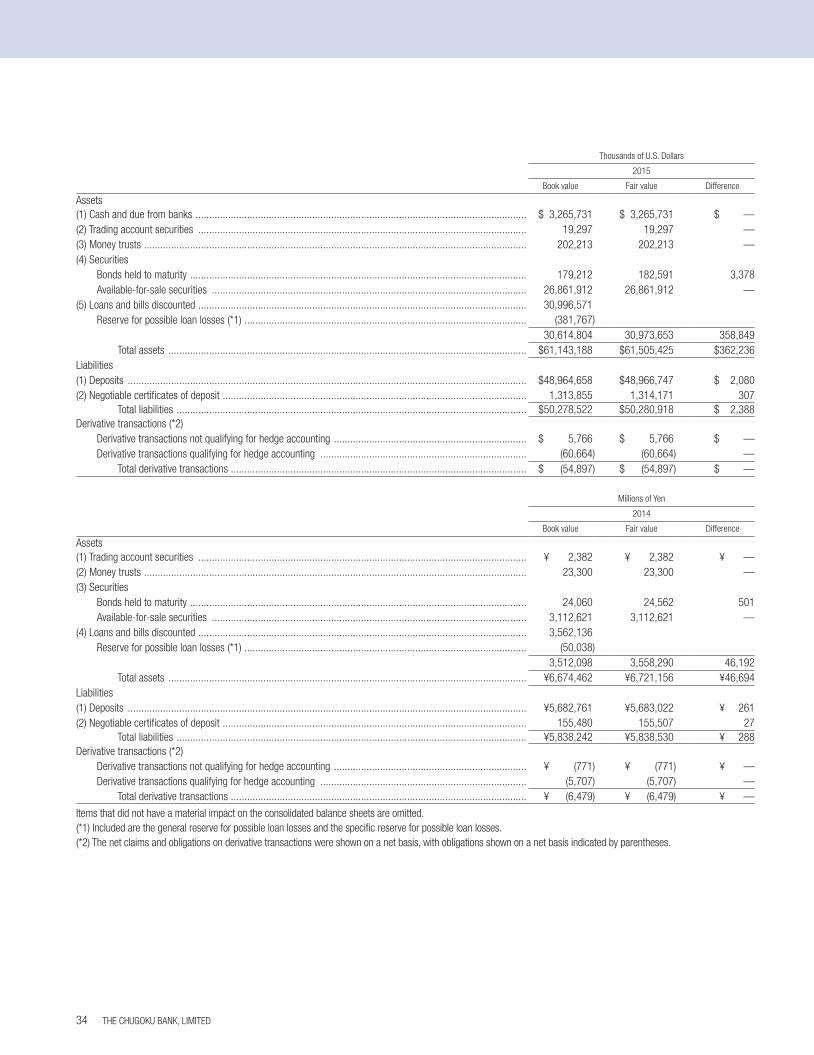
Thousands of U.S. Dollars
2015
Book value Fair value Difference
Assets(1) Cash and due from banks .......................................................................................................................... $ 3,265,731 $ 3,265,731 $ —(2) Trading account securities ......................................................................................................................... 19,297 19,297 —(3) Money trusts ............................................................................................................................................. 202,213 202,213 —(4) Securities
Bonds held to maturity ............................................................................................................................ 179,212 182,591 3,378Available-for-sale securities .................................................................................................................... 26,861,912 26,861,912 —
(5) Loans and bills discounted ......................................................................................................................... 30,996,571Reserve for possible loan losses (*1) ........................................................................................................ (381,767)
30,614,804 30,973,653 358,849Total assets .................................................................................................................................... $61,143,188 $61,505,425 $362,236
Liabilities(1) Deposits ................................................................................................................................................... $48,964,658 $48,966,747 $ 2,080(2) Negotiable certificates of deposit ................................................................................................................ 1,313,855 1,314,171 307
Total liabilities ................................................................................................................................. $50,278,522 $50,280,918 $ 2,388Derivative transactions (*2)
Derivative transactions not qualifying for hedge accounting ....................................................................... $ 5,766 $ 5,766 $ —Derivative transactions qualifying for hedge accounting ............................................................................ (60,664) (60,664) —
Total derivative transactions ............................................................................................................. $ (54,897) $ (54,897) $ —
Millions of Yen
2014
Book value Fair value Difference
Assets(1) Trading account securities ......................................................................................................................... ¥ 2,382 ¥ 2,382 ¥ —(2) Money trusts ............................................................................................................................................. 23,300 23,300 —(3) Securities
Bonds held to maturity ............................................................................................................................ 24,060 24,562 501Available-for-sale securities .................................................................................................................... 3,112,621 3,112,621 —
(4) Loans and bills discounted ......................................................................................................................... 3,562,136Reserve for possible loan losses (*1) ........................................................................................................ (50,038)
3,512,098 3,558,290 46,192Total assets .................................................................................................................................... ¥6,674,462 ¥6,721,156 ¥ 46,694
Liabilities(1) Deposits ................................................................................................................................................... ¥5,682,761 ¥5,683,022 ¥ 261(2) Negotiable certificates of deposit ................................................................................................................ 155,480 155,507 27
Total liabilities ................................................................................................................................. ¥5,838,242 ¥5,838,530 ¥ 288Derivative transactions (*2)
Derivative transactions not qualifying for hedge accounting ....................................................................... ¥ (771) ¥ (771) ¥ —Derivative transactions qualifying for hedge accounting ............................................................................ (5,707) (5,707) —
Total derivative transactions ............................................................................................................. ¥ (6,479) ¥ (6,479) ¥ —
Items that did not have a material impact on the consolidated balance sheets are omitted.(*1) Included are the general reserve for possible loan losses and the specific reserve for possible loan losses.(*2) The net claims and obligations on derivative transactions were shown on a net basis, with obligations shown on a net basis indicated by parentheses.
THE CHUGOKU BANK, LIMITED34
010_0410501372709.indd 34 2015/09/08 18:44:12
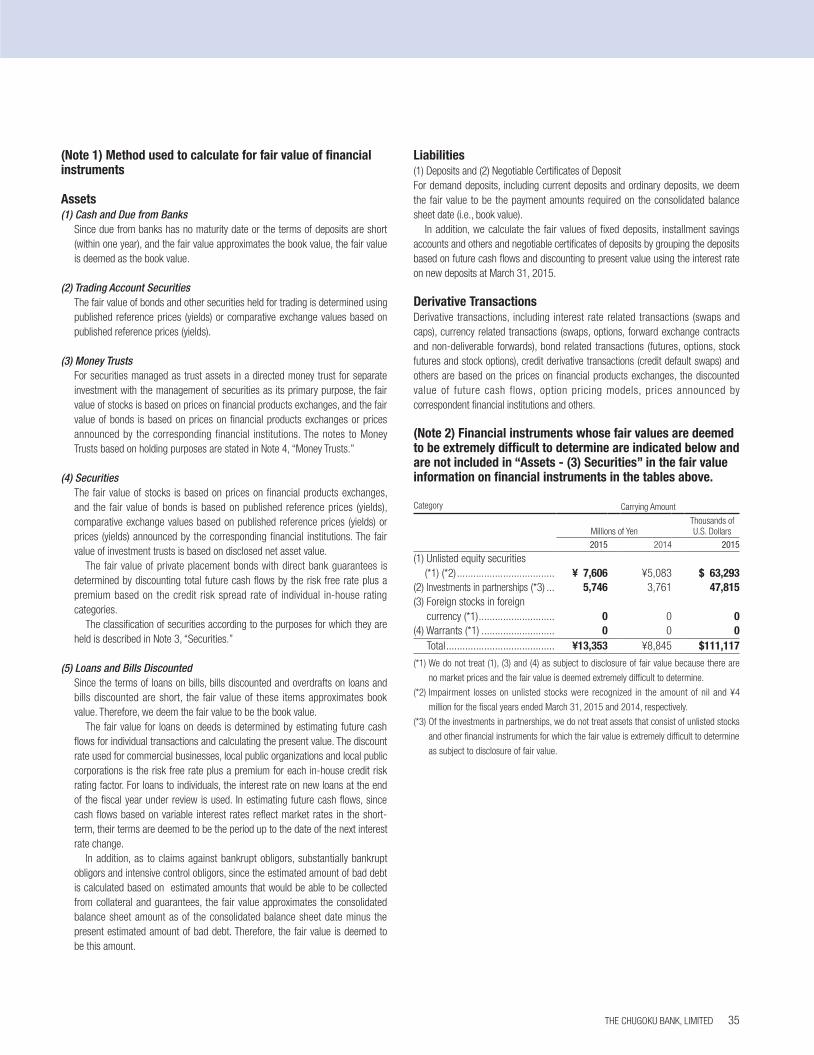
(Note 1) Method used to calculate for fair value of financial instruments
Assets(1) Cash and Due from Banks
Since due from banks has no maturity date or the terms of deposits are short (within one year), and the fair value approximates the book value, the fair value is deemed as the book value.
(2) Trading Account SecuritiesThe fair value of bonds and other securities held for trading is determined using published reference prices (yields) or comparative exchange values based on published reference prices (yields).
(3) Money TrustsFor securities managed as trust assets in a directed money trust for separate investment with the management of securities as its primary purpose, the fair value of stocks is based on prices on financial products exchanges, and the fair value of bonds is based on prices on financial products exchanges or prices announced by the corresponding financial institutions. The notes to Money Trusts based on holding purposes are stated in Note 4, “Money Trusts.”
(4) SecuritiesThe fair value of stocks is based on prices on financial products exchanges, and the fair value of bonds is based on published reference prices (yields), comparative exchange values based on published reference prices (yields) or prices (yields) announced by the corresponding financial institutions. The fair value of investment trusts is based on disclosed net asset value.
The fair value of private placement bonds with direct bank guarantees is determined by discounting total future cash flows by the risk free rate plus a premium based on the credit risk spread rate of individual in-house rating categories.
The classification of securities according to the purposes for which they are held is described in Note 3, “Securities.”
(5) Loans and Bills DiscountedSince the terms of loans on bills, bills discounted and overdrafts on loans and bills discounted are short, the fair value of these items approximates book value. Therefore, we deem the fair value to be the book value.
The fair value for loans on deeds is determined by estimating future cash flows for individual transactions and calculating the present value. The discount rate used for commercial businesses, local public organizations and local public corporations is the risk free rate plus a premium for each in-house credit risk rating factor. For loans to individuals, the interest rate on new loans at the end of the fiscal year under review is used. In estimating future cash flows, since cash flows based on variable interest rates reflect market rates in the short-term, their terms are deemed to be the period up to the date of the next interest rate change.
In addition, as to claims against bankrupt obligors, substantially bankrupt obligors and intensive control obligors, since the estimated amount of bad debt is calculated based on estimated amounts that would be able to be collected from collateral and guarantees, the fair value approximates the consolidated balance sheet amount as of the consolidated balance sheet date minus the present estimated amount of bad debt. Therefore, the fair value is deemed to be this amount.
Liabilities(1) Deposits and (2) Negotiable Certificates of DepositFor demand deposits, including current deposits and ordinary deposits, we deem the fair value to be the payment amounts required on the consolidated balance sheet date (i.e., book value).
In addition, we calculate the fair values of fixed deposits, installment savings accounts and others and negotiable certificates of deposits by grouping the deposits based on future cash flows and discounting to present value using the interest rate on new deposits at March 31, 2015.
Derivative TransactionsDerivative transactions, including interest rate related transactions (swaps and caps), currency related transactions (swaps, options, forward exchange contracts and non-deliverable forwards), bond related transactions (futures, options, stock futures and stock options), credit derivative transactions (credit default swaps) and others are based on the prices on financial products exchanges, the discounted value of future cash flows, option pricing models, prices announced by correspondent financial institutions and others.
(Note 2) Financial instruments whose fair values are deemed to be extremely difficult to determine are indicated below and are not included in “Assets - (3) Securities” in the fair value information on financial instruments in the tables above.
Category Carrying Amount
Millions of YenThousands of U.S. Dollars
2015 2014 2015
(1) Unlisted equity securities (*1) (*2) .................................... ¥ 7,606 ¥5,083 $ 63,293
(2) Investments in partnerships (*3) ... 5,746 3,761 47,815(3) Foreign stocks in foreign
currency (*1) ............................ 0 0 0(4) Warrants (*1) ........................... 0 0 0
Total ........................................ ¥13,353 ¥8,845 $111,117
(*1) We do not treat (1), (3) and (4) as subject to disclosure of fair value because there are
no market prices and the fair value is deemed extremely difficult to determine.
(*2) Impairment losses on unlisted stocks were recognized in the amount of nil and ¥4
million for the fiscal years ended March 31, 2015 and 2014, respectively.
(*3) Of the investments in partnerships, we do not treat assets that consist of unlisted stocks
and other financial instruments for which the fair value is extremely difficult to determine
as subject to disclosure of fair value.
THE CHUGOKU BANK, LIMITED 35
010_0410501372709.indd 35 2015/09/08 18:44:12
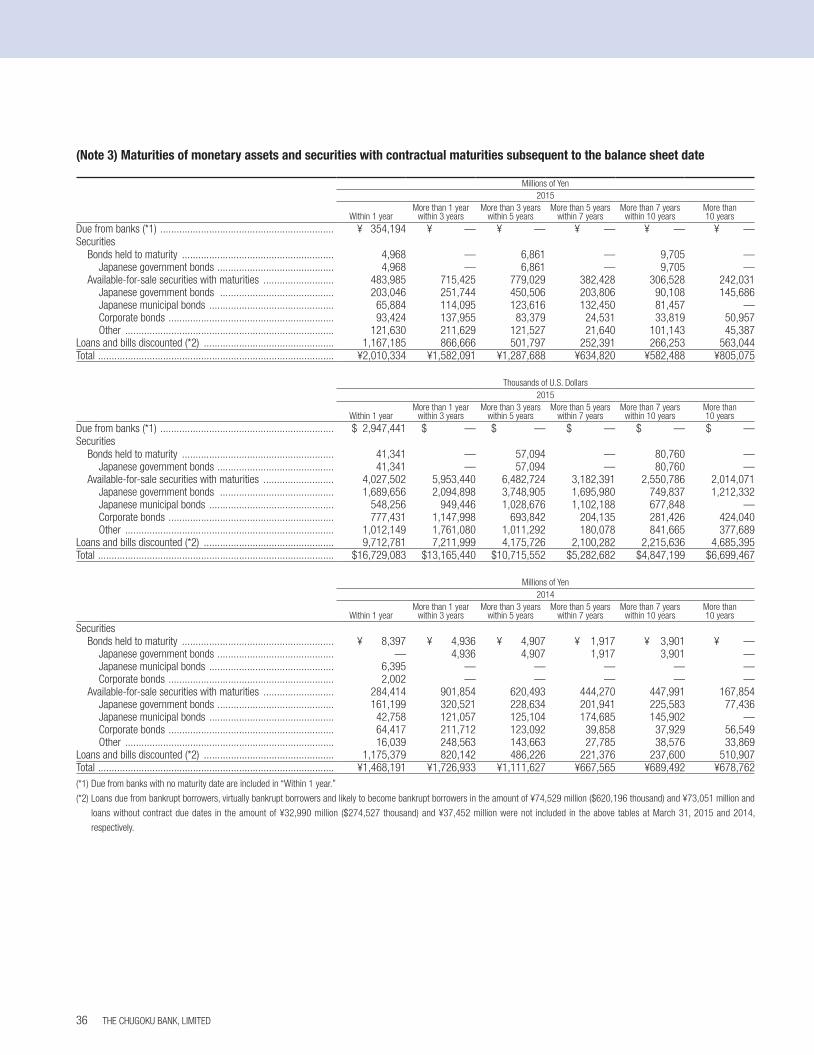
(Note 3) Maturities of monetary assets and securities with contractual maturities subsequent to the balance sheet date
Millions of Yen2015
Within 1 yearMore than 1 year
within 3 yearsMore than 3 years
within 5 yearsMore than 5 years
within 7 yearsMore than 7 years
within 10 yearsMore than10 years
Due from banks (*1) ................................................................ ¥ 354,194 ¥ — ¥ — ¥ — ¥ — ¥ —Securities
Bonds held to maturity ........................................................ 4,968 — 6,861 — 9,705 —Japanese government bonds ........................................... 4,968 — 6,861 — 9,705 —
Available-for-sale securities with maturities .......................... 483,985 715,425 779,029 382,428 306,528 242,031Japanese government bonds .......................................... 203,046 251,744 450,506 203,806 90,108 145,686Japanese municipal bonds .............................................. 65,884 114,095 123,616 132,450 81,457 —Corporate bonds ............................................................. 93,424 137,955 83,379 24,531 33,819 50,957Other ............................................................................. 121,630 211,629 121,527 21,640 101,143 45,387
Loans and bills discounted (*2) ................................................ 1,167,185 866,666 501,797 252,391 266,253 563,044Total ....................................................................................... ¥2,010,334 ¥1,582,091 ¥1,287,688 ¥634,820 ¥582,488 ¥805,075
Thousands of U.S. Dollars2015
Within 1 yearMore than 1 year
within 3 yearsMore than 3 years
within 5 yearsMore than 5 years
within 7 yearsMore than 7 years
within 10 yearsMore than10 years
Due from banks (*1) ................................................................ $ 2,947,441 $ — $ — $ — $ — $ —Securities
Bonds held to maturity ........................................................ 41,341 — 57,094 — 80,760 —Japanese government bonds ........................................... 41,341 — 57,094 — 80,760 —
Available-for-sale securities with maturities .......................... 4,027,502 5,953,440 6,482,724 3,182,391 2,550,786 2,014,071Japanese government bonds .......................................... 1,689,656 2,094,898 3,748,905 1,695,980 749,837 1,212,332Japanese municipal bonds .............................................. 548,256 949,446 1,028,676 1,102,188 677,848 —Corporate bonds ............................................................. 777,431 1,147,998 693,842 204,135 281,426 424,040Other ............................................................................. 1,012,149 1,761,080 1,011,292 180,078 841,665 377,689
Loans and bills discounted (*2) ................................................ 9,712,781 7,211,999 4,175,726 2,100,282 2,215,636 4,685,395Total ....................................................................................... $16,729,083 $13,165,440 $10,715,552 $5,282,682 $4,847,199 $6,699,467
Millions of Yen2014
Within 1 yearMore than 1 year
within 3 yearsMore than 3 years
within 5 yearsMore than 5 years
within 7 yearsMore than 7 years
within 10 yearsMore than10 years
SecuritiesBonds held to maturity ........................................................ ¥ 8,397 ¥ 4,936 ¥ 4,907 ¥ 1,917 ¥ 3,901 ¥ —
Japanese government bonds ........................................... — 4,936 4,907 1,917 3,901 —Japanese municipal bonds .............................................. 6,395 — — — — —Corporate bonds ............................................................. 2,002 — — — — —
Available-for-sale securities with maturities .......................... 284,414 901,854 620,493 444,270 447,991 167,854Japanese government bonds ........................................... 161,199 320,521 228,634 201,941 225,583 77,436Japanese municipal bonds .............................................. 42,758 121,057 125,104 174,685 145,902 —Corporate bonds ............................................................. 64,417 211,712 123,092 39,858 37,929 56,549Other ............................................................................. 16,039 248,563 143,663 27,785 38,576 33,869
Loans and bills discounted (*2) ................................................ 1,175,379 820,142 486,226 221,376 237,600 510,907Total ....................................................................................... ¥1,468,191 ¥1,726,933 ¥1,111,627 ¥667,565 ¥689,492 ¥678,762(*1) Due from banks with no maturity date are included in “Within 1 year.”
(*2) Loans due from bankrupt borrowers, virtually bankrupt borrowers and likely to become bankrupt borrowers in the amount of ¥74,529 million ($620,196 thousand) and ¥73,051 million and
loans without contract due dates in the amount of ¥32,990 million ($274,527 thousand) and ¥37,452 million were not included in the above tables at March 31, 2015 and 2014,
respectively.
THE CHUGOKU BANK, LIMITED36
010_0410501372709.indd 36 2015/09/08 18:44:12
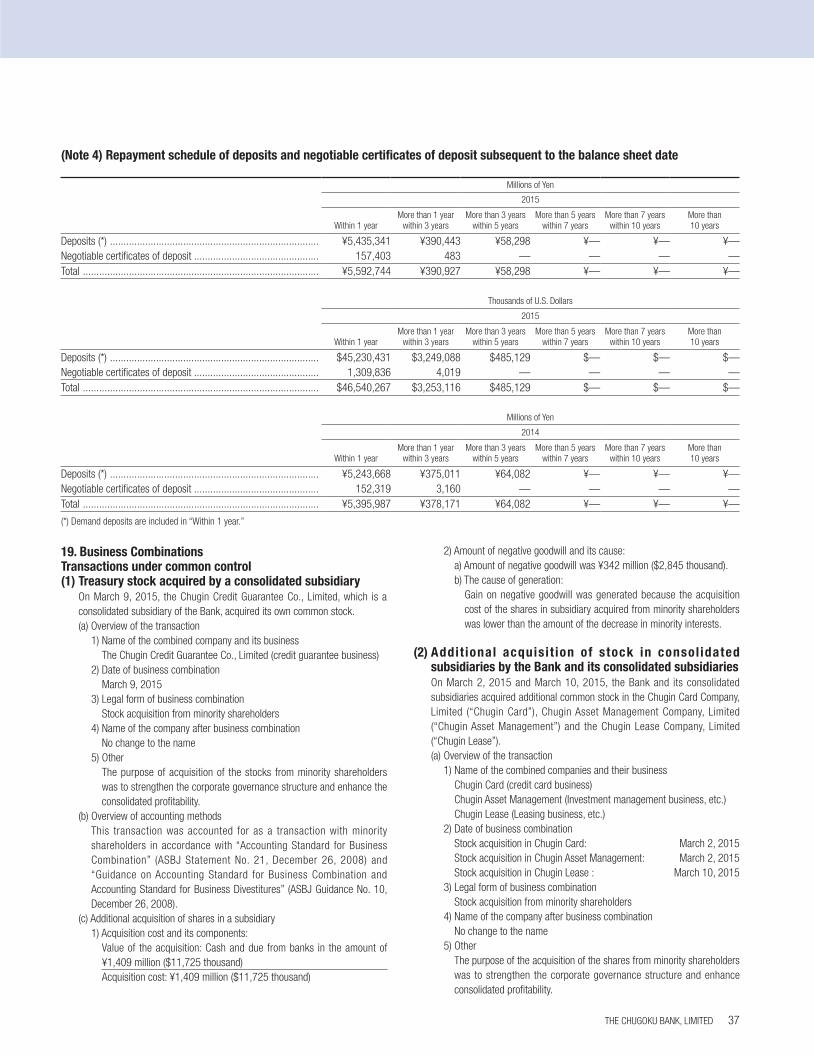
(Note 4) Repayment schedule of deposits and negotiable certificates of deposit subsequent to the balance sheet date
Millions of Yen
2015
Within 1 yearMore than 1 year
within 3 yearsMore than 3 years
within 5 yearsMore than 5 years
within 7 yearsMore than 7 years
within 10 yearsMore than 10 years
Deposits (*) ............................................................................. ¥5,435,341 ¥390,443 ¥58,298 ¥— ¥— ¥—Negotiable certificates of deposit .............................................. 157,403 483 — — — —Total ....................................................................................... ¥5,592,744 ¥390,927 ¥58,298 ¥— ¥— ¥—
Thousands of U.S. Dollars
2015
Within 1 yearMore than 1 year
within 3 yearsMore than 3 years
within 5 yearsMore than 5 years
within 7 yearsMore than 7 years
within 10 yearsMore than 10 years
Deposits (*) ............................................................................. $45,230,431 $3,249,088 $485,129 $— $— $—Negotiable certificates of deposit .............................................. 1,309,836 4,019 — — — —Total ....................................................................................... $46,540,267 $3,253,116 $485,129 $— $— $—
Millions of Yen
2014
Within 1 yearMore than 1 year
within 3 yearsMore than 3 years
within 5 yearsMore than 5 years
within 7 yearsMore than 7 years
within 10 yearsMore than 10 years
Deposits (*) ............................................................................. ¥5,243,668 ¥375,011 ¥64,082 ¥— ¥— ¥—Negotiable certificates of deposit .............................................. 152,319 3,160 — — — —Total ....................................................................................... ¥5,395,987 ¥378,171 ¥64,082 ¥— ¥— ¥—
(*) Demand deposits are included in “Within 1 year.”
19. Business CombinationsTransactions under common control(1) Treasury stock acquired by a consolidated subsidiary On March 9, 2015, the Chugin Credit Guarantee Co., Limited, which is a
consolidated subsidiary of the Bank, acquired its own common stock. (a) Overview of the transaction 1) Name of the combined company and its business The Chugin Credit Guarantee Co., Limited (credit guarantee business) 2) Date of business combination March 9, 2015 3) Legal form of business combination Stock acquisition from minority shareholders 4) Name of the company after business combination No change to the name 5) Other The purpose of acquisition of the stocks from minority shareholders
was to strengthen the corporate governance structure and enhance the consolidated profitability.
(b) Overview of accounting methods This transaction was accounted for as a transaction with minority
shareholders in accordance with “Accounting Standard for Business Combination” (ASBJ Statement No. 21, December 26, 2008) and “Guidance on Accounting Standard for Business Combination and Accounting Standard for Business Divestitures” (ASBJ Guidance No. 10, December 26, 2008).
(c) Additional acquisition of shares in a subsidiary 1) Acquisition cost and its components: Value of the acquisition: Cash and due from banks in the amount of
¥1,409 million ($11,725 thousand) Acquisition cost: ¥1,409 million ($11,725 thousand)
2) Amount of negative goodwill and its cause: a) Amount of negative goodwill was ¥342 million ($2,845 thousand). b) The cause of generation: Gain on negative goodwill was generated because the acquisition
cost of the shares in subsidiary acquired from minority shareholders was lower than the amount of the decrease in minority interests.
(2) Addit ional acquisi t ion of stock in consol idated subsidiaries by the Bank and its consolidated subsidiaries
On March 2, 2015 and March 10, 2015, the Bank and its consolidated subsidiaries acquired additional common stock in the Chugin Card Company, Limited (“Chugin Card”), Chugin Asset Management Company, Limited (“Chugin Asset Management”) and the Chugin Lease Company, Limited (“Chugin Lease”).
(a) Overview of the transaction 1) Name of the combined companies and their business Chugin Card (credit card business) Chugin Asset Management (Investment management business, etc.) Chugin Lease (Leasing business, etc.) 2) Date of business combination Stock acquisition in Chugin Card: March 2, 2015 Stock acquisition in Chugin Asset Management: March 2, 2015 Stock acquisition in Chugin Lease : March 10, 2015 3) Legal form of business combination Stock acquisition from minority shareholders 4) Name of the company after business combination No change to the name 5) Other The purpose of the acquisition of the shares from minority shareholders
was to strengthen the corporate governance structure and enhance consolidated profitability.
THE CHUGOKU BANK, LIMITED 37
010_0410501372709.indd 37 2015/09/08 18:44:12
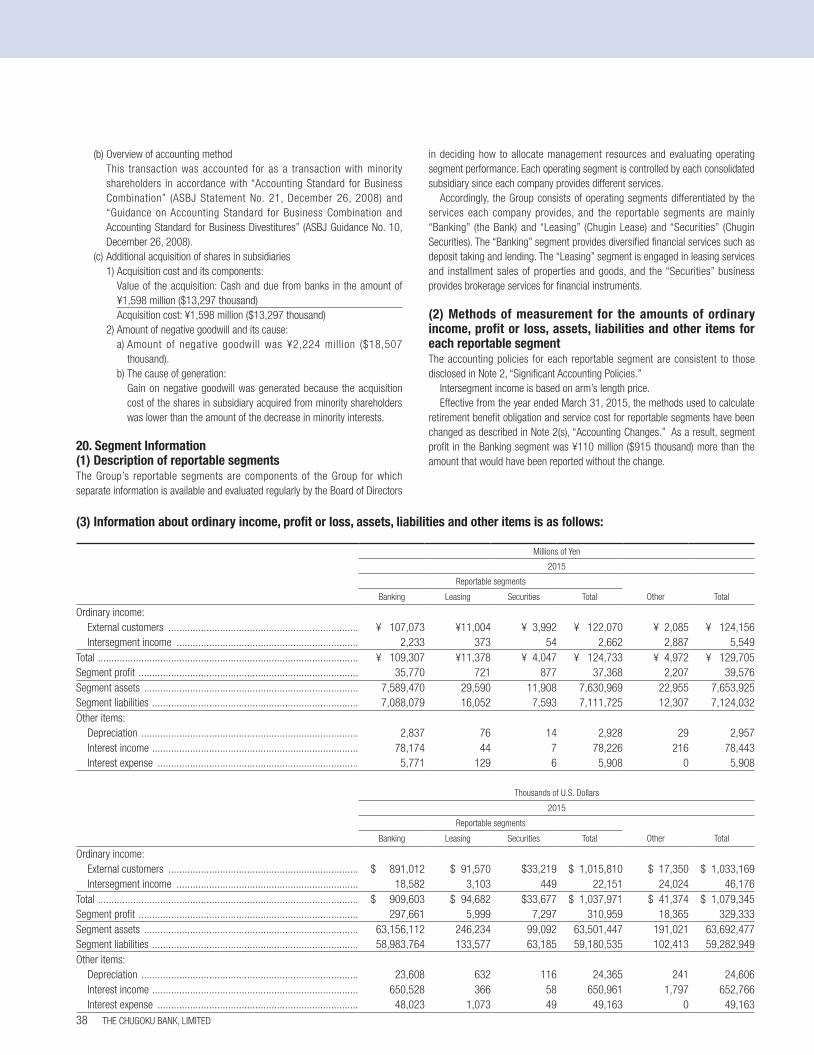
(3) Information about ordinary income, profit or loss, assets, liabilities and other items is as follows:
Millions of Yen
2015
Reportable segments
Banking Leasing Securities Total Other Total
Ordinary income:External customers ...................................................................... ¥ 107,073 ¥11,004 ¥ 3,992 ¥ 122,070 ¥ 2,085 ¥ 124,156Intersegment income ................................................................... 2,233 373 54 2,662 2,887 5,549
Total ................................................................................................ ¥ 109,307 ¥11,378 ¥ 4,047 ¥ 124,733 ¥ 4,972 ¥ 129,705Segment profit ................................................................................. 35,770 721 877 37,368 2,207 39,576Segment assets ............................................................................... 7,589,470 29,590 11,908 7,630,969 22,955 7,653,925Segment liabilities ............................................................................ 7,088,079 16,052 7,593 7,111,725 12,307 7,124,032Other items:
Depreciation ................................................................................ 2,837 76 14 2,928 29 2,957Interest income ............................................................................ 78,174 44 7 78,226 216 78,443Interest expense .......................................................................... 5,771 129 6 5,908 0 5,908
Thousands of U.S. Dollars
2015
Reportable segments
Banking Leasing Securities Total Other Total
Ordinary income:External customers ...................................................................... $ 891,012 $ 91,570 $33,219 $ 1,015,810 $ 17,350 $ 1,033,169Intersegment income ................................................................... 18,582 3,103 449 22,151 24,024 46,176
Total ................................................................................................ $ 909,603 $ 94,682 $33,677 $ 1,037,971 $ 41,374 $ 1,079,345Segment profit ................................................................................. 297,661 5,999 7,297 310,959 18,365 329,333Segment assets ............................................................................... 63,156,112 246,234 99,092 63,501,447 191,021 63,692,477Segment liabilities ............................................................................ 58,983,764 133,577 63,185 59,180,535 102,413 59,282,949Other items:
Depreciation ................................................................................ 23,608 632 116 24,365 241 24,606Interest income ............................................................................ 650,528 366 58 650,961 1,797 652,766Interest expense .......................................................................... 48,023 1,073 49 49,163 0 49,163
(b) Overview of accounting method This transaction was accounted for as a transaction with minority
shareholders in accordance with “Accounting Standard for Business Combination” (ASBJ Statement No. 21, December 26, 2008) and “Guidance on Accounting Standard for Business Combination and Accounting Standard for Business Divestitures” (ASBJ Guidance No. 10, December 26, 2008).
(c) Additional acquisition of shares in subsidiaries 1) Acquisition cost and its components: Value of the acquisition: Cash and due from banks in the amount of
¥1,598 million ($13,297 thousand) Acquisition cost: ¥1,598 million ($13,297 thousand) 2) Amount of negative goodwill and its cause: a) Amount of negative goodwill was ¥2,224 million ($18,507
thousand). b) The cause of generation: Gain on negative goodwill was generated because the acquisition
cost of the shares in subsidiary acquired from minority shareholders was lower than the amount of the decrease in minority interests.
20. Segment Information(1) Description of reportable segmentsThe Group’s reportable segments are components of the Group for which separate information is available and evaluated regularly by the Board of Directors
in deciding how to allocate management resources and evaluating operating segment performance. Each operating segment is controlled by each consolidated subsidiary since each company provides different services.
Accordingly, the Group consists of operating segments differentiated by the services each company provides, and the reportable segments are mainly “Banking” (the Bank) and “Leasing” (Chugin Lease) and “Securities” (Chugin Securities). The “Banking” segment provides diversified financial services such as deposit taking and lending. The “Leasing” segment is engaged in leasing services and installment sales of properties and goods, and the “Securities” business provides brokerage services for financial instruments.
(2) Methods of measurement for the amounts of ordinary income, profit or loss, assets, liabilities and other items for each reportable segmentThe accounting policies for each reportable segment are consistent to those disclosed in Note 2, “Significant Accounting Policies.”
Intersegment income is based on arm’s length price.Effective from the year ended March 31, 2015, the methods used to calculate
retirement benefit obligation and service cost for reportable segments have been changed as described in Note 2(s), “Accounting Changes.” As a result, segment profit in the Banking segment was ¥110 million ($915 thousand) more than the amount that would have been reported without the change.
THE CHUGOKU BANK, LIMITED38
010_0410501372709.indd 38 2015/09/08 18:44:13
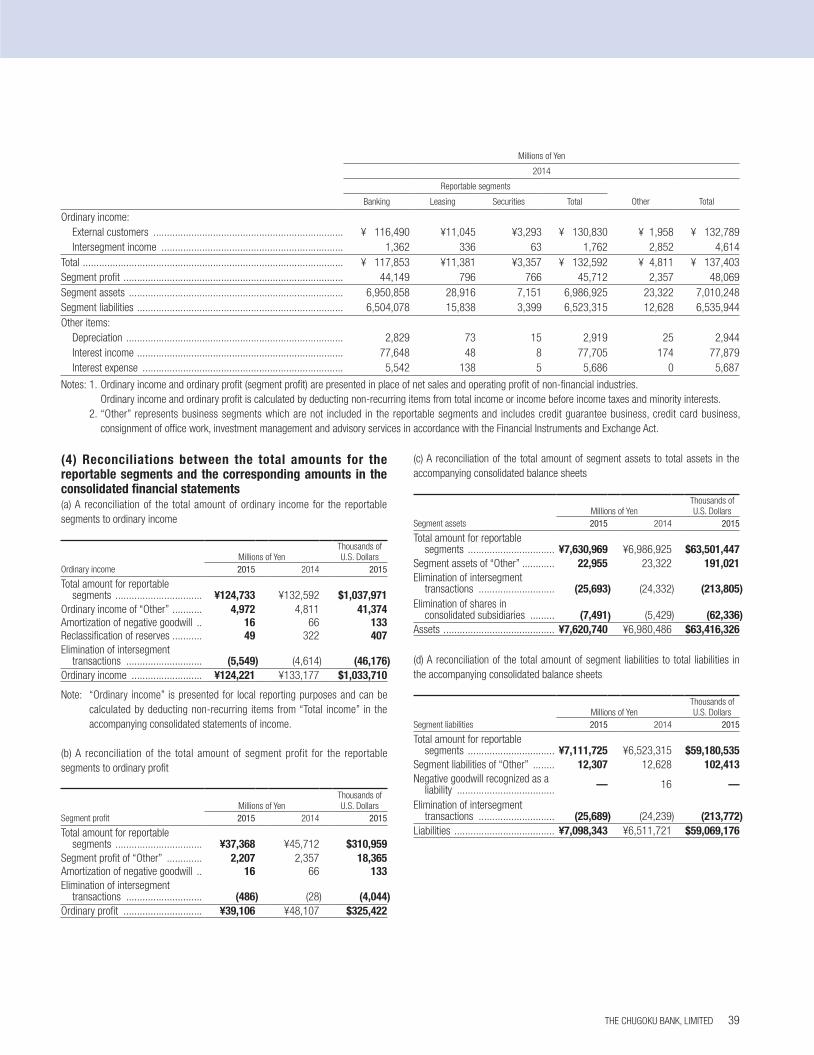
(4) Reconciliations between the total amounts for the reportable segments and the corresponding amounts in the consolidated financial statements(a) A reconciliation of the total amount of ordinary income for the reportable segments to ordinary income
Millions of YenThousands of U.S. Dollars
Ordinary income 2015 2014 2015
Total amount for reportable segments ................................ ¥124,733 ¥132,592 $1,037,971
Ordinary income of “Other” ........... 4,972 4,811 41,374Amortization of negative goodwill .. 16 66 133Reclassification of reserves ........... 49 322 407Elimination of intersegment
transactions ............................ (5,549) (4,614) (46,176)Ordinary income .......................... ¥124,221 ¥133,177 $1,033,710
Note: “Ordinary income” is presented for local reporting purposes and can be calculated by deducting non-recurring items from “Total income” in the accompanying consolidated statements of income.
(b) A reconciliation of the total amount of segment profit for the reportable segments to ordinary profit
Millions of YenThousands of U.S. Dollars
Segment profit 2015 2014 2015
Total amount for reportable segments ................................ ¥37,368 ¥45,712 $310,959
Segment profit of “Other” ............. 2,207 2,357 18,365Amortization of negative goodwill .. 16 66 133Elimination of intersegment
transactions ............................ (486) (28) (4,044)Ordinary profit ............................. ¥39,106 ¥48,107 $325,422
(c) A reconciliation of the total amount of segment assets to total assets in the accompanying consolidated balance sheets
Millions of YenThousands of U.S. Dollars
Segment assets 2015 2014 2015
Total amount for reportable segments ................................ ¥7,630,969 ¥6,986,925 $63,501,447
Segment assets of “Other” ............ 22,955 23,322 191,021Elimination of intersegment
transactions ............................ (25,693) (24,332) (213,805)Elimination of shares in
consolidated subsidiaries ......... (7,491) (5,429) (62,336)Assets ......................................... ¥7,620,740 ¥6,980,486 $63,416,326
(d) A reconciliation of the total amount of segment liabilities to total liabilities in the accompanying consolidated balance sheets
Millions of YenThousands of U.S. Dollars
Segment liabilities 2015 2014 2015
Total amount for reportable segments ................................ ¥7,111,725 ¥6,523,315 $59,180,535
Segment liabilities of “Other” ........ 12,307 12,628 102,413Negative goodwill recognized as a
liability .................................... — 16 —
Elimination of intersegment transactions ............................ (25,689) (24,239) (213,772)
Liabilities ..................................... ¥7,098,343 ¥6,511,721 $59,069,176
Millions of Yen
2014
Reportable segments
Banking Leasing Securities Total Other Total
Ordinary income:External customers ...................................................................... ¥ 116,490 ¥11,045 ¥3,293 ¥ 130,830 ¥ 1,958 ¥ 132,789Intersegment income ................................................................... 1,362 336 63 1,762 2,852 4,614
Total ................................................................................................ ¥ 117,853 ¥11,381 ¥3,357 ¥ 132,592 ¥ 4,811 ¥ 137,403Segment profit ................................................................................. 44,149 796 766 45,712 2,357 48,069Segment assets ............................................................................... 6,950,858 28,916 7,151 6,986,925 23,322 7,010,248Segment liabilities ............................................................................ 6,504,078 15,838 3,399 6,523,315 12,628 6,535,944Other items:
Depreciation ................................................................................ 2,829 73 15 2,919 25 2,944Interest income ............................................................................ 77,648 48 8 77,705 174 77,879Interest expense .......................................................................... 5,542 138 5 5,686 0 5,687
Notes: 1. Ordinary income and ordinary profit (segment profit) are presented in place of net sales and operating profit of non-financial industries. Ordinary income and ordinary profit is calculated by deducting non-recurring items from total income or income before income taxes and minority interests. 2. “Other” represents business segments which are not included in the reportable segments and includes credit guarantee business, credit card business,
consignment of office work, investment management and advisory services in accordance with the Financial Instruments and Exchange Act.
THE CHUGOKU BANK, LIMITED 39
010_0410501372709.indd 39 2015/09/08 18:44:13
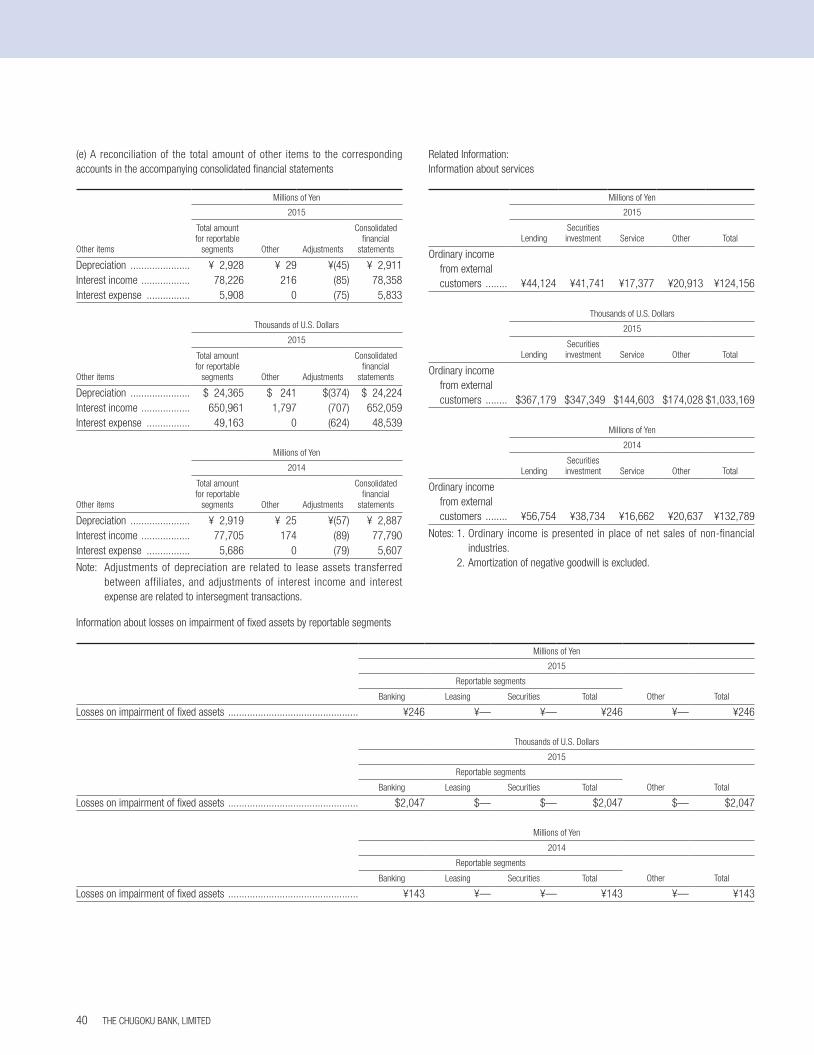
Information about losses on impairment of fixed assets by reportable segments
Millions of Yen
2015
Reportable segments
Banking Leasing Securities Total Other Total
Losses on impairment of fixed assets ................................................ ¥246 ¥— ¥— ¥246 ¥— ¥246
Thousands of U.S. Dollars
2015
Reportable segments
Banking Leasing Securities Total Other Total
Losses on impairment of fixed assets ................................................ $2,047 $— $— $2,047 $— $2,047
Millions of Yen
2014
Reportable segments
Banking Leasing Securities Total Other Total
Losses on impairment of fixed assets ................................................ ¥143 ¥— ¥— ¥143 ¥— ¥143
(e) A reconciliation of the total amount of other items to the corresponding accounts in the accompanying consolidated financial statements
Millions of Yen
2015
Other items
Total amount for reportable
segments Other Adjustments
Consolidated financial
statements
Depreciation ...................... ¥ 2,928 ¥ 29 ¥(45) ¥ 2,911Interest income .................. 78,226 216 (85) 78,358Interest expense ................ 5,908 0 (75) 5,833
Thousands of U.S. Dollars
2015
Other items
Total amount for reportable
segments Other Adjustments
Consolidated financial
statements
Depreciation ...................... $ 24,365 $ 241 $(374) $ 24,224Interest income .................. 650,961 1,797 (707) 652,059Interest expense ................ 49,163 0 (624) 48,539
Millions of Yen
2014
Other items
Total amount for reportable
segments Other Adjustments
Consolidated financial
statements
Depreciation ...................... ¥ 2,919 ¥ 25 ¥(57) ¥ 2,887Interest income .................. 77,705 174 (89) 77,790Interest expense ................ 5,686 0 (79) 5,607
Note: Adjustments of depreciation are related to lease assets transferred between affiliates, and adjustments of interest income and interest expense are related to intersegment transactions.
Related Information:Information about services
Millions of Yen
2015
LendingSecurities investment Service Other Total
Ordinary income from external customers ........ ¥44,124 ¥41,741 ¥17,377 ¥20,913 ¥124,156
Thousands of U.S. Dollars
2015
LendingSecurities investment Service Other Total
Ordinary income from external customers ........ $367,179 $347,349 $144,603 $174,028 $1,033,169
Millions of Yen
2014
LendingSecurities investment Service Other Total
Ordinary income from external customers ........ ¥56,754 ¥38,734 ¥16,662 ¥20,637 ¥132,789
Notes: 1. Ordinary income is presented in place of net sales of non-financial industries.
2. Amortization of negative goodwill is excluded.
THE CHUGOKU BANK, LIMITED40
010_0410501372709.indd 40 2015/09/08 18:44:13
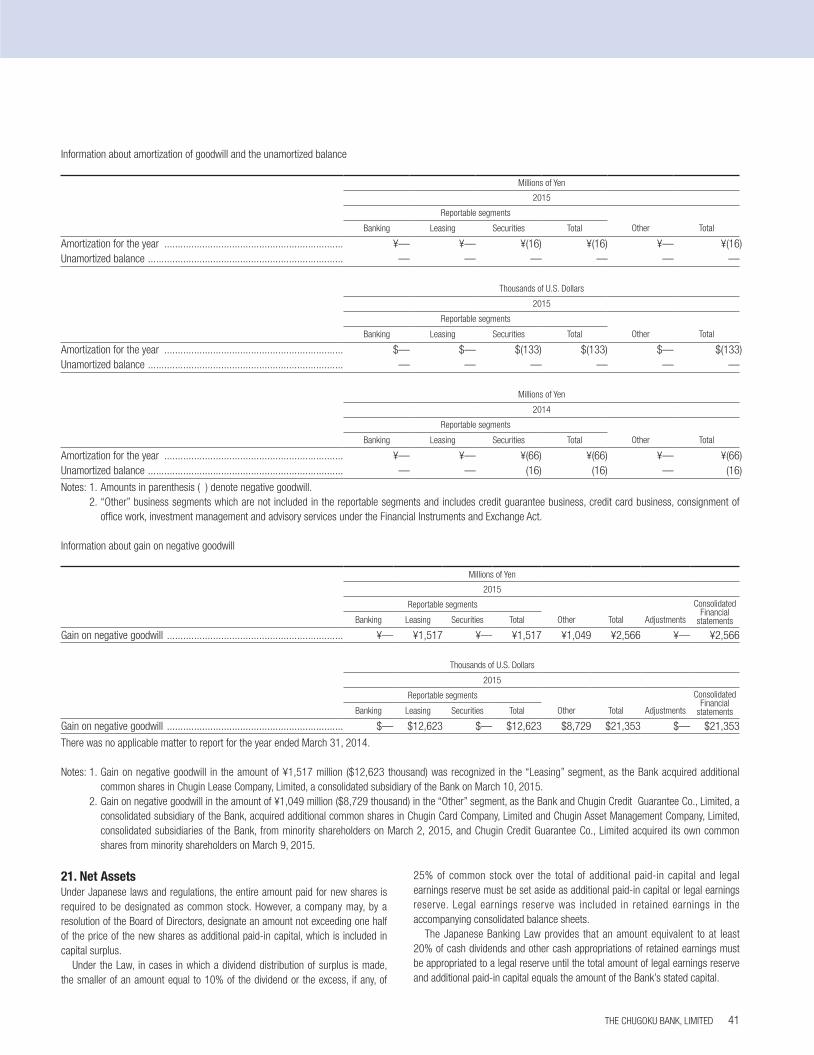
21. Net AssetsUnder Japanese laws and regulations, the entire amount paid for new shares is required to be designated as common stock. However, a company may, by a resolution of the Board of Directors, designate an amount not exceeding one half of the price of the new shares as additional paid-in capital, which is included in capital surplus.
Under the Law, in cases in which a dividend distribution of surplus is made, the smaller of an amount equal to 10% of the dividend or the excess, if any, of
25% of common stock over the total of additional paid-in capital and legal earnings reserve must be set aside as additional paid-in capital or legal earnings reserve. Legal earnings reserve was included in retained earnings in the accompanying consolidated balance sheets.
The Japanese Banking Law provides that an amount equivalent to at least 20% of cash dividends and other cash appropriations of retained earnings must be appropriated to a legal reserve until the total amount of legal earnings reserve and additional paid-in capital equals the amount of the Bank’s stated capital.
Information about amortization of goodwill and the unamortized balance
Millions of Yen
2015
Reportable segments
Banking Leasing Securities Total Other Total
Amortization for the year .................................................................. ¥— ¥— ¥(16) ¥(16) ¥— ¥(16)Unamortized balance ........................................................................ — — — — — —
Thousands of U.S. Dollars
2015
Reportable segments
Banking Leasing Securities Total Other Total
Amortization for the year .................................................................. $— $— $(133) $(133) $— $(133)Unamortized balance ........................................................................ — — — — — —
Millions of Yen
2014
Reportable segments
Banking Leasing Securities Total Other Total
Amortization for the year .................................................................. ¥— ¥— ¥(66) ¥(66) ¥— ¥(66)Unamortized balance ........................................................................ — — (16) (16) — (16)
Notes: 1. Amounts in parenthesis ( ) denote negative goodwill. 2. “Other” business segments which are not included in the reportable segments and includes credit guarantee business, credit card business, consignment of
office work, investment management and advisory services under the Financial Instruments and Exchange Act.
Information about gain on negative goodwill
Millions of Yen
2015
Reportable segments ConsolidatedFinancial
statementsBanking Leasing Securities Total Other Total Adjustments
Gain on negative goodwill ................................................................. ¥— ¥1,517 ¥— ¥1,517 ¥1,049 ¥2,566 ¥— ¥2,566
Thousands of U.S. Dollars
2015
Reportable segments ConsolidatedFinancial
statementsBanking Leasing Securities Total Other Total Adjustments
Gain on negative goodwill ................................................................. $— $12,623 $— $12,623 $8,729 $21,353 $— $21,353
There was no applicable matter to report for the year ended March 31, 2014.
Notes: 1. Gain on negative goodwill in the amount of ¥1,517 million ($12,623 thousand) was recognized in the “Leasing” segment, as the Bank acquired additional common shares in Chugin Lease Company, Limited, a consolidated subsidiary of the Bank on March 10, 2015.
2. Gain on negative goodwill in the amount of ¥1,049 million ($8,729 thousand) in the “Other” segment, as the Bank and Chugin Credit Guarantee Co., Limited, a consolidated subsidiary of the Bank, acquired additional common shares in Chugin Card Company, Limited and Chugin Asset Management Company, Limited, consolidated subsidiaries of the Bank, from minority shareholders on March 2, 2015, and Chugin Credit Guarantee Co., Limited acquired its own common shares from minority shareholders on March 9, 2015.
THE CHUGOKU BANK, LIMITED 41
010_0410501372709.indd 41 2015/09/08 18:44:13
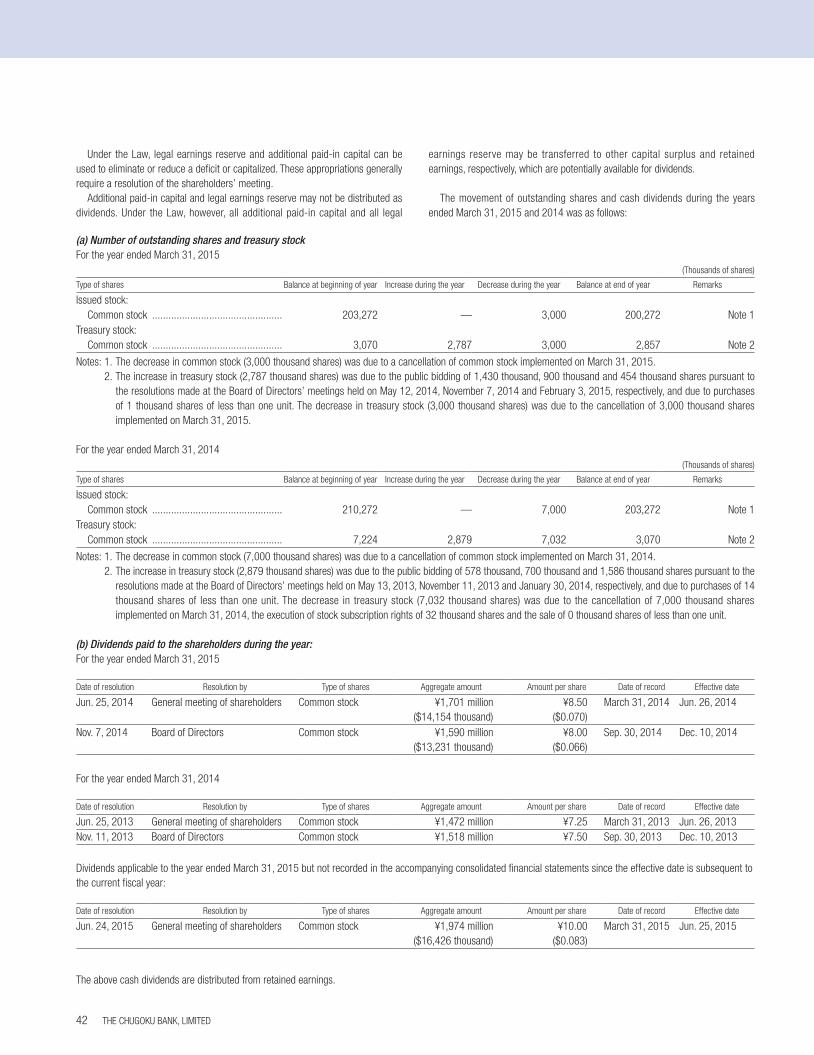
(a) Number of outstanding shares and treasury stockFor the year ended March 31, 2015 (Thousands of shares)
Type of shares Balance at beginning of year Increase during the year Decrease during the year Balance at end of year Remarks
Issued stock:Common stock ................................................ 203,272 — 3,000 200,272 Note 1
Treasury stock:Common stock ................................................ 3,070 2,787 3,000 2,857 Note 2
Notes: 1. The decrease in common stock (3,000 thousand shares) was due to a cancellation of common stock implemented on March 31, 2015. 2. The increase in treasury stock (2,787 thousand shares) was due to the public bidding of 1,430 thousand, 900 thousand and 454 thousand shares pursuant to
the resolutions made at the Board of Directors’ meetings held on May 12, 2014, November 7, 2014 and February 3, 2015, respectively, and due to purchases of 1 thousand shares of less than one unit. The decrease in treasury stock (3,000 thousand shares) was due to the cancellation of 3,000 thousand shares implemented on March 31, 2015.
For the year ended March 31, 2014 (Thousands of shares)
Type of shares Balance at beginning of year Increase during the year Decrease during the year Balance at end of year Remarks
Issued stock:Common stock ................................................ 210,272 — 7,000 203,272 Note 1
Treasury stock:Common stock ................................................ 7,224 2,879 7,032 3,070 Note 2
Notes: 1. The decrease in common stock (7,000 thousand shares) was due to a cancellation of common stock implemented on March 31, 2014. 2. The increase in treasury stock (2,879 thousand shares) was due to the public bidding of 578 thousand, 700 thousand and 1,586 thousand shares pursuant to the
resolutions made at the Board of Directors’ meetings held on May 13, 2013, November 11, 2013 and January 30, 2014, respectively, and due to purchases of 14 thousand shares of less than one unit. The decrease in treasury stock (7,032 thousand shares) was due to the cancellation of 7,000 thousand shares implemented on March 31, 2014, the execution of stock subscription rights of 32 thousand shares and the sale of 0 thousand shares of less than one unit.
(b) Dividends paid to the shareholders during the year:For the year ended March 31, 2015
Date of resolution Resolution by Type of shares Aggregate amount Amount per share Date of record Effective date
Jun. 25, 2014 General meeting of shareholders Common stock ¥1,701 million($14,154 thousand)
¥8.50($0.070)
March 31, 2014 Jun. 26, 2014
Nov. 7, 2014 Board of Directors Common stock ¥1,590 million($13,231 thousand)
¥8.00($0.066)
Sep. 30, 2014 Dec. 10, 2014
For the year ended March 31, 2014
Date of resolution Resolution by Type of shares Aggregate amount Amount per share Date of record Effective date
Jun. 25, 2013 General meeting of shareholders Common stock ¥1,472 million ¥7.25 March 31, 2013 Jun. 26, 2013Nov. 11, 2013 Board of Directors Common stock ¥1,518 million ¥7.50 Sep. 30, 2013 Dec. 10, 2013
Dividends applicable to the year ended March 31, 2015 but not recorded in the accompanying consolidated financial statements since the effective date is subsequent to the current fiscal year:
Date of resolution Resolution by Type of shares Aggregate amount Amount per share Date of record Effective date
Jun. 24, 2015 General meeting of shareholders Common stock ¥1,974 million($16,426 thousand)
¥10.00($0.083)
March 31, 2015 Jun. 25, 2015
The above cash dividends are distributed from retained earnings.
Under the Law, legal earnings reserve and additional paid-in capital can be used to eliminate or reduce a deficit or capitalized. These appropriations generally require a resolution of the shareholders’ meeting.
Additional paid-in capital and legal earnings reserve may not be distributed as dividends. Under the Law, however, all additional paid-in capital and all legal
earnings reserve may be transferred to other capital surplus and retained earnings, respectively, which are potentially available for dividends.
The movement of outstanding shares and cash dividends during the years ended March 31, 2015 and 2014 was as follows:
THE CHUGOKU BANK, LIMITED42
010_0410501372709.indd 42 2015/09/08 18:44:13
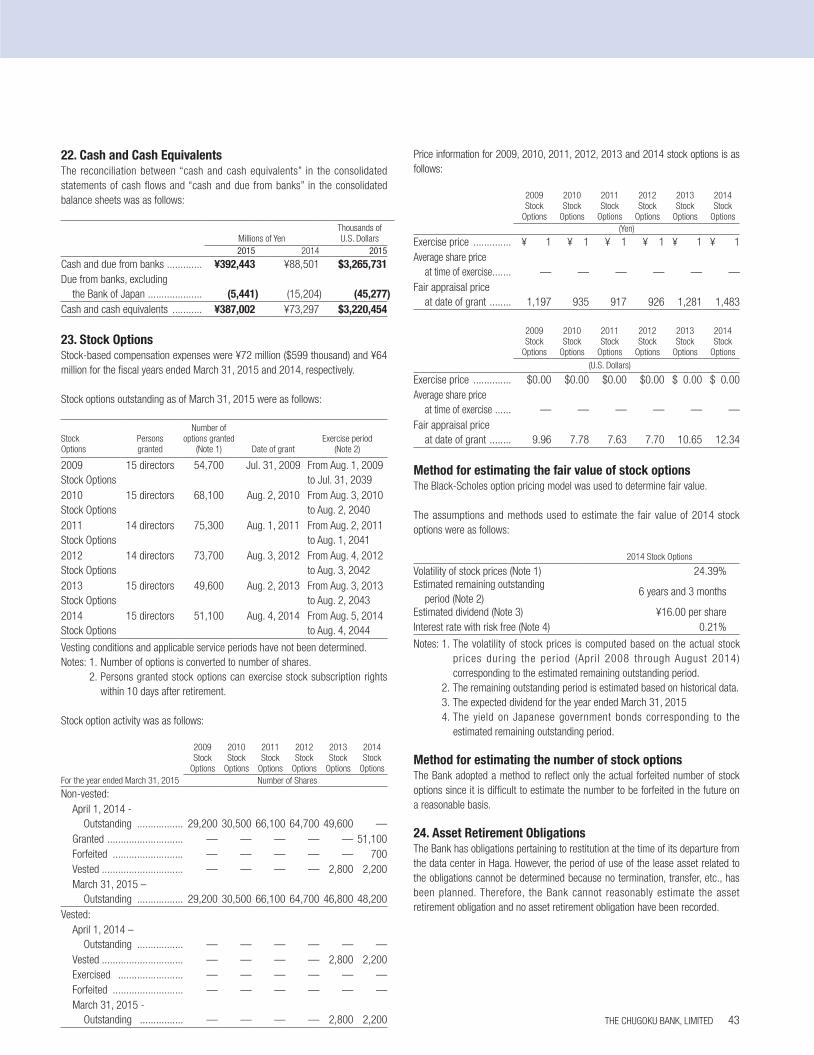
22. Cash and Cash EquivalentsThe reconciliation between “cash and cash equivalents” in the consolidated statements of cash flows and “cash and due from banks” in the consolidated balance sheets was as follows:
Millions of YenThousands ofU.S. Dollars
2015 2014 2015
Cash and due from banks ............. ¥392,443 ¥88,501 $3,265,731Due from banks, excluding
the Bank of Japan .................... (5,441) (15,204) (45,277)Cash and cash equivalents ........... ¥387,002 ¥73,297 $3,220,454
23. Stock OptionsStock-based compensation expenses were ¥72 million ($599 thousand) and ¥64 million for the fiscal years ended March 31, 2015 and 2014, respectively.
Stock options outstanding as of March 31, 2015 were as follows:
Stock Options
Persons granted
Number of options granted
(Note 1) Date of grantExercise period
(Note 2)
2009 Stock Options
15 directors
54,700 Jul. 31, 2009 From Aug. 1, 2009 to Jul. 31, 2039
2010 Stock Options
15 directors
68,100 Aug. 2, 2010 From Aug. 3, 2010 to Aug. 2, 2040
2011 Stock Options
14 directors 75,300 Aug. 1, 2011 From Aug. 2, 2011 to Aug. 1, 2041
2012 Stock Options
14 directors 73,700 Aug. 3, 2012 From Aug. 4, 2012 to Aug. 3, 2042
2013 Stock Options
15 directors 49,600 Aug. 2, 2013 From Aug. 3, 2013 to Aug. 2, 2043
2014 Stock Options
15 directors 51,100 Aug. 4, 2014 From Aug. 5, 2014 to Aug. 4, 2044
Vesting conditions and applicable service periods have not been determined.Notes: 1. Number of options is converted to number of shares. 2. Persons granted stock options can exercise stock subscription rights
within 10 days after retirement.
Stock option activity was as follows:
2009 Stock
Options
2010 Stock
Options
2011 Stock
Options
2012 Stock
Options
2013 Stock
Options
2014 Stock
OptionsFor the year ended March 31, 2015 Number of Shares
Non-vested: April 1, 2014 -
Outstanding ................. 29,200 30,500 66,100 64,700 49,600 —Granted ............................ — — — — — 51,100Forfeited .......................... — — — — — 700Vested .............................. — — — — 2,800 2,200March 31, 2015 –
Outstanding ................. 29,200 30,500 66,100 64,700 46,800 48,200Vested:
April 1, 2014 – Outstanding ................. — — — — — —
Vested .............................. — — — — 2,800 2,200Exercised ........................ — — — — — —Forfeited .......................... — — — — — —March 31, 2015 -
Outstanding ................ — — — — 2,800 2,200
Price information for 2009, 2010, 2011, 2012, 2013 and 2014 stock options is as follows:
2009 Stock
Options
2010 Stock
Options
2011 Stock
Options
2012 Stock
Options
2013 Stock
Options
2014Stock
Options(Yen)
Exercise price .............. ¥ 1 ¥ 1 ¥ 1 ¥ 1 ¥ 1 ¥ 1Average share price
at time of exercise ....... — — — — — —Fair appraisal price
at date of grant ........ 1,197 935 917 926 1,281 1,483
2009 Stock
Options
2010 Stock
Options
2011 Stock
Options
2012 Stock
Options
2013 Stock
Options
2014Stock
Options
(U.S. Dollars)
Exercise price .............. $0.00 $0.00 $0.00 $0.00 $ 0.00 $ 0.00Average share price
at time of exercise ...... — — — — — —Fair appraisal price
at date of grant ........ 9.96 7.78 7.63 7.70 10.65 12.34
Method for estimating the fair value of stock optionsThe Black-Scholes option pricing model was used to determine fair value.
The assumptions and methods used to estimate the fair value of 2014 stock options were as follows:
2014 Stock Options
Volatility of stock prices (Note 1) 24.39%Estimated remaining outstanding
period (Note 2)6 years and 3 months
Estimated dividend (Note 3) ¥16.00 per shareInterest rate with risk free (Note 4) 0.21%
Notes: 1. The volatility of stock prices is computed based on the actual stock prices during the period (Apri l 2008 through August 2014) corresponding to the estimated remaining outstanding period.
2. The remaining outstanding period is estimated based on historical data. 3. The expected dividend for the year ended March 31, 2015 4. The yield on Japanese government bonds corresponding to the
estimated remaining outstanding period.
Method for estimating the number of stock optionsThe Bank adopted a method to reflect only the actual forfeited number of stock options since it is difficult to estimate the number to be forfeited in the future on a reasonable basis.
24. Asset Retirement ObligationsThe Bank has obligations pertaining to restitution at the time of its departure from the data center in Haga. However, the period of use of the lease asset related to the obligations cannot be determined because no termination, transfer, etc., has been planned. Therefore, the Bank cannot reasonably estimate the asset retirement obligation and no asset retirement obligation have been recorded.
THE CHUGOKU BANK, LIMITED 43
010_0410501372709.indd 43 2015/09/08 18:44:13
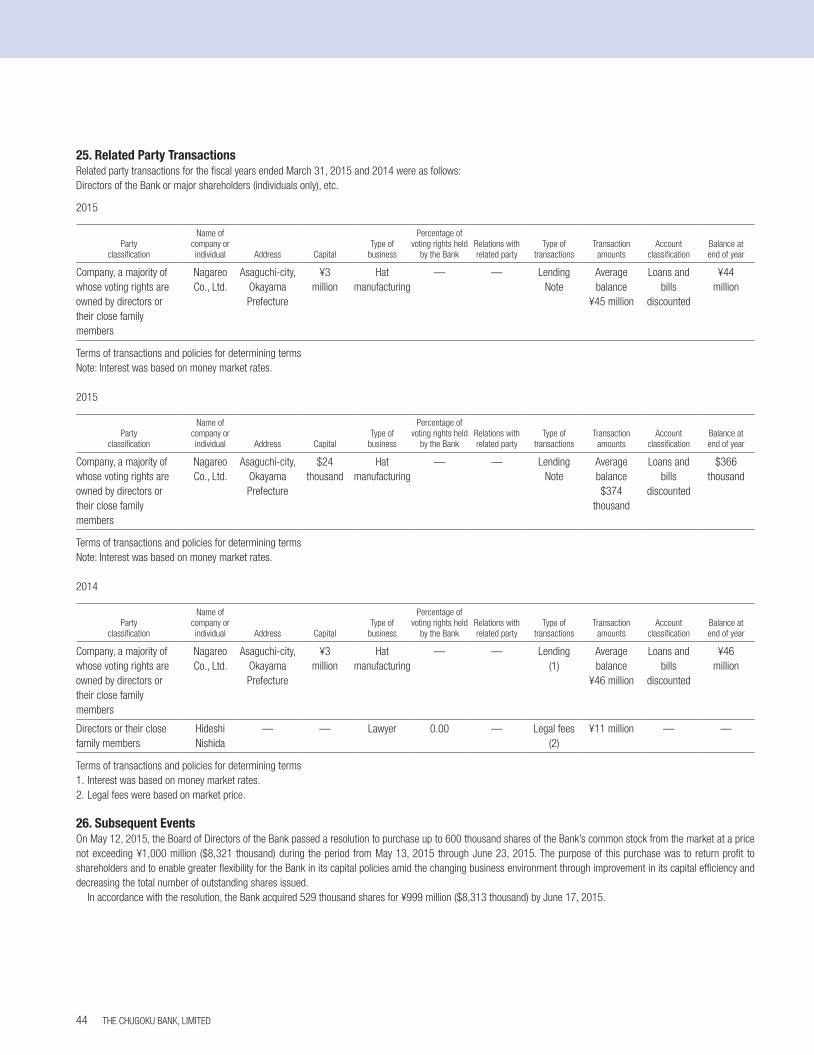
25. Related Party TransactionsRelated party transactions for the fiscal years ended March 31, 2015 and 2014 were as follows:Directors of the Bank or major shareholders (individuals only), etc.
2015
Party classification
Name of company or individual Address Capital
Type of business
Percentage of voting rights held
by the BankRelations with related party
Type of transactions
Transaction amounts
Account classification
Balance at end of year
Company, a majority of whose voting rights are owned by directors or their close family members
Nagareo Co., Ltd.
Asaguchi-city, Okayama Prefecture
¥3 million
Hat manufacturing
— — LendingNote
Average balance
¥45 million
Loans and bills
discounted
¥44 million
Terms of transactions and policies for determining termsNote: Interest was based on money market rates.
2015
Party classification
Name of company or individual Address Capital
Type of business
Percentage of voting rights held
by the BankRelations with related party
Type of transactions
Transaction amounts
Account classification
Balance at end of year
Company, a majority of whose voting rights are owned by directors or their close family members
Nagareo Co., Ltd.
Asaguchi-city, Okayama Prefecture
$24 thousand
Hat manufacturing
— — Lending Note
Average balance $374
thousand
Loans and bills
discounted
$366 thousand
Terms of transactions and policies for determining termsNote: Interest was based on money market rates.
2014
Party classification
Name of company or individual Address Capital
Type of business
Percentage of voting rights held
by the BankRelations with related party
Type of transactions
Transaction amounts
Account classification
Balance at end of year
Company, a majority of whose voting rights are owned by directors or their close family members
Nagareo Co., Ltd.
Asaguchi-city, Okayama Prefecture
¥3 million
Hat manufacturing
— — Lending(1)
Average balance
¥46 million
Loans and bills
discounted
¥46 million
Directors or their close family members
HideshiNishida
— — Lawyer 0.00 — Legal fees(2)
¥11 million — —
Terms of transactions and policies for determining terms1. Interest was based on money market rates.2. Legal fees were based on market price.
26. Subsequent EventsOn May 12, 2015, the Board of Directors of the Bank passed a resolution to purchase up to 600 thousand shares of the Bank’s common stock from the market at a price not exceeding ¥1,000 million ($8,321 thousand) during the period from May 13, 2015 through June 23, 2015. The purpose of this purchase was to return profit to shareholders and to enable greater flexibility for the Bank in its capital policies amid the changing business environment through improvement in its capital efficiency and decreasing the total number of outstanding shares issued.
In accordance with the resolution, the Bank acquired 529 thousand shares for ¥999 million ($8,313 thousand) by June 17, 2015.
THE CHUGOKU BANK, LIMITED44
010_0410501372709.indd 44 2015/09/08 18:44:13
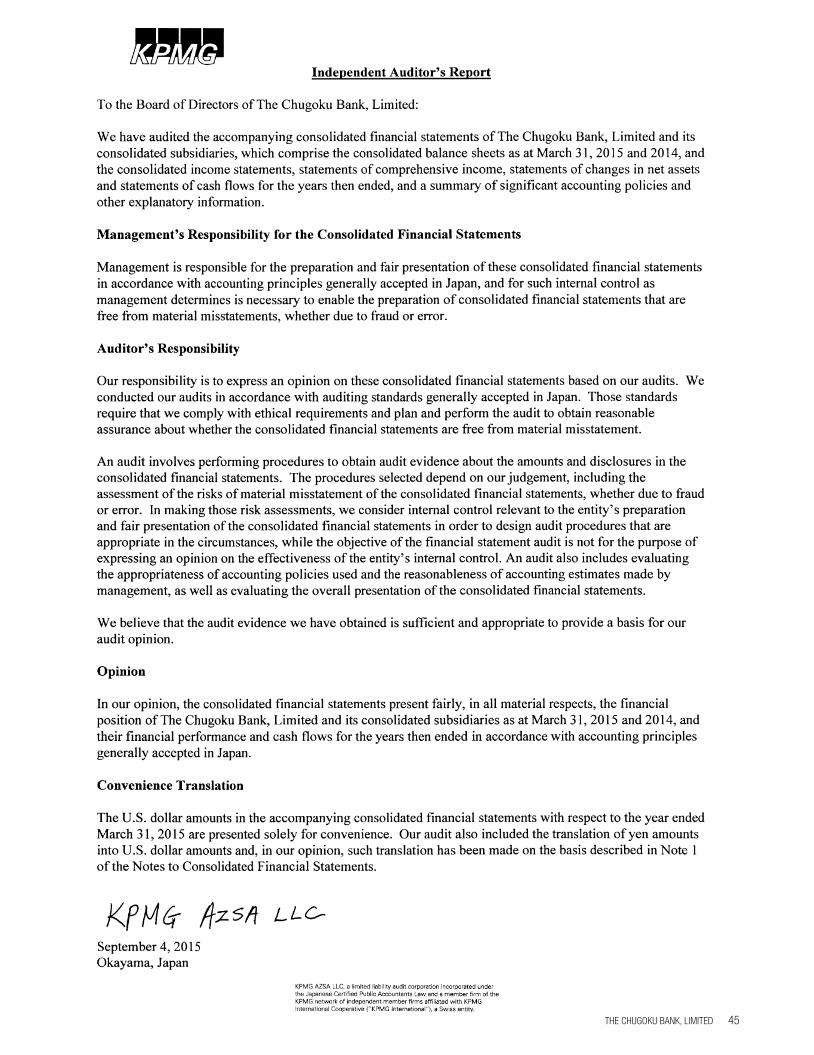
THE CHUGOKU BANK, LIMITED 45
010_0410501372709.indd 45 2015/09/08 18:44:13
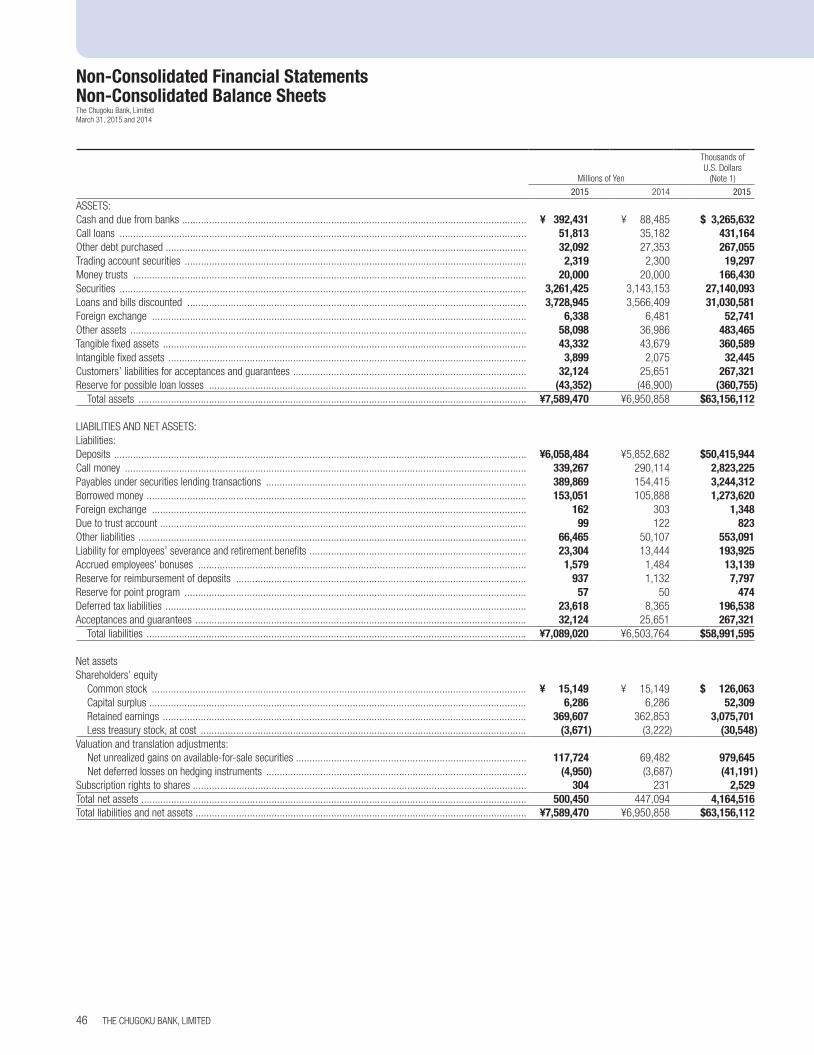
Non-Consolidated Financial StatementsNon-Consolidated Balance SheetsThe Chugoku Bank, LimitedMarch 31, 2015 and 2014
Millions of Yen
Thousands of U.S. Dollars
(Note 1)
2015 2014 2015
ASSETS:Cash and due from banks ............................................................................................................................... ¥ 392,431 ¥ 88,485 $ 3,265,632 Call loans ...................................................................................................................................................... 51,813 35,182 431,164 Other debt purchased ..................................................................................................................................... 32,092 27,353 267,055 Trading account securities .............................................................................................................................. 2,319 2,300 19,297 Money trusts ................................................................................................................................................. 20,000 20,000 166,430 Securities ...................................................................................................................................................... 3,261,425 3,143,153 27,140,093 Loans and bills discounted ............................................................................................................................. 3,728,945 3,566,409 31,030,581 Foreign exchange .......................................................................................................................................... 6,338 6,481 52,741 Other assets .................................................................................................................................................. 58,098 36,986 483,465 Tangible fixed assets ...................................................................................................................................... 43,332 43,679 360,589 Intangible fixed assets .................................................................................................................................... 3,899 2,075 32,445 Customers’ liabilities for acceptances and guarantees ...................................................................................... 32,124 25,651 267,321 Reserve for possible loan losses ..................................................................................................................... (43,352) (46,900) (360,755)
Total assets ............................................................................................................................................... ¥7,589,470 ¥6,950,858 $63,156,112
LIABILITIES AND NET ASSETS:Liabilities:Deposits ........................................................................................................................................................ ¥6,058,484 ¥5,852,682 $50,415,944 Call money .................................................................................................................................................... 339,267 290,114 2,823,225 Payables under securities lending transactions ................................................................................................ 389,869 154,415 3,244,312 Borrowed money ............................................................................................................................................ 153,051 105,888 1,273,620 Foreign exchange .......................................................................................................................................... 162 303 1,348 Due to trust account ....................................................................................................................................... 99 122 823 Other liabilities ............................................................................................................................................... 66,465 50,107 553,091 Liability for employees’ severance and retirement benefits ................................................................................ 23,304 13,444 193,925 Accrued employees’ bonuses ......................................................................................................................... 1,579 1,484 13,139 Reserve for reimbursement of deposits ........................................................................................................... 937 1,132 7,797 Reserve for point program .............................................................................................................................. 57 50 474 Deferred tax liabilities ..................................................................................................................................... 23,618 8,365 196,538 Acceptances and guarantees .......................................................................................................................... 32,124 25,651 267,321
Total liabilities ............................................................................................................................................ ¥7,089,020 ¥6,503,764 $58,991,595
Net assetsShareholders’ equity
Common stock .......................................................................................................................................... ¥ 15,149 ¥ 15,149 $ 126,063 Capital surplus ........................................................................................................................................... 6,286 6,286 52,309 Retained earnings ...................................................................................................................................... 369,607 362,853 3,075,701 Less treasury stock, at cost ........................................................................................................................ (3,671) (3,222) (30,548)
Valuation and translation adjustments: Net unrealized gains on available-for-sale securities ..................................................................................... 117,724 69,482 979,645 Net deferred losses on hedging instruments ................................................................................................ (4,950) (3,687) (41,191)
Subscription rights to shares ........................................................................................................................... 304 231 2,529 Total net assets .............................................................................................................................................. 500,450 447,094 4,164,516 Total liabilities and net assets .......................................................................................................................... ¥7,589,470 ¥6,950,858 $63,156,112
THE CHUGOKU BANK, LIMITED46
010_0410501372709.indd 46 2015/09/08 18:44:13
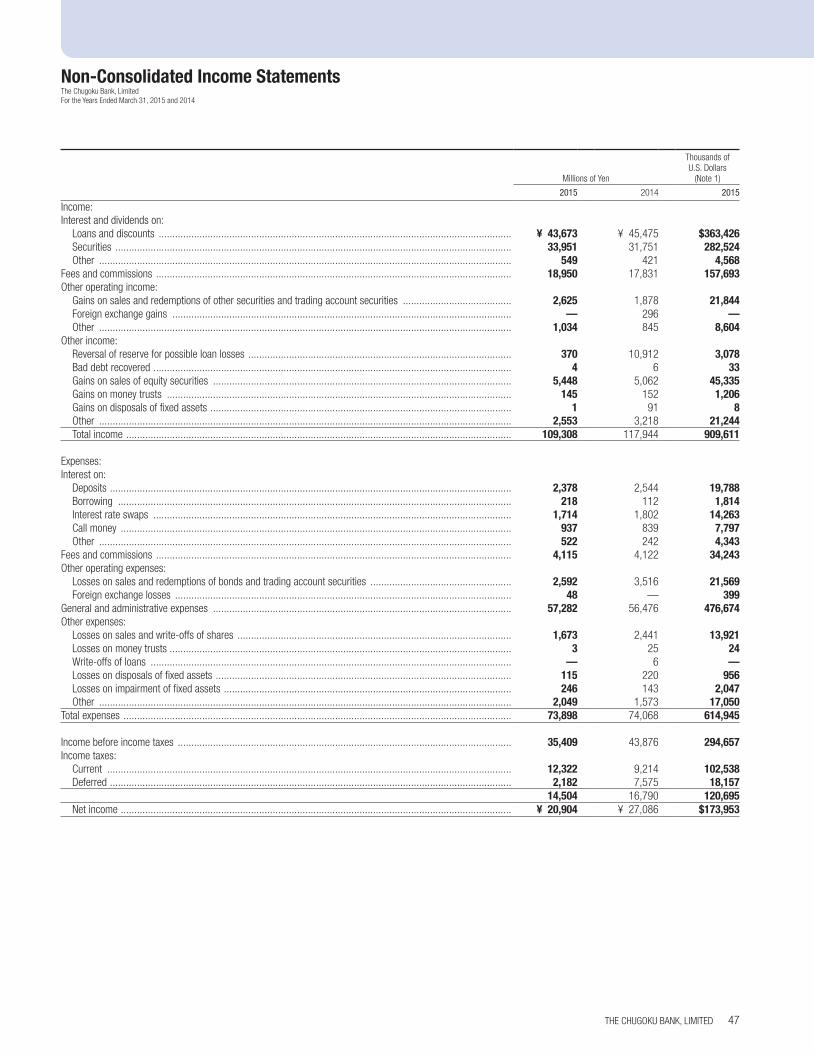
Non-Consolidated Income StatementsThe Chugoku Bank, LimitedFor the Years Ended March 31, 2015 and 2014
Millions of Yen
Thousands of U.S. Dollars
(Note 1)
2015 2014 2015
Income:Interest and dividends on:
Loans and discounts .................................................................................................................................. ¥ 43,673 ¥ 45,475 $363,426 Securities .................................................................................................................................................. 33,951 31,751 282,524 Other ........................................................................................................................................................ 549 421 4,568
Fees and commissions ................................................................................................................................... 18,950 17,831 157,693 Other operating income:
Gains on sales and redemptions of other securities and trading account securities ........................................ 2,625 1,878 21,844 Foreign exchange gains ............................................................................................................................. — 296 —Other ........................................................................................................................................................ 1,034 845 8,604
Other income: Reversal of reserve for possible loan losses ................................................................................................. 370 10,912 3,078 Bad debt recovered .................................................................................................................................... 4 6 33 Gains on sales of equity securities .............................................................................................................. 5,448 5,062 45,335 Gains on money trusts ............................................................................................................................... 145 152 1,206 Gains on disposals of fixed assets ............................................................................................................... 1 91 8 Other ........................................................................................................................................................ 2,553 3,218 21,244 Total income .............................................................................................................................................. 109,308 117,944 909,611
Expenses:Interest on:
Deposits .................................................................................................................................................... 2,378 2,544 19,788 Borrowing ................................................................................................................................................. 218 112 1,814 Interest rate swaps .................................................................................................................................... 1,714 1,802 14,263 Call money ................................................................................................................................................ 937 839 7,797 Other ........................................................................................................................................................ 522 242 4,343
Fees and commissions ................................................................................................................................... 4,115 4,122 34,243 Other operating expenses:
Losses on sales and redemptions of bonds and trading account securities .................................................... 2,592 3,516 21,569 Foreign exchange losses ............................................................................................................................ 48 — 399
General and administrative expenses .............................................................................................................. 57,282 56,476 476,674 Other expenses:
Losses on sales and write-offs of shares ..................................................................................................... 1,673 2,441 13,921 Losses on money trusts .............................................................................................................................. 3 25 24 Write-offs of loans ..................................................................................................................................... — 6 —Losses on disposals of fixed assets ............................................................................................................. 115 220 956 Losses on impairment of fixed assets .......................................................................................................... 246 143 2,047 Other ........................................................................................................................................................ 2,049 1,573 17,050
Total expenses ............................................................................................................................................... 73,898 74,068 614,945
Income before income taxes ........................................................................................................................... 35,409 43,876 294,657 Income taxes:
Current ..................................................................................................................................................... 12,322 9,214 102,538 Deferred .................................................................................................................................................... 2,182 7,575 18,157
14,504 16,790 120,695 Net income ................................................................................................................................................ ¥ 20,904 ¥ 27,086 $173,953
THE CHUGOKU BANK, LIMITED 47
010_0410501372709.indd 47 2015/09/08 18:44:13
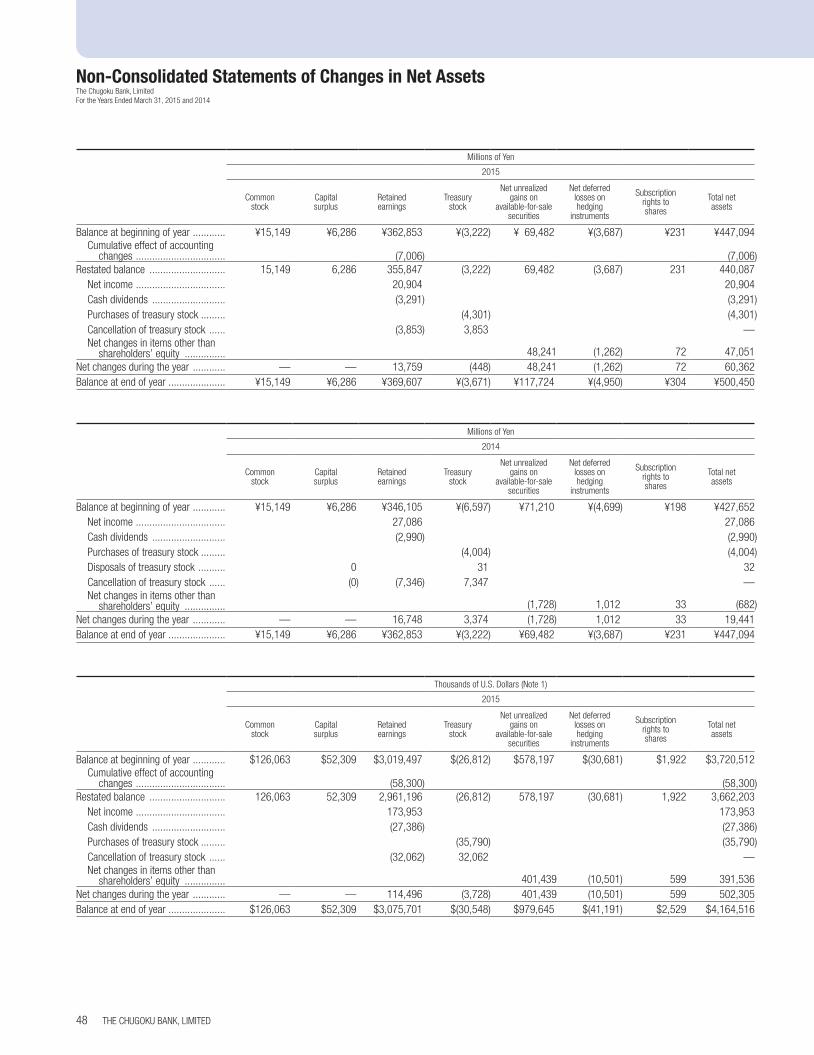
Non-Consolidated Statements of Changes in Net AssetsThe Chugoku Bank, Limited For the Years Ended March 31, 2015 and 2014
Millions of Yen
2015
Common stock
Capital surplus
Retained earnings
Treasury stock
Net unrealized gains on
available-for-sale securities
Net deferred losses on hedging
instruments
Subscription rights to shares
Total net assets
Balance at beginning of year ............ ¥15,149 ¥6,286 ¥362,853 ¥(3,222) ¥ 69,482 ¥(3,687) ¥231 ¥447,094 Cumulative effect of accounting
changes ................................. (7,006) (7,006)Restated balance ............................ 15,149 6,286 355,847 (3,222) 69,482 (3,687) 231 440,087
Net income ................................. 20,904 20,904 Cash dividends ........................... (3,291) (3,291)Purchases of treasury stock ......... (4,301) (4,301)Cancellation of treasury stock ...... (3,853) 3,853 —Net changes in items other than
shareholders’ equity ............... 48,241 (1,262) 72 47,051 Net changes during the year ............ — — 13,759 (448) 48,241 (1,262) 72 60,362 Balance at end of year ..................... ¥15,149 ¥6,286 ¥369,607 ¥(3,671) ¥117,724 ¥(4,950) ¥304 ¥500,450
Millions of Yen
2014
Common stock
Capital surplus
Retained earnings
Treasury stock
Net unrealized gains on
available-for-sale securities
Net deferred losses on hedging
instruments
Subscription rights to shares
Total net assets
Balance at beginning of year ............ ¥15,149 ¥6,286 ¥346,105 ¥(6,597) ¥71,210 ¥(4,699) ¥198 ¥427,652Net income ................................. 27,086 27,086Cash dividends ........................... (2,990) (2,990)Purchases of treasury stock ......... (4,004) (4,004)Disposals of treasury stock .......... 0 31 32Cancellation of treasury stock ...... (0) (7,346) 7,347 —Net changes in items other than
shareholders’ equity ............... (1,728) 1,012 33 (682)Net changes during the year ............ — — 16,748 3,374 (1,728) 1,012 33 19,441Balance at end of year ..................... ¥15,149 ¥6,286 ¥362,853 ¥(3,222) ¥69,482 ¥(3,687) ¥231 ¥447,094
Thousands of U.S. Dollars (Note 1)
2015
Common stock
Capital surplus
Retained earnings
Treasury stock
Net unrealized gains on
available-for-sale securities
Net deferred losses on hedging
instruments
Subscription rights to shares
Total net assets
Balance at beginning of year ............ $126,063 $52,309 $3,019,497 $(26,812) $578,197 $(30,681) $1,922 $3,720,512 Cumulative effect of accounting
changes ................................. (58,300) (58,300)Restated balance ............................ 126,063 52,309 2,961,196 (26,812) 578,197 (30,681) 1,922 3,662,203
Net income ................................. 173,953 173,953 Cash dividends ........................... (27,386) (27,386)Purchases of treasury stock ......... (35,790) (35,790)Cancellation of treasury stock ...... (32,062) 32,062 —Net changes in items other than
shareholders’ equity ............... 401,439 (10,501) 599 391,536 Net changes during the year ............ — — 114,496 (3,728) 401,439 (10,501) 599 502,305 Balance at end of year ..................... $126,063 $52,309 $3,075,701 $(30,548) $979,645 $(41,191) $2,529 $4,164,516
THE CHUGOKU BANK, LIMITED48
010_0410501372709.indd 48 2015/09/08 18:44:13
Corporate Information
THE CHUGOKU BANK, LIMITED 49
010_0410501372709.indd 49 2015/09/08 18:44:13
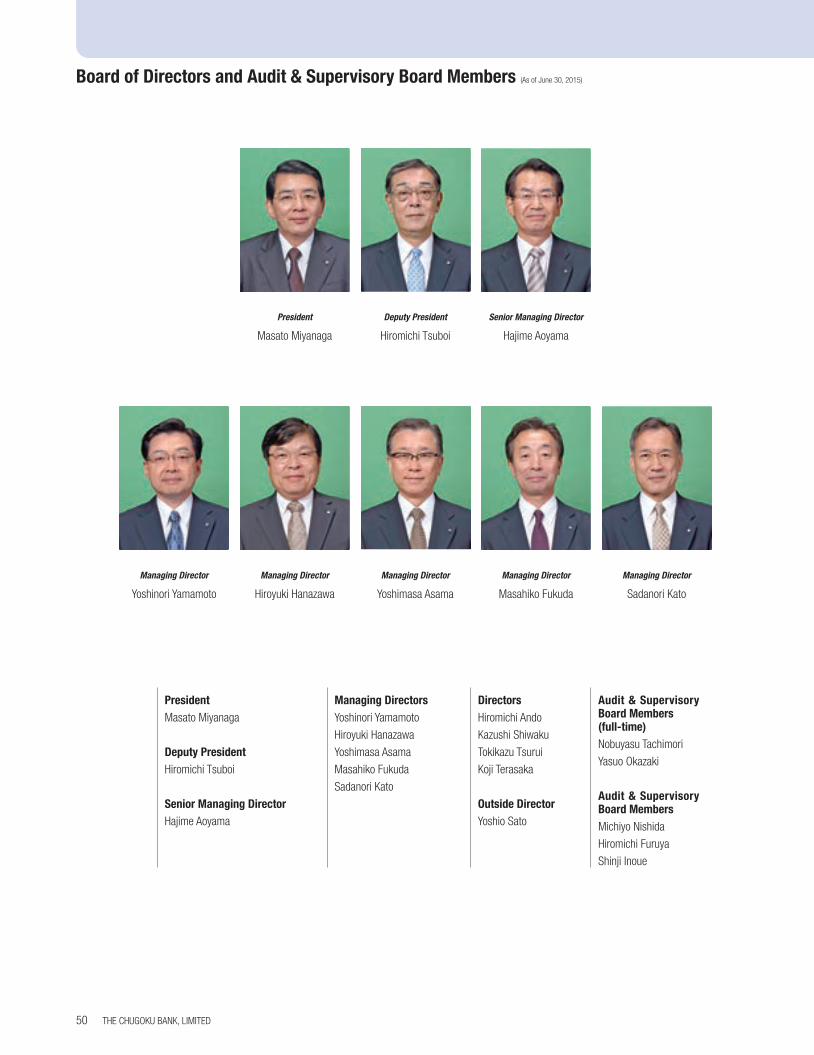
Board of Directors and Audit & Supervisory Board Members (As of June 30, 2015)
PresidentMasato Miyanaga
Deputy PresidentHiromichi Tsuboi
Senior Managing DirectorHajime Aoyama
Managing DirectorsYoshinori Yamamoto
Hiroyuki Hanazawa
Yoshimasa Asama
Masahiko Fukuda
Sadanori Kato
Audit & Supervisory Board Members (full-time) Nobuyasu Tachimori
Yasuo Okazaki
Audit & Supervisory Board MembersMichiyo Nishida
Hiromichi Furuya
Shinji Inoue
DirectorsHiromichi Ando
Kazushi Shiwaku
Tokikazu Tsurui
Koji Terasaka
Outside DirectorYoshio Sato
Senior Managing Director
Hajime Aoyama
Managing Director
Sadanori Kato
THE CHUGOKU BANK, LIMITED50
President
Masato Miyanaga
Deputy President
Hiromichi Tsuboi
Managing Director
Yoshinori Yamamoto
Managing Director
Hiroyuki Hanazawa
Managing Director
Yoshimasa Asama
Managing Director
Masahiko Fukuda
010_0410501372709.indd 50 2015/09/08 18:44:14
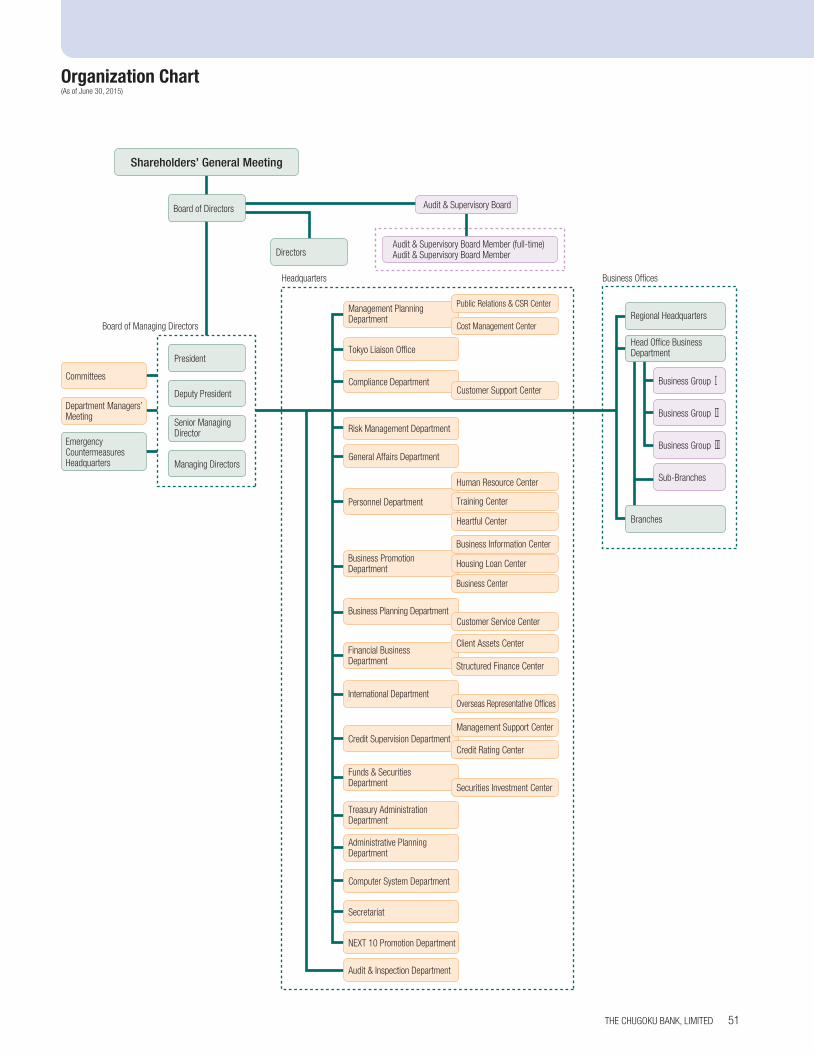
Board of Managing Directors
Headquarters Business Offices
President
Deputy President
Senior Managing Director
Managing DirectorsGeneral Affairs Department
Risk Management Department
Computer System Department
Secretariat
NEXT 10 Promotion Department
Audit & Inspection Department
Tokyo Liaison OfficeHead Office Business Department
Sub-Branches
Branches
Business Group
Business Group
Business Group
Shareholders’ General Meeting
Board of Directors
DirectorsAudit & Supervisory Board Member (full-time)Audit & Supervisory Board Member
Management Planning Department
Customer Service Center
Customer Support Center
Administrative Planning Department
Personnel Department
Compliance Department
Training Center
Heartful Center
Human Resource Center
Credit Supervision Department
Financial Business Department
Overseas Representative Offices
Structured Finance Center
Client Assets Center
Business Promotion Department
Business Center
Housing Loan Center
Business Information Center
Business Planning Department
International Department
Funds & Securities Department Securities Investment Center
Committees
Department Managers’ Meeting
Emergency CountermeasuresHeadquarters
Regional Headquarters
Credit Rating Center
Management Support Center
Treasury Administration Department
Audit & Supervisory Board
Public Relations & CSR Center
Cost Management Center
Organization Chart(As of June 30, 2015)
THE CHUGOKU BANK, LIMITED 51
010_0410501372709.indd 51 2015/09/08 18:44:14
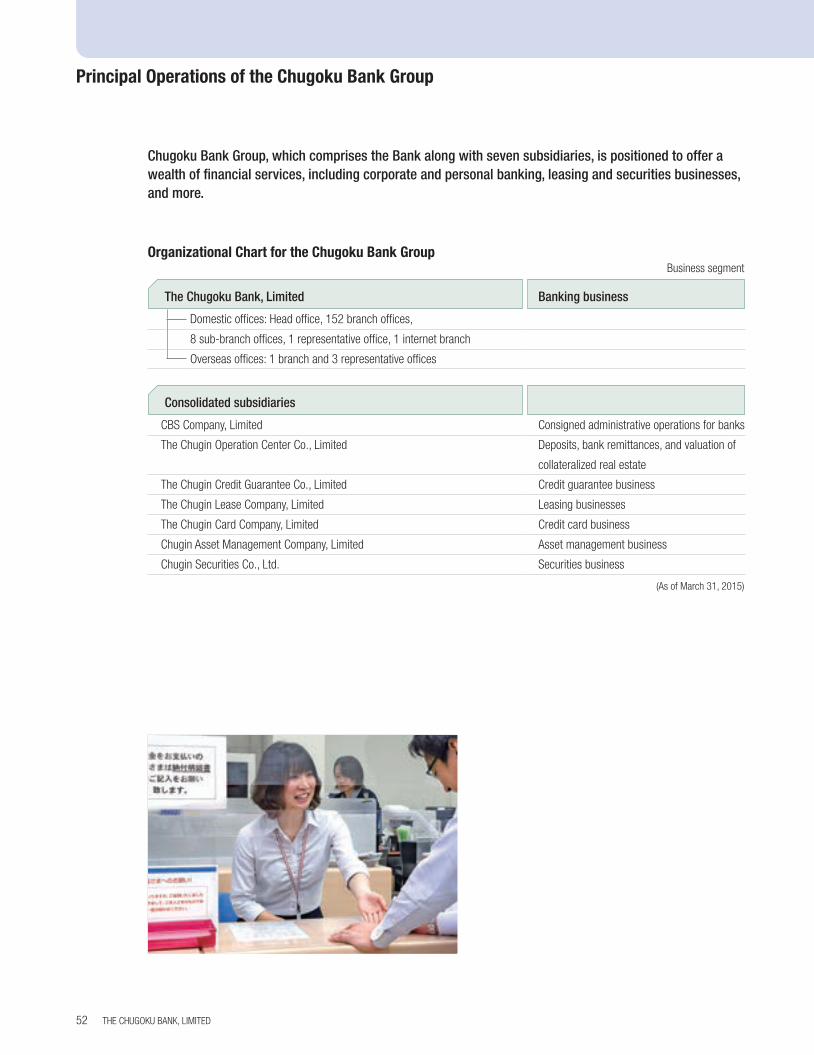
Principal Operations of the Chugoku Bank Group
Consolidated subsidiaries
CBS Company, Limited Consigned administrative operations for banks
The Chugin Operation Center Co., Limited Deposits, bank remittances, and valuation of
collateralized real estate
The Chugin Credit Guarantee Co., Limited Credit guarantee business
The Chugin Lease Company, Limited Leasing businesses
The Chugin Card Company, Limited Credit card business
Chugin Asset Management Company, Limited Asset management business
Chugin Securities Co., Ltd. Securities business
Organizational Chart for the Chugoku Bank Group Business segment
(As of March 31, 2015)
Chugoku Bank Group, which comprises the Bank along with seven subsidiaries, is positioned to offer a wealth of financial services, including corporate and personal banking, leasing and securities businesses, and more.
The Chugoku Bank, Limited Banking business
Domestic offices: Head office, 152 branch offices,
8 sub-branch offices, 1 representative office, 1 internet branch
Overseas offices: 1 branch and 3 representative offices
THE CHUGOKU BANK, LIMITED52
010_0410501372709.indd 52 2015/09/08 18:44:14
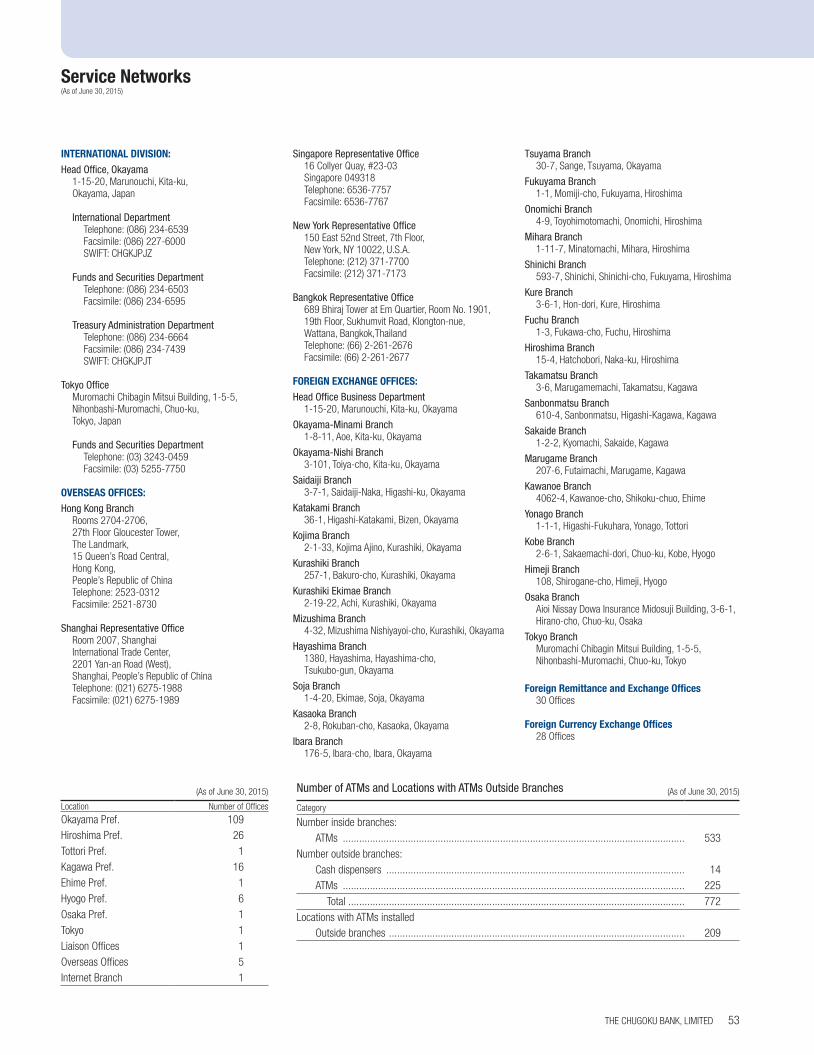
Service Networks(As of June 30, 2015)
INTERNATIONAL DIVISION:Head Office, Okayama
1-15-20, Marunouchi, Kita-ku,Okayama, Japan
International DepartmentTelephone: (086) 234-6539Facsimile: (086) 227-6000SWIFT: CHGKJPJZ
Funds and Securities DepartmentTelephone: (086) 234-6503Facsimile: (086) 234-6595
Treasury Administration DepartmentTelephone: (086) 234-6664Facsimile: (086) 234-7439SWIFT: CHGKJPJT
Tokyo OfficeMuromachi Chibagin Mitsui Building, 1-5-5,Nihonbashi-Muromachi, Chuo-ku,Tokyo, Japan
Funds and Securities DepartmentTelephone: (03) 3243-0459Facsimile: (03) 5255-7750
OVERSEAS OFFICES:Hong Kong Branch
Rooms 2704-2706, 27th Floor Gloucester Tower,The Landmark, 15 Queen’s Road Central,Hong Kong,People’s Republic of ChinaTelephone: 2523-0312Facsimile: 2521-8730
Shanghai Representative OfficeRoom 2007, ShanghaiInternational Trade Center,2201 Yan-an Road (West),Shanghai, People’s Republic of ChinaTelephone: (021) 6275-1988Facsimile: (021) 6275-1989
Singapore Representative Office16 Collyer Quay, #23-03Singapore 049318Telephone: 6536-7757Facsimile: 6536-7767
New York Representative Office150 East 52nd Street, 7th Floor,New York, NY 10022, U.S.A.Telephone: (212) 371-7700Facsimile: (212) 371-7173
Bangkok Representative Office689 Bhiraj Tower at Em Quartier, Room No. 1901,19th Floor, Sukhumvit Road, Klongton-nue,Wattana, Bangkok,ThailandTelephone: (66) 2-261-2676Facsimile: (66) 2-261-2677
FOREIGN EXCHANGE OFFICES:Head Office Business Department
1-15-20, Marunouchi, Kita-ku, Okayama
Okayama-Minami Branch1-8-11, Aoe, Kita-ku, Okayama
Okayama-Nishi Branch3-101, Toiya-cho, Kita-ku, Okayama
Saidaiji Branch3-7-1, Saidaiji-Naka, Higashi-ku, Okayama
Katakami Branch36-1, Higashi-Katakami, Bizen, Okayama
Kojima Branch2-1-33, Kojima Ajino, Kurashiki, Okayama
Kurashiki Branch257-1, Bakuro-cho, Kurashiki, Okayama
Kurashiki Ekimae Branch2-19-22, Achi, Kurashiki, Okayama
Mizushima Branch4-32, Mizushima Nishiyayoi-cho, Kurashiki, Okayama
Hayashima Branch1380, Hayashima, Hayashima-cho,Tsukubo-gun, Okayama
Soja Branch1-4-20, Ekimae, Soja, Okayama
Kasaoka Branch2-8, Rokuban-cho, Kasaoka, Okayama
Ibara Branch176-5, Ibara-cho, Ibara, Okayama
Tsuyama Branch30-7, Sange, Tsuyama, Okayama
Fukuyama Branch1-1, Momiji-cho, Fukuyama, Hiroshima
Onomichi Branch4-9, Toyohimotomachi, Onomichi, Hiroshima
Mihara Branch1-11-7, Minatomachi, Mihara, Hiroshima
Shinichi Branch593-7, Shinichi, Shinichi-cho, Fukuyama, Hiroshima
Kure Branch3-6-1, Hon-dori, Kure, Hiroshima
Fuchu Branch1-3, Fukawa-cho, Fuchu, Hiroshima
Hiroshima Branch15-4, Hatchobori, Naka-ku, Hiroshima
Takamatsu Branch3-6, Marugamemachi, Takamatsu, Kagawa
Sanbonmatsu Branch610-4, Sanbonmatsu, Higashi-Kagawa, Kagawa
Sakaide Branch1-2-2, Kyomachi, Sakaide, Kagawa
Marugame Branch207-6, Futaimachi, Marugame, Kagawa
Kawanoe Branch4062-4, Kawanoe-cho, Shikoku-chuo, Ehime
Yonago Branch1-1-1, Higashi-Fukuhara, Yonago, Tottori
Kobe Branch2-6-1, Sakaemachi-dori, Chuo-ku, Kobe, Hyogo
Himeji Branch108, Shirogane-cho, Himeji, Hyogo
Osaka BranchAioi Nissay Dowa Insurance Midosuji Building, 3-6-1,Hirano-cho, Chuo-ku, Osaka
Tokyo BranchMuromachi Chibagin Mitsui Building, 1-5-5,Nihonbashi-Muromachi, Chuo-ku, Tokyo
Foreign Remittance and Exchange Offices30 Offices
Foreign Currency Exchange Offices28 Offices
(As of June 30, 2015)
Location Number of Offices
Okayama Pref. 109Hiroshima Pref. 26Tottori Pref. 1Kagawa Pref. 16Ehime Pref. 1Hyogo Pref. 6Osaka Pref. 1Tokyo 1Liaison Offices 1Overseas Offices 5Internet Branch 1
Number of ATMs and Locations with ATMs Outside Branches (As of June 30, 2015)
Category
Number inside branches:ATMs .............................................................................................................................. 533
Number outside branches:Cash dispensers .............................................................................................................. 14ATMs .............................................................................................................................. 225
Total ............................................................................................................................ 772Locations with ATMs installed
Outside branches ............................................................................................................. 209
THE CHUGOKU BANK, LIMITED 53
010_0410501372709.indd 53 2015/09/08 18:44:14
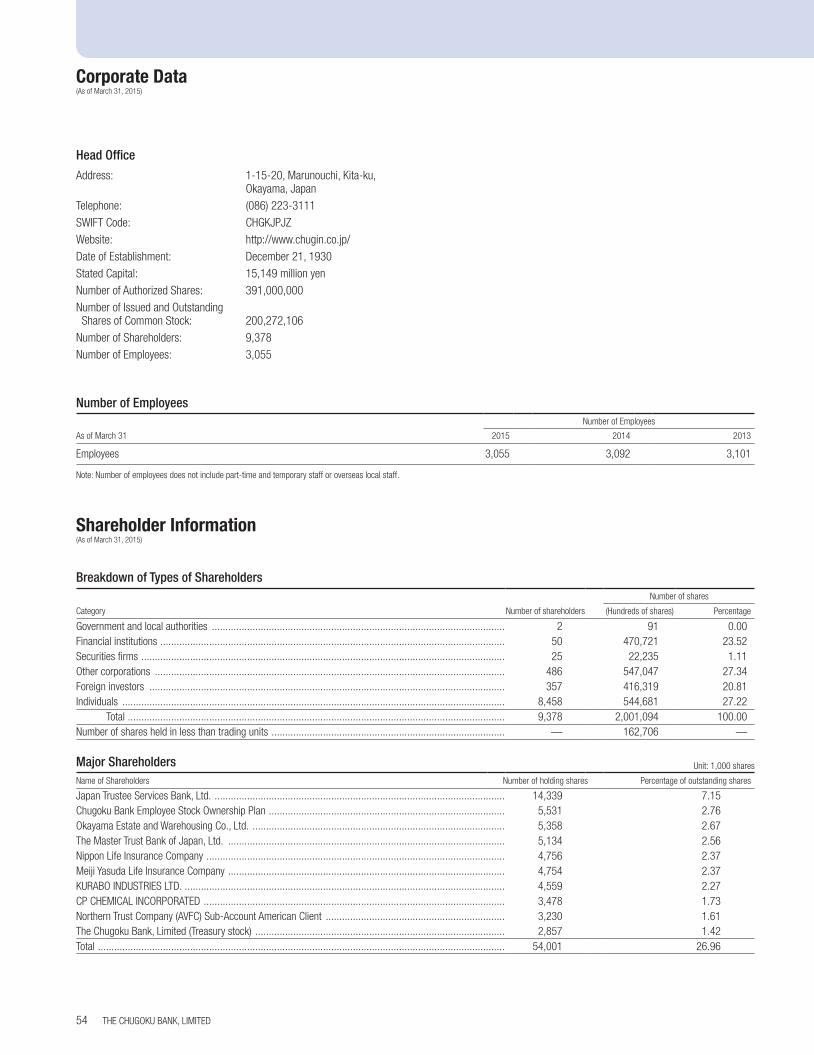
Corporate Data(As of March 31, 2015)
Head Office
Address: 1-15-20, Marunouchi, Kita-ku, Okayama, Japan
Telephone: (086) 223-3111
SWIFT Code: CHGKJPJZ
Website: http://www.chugin.co.jp/
Date of Establishment: December 21, 1930
Stated Capital: 15,149 million yen
Number of Authorized Shares: 391,000,000
Number of Issued and Outstanding Shares of Common Stock: 200,272,106
Number of Shareholders: 9,378
Number of Employees: 3,055
Number of EmployeesNumber of Employees
As of March 31 2015 2014 2013
Employees 3,055 3,092 3,101
Note: Number of employees does not include part-time and temporary staff or overseas local staff.
Shareholder Information(As of March 31, 2015)
Breakdown of Types of ShareholdersNumber of shares
Category Number of shareholders (Hundreds of shares) Percentage
Government and local authorities ............................................................................................................ 2 91 0.00Financial institutions ............................................................................................................................... 50 470,721 23.52Securities firms ...................................................................................................................................... 25 22,235 1.11Other corporations ................................................................................................................................. 486 547,047 27.34Foreign investors ................................................................................................................................... 357 416,319 20.81Individuals ............................................................................................................................................. 8,458 544,681 27.22
Total ........................................................................................................................................... 9,378 2,001,094 100.00Number of shares held in less than trading units ...................................................................................... — 162,706 —
Major Shareholders Unit: 1,000 shares
Name of Shareholders Number of holding shares Percentage of outstanding shares
Japan Trustee Services Bank, Ltd. ........................................................................................................... 14,339 7.15Chugoku Bank Employee Stock Ownership Plan ....................................................................................... 5,531 2.76Okayama Estate and Warehousing Co., Ltd. ............................................................................................. 5,358 2.67The Master Trust Bank of Japan, Ltd. ...................................................................................................... 5,134 2.56Nippon Life Insurance Company .............................................................................................................. 4,756 2.37Meiji Yasuda Life Insurance Company ...................................................................................................... 4,754 2.37KURABO INDUSTRIES LTD. ...................................................................................................................... 4,559 2.27CP CHEMICAL INCORPORATED ............................................................................................................... 3,478 1.73Northern Trust Company (AVFC) Sub-Account American Client .................................................................. 3,230 1.61The Chugoku Bank, Limited (Treasury stock) ............................................................................................ 2,857 1.42Total ...................................................................................................................................................... 54,001 26.96
THE CHUGOKU BANK, LIMITED54
010_0410501372709.indd 54 2015/09/08 18:44:14
Okayama(Head Office)
Yonago
HiroshimaKobe
Osaka
Takamatsu
Tokyo
Shanghai
Hong Kong
Bangkok
Okayama
Singapore
New York
Hiroshima
Okayama
Tottori
Hyogo
Kagawa
Ehime
Hiroshima Port of MizushimaOkayama Kobe
Okayama Airport
Takamatsu
Disclosure Policy
The Chugoku Bank proactively undertakes the disclosure of information in order that customers, investors,
business partners and other parties can more accurately understand matters concerning the Bank as a result
of conducting timely and appropriate information disclosure.
This includes disclosing information in a timely manner by producing disclosure pamphlets, business
reports, annual reports and financial reports as well as via our website and other mediums.
The Chugoku Bank will continue to endeavor to disclose information in an appropriate and timely manner.
Forward-looking StatementsThis annual report contains forward-looking statements regarding the future results and performance of Chugoku Bank. Such forward-looking statements are based on current information and assumptions. Please be advised that actual results could differ materially from those anticipated by the forward-looking statements due to a variety of factors.
THE CHUGOKU BANK, LIMITED 55
005_0410501372709.indd 6 2015/09/11 20:27:56

THE
CH
UG
OK
U B
AN
K, LTD
. AN
NU
AL R
EP
OR
T 2015
Chugin Heart
005_0410501372709.indd 1 2015/09/11 20:27:54