Embed Size (px)
Citation preview

Mon. Not. R. Astron. Soc. 000, 1–12 (2014) Printed 26 June 2014 (MN LATEX style file v2.2)
The chosen few: the low mass halos that host faint galaxies
Till Sawala1?, Carlos S. Frenk1, Azadeh Fattahi2, Julio F. Navarro2, Tom Theuns1,3,Richard G. Bower1, Robert A. Crain4, Michelle Furlong1, Adrian Jenkins1,Matthieu Schaller1 and Joop Schaye4
1Institute for Computational Cosmology, Department of Physics, University of Durham, South Road, Durham DH13LE, UK2Department of Physics and Astronomy, University of Victoria, 3800 Finnerty Road, Victoria, British Columbia V8P 5C2, Canada3Department of Physics, University of Antwerp, Campus Groenenborger, Groenenborgerlaan 171, B-2020 Antwerp, Belgium4Leiden Observatory, Leiden University, Postbus 9513, 2300 RA Leiden, The Netherlands
Accepted 2014 ***. Received 2014 ***; in original form 2014
ABSTRACTSince reionization prevents star formation in most halos less massive than 3× 10⁹M,dwarf galaxies only populate a fraction of existing dark matter halos. We use hy-drodynamic cosmological simulations of the Local Group to study the discriminatingfactors for galaxy formation in the early Universe and connect them to the present-dayproperties of galaxies and halos. A combination of selection effects related to reion-ization, and the subsequent evolution of halos in different environments, introducesstrong biases between the population of halos that host dwarf galaxies, and the totalhalo population. Halos that host galaxies formed earlier and are more concentrated.In addition, halos more affected by tidal stripping are more likely to host a galaxy fora given mass or maximum circular velocity, vmax, today. Consequently, satellite halosare populated more frequently than field halos, and satellite halos of 108 − 109M orvmax of 12 − 20 kms−1, similar to the Local Group dwarf spheroidals, have experi-enced a greater than average reduction in both mass and vmax after infall. They are oncloser, more radial orbits with higher infall velocities and earlier infall times. Together,these effects make dwarf galaxies highly biased tracers of the underlying dark matterdistribution.
Key words: cosmology: theory – galaxies: formation – galaxies: evolution – galaxies:mass functions – methods: N-body simulations
“There are some who are in darknessAnd the others are in lightAnd you see the ones in brightnessThose in darkness drop from sight”
– Bertolt Brecht, The Threepenny Opera
1 INTRODUCTION
The Local Group dwarf galaxies and their halos are oftendescribed as ideal test cases for the impact of cosmologi-cal models on small scale structures. It has, of course, longbeen recognised that astrophysical processes such as reion-ization can suppress star formation in low mass halos (e.g.Efstathiou 1992; Bullock et al. 2000; Benson et al. 2002;Somerville 2002). It should therefore perhaps come as no
? E-mail: [email protected]
surprise that the total number of substructures predicted ina given cosmological model can be far greater than the num-ber of observable galaxies. However, as reionization occursin the early universe when halos are at a fraction of theirfinal mass, it is also expected that the properties of LocalGroup halos and galaxies today are only loosely related tothe conditions which separated those progenitor halos thatwere able to form stars from those that have remained dark.
In this paper we examine how the sparse sampling ofhalos by galaxies in the presence of an ionizing background,and the subsequent evolution of halos and galaxies in a Lo-cal Group environment, can lead to a population of haloshosting faint galaxies that is very different from the totalhalo population.
Previous simulations have studied the impact of reion-ization both for individual dwarf galaxies and for satellites ofMilky Way sized halos. Okamoto et al. (2008) and Okamoto& Frenk (2009) have found that reionization can removemost of the baryons from halos with low maximum circular
c© 2014 RAS
arX
iv:1
406.
6362
v1 [
astr
o-ph
.CO
] 2
4 Ju
n 20
14

2 Sawala et al.
velocity, vmax (the circular velocity measured at the radius
where vcirc =√
GM(< r)/r is maximal), and showed thatdark satellite halos are expected around the Milky Way withvmax up to 25 kms−1. They concluded that vmax ∼ 12 kms−1
at the time of reionization (z = 8 in their model) sharplyseparates dark and luminous halos. Nickerson et al. (2011)have also performed a simulation of a Milky-Way mass haloand its satellites, but found the peak mass, Mpeak, whichsatellites reach during their evolution to be the discriminat-ing factor, with halos of Mpeak < 2 × 10⁹M losing mostof their gas to reionization and failing to form stars. Shenet al. (2013) simulated galaxy formation in seven halos ofmass between 4.4 × 10⁸ and 3.6 × 10¹⁰M, and found thatthe three halos with a peak value of vmax < 16 kms−1 weredevoid of stars, and two halos with peak mass of 1.8 and3.3 × 109M only started star formation at z ∼ 0.5, longafter reionization.
Recently, we used a set of cosmological hydrodynamicsimulations of Local Group like volumes to show that the ap-pearance of “dark” halos that host no galaxy, combined withthe reduction in halo mass due to baryonic processes, cansignificantly change the expected stellar-to-total mass rela-tion of dwarf galaxies, and resolve previously reported dis-crepancies between observations of individual dwarf galax-ies and the predictions of ΛCDM derived from abundancematching (Sawala et al. (2014), see also Sawala et al. (2011)).In this paper we use the same set of simulations to studyhow reionization selects between halos that host galaxiesand those that do not. Following the formation and evolu-tion of dark and luminous halos throughout cosmic time,we can connect their properties in the early universe to theobservable galaxies and halos of the present day.
We also link individual halos from the hydrodynamicsimulations to their counterparts in dark matter only(DMO) simulations of the same volumes. This allows usto study the intrinsic properties of halos which determinegalaxy formation, and distinguish them from the impactthat the baryonic processes associated with galaxy forma-tion can have on individual halos. Finally, by comparing thepopulations of dark and luminous halos in the simulatedLocal Group volumes, we deduce the biases which can arisewhen observed galaxies are assumed to be representative ofthe underlying population of dark matter halos.
This paper is organised as follows. In Section 2, webriefly describe the simulations and the astrophysical as-sumptions made. By comparing simulations with and with-out reionization, we discuss the impact of reionization in Sec-tion 3. Section 4 describes galaxy formation in the presenceof reionization. In Section 4.1, we explain how the assemblyhistories separate those halos which form stars from thosethat remain dark. In Section 4.2 we discuss the resulting biasin formation redshifts, and in Section 4.3 we show the differ-ence in concentration between luminous and non-luminoushalos. In Section 5, we examine how the subsequent evolu-tion in different environments within the Local Group cre-ates further biases between luminous and non-luminous ha-los: satellites halos that are luminous have higher infall red-shifts and more radial orbits with higher infall velocities(Section 5.1), and the distributions of luminous and non-luminous halos differ within the Local Group (Section 5.2).We discuss some implications of our findings and concludewith a summary in Section 6.
Table 1. Numerical parameters of the simulations
Particle Masses Max Softening
Label Type DM [M] Gas [M] [pc]
L1 hydro 5.0 × 10⁴ 1.0 × 10⁴ 94
L1 DMO 6.0 × 10⁴ – 94
L2 hydro 5.9 × 10⁵ 1.3 × 10⁵ 216L2 DMO 7.2 × 10⁵ – 216
L3 hydro 7.3 × 10⁶ 1.5 × 10⁶ 500
L3 DMO 8.8 × 10⁶ – 500
2 METHODS
The simulations used in this paper have previously beendescribed in Sawala et al. (2014). We reproduce here themain aspects of their initial conditions and astrophysicalmodel.
We resimulate 12 cosmological volumes as “zoom” sim-ulations extracted frome the Dove simulation, a 1003Mpc3
N-Body simulation based on the WMAP-7 cosmology. Werequire that each volume should contain two halos of massin the range
(5 × 10¹¹ − 2.5 × 10¹²
)M separated by 800±
200 kpc, approaching with radial velocity of (0 − 250) kms−1
and with tangential velocity below 100 kms−1 in an environ-ment with an unperturbed Hubble flow out to 4 Mpc. Thehigh resolution initial conditions were created using second-order Lagrangian perturbation theory, as described by Jenk-ins (2010). The selection of Local Group environments isdiscussed in more detail in Fattahi et al. (2014, in prep).
The simulations were performed using a pressure-entropy variant (Hopkins 2013) of the Tree-PM SPH codeP-Gadget3 (Springel 2005), described in Dalla Vecchia etal. 2014 (in prep.). The subgrid physics model is that ofthe Evolution and Assembly of GaLaxies and their Environ-ments project (Eagle, Schaye et al. 2014 in prep., Crainet al. 2014 in prep.). It includes metal-dependent radia-tive cooling (Wiersma et al. 2009) and photo-heating in thepresence of UV and X-ray backgrounds, and the cosmic mi-crowave background (CMB).
Prior to reionization, net cooling rates are computedfrom the CMB and from a UV and X-ray background thatfollows the z = 9 model of Haardt & Madau (2001) witha 1 Ryd high-energy cutoff. To account for the tempera-ture boost due to radiative transfer and non-equilibrium ef-fects over the optically thin limit assumed in our simulations(Abel & Haehnelt 1999), we inject 2 eV per hydrogen andhelium atom. We assume that hydrogen reionizes instanta-neously at z = 11.5 (Planck Collaboration et al. 2013), whilethe redshift dependence of helium reionization is modelledas a Gaussian centred at z = 3.5 (Theuns et al. 2002) withσ(z) = 0.5. As shown by Wiersma et al. (2009) and Rollindeet al. (2013), the resulting evolution of the temperature-density relation is consistent with measurements of the in-tergalactic medium (Schaye et al. 2000).
Star formation follows the formulation of Schaye &Dalla Vecchia (2008) with a metallicity-dependent thresh-old (Schaye 2004). The model includes stellar evolution(Wiersma et al. 2009) and stochastic thermal supernovafeedback (Dalla Vecchia & Schaye 2012), as well as black-hole growth and AGN feedback (Rosas-Guevara et al. 2013;Booth & Schaye 2009; Springel et al. 2005).
All simulations were run twice: once with gas and the
c© 2014 RAS, MNRAS 000, 1–12

The chosen few 3
Figure 1. Gas density distribution (top three rows) and stellar density distribution (bottom row, only halos with m? > 4 × 10⁶M) in
the L2 simulation without reionization (left) and the same volume with reionization (right). The region shown measures 3× 2Mpc2 atz = 0 and is magnified proportional to a(z) at higher redshifts. Following reionization at z = 11.5, gas is removed from low mass halos,
and reduced cooling results in a less fragmented IGM. The impact of reionization is first noticeable in the low-density regions, whichare already less structured at z = 10, just after reionization. At later times, the differences increase, and the number of collapsed andeventually star-forming halos is much lower in the simulation that includes reionization.
c© 2014 RAS, MNRAS 000, 1–12

4 Sawala et al.
baryon physics described above, and once as dark matteronly (DMO). In addition, one volume was also run with thecomplete hydrodynamic model, but without reionization.In the DMO simulations the dark matter particle massesare larger by a factor of (Ωb + ΩDM )/ΩDM relative to thecorresponding hydrodynamic simulations. To investigate theregime of Local Group dwarf galaxies, we use three differentresolution levels labelled L1, L2 and L3, whose parametersare given in Table 1. In this work, L3 is only used to testconvergence. The main results for the model that includesreionization are obtained from five pairs of hydrodynamicand DMO simulations at resolution L2 and one pair at L1.The simulations without reionization presented in Section 3were only run up to L2.
We use a Friends-of-Friends algorithm (FoF; Davis et al.1985) to identify overdense structures (FoF-groups), and thesubfind algorithm (Springel et al. 2001; Dolag et al. 2009)to identify self-bound substructures within them. As theyrepresent the objects most directly associated with individ-ual galaxies, we always refer to the self-bound substructuresas “halos”. The principal substructure within an FoF-groupcontains most of its mass, but satellites may share the sameFoF-group while still residing in separate self-bound halos.Throughout this paper, we use the term “satellite” when werefer to the satellite halos or galaxies associated with theM31 and Milky-Way analogues, and “field” when we referto isolated halos.
We analyse our simulations at 128 snapshots, and tracethe evolution of individual halos in both the hydrodynamicand DMO simulations using merger trees, as described inHelly et al. (2003) and Qu et al. (2014, in prep.). The uniqueIDs of dark matter particles which encode their positions inthe initial conditions allow us to match and compare indi-vidual halos from different simulations of the same volumeat the same resolution.
3 THE IMPACT OF REIONIZATION
From z = 11.5, the UV background heats the intergalac-tic medium and lowers its cooling rate. It can also removegas from low-mass halos by photo-evaporation. In Fig. 1we compare the evolution of the gas density distributionsin two simulations of the same volume and resolution (L2)with and without reionization, as well as the final stellar den-sity distribution. At z = 10, shortly after hydrogen reion-ization, the main difference is apparent in the low-densityregions. Here, the thermal energy provided by reionizationslows the collapse of small structures which results in asmoother IGM than in the absence of reionization. By com-parison, regions of higher density which correspond to ha-los that have already formed before reionization, are notsignificantly affected. By z = 4, the intergalactic mediumhas become significantly more fragmented in the simulationwithout reionization, with many more low-mass halos nowcontaining dense gas and forming stars compared to the sim-ulation with reionization. At z = 0 it can be seen that whilethe large-scale features in both the gas- and stellar densitydistributions are similar, in the absence of reionization, theIGM is strongly fragmented and has collapsed into manysmall clumps. By contrast, the IGM in the simulation withreionization has remained much smoother. Without reion-
Figure 2. Fraction of halos which are luminous at z = 0 as a
function of halo mass in simulations with and without reioniza-tion for different resolutions. When reionization is included, the
fraction of luminous halos as a function of mass is much reduced.
In the simulation with reionization, the luminous fraction is con-verged at L2. By contrast, without reionization, the luminous
fraction is not numerically converged, and would increase further
with higher resolution.
Figure 3. Fraction of halos which are luminous as a function of
halo mass at different redshifts from z = 11.5 to z = 0 in the
simulation with reionization at resolution L1. At any redshift,the fraction of luminous halos of mass below 108M is less than
10%, and almost no halos below 107.5M contain stars. The mass
scale that separates luminous from dark halos evolves from ∼ 3×10⁸M at z = 11.5 to ∼ 3 × 10⁹M at z = 0.
ization, the number of halos within 2.5 Mpc from the LGcentre that contain stars is ∼ 700, compared to only ∼ 180in the same volume with reionization.
In Fig. 2 we compare the fraction of halos containingstars at z = 0, for simulations of the same volume with andwithout reionization and at different resolutions, as definedin Table 1. It can be seen that significantly more halos areluminous in the simulations without reionization. It shouldbe noted that our simulations are not sufficient to simulatea Universe without reionization faithfully: the level of frag-mentation of the IGM is limited by resolution, and the totalnumber of galaxies formed in this (unphysical) scenario isnot converged and increases with increasing resolution. Bycontrast, the results with reionization are well converged atL2, suggesting that in our simulations, reionization sets a
c© 2014 RAS, MNRAS 000, 1–12

The chosen few 5
Figure 4. Mass assembly history for present-day field halos (left), present-day satellites (centre), and the combination of both (right).
Halos are grouped according to mass at z = 0, as measured in the hydrodynamic simulation (top row), and as measured in the DMO
simulation (bottom row). The vertical lines indicate z = 11.5, the time of hydrogen reionization, and the squares indicate mass ratiosthat corresponds to the same halo mass (107.5M) at this time for each final mass bin. As indicated by the dashed lines, halos of lower
final mass generally formed earlier, but this trend is greatly amplified for luminous halos. With decreasing final mass, luminous halos
become increasingly biased towards earlier formation times. Tidal stripping typically results in mass loss for satellites, whereas field halostend to reach their peak mas at z = 0. However, note that luminous field halos with masses below 109M today are also likely to have
been tidally stripped in the past, leading to an evolution more similar to that of satellites.
limit for star formation in low mass halos that is above theresolution limit of our simulations.
Fig. 3 shows the evolution of the luminous fractionof halos as a function of mass in a simulation that in-cludes reionization, from z = 11.5 to z = 0. At all red-shifts, the fraction of luminous halos at 108M is less than10%, and almost no halos are luminous below 107.5M. Themass-dependence of the luminous fraction is strongest atz = 11.5, where all halos more massive than 3×10⁸M con-tain stars. As halos typically grow in mass over time, themass-dependence of the luminous fraction becomes moregradual towards lower redshifts. While the minimum halomass of luminous halos remains almost unchanged, the massat which most halos are luminous increases continuously.
Of course, supernovae and AGN feedback can also heatup the gas and regulate star formation in larger halos. How-ever, reionization is clearly a key factor for determining thetotal number of galaxies that form and can also strengthenthe impact of supernovae on the star formation rate (Pawlik& Schaye 2009). In terms of the halo properties required forstar formation in the presence of reionization, our resultsare consistent with those obtained by the previous stud-ies reviewed in Section 1. At a mass of ∼ 3 × 10⁹M, orvmax ∼ 25 kms−1, half of all halos contain galaxies at z = 0.
4 THE TIMING OF GALAXY FORMATION
Since reionization takes place at a time when halos have onlya small fraction of their present mass, the probability for starformation within a halo is expected to depend strongly onits individual assembly history. Consequently, the propertiesthat separate the halos that host galaxies from those thatremain dark should be more closely related to their progen-itors at high redshifts.
Halos that have assembled more mass at the time ofreionization will be more resilient to photo-evaporation, andwill subsequently be able to cool gas more efficiently, result-ing in a greater chance for star formation. As a result, for afixed mass today, halos that formed earlier are more likely tocontain galaxies, so that halos that host galaxies are biasedtowards earlier formation times.
4.1 Assembly Histories
In Fig. 4 we compare the average mass assembly histories ofluminous and dark halos in three different final halo massranges. We distinguish between presently isolated halos andsatellites, and compare the results measured directly in thehydrodynamic simulation to those measured by comparingthe matched counterparts to the luminous and non-luminoushalos from the dark matter only (DMO) simulation.
c© 2014 RAS, MNRAS 000, 1–12

6 Sawala et al.
As expected, we find that halos which form stars as-semble their mass significantly earlier compared to non-luminous halos of the same mass today.
We reproduce the well-known result of hierarchicalstructure formation that halos of lower mass typically formearlier than halos of larger mass, independently of whetheror not they contain stars. Since most halos above 109.5Mare luminous, we find only a slight difference between the as-sembly histories of dark and luminous halos above this mass.However, as the fraction of luminous halos decreases in themass ranges 109−109.5M and 108.5−109M, the remainingluminous halos are increasingly biased towards earlier massassembly. This result can be readily understood from thefact that for gas cooling and star formation to take place inthe presence of reionization, a sufficiently high mass needsto have been assembled at an early time.
It is worth pointing out that while low mass halos haveto assemble their mass early in order to survive reionization,star formation itself begins later for most halos. Of all halosthat contain galaxies at z = 0, only ∼ 8% have startedforming stars before z = 11.5, with a median redshift ofz = 6 for the first stars to form in each galaxy.
As shown in the middle column of Fig. 4, luminous aswell as dark satellites of all masses have typically experi-enced some degree of tidal stripping and mass loss, leadingto a decrease in average mass towards z = 0. By compari-son, the mass of present-day field halos is typically maximalat z = 0. However, the least massive luminous field halosin the hydrodynamic simulation achieved their peak massat z > 0, and have since lost mass as a result of tidal in-teractions. Note that the combination of strong strippingand ejection means that a pair of matched halos is unlikelyto evolve in the same way across in the hydrodynamic andDMO simulations, and that low mass centrals in the DMOsimulation are more likely to be matched to slightly moremassive centrals in the hydrodynamic simulation than to beon such a rare orbit. However, while such objects are rareamongst all halos, star formation in halos with peak massof less than 109M is also rare, so the probability of an iso-lated galaxy in such a low mass halo having had such anexceptional history is strongly increased.
In this context, it is also worth noting that Teyssieret al. (2012) have computed the probability that halos ofisolated dwarf galaxies within the Local Group are “es-caped” satellites, based on orbits of halos measured in theVia Lactea II dark matter only simulation. They found that∼ 13% of halos within 1.5 Mpc have passed through theMilky Way’s virial radius. Our results suggest that for actualfield dwarf galaxies in very low mass halos, the probabilityof past tidal interactions is significantly higher.
4.2 Formation Redshifts
The difference in assembly history between luminous andnon-luminous halos can also be expressed as a bias in forma-tion redshift, z1/2, defined as the redshift at which a halo’smost massive progenitor first reaches 1/2 of its peak mass.In Fig. 5, we plot the formation redshifts of luminous andnon-luminous halos as a function of their peak mass.
While the total population of halos shows only a weakdependence of formation redshift on mass (in agreementwith Fakhouri et al. 2010), the sub-populations of lumi-
Figure 5. Redshift when a halo reached half of its peak mass as
a function of peak mass. Luminous halos which were able to coolstars in the presence of reionization formed significantly earlier
than non-luminous ones of the same peak mass. As the requiredevolution bias increases for lower mass halos, both luminous and
dark halos show a strong mass evolution of the formation redshift,
whereas the total halo population does not.
nous and non-luminous halos both show a strong mass-dependence, with lower mass halos forming earlier. This re-sult can be understood because at any mass, luminous ha-los form earlier than dark halos: halos of low mass have toform earlier to be luminous, and halos of high mass have toform later to be dark. The increase in the fraction of lumi-nous halos with mass then offsets the negative correlationof mass with formation redshift in each subset to give a to-tal population in which mass and formation time are largelyuncorrelated.
The average formation redshift of present-day satellitesis higher than that of present-day field halos. Satellite ha-los typically reach their peak mass at zinfall before z = 0,while the masses of field halos typically continue to increaseto z = 0. The exception are present-day field halos that ex-perienced past tidal interactions, which, like satellites, arebelow their peak mass today. As noted in Section 4.1, amongfield halos with peak masses below 109M that are luminousthe probability of such a history is increased significantly.
In summary, we find that the progenitors of present-daydwarf galaxies do not have the assembly histories typical ofdark matter halos of their mass or vmax. While dark halos ofpeak mass 109M form at z1/2 ∼ 2, halos of the same massthat host galaxies have a formation redshift of z1/2 ∼ 3− 4.
4.3 Velocity – mass relation
Halos that formed earlier have higher concentration, andtherefore higher maximum circular velocity, vmax, for agiven mass. In addition, more concentrated halos can coolgas more efficiently, limiting the photo-evaporating effect ofreionization. Since both early mass growth and the resis-tance to photo-evaporation enhance the probability for starformation, we expect low-mass galaxies to be hosted prefer-entially by halos of higher vmax – mass ratios.
In Fig. 6 we show the relation between vmax and halomass, either evaluated at z = 0 or at zpeak, the time of peak
c© 2014 RAS, MNRAS 000, 1–12

The chosen few 7
Figure 6. The relation between halo mass and vmax at the time of peak mass (left panel) and at z = 0 (right panel) from the simulation
at resolution L1 including reionization. Since stars form preferentially in halos of high concentration, luminous halos are on averagemore concentrated than dark halos. The effect of galaxy formation itself on the halo is manifest in the difference between the relations
measured in the hydrodynamic simulation and those measured from the matched DMO simulation. At peak mass, luminous halos in the
hydrodynamic simulation have higher vmax/mass ratios than their DMO counterparts, indicating that gas cooling leads to an increasein concentration. At z = 0 halos of all type are typically less concentrated in the hydrodynamic simulation than in the DMO simulation.
mass. While the total population follows the vmax – massrelations expected for ΛCDM (e.g. Klypin et al. 2011, notshown), we find that below 109.5M, luminous halos havesignificantly higher vmax – mass ratios than non-luminousones. As the fraction of luminous halos in our hydrodynamicsimulation decreases with decreasing halo mass, the bias ofthe remaining luminous halos increases. Similarly, at highmasses where most halos are luminous, the remaining darkhalos are increasingly biased towards lower vmax – mass ra-tios.
We find similar trends when we consider the halos ofthe DMO simulation that are matched to luminous andnon-luminous halos. Like the luminous halos themselves,their counterparts in the DMO simulation have much highervmax – mass ratios than the DMO counterparts of the non-luminous halos. This confirms that the increased vmax ofluminous halos in the hydrodynamic simulation is largelyexplained by the fact that more concentrated halos are in-trinsically more likely to form stars.
We can examine the additional effect of baryons by di-rectly comparing the vmax – mass relation between halosin the hydrodynamic simulation and their respective DMOcounterparts. From the left panel of Fig. 6, it can be seenthat at peak mass, the non-luminous halos and their DMOcounterparts follow very similar relations, while the lumi-nous halos in the hydrodynamic simulation are more con-centrated than their DMO counterparts. This indicates thatprocesses like gas cooling, which are stronger in the lumi-nous than in the the non-luminous halos, can also lead toan increase in the vmax – mass ratios, an effect obviously notpresent in the DMO simulation.
When the two simulations are compared at z = 0, asis the case in the right panel of Fig. 6, luminous and non-luminous halos alike have lower average vmax – mass ra-tios than their respective counterparts in the DMO simula-
tion. However, this difference is small compared to the off-set between luminous and dark halos or the correspondingmatched objects.
It can also be seen that satellites follow a differentvmax – mass relation compared to field halos, with a lowermass for a given vmax. This well-known result can be at-tributed to the fact that tidal stripping first removes mate-rial from the outside of an infalling halo, beyond rmax, witha greater impact on halo mass than on vmax. However, wealso find that the difference between satellite and field ha-los is strongly amplified among luminous halos because, aswe will discuss in Section 5.1, luminous and dark satellitesfollow significantly different orbits.
In summary, we find that luminous low-mass halos havemuch higher vmax – mass ratios than average halos. This dif-ference increases as the fraction of luminous halos decreasestowards lower masses, and is higher for satellites than forfield halos. Since we find similar trends between the respec-tive matched halos in DMO simulation, we attribute themmostly to the increased likelihood for star formation in moreconcentrated halos, rather than to an increase of concentra-tion due to cooling and star formation.
5 LATE TIME EVOLUTION
In addition to the effects of assembly history and the prop-erties of halos directly related to reionization, the late-timeevolution also influences the probability for halos to hostgalaxies, and the expected distribution of luminous and darkhalos within the Local Group.
In the previous section, we showed that the progeni-tors of luminous halos formed significantly earlier than thoseof dark halos. We also noted clear differences between theevolution of satellites and centrals. These are not a direct
c© 2014 RAS, MNRAS 000, 1–12

8 Sawala et al.
Figure 7. Evolution of galactocentric distance for dark and luminous satellites of the simulated “Milky Way”, as identified directly in
the hydrodynamic simulation (left column), or as matched from the DMO simulation (right column) at resolution L1. Satellite halos are
selected by present mass in the range 108 − 109M (top row) or present vmax in the range 12 − 20 kms−1 (bottom row). In each panel,the grey dashed line shows the evolution of the host halo’s virial radius, r200, in both simulations. Within this range of mass or vmax, the
orbits of luminous and dark halos differ significantly. Also note the lower number of objects in the hydrodynamic simulation compared
to the DMO simulation, due to the reduction of vmax and mass of individual halos by baryonic effects.
consequence of reionization, but indicate that differences inthe late-time evolution can change the correspondence be-tween the properties of present-day halos and those of theirprogenitors in the early universe.
In this section, we examine the late-time effects in moredetail, and show in particular how tidal stripping and thefact that satellites stop growing after infall, can introducea strong environmental dependence on the relation betweenobservable galaxies and the underlying halo population.
5.1 Satellite Evolution
The evolution of satellite halos is driven by tidal effects,which further separate their present-day properties fromthose of their progenitors. Among satellite halos of the samemass or vmax today, those that experienced greater mass losshad more massive progenitors prior to infall, and thereforea higher probability for star formation. This introduces ad-ditional biases between dark and luminous satellites thatdepend on their infall times and orbital parameters.
In Fig. 7 we compare the orbits of luminous and darklow-mass satellites of one of our simulated Milky-Way likehalos. We identify satellites as self-bound halos within thevirial radius of the host at z = 0, r200, defined as the radiuswithin which the mean density is 200 × the critical density,and define the infall redshift, zinfall, as the redshift when asatellite first crosses r200. Selecting satellites either by theirpresent mass or present vmax, it can be seen that the orbits
of luminous halos in the mass range of 108 − 109 M or thevmax range of 12 − 20 kms−1 differ significantly from thoseof dark halos of the same present mass: they fall in earlierand come closer to the centre of the host.
We note that the same effect can be seen between thehalos of the DMO simulation which are matched to luminousand dark halos in the hydrodynamic simulation and shownin the right column of Fig. 7. The matching of low mass satel-lites is imperfect because satellites can evolve differently inthe two simulations. Nevertheless, it underlines the fact thatthe different orbits of luminous and non-luminous satellitesare primarily caused by a selection effect of the progenitorsimposed by reionization, and not by differences in the bary-onic components between the luminous and dark satellites.However, the overall number of satellites is reduced in thehydrodynamic simulation due to the loss of baryons, consis-tent with the results of Sawala et al. (2013).
Fig. 8 shows the distribution of infall redshifts of lu-minous and non-luminous satellites in the vmax range of12 − 20 kms−1, comparable to the values inferred for thehalos that host the Milky Way dwarf spheroidal galaxies.These results include satellites of all 10 M31 and Milky Waylike halos in our five Local Group simulations at resolutionL2. The median infall redshift of non-luminous satellites inthis vmax range is 1.0, while luminous satellites fell in sig-nificantly earlier, with a median infall redshift of 1.5.
It is worth noting that in addition to mass loss throughtidal stripping, the infall of a satellite also marks the end
c© 2014 RAS, MNRAS 000, 1–12
The chosen few 9
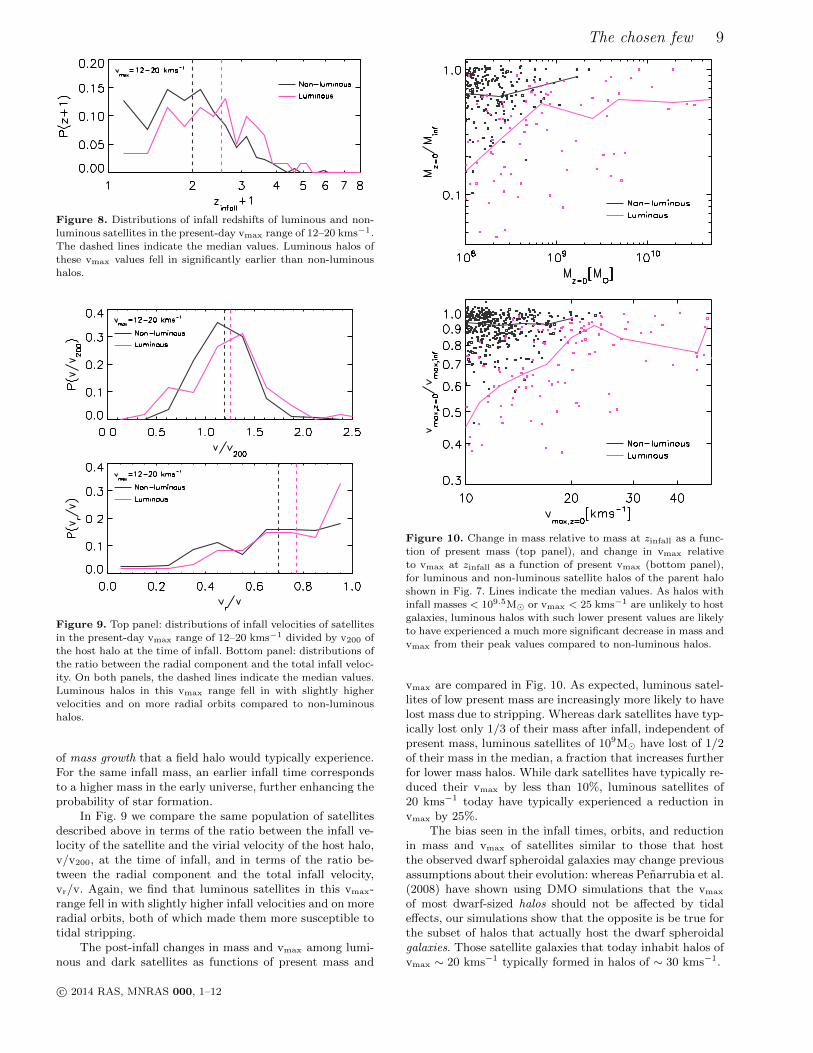
Figure 8. Distributions of infall redshifts of luminous and non-luminous satellites in the present-day vmax range of 12–20 kms−1.
The dashed lines indicate the median values. Luminous halos of
these vmax values fell in significantly earlier than non-luminoushalos.
Figure 9. Top panel: distributions of infall velocities of satellitesin the present-day vmax range of 12–20 kms−1 divided by v200 of
the host halo at the time of infall. Bottom panel: distributions of
the ratio between the radial component and the total infall veloc-ity. On both panels, the dashed lines indicate the median values.
Luminous halos in this vmax range fell in with slightly highervelocities and on more radial orbits compared to non-luminous
halos.
of mass growth that a field halo would typically experience.For the same infall mass, an earlier infall time correspondsto a higher mass in the early universe, further enhancing theprobability of star formation.
In Fig. 9 we compare the same population of satellitesdescribed above in terms of the ratio between the infall ve-locity of the satellite and the virial velocity of the host halo,v/v200, at the time of infall, and in terms of the ratio be-tween the radial component and the total infall velocity,vr/v. Again, we find that luminous satellites in this vmax-range fell in with slightly higher infall velocities and on moreradial orbits, both of which made them more susceptible totidal stripping.
The post-infall changes in mass and vmax among lumi-nous and dark satellites as functions of present mass and
Figure 10. Change in mass relative to mass at zinfall as a func-tion of present mass (top panel), and change in vmax relative
to vmax at zinfall as a function of present vmax (bottom panel),for luminous and non-luminous satellite halos of the parent halo
shown in Fig. 7. Lines indicate the median values. As halos with
infall masses < 109.5M or vmax < 25 kms−1 are unlikely to hostgalaxies, luminous halos with such lower present values are likely
to have experienced a much more significant decrease in mass and
vmax from their peak values compared to non-luminous halos.
vmax are compared in Fig. 10. As expected, luminous satel-lites of low present mass are increasingly more likely to havelost mass due to stripping. Whereas dark satellites have typ-ically lost only 1/3 of their mass after infall, independent ofpresent mass, luminous satellites of 109M have lost of 1/2of their mass in the median, a fraction that increases furtherfor lower mass halos. While dark satellites have typically re-duced their vmax by less than 10%, luminous satellites of20 kms−1 today have typically experienced a reduction invmax by 25%.
The bias seen in the infall times, orbits, and reductionin mass and vmax of satellites similar to those that hostthe observed dwarf spheroidal galaxies may change previousassumptions about their evolution: whereas Penarrubia et al.(2008) have shown using DMO simulations that the vmax
of most dwarf-sized halos should not be affected by tidaleffects, our simulations show that the opposite is be true forthe subset of halos that actually host the dwarf spheroidalgalaxies. Those satellite galaxies that today inhabit halos ofvmax ∼ 20 kms−1 typically formed in halos of ∼ 30 kms−1.
c© 2014 RAS, MNRAS 000, 1–12
10 Sawala et al.
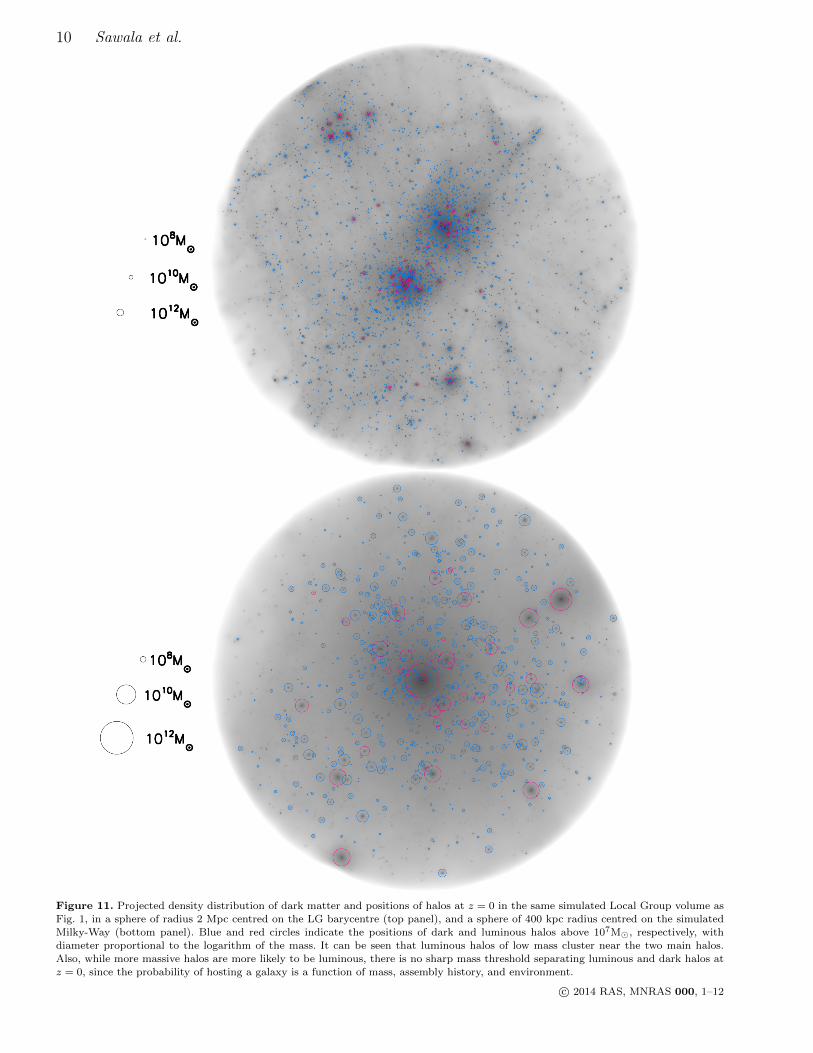
Figure 11. Projected density distribution of dark matter and positions of halos at z = 0 in the same simulated Local Group volume as
Fig. 1, in a sphere of radius 2 Mpc centred on the LG barycentre (top panel), and a sphere of 400 kpc radius centred on the simulated
Milky-Way (bottom panel). Blue and red circles indicate the positions of dark and luminous halos above 107M, respectively, withdiameter proportional to the logarithm of the mass. It can be seen that luminous halos of low mass cluster near the two main halos.
Also, while more massive halos are more likely to be luminous, there is no sharp mass threshold separating luminous and dark halos at
z = 0, since the probability of hosting a galaxy is a function of mass, assembly history, and environment.
c© 2014 RAS, MNRAS 000, 1–12

The chosen few 11
Figure 12. Fraction of halos above a given mass (solid lines) orvmax (dashed lines), within a given distance from the centre of
the simulated “Milky Way”. At fixed mass, halos within ∼ 300
kpc of the Milky Way are much more likely to contain galaxiesthan more isolated halos, and the environmental dependence is
stronger among halos of lower present mass or vmax.
5.2 Dwarf Galaxies and Halos in the Local Group
The effect of stripping that separates the luminous and non-luminous satellites also extends to a marked difference be-tween satellite and field halos within the Local Group, anddifferences in the distribution of luminous and dark halosbeyond the virial radius of its two main galaxies.
In Fig. 11 we show the z = 0 distributions of halosabove 107M within 2 Mpc to the centre of one of our LocalGroup volumes, and within 400 kpc of one of the Milky-Way like halos. It can be seen that low-mass luminous halosare predominantly found close to the larger galaxies, wherestripping has lead to a significant reduction in mass.
While ram pressure stripping can quench star formationand introduce environmental dependencies on the propertiesof low mass galaxies, gas is not responsible for the environ-mental dependence of the luminous fraction. It is primarilydriven by the fact that, as a result of tidal stripping, halosof a given mass or vmax today that are closer to the centralgalaxies typically had higher masses or vmax in the earlyuniverse, and therefore a higher probability for star forma-tion.
In Fig. 12 we show the fraction of halos of a given massor vmax today that are populated by galaxies, as a functionof distance to the Milky-Way-like galaxy. It can be seen thatwhile all satellites with M > 109M or vmax > 20 kms−1,as well as a large fraction of lower mass halos, are popu-lated inside 200 kpc, the fraction decreases with increasingdistance (an increase at ∼ 800kpc can be attributed to thesatellites of the second massive halo in the simulated LocalGroup, i.e. the halo of “M31”).
This result implies that there are fewer isolated dwarfgalaxies in the Local Group than a simple extrapolationbased on vmax or mass from the Milky Way and M31 satel-lites would suggest.
6 DISCUSSION AND SUMMARY
We have analysed a set of hydrodynamic and dark mat-ter only (DMO) simulations of the Local Group in order tostudy how galaxies populate low mass halos in the presenceof reionization. We have shown that reionization greatly re-duces the number of dwarf galaxies that form, and that evenat fixed mass or vmax today, the subset of halos that hostthe Local Group’s dwarf galaxies differ significantly from thetotal halo population.
The differences between the luminous and non-luminoushalos result from a combination of early-time and late-timeeffects. Halos of mass below ∼ 3 × 10⁹M or vmax below∼ 25 kms−1, that host the majority of the Local Groupdwarf galaxies, assembled their mass significantly earlierthan typical dark matter halos of the same present-day massor vmax. Since halos that form earlier are more concentrated,and also because more concentrated halos are more resistantto photo-evaporation, those halos that contain stars havesignificantly higher vmax – mass ratios.
The late-time evolution of halos, and in particular tidalstripping, introduces further biases between the luminousand non-luminous halos. The halos of satellite galaxies withmass and vmax values similar to those of the observed dwarfspheroidals experienced much stronger tidal stripping thancomparable non-luminous satellites. The Milky Way or M31satellite galaxies typically formed in halos that were morethan twice as massive and had significantly higher vmax val-ues prior to infall. They also had earlier infall redshifts,higher infall velocities, and followed more radial orbits thantypical dark matter halos.
Within the Local Group, isolated halos are much lesslikely to host galaxies than satellites of comparable mass orvmax today. In particular, present-day field dwarf galaxiesthat share the characteristics of dwarf spheroidals are morelikely to be “escaped” satellites than was assumed from ear-lier DMO studies.
The biases between the luminous and non-luminous ha-los described here have to be taken into account wheneverthe properties of halos or of the underlying cosmology areto be measured, but only those halos that contain galaxiescan be observed.
It is worth noting that our simulations still have severallimitations. They assume that reionization is uniform and donot account for local sources of ionization. Radiative transferis not included, cooling rates are computed in the opticallythin limit, star formation is modelled in a stochastic way,and we did not include star formation in mini halos poweredby H2 cooling. While we have shown that the fraction ofhalos populated by galaxies is numerically converged, it maystill depend on model parameters.
With these limitations in mind, we would like to empha-sise the importance of the connection between the observ-able dwarf galaxies and the underlying population of darkmatter halos. As noted in the beginning, the Local Groupdwarf galaxies provide the best window for studying the na-ture of dark matter on small scales. However, our resultssuggest that because reionization leaves most halos empty,Local Group dwarf galaxies today typically live in halos thatare highly atypical.
c© 2014 RAS, MNRAS 000, 1–12

12 Sawala et al.
ACKNOWLEDGEMENTS
We are indebted to Dr. Lydia Heck who ensures that thecomputers run smoothly at the ICC. This work was sup-ported by the Science and Technology Facilities Council[grant number ST/F001166/1 and RF040218], the Euro-pean Research Council under the European Union’s Sev-enth Framework Programme (FP7/2007-2013) / ERC Grantagreement 278594-GasAroundGalaxies, the National Sci-ence Foundation under Grant No. PHYS-1066293, the In-teruniversity Attraction Poles Programme of the BelgianScience Policy Office [AP P7/08 CHARM] and the hospi-tality of the Aspen Center for Physics. T. S. acknowledgesthe Marie-Curie ITN CosmoComp. C. S. F. acknowledgesan ERC Advanced Investigator Grant COSMIWAY. Thiswork used the DiRAC Data Centric system at DurhamUniversity, operated by the Institute for ComputationalCosmology on behalf of the STFC DiRAC HPC Facil-ity (www.dirac.ac.uk), and resources provided by WestGrid(www.westgrid.ca) and Compute Canada / Calcul Canada(www.computecanada.ca). The DiRAC system is funded byBIS National E-infrastructure capital grant ST/K00042X/1,STFC capital grant ST/H008519/1, STFC DiRAC Opera-tions grant ST/K003267/1, and Durham University. DiRACis part of the National E-Infrastructure.
REFERENCES
Abel T., Haehnelt M. G., 1999, ApJ, 520, L13Benson A. J., Frenk C. S., Lacey C. G., Baugh C. M., ColeS., 2002, MNRAS, 333, 177
Booth C. M., Schaye J., 2009, MNRAS, 398, 53Bullock J. S., Kravtsov A. V., Weinberg D. H., 2000, ApJ,539, 517
Dalla Vecchia C., Schaye J., 2012, MNRAS, 426, 140Davis M., Efstathiou G., Frenk C. S., White S. D. M., 1985,ApJ, 292, 371
Dolag K., Borgani S., Murante G., Springel V., 2009, MN-RAS, 399, 497
Efstathiou G., 1992, MNRAS, 256, 43PFakhouri O., Ma C.-P., Boylan-Kolchin M., 2010, MNRAS,406, 2267
Haardt F., Madau P., 2001, in D. M. Neumann &J. T. V. Tran ed., Clusters of Galaxies and the High Red-shift Universe Observed in X-rays Modelling the UV/X-ray cosmic background with CUBA
Helly J. C., Cole S., Frenk C. S., Baugh C. M., Benson A.,Lacey C., 2003, MNRAS, 338, 903
Hopkins P. F., 2013, MNRAS, 428, 2840Jenkins A., 2010, MNRAS, 403, 1859Klypin A. A., Trujillo-Gomez S., Primack J., 2011, ApJ,740, 102
Nickerson S., Stinson G., Couchman H. M. P., Bailin J.,Wadsley J., 2011, MNRAS, 415, 257
Okamoto T., Frenk C. S., 2009, MNRAS, 399, L174Okamoto T., Gao L., Theuns T., 2008, MNRAS, 390, 920Pawlik A. H., Schaye J., 2009, MNRAS, 396, L46Penarrubia J., McConnachie A. W., Navarro J. F., 2008,ApJ, 672, 904
Planck Collaboration Ade P. A. R., Aghanim N., Armitage-Caplan C., Arnaud M., Ashdown M., Atrio-Barandela F.,
Aumont J., Baccigalupi C., Banday A. J., et al. 2013,ArXiv 1303.5076
Rollinde E., Theuns T., Schaye J., Paris I., Petitjean P.,2013, MNRAS, 428, 540
Rosas-Guevara Y. M., Bower R. G., Schaye J., Furlong M.,Frenk C. S., Booth C. M., Crain R., Dalla Vecchia C.,Schaller M., Theuns T., 2013, ArXiv 1312.0598
Sawala T., Frenk C. S., Crain R. A., Jenkins A., Schaye J.,Theuns T., Zavala J., 2013, MNRAS, 431, 1366
Sawala T., Frenk C. S., Fattahi A., Navarro J. F., BowerR. G., Crain R. A., Dalla Vecchia C., Furlong M., JenkinsA., McCarthy I. G., Qu Y., Schaller M., Schaye J., TheunsT., 2014, ArXiv e-prints
Sawala T., Guo Q., Scannapieco C., Jenkins A., White S.,2011, MNRAS, 413, 659
Schaye J., 2004, ApJ, 609, 667Schaye J., Dalla Vecchia C., 2008, MNRAS, 383, 1210Schaye J., Theuns T., Rauch M., Efstathiou G., SargentW. L. W., 2000, MNRAS, 318, 817
Shen S., Madau P., Conroy C., Governato F., Mayer L.,2013, ArXiv e-prints
Somerville R. S., 2002, ApJ, 572, L23Springel V., 2005, MNRAS, 364, 1105Springel V., Di Matteo T., Hernquist L., 2005, MNRAS,361, 776
Springel V., White S. D. M., Tormen G., Kauffmann G.,2001, MNRAS, 328, 726
Teyssier M., Johnston K. V., Kuhlen M., 2012, MNRAS,426, 1808
Theuns T., Schaye J., Zaroubi S., Kim T.-S., TzanavarisP., Carswell B., 2002, ApJ, 567, L103
Wiersma R. P. C., Schaye J., Smith B. D., 2009, MNRAS,393, 99
Wiersma R. P. C., Schaye J., Theuns T., Dalla Vecchia C.,Tornatore L., 2009, MNRAS, 399, 574
c© 2014 RAS, MNRAS 000, 1–12
![arXiv:1410.0681v1 [astro-ph.GA] 2 Oct 2014 · THE QUENCHING OF THE ULTRA-FAINT DWARF GALAXIES IN THE REIONIZATION ERA1 THOMAS M ... luis.vargas@yale.edu 4 Observatories of the Carnegie](https://img.pdfslide.us/doc/110x75/5be2635109d3f24c478c4f03/arxiv14100681v1-astro-phga-2-oct-2014-the-quenching-of-the-ultra-faint.jpg)