Embed Size (px)
Citation preview
J Sci Food Agric 1998, 78, 399È404
The Choline Content of Feed Ingredients andMixed Feeds Determined by an Enzymatic Assay
Jose� Fernando M Menten,1 Gene M Pesti2* and John T Halley3
1 Dept Zootecnia, University of Sa8 o Paulo, 13418-900 Piracicaba SP, Brazil2 Department of Poultry Science, University of Georgia, Athens, GA 30602-2772, USA3 ConAgra Poultry Company, 2475 Meadow Brook Parkway, Duluth, GA 30136, USA
(Received 17 October 1997 ; revised version received 9 February 1998 ; accepted 11 March 1998)
Abstract : A recently developed procedure for the determination of choline iningredients and feeds was utilised to establish the levels and the variability ofcholine in a series of ingredients and to compare the analysed and calculatedcholine values of mixed feeds. The concentrations of choline in samples of maize(7), canola meal (3), wheat middlings (1) and dehydrated bakery product (1) were,respectively, 1É55 ^ 0É18, 7É59 ^ 0É08, 2É35 and 2É39 g kg~1, all higher thaningredient composition table values. Choline contents lower than table valueswere found in samples of poultry by-products (7) and meat and bone meal (6) :2É18 ^ 0É87 and 1É08 ^ 0É29 g kg~1, respectively. The average choline concentra-tion found in samples of dehulled soybean meal (7) was 2É73 ^ 0É18 g kg~1,similar to table values. The choline in samples of poultry fat (2) averaged0É48 ^ 0É02 g kg~1. SigniÐcant correlations between the concentrations ofcholine and of some components of the proximate analysis were found. Theanalysed choline concentrations in mixed feeds were only 1É4% lower than thecalculated levels based on the ingredient analyses. The procedure was adequatefor choline determination in ingredients or mixed feeds. The high variability inthe choline content of some ingredients may require analysis for proper feedformulation. 1998 Society of Chemical Industry.(
J Sci Food Agric 78, 399È404 (1998)
Key words : choline ; feed ingredients ; feeds ; enzymatic assay
INTRODUCTION
Reports on the choline content of feed ingredients havebeen found in the literature for more than 50 years. Inthe early reports of Engel (1942, 1943) and Rhian et al(1943), as well in others that followed (Almquist andMaurer 1951 ; Lim and Schall 1964 ; Lipstein et al 1977),the analytical procedure consisted of variations of thechemical method referred to as the reineckate technique.Horowitz and Beadle (1943) determined choline bymeans of a microbiological method using a mutant ofNeurospora. Chemical and microbiological methodswere compared to a chick growth assay in evaluating
* To whom correspondence should be addressed.
the choline content of some feed ingredients (Fritz et al1967). A limited number of ingredients were analysed inthese studies. The analytical procedures for choline havebeen, until recently, described as laborious, impreciseand relatively unspeciÐc (Anonymous 1994). Mentenand Pesti (1998) presented a methodology for a morerapid and precise determination of choline in feedsusing an enzymatic assay.
Recent information on the choline content of feedingredients has not been found in the scientiÐc liter-ature. However, all feed composition tables available toanimal nutritionists display the choline content of alarge number of feedstu†s. These values are probablyderived from unpublished results of independent labor-atories, and the methods of analyses are not reported.
3991998 Society of Chemical Industry. J Sci Food Agric 0022È5142/98/$17.50. Printed in Great Britain(
400 J F M Menten, G M Pesti, J T Halley
Furthermore, the feed composition tables do notprovide information on the variability in cholinecontent that can be expected for each ingredient. Di†er-ences in the origin or processing method of some feed-stu†s may result in di†erent choline contents.
Choline is an essential nutrient which is often supple-mented to animal diets to improve performance,because the main ingredients may not meet minimumspeciÐcations. In order to supplement adequateamounts of choline to feeds, it is necessary to properlyestimate its concentration in the ingredients. Thepurpose of this report is to provide information on thelevels and variability in the choline content in somecommonly used feed ingredients. In addition, the calcu-lated and analysed values of some commercial poultryfeeds were compared to determine the additivity ofresults.
EXPERIMENTAL
Choline determinations were carried out on a series offeed ingredients and mixed feeds collected from sevenfeed mills operated by a private company (ConAgraPoultry Company) in the US. Seven samples each ofmaize, dehulled soybean meal and poultry by-products(ground, rendered, clean parts of the carcass of slaugh-tered poultry excluding feathers), six samples of meatand bone meal (rendered mammal tissues except blood,hair, hoof, horn and hide trimmings), three samples ofcanola meal, two samples of poultry fat, one sample of
wheat middlings, one sample of dehydrated bakeryproduct and nine samples of broiler and broiler breederfeeds containing the above ingredients were included inthe study. In addition to the choline determinations, thefeed ingredients were also analysed for moisture, crudeprotein (CP), ash, ether extract (EE) and crude Ðbre(CF) according to the AOAC (1990).
The feed samples were milled using a 2-mm screenprior to the analyses. The analytical procedure pre-viously described (Menten and Pesti 1998), using a “hotÏextraction in methanolÈKOH and an enzymatic assayof choline, was utilized. Duplicate samples (weighingapproximately 2 g each) were extracted in a GoldÐschapparatus. The biochemical components of the enzy-matic assay were all purchased from Sigma ChemicalCo (St Louis, MO, USA). The dilution factors (F) were5 for soybean meal and poultry fat, 10 for maize,poultry by-products, meat and bone meal, wheat mid-dlings, bakery product and the mixed feeds and 20 forthe canola meal.
Correlation analyses involving the components of theproximate analysis and choline were performed (SAS1985) for the materials with 6 or more samples.
The analysed choline values in the mixed feeds werecompared, in a blind procedure, to the calculated valuesbased on the contributions of each ingredient and sup-plemental choline.
RESULTS AND DISCUSSION
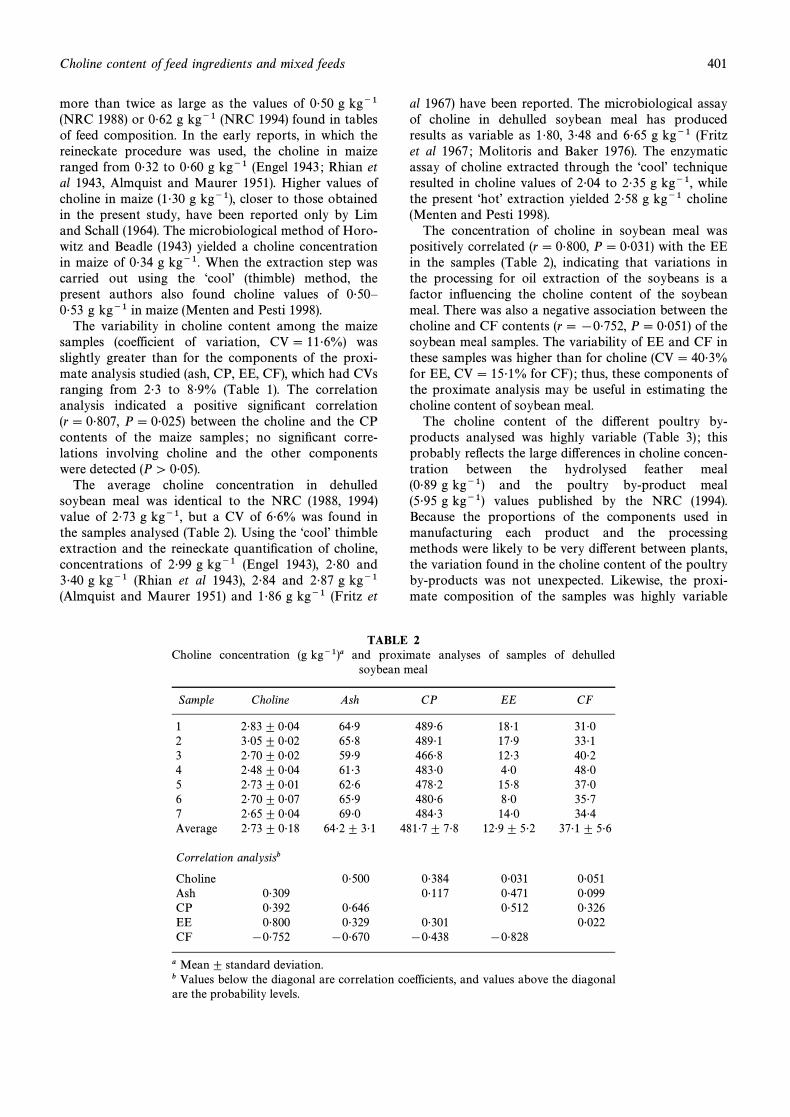
The determined choline concentrations in maizeobtained with the present procedure (Table 1) were
TABLE 1Choline concentration (g kg~1)a and proximate analyses of samples of maize
Sample Choline Ash Crude protein Ether extract Crude Ðbre(CP) (EE) (CF)
1 1É74 ^ 0É02 13É8 80É1 33É5 17É62 1É70 ^ 0 12É2 80É7 32É2 17É43 1É35 ^ 0É11 12É8 76É6 29É7 19É24 1É39 ^ 0É04 12É3 75É4 27É9 17É45 1É36 ^ 0É13 12É3 77É8 34É4 18É46 1É58 ^ 0 13É1 78É4 36É5 20É97 1É74 ^ 0É01 12É2 78É4 33É1 19É0Average 1É55 ^ 0É18 12É7 ^ 0É6 78É2 ^ 1É8 32É5 ^ 2É9 18É6 ^ 1É3
Correlation analysisb
Choline 0É573 0É025 0É343 0É863Ash 0É260 0É529 0É485 0É699CP 0É815 0É289 0É170 0É776EE 0É424 0É319 0É582 0É195CF [0É081 0É180 [0É133 0É555
a Mean^ standard deviation.b Values below the diagonal are correlation coefficients, and values above the diagonal arethe probability levels.
Choline content of feed ingredients and mixed feeds 401
more than twice as large as the values of 0É50 g kg~1(NRC 1988) or 0É62 g kg~1 (NRC 1994) found in tablesof feed composition. In the early reports, in which thereineckate procedure was used, the choline in maizeranged from 0É32 to 0É60 g kg~1 (Engel 1943 ; Rhian etal 1943, Almquist and Maurer 1951). Higher values ofcholine in maize (1É30 g kg~1), closer to those obtainedin the present study, have been reported only by Limand Schall (1964). The microbiological method of Horo-witz and Beadle (1943) yielded a choline concentrationin maize of 0É34 g kg~1. When the extraction step wascarried out using the “coolÏ (thimble) method, thepresent authors also found choline values of 0É50È0É53 g kg~1 in maize (Menten and Pesti 1998).
The variability in choline content among the maizesamples (coefficient of variation, CV\ 11É6%) wasslightly greater than for the components of the proxi-mate analysis studied (ash, CP, EE, CF), which had CVsranging from 2É3 to 8É9% (Table 1). The correlationanalysis indicated a positive signiÐcant correlation(r \ 0É807, P\ 0É025) between the choline and the CPcontents of the maize samples ; no signiÐcant corre-lations involving choline and the other componentswere detected (P[ 0É05).
The average choline concentration in dehulledsoybean meal was identical to the NRC (1988, 1994)value of 2É73 g kg~1, but a CV of 6É6% was found inthe samples analysed (Table 2). Using the “coolÏ thimbleextraction and the reineckate quantiÐcation of choline,concentrations of 2É99 g kg~1 (Engel 1943), 2É80 and3É40 g kg~1 (Rhian et al 1943), 2É84 and 2É87 g kg~1(Almquist and Maurer 1951) and 1É86 g kg~1 (Fritz et
al 1967) have been reported. The microbiological assayof choline in dehulled soybean meal has producedresults as variable as 1É80, 3É48 and 6É65 g kg~1 (Fritzet al 1967 ; Molitoris and Baker 1976). The enzymaticassay of choline extracted through the “coolÏ techniqueresulted in choline values of 2É04 to 2É35 g kg~1, whilethe present “hotÏ extraction yielded 2É58 g kg~1 choline(Menten and Pesti 1998).
The concentration of choline in soybean meal waspositively correlated (r \ 0É800, P\ 0É031) with the EEin the samples (Table 2), indicating that variations inthe processing for oil extraction of the soybeans is afactor inÑuencing the choline content of the soybeanmeal. There was also a negative association between thecholine and CF contents (r \ [0É752, P\ 0É051) of thesoybean meal samples. The variability of EE and CF inthese samples was higher than for choline (CV\ 40É3%for EE, CV\ 15É1% for CF) ; thus, these components ofthe proximate analysis may be useful in estimating thecholine content of soybean meal.
The choline content of the di†erent poultry by-products analysed was highly variable (Table 3) ; thisprobably reÑects the large di†erences in choline concen-tration between the hydrolysed feather meal(0É89 g kg~1) and the poultry by-product meal(5É95 g kg~1) values published by the NRC (1994).Because the proportions of the components used inmanufacturing each product and the processingmethods were likely to be very di†erent between plants,the variation found in the choline content of the poultryby-products was not unexpected. Likewise, the proxi-mate composition of the samples was highly variable
TABLE 2Choline concentration (g kg~1)a and proximate analyses of samples of dehulled
soybean meal
Sample Choline Ash CP EE CF
1 2É83 ^ 0É04 64É9 489É6 18É1 31É02 3É05 ^ 0É02 65É8 489É1 17É9 33É13 2É70 ^ 0É02 59É9 466É8 12É3 40É24 2É48 ^ 0É04 61É3 483É0 4É0 48É05 2É73 ^ 0É01 62É6 478É2 15É8 37É06 2É70 ^ 0É07 65É9 480É6 8É0 35É77 2É65 ^ 0É04 69É0 484É3 14É0 34É4Average 2É73 ^ 0É18 64É2 ^ 3É1 481É7 ^ 7É8 12É9 ^ 5É2 37É1 ^ 5É6
Correlation analysisb
Choline 0É500 0É384 0É031 0É051Ash 0É309 0É117 0É471 0É099CP 0É392 0É646 0É512 0É326EE 0É800 0É329 0É301 0É022CF [0É752 [0É670 [0É438 [0É828
a Mean^ standard deviation.b Values below the diagonal are correlation coefficients, and values above the diagonalare the probability levels.
402 J F M Menten, G M Pesti, J T Halley
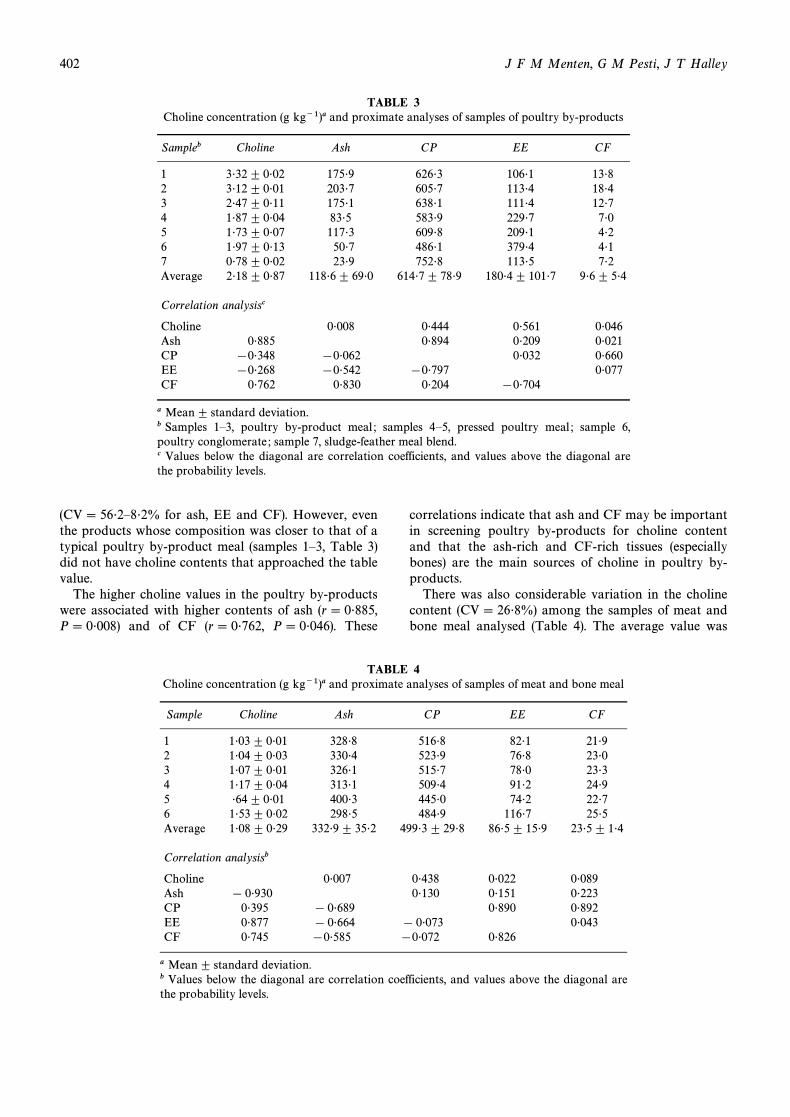
TABLE 3Choline concentration (g kg~1)a and proximate analyses of samples of poultry by-products
Sampleb Choline Ash CP EE CF
1 3É32 ^ 0É02 175É9 626É3 106É1 13É82 3É12 ^ 0É01 203É7 605É7 113É4 18É43 2É47 ^ 0É11 175É1 638É1 111É4 12É74 1É87 ^ 0É04 83É5 583É9 229É7 7É05 1É73 ^ 0É07 117É3 609É8 209É1 4É26 1É97 ^ 0É13 50É7 486É1 379É4 4É17 0É78 ^ 0É02 23É9 752É8 113É5 7É2Average 2É18 ^ 0É87 118É6 ^ 69É0 614É7 ^ 78É9 180É4 ^ 101É7 9É6 ^ 5É4
Correlation analysisc
Choline 0É008 0É444 0É561 0É046Ash 0É885 0É894 0É209 0É021CP [0É348 [0É062 0É032 0É660EE [0É268 [0É542 [0É797 0É077CF 0É762 0É830 0É204 [0É704
a Mean^ standard deviation.b Samples 1È3, poultry by-product meal ; samples 4È5, pressed poultry meal ; sample 6,poultry conglomerate ; sample 7, sludge-feather meal blend.c Values below the diagonal are correlation coefficients, and values above the diagonal arethe probability levels.
(CV\ 56É2È8É2% for ash, EE and CF). However, eventhe products whose composition was closer to that of atypical poultry by-product meal (samples 1È3, Table 3)did not have choline contents that approached the tablevalue.
The higher choline values in the poultry by-productswere associated with higher contents of ash (r \ 0É885,P\ 0É008) and of CF (r \ 0É762, P\ 0É046). These
correlations indicate that ash and CF may be importantin screening poultry by-products for choline contentand that the ash-rich and CF-rich tissues (especiallybones) are the main sources of choline in poultry by-products.
There was also considerable variation in the cholinecontent (CV\ 26É8%) among the samples of meat andbone meal analysed (Table 4). The average value was
TABLE 4Choline concentration (g kg~1)a and proximate analyses of samples of meat and bone meal
Sample Choline Ash CP EE CF
1 1É03 ^ 0É01 328É8 516É8 82É1 21É92 1É04 ^ 0É03 330É4 523É9 76É8 23É03 1É07 ^ 0É01 326É1 515É7 78É0 23É34 1É17 ^ 0É04 313É1 509É4 91É2 24É95 É64 ^ 0É01 400É3 445É0 74É2 22É76 1É53 ^ 0É02 298É5 484É9 116É7 25É5Average 1É08 ^ 0É29 332É9 ^ 35É2 499É3 ^ 29É8 86É5 ^ 15É9 23É5 ^ 1É4
Correlation analysisb
Choline 0É007 0É438 0É022 0É089Ash [ 0É930 0É130 0É151 0É223CP 0É395 [ 0É689 0É890 0É892EE 0É877 [ 0É664 [ 0É073 0É043CF 0É745 [0É585 [0É072 0É826
a Mean^ standard deviation.b Values below the diagonal are correlation coefficients, and values above the diagonal arethe probability levels.
Choline content of feed ingredients and mixed feeds 403
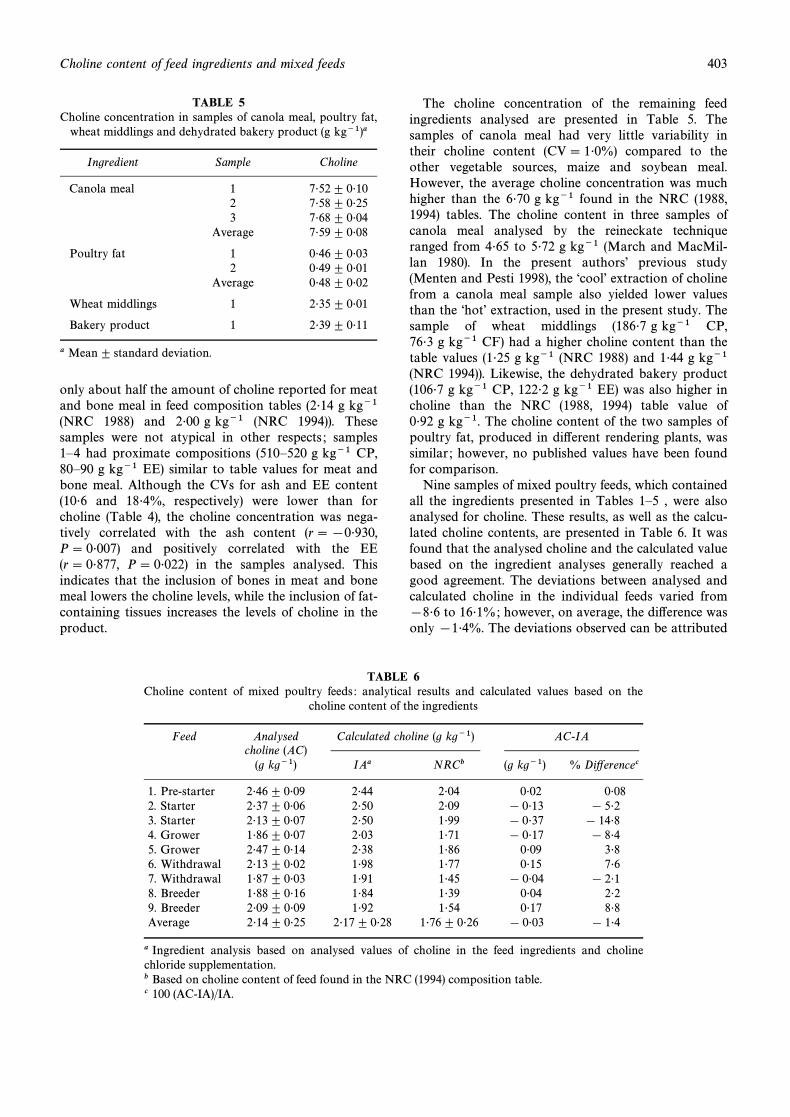
TABLE 5Choline concentration in samples of canola meal, poultry fat,
wheat middlings and dehydrated bakery product (g kg~1)a
Ingredient Sample Choline
Canola meal 1 7É52 ^ 0É102 7É58 ^ 0É253 7É68 ^ 0É04
Average 7É59 ^ 0É08
Poultry fat 1 0É46 ^ 0É032 0É49 ^ 0É01
Average 0É48 ^ 0É02
Wheat middlings 1 2É35 ^ 0É01
Bakery product 1 2É39 ^ 0É11
a Mean^ standard deviation.
only about half the amount of choline reported for meatand bone meal in feed composition tables (2É14 g kg~1(NRC 1988) and 2É00 g kg~1 (NRC 1994)). Thesesamples were not atypical in other respects ; samples1È4 had proximate compositions (510È520 g kg~1 CP,80È90 g kg~1 EE) similar to table values for meat andbone meal. Although the CVs for ash and EE content(10É6 and 18É4%, respectively) were lower than forcholine (Table 4), the choline concentration was nega-tively correlated with the ash content (r \ [0É930,P\ 0É007) and positively correlated with the EE(r \ 0É877, P\ 0É022) in the samples analysed. Thisindicates that the inclusion of bones in meat and bonemeal lowers the choline levels, while the inclusion of fat-containing tissues increases the levels of choline in theproduct.
The choline concentration of the remaining feedingredients analysed are presented in Table 5. Thesamples of canola meal had very little variability intheir choline content (CV\ 1É0%) compared to theother vegetable sources, maize and soybean meal.However, the average choline concentration was muchhigher than the 6É70 g kg~1 found in the NRC (1988,1994) tables. The choline content in three samples ofcanola meal analysed by the reineckate techniqueranged from 4É65 to 5É72 g kg~1 (March and MacMil-lan 1980). In the present authorsÏ previous study(Menten and Pesti 1998), the “coolÏ extraction of cholinefrom a canola meal sample also yielded lower valuesthan the “hotÏ extraction, used in the present study. Thesample of wheat middlings (186É7 g kg~1 CP,76É3 g kg~1 CF) had a higher choline content than thetable values (1É25 g kg~1 (NRC 1988) and 1É44 g kg~1(NRC 1994)). Likewise, the dehydrated bakery product(106É7 g kg~1 CP, 122É2 g kg~1 EE) was also higher incholine than the NRC (1988, 1994) table value of0É92 g kg~1. The choline content of the two samples ofpoultry fat, produced in di†erent rendering plants, wassimilar ; however, no published values have been foundfor comparison.
Nine samples of mixed poultry feeds, which containedall the ingredients presented in Tables 1È5 , were alsoanalysed for choline. These results, as well as the calcu-lated choline contents, are presented in Table 6. It wasfound that the analysed choline and the calculated valuebased on the ingredient analyses generally reached agood agreement. The deviations between analysed andcalculated choline in the individual feeds varied from[8É6 to 16É1%; however, on average, the di†erence wasonly [1É4%. The deviations observed can be attributed
TABLE 6Choline content of mixed poultry feeds : analytical results and calculated values based on the
choline content of the ingredients
Feed Analysed Calculated choline (g kg~1) AC-IAcholine (AC)
(g kg~1) IAa NRCb (g kg~1) % Di†erencec
1. Pre-starter 2É46 ^ 0É09 2É44 2É04 0É02 0É082. Starter 2É37 ^ 0É06 2É50 2É09 [ 0É13 [ 5É23. Starter 2É13 ^ 0É07 2É50 1É99 [ 0É37 [ 14É84. Grower 1É86 ^ 0É07 2É03 1É71 [ 0É17 [ 8É45. Grower 2É47 ^ 0É14 2É38 1É86 0É09 3É86. Withdrawal 2É13 ^ 0É02 1É98 1É77 0É15 7É67. Withdrawal 1É87 ^ 0É03 1É91 1É45 [ 0É04 [ 2É18. Breeder 1É88 ^ 0É16 1É84 1É39 0É04 2É29. Breeder 2É09 ^ 0É09 1É92 1É54 0É17 8É8Average 2É14 ^ 0É25 2É17 ^ 0É28 1É76 ^ 0É26 [ 0É03 [ 1É4
a Ingredient analysis based on analysed values of choline in the feed ingredients and cholinechloride supplementation.b Based on choline content of feed found in the NRC (1994) composition table.c 100 (AC-IA)/IA.
404 J F M Menten, G M Pesti, J T Halley
to several factors, such as improper mixing of choline atthe feed mill, inadequate sampling of the feed foranalysis or errors in the analytical procedure. Althoughthe analysed choline was higher than the table value forsome ingredients and lower for others, the calculatedcholine based on ingredient analyses was 23% greaterthan calculating based on the values found in the NRC(1994) table.
CONCLUSIONS
The concentrations of choline in feed ingredientsobtained with the analytical procedure used in thisstudy were higher than the values found in tables of feedcomposition for maize, canola meal, wheat middlingsand dehydrated bakery product, lower for poultry by-products and meat and bone meal and similar fordehulled soybean meal. Because of these di†erences, theadoption of the present procedure for choline analysiswould require a re-evaluation of the choline content ofa number of other feed ingredients and a re-evaluationof the choline requirements of animals.
The elevated variability in choline content encoun-tered among samples of poultry by-products and meatand bone meal may warrant routine analysis for cholineand/or a better standardisation of the products used infeed formulation. Even for the major constituents of afeed, maize and soybean meal, which has only a moder-ate variability in the samples analysed, the analysis ofcholine may be advantageous. If, for example, the maizeand soybean meal samples with the highest and thelowest concentrations of choline (Tables 1 and 2) werecombined in poultry feeds (620 g kg~1 maize,330 g kg~1 soybean meal), the di†erence in choline con-centration between the two feeds would be 0É43 g kg~1.This di†erence in choline supplementation is importantin terms of feed cost and performance of the animals.
Interesting correlations between the concentrations ofcholine and several components of the proximateanalysis have been detected. Although the number ofsamples of each ingredient was not large, those corre-lations may prove to be helpful in screening productswith di†erent choline contents based on the proximateanalysis. It may also be possible to estimate cholinefrom the results of the proximate analysis.
The determined choline in the mixed feeds and thecalculated choline based on ingredient analyses reachedan acceptable agreement. Thus, the analytical procedureutilised was equally adequate for mixed feeds and feed
ingredients ranging from cereal grain to rendering pro-ducts.
ACKNOWLEDGEMENTS
The authors are grateful to Ms Vjollca Konjufca for hertechnical assistance. This paper was supported by Stateand Hatch funds allocated to the Georgia AgriculturalStations of The University of Georgia, an FAPESPScholarship to the senior author, and a gift fromDuCoa Inc, Highland, IL, USA.
REFERENCES
Almquist H J, Maurer S 1951 Choline content of certain feed-stu†s. Poultry Sci 30 789È790.
Anonymous 1994 Choline, Functions and Requirements.DuCoa, Highland Park, IL, USA, pp 36È39.
AOAC 1990 Official Methods of Analysis (15th edn). Associ-ation of Official Agricultural Chemists, Washington, DC,USA.
Engel R W 1942 ModiÐed methods for the chemical and bio-logical determination of choline. J Biol Chem 144 701È710.
Engel R W 1943 The choline content of animal and plant pro-ducts. J Nutr 25 441È446.
Fritz J C, Roberts T, Boehne J W 1967 The chickÏs responseto choline and its application to an assay for choline infeedstu†s. Poultry Sci 46 1447È1453.
Horowitz N H, Beadle G W 1943 A microbiological methodfor the determination of choline by use of a mutant of neu-rospora. J Biol Chem 150 325È333.
Lim F, Schall E D 1964 Determination of choline in feeds. JAssoc O† Agric Chem 47 501È503.
Lipstein B, Bornstein S, Budowski P 1977 Utilization ofcholine from crude soybean lecithin by chicks. 1. Growthand prevention of perosis. Poultry Sci 56 331È336.
March B E, MacMillan C 1980 Choline concentration andavailability in rapeseed meal. Poultry Sci 59 611È615.
Menten J F M, Pesti G M 1998 The determination of thecholine content of feed ingredients using choline kinase. JSci Food Agric 78 395È398.
Molitoris B A, Baker D H 1976 Assessment of the quantity ofbiologically available choline in soybean meal. J Anim Sci42 481È489.
NRC 1988 Nutrient Requirements of Swine (9th edn). NationalResearch Council National Academy Press, Washington,DC, USA, pp 56È57.
NRC 1994 Nutrient Requirements of Poultry (9th ed). NationalResearch Council National Academy Press, Washington,DC, USA, pp 62È65.
Rhian M, Evans R J, St John J L 1943 The choline content offeeds. J Nutr 25 1È5.
SAS 1985 SAS UserÏs Guide : Statistical V ersion (5th edn). SASInstitute, Cary, NC, USA.