Embed Size (px)
Citation preview

THE CHIEF JUSTICE’S ANNUAL STATISTICS REPORT 2017
ON THE SUPREME COURT
1

THE CHIEF JUSTICE’S ANNUAL STATISTICS REPORT 2017
ON THE SUPREME COURT
TABLE OF CONTENTS
The Chief Justice s Message ................................................................................................................ i
Executive Summary .......................................................................................................................... iii
Methodology .....................................................................................................................................v
Chapter 1.0: High Court Civil Division .................................................................................................. 1
Chapter 2.0: Matrimonial Division .................................................................................................... 31
Chapter 3.0: Probate Division ........................................................................................................... 45
Chapter 4.0: Home Circuit Court ....................................................................................................... 57
Chapter 5.0: High Court Division of the Gun Court ............................................................................. 78
Chapter 6.0: Commercial Division ..................................................................................................... 95
Chapter 7.0: Aggregate Case Activity and Reserved Judgments .......................................................... 97
Chapter 8.0: Conclusion and Recommendations ...............................................................................105
APPENDIX ......................................................................................................................................110
2

THE CHIEF JUSTICE’S ANNUAL STATISTICS REPORT 2017
ON THE SUPREME COURT
CHIEF JUSTICE’S MESSAGE
Over the last two years significant efforts have been made to optimize the use of the JEMS
Case Management software at the Supreme Court in seeking to ensure that data on a range of
variables are adequately captured. This was done with the assistance of a statistician, working
closely with the Information Technology and other court staff and staff assigned by the Ministry
of Justice. This project has been successfully applied in the Civil, Matrimonial, Commercial and
Probate Divisions of the Civil Registries of the Supreme Court as well as the Home Circuit Court
and Gun Courts and is supported by a robust data validation system. This initiative forms part of
a broader, ongoing court-wide effort to digitize all records. As a result of these initiatives, the
Supreme Court is now in a position to extract and report on a range of statistical data, including
case load, case clearance and disposal rates and the length of time that it takes for matters to
be disposed of in the various Divisions. Among other things, such data provide the Supreme
Court with an opportunity to establish time standards for the delivery of justice across all
Divisions.
It has always been my desire to create a data driven court system where statistics form the
basis of informing both operational and policy decisions and the recent progress made has
been exceptional. I anticipate that in the coming years these improvements will have a
transformational impact on the Jamaican judiciary, by strengthening and enhancing the
timeliness for the delivery of justice to our citizens.
3

THE CHIEF JUSTICE’S ANNUAL STATISTICS REPORT 2017
ON THE SUPREME COURT
A comprehensive Statistical Report is prepared on case activity in all Divisions of the Supreme
Court for each Term, in addition to an Annual Report. These reports are publicly available on
the website of the Supreme Court.
This annual report for 2017 is the first comprehensive Statistical Report of its kind for the
Supreme Court and therefore represents a significant step. It presents a summary of essential
data on case activity in the Civil, Matrimonial, Probate and Commercial Divisions of the
Supreme Court as well as for the Home Circuit Court and the Gun Court. The statistical team is
committed to working towards the improvement of our Justice sector in this important area of
record keeping.
I would like to thank all members of staff and stakeholders who have contributed to the steady
strides being made in improving data collection and statistics as well as critical supporting
processes such as records and case flow management.
Hon Zaila McCalla, OJ
Chief Justice
4

THE CHIEF JUSTICE’S ANNUAL STATISTICS REPORT 2017
ON THE SUPREME COURT
EXECUTIVE SUMMARY
This is a seminal Annual Statistical Report for 2017 on case activity in the Supreme Court. A
range of data on the High Court Civil (HCV), Probate, Matrimonial and Commercial Divisions as
well as the Home Circuit Court and Gun Court are included in this report. The results therefore
provide important insights which can potentially inform the operational efficiency of the
Supreme Court and the policy design of the relevant state actors.
A total of 11937 new cases entered the Supreme Court across the HCV, Probate and
Matrimonial Divisions in 2017 while 5933 cases were disposed for these same Divisions. A
further 667 new cases were filed in the Commercial Division in the year, bringing the total
number of new cases filed in the Supreme Court in 2017 to 12604. The HCV and Matrimonial
Divisions with 4396 and 3539 respectively of the total number of new cases accounted for the
largest share while the Gun Court with 513 new cases and the Revenue Division with 12 cases
had the lowest numbers. The Matrimonial Division accounted for over 40% of all cases disposed
in the Supreme Court in 2017, with 2621 cases while the 3 cases disposed of in the Revenue
Division was the least among the Divisions.
Among the major findings from this Annual Report is that the average case clearance rate
across the four Divisions was roughly 50%. The case clearance rate provides a measure of the
number of cases disposed, for every new case entered. The average of roughly 50% across the
Divisions suggests that for every 100 new cases entered in the period; roughly 50 were also
disposed (not necessarily from the new cases entered). The case clearance rates for 2017 range
from a low of 24.18% in the High Court Civil Division to a high of 97.86% in the Gun Court. The
5

THE CHIEF JUSTICE’S ANNUAL STATISTICS REPORT 2017
ON THE SUPREME COURT
overall statistic on the case clearance rate gives essential insights into potential case flow and
backlog problems as on average there twice as many new cases entered as cases disposed in
2017.
Most Divisions of the Supreme Court continue to encounter severe challenges with the rate of
strict adherence to dates set for hearing or trial due to the high incidence of adjournments. The
trial and hearing date certainty which computes the rate of adherence to dates scheduled,
ranges from an approximate low of roughly 54% in the Criminal Division to an approximate high
of approximately 80.50% in the Probate Division for 2017. The average date adherence across
the Divisions for the period under examination was roughly 69%. This is an indication that there
is a 69% probability that a matter scheduled for hearing or trial will go ahead without
adjournment. Among the prominent reasons for adjournment cited across the Divisions are
files not found, the non-appearance of parties and/or attorneys, matters wrongly listed and
matters left off the court list. These reasons span both internal factors within the court s
control and factors outside of its direct autonomy. Therefore, the ethos of the solutions related
to these issues is the need for enhanced case and records management, more robust systems
of scheduling and stronger stakeholder engagements.
Apart from the high frequency of adjournments, the relatively high incidence of requisitions is
an impediment to the speed of disposition of civil matters. Among the Civil Divisions, the
incidence of requisitions was highest in the Matrimonial Division with a ratio of 215 requisitions
per 100 case files while the HCV Division with 28 requisitions per 100 case files ranked among
the lowest incidence.
6
THE CHIEF JUSTICE’S ANNUAL STATISTICS REPORT 2017
ON THE SUPREME COURT
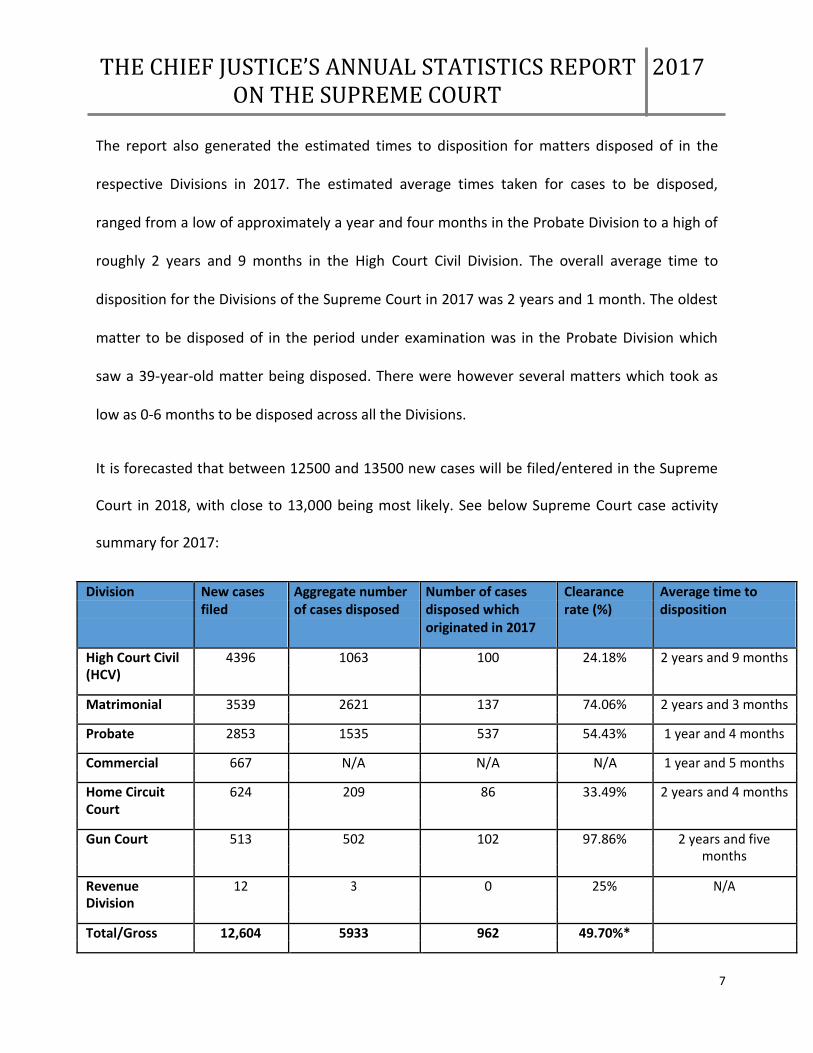
The report also generated the estimated times to disposition for matters disposed of in the
respective Divisions in 2017. The estimated average times taken for cases to be disposed,
ranged from a low of approximately a year and four months in the Probate Division to a high of
roughly 2 years and 9 months in the High Court Civil Division. The overall average time to
disposition for the Divisions of the Supreme Court in 2017 was 2 years and 1 month. The oldest
matter to be disposed of in the period under examination was in the Probate Division which
saw a 39-year-old matter being disposed. There were however several matters which took as
low as 0-6 months to be disposed across all the Divisions.
It is forecasted that between 12500 and 13500 new cases will be filed/entered in the Supreme
Court in 2018, with close to 13,000 being most likely. See below Supreme Court case activity
summary for 2017:
Division New cases Aggregate number Number of cases Clearance Average time to
filed of cases disposed disposed which rate (%) disposition
originated in 2017
High Court Civil 4396 1063 100 24.18% 2 years and 9 months
(HCV)
Matrimonial 3539 2621 137 74.06% 2 years and 3 months
Probate 2853 1535 537 54.43% 1 year and 4 months
Commercial 667 N/A N/A N/A 1 year and 5 months
Home Circuit 624 209 86 33.49% 2 years and 4 months
Court
Gun Court 513 502 102 97.86% 2 years and five
months
Revenue 12 3 0 25% N/A
Division
Total/Gross 12,604 5933 962 49.70%*
7

THE CHIEF JUSTICE’S ANNUAL STATISTICS REPORT 2017
ON THE SUPREME COURT
METHODOLOGY
Guaranteeing the reliability and validity of the data used to produce the periodic statistics
reports for the Jamaican Courts is of utmost importance as we seek to produce a data driven
enterprise for policy making and operational decisions. As a result, a robust and verifiable
system of data production has been created in both the Parish Courts and the Supreme Court.
At the Supreme Court, each Division has a set of data entry officers whose daily responsibility is
to enter data on new cases and as necessary update all case activity and events as the matters
traverse the courts. Such updates are done electronically using the Judicial Enhancement
Management Software (JEMS) software which has been evolved to cater for a wider range of
data capture and reporting needs. In all Divisions, live court data is also recorded in JEMS from
inside court by the Clerks. In order to assure the integrity of the data that is entered in JEMS,
data validators are specially assigned to scrutinize case files on a daily basis to ensure
consistency with the electronic data and adequacy of data capture.
Once all data for the periods of interest are entered in the JEMS software and the necessary
checks and balances completed, the data is then migrated to an excel friendly platform, from
where it is extracted, the statistical data processed and reports generated. Statistical reports
are generated for each of the three Terms which constitutes the operating year for the
Supreme Court, as well as for the summer period for the Civil Registries. These reports
culminate with an Annual Report. Such reports are published on the website of the Supreme
Court however interim data required by stakeholders may be requested through the office of
the Chief Justice.
8

THE CHIEF JUSTICE’S ANNUAL STATISTICS REPORT 2017
ON THE SUPREME COURT
CHAPTER 1.0: HIGH COURT CIVIL DIVISION
Chart 1.0: New case summary for 2017
Total number of civil cases for 2017 = 4396
The chart above provides summary of some the number of cases filed in the High Court Civil
Division (HCV) for 2017. A total of 4396 new HCV cases filed in the year, the largest proportion
of which, 1403 or 31.92% were filed during the Michaelmas Term. The vacation period with 479
new cases or 10.90% of the total expectedly accounted for the lowest proportion while the
Hilary Term with 1213 or 27.59% and the Easter Term with 1301 or 29.60% rounds off the
count.
9
THE CHIEF JUSTICE’S ANNUAL STATISTICS REPORT 2017
ON THE SUPREME COURT
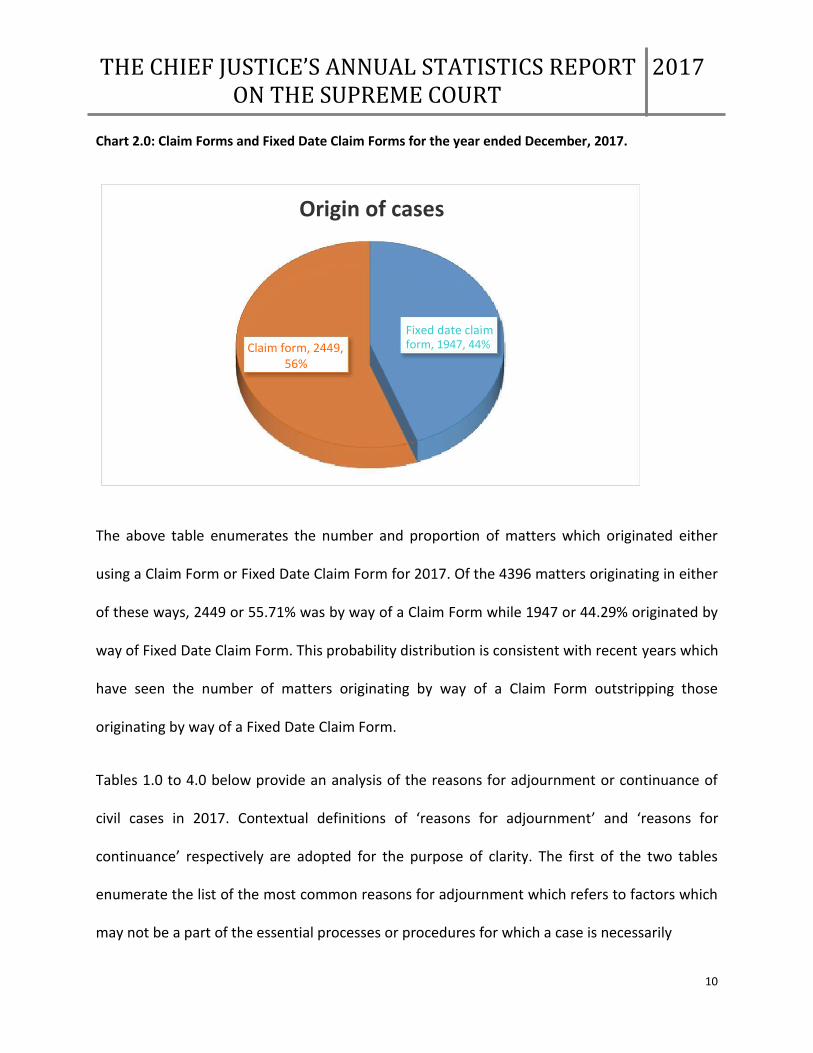
Chart 2.0: Claim Forms and Fixed Date Claim Forms for the year ended December, 2017.
Origin of cases
Claim form, 2449,
56%
Fixed date claim form, 1947, 44%
The above table enumerates the number and proportion of matters which originated either
using a Claim Form or Fixed Date Claim Form for 2017. Of the 4396 matters originating in either
of these ways, 2449 or 55.71% was by way of a Claim Form while 1947 or 44.29% originated by
way of Fixed Date Claim Form. This probability distribution is consistent with recent years which
have seen the number of matters originating by way of a Claim Form outstripping those
originating by way of a Fixed Date Claim Form.
Tables 1.0 to 4.0 below provide an analysis of the reasons for adjournment or continuance of
civil cases in 2017. Contextual definitions of reasons for adjournment and reasons for
continuance respectively are adopted for the purpose of clarity. The first of the two tables
enumerate the list of the most common reasons for adjournment which refers to factors which
may not be a part of the essential processes or procedures for which a case is necessarily
10

THE CHIEF JUSTICE’S ANNUAL STATISTICS REPORT 2017
ON THE SUPREME COURT
delayed. The second table lists what may be considered as the main reasons for adjournment
due to continuance . Such reasons are defined as those which are intrinsic to the normal
progression of a case towards disposition and are therefore largely unavoidable. There were a
combined total of 4195 incidences of adjournments whether for continuance or avoidable
reasons in the High Court Civil (HCV) Division during 2017.
Table 1.0: Top 14 reasons for adjournment for year ended December, 2017.
Reasons for adjournment Frequency Percentage
File not found 713 16.22
No parties appearing 552 12.56
Claimant s documents not served or short served 384 8.74
For comments from NEPA to be complied with 282 6.41
(Restrictive covenant)
Claimant to file documents 274 6.23
Claimant s attorney absent 159 3.62
Claimant not available 145 3.30
Defendant not available 114 2.59
Wrongly listed 103 2.34
Defendant s attorney absent 97 1.41
Medical certificate outstanding 62 1.25
11

THE CHIEF JUSTICE’S ANNUAL STATISTICS REPORT 2017
ON THE SUPREME COURT
Matter left off the court list 55 1.14
Matter not reached 50 1.25
Judge/Courtroom unavailable 43 0.98
For Social Enquiry Report 42 0.96
Total number of adjournments/continuance = 4195
The above table summarizes the top ten reasons for adjournment for the year ended
December, 2017 using the contextual definition outlined above. It is seen that the three
dominant reasons for adjournment were files not found with 713 or 16.22% of all events of
adjournments/continuance, no parties appearing with 552 or 12.56% and claimant s documents
not served or short served with 384 or 8.74%. Adjournments for comments from NEPA with 282
or 6.41% and claimant to file documents rounds off the top five reasons for adjournment in the
High Court Civil Division for 2017. The reasons for adjournment enumerated above, accounts
for approximately 70% of the total reasons for case adjournment/continuance in 2017. It is
evident that a significant proportion of the total adjournments were due to factors related to
the lack of readiness or preparedness of case files and cases themselves and the absenteeism of
parties and attorneys for court. Many of the reasons for adjournment strongly suggest
weaknesses in case management and scheduling practices as a significant proportion of the
reasons for adjournments/continuance are directly a result of factors which could be classified
as avoidable.
12

THE CHIEF JUSTICE’S ANNUAL STATISTICS REPORT 2017
ON THE SUPREME COURT
Specific, targeted interventions may also be necessary to stem the high incidence of particular
reasons for adjournment. For example, the acutely high incidence of files not found (accounting
for 16% of the total adjournments) as well as matters left off the court list and matters wrongly
listed can be addressed by strengthening internal validation processes. Bolstering the existing
system of logging files in and out to individuals who use them at the various stages along the
case flow continuum could be a source of enhancing the accountability and transparency of the
file movement process and stemming the current worrying tide of files not being located in
time for court. Furthermore, the electronic availability of copies of the files should be utilized in
case of such eventualities and as such the management of the readiness of files for court must
be improved. Adjournments resulting from the absenteeism of attorneys, claimants and
defendants collectively remain a source of concern, accounting for roughly 8% of the total
adjournments. Redressing these weaknesses require constant dialogue and improvements in
cooperation with the Bar Association as well as more robust internal policy mechanisms. Such
internal policy mechanisms could include the implementation of a sequencing mechanism
where repeated attorney absenteeism for particular cases result in the new court dates for
such cases be placed in a queue behind other matters which are progressing on schedule. It is
of interest that there were only 43 incidences of matters adjourned as a result of the
unavailability of a courtroom or judge in the entire 2017, accounting directly for just less than
1% of the total number of High Court Civil adjournments throughout the year.
13

THE CHIEF JUSTICE’S ANNUAL STATISTICS REPORT 2017
ON THE SUPREME COURT
The apparent need to strengthen case management processes, reinforced by the large monthly
case load, suggests that there may be a need to examine the engagement of additional Case
Progression Officers in the HCV Division.
Table 2.0: Frequent reasons for continuance for the year ended December, 2017.
Reasons for continuance Frequency Percentage
Part heard 259 5.89
Pending settlement 83 1.89
Pending outcome of another application 42 0.96
Total number of adjournments/continuance = 4195
The above table summarizes the most common reasons why cases in the HCV Division were
delayed for continuance throughout 2017. It is seen that this list is led by matters part heard
with 259 or 9.9% of the total list of reasons for adjournment/continuance. This is followed by
pending settlements with 42 or 0.96% and adjournments pending the outcome of another
application with 42 or 0.96% of the total adjournments.
The below table enumerates the leading reasons for delay in a matter which may not always be
strictly an adjournment or continuance , using the definitions outlined above. In other words,
these reasons could be either for adjournment or continuance depending on the stage and
circumstances of occurrence on the case flow continuum.
14

THE CHIEF JUSTICE’S ANNUAL STATISTICS REPORT 2017
ON THE SUPREME COURT
Table 3.0: Frequent reasons for adjournment/continuance for the year ended December, 2017
Reasons for continuance Frequency Percentage
Parties having discussion with a view to settlement 193 4.39
Medical report outstanding 62 1.41
Total number of adjournment/continuance = 4195
It is seen above that parties having discussions with a view to settlement with 193 incidences or
4.39% of the total and medical reports outstanding with 62 or 1.41% of the total, accounts for
the dominant share of the reasons for adjournment/continuance which falls in this category.
Table 4.0: Trial matters for the year ended December, 2017
Trial matters Frequency Percentage
Petition for winding up 13 0.37
Court Trials 1487 42.33
Motion Hearing 120 3.41
Assessment of Damages 1450 41.28
Trial in Chambers 443 12.61
Total trial matters 3513 100
The above table shows the breakdown of the progression of HCV pre-trial and trial matters for
2017. There were 3513 combined occurrence of trial hearings in 2017. Of these 3513
occurrences, Court Trials led with 1487 or 38.93% of the total. This was followed by Assessment
of Damages with 1450 or 41.28% of the total while Trails in Chamber with 443 or 12.61% of the
matters ranks next. Motion Hearings with 3.41% and Petition for winding up with 0.37% rounds
off the frequency distribution.
15

THE CHIEF JUSTICE’S ANNUAL STATISTICS REPORT 2017
ON THE SUPREME COURT
Table 5.0 Trial/hearing date certainty for the year ended December, 2017.
Trial/hearing Trial/hearing dates Trial/hearing date
dates set adjourned (excluding certainty
adjournments for
continuance)
11,415 3684 67.73%
The date scheduling certainty of a court provides a good metric of the extent to which dates
which are scheduled for either hearing or trial are adhered to and therefore speaks to the
reliability of the case scheduling process. Of the 11,415 matters scheduled for either trail or
pre-trial hearings, both in Court and in Chamber, 4195 were adjourned. However, in order to
get a pure measurement of scheduling certainty it is necessary to deduct those reasons for
adjournment which are for some form of continuance or settlement. Hence for example the
counts for adjournments due to part heard and issues regarding pending settlement are
subtracted. The resulting trial/hearing date certainty figure of 67.73% suggests that there is a
roughly 68% probability that a date set for a matter to be heard or for trial, will proceed
without adjournment for reasons other than some form of continuance or settlement. This
result gives important insights into the extent to which judicial time is wasted by potentially
avoidable adjournments and suggests that strong interventions by way of improved case
management, scheduling and external stakeholder cooperation are vital to redressing these
deficiencies.
16

THE CHIEF JUSTICE’S ANNUAL STATISTICS REPORT 2017
ON THE SUPREME COURT
The ensuing analysis will go further into explaining where on the continuum of a matter
traversing the system are adjournments are most likely to occur. This will involve an analysis,
termed a break-out analysis which will examine the incidence of adjournments particularly at
Assessment of Damages and Case Management Conferences.
The below tables provide indices of scheduling efficiency in the Supreme Court by measuring
the number of days of matters being scheduled for assessment of damages and court trials
respectively compared to the number of available court days.
Table 6.0a: Index of scheduling efficiency for Assessment of Damages in the HCV Division for the year ended December, 2017
Number of available court Number of days’ worth of assessment Approximate ratio
days in 2017 of damages scheduled (for 1 court)
210 1450 7 days
An important indicator of the problems associated with the scheduling of HCV matters comes
from an assessment of the number of court days which were available in 2017, 210 all told and
the number of days worth of assessment of damages which were scheduled (a total of 1450). It
is shown that for every court day available, approximately 7 days worth of matters were
scheduled, creating a significant stress on the ability of the court to proceed without
adjournments. This evidence reinforces the idea that there needs to be a major revision of the
methods used to schedule matters for assessment court.
17

THE CHIEF JUSTICE’S ANNUAL STATISTICS REPORT 2017
ON THE SUPREME COURT
Table 6.0b: Index of scheduling efficiency for court trials in the HCV Division for the year ended December, 2017
Number of available court Number of days’ worth of court matters Approximate ratio
days in 2017 scheduled for court trial per court
210 703 3.35
Another important indicator of the problems associated with the scheduling of HCV matters
comes from an assessment of the number of court days which were available in the year, 210
all told and the number of days worth of court trials which were scheduled per court (a total of
703). It is shown that for every day available, roughly 3 days worth of matters were scheduled,
reinforcing the strain on the capacity of the court to proceed without adjournments. The
evidence again reaffirms the idea that there needs to be a major revision of the scheduling
mechanisms currently being employed. An increase in physical and human capital will be
needed to ensure that the court is able to adequately revisit its scheduling practices.
Table 7.0: Probability distribution of the incidence of adjournments/continuance for the year ended December, 2017
Type of Incidence Frequency Percentage (%)
Case Management Conference 369 8.79
Pre-Trial Review 194 4.62
Trial in court 89 2.12
Assessment of damages 1072 25.55
Judgment Summons Hearing 199 4.75
Applications 2272 54.17
Total 4195 100
18

THE CHIEF JUSTICE’S ANNUAL STATISTICS REPORT 2017
ON THE SUPREME COURT
The above table shows decisively that the vast majority of reasons for
adjournments/continuance are associated with Applications, accounting for 54.17% of the
total. Adjournments from Assessment of Damages and Case Management Conferences with
25.55% and 8.79% respectively of the total adjournments rank next. It is of interest that Trial in
Court accounts for only 2.12% of the adjournments which is an indication of a high trial/hearing
credibility ratio. The implication of these collective findings is that there needs to be significant
strengthening of the processes which impact on the readiness of matters to heard, thereby
reducing the incidence of adjournments. This is a reaffirmation of the possible targeted
interventions outlined earlier which could stem the incidence of adjournments.
The analysis below highlights the two of the major contributors to adjournments – Assessment
of Damages and Case Management Conferences and explores the magnitude of their
contribution, through an examination of trial/hearing date certainty for these matters.
Table 8.0: Hearing date certainty for Assessment of damages for the year ended December, 2017
Hearing dates Dates adjourned (excluding Hearing date certainty
set continuance)
1450 942 35.03
One area in which adjournments are aplenty is with respect to the Assessment of Damages
which accounts for 942 adjournments (excluding procedural adjournments) and has a low
hearing date credibility of 35.03%. This suggests that the probability that a matter that is set for
19

THE CHIEF JUSTICE’S ANNUAL STATISTICS REPORT 2017
ON THE SUPREME COURT
assessment will be heard without adjournment is just over 35% and implies that significant
strengthening of the scheduling process for Assessment of Damages is firmly required.
Table 9.0: Hearing date certainty for Case Management Conferences for the year ended December, 2017
Hearing dates Dates adjourned (excluding Hearing date certainty
set continuance)
1223 325 73.43
The hearing date certainty for Case Management Conferences is considerably higher than that
of Assessment of Damages, accounting for 325 adjournments and a trial certainty of 73.43%.
This suggests that there is only a roughly 2.5 in 10 chances that a matter scheduled for Case
Management Conferences will be adjourned. While this is not necessarily a cause for concern,
strengthening Case Management processes which contribute to the readiness of a matter for
hearing would contribute to bolstering the scheduling certainty of Case Management
Conferences. Case Management Conferences have a considerably higher hearing date certainty
than Assessment of Damages, partly because such matters are scheduled to be heard at specific
time intervals while assessments of damages are all scheduled for hearing on the same day. The
replication and strengthening of the scheduling methodology used for Case Management
Conferences could therefore assist in reducing the high probability of adjournment in the HCV
Division.
20

THE CHIEF JUSTICE’S ANNUAL STATISTICS REPORT 2017
ON THE SUPREME COURT
Table 10.0: Requisitions for the year ended December, 2017.
Action Frequency
Requisitions Issued 1234
Responses to requisitions 146
Requisition response rate 11.83
Requisitions per case file 0.28
In considering the efficiency with which civil matters flow through the court system, the
number of requisitions and the ratio of requisitions to case files is an important metric. In the
table above it is shown that there was a total of 1234 requisitions for the year. The ratio of
cases filed to requisition was calculated to be 1: 0.28 which suggests that for every 100 case
files there were 28 requisitions or roughly speaking an average of 3 requisitions per 10 HCV
case file. Interventions aimed at reducing this incidence of requisitions should positively impact
on the efficiency of the progression of cases towards disposition in the HCV Division. One such
intervention that has been implemented is the emailing of requisitions which should expedite
the rate at which the public responds, mirroring the incremental success seen since deploying a
similar approach in the Matrimonial Division.
Table 11.0: Judgments for the year ended December, 2017
Frequency Percentage
Judgments
Judgments (Trial in Court/Assessment of 298
32.57
damages)
Judgment on admission 67 7.32
Judgment in default of acknowledging service 456 49.84
Judgment in default of defense 94 10.27
Total Judgments 915 100
21

THE CHIEF JUSTICE’S ANNUAL STATISTICS REPORT 2017
ON THE SUPREME COURT
The above table provides a summary of the Judgments rendered throughout the life of HCV
cases in 2017. As seen, Judgments from trial in court or assessment of damages with 298 or
32.57% of total Judgments account for the largest proportion of the Judgments enumerated
above. This is followed by Judgments in default of acknowledging service with 456 or 49.84% of
the Judgments. The top three Judgments are rounded off by Judgments in default of defense
with 94 or 10.27% of the total. The top three Judgments in the period under examination were
also the top three in the previous reports produced.
Table 12.0: Chamber hearings for the year ended December, 2017.
Frequency Percentage (%)
Hearings
Oral Examination 26 0.29
Case Management Conference 1223 13.75
Pre-trial review 848 9.53
Applications (Various) 6355 71.46
Judgment summons hearing 441 4.96
Total 8893 100
The above table summarizes the incidence of different types of hearings for the year. It is seen
that the total number of hearings for the period was 8893. The highest proportions were
various applications with 6355 or 71.46% of the total number of hearings. The general
applications category speaks a non-exhaustive list of various types of applications which come
before the HCV Division. Case Management Conferences was a distant second with an
incidence of 1223 or 13.75% of the total number while Pre-trial reviews with 848 or 9.53% and
Judgment summons hearings with 441 or 4.96% rounds off the top five Chamber Hearings for
the year.
22
THE CHIEF JUSTICE’S ANNUAL STATISTICS REPORT 2017
ON THE SUPREME COURT
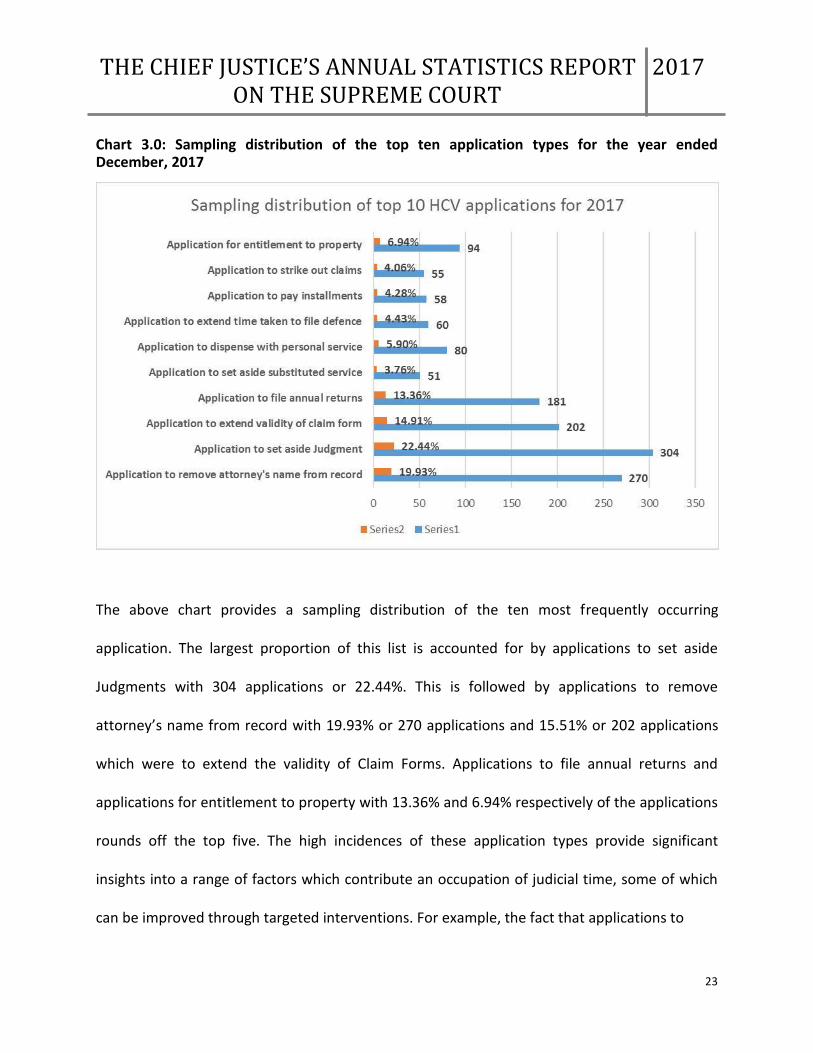
Chart 3.0: Sampling distribution of the top ten application types for the year ended December, 2017
The above chart provides a sampling distribution of the ten most frequently occurring
application. The largest proportion of this list is accounted for by applications to set aside
Judgments with 304 applications or 22.44%. This is followed by applications to remove
attorney s name from record with 19.93% or 270 applications and 15.51% or 202 applications
which were to extend the validity of Claim Forms. Applications to file annual returns and
applications for entitlement to property with 13.36% and 6.94% respectively of the applications
rounds off the top five. The high incidences of these application types provide significant
insights into a range of factors which contribute an occupation of judicial time, some of which
can be improved through targeted interventions. For example, the fact that applications to
23

THE CHIEF JUSTICE’S ANNUAL STATISTICS REPORT 2017
ON THE SUPREME COURT
extend the validity of a Claim Form ranks so prominently among the types of applications filed
provide a clear suggestion that a system of tracking such applications could be established in
which reminders are provided to the relevant parties well in advance of the expiration date.
The need to bolster the case progression management processes is thus reinforced.
Table 13: Methods of disposition for the year ended December, 2017
Methods of Disposition Frequency Percent
Application Granted 465 43.7
Application Refused 6 .6
Attorney Admitted to Bar 7* .7
Claim Form expire 11 1.0
Consent Judgment 45 4.2
Consent Order 7 .7
Damages Assessed 86 8.1
Dismissed 4 .4
Judgment 44 4.1
Matter Completed at 10 .9
Mediation
Matter Withdrawn 6 .6
Med - Settled Fully in
3 .3
Mediation
Notice of Discontinuance
77 7.2
noted
Order (Chamber Court) 2 .2
Settled 201 18.9
Settlement Order 2 .2
Struck Out 41 3.9
Transfer to Commercial 10 .9
Written Judgment Delivered 36 3.4
Total 1063 100.0
*Figure incomplete due to procedural factors.
24

THE CHIEF JUSTICE’S ANNUAL STATISTICS REPORT 2017
ON THE SUPREME COURT
An understanding of the distribution of the methods of case disposal is an essential metric to
gaining insights into the efficiency of case handling in the courts and in operational planning. It
is seen that there were 1063 HCV cases disposed in 2017, of which the largest proportion, 465
or 43.70% were as a result of Applications Granted. This was followed by Matters Settled with
201 or 18.90% of the total. Damages Assessed with 86 or 8.10%, notices of discontinuance with
77 or 7.20% and consent Judgment with 45 or 4.20% of the total dispositions rounds off the top
five methods of disposition in 2017. Of note is that only a small minority of the methods of
disposal, 10 or 0.90% were completed by way of Mediation. Of similar note is that only 6 or
0.6% of the total number of disposals were as a result of Matters Withdrawn. Of the 1063 HCV
cases disposed of in 2017, only 100 or 9.41% were from cases originating in that year. This
represents a mere 2.27% of the new cases filed in this Division in 2017.
Chart 4.0: Sampling distribution of the dominant types of orders for the year ended
December, 2017.
25

THE CHIEF JUSTICE’S ANNUAL STATISTICS REPORT 2017
ON THE SUPREME COURT
The above table summarizes the top seven orders made in the HCV Division for the year ended
December, 2017. There were a total of 3210 orders made in the year. Of these top seven
orders, 31% were Orders on Seizure of Goods for Sale while 22% were Orders at Case
Management and 19% were Orders at Pre-Trial. Orders on Restrictive Covenants with 10% of
the sample rounds the top four orders in 2017.
Table 14.0: Time to disposition for the year ended December, 2017
Time to disposition (in month)
Number of observations 1063
Mean 32.9078
Median 23.0000
Mode 13.00
Std. Deviation 29.69764
Skewness 2.022
Minimum 3.00
Maximum 223.00
One of the most important metrics which can be used in assessing the efficiency of case handling is
the time to disposition. An understanding of this measure is crucial to influencing both internal and
external policies, necessary to bolster the timely delivery of justice. The above table provides crucial
insights on the average time to disposition of matters in the HCV Division for 2017. The 1063 cases
disposed in the year reveal an estimated average time to disposition was 32.47 months or 2.74
years, a result that is broadly consistent with previous analyses. The oldest matter disposed in the
year was 223 months old or 18.60 years old while the lowest time that a matter took to disposition
was roughly 3 months. The most frequently occurring time to disposition in the period was 13
months or just over a year. The standard deviation of roughly
26

THE CHIEF JUSTICE’S ANNUAL STATISTICS REPORT 2017
ON THE SUPREME COURT
30 months or 2.75 years is indication of a wide variation of the durations to disposal around the
mean and suggests that the times to disposition vary widely. The positive skewness of roughly 2
however indicates that there were more disposals which took lower time to disposition than
those which took higher than the average time. The margin of error of these estimates is plus
or minus 2 months or 0.17 years.
Table 15.0: Breakdown of time to disposition for the year ended December, 2017
Time Intervals Frequency Percent
0 – 12 243 22.9
13 - 24 388 36.5
25 - 36 104 9.8
37 - 47 103 9.7
48 & over 225 21.2
Total 1063 100.0
The above table provides a more detailed breakdown of the average time to disposition. It is
seen that of the 387 matters disposed in the year, the largest proportion, 388 or 36.50% took
between 13 and 24 months (just over 1 year to 2 years) to be disposed. This was followed by
243 matters or roughly 23% which were disposed of in under a year. 225 or 21.2% of the
matters took 4 or more years to be disposed while it was almost equal for the age categories 25
– 36 and 37 – 47, with 9.8 and 9.7% respectively of the matters disposed falling in those
intervals. It is of note that just over 59% of the matters disposed of in 2017 took two years or
less, compared to roughly 41% which took more than two years during the year. Deficiencies
including frequent adjournments, low trial/hearing certainty and the attendant problems with
date scheduling certainty as well as the incidence of requisitions may be among the factors
27

THE CHIEF JUSTICE’S ANNUAL STATISTICS REPORT 2017
ON THE SUPREME COURT
accounting for the majority of matters taking more than two years to be disposed. The margin
of error of these estimates is plus or minus 2 months or 0.17 years. The fact that the modal
time to disposition is 13 months is very instructive as it suggests that the current average time
to disposition of well over 2 years can be significantly reduced. This outcome is largely the
result of continuous targeted intervention spearheaded by an HCV Scheduling Committee
which is styled as the Express Chamber Resource. Under this intervention the matters which are
most likely to be disposed within the shortest time were assigned to a specific court and
expedited accordingly. It is expected that the average time to disposition for the High Court
Civil Division will reach a steady state of roughly 2 years over the next two years however the
improvements could be more impressive if a more robust and systematic approach is taken to
Case Management. An augmented, Cross-Divisional approach of this nature could greatly assist
in promoting a timelier movement of cases towards disposition.
The below chart provides a breakdown of the number of cases disposed of, by Term in the High
Court Civil Division throughout 2017.
28

THE CHIEF JUSTICE’S ANNUAL STATISTICS REPORT 2017
ON THE SUPREME COURT
Chart 4.0: Dispositions by Term in the HCV Division for 2017
The above chart shows that the largest proportion of the 1063 cases disposed of in the HCV
Division during 2017, took place in the Easter Term, accounting for 479 or 45% of the total. This
was followed by 387 or 36% in the Hilary Term and the Michaelmas Term which accounted for
191 or 18% of the disposals. Only 6 cases or 1% of the total were disposed of in the Vacation
Period.
Table 16.0: Clearance rate for the year ended December, 2017.
Cases filed Cases disposed Case clearance rate
4396 1063* 24.18%
*100 or 9.41% of the cases disposed, originated in 2017.
The case clearance rate is an important metric which complements the case disposal rate. It is
calculated as the ratio of incoming active cases to disposed cases. A ratio of 100% is an
29

THE CHIEF JUSTICE’S ANNUAL STATISTICS REPORT 2017
ON THE SUPREME COURT
indication that for every new case filed, a pre-existing case is also disposed. It is an important
measure in placing the time to disposition of matters into context and to providing a deeper
understanding the case carriage burden that is being faced by the different Divisions. The ratio
of 24.18% seen above for the HCV Division is an indication that for every 100 new cases filed in
the period under examination, there were roughly 24 cases disposed. This clearance rate is
broadly consistent with the findings from the previous periods of analysis. The result could
suggest that either the case disposal rate in the Division is too low to sustain a continuously
increasing burden and / or that the Division s capability to handle its case load is under-
resourced. It is important to point out that at least some of the disposed cases used in this
computation may have originated in previous periods as the clearance rate is meant to be a
productivity ratio.
30

THE CHIEF JUSTICE’S ANNUAL STATISTICS REPORT 2017
ON THE SUPREME COURT
CHAPTER 2.0: MATRIMONIAL DIVISION
The ensuing analysis examines the various measures of the efficiency of case handling in
the Matrimonial Division for the year ended December, 2017.
Chart 5.0: Distribution of cases filed in the Matrimonial Division in 2017
Total number of new cases filed in the Matrimonial Division (N) = 3539
A total of 3539 new Matrimonial cases were filed in 2017. The above chart shows that largest
proportion of Matrimonial cases filed in 2017 occurred during the Easter Term, accounting
for 1127 or 32%. This was followed by the Hilary Term with 1068 or 30% of the new cases
filed, while the Michaelmas Term and Vacation Period respectively accounts for 27% and 11%
respectively of the total.
31

THE CHIEF JUSTICE’S ANNUAL STATISTICS REPORT 2017
ON THE SUPREME COURT
Table 17.0: Petitions filed for the year ended December, 2017.
Type of petition Frequency Percentage
Amended petition for dissolution of 2067 42.35
Marriage
Petition for dissolution of marriage 3585 57.65
Total Petitions filed 5652 100
Number of amendments per petition 0.58
The above table summarizes Petitions filed in 2017. It is shown that a total of 5652 Petitions
were filed, 3585 or 57.65% were Petitions for dissolution of marriage, compared to 2067 or
42.35% which were amended Petitions for dissolution of marriage. The analysis further
suggests that the ratio of Petitions to Amended Petitions is 0.58 or in other words for every 100
Petitions for dissolution of marriage there is roughly 58 amended Petitions for dissolution of
marriage in 2017. The high incidence of amendments constitutes a source of delays in the
timely and efficient delivery of dispositions. Greater public sensitization may be necessary to
stem this tide. An initiative commenced in 2017 involving the window postings form completion
models at the point of filing a petition and to email such models along with requisitions sent
out on a daily basis is so far yielding incremental success. The Michaelmas Term saw a notable
reduction in the ratio of Petitions to Amended Petitions when compared to the previous Terms,
a possible testament to the improvement seen so far. The effectiveness of these and other
interventions will be continuously monitored in 2018.
32

THE CHIEF JUSTICE’S ANNUAL STATISTICS REPORT 2017
ON THE SUPREME COURT
Table 18.0: Decrees Nisi and Decrees Absolute filed for the year ended December, 2017
Case Status Frequency
Decree Absolute 5435
Decree Nisi for dissolution of marriage 6433
Decree Nisi for nullity of marriage 17
Total 11885
Ratio of Nisi to Absolute 1.18
It is seen in the above table that for every 100 Decrees Absolute filed there were roughly 118
Decrees Nisi filed in 2017. One caveat to note is that Decrees Nisi and Decrees Absolute would
have originated at various times outside of this specific period of analysis. The data here
suggests that there were 18% more Decrees Nisi than Decrees Absolute filed in 2017. The stage
of a matter at which requisitions have mostly occurred has an impact on the production rate for
both Decrees Nisi and Decrees Absolute Granted.
A sampling distribution of the incidence of requisitions at the key stages of a matrimonial
matter s lifecycle; Petition, Decrees Nisi and Decrees Absolute are shown in the chart below.
33
THE CHIEF JUSTICE’S ANNUAL STATISTICS REPORT 2017
ON THE SUPREME COURT
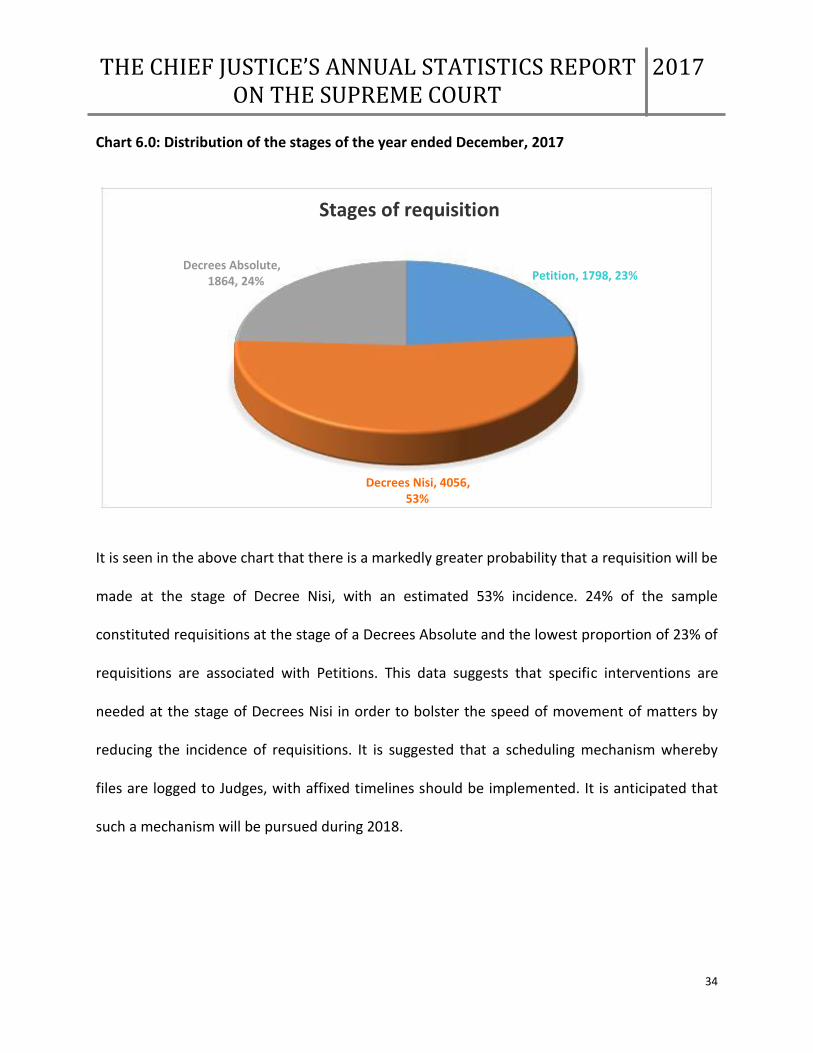
Chart 6.0: Distribution of the stages of the year ended December, 2017
Stages of requisition
Decrees Absolute, Petition, 1798, 23%
1864, 24%
Decrees Nisi, 4056,
53%
It is seen in the above chart that there is a markedly greater probability that a requisition will be
made at the stage of Decree Nisi, with an estimated 53% incidence. 24% of the sample
constituted requisitions at the stage of a Decrees Absolute and the lowest proportion of 23% of
requisitions are associated with Petitions. This data suggests that specific interventions are
needed at the stage of Decrees Nisi in order to bolster the speed of movement of matters by
reducing the incidence of requisitions. It is suggested that a scheduling mechanism whereby
files are logged to Judges, with affixed timelines should be implemented. It is anticipated that
such a mechanism will be pursued during 2018.
34

THE CHIEF JUSTICE’S ANNUAL STATISTICS REPORT 2017
ON THE SUPREME COURT
Table 19.0: Methods of Disposals for the year ended December, 2017.
Method of disposition Frequency Percentage (%)
Decree Absolute Granted 2617 99.8
Notice of Discontinuance
4 .2
noted
Total 2621 100.0
The above table reveals that a total of 2621 Matrimonial matters were disposed of in 2017,
99.80% of which were by the method of Decrees Absolute Granted and the remaining 0.20% by
way of Notices of Discontinuance. It is of note that only 137 or 5.24% of the cases disposed of in
2017, actually originated in that year. This represents a mere 3.87% of the new cases filed in
2017 however this should not necessary be interpreted as an adverse finding as a typical
Matrimonial case will take 6-7 months to be disposed, under ideal conditions.
35

THE CHIEF JUSTICE’S ANNUAL STATISTICS REPORT 2017
ON THE SUPREME COURT
Chart 7.0: Distribution of cases disposed in the year ended December, 2017.
Cases disposed in each term
Michaelmas Term,
304, 12%
Vacation Period,
390, 15%
Hilary Term, 797,
30%
Easter Term, 1130,
43%
It is seen in the above chart that of the 2621 cases which were disposed, the largest proportion
took place in the Easter Term which accounted for 43% of the disposals. The Hilary Term with
30% of the disposals was next while the Vacation Period with 15% and the Michaelmas Term
with 12% accounts for the lower shares.
Table 20.0: Requisitions summary for the year ended December, 2017.
Action Frequency
Requisitions 7718
Number of requisitions per 100 files 215
Number of responses to requisitions 2485
Requisition response rate 32.20%
The incidence of requisitions is especially important in assessing the efficiency with which
Matrimonial matters move through the court system. A total of 7718 requisitions were filed in
36

THE CHIEF JUSTICE’S ANNUAL STATISTICS REPORT 2017
ON THE SUPREME COURT
2017producing a ratio of cases filed to requisitions of 2.15. This suggests that for every 100
cases filed there were 215 requisitions, a considerably high rate by any measure. There were
2485 responses to requisitions made in the period, a response rate of roughly 32.20. The rate of
response has shown progressive improvements throughout 2017, largely as a result of
instituting of a robust system of daily emailing of requisitions. Continuous improvements in this
rate are anticipated in 2018 which will contribute appreciably to enhancing the case disposal
rate.
Table 21.0: Time efficiency measures for the year ended December, 2017
Efficiency measures Days
Average days between Petitions filed and 31
Decrees Nisi filed
Average days between requisitions issued 28
and Decrees Nisi filed
Average days between Decrees Nisi filed 63.25
and Decrees Absolute filed
Average days between requisitions issued 24
and Decrees Absolute filed
The above table provides vital insights into the efficiency with which cases move along the
continuum from initiation to disposition. It is shown that it took on average 31 days or 1 month
between the filing of a petition and the filing of a Decree Nisi in 2017. The data further suggests
that the estimated average number of days between the issuing of a final requisition and the
filing of a Decree Absolute is 24 days. It takes on average four days longer, 28 days, between
issuing a requisition and filing a Decree Nisi. The time interval between the filing of a Decree
Nisi and a Decree Absolute is approximately 63.25 days or just about 2 months. Based on this
37

THE CHIEF JUSTICE’S ANNUAL STATISTICS REPORT 2017
ON THE SUPREME COURT
data, if it was to be assumed that a randomly selected Matrimonial matter follows the average
time from Petition to disposition, with a maximum of 1 requisition at each stage and a
maximum delay of 30 days each between the filing and granting of Decrees Nisi and Decrees
Absolute respectively, then it is conceivable that a Matrimonial matter could be disposed of
within 6 to 7 months. It must therefore be extrapolated that the incidence of multiple
requisitions for some files is likely a key source of delays in the Matrimonial Division and thus
attributable to the long time taken to dispose of matters. The data shown here provides
important benchmarks for measuring the effectiveness of interventions aimed at bolstering
disposal rates through a reduction in the incidence of requisitions and a general shortening of
the timeline between each stage on the data flow continuum in the Matrimonial Division.
Table 22.0: Court/Chamber matters for the year ended December, 2017
Action Frequency Percentage (%)
Applications 396 48.55
Expedited Applications 80 10.53
Case Management Conference 150 19.74
Motion Hearing 94 12.37
Pre-trial Hearing 4 0.53
Trial 36 4.74
Total 760 100
The above table shows the distribution of the types of matters brought before the Court for the
period under examination. The data shows that a total of 760 Matrimonial matters were
brought before either Court or Chamber of which the largest proportion, 396 or 48.55% were
applications followed by 150 or 19.74% which were Case Management Conference matters.
The event with the third highest incidence in this category is motion hearings which accounts
38

THE CHIEF JUSTICE’S ANNUAL STATISTICS REPORT 2017
ON THE SUPREME COURT
for 94 or 12.37% of the total. Expedited Applications with 80 or 10.53% and trial matters with
36 or 4.74% of the total rounds off the top five events enumerated in this category. The
probability distributions of the events in this table are broadly consistent with that which was
observed throughout year.
Table 23.0: Top four types of applications in the year ended December, 2017
Application type Frequency Percentage (%)
Application for custody and /or maintenance 108 29.27
Application for substituted service 51 12.88
Application to dispense with personal service 48 12.12
Application for entitlement of property 34 9.21
Further analysis of the types of application brought before the Court suggests that applications
for custody and/or maintenance with 108 or 29.27% accounted for the largest share. This is
followed by applications for substituted service with 51 or 12.88% of the total applications,
while applications to dispense with personal service with 48 or 12.12% and applications for
entitlement to property with 34 or 9.21% which round off the top four types of applications.
These top four application types account for roughly 61% of all application in the Matrimonial
Division in 2017. These four application types were also in the top five in the previous periods
of analysis.
39

THE CHIEF JUSTICE’S ANNUAL STATISTICS REPORT 2017
ON THE SUPREME COURT
Table 24.0: Top five reasons for adjournment for the year ended December, 2017.
Reasons for Adjournment Frequency Percentage (%)
File not found 60 29.56
Matter left off court list 31 15.27
No parties appearing 17 8.37
Matter left off court list 10 4.93
Claimant to file documents 10 4.93
Total number of adjournments (N) = 203
As with all Divisions of the Supreme Court, an important metric of court efficiency are the
reasons for adjournment of court matters. The data suggests that there were a total of 203
adjournments in the Matrimonial Division in 2017. The largest proportion of these
adjournments was due to files not found, accounting for 29.56% of total adjournments.
Interestingly, this was also the leading reason for adjournment for the High Court Civil Division,
reflecting a problem which requires urgent operational intervention. Matters left off the courts
list with 31 or 15.27% and no parties appearing with 17 or 8.37% of the reasons for
adjournments rounds off the top three. Matters left off the court list and claimant to file
documents, each with 10 or 4.93% rank next. All five reasons for adjournment enumerated
above also featured prominently in the list for the High Court Civil Division, contributing to non-
productive use of judicial time and slower rates of case disposal. Strengthening the case
management apparatus and the key tributaries of contact with external stakeholders/parties
will be vital to reducing these incidences.
40

THE CHIEF JUSTICE’S ANNUAL STATISTICS REPORT 2017
ON THE SUPREME COURT
Table 25.0: Trial/hearing date certainty for the year ended December, 2017
Court/Chamber Date adjourned Date scheduling
dates set certainty
760 194 74.47%
The possible over-scheduling of cases is affirmed by the above table which computes the date
scheduling certainty of the Matrimonial Division. It is seen that of the 760 matters scheduled in
Court or Chamber in 2017, 194 were adjourned for reasons other than intrinsic procedural
factors. This produces a reasonably high 74.47% date scheduling certainty and suggests that for
the year, the Matrimonial Division did fairly well with the management of its court schedule.
For every 100 matters scheduled is the approximate number that would be expected to
proceed without adjournment is 74.
Table 26.0: Time to disposition for the year ended December, 2017
Descriptive Statistics (in month)
Number of observations 2621
Mean 26.9783
Median 20.0000
Mode 13.00
Std. Deviation 23.15663
Skewness 3.602
Std. Error of Skewness .048
Minimum 6.00
Maximum 319.00
The above table summarizes the time disposition for the year ended December, 2017. It is seen
that of the 2621 matters disposed of in the year, the estimated average time to disposition was
41

THE CHIEF JUSTICE’S ANNUAL STATISTICS REPORT 2017
ON THE SUPREME COURT
roughly 27 months or 2 and a quarter year. This is quite an interesting result as the average
time to disposition for the Terms individually was also exactly the same and may therefore be
indicative of a decisive trend. The estimate of the most frequently occurring time to disposition
was however 20 months while the estimated maximum time to disposition for matters
disposed of in the Term was 319 months or roughly 27 years and the estimated minimum was 6
months. The scores had a standard deviation of roughly 23 months which indicates a wide
variation in the distribution of the times to disposition in the period. The skewness measure
returns a large positive figure of approximately 3.60 which strongly indicates that a markedly
larger proportion of the times to disposition were lower than the mean. The margin of error of
these estimates is plus or minus 2 months or 0.17 years.
Table 27.0: Breakdown of times to disposition for the year ended December, 2017.
Time Interval (in months) Frequency Percentage (%)
0 – 12 551 21.0
13 – 24 1056 40.3
25 – 36 463 17.7
37 – 47 220 8.4
48 & over 331 12.6
Total 2621 100.0
The above table provides a more detailed breakdown of the estimated times to disposition for
Matrimonial matters in 2017. It is seen that of the 2621 matters disposed of in 2017, the largest
proportion, 1056 or roughly 40% were disposed of in a time of between 13 and 24 months. The
second most disposals occurred within the time frame 0 - 12 months, accounting for 551 or
21% of the total. Taken together this result suggests that 1607 or 61.31% of Matrimonial
42

THE CHIEF JUSTICE’S ANNUAL STATISTICS REPORT 2017
ON THE SUPREME COURT
matters disposed of in the period were done in two years or less from the time of initiation.
1014 or roughly 36.8% of all Matrimonial matters disposed of in the year took more than two
years to be disposed. It is of note that 331 or 12.6% of the cases disposed in the Matrimonial
Division in 2017 took 4 or more years. The estimates however clearly suggest that a decidedly
larger proportion of matters which were disposed of during the year took two years or less.
With a strengthening of case management to reduce delays on the continuum as matters
transit from initiation to disposition, this statistic could improve sharply. The margin of error of
these estimates is plus or minus 2 months or 0.17 years.
Chart 8.0: Distribution of Matrimonial cases disposed in 2017
The above chart shows the distribution of cases disposed in the major periods in 2017. It is seen
that the Easter Term decidedly accounted for the largest proportion of cases disposed with
1130 or 43%. This was followed by the Hilary Term with 797 or 30% of the disposals. The
43

THE CHIEF JUSTICE’S ANNUAL STATISTICS REPORT 2017
ON THE SUPREME COURT
Vacation Period with 12% of the disposals and the Michaelmas Term with 304 or 12% rounds
off the distribution.
Table 28.0: Case clearance rate for the year ended December, 2017.
Cases filed Cases disposed Case clearance rate
3539 2621* 74.06%
*137 or 3.87% of the 2621 cases disposed of, originated in 2017.
The above table shows that there were 3539 new cases filed in the year. This produces a case
clearance rate of 74.06%, suggesting that for every 100 new cases; roughly 74 were disposed in
the year. An important caveat is that the cases disposed of did not necessarily originate in the
stated year. This measure gives a good impression of the true case load that is being carried by
the Matrimonial Division, the data clearly suggesting that there were more in-coming than
outgoing cases. This could be a symptom of both an increase in the incidence of new cases filed
in the Division in 2017 and a moderate rate of disposal of existing matters in the system. Strong
support for the Deputy Registrar of the Matrimonial Division is required to ensure that the
vetting process for files is expedited to promote a timely progression of files to the Judges.
Again, efforts to reduce the incidence of requisitions through greater public education and
continuous efforts to email requisitions to attorneys in a timely manner should over time
contribute markedly to enhancing the rate of disposition in the Division. These collective efforts
could potentially make major cuts into the time to disposition for Matrimonial matters. It is
44

THE CHIEF JUSTICE’S ANNUAL STATISTICS REPORT 2017
ON THE SUPREME COURT
important to point out that at least some of the disposed cases used in this computation may
have originated in previous periods at the clearance rate is meant to be a ratio.
45

THE CHIEF JUSTICE’S ANNUAL STATISTICS REPORT 2017
ON THE SUPREME COURT
CHAPTER 3.0: PROBATE DIVISION
This section turns to the analysis of the progression of matters in the Probate Division for the
year ended December, 2017.
A total of 2853 new Probate Cases were filed in the year ended December, 2017. The below
table provides a distribution of the Oaths and Supplemental Oaths which were file in the year.
Table 29.0: Oaths for the year ended December, 2017.
Oaths Frequency Percentage (%)
Supplemental Oaths 1895 41.05
Oaths 2721 48.95
Total Oaths 4616 100
Ratio 0.70
The above table suggests there were a total of 4616 Oaths filed in the period under
examination, of which 2721 or 48.95% were initial Oaths filed, compared to 1895 which were
Supplemental Oaths. The ratio of Oaths to Supplemental Oaths is 0.70 which suggests that for
every 100 Oaths there were 70 Supplemental Oaths filed during the year, a statistic which has
potentially adverse implications for the speed of disposition of matters.
46

THE CHIEF JUSTICE’S ANNUAL STATISTICS REPORT 2017
ON THE SUPREME COURT
Chart 9.0: Distribution of the type of matters as of the year ended December, 2017.
The above table provides a summary of the types of matters filed in the Probate Division in
2017. It is shown that 56% of the matters were Testate and 44% Intestate. This probability
distribution is not dissimilar to recent years.
Table 30.0: Action sequence for the year ended December, 2017
Action Status Frequency
Recommendations 1619
*Granted 2430
Grant Signed 983
Ratio of Recommendations to Granted Applications 1.45
Ratio of Recommendations to Grants signed 0.61
* Some of these relate to cases originating before 2017
The rate at which recommendations are made based on applications and at which these
recommendations are granted and signed may be affected by several variables, both
exogenous and endogenous to the Supreme Court. The measures therefore provide an
47

THE CHIEF JUSTICE’S ANNUAL STATISTICS REPORT 2017
ON THE SUPREME COURT
important indication of the efficiency with which Probate applications are disposed of. It is
shown in the above table that during 2017, 1619 recommendations while 2430 were granted.
This implies that for every 100 recommendations made there were 145 applications granted,
with the important caveat being that some of these Granted Applications were for
recommendations prior to 2017. This measure may therefore at best be seen as a clearance
rate. As for the proportion of recommendations made to Grants Signed, the ratio is far less
impressive as the figure of 0.61 suggests that for every 100 recommendations made there were
61 Grants Signed. This metric suggests a moderate rate of transition between
recommendations and Grants Signed and therefore it may be necessary to explore mechanisms
to bolster the rate of transition and efficiency on the continuum from recommendations to
Applications Granted to Grants Signed.
Table 31.0: Cases filed and requisitions summary for the year ended December, 2017
Action Status Frequency
New cases filed 2853
Requisitions Issued 2171
Number of responses to requisitions 1848
Number of requisitions per case file 0.76
Requisitions response rate 0.65
Average days between final 26
requisition filed and Grant of
Probate/Administration
The number of requisitions made, the length of time that it takes for requisitions to be retuned
and the time to disposition after issuing requisitions, is important to understanding the
efficiency of the flow of matters in the Probate Division. It is seen that for the year ended
December, 2017, there was a total of 1848 requisitions issued while 2853 new matters were
48

THE CHIEF JUSTICE’S ANNUAL STATISTICS REPORT 2017
ON THE SUPREME COURT
filed, representing a ratio of 0.76 requisitions per case file during the year. This means that for
every 100 cases there were 76 requisitions. This high incidence of requisitions is undoubtedly
contributing adversely to the time to disposition of cases filed in the Probate Division. The rate
of responses to requisitions issued in 2017 was 0.65, suggesting that for every 100 requisitions
issues there were 65 responses. Further analysis suggests that the average time from the
issuing of final requisitions to the Grant of Probate was 26 days.
Chart 10.0: Distribution of cases filed in 2017
The above table provides a breakdown of the cases filed in 2017 in the Probate Division. It is
seen that the largest proportion of new cases filed were in the Michaelmas and Hilary Terms
with 33% and 27% respectively of the 2853 new cases for the year. The Easter Term follows
49

THE CHIEF JUSTICE’S ANNUAL STATISTICS REPORT 2017
ON THE SUPREME COURT
closely behind the Hilary Term with roughly 27% as well while the Vacation Period with 13%
accounts for the lowest proportion.
Table 32.0: Methods of Disposal for the year ended December, 2017.
Methods of disposition Frequency Percent (%)
Granted (Resealed) 58 3.8
Instrument Issued 235 15.3
L/A Granted 593 38.6
Notice of Discontinuance 7 .5
Probate Granted 641 41.8
Struck Out 1 .1
Total 1535 100.0
The methods of disposal for the Probate Division for the year ended December, 2017 are
summarized in the above table. It is shown that of the 1535 matters disposed of in the period,
the largest proportion, 641 or 41.80% was a result of Probates Granted. This is followed by
Letters of Administration with 593 or 38.60% of the total number of disposals and Instruments
issued rounds off the top three methods with 235 or 15.30% of the total.
Table 33.0: Dominant reasons for adjournment of Probate matters for the year ended December, 2017.
Reason Frequency Percentage (%)
File not found 13 25.00
No parties appearing 12 23.08
Claimant to file documents 8 15.38
Claimant s documents not serve on defendant 5 9.62
Claimant s attorney absent 3 5.77
Total number of adjournments= 52
50

THE CHIEF JUSTICE’S ANNUAL STATISTICS REPORT 2017
ON THE SUPREME COURT
The top five reasons for adjournment for Probate matters that went to court in 2017 are
summarized in the above table above. It is shown that of the adjournments in the period, the
largest proportion was for the reasons of file not found, and no parties appearing, accounting
for 13 or 25% and 12 or 23.08% respectively of the total reasons for adjournment in 2017.
Claimant to file documents rounds off the top three reasons for adjournment with 8 or 15.38%
of the total. It is of concern that files not found again features among the top reasons for
adjournment, having topped the list for both the HCV and Matrimonial Divisions.
Table 34.0: Applications for the year ended December, 2017.
Nature of Applications Frequency Percentage
Applications 166 73.78
Express Applications 59 26.22
Total 225 100.0
Ratio of express applications - 0.36
to applications
The above table provides a basic summary of the types of court applications made in 2017 and
shows that there were a total of 225 Court Applications in the period, of which 166 or 73.78%
were standard applications while the remaining 59 or 26.22% were express applications. For
every 10 applications made during the year, there were roughly 4 express applications.
51

THE CHIEF JUSTICE’S ANNUAL STATISTICS REPORT 2017
ON THE SUPREME COURT
Table 35.0: Top four types of applications for the year ended December, 2017
Application Frequency Percentage (%)
Application to prove 54 24.0
copy will
Application for 17 7.56
directions
Application for court 14 6.22
orders
Application to remove 12 5.33
Executor
The above provides a deeper analysis of the types of applications made during the period under
examination. It is shown that applications to prove copy will account for the largest proportion
of applications with 54 or 24.0% of the total, followed by applications for directions with 17 or
7.56 % of the total number of applications. The top four types of applications are rounded off
by applications for court orders with 14 or 6.22% of the total and applications to remove
executors with 12 or 5.33%.
Table 36.0: Trial/hearing date certainty for the year ended December, 2017
Court/Chamber Date adjourned Trial/Hearing date certainty
dates set
241 47 80.50%
The above table addresses the extent of adherence with dates set for Court/Chamber matters
in the Probate Division for the 2017. It is shown that there were 241 incidences of dates set
were scheduled for Chamber or Court, 47 of which were adjourned for reasons other than
continuance . This suggests a relatively strong trial/hearing date certainty ratio of 80.50%, an
52
THE CHIEF JUSTICE’S ANNUAL STATISTICS REPORT 2017
ON THE SUPREME COURT
indication that for 2017 there was a roughly 81% chance that a matter set for court would
proceed without adjournment for reasons other than continuance .
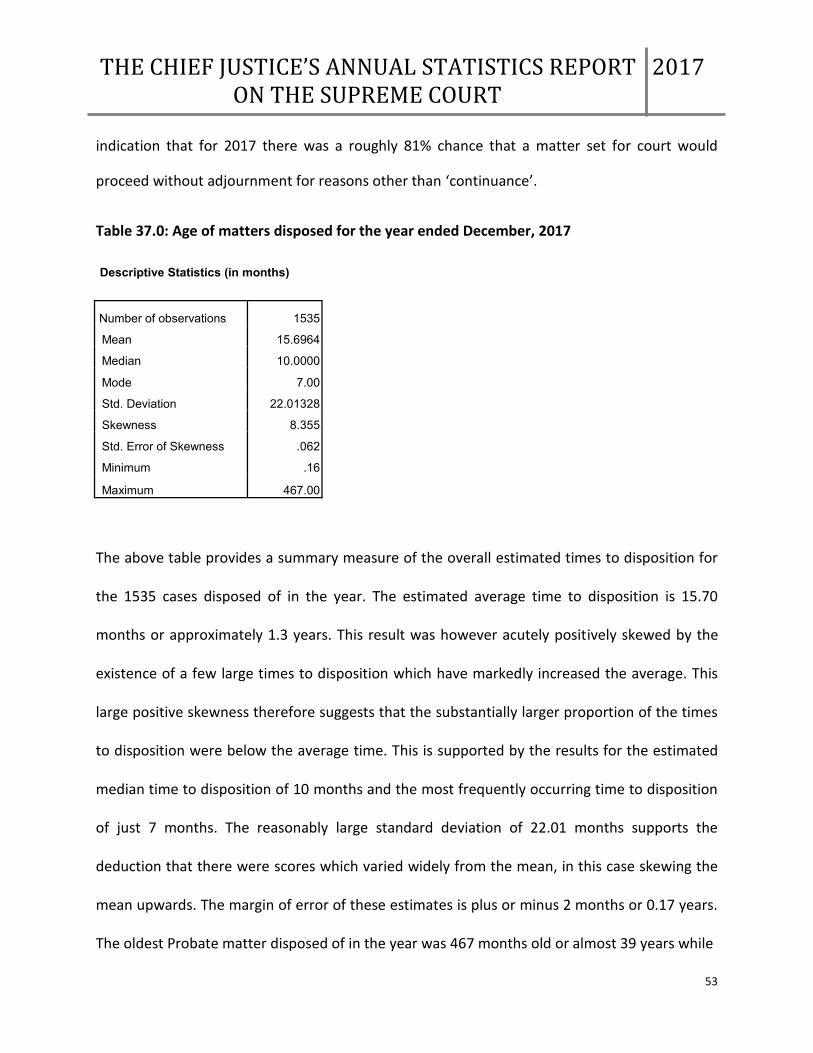
Table 37.0: Age of matters disposed for the year ended December, 2017
Descriptive Statistics (in months)
Number of observations 1535
Mean 15.6964
Median 10.0000
Mode 7.00
Std. Deviation 22.01328
Skewness 8.355
Std. Error of Skewness .062
Minimum .16
Maximum 467.00
The above table provides a summary measure of the overall estimated times to disposition for
the 1535 cases disposed of in the year. The estimated average time to disposition is 15.70
months or approximately 1.3 years. This result was however acutely positively skewed by the
existence of a few large times to disposition which have markedly increased the average. This
large positive skewness therefore suggests that the substantially larger proportion of the times
to disposition were below the average time. This is supported by the results for the estimated
median time to disposition of 10 months and the most frequently occurring time to disposition
of just 7 months. The reasonably large standard deviation of 22.01 months supports the
deduction that there were scores which varied widely from the mean, in this case skewing the
mean upwards. The margin of error of these estimates is plus or minus 2 months or 0.17 years.
The oldest Probate matter disposed of in the year was 467 months old or almost 39 years while
53

THE CHIEF JUSTICE’S ANNUAL STATISTICS REPORT 2017
ON THE SUPREME COURT
there were a few matters which took just under a month to be disposed, representing the
lowest times to disposition in the year. Of the 1535 Probate cases disposed of in 2017, 537 or
35% originated in that year. This further represents 18.82% of new cases filed in 2017.
Table 38.0: Breakdown of times to disposition for the year ended December, 2017.
Time Interval Frequency Percentage (%)
0 -12 996 64.9
13 - 24 330 21.5
25 - 36 90 5.9
37 - 47 37 2.4
48 & over 82 5.3
Total 1535 100.0
The above table shows that of the 1535 Probate matters disposed of in the year, the majority,
996 or 64.90% were disposed of in 12 months or less, followed by 330 or 21.50% which were
disposed of within a time interval of 13 to 24 months. Taken together this data suggests that a
fairly impressive estimated 86.4% of Probate matters which were disposed of in 2017 took two
years or less. 5.9% each of the cases were disposed of in an estimated time frame of between
25 and 36 months, 2.4% took between 37 and 47 months and 5.3% took over an estimated time
of over 48 months or more than four years to be disposed. The margin of error of these
estimates is plus or minus 2 months or 0.17 years.
54

THE CHIEF JUSTICE’S ANNUAL STATISTICS REPORT 2017
ON THE SUPREME COURT
Chart 11.0: Distribution of cases disposed in 2017
The largest proportion of cases disposed in the Probate Division occurred in the Michaelmas
Term with 42% of the total while the Easter Term with 24% and the Vacation Period with 20%
of the disposals rank next. The Hilary Term accounted for the lowest proportion of the
disposals.
Table 39.0: Case clearance rate for the year ended December, 2017
Cases filed Cases disposed Case clearance rate
2853 *1535 54.43%
*537 of the 1535 cases disposed, originated in 2017.
Using the data on the number of cases filed and disposed of in the period under examination, a
case clearance rate of approximately 54% is derived. This suggests that for every 100 cases filed
55

THE CHIEF JUSTICE’S ANNUAL STATISTICS REPORT 2017
ON THE SUPREME COURT
and active in the period, 54 were disposed, a result which indicates that there were more files
coming in than going out in the year. Targeted interventions are needed to stem this imbalance
between the rates of incoming and outgoing cases, thus improving the case clearance rate. It is
important to emphasize that some of the disposed cases used in this computation originated
prior to 2017 and thus the clearance is simply a productivity index.
56

THE CHIEF JUSTICE’S ANNUAL STATISTICS REPORT 2017
ON THE SUPREME COURT
CHAPTER 4.0: HOME CIRCUIT COURT
The analysis now turns to a look at the Home Circuit Court for 2017 in the Home Circuit Court.
Table 40.0: Distribution of the top ten charges brought for 2017.
Charge Frequency Percentage (%)
Murder 221 21.20
Sexual Intercourse with a person under 16 years old 189 18.16
Rape 159 15.30
Grievous sexual assault 58 5.60
Forcible abduction 40 3.80
Aiding and abetting rape 32 3.10
Wounding with intent 29 2.80
Buggery 24 2.30
Sexual touching 23 2.20
Leadership in a criminal organization 21 2.00
Total 796 76.54
Total number of charges brought (N) = 1041
The above table summarizes the distribution of top ten charges associated with cases brought
in 2017. There were 624 new cases filed at the Supreme Court during the year, representing a
total of 1041 charges, a ratio of roughly 17 charges for every 10 cases. It is shown that of these
1041 charges the largest proportion, 221 or 21.20% were murder matters. This is followed by
charges of sexual intercourse with a person under 16 years old with 189 or 18.16% of the total,
while rape with 159 or 15.30%, grievous sexual assault with 58 or 5.60% and forcible abduction
with 40 or 3.80% rounds off the top five charges entered in the Home Circuit Court for 2017.
The top ten charges account for 76.37% of the total charges brought in the Home Circuit Court
57

THE CHIEF JUSTICE’S ANNUAL STATISTICS REPORT 2017
ON THE SUPREME COURT
in 2017. It is of great interest that roughly 63% of the total number of charges brought in 2017
represents sexual related matters, a result which is consistent with the findings in 2016. A total
of 1129 criminal cases, which is the equivalent of 3454 charges, came to court in 2017,
including many aged cases which predate 2017, dating back to as far as 2002. The below chart
provides a breakdown of the number of criminal cases brought, by Term.
Chart 12.0: Criminal cases brought at the Supreme Court across Terms throughout 2017
The above chart shows that of the 624 new cases brought to the Supreme Court in 2017, the
majority, 254 or 41% occurred during the Hilary Term, followed by the Easter Term with 191
new cases or 30% and the Michaelmas Term with 179 or 29% of the new cases brought.
The ensuing analysis will highlight the common reasons for adjournment of matters throughout
2017. As with the analysis of adjournments for the High Court Civil Division (HCV), a distinction
58

THE CHIEF JUSTICE’S ANNUAL STATISTICS REPORT 2017
ON THE SUPREME COURT
will be made between those reasons classified under adjournments and continuance as
earlier defined as well as those which could be categorized under either, depending on the
stage of a matter.
Table 41.0: Top ten reasons for adjournment for the year ended December, 2017.
Reason for adjournment Frequency Percentage Stage of matter
Defense counsel absent 422
9.51 Trial
Plea and case management 118
2.66 Case Management
form not completed
For disclosure 101
2.28 Case Management
Accused not brought 97
2.19 Trial
Statement outstanding 91
2.05 Case Management
For investigating officer to
84
1.89 Case Management
attend
To take steps under section
55
1.24 Case Management
31D
Defense counsel involved in
50
1.13 Trial
another matter
Crown to take instruction 49 2.20 Trial
Forensic certificate
27
0.61
Case Management
outstanding
Total incidence of adjournments/continuance (N) =4438
The above table provides a summary of the top ten reasons for adjournment for 2017. It is
shown that there was a combined 4438 incidence of reasons for adjournment during the year,
with some matters having multiple adjournments. The highest proportion, 422 or 9.51% were
due to the absenteeism of defense counsel. This was followed by a notable 118 or 2.66% of the
total which were due to incomplete Plea and Case Management Forms and adjournments for
Disclosure with 101 or 2.28%. Adjournments due to the accused not brought with 97 or 2.19%
of total adjournments, adjournments due to statements outstanding with 91 or 2.05% and
59

THE CHIEF JUSTICE’S ANNUAL STATISTICS REPORT 2017
ON THE SUPREME COURT
adjournments for investigating officer to attend court with 84 or 1.89% were ranked fifth and
sixth respectively. Aside from the reasons for adjournment enumerated in the above table,
adjournments for the investigating officer to attend court, adjournments to take steps to
proceed under section 31D, those due to defense counsel s involvement in other matters, for
the crown to take instruction as well as due to outstanding forensic reports account for a
notable proportions of the total adjournments in 2017. The top 10 reasons for adjournment
listed above accounts for 25.76% of total incidences of adjournments/continuance for the year.
The nature of many of the adjournments enumerated above suggests that a more robust case
management system in which matters are not set for trial unless it is absolutely ready and in
which matters are allotted expected durations before the court, could be pursued. This can be
done with a view to enhancing the confidence in and adequacy of the Supreme Court s
scheduling process and also ultimately reduce incidence of adjournments and speed up the
disposition rates. The cooperation of important stakeholders such as the attorneys,
investigating officers and the crown are crucial to realizing the improvements needed.
Table 42.0: Top reasons for continuance for the year ended December, 2017
Reason for continuance Frequency Percentage (%) Stage of matter
For trial 1076 24.25 Trial
For Plea and Case Management 1000 22.53 Case Management
For bail application 231 5.21 Case Management
Total incidence of adjournments/continuance (N) =4438
It is seen in the above table that there were 1076 incidences of continuance for trial;
representing 24.25% of the total reasons, 1000 or 22.53% were for plea and case management
60

THE CHIEF JUSTICE’S ANNUAL STATISTICS REPORT 2017
ON THE SUPREME COURT
and 231 or 5.21% for bail application. These were the three leading reasons in this category,
together accounting for roughly 52% of the total reasons for adjournments/continuance.
Table 43.0: Other leading reasons for adjournment/continuance for the year ended December, 2017
Reasons for Frequency Percentage (%) Stage of matter
continuance/adjournments
To settle legal 245 5.52 Case
representation Management
Papers to be served 146 3.29 Case
Management
Assignment of legal aid 119 2.68 Case
Management
Total incidence of adjournments/continuance (N) =4438
Among the reasons for continuance/adjournment of a criminal case which could be either
procedural or avoidable depending on the stage of a matter and the specific circumstances are
those which are a result of the need to settle legal representation, accounting for 245 or 5.52%
of the total. This is followed by papers to be served with 146 or 3.29% and adjournments for
assignment of legal aid with 119 or 2.68% of the total.
Importantly, there was an average of roughly 7 adjournments per criminal case for 2017.
61

THE CHIEF JUSTICE’S ANNUAL STATISTICS REPORT 2017
ON THE SUPREME COURT
Chart 13.0: Trial and mention matters/dates set for the year ended December, 2017.
The above chart shows that there were a total 3447 dates set for ether Trial or Mention Court
in 2017, 2443 or 71% of which were dates set for Mention Court while 1004 or 29% represents
dates set for Trial. This produces a ratio of 1: 0.43 which suggests that for every 100 matters
mentioned there were 43 trial matters set down in the year. Further analysis suggests that each
case mentioned in court were mentioned on average of 2.43 times, which is another way of
saying that every 100 mention cases were mentioned 243 times. Similarly, for cases which were
set for Trial, there was a scheduling incidence of 1.04 times per case, which suggests that 104
trial dates were set for every 100 trial cases.
62

THE CHIEF JUSTICE’S ANNUAL STATISTICS REPORT 2017
ON THE SUPREME COURT
Table 44.0: Trial/hearing date certainty for the year ended December, 2017
Number of hearing/trial dates Number of adjournments Trial/hearing date certainty
set (excluding adjournments for
continuance)
3447 1874 54.37%
The date scheduling certainty for each Division of the Supreme Court is an important metric
which examines the extent to which dates which are set for either hearing or trial are adhered
to. A low result has implications for the capacity of the court to adequately estimate the length
duration of a matter, for the capacity of Court Rooms and Judges to absorb certain caseloads
and for the general system of scheduling. In the table above it is shown that of 3447 Court
dates scheduled in the period under study, 1874 were adjourned for reasons other than
continuity by way of a Trial or Plea and Case Management hearing. This suggests a scheduling
certainty rate of roughly 54.37% which is another way of saying that for every 100 criminal
matters scheduled for court, roughly 54 are able to proceed without adjournment for reasons
other than those procedural, for example for Trial, Bail Application and Plea and Case
Management. Though a modest result, sharp improvements were seen in the Michaelmas
Term, possibly partly on account of the Sentence Reduction Days mechanism and in spite of the
marked increase in committals from the Parish Courts. This modest date certainty is both
reflected and influenced by the high incidence of adjournments which are due to factors such
as the absenteeism of attorneys, witnesses and investigating officers. It creates a self-fulfilling
63

THE CHIEF JUSTICE’S ANNUAL STATISTICS REPORT 2017
ON THE SUPREME COURT
prophesy as the expectation that matters will be adjourned leads to actions which reinforces
negligent practices that contribute to it.
Table 45.0: Methods of case disposal for the year ended December, 2017
Method of disposition Frequency Percentage (%)
Accused Deceased 3 1.4
Formal Verdict of Not Guilty – 8 3.8
Discharged
Found Guilty 21 10.0
Guilty Plea 74 35.4
No Case Submission upheld 2 1.0
No Case to Answer, Discharged 3 1.4
No Evidence offered-discharged 28 13.4
No further evidence offered- 16 7.7
discharged
Nolle Proseque 25 12.0
Not Guilty – Discharged 21 10.0
Plead guilty to a lesser charge 2 1.0
Remitted to Parish Court 6 2.9
Total 209* 100.0
*This excludes bench warrants and conditional Nolle Proseque which were formerly treated as inactive but are now being
included in the disposal count and will thus be reflected in future reports.
The above table summarizes the methods of disposal for the cases disposed of during 2017. It is
shown that a total of 209 cases were disposed of in 2017. Guilty plea with 74 or 35.4% of the
total number of disposals accounted for the largest share of disposals for the year. Accounting
for the next highest proportion of total disposals was no evidence offered with 28 or 13.4% of
the total. Nolle Proseque with 25 or 12% of the disposal methods and not guilty outcomes and
guilty outcomes, each with 21 or 10% of the total rank next as the leading ways in which
64

THE CHIEF JUSTICE’S ANNUAL STATISTICS REPORT 2017
ON THE SUPREME COURT
criminal cases were disposed of in 2017. Of the 209 criminal cases disposed of in 2017, 86 or
41.14% originated during that year.
A crucial measure of efficiency in the criminal court is the conviction rate as displayed below.
Table 46.0: Overall criminal conviction rate for 2017
Total number of cases disposed Total number of guilty outcomes Conviction rate
209 95 45.45%
The above table shows that of the 209 criminal cases disposed of in 2017, 95 were as a result of
guilty outcomes, whether by way of a verdict or a plea. This represents a conviction rate of
45.45% which suggests that there is a roughly 46% probability that a matter could end in a
guilty outcome. This data can be further disaggregated so that the conviction rates for some of
the most frequently occurring offences are measured. In particular, the conviction rate on
murder charges and sexual offence charges are detailed below.
Table 47.0: Conviction rate for sexual offences cases for the year ended December 30, 2017.
Total number of cases concluded Total number of guilty outcomes Conviction rate
(i.e. guilty verdicts or guilty pleas)
218 103 47.25%
65

THE CHIEF JUSTICE’S ANNUAL STATISTICS REPORT 2017
ON THE SUPREME COURT
The above table shows that of the 218 sexual offence cases were concluded in 2017, 103 were
as a result of guilty outcomes, whether by way of a verdict or a plea. This represents a
conviction rate of roughly 47.25% which suggests a roughly 47% probability that a sexual
offence matter could end in a guilty outcome.
Table 48.0: Conviction rate for murder cases in the year ended December, 2017.
Total number of cases concluded Total number of guilty outcomes Conviction rate
(i.e. guilty verdict or guilty plea)
80 23 28.75%
The above table shows that of the 80 murder cases concluded in 2017, 23 of which were as a
result of guilty outcomes, whether by way of a verdict or a plea. This represents a conviction
rate of 29% which suggests a roughly 29% probability that a murder matter could end in a guilty
outcome.
Table 49.0: Top five charges disposed in the year ended December, 2017
Charge disposed Frequency Percentage (%)
Murder 161 36.40
Sexual Intercourse with a 76 17.2
person under 16 years old
Rape 36 8.10
Grievous sexual assault 19 4.30
Acquisition of criminal 16 3.60
property
Number of disposed charges (N) =442
66

THE CHIEF JUSTICE’S ANNUAL STATISTICS REPORT 2017
ON THE SUPREME COURT
The above data shows that of the 442 charges disposed of in the period under examination, the
largest proportion of which was murder charges, accounting for 161 disposals or 36.40. This
was followed by sexual intercourse with a person under 16 years old with 75 or 17.00% of the
total. Rape and grievous sexual assault comes next with 4.30% and 3.60% respectively.
Acquisition of criminal property with 16 or 3.60% of the total number of disposed charges in the
year, round off the top five. Murder and sexual offences are not only the dominant incoming
but also the dominant outgoing cases. It is of particular note that roughly 33% of cases disposed
of in 2017 were sex related while also accounting for roughly 63% of all incoming cases. As seen
earlier, sexual offences also demonstrated a conviction rate of roughly 47% in 2017. The
dominance of this offence in the criminal statistics strongly suggests that there needs to be
robust Case Management attention for these matters to support their timely disposition.
67

THE CHIEF JUSTICE’S ANNUAL STATISTICS REPORT 2017
ON THE SUPREME COURT
Table 50.0: Methods of disposition for dominant case types in the year ended December, 2017
Case type
Sexual
Intercourse
with a Person
Murder Rape under Sixteen
Method of Accused Deceased 1 1 0
disposition
1.3% 3.1% 0.0%
Formal Verdict of Not 5 2 0
Guilty – discharge
6.3% 6.3% 0.0%
Found Guilty
16 2 1
20.0% 6.3% 1.6%
Guilty Plea
7 4 49
8.8% 12.5% 80.3%
No Case Submission
2 0 0
upheld
2.5% 0.0% 0.0%
No Case to Answer, 3 0 0
Discharged
3.8% 0.0% 0.0%
No Evidence offered 16 5 2
discharged
20.0% 15.6% 3.3%
No further evidence offered
3 5 5
discharged
3.8% 15.6% 8.2%
Nolle Proseque
19 2 0
23.8% 6.3% 0.0%
Not Guilty - Discharged
6 10 4
7.5% 31.3% 6.6%
Plead guilty to a lesser
1 1 0
charge
1.3% 3.1% 0.0%
Remitted to Parish Court
1 0 0
1.3% 0.0% 0.0%
Total 80 32 61
100.0% 100.0% 100.0%
The above table summarizes the methods of disposal for the three criminal case types with the
highest incidence of dispositions in 2017. Starting with murder, it is seen that the largest
proportion of murder cases in the year were disposed by way of Nolle Proseque with 23.8% of
68

THE CHIEF JUSTICE’S ANNUAL STATISTICS REPORT 2017
ON THE SUPREME COURT
the disposals. This was followed by disposals by way of no evidence offered and guilty
verdicts, each accounting for 20% of murder cases disposed of in 2017, which rounds off the
top three methods of disposition for murder cases. As it relates to rape cases, the data shows
that not guilty outcomes accounts for the largest share of disposals with 31.3% while the
methods of no evidence offered and no further evidence offered accounts for the next
highest proportion of disposals, each with 15.60% of the disposals. As highlighted earlier, cases
of sexual intercourse with a person less than 16 years old accounts for the largest proportion of
both cases initiated and disposed of in 2017. The methods of disposition for these case types
are highly skewed with the overwhelming majority, 80.3% being disposed of by way of guilty
pleas. The next highest methods of disposition were no further evidence offered and not guilty
outcomes with 8.20% and 6.0% each.
It is interesting to explore whether there is a statistically significant difference in the methods
of disposition among the most frequently occurring criminal cases disposed in 2017. In order to
explore this, a chi-square test is administered, the results of which are shown in the table
below:
Table 51.0: Chi-square test of association between
methods of disposition and type of case.
Degrees of Probability
Statistical Test Value Freedom values
Pearson Chi-Square 124.662 22 .000
Likelihood Ratio 133.731 22 .000
N of Valid Cases 173
Level of significance = 0.05 or 5%
69

THE CHIEF JUSTICE’S ANNUAL STATISTICS REPORT 2017
ON THE SUPREME COURT
The results in the above table reveal that probability values of less than 5% which suggests that
there is a statistically significant difference between the methods of disposition for the most
frequently disposed cases. In other words, the methods of disposition vary significantly
depending on the case type.
Table 52.0: Time to disposition for cases disposed in the year ended December, 2017
Descriptive Statistics (in months)
Number of observations 209
Mean 28.3876
Median 13.0000
Mode 5.00
Std. Deviation 30.19596
Skewness 1.963
Std. Error of Skewness .168
Minimum 0.52
Maximum 153.00
The above table provides a descriptive summary of the time to disposition for criminal cases
disposed of in 2017. It is shown that the estimated average time to disposition for the cases
disposed of was approximately 28 months or 2 years and 4 months. This represents an
improvement when compared to recent years and is aided by the fact that roughly 41% of the
cases disposed of in 2017 originated in that year. The estimated minimum time to disposition
was 16 days and the estimated maximum was 153 months or almost 13 years. The positive
skewness of 1.963 indicates that there are at least a few large outlying values which pulled the
average time to disposition upwards. This is affirmed by the standard deviation of roughly 2.5
years, indicating a wide average variation of the individual scores around the mean.
70

THE CHIEF JUSTICE’S ANNUAL STATISTICS REPORT 2017
ON THE SUPREME COURT
Table 53.0: Breakdown of time to disposition of cases for the year ended December, 2017
Time Intervals Frequency Percentage (%)
0 -12 108 51.7
13-24 40 19.1
25-39 13 6.2
37-47 12 5.7
48 & over 36 17.2
Total 209 100.0
The above table provides a summary of the estimated time to disposition for the cases disposed
of during 2017. It is shown that the largest proportion of matters were disposed of in a year or
less of initiation, accounting for exactly 108 or 51.7% of all matters disposed. This is followed by
40 or 19.1% which were disposed of in 13 to 24 months and 36 or 17.2% of matters which took
4 or more years to be disposed. Cumulatively, almost 71% of the matters disposed of in the
period took two years or less while the remaining 29% took over two years to be disposed. The
relatively large proportion of matters taking two or more years to be disposed is cause for
concern and requires deliberate policy interventions, however it must be noted that there has
also been an improvement in the proportion of matters disposed on in two years or less.
71

THE CHIEF JUSTICE’S ANNUAL STATISTICS REPORT 2017
ON THE SUPREME COURT
The chart below provides a breakdown of the distribution of cases disposed by Term for 2017.
Chart 14.0: Cases disposed in each Term for the year ended December, 2017
The above chart shows that there wasn t a marked disparity in the number of cases disposed of
over the three Terms throughout 2017. It is seen that the largest proportion of 78 or 37% of the
209 cases disposed took place in the Easter Term. This is followed by 71 or 34% which were
disposed of in the Michaelmas Term and 60 or 29% which were disposed of during the Hilary
Term.
72

THE CHIEF JUSTICE’S ANNUAL STATISTICS REPORT 2017
ON THE SUPREME COURT
Table 54: Time to disposition for charges disposed (from case file date) in the year ended December, 2017
Descriptive statistics (in months)
Number of charges disposed 1041
Mean 30.59
Median 12.0000
Mode 10.00
Std. Deviation 27.9209
Skewness 2.00
Minimum .0.52
Maximum 153.00
The above table provides an affirmation of the results gleaned from the analysis of times to
disposition for charges, measuring from the case file date. The average time to disposition is
shown to be roughly 2 years and five months, slightly higher than the time to disposition for
criminal cases in the same period. The longest and shortest times to disposition of 13.5 years
and 16 days respectively for disposed charges were also the same as for the actual cases
disposed of in 2017.
Table 55: Time to disposition for charges disposed (from date of charge) for year ended December, 2017.
Descriptive Statistics (in months)
Number of charges disposed 1041
Mean 41.00
Median 38.00
Mode 35.00
Std. Deviation 34.2082
Skewness 0.263
Minimum 3.00
Maximum 160.00
73
THE CHIEF JUSTICE’S ANNUAL STATISTICS REPORT 2017
ON THE SUPREME COURT
The data summarized in the tables above suggests that there is a marked contrast between the
time to disposition from the case file date and the time to disposition from the time the
offences were committed. It is shown that the estimated average disposition time from the
date the offences were committed to the time the matters were disposed is 41 months or
almost three and a half years. This is over a year more than the average disposition time from a
case is filed to the date of disposition and implies that there might be deficiencies in the
investigative systems which leads to charges being filed or in the general process of transferring
files to the Supreme Court for trial. This result was similar to the findings from the analysis done
in 2016, in that the average time to disposition from the time offences was committed
markedly exceeded the average disposition time when calculated from the case file date. The
slight positive skewness of 0.263 suggests that a large proportion of the times to disposition
were concentrated around the average although proportionately more of these times were less
than the mean, indicating the existence of at least a few disposed cases which took
considerably higher than the average time. The minimum time to disposition from the date of
charge was estimated at three months while the maximum estimated figure was 160 months or
roughly thirteen and a third years. The margin of error of these estimates is 2 months or 0.17
days.
74

THE CHIEF JUSTICE’S ANNUAL STATISTICS REPORT 2017
ON THE SUPREME COURT
Table 56.0a: Breakdown of time to disposition by selected charges for the year
ended December, 2017.
Time interval by case type
Time Interval (in months)
0-12 13-24 25-36 37-47 48 & over
Case type Murder 18 13 10 6 33
22.2% 46.4% 66.7% 75.0% 80.5%
Rape 15 7 4 2 4
18.5% 25.0% 26.7% 25.0% 9.8%
Sexual Intercourse with 48 8 1 0 4
a Person under Sixteen 59.3% 28.6% 6.7% 0.0% 9.8%
Total 81 28 15 8 41
100.0% 100.0% 100.0% 100.0% 100.0%
The above table provides a summary of the length of time taken to dispose the four of the most
frequently occurring criminal charges in 2017. It is seen that of the three types of criminal cases
listed, sexual intercourse with a minor account for the largest share of cases disposed of in 12
months or less with 59.30% of the total. Murder and rape accounted for 22.20% and 18.50%
respectively of the total number of cases disposed of in this timeline. Of the listed criminal case
types which were disposed of in more than a year but less than two years, murder accounts for
the largest proportion with 46.4% while 28.6% and 25% respectively were accounted for by
sexual intercourse with a person under 16 and rape. Murder cases accounted for the
overwhelming share of disposed cases on this list which took over three years, accounting for
75% of those disposals which took between 3 and 4 years (not inclusive) and 80.5% of those
matters taking four or more years to be disposed. It is of note that 25% of cases which took 3-4
75

THE CHIEF JUSTICE’S ANNUAL STATISTICS REPORT 2017
ON THE SUPREME COURT
years (not inclusive) to be disposed were rape cases while 9.8% each of matters of sexual
intercourse with persons under 16 years old took four or more years to be disposed.
Table 36.0b: Breakdown of selected charges by time to disposition for the year ended
December, 2017.
Case type
Sexual Intercourse
with a Person
Murder Rape under Sixteen
Time Interval (in months) 0-12 18 15 48
22.5% 46.9% 78.7%
13-24 13 7 8
16.3% 21.9% 13.1%
25-36 10 4 1
12.5% 12.5% 1.6%
37-47 6 2 0
7.5% 6.3% 0.0%
48 & over 33 4 4
41.3% 12.5% 6.6%
Total 80 32 61
100.0% 100.0% 100.0%
The above tables detail the time taken to dispose of cases of murder, rape and sexual offences
with persons under 16 in 2017. It is seen that the largest proportion of murder cases disposed
took 4 or more years, accounting for 41.3% of the total while the next highest proportion of
murder cases disposed occurred within a year, responsible for 22.5%. A somewhat reverse
distribution was true of cases of rape and sexual intercourse with persons under 16 which saw
the largest proportion of disposed cases taking a year or less. In particular, 78.7% of cases of
sexual intercourse with a person under 16 and 46.9% of rape cases took a year or less to be
disposed. It is notable that although 6.6% of cases of sexual intercourse with a person under 16
76

THE CHIEF JUSTICE’S ANNUAL STATISTICS REPORT 2017
ON THE SUPREME COURT
took 4 or more years to be disposed, a cumulative percentage of 91.8% were disposed of in 2
years or less. Further, although 12.5% of rape cases took two years or less to be disposed,
roughly 69% were disposed of in two years or less. Evidently, of these three dominant offences,
murder cases take considerably more time to be disposed while cases of sexual intercourse
with a person under 16 years old took the least time.
Table 36.0c: Proportional breakdown of time to disposition by selected charge type for
the year ended December, 2017.
Charge Percentage of matters Percentage of matters
disposed of in 2 years or disposed of in more
Less than 2 years
Murder 38.80% 61.20%
Sexual intercourse 91.80% 9.20%
with a person
under 16 years old
Rape 68.80% 31.20%
The above table furthers the previous one by directly highlighting the relative lengths of time
that it takes for the most frequently occurring types of matters to be disposed. It is seen that
roughly 38.80% of murder charges disposed of in 2017 took 2 years and under, while 61.20%
took over two years to be disposed. It is again of note that an aggregate proportion of 41.3% of
murder cases disposed of in the year took 4 or more years to be disposed. As for sexual
offences with a person under 16 years old, 91.80% each took 2 years and under and 31.20%
took over two years to be disposed while 6.60% took 4 or more years to be disposed.
Approximately 69% of rape charges took 2 years and under to be disposed of in 2017 while
77
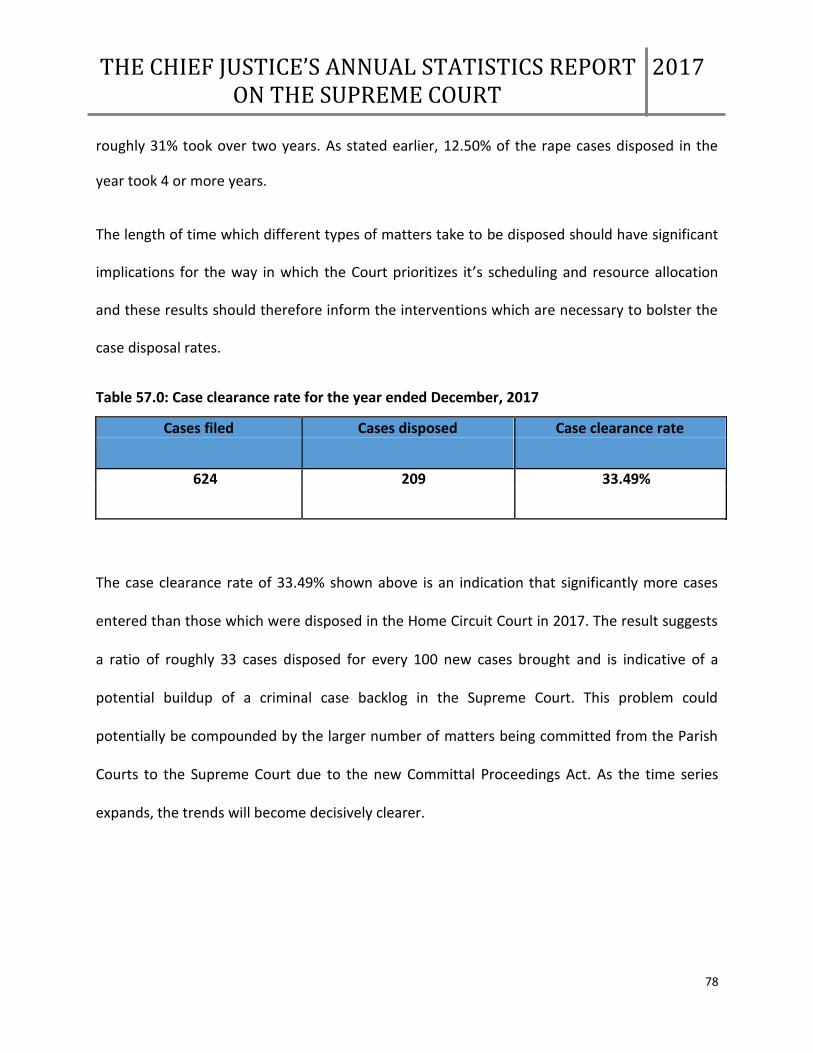
THE CHIEF JUSTICE’S ANNUAL STATISTICS REPORT 2017
ON THE SUPREME COURT
roughly 31% took over two years. As stated earlier, 12.50% of the rape cases disposed in the
year took 4 or more years.
The length of time which different types of matters take to be disposed should have significant
implications for the way in which the Court prioritizes it s scheduling and resource allocation
and these results should therefore inform the interventions which are necessary to bolster the
case disposal rates.
Table 57.0: Case clearance rate for the year ended December, 2017
Cases filed Cases disposed Case clearance rate
624 209 33.49%
The case clearance rate of 33.49% shown above is an indication that significantly more cases
entered than those which were disposed in the Home Circuit Court in 2017. The result suggests
a ratio of roughly 33 cases disposed for every 100 new cases brought and is indicative of a
potential buildup of a criminal case backlog in the Supreme Court. This problem could
potentially be compounded by the larger number of matters being committed from the Parish
Courts to the Supreme Court due to the new Committal Proceedings Act. As the time series
expands, the trends will become decisively clearer.
78

THE CHIEF JUSTICE’S ANNUAL STATISTICS REPORT 2017
ON THE SUPREME COURT
CHAPTER 5.0: HIGH COURT DIVISION OF THE GUN COURT
The ensuing analyses provide an overview of case activity in the Gun Court in the year ended
December, 2017. In particular, this section outlines data related to matters initiated, matters
disposed, adjournments and the distribution of trial and mention matters during the year.
Table 58.0: Top six charges filed in the year ended December, 2017.
Charges filed Frequency Percentage (%)
Illegal possession of 584 40.56
firearm
Illegal possession of 300 20.83
ammunition
Shooting with intent 184 12.78
Robbery with aggravation 115 7.99
Assault at Common Law 93 6.46
Wounding with intent 39 2.71
Total 1315
Total number of charges (N) = 1440
The above table provides a summary of the top five charges which were brought in the Gun
Court during 2017. It is seen that of the 1440 charges were filed in the period, the largest
proportion of which, 584 or 40.56% were for illegal possession of firearm, well ahead of the
next highest ranked charge of illegal possession of ammunition with a count of 300 or 20.83%
of the total. Shooting with intent is next with 184 or 12.78% while robbery with aggravation
with 115 or 7.99% and assault at common law with 93 or 6.46% rounds off the top five charges
filed in the Gun Court for 2017. The 1440 new charges entered in 2017 translates into 513 new
79

THE CHIEF JUSTICE’S ANNUAL STATISTICS REPORT 2017
ON THE SUPREME COURT
cases filed in the year which represents a ratio 1:2.81, suggesting that for every 100 cases
entered, there were 281 charges.
Chart 15.0: Distribution of cases filed in each Term/period in 2017.
The above chart provides a breakdown of the number and proportion of the 513 new cases
filed in the Gun Court in each Term/period in 2017. It is seen that the combined periods of the
Michaelmas Term and summer period with 177 or 34% of new cases filed, accounts for the
largest proportion. This is followed closely by 173 or roughly 34% which were filed in the Easter
Term and 163 or 32% which were filed in Hilary Term. As stated earlier, a combined 513 Gun
Court cases were disposed of in 2017.
80

THE CHIEF JUSTICE’S ANNUAL STATISTICS REPORT 2017
ON THE SUPREME COURT
Chart 16.0: Summary of selected case activity dates for the year ended December, 2017
The above chart provides a summary of key court events/dates in the Gun Court for 2017. It is
shown that there were 2194 trial dates set in the period, compared to 1515 mention dates. This
produces a ratio of roughly 1:1.45, indicating that for every 100 mention dates there were 145
trial dates set, a figure which intimates that there is either potentially a high transition rate
from mention to trial matters in the Gun Court or that trial matters have a much higher
incidence of adjournments, necessitating significantly more court dates on the continuum
towards disposal. The data also suggests that there were 185 part-heard trial dates set in Gun
Court for 2017 which indicates that for every 100 trial dates there were roughly 8 part-heard
trial dates. There were also 130 incidence of sentencing and 46 bail applications date set during
2017.
81
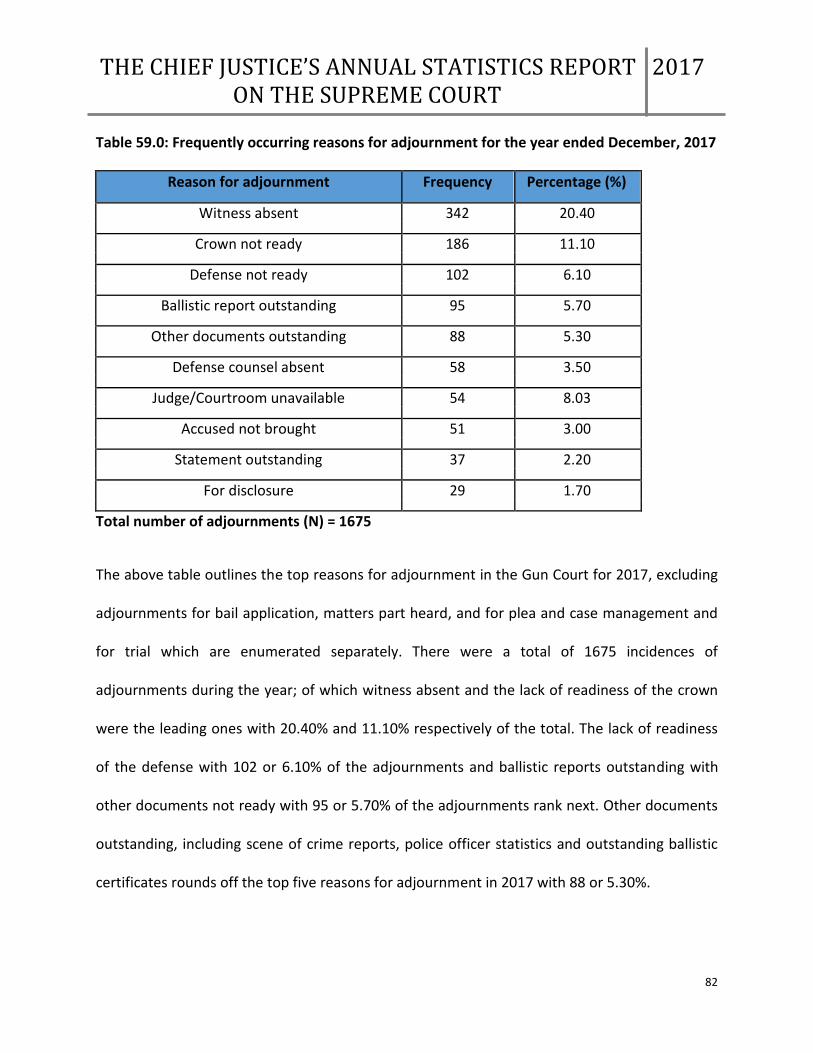
THE CHIEF JUSTICE’S ANNUAL STATISTICS REPORT 2017
ON THE SUPREME COURT
Table 59.0: Frequently occurring reasons for adjournment for the year ended December, 2017
Reason for adjournment Frequency Percentage (%)
Witness absent 342 20.40
Crown not ready 186 11.10
Defense not ready 102 6.10
Ballistic report outstanding 95 5.70
Other documents outstanding 88 5.30
Defense counsel absent 58 3.50
Judge/Courtroom unavailable 54 8.03
Accused not brought 51 3.00
Statement outstanding 37 2.20
For disclosure 29 1.70
Total number of adjournments (N) = 1675
The above table outlines the top reasons for adjournment in the Gun Court for 2017, excluding
adjournments for bail application, matters part heard, and for plea and case management and
for trial which are enumerated separately. There were a total of 1675 incidences of
adjournments during the year; of which witness absent and the lack of readiness of the crown
were the leading ones with 20.40% and 11.10% respectively of the total. The lack of readiness
of the defense with 102 or 6.10% of the adjournments and ballistic reports outstanding with
other documents not ready with 95 or 5.70% of the adjournments rank next. Other documents
outstanding, including scene of crime reports, police officer statistics and outstanding ballistic
certificates rounds off the top five reasons for adjournment in 2017 with 88 or 5.30%.
82

THE CHIEF JUSTICE’S ANNUAL STATISTICS REPORT 2017
ON THE SUPREME COURT
The absenteeism of defense attorneys, medical certificate outstanding, Judge/Courtroom
unavailable and accused not brought also featured prominently among the reasons for
adjournment in the Gun Court for 2017.
Table 60.0: Frequently occurring reasons for continuance for the year ended December, 2017.
Reason for continuance Frequency Percentage (%)
Part-heard 217 13.0
Bail application 59 3.50
Plea and case management 82 4.80
Total number of adjournments (N) = 1675
The above table provides a basic list of reasons for adjournment 2017 which are considered as
intrinsic to the natural progression of a case or are merely procedural and are therefore termed
as reasons for continuance. It is seen that during the year there were 217 part-heard matters
representing 13.0% of the total adjournments. There were also 59 bail applications while 82
matters were continued for Plea and Case Management.
83
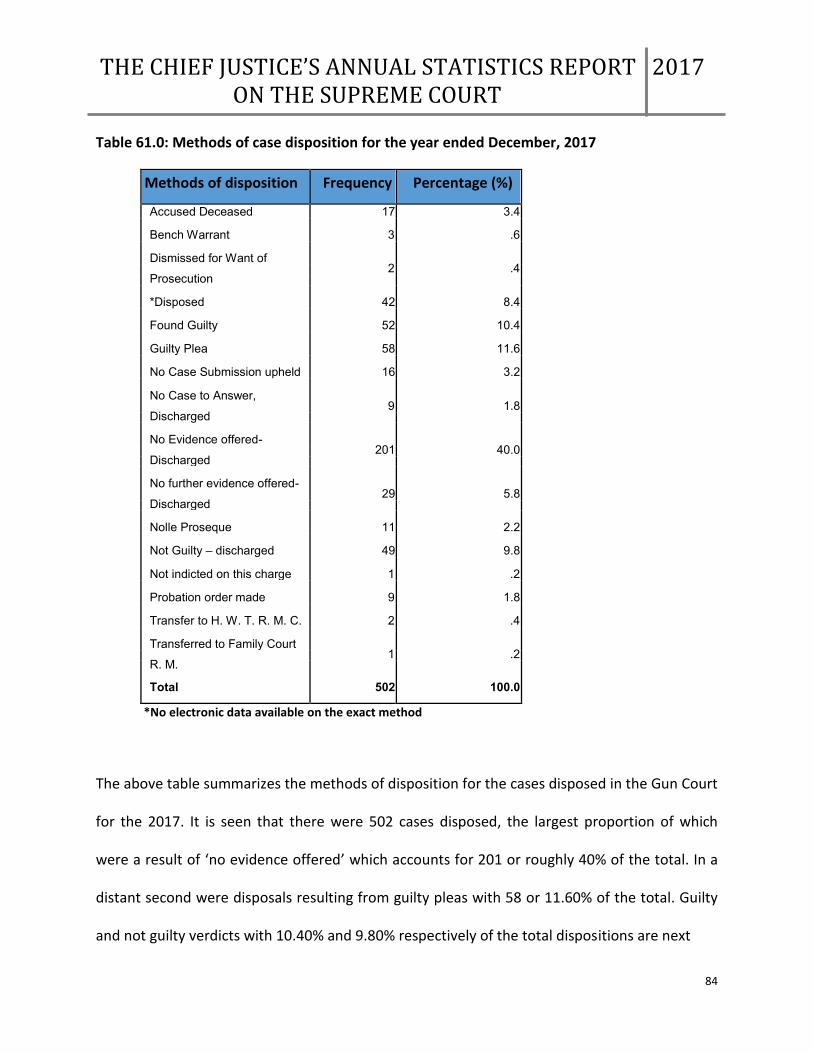
THE CHIEF JUSTICE’S ANNUAL STATISTICS REPORT 2017
ON THE SUPREME COURT
Table 61.0: Methods of case disposition for the year ended December, 2017
Methods of disposition Frequency Percentage (%)
Accused Deceased 17 3.4
Bench Warrant 3 .6
Dismissed for Want of 2 .4
Prosecution
*Disposed 42 8.4
Found Guilty 52 10.4
Guilty Plea 58 11.6
No Case Submission upheld 16 3.2
No Case to Answer, 9 1.8
Discharged
No Evidence offered- 201 40.0
Discharged
No further evidence offered- 29 5.8
Discharged
Nolle Proseque 11 2.2
Not Guilty – discharged 49 9.8
Not indicted on this charge 1 .2
Probation order made 9 1.8
Transfer to H. W. T. R. M. C. 2 .4
Transferred to Family Court 1 .2
R. M.
Total 502 100.0
*No electronic data available on the exact method
The above table summarizes the methods of disposition for the cases disposed in the Gun Court
for the 2017. It is seen that there were 502 cases disposed, the largest proportion of which
were a result of no evidence offered which accounts for 201 or roughly 40% of the total. In a
distant second were disposals resulting from guilty pleas with 58 or 11.60% of the total. Guilty
and not guilty verdicts with 10.40% and 9.80% respectively of the total dispositions are next
84

THE CHIEF JUSTICE’S ANNUAL STATISTICS REPORT 2017
ON THE SUPREME COURT
while accused deceased and no case submissions with 3.40% each of the total, rounds off the
top five methods. Of the 502 cases disposed of in the Gun Court in 2017, 86 or 17.13% were
cases originating in 2017. This further represents 16.76% of the new Gun Court cases filed in
2017.
Table 62.0: Conviction rate in the Gun Court for the year ended December, 2017
Number of cases disposed Number of Guilty outcomes Conviction rate
(i.e. guilty verdicts and guilty
pleas
502 110 21.91%
The overall conviction rate in the Gun Court is summarized in the above table. It is seen that of
the 502 cases which were disposed of in the year, 110 were a result of either a guilty plea or a
guilty verdict. This produces an overall conviction rate of 21.91% for Gun Court cases for 2017.
The following table delves further into the conviction rate, by the substantive matter.
Table 63.0: Conviction rate by substantive matter in the Gun Court for the year ended December, 2017.
Substantive matter Number of cases Number of Guilty Conviction rate
Disposed outcomes
Illegal possession of
fire arm 478 100 20.92%
Illegal possession of
ammunition 18 10 55.56%
It is seen in the above table that of the 478 disposed cases of illegal possession of a firearm, 100
were disposed by way of either a guilty verdict or a guilty plea, yielding a conviction rate of
85
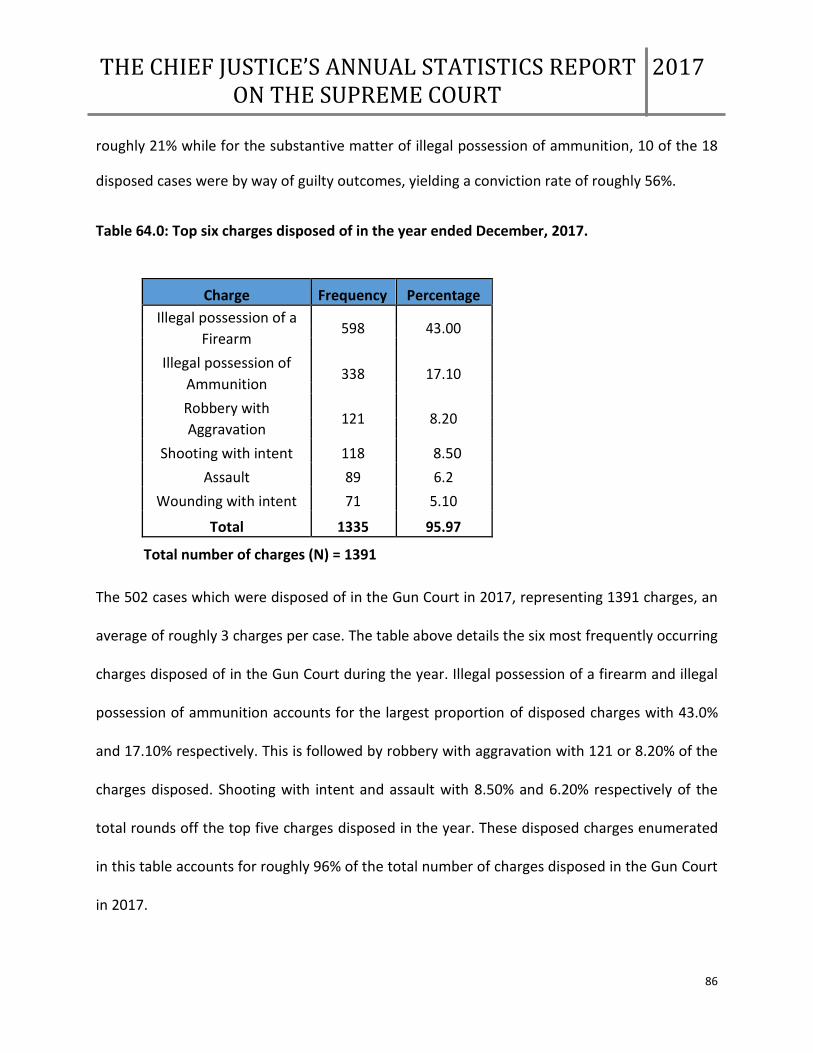
THE CHIEF JUSTICE’S ANNUAL STATISTICS REPORT 2017
ON THE SUPREME COURT
roughly 21% while for the substantive matter of illegal possession of ammunition, 10 of the 18
disposed cases were by way of guilty outcomes, yielding a conviction rate of roughly 56%.
Table 64.0: Top six charges disposed of in the year ended December, 2017.
Charge Frequency Percentage
Illegal possession of a
598 43.00
Firearm
Illegal possession of 338 17.10
Ammunition
Robbery with
121 8.20
Aggravation
Shooting with intent 118 8.50
Assault 89 6.2
Wounding with intent 71 5.10
Total 1335 95.97
Total number of charges (N) = 1391
The 502 cases which were disposed of in the Gun Court in 2017, representing 1391 charges, an
average of roughly 3 charges per case. The table above details the six most frequently occurring
charges disposed of in the Gun Court during the year. Illegal possession of a firearm and illegal
possession of ammunition accounts for the largest proportion of disposed charges with 43.0%
and 17.10% respectively. This is followed by robbery with aggravation with 121 or 8.20% of the
charges disposed. Shooting with intent and assault with 8.50% and 6.20% respectively of the
total rounds off the top five charges disposed in the year. These disposed charges enumerated
in this table accounts for roughly 96% of the total number of charges disposed in the Gun Court
in 2017.
86

THE CHIEF JUSTICE’S ANNUAL STATISTICS REPORT 2017
ON THE SUPREME COURT
Table 65.0: Time to disposition from date charged, for charges disposed of in the year ended December, 2017.
Descriptive Statistics (in months)
Number of 1391
observations
Mean 39.53
Median 34.67
Mode 21.00
Std. Deviation 20.43
Skewness 0.71
Minimum 3.00
Maximum 343
The above table shows that there were 1391 charges disposed of in 2017. It is seen that the
estimated average time to disposition from the date of charge is approximately 40 months or
roughly 3 years and 3 months. The data set for this measure is moderately positively skewed,
indicating that there were a slightly greater proportion of times to disposition which fell below
the mean than those which fell above it but most of the data points are clustered around the
average. There are indeed at least a few comparatively large times to disposal in the data set,
constituting outliers which have pushed up the average time. The estimated maximum time to
disposition for the data set is 343 months or just over 28.5 years. The estimated minimum time
to disposition from the time an offence was entered is 3 months. It is of interest that the modal
time to disposition is marginally under two years, which is an indication that the majority of
matters disposed in the period had a life of less than two years from the charged date.
87

THE CHIEF JUSTICE’S ANNUAL STATISTICS REPORT 2017
ON THE SUPREME COURT
Table 66.0: Breakdown of times to disposition from date charged, for the charges disposed in the year ended December, 2017.
Months Frequency Percentage
0 -12 405 29.12
13 -24 356 25.59
25 – 36 208 14.95
37 – 47 130 9.35
48 & over 292 20.99
Total 1391 100.0
The above table provides a further breakdown of the estimated time to disposition for charges
disposed in 2017, from the date of charge. The slight positive skewness displayed in the
previous table is affirmed as the scores here are mostly concentrated towards the lower
intervals, though there is a fair spread of the scores throughout the intervals. The data shows
that the largest proportion of the disposals using this method took a year or less. This interval
accounted for 405 or 29.12% of the disposals and was followed by matters taking between 13
and 24 months to be disposed with 356 charges or 25.59%. A further 14.95% of the matters
were disposed of within 25-36 months, 9.35% took between 37 and 47 months and the
remaining proportion of 2.99% took four years or more to be disposed.
88
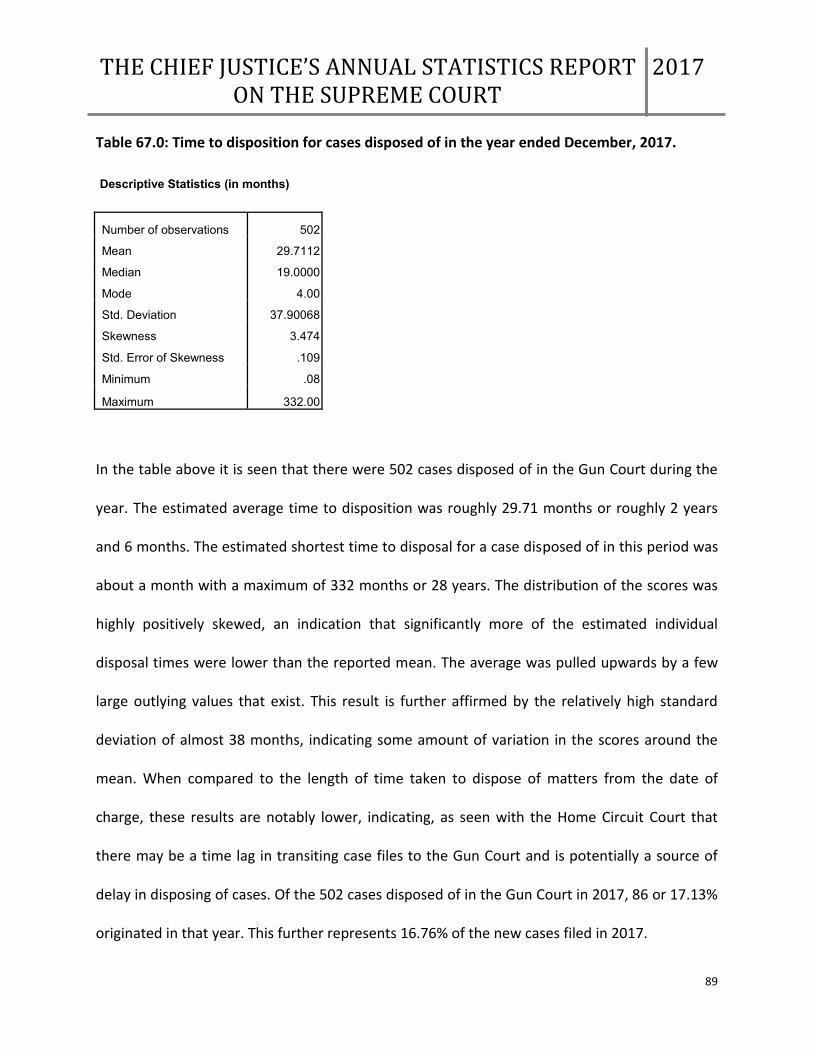
THE CHIEF JUSTICE’S ANNUAL STATISTICS REPORT 2017
ON THE SUPREME COURT
Table 67.0: Time to disposition for cases disposed of in the year ended December, 2017.
Descriptive Statistics (in months)
Number of observations 502
Mean 29.7112
Median 19.0000
Mode 4.00
Std. Deviation 37.90068
Skewness 3.474
Std. Error of Skewness .109
Minimum .08
Maximum 332.00
In the table above it is seen that there were 502 cases disposed of in the Gun Court during the
year. The estimated average time to disposition was roughly 29.71 months or roughly 2 years
and 6 months. The estimated shortest time to disposal for a case disposed of in this period was
about a month with a maximum of 332 months or 28 years. The distribution of the scores was
highly positively skewed, an indication that significantly more of the estimated individual
disposal times were lower than the reported mean. The average was pulled upwards by a few
large outlying values that exist. This result is further affirmed by the relatively high standard
deviation of almost 38 months, indicating some amount of variation in the scores around the
mean. When compared to the length of time taken to dispose of matters from the date of
charge, these results are notably lower, indicating, as seen with the Home Circuit Court that
there may be a time lag in transiting case files to the Gun Court and is potentially a source of
delay in disposing of cases. Of the 502 cases disposed of in the Gun Court in 2017, 86 or 17.13%
originated in that year. This further represents 16.76% of the new cases filed in 2017.
89

THE CHIEF JUSTICE’S ANNUAL STATISTICS REPORT 2017
ON THE SUPREME COURT
Table 68.0: Breakdown of times to disposition from the time of offence for cases disposed in the year ended December, 2017
Time interval (in
months) Frequency Percent
0 -12 188 37.5
13 – 24 119 23.7
25 – 36 75 14.9
37 – 47 47 9.4
48 & over 73 14.5
Total 502 100.0
The above table provides a more detailed breakdown of the times to disposition for cases
disposed of in 2017. It is shown that the largest proportion of cases disposed was disposed of in
under a year. This accounted for 37.50% of all the disposals, followed by approximately 23.70%
of matters which took between 13 and 24 months to be disposed. Approximately 15% of the
matters took between 25 and 36 months to be disposed, 9.40% took between 37 and 47
months and the remaining 14.50% took four years or more to be disposed. It is of interest to
note that roughly 61.20% of all matters disposed of in the period took two years or less with
38.80% taking over two years.
90

THE CHIEF JUSTICE’S ANNUAL STATISTICS REPORT 2017
ON THE SUPREME COURT
Table 17.0: Breakdown of cases disposed in each Term/period of 2017
The above chart provides a summary of the distribution of Gun Court cases disposed of in 2017.
It is shown that the largest proportion of cases were disposed in the combined period of the
Michaelmas Term and summer period with 213 or 42% of the 502 Gun Court cases disposed
during the year. This was followed by the Easter Term which accounts for 183 or 37% and the
Hilary Term with 106 or 21% of the disposals.
91

THE CHIEF JUSTICE’S ANNUAL STATISTICS REPORT 2017
ON THE SUPREME COURT
Demographic summary of Gun Court offenders
This section provides a brief summary of the age and gender distribution of persons charged in
2017.
Chart 18.0: Summary of age distribution of a sample of offenders in the Gun Court for the year ended December, 2017
As shown earlier, the offenses which dominated the Gun Court for the year are illegal
possession of fire arm, illegal possession of ammunition, robbery with aggravation, shooting
with intent and assault. Using a representative sample, the average age of persons charged in
the year is roughly 33 years old with the oldest person charged being 65 years old and the
youngest 13 years old. The modal age from this sample was 23, an indication that a significant
number of offenders are quite youthful. This notion is affirmed in the chart above where it is
shown that from the sample 32% of the offenders were between 19 and 25 years old, closely
92

THE CHIEF JUSTICE’S ANNUAL STATISTICS REPORT 2017
ON THE SUPREME COURT
followed by the age group 26 to 35 years old with 27% of the offenders. The 36 to 45 age group
comes next with 19% of the offenders. The youngest and oldest age categories of 12 – 18 and
46 and over respectively accounts for 9% and 13% respectively of the offenders brought before
the Gun Court in 2017.
In terms of gender distribution, using a sample of 200 offenders the data shows that 99 or 99%
were male and 1 or 1% female. This is exactly the same sampling distribution for gender which
was observed in the respective Terms.
Chart 19.0: Summary of gender distribution of a sample of offenders in the Gun Court for the year ended December, 2017
Table 69.0: Case clearance rate for the year ended December, 2017.
Cases filed Cases disposed Case clearance rate
513 502* 97.86%
*102 or 20.32% of the 502 cases disposed of, originated in 2017
93

THE CHIEF JUSTICE’S ANNUAL STATISTICS REPORT 2017
ON THE SUPREME COURT
Five hundred and thirteen new cases were entered in the Gun Court during the year while 502
were disposed (including many which originated before the Term) leading to an impressive case
clearance rate of 97.86% for the year. This result translates into a generalization of roughly 98
Gun Court cases disposed for every 100 new cases entered during the year. It represents one of
the highest case clearance rates in the Supreme Court during the year. The establishment of a
specialized fast track court to dispose of Gun Court cases in 2017 as well as sentence reduction
days appears to have contributed to this improved productivity index.
94
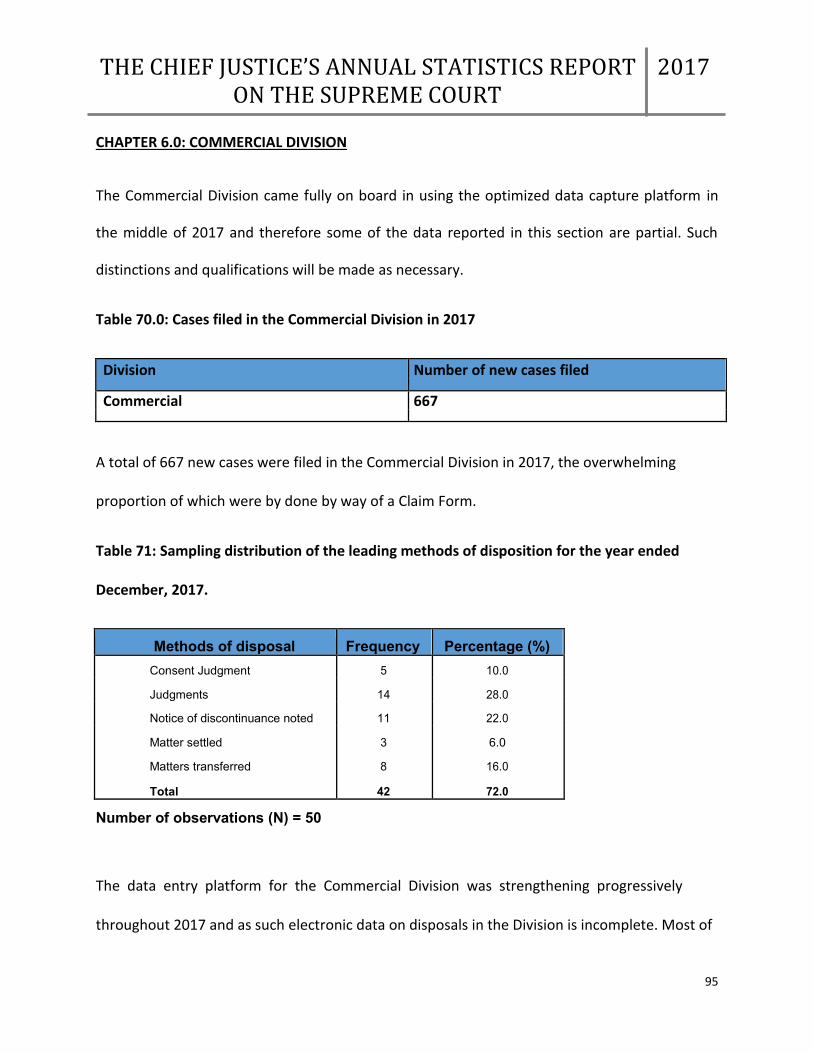
THE CHIEF JUSTICE’S ANNUAL STATISTICS REPORT 2017
ON THE SUPREME COURT
CHAPTER 6.0: COMMERCIAL DIVISION
The Commercial Division came fully on board in using the optimized data capture platform in
the middle of 2017 and therefore some of the data reported in this section are partial. Such
distinctions and qualifications will be made as necessary.
Table 70.0: Cases filed in the Commercial Division in 2017
Division Number of new cases filed
Commercial 667
A total of 667 new cases were filed in the Commercial Division in 2017, the overwhelming
proportion of which were by done by way of a Claim Form.
Table 71: Sampling distribution of the leading methods of disposition for the year ended
December, 2017.
Methods of disposal Frequency Percentage (%)
Consent Judgment 5 10.0
Judgments 14 28.0
Notice of discontinuance noted 11 22.0
Matter settled 3 6.0
Matters transferred 8 16.0
Total 42 72.0
Number of observations (N) = 50
The data entry platform for the Commercial Division was strengthening progressively
throughout 2017 and as such electronic data on disposals in the Division is incomplete. Most of
95

THE CHIEF JUSTICE’S ANNUAL STATISTICS REPORT 2017
ON THE SUPREME COURT
The disposals reflected in this sample therefore took place in the final Term of 2017 -
Michaelmas Term. Using a sample size of fifty cases disposed, the above table shows that
Judgments and notices of discontinuance were the most common method of disposal in the
Commercial Division accounting for 28% and 22% respectively of the disposals. This was
followed by matters transferred with 16% of the disposals.
Table 72.0: Time to disposition for Commercial cases
Descriptive Statistics (in months)
Number of observations 50
Mean 17.5200
Median 16.0000
Mode 16.00
a
Std. Deviation 15.26399
Skewness 1.328
Std. Error of Skewness .337
Minimum 3.00
Maximum 56.00
a. Multiple modes exist. The smallest
value is shown
The above table shows that the estimated average time to disposition, using a sample of 50
Commercial cases is 17.52 months or about a year and five months, the second lowest of all
Divisions of the Supreme Court, behind the Probate Division. The maximum time to disposition
from this sample of cases is 56 months or just over four and a half years while the lowest is just
three months. There was a greater proportion of scores in the sample of disposed cases which
fell below the mean, as revealed by the positive skewness of the data set.
96

THE CHIEF JUSTICE’S ANNUAL STATISTICS REPORT 2017
ON THE SUPREME COURT
Table 73.0: Breakdown of times to disposition
Time to disposition (in
months) Frequency Percentage (%)
0 -12 23 46.0
13 – 24 16 32.0
25 – 36 3 6.0
37 – 47 4 8.0
48 & over 4 8.0
Total 50 100.0
The above table provides a breakdown of the times to disposition for the sample of cases
disposed of in the Commercial Division in 2017. It is seen that the largest proportion of these
cases were disposed of within a year, accounting for 46% of the disposals This is followed by
32% which took 13 to 24 months to be disposed. Taken together, 78% of the cases in this
sample were disposed of with 2 years. These results are consistent with the inferences made
from the previous table.
97

THE CHIEF JUSTICE’S ANNUAL STATISTICS REPORT 2017
ON THE SUPREME COURT
CHAPTER 7.0: AGGREGATE CASE ACTIVITY AND RESERVED JUDGMENTS
Aggregate Case Clearance Rate
Analysis of the productivity of the judiciary, subject to its resource constraints is an important
metric for gauging efficiency and for informing policy and operational interventions. In this sub-
section the gross case clearance rate is used as a measure the ratio of incoming and outgoing
cases in the Supreme Court in 2017.
The below table provides a summary of the collective case clearance rate for the Divisions of
the Supreme Court. It is important to again point out that at least some of the disposed cases
used in this computation may have originated in previous periods as the clearance rate is meant
to be a productivity index measuring the ratio of new cases filed/entered to cases disposed of
in a particular period of time, regardless of when the disposed cases originated.
Table 72.0: Gross case clearance rate for the year ended December, 2017
Total cases filed Total cases disposed Gross Case clearance rate
11937* 5933 49.70%
*Excluding new cases filed in the Commercial Division
The above table provides an aggregate summary of the clearance rates using the data from the
Home Circuit Court, Gun Court, Matrimonial, Probate, Revenue and HCV Divisions. The data
suggests that a total of 11937 new cases were filed/entered across the six named Divisions
reviewed in 2017. These results yield a gross clearance rate of roughly 49.70% an increase of
which suggests that for every 100 cases filed/entered during the year, roughly 50 were also
98

THE CHIEF JUSTICE’S ANNUAL STATISTICS REPORT 2017
ON THE SUPREME COURT
disposed. This is an indication that there were twice as many incoming than outgoing cases in
the Supreme Court as a whole in 2017.
Aggregate Case Counts 2015-2017
The below table provides a count of the number of new cases filed/entered in the larger
Divisions of the Supreme Court for the years 2015-2017.
Table 74.0: Number of new cases by Division for the years 2015-2017
Division Aggregate number of new Aggregate number of Aggregate number of
cases in 2015 new cases in 2016 new cases in 2017
High Court 5953 5336 4396
Civil (HCV)
Matrimonial 3550 3536 3539
Probate 2515 2436 2853
Commercial 145 424 667
Home Circuit 238 209 624
Court
Gun Court 538 473 513
Total 12939 12414 12592
99

THE CHIEF JUSTICE’S ANNUAL STATISTICS REPORT 2017
ON THE SUPREME COURT
Chart 20.0: Number of new cases by Division for the years 2015-2017
The above table and chart summarizes the progression of cases in the larger Divisions of the
Supreme Court between 2015 and 2017. It is shown that the High Court Civil (HCV) Division has
consistently demonstrated the largest share of new cases in the Supreme Court over the
period. There has however been steady decline in the number of new cases filed in this Division
over the three-year period, cumulatively falling by 26.15% over this time. The Matrimonial
Division accounts for the second highest case count each year over the period, maintaining a
notably steady count, ranging between a high of 3550 in 2015 and a low of 3536 in 2016,
fluctuating only marginally over the three years. The Probate Division accounts for third highest
share of new cases over the period and also demonstrates a consistency over 2015 and 2016,
where only a marginal fall was seen. There was however a sharp increase in 2017 which saw the
highest recorded number of 2853 new cases over the period. The Gun Court also demonstrates
100

THE CHIEF JUSTICE’S ANNUAL STATISTICS REPORT 2017
ON THE SUPREME COURT
a steady progression of new cases over the three-year period with a high of 573 new cases in
2015 and a low of 473 in 2016. The progression observed is however notably different from the
other Divisions, for the Commercial Division and Home Circuit Court which have both seen
overall increases over the period. I particular, the data on the Commercial Division suggest that
there has been a marked annual rise over the past three years, increasing by roughly 186%
between 2015 and 2016 and approximately 61% between 2016 and 2017. As for the Home
Circuit Court, the number of new cases brought in 2015 and 2016 was fairly steady however
aided by the new Committal Proceedings Act there was a major surge in 2017 which saw the
number of new cases increasing by roughly 199% over 2016.
101

THE CHIEF JUSTICE’S ANNUAL STATISTICS REPORT 2017
ON THE SUPREME COURT
Case Activity Summary for 2017
The below table provides a summary of the new cases filed, cases dispose and clearance rates
for each Divisions of the Supreme Court in 2017. A cumulative summary is also provided.
Table 75.0: Aggregate case activity in 2017.
Division New cases Aggregate Number of cases Clearance Average time
filed number of disposed which rate (%) to disposition
cases disposed originated in 2017
High Court 4396 1063 100 24.18% 2 years and 9
Civil (HCV) months
Matrimonial 3539 2621 137 74.06% 2 years and 3
months
Probate 2853 1535 537 54.43% 1 year and 4
months
Commercial 667 N/A N/A N/A 1.5 years
Home 624 209 86 33.49% 2 years and 4
Circuit months
Court
Gun Court 513 502 102 97.86% 2.5 years
Revenue 12 3 0 25% N/A
Division
Total/Gross 12,604 5933 962 49.70%*
*This figure excludes the Commercial Division
The above table provides an important summary of case activity in the Supreme Court in 2017.
It is shown that a total of 12,604 new cases were filed/entered across all Divisions of the
Supreme Court in 2017. The High Court Civil (HCV) Division with 4396 cases or 34.88% of the
cases accounts for the largest share of the new cases, followed by the Matrimonial Division
with 3539 or 28.08% of the total and the Probate Division with 2853 or 22.64% of the total. The
102

THE CHIEF JUSTICE’S ANNUAL STATISTICS REPORT 2017
ON THE SUPREME COURT
Commercial Division experienced the most pronounced growth in new cases filed with 57.3%
increase. This upward trend is expected to continue in 2018, partly due to greater public
awareness of the functions of the Division. The number of new High Court Civil cases filed in
2017 continue the downward trend of the past few years, resulting from the greater capacity of
the Parish Courts to handle civil matters. The general increases in the litigious nature of the
Jamaican public however suggest that this decline may be slow and incremental in the coming
years. New cases entered in the Home Circuit Court accounted for 624 or 4.95% of the total
number of cases. This is an increase over recent years and is expected to continue growing in
2018. The number of Probate and Revenue Division cases is expected to remain generally
steady in 2018. In light of the ensuing, it can be anticipated that the total number of new cases
filed/brought in the Supreme Court in 2018 will be between 12500 and 13500 cases, likely
settling close to the midpoint of about 13000 cases.
The Matrimonial and Probate Divisions accounted for the largest share of the cases disposed
with roughly 44% and 26% respectively of the cases disposed. The largest proportion of new
cases filed/brought in the Supreme Court in 2017 which were disposed of was accounted for by
the Probate Division. As far as clearance rates are concerned, the Gun Court and Matrimonial
Divisions with clearance rates of 97.86% and 74.06% respectively rank highest while the
Revenue Division and the High Court Civil Division with 25% and 24.18% respectively have the
lowest clearance rates. The overall case clearance rate for the Supreme Court is estimated at
50% which suggests that there were twice as many incoming than outgoing cases in 2017,
indicative of mounting stress on existing judicial resources.
103

THE CHIEF JUSTICE’S ANNUAL STATISTICS REPORT 2017
ON THE SUPREME COURT
The longest average time to disposition was accounted for by the High Court Civil (HCV) Division
with cases taking an average of 2 years and 9 months to be disposed. The Matrimonial Division
is next with an average time to disposition of 2 years and four months while the Commercial
and Probate Divisions with estimated average times of a year and 6 months and a year and four
months respectively account for the lowest times to disposition in 2017.
Judgments Reserved and Judgments Delivered
This sub-section provides a summary of the Civil Judgments reserved and delivered in 2017.
Table 76.0: Summary of Judgments Reserved and Delivered in 2017
Number of Number of Judgments Total number of Number of outstanding
Judgments delivered (from those Judgments Judgments (from those
reserved reserved in 2017) delivered reserved in 2017)
127 37 127 90
A total of 127 Judgments were reserved in 2017, 37 or 29.13% of which were delivered. In total,
127 Judgments were delivered in 2017, the overwhelming proportion of which was reserved in
previous years. Ninety of the Judgments reserved in 2017 were still outstanding at the end of
the year.
104

THE CHIEF JUSTICE’S ANNUAL STATISTICS REPORT 2017
ON THE SUPREME COURT
CHAPTER 8.0: CONCLUSION AND RECOMMENDATION
This annual report for the Supreme Court represents an important step in the effort in creating
a more data driven court system and to improving access to information. Although there is no
comprehensive data from prior years for the necessary comparisons to be adequately
established, this report creates a vital foundation and critical watershed for the creation of a
sustainable system of data capture and reporting. The data harnessed should form the basis of
informing crucial policy and operational decisions which will bolster resource alignment and a
more efficient allocation of resources in the Supreme Court.
As with the previous reports, among the critical findings from this report is that the HCV and
Home Circuit Courts are particularly heavily impacted by a very high incidence of adjournments
and low trial date certainty rates. In both of these Divisions and in others, it appears that a large
proportion of these adjournments, over 30% all told, are due to issues associated with files not
found, absenteeism of attorneys or parties not showing up and documents not being ready for
court. This again draws into sharp focus the potential need for more physical and human
resources and a more robust system of scheduling matters for court, for enhanced case
management strategies and for strong methods of engagement of stakeholders, including the
attorneys and parties, to increase court attendance.
It is also of vital note that the combined periods of analysis so far have revealed an approximate
average time to disposition of roughly 2.11 years or roughly 25 months across all Divisions. The
High Court Civil, Matrimonial and Home Circuit Courts and the Gun Court all demonstrate
105

THE CHIEF JUSTICE’S ANNUAL STATISTICS REPORT 2017
ON THE SUPREME COURT
average times to disposition of over 2 years for the matters disposed in 2017, with the High
Court Civil Division ranking highest with a time of 2.74 year or roughly 33 months. The Probate
and Commercial Divisions with average times to disposition of fewer than two years
demonstrate the best outcomes in this regard, with the Probate Division having the lowest time
of 1.30 years or approximately 16 months.
Despite the resource constraints being experienced by the Supreme Court, it is necessary to
establish time standards which inform the time taken to dispose of cases in the respective
Divisions of the Supreme Court. This will strengthen the commitment both internally and
externally to an established ethic and also eventually improve public confidence in the system.
It is also evident from the analyses so far that the Supreme Court as a whole has significantly
more incoming than outgoing matters which has resulted in the court experiencing generally
modest gross clearance rate. The overall average clearance rate for the 2017 is roughly 50%, an
indication that over the period the Supreme Court has experienced two times more new cases
filed than cases disposed. This has potentially adverse implications for the buildup of a backlog
of cases and requires deliberate, targeted policy interventions.
There is generally high incidence of requisitions in the Civil Divisions is cause for concern and
stands out among the leading causes of delay in the disposition of cases. The number and
incidence of requisitions in the Matrimonial Division is particularly acute with a rate of over 200
requisitions to every 100 case files. This problem requires special targeted measures which are
centrally managed. One recommendation for which there is much conviction is to have a
106

THE CHIEF JUSTICE’S ANNUAL STATISTICS REPORT 2017
ON THE SUPREME COURT
system of scheduling Matrimonial cases and accordingly assigning them to judges with clearly
defined turnaround times established.
RECOMMENDATIONS
A number of other recommendations were highlighted in this report for the different Divisions,
geared towards redressing many of the deficiencies which have been identified. These
recommendations were developed in consultation with the respective Divisions. Among the
major recommendations cited is the need to stem the high incidence of adjournments by
ensuring that that specific court rooms are dedicated to dealing with matters which are ready
for trial or which have a greater probability of being disposed within a shorter space of time.
This is consistent with the express resource facility which was devised by the scheduling
committee in the High Court Civil Division, which has shown positive results. It is also consistent
with the use of Court Room 7 as a specialized medium for expediting the disposal of Gun Court
cases. Applying an adapted approach across all Divisions could potentially have a marked
positive effect on disposal rates and the efficient use of judicial time.
The report identified that Assessment of Damages is a particularly sore area with multiple
adjournments in the High Court Civil Division. It is recommended that a stronger system of
scheduling be implemented for these matters where specific time slots be set for hearings. This
would be done in such a way that a limited number of matters for assessment of damage which
are ready for hearing are scheduled each day, with a built in contingency of other ready cases in
the event of delays with those scheduled. Such a measure should gradually redress the current
situation in which many days worth of Assessment of Damages matters are in effect being
107

THE CHIEF JUSTICE’S ANNUAL STATISTICS REPORT 2017
ON THE SUPREME COURT
scheduled for single court days, inevitably leading to multiple adjournments and a sub-optimal
use of judicial time.
The large number of adjournments resulting from reasons such as matters wrongly listed the
inability to locate files and matters left off the court list can be addressed by strengthening the
internal systems of data validation in the respective Divisions. It is also recommended that a
Case Progression and Records Management Team be established at the Supreme Court to
provide oversight to matters of scheduling, file movement and control and general case file
handing in the relevant Divisions.
In an effort to reduce the incidence of requisitions in the Civil Divisions, it has also been
recommended that the instructions for completing the relevant documents accompany the
emails which are sent out with the requisitions. This will function as a means of supplementing
the posting of instructional guides for the public at the relevant customer service windows.
Such an approach is currently being piloted in the Matrimonial Division.
The reasons for delays in the progression of matters through the court system greatly intimate
the need for a more robust system of case management and as such an examination of the
possibility of increasing the number of Case Progression Officers should be pursued. This is
consistent with the recommendation made to establish clearly defined time standards for the
disposition of cases in each Division.
The data suggests that there are a number of cases in the court system which have taken much
longer than the average or expected time to be disposed. Several aged cases remain active at
108

THE CHIEF JUSTICE’S ANNUAL STATISTICS REPORT 2017
ON THE SUPREME COURT
the end of 2017 and as such it is recommended that a special court be assigned to expedite the
disposition of such cases through a deliberate, highly organized system of scheduling and case
flow management.
The overall judicial burden being carried by the Supreme Court Judges and support staff are
quite significant. The average case load of between 300 and 400 cases per year, per High Court
Judge across the Divisions, exceeds the recommended international benchmark and has dire
consequences for both case clearance and disposal rates. Any holistic effort to remedy the
deficiencies in the court system should therefore encapsulate increasing the number of High
Court Judges and the requisite support staff.
The overarching results from the statistical analysis for 2017 could form the basis for important
policy considerations and the strengthening of the operational procedures of the Supreme
Court, thereby transforming the efficiency with which the entity does business.
109

THE CHIEF JUSTICE’S ANNUAL STATISTICS REPORT 2017
ON THE SUPREME COURT
APPENDIX
List of criminal charges for 2017
Cumulative
Frequency Percent Valid Percent Percent
Valid 1 .1 .1 .1
Abduction 17 1.6 1.6 1.7
Abduction of a child under 18 1.7 1.7 3.5
16
Aid and Abetting Forcible
2 .2 .2 3.7
Abduction
Aiding and Abetting Rape 32 3.1 3.1 6.7
Aiding and Abetting
3 .3 .3 7.0
SIWPUS
Arson 3 .3 .3 7.3
Assault 3 .3 .3 7.6
Assault at Common Law 3 .3 .3 7.9
Assault Occasioning Bodily
14 1.3 1.3 9.2
Harm
Assault Occasioning
4 .4 .4 9.6
Grievous Bodily Harm
Assault with Intent to Rape 2 .2 .2 9.8
Attempt to pervert the
1 .1 .1 9.9
course of justice
Attempted Murder 4 .4 .4 10.3
Attempted Rape 4 .4 .4 10.7
Being armed with an
1 .1 .1 10.8
offensive weapon
Breaches of the law reform 2 .2 .2 11.0
Buggery 24 2.3 2.3 13.3
Burglary 3 .3 .3 13.5
Carnal Abuse 3 .3 .3 13.8
Causing death by dangerous
2 .2 .2 14.0
driving
Causing grievous bodily
2 .2 .2 14.2
harm with intent
Child Pornography 2 .2 .2 14.4
Conspiracy to defraud 5 .5 .5 14.9
Conspiracy to murder 19 1.8 1.8 16.7
Counselling/Inciting Sexual 1 .1 .1 16.8
Touching
Cruelty to child 1 .1 .1 16.9
Encouraging violation of a
2 .2 .2 17.1
child fewer than 16 years
Encouraging violation of 1 .1 .1 17.2
child on premises
Forcible Abduction 40 3.8 3.8 21.0
Forfeiture of Assets
1 .1 .1 21.1
Proceedings
Forgery 3 .3 .3 21.4
Grievous sexual assault 58 5.6 5.6 27.0
110

THE CHIEF JUSTICE’S ANNUAL STATISTICS REPORT 2017
ON THE SUPREME COURT
Gross Indecency
House holder encouraging violation of child under 16
Illegal Importation of Ammunition
Illegal Importation of Firearm
Illegal Possession of Ammunition
Illegal Possession of Firearm Incest
Indecent assault
Inflicting grievous bodily harm
Kidnapping
Knowingly possessing identity information
Larceny by trick
Leadership in a criminal organization
Living on the earnings of prostitution
Making Use of a Firearm to Commit a Felony
Malicious Destruction of Property
Manslaughter
Misprision of
Felony Murder
Obtaining property by false presence
Participating in a criminal organization
Possession of identity information
Procuring drugs to procure abortion
Procuring drugs to procure an abortion
Rape
Robbery with Aggravation
Robbery With Violence
Sexual Grooming
Sexual Intercourse with a mentally disordered Person
Sexual Intercourse with a Person under Sixteen
Sexual Intercourse with a Person fewer than Sixteen Count 1
Sexual Touching
Shooting with Intent
6 .6 .6 27.6
2 .2 .2 27.8
1 .1 .1 27.9
2 .2 .2 28.0
5 .5 .5 28.5
20 1.9 1.9 30.5
6 .6 .6 31.0
14 1.3 1.3 32.4
2 .2 .2 32.6
4 .4 .4 32.9
1 .1 .1 33.0
1 .1 .1 33.1
1 .1 .1 33.2
21 2.0 2.0 35.3
1 .1 .1 35.4
1 .1 .1 35.4
2 .2 .2 35.6
7 .7 .7 36.3
2 .2 .2 36.5
221 21.2 21.2 57.7
4 .4 .4 58.1
3 .3 .3 58.4
10 1.0 1.0 59.4
2 .2 .2 59.6
1 .1 .1 59.7
159 15.3 15.3 74.9
6 .6 .6 75.5
1 .1 .1 75.6
3 .3 .3 75.9
1 .1 .1 76.0
188 18.1 18.1 94.0
1 .1 .1 94.1
23 2.2 2.2 96.3
4 .4 .4 96.7
111

THE CHIEF JUSTICE’S ANNUAL STATISTICS REPORT 2017
ON THE SUPREME COURT
Trafficking persons 3 .3 .3 97.0
Uttering Forged Documents 1 .1 .1 97.1
Violation of a Mentally
1 .1 .1 97.2
Challenged Person
Wounding with Intent 29 2.8 2.8 100.0
Total 1041 100.0 100.0
112