Embed Size (px)
Citation preview

THE CHEMICAL LIMNOLOGY OF LAKE BONNEY, ANTARCTICA
WITH
EMPHASIS ON TRACE METALS AND NUTRIENTS
by
Barron Luther Weand
Dissertation submitted to the Graduate Faculty of the
Virginia Polytechnic Institute and State University
in partial fulfillment of the requirements for the degree of
DOCTOR OF PHILOSOPHY
in
Environmental Sciences and Engineering
APPROVED:
Dr. Robert C. Hoehn, Chairman
Dr. Paul H. Ki'J
Dr. Bruce C. Parker
December, 1975
Blacksburg, Virginia
Dr. John G. Mason
Dr. George M. Simmons, Jr.

ACKNOWLEDGEMENTS
This research was supported in part by grant GV-35171 from
the National Science Foundation, for which the author expresses
his appreciation.
The author would also like to express his gratitude to his
graduate committee chairman, Dr. Robert C. Hoehn, for his encour-
agement and guidance throughout his graduate program, and for his
editing of this dis&ertation.
Thanks are also due Dr. Bruce C. Parker for his suggestions
and enthusiasm, and to Drs. Paul H. King, John G. Mason, and
George M. Sirrmons, Jr. for their advice and service on the author's
graduate committee.
Appreciation is here extended to Ms. Cynthia Whitman for her
able assistance in the computer analysis of some of the data.
It would be inappropriate to pass without mentioning the field
team members, who were instrumental in obtaining the data upon
which this work is based. Most operations which would be considered
routine in another environment required much more time and effort
at Lake Bonney; only personal experience can give one a true
appreciation of the problems of remote field work. Only through
teamwork were the everyday problems surmounted and our research
goals attained. So a very special appreciation born of Antarctic
fellowship is extended to all the members of the 1973-74 and 1974-75
;;

field teams:
Mr. James Borchers Mr. Phil Brown Mr. James Craft Mr. Gary Crouch Mr. Richard Fortner Ms. Paige Gerring Mr. Dan Graber Mr. Steve Hash Mr. Larry Lane
iii
Mr. William Markley Ms. Carol Mcintyre Ms. Julie Petruska Mr. Robert Stavros Mr. Hal Sugg, Jr. Ms. Alexis Taylor Mr. James Voorhees Mr. Jeffrey Whitehurst Ms. Sally Woods
Thanks are also extended to the men and women of the U. S.
Navy Task Force 43 for the logistical support provided during the
field studies.
Finally, the author must express his greatest appreciation
to his wife, Diana, who helped edit and type this dissertation.
More important, however, she has freely given her unwavering
support and encouragement throughout several years of work which
included two lengthy absences from home. She truly shares in
any accomplishment that this work represents.

I.
ACKNOWLEDGEMENTS
LIST OF TABLES .
LIST OF FIGURES
INTRODUCTION . .
TABLE OF CONTENTS
II. LITERATURE REVIEW
Lake Bonney . • . . Analysis of Trace Metals by
Flameless AA .... A Brief Biogeochemistry of
Select Trace Metals
III. EXPERIMENTAL METHODS .....
Sampling Stations and Routines . Stream Flow Measurements Chemical Analyses ..... . Additional Measurements Trace Metal Analysis ..... . Sediment Sampling and Analysis . Benthic Mat Samples .•..
IV. RESULTS ......... .
General Descriptive Data Trace Metals ..... Nutrients ..•.... Miscellaneous Results
V. DISCUSSION .
VI. CONCLUSIONS
VII. LITERATURE CITED .
VIII. APPENDICES ...
Appendix A - The Method of Standard Methods Appendix B - Data Calculated from the
University of Waikato (N.Z.) Bathymetric Survey of Lake Bonney . . . . . . . . . .
iv
Page ;;
vi
viii
1
10
10
25
31
56
56 58 59 63 63 69 70
71
71 84 97
113
117
140
143
154
157

v
Appendix C - Data from Field Study at Lake Bonney . . . . .
IX. VITA .•
ABSTRACT
Page
161
187

LIST OF TABLES
Table Page
I. Morphometric parameters of Lake Bonney as reported by Angino et!]_. (16) and Goldman et!]_. (22). 13
II. Representative distribution of alkali metals and chloride in Lake Bonney. Data collected on December 16, 1961, by Angina et!]_. (16).
III. A comparison of nutrient concentrations found at comparable sites in Lake Bonney by several investigators ............... .
IV. A comparison of the concentrations of sulfate, boron, and silicate found at comparable sites in Lake Bonney by several investigators ....
V. Trace metals reported in Lake Bonney by Armitage and Angino (reference 20) ..•.•.•••..
VI. Detection limits of the HGA-2100 graphite furnace for selected trace metals (after Perkin-Elmer Corpora ti on, reference 20). . • . . • . . . . .
VII. A comparison of direct injection and extraction procedures for the analysis of copper in saline water by flameless atomic absorption. (after ediger, reference 51) ...•...•...•
VIII. The use of an111onium nitrate to volatilize matrix components for flameless atomic absor~tion analyses. (after Ediger, reference 51) ..•..
IX. Geochemical parameters for selected trace metals. (after Hedgpeth, reference 60) .•....•.•
X. Some equilibria governing the solubility of iron in
16
17
19
21
26
28
29
32
natural waters. . . . . . . . . . . • . . . . . . • 34
XI. Some equilibria governing the solubility of manganese in natural waters. . . . . . . . . . . . . . . . . 40
XII. The effect of manganese concentration in the culture solution on the iron requirement of Mlcrocystis. (after Gerloff and Skoog, reference ~) . . . . . . 43
vi

vii
Table
XIII. Quantities of various metals (in mg) solubilized by each gram of humic acid from insoluble metal carbonates and sulfides at pH 7.0 (after Rashid
Page
and Leonard, reference 78). . • . . . . . . . . 46
XIV. Dilution required to prepare Lake Bonney water samples for various analyses. . . • . . . . . . . . . . 60
XV. Operating parameters used in the analysis of trace elements in Lake Bonney samples by flameless atomic absorption with the Perkin-Elmer HGA-2100 graphite furnace. . . • . • • • • . . . . . . . . 67
XVI. Morphometric parameters of Lake Bonney as computed from the 1974 bathymetric survey by the University of Waikato (N.Z.) research team (Figure 5). . . . . . 73
XVII. Annual loading of trace metals to Lake Bonney by me 1 ts treams. . . . . . . . . . . . . . . . . . 98
XVIII. Concentration factors of benthic algal mat from Lake Bonney for various nutrients and trace elements. 115
LIST OF FIGURES
Figure
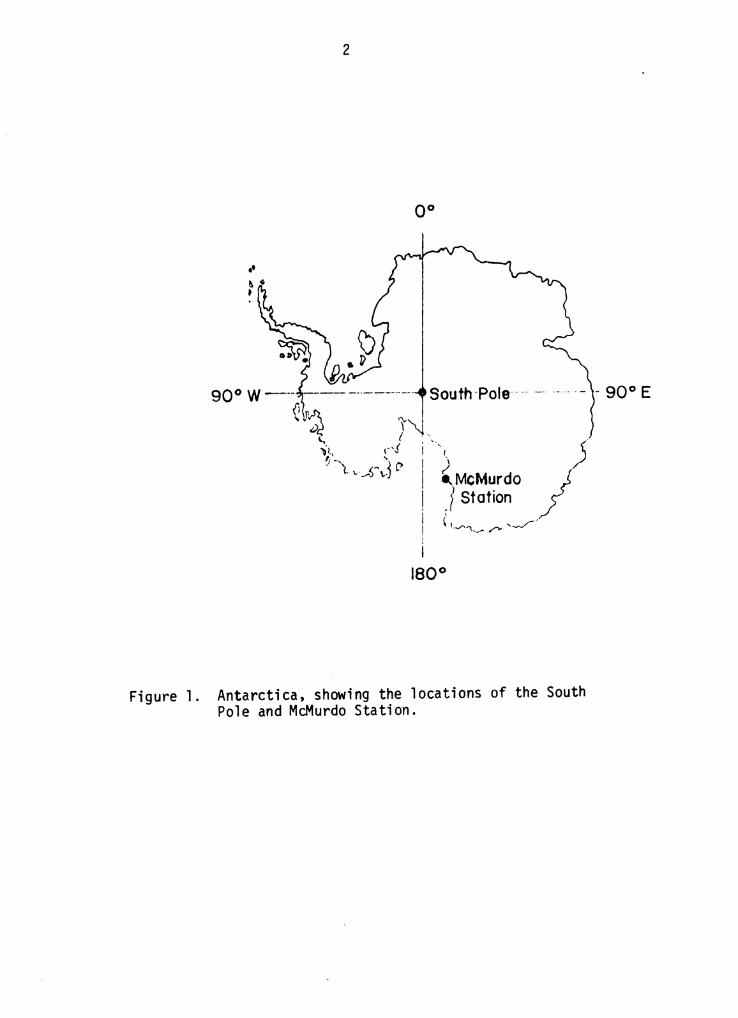
1. Antarctica, showing the locations of the South Pole and McMurdo Station. • .•.•••..
2. A portion of the McMurdo Oasis in southern Victoria Land,
Page
2
showing the Wright and Taylor Dry Valleys. 3
3. Photograph of Lake Bonney, southern Victoria Land, Antarctica. . . • . . . . . • . • . • • . • . . 6
4. A profile of Lake Bonney, showing its permanent ice cover and meromictic nature. . . • • • • . • • . • 7
5. Bathymetric survey of Lake Bonney (courtesy of Dr. Terry Healy, University of Waikato, New Zealand). 12
6. Cytochrome oxidase.
7. Sampling sites on Lake Bonney.
8. Volume-depth curve for Lake Bonney.
36
57
72
9. Cumulative flow in the Sollas-LaCroix meltstream. 75
10. Seasonal temperature variations at site 1 (1974-75). • . 77
11. Seasonal variation in chloride concentrations at site 1 (1974-75). . . . . . . . . • • . . • • . • • • • • 78
12. Seasonal variation in dissolved oxygen concentrations at site 1 (1974-75). . . . . • . . . . . . . . • • 81
13. Seasonal variation in pH at site 1 (1974-75). 83
14. Seasonal variation in alkalinity at site 1 (1974-75). 85
15. Mean value and ran9e of total manganese concentrations found at site l (1974-75). • . . . • . . . 87
16. Mean value and ran9e of total iron concentrations found at site 1 (1974-75). • . . . . . • . . . 88
17. Mean value and ran9e of total copper concentrations found at site 1 (1974-75). • • . . . . . • . • . 90
viii

ix
Figure Page
18. Mean value and range of concentrations of total nickel found at site 1 (1974-75). . . . . . . 91
19. Mean value a~d ran~e of total cobalt concentrations found at site l {1974-75). . . . . . . • • . • . 93
20. Total mass of certain trace elements found in Lake Bonney. . . . . . . . . . . . . . . . 96
21. Profile of ortho- and condensed phosphate at site 1 early in the field season. . . . . . . . . . . . 100
22. Profile of ortho- and condensed phosphate at site 1
23.
24.
late in the field season. . . . • . . . . . . . . • . 101
Comparison of total nutrient masses in Lake Bonney.
Daily concentrations of orthophosphate phosphorus in the Sollas-LaCroix meltstream (1974-75). . •.
103
104
25. Daily loading of orthophosphate phosphorus to Lake Bonney from the Sollas-LaCroix meltstream (1974-75) 105
26. Distribution of inorganic nitrogen forms at site 1 early in the field season. . • • . . . . . • . 107
27. Distribution of inorganic nitrogen forms at site l late in the field season. . . • • . . • . • . • . 108
28. Seasonal variations in sulfate concentration at site l (1974-75). . . . . . . . . . • • . . • . . . . 111
I. INTRODUCTION
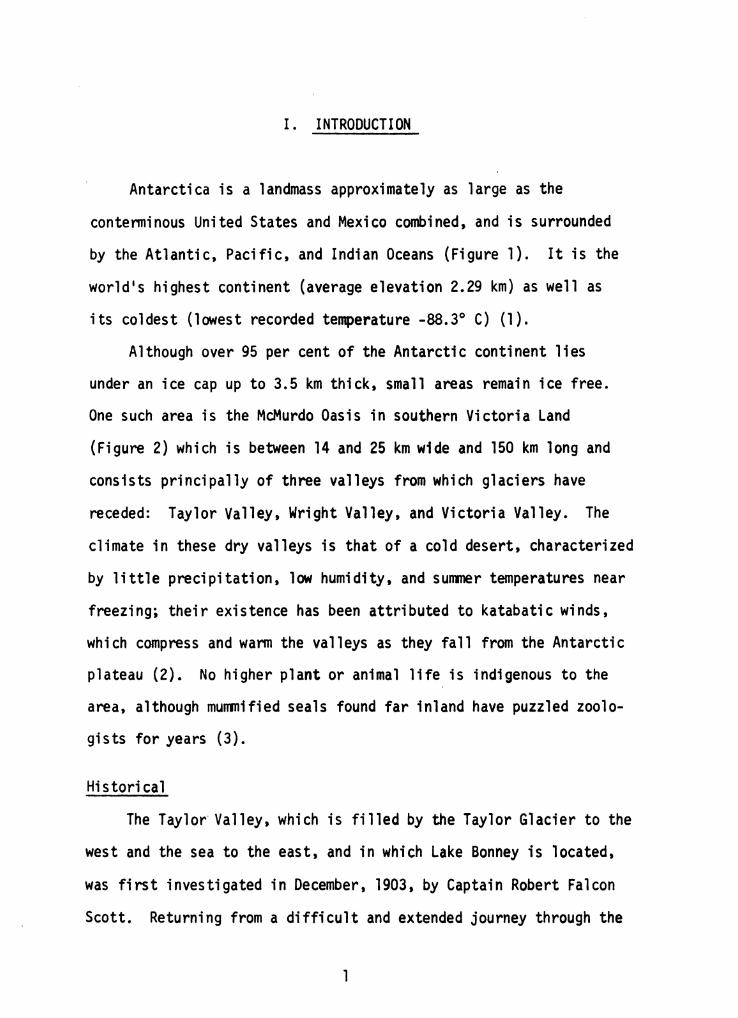
Antarctica is a landmass approximately as large as the
contenninous United States and Mexico combined, and is surrounded
by the Atlantic, Pacific, and Indian Oceans (Figure 1). It is the
world's highest continent (average elevation 2.29 km) as well as
its coldest (lowest recorded temperature -88.3° C) (1).
Although over 95 per cent of the Antarctic continent lies
under an ice cap up to 3.5 km thick, small areas remain ice free.
One such area is the McMurdo Oasis in southern Victoria Land
(Figure 2) which is between 14 and 25 km wide and 150 km long and
consists principally of three valleys from which glaciers have
receded: Taylor Valley, Wright Valley, and Victoria Valley. The
climate in these dry valleys is that of a cold desert, characterized
by little precipitation, low humidity, and sunrner temperatures near
freezing; their existence has been attributed to katabatic winds,
which compress and wann the valleys as they fall from the Antarctic
plateau (2). No higher plant or animal life is indigenous to the
area, although munmified seals found far inland have puzzled zoolo-
gists for years (3).
Historical
The Taylor· Valley, which is filled by the Taylor Glacier to the
west and the sea to the east, and in which Lake Bonney is located,
was first investigated in December, 1903, by Captain Robert Falcon
Scott. Returning from a difficult and extended journey through the
1
2
••
South ·Pole····· -· -- ··· · - - 90° E
Figure 1. Antarctica, showing the locations of the South Pole and McMurdo Station.

Figure 2.
Wrighf GI. ' ' ... ,.:;7~;::t~;;:~~·i~t·· 1530
. ' '. .: : : . ~ ~ i-1 :
· ·McMur~o "l, .. :. ~
~~~r: :·i:i.' .. ·· ''!',
6 Km 12 18
A portion of the McMurdo Oasis in southern Victoria land, showing the Wright and Taylor Dry Valleys. McMurdo Station (not shown) is on Ross Island, to the East. After Angino and Annitage, refer~nce 10.
w
4
plateau of Victoria Land, Scott and his companions were both amazed
and thrilled at what greeted them in the Taylor Valley. Scott
recorded their impressions in The Voyage of the Discovery (4):
I cannot but think that this valley is a very wonderful place. We have seen to-day [sic] all the indications of collosal ice action and considerable water action, and yet neither of these agents is now at work. It is worthy of record, too, that we have seen no living thing, not even a moss or lichen; all that we did find, far inland amongst the moraine heaps, was the skeleton of a Weddell seal, and how that came there is beyond guessing. It is certainly a valley of the dead: even the great glacier which once pushed through it has withered away.
Scott also described his descent down the Taylor Glacier onto
the frozen surface of Lake Bonney, the first time men had been
there:
With a little difficulty we climbed down to the level of the lake, and then observed that the glacier rested on a deep ground moraine of mud ... Skirting the lake below the glacier, we found our-selves approaching the high, rocky groin which puzzled us so much last night, but we now saw that a very narrow channel wound round its base. . •. as we traversed this part, the high cliffs on either side towered above our heads and we seemed to be passing through a massive gateway; beyond this the valley opened out again, and its floor was occupied by a frozen lake a mile in breadth and three or four miles in length. As the snow surface of this lake was very rough, we were obliged· to ski rt its margin; we were now 1300 feet below our camp, and about 300 feet above sea level.
Taylor Valley was named by Scott after Griffith Taylor, a
geologist who accompanied his last expedition, and it is perhaps
the best kno\'iri cf the dry valleys (5). It was Taylor who name.d
Lake Bonney, apparently after one of his professors at Cambridge
University (6).

5
Despite this early attention to the area, it was not until
1961 that the permanent ice of Lake Bonney was cored and the true
nature of the lake established (7).
Lake Bonney
Lake Bonney is located at latitude 77°43' S. and longitude
162°23' E., and consists of two basins connected by a narrow
isthmus approximately 35 m wide and 10 m deep (Figure 3). The
smaller, western lobe lies at the base of the Taylor Glacier, and
is approximately 2.5 km long, 0.8 km wide, and 35 m deep. The
eastern lobe is approximately 4.8 km long, 0.8 km wide, and 33 m
deep. The lake surface is covered by pennanent ice about 3.5 m
thick, although during the austral sunmer melting produces a moat
up to several meters wide around the periphery of the lake.
Lake Bonney is considered to be about 6000 years old, the rem-
nant of a much larger glacial lake (8, 9) and is meromictic: a
freshwater mixolimnion is separated from a hypersaline minimolimnion
by a narrow chemocline (Figure 4). Surface flow to the lake, via
glacial meltstreams, occurs for only 6-8 weeks during the year, and
subterranean inflow has been suggested by Angina and Annitage (10)
and Weand et~· (11). There is no outlet, the only loss being by
evaporation and by ablation of the ice cover.
Much of the analytical work for this study was carried out on
site in a small laboratory constructed in 1972 by a research team
from Virginia Polytechnic Institute and State University (VPI & SU).
This particular work is the result of efforts during the 1973-74

6
Figure 3. Photograph of Lake Bonney, southern Victoria Land, Antarctica. This view, looking southward, shows Lake Bonney (A), Hughes Glacier (B), Taylor Glacier (C), and the Rhone Glacier (D).

NE
Monimolimnion ( Hypersoline Zone, 15 - 34m.} 0
Halite 10
I 20M
0 I 2km
Figure 4. A profile of Lake Bonney, showing its permanent ice cover and meromictic nature.
'i

8
and 1974-75 austral sunmers, during which field teams were on site
from October to February each year. Field operations were
dependent for support upon McMurdo Station, a United States Naval
Facility about 100 km distant; food and fuel were transported to
the site by helicopters, which were also used to fly out laboratory
wastes, scientific samples, and garbage. Great care was taken to
avoid contamination of the area.
Objectives
Lake Bonney has been the subject of several studies, but until
the efforts of the teams from VPI & SU--under the direction of Ors.
Bruce C. Parker, Robert C. Hoehn, and Robert A. Paterson--no con-
tinuous seasonal data were obtained. The ultimate objective of the
VPI & SU project was to mathematically model the Lake Bonney ecosys-
tem, requiring interdisciplinary efforts by biologists, chemists,
geologists, engineers, and mathematicians (12, 13, 14, 15).
The study at hand was part of the larger program, focusing upon
the chemical limnology of the lake, particularly certain biologically
important trace metals and nutrients. By monitoring the Lake Bonney
water column and meltstreams it was hoped several specific objec-
tives could be realized:
1. establishment of the relative abundance of
selected trace metals in the Lake Bonney eco-
system, with consideration to their toxicity
and/or stimulatory effects;

9
2. determination of a relationship, if any,
between seasonal variations of nutrients
(particularly nitrogen and phosphorus)
and the observed phytoplankton activity
in the water column; and
3. evaluation of the significance of the
meltstreams as a source of both trace metals
and nutrients to Lake Bonney.

II. LITERATURE REVIEW
The following is a review of the available literature concerning
Lake Bonney, analysis of trace metals by flameless atomic absorption
spectrophotometry and the biogeochemistry of the trace metals
involved in this study.
Lake Bonney
Lake Bonney has been the subject of numerous investigations
since its ice cover was first cored in 1961. For simplification,
previously reported observations about the lake have been charac-
terized as physical, chemical, and biological.
Physical Observations
Armitage and House (2) were the first to break through the
permanent ice of Lake Bonney during their limnological survey of
the McMurdo area in late January, 1961. They found the ice cover
to be 4.2 m thick, and the temperature of the underlying water to
vary from a low of -2.4°C on the bottom (31 m) to a high of 8.0°C
at a depth of 12 m. They and other investigators [Angina et !}_. (10)
and Angino et .!l_. (16)] suggested the possibility of subterranean
springs as an explanation of the observed temperature profile. In
contrast, Hoare et .!l· (17) ruled out the possibility of geothermal
sources, and contended that solar radiation alone provided sufficient
energy to create the observed temperature gradient with depth.
Shirtcliffe and Senseman (18) also favored solar heating, and Shirt-
cliffe (19) gave evidence based on diffusion calculations that 10 m
10

11
of fresh water flowed onto the surface of Lake Bonney about 70 years
ago. He did, in fact, find this to be consistent with records
indicating an increase in lake depth of about 9 m between 1903 and
1911, which could account for the present-day mixolimnion.
Benoit et.!!_. (20) and Angina et~· (16) both observed an
increase in temperature in the water column throughout the season,
but Koob and Leister (21) noted a decrease in the region of the
chemocline between Noveni>er and December of 1965.
Angina et .!!_. (16) prepared a bathymetric map of Lake Bonney
based on data obtained during the 1961-62 austral summer, but it
appears that the scale of the map is incorrect, and a more recent
survey by a team from the University of Waikato (N. Z.) is more com-
plete (Figure 5). The contours evident in Figure 5 show that the east
lobe of Lake Bonney is rather steep sided and has a flat bottom.
Goldman et .!!_. (22) and Angina et .!!_. (16) arrived at slightly
different values for the morphometric parameters of Lake Bonney,
with the latter generally reporting smaller values (Table I).
The sediments of Lake Bonney have only recently attracted
attention, although Yamagata et .!!_. (23) did make passing mention of
the presence of halite (NaCl) and gypsum (Caso4·2H20). Concurrent
with the present study, Wilson et.!!_. (9) found the halite deposits
on the bottom of Lake Bonney to be at least 0.3 m thick, occupying
an area of 1. 1 km2. They also found layers of gypsum and aragonite

Bathymetric survey of Lake Bonney, Antarctica
Sur...ey by Uni~r1ity of V.Vikoto Antorc:tic Re1=rch Unit. bo~d on 35 t.ol.o!s c!r-ffied tt...ough ice Jm to Am thkk... Ootum:Dep1M ~ rekrle too datum ll"k pre-1i.onvne1 melt piezometric wrfoce) 1..(Jm below thcr N.Z.. beoch.mork on the wr:st side of the Loh Booney t..rl ood 1 . .(5m ~the US.G.S. bench-rnor\r. on the north 1ide of I~ hut. Nole' wbs~tly during the melt. the piezo~hic 1urfoce on.d woter ie-1 •<>Ml by LlSm, thu1 ohenng both depths on.d sho.e-lioe configurcition. O..plh1 shc-n ore to ""°'Ml ouetre. Ad:no..,fedge ...... nt G mode of the US.A.R.f> lcom from Vt..ginio Polytechnicol Institute ond Stole Un;.......rty IC<" per~nsion lo UM fdtee'n of their drill-holn.
l~' •Mori.er rodr. CO" slr.,.om •Holes drilled in ice ~ Riwen flowing in .kinuory 1974
c::J M<><oino end K•-c:;zi Send K,_ >lope>
E:;2J Bedroclr. outcropping on lake shore (Pu ond gronite)
~Oulwosh fens ond lttroces Jonvory 1974
From ice-fall off Sentinel Peak
From Hughes Glacier
12
From Sonas GW:i«
... From Hughfl Glacier
Figure 5. Bathymetric survey of Lake Bonney (courtesy of Dr. Terry Healy, University of Waikato, New Zealand).
1000m

13
TABLE I
~orphometric parameters of Lake Bonney as reported by Angina et tl· (16) and Goldman et tl· (22).
Parameter Angina et tl· ( 1964) Goldman et al. --
Area, km2 3. 18 4.08a
Maximum Depth, m 32.9b
Shoreline Length, km 12.3 16.5
Volume, m3 59.5 x 10⁶
Average Depth, m 18. 7 l8.7c
Maximum Breadth, km 0.86 0.85
Maximum Length, km 3.8 7. l 0
a The original text reports this as 24.08 due to a typographical error.
b Including the ice cover.
c Based on Angina et tl·
( 1967)

14
Past attention given to the ice cover on the lake has included
its optical properties and its role in the heat budget for the lake.
Goldman et ~· (22) reported that 21 per cent of the incident light
penetrated the ice cover, and one per cent reached the bottom. They
also detennined that the light transmission by the Lake Bonney ice
approached that of distilled water.
Estimates ·of water flow in and out of the lake are sparse. Lake
Bonney has no outlet, so that the only losses are by evaporation of
water and ablation of the ice. Ragotzkie and Likens (24) measured
the loss of ice from the surface of Lake Bonney to be 28 cm over
a 36-day period, including losses both by melting and ablation. These
same investigators found ablation on Lake Vanda, in adjacent Wright
Valley, to be 0.194 cm/day, which agrees fairly well with the estimates
of Angina et ~· (25) for Lake Vanda: 75 ± 15 cm per year.
The only previous quantitative estimates of inflow are those of
Angino et~· (16). Flow in the Sollas-LaCroix meltstream, which
enters the extreme eastern end of Lake Bonney, was detennined to be 0.4
cubic feet per second (cfs) on December 18, 1961, and the overall flow
to the lake was estimated to be 2.0 cfs. Coupled with an assumed flow
duration of 60 days, an annual inflow of 2.95 x 10⁵ m3 was calculated.
Ice loss was estimated by the investigators to be 2.4 x 10⁶ m3, yield-6 3 ing a net loss of 2.1 x 10 m. They felt that if the lake was not
indeed shrinking, the most likely explanation was inflow of water into
the lower depths.

15
Chemical Observations
Chemical analyses of Lake Bonney water have concentrated largely
on nutrients such as nitrogen and phosphorus, and upon the alkali
metals which constitute such a large part of the inorganic dissolved
matter. Table II illustrates a typical profile of the water column. A
very distinct increase in the concentration of all substances is seen
at the chemocline. Cation concentrations generally follow the order
Na>Mg>K>Ca. Total solids in the bottom water were reported by Angina
et~· (16) to be as much as 407.3 g/l.
A comparison of nutrient concentrations found by various inves-
tigators is found in Table III. Only Goldman (26) and Torii et!}_. (27)
reported finding nitrate, with the latter finding considerably higher
concentrations, up to nearly 6 mg/l. Significant ammonia levels were
reported by only Torii et~- (27), and all those values were less
than 0.500 mg/l NH4-N. Nitrite was found by all who analyzed for it,
and it has been found in highest concentrations in the monimolimnion.
Annitage (28) reported total inorganic nitrogen levels as high as 1. 1
mg/l in Lake Bonney, but comparison with an earlier publication [Angino
et!}_. (16)] shows this to be the nitrite concentration. Angina and
Annitage, it should be noted, believe that their nutrient data is sus-
pect because the water samples were not properly preserved, and the
analyses were delayed until after their return to the United States (28,29).
Annitage and Angina (29) noted considerable variation in nitrogen
levels in the mixolimnion but could not discern a pattern. They did
speculate that nitrogen was probably limiting to the ecosystem.

16
TABLE II
Representative distribution of alkali metals and chloride in Lake Bonney. Data collected on December 16, 1961 by Angina et~- (16).
Ion Concentration, mg/l
Depth, m Na+ ca2+ Mg2+ K+ Cl-
4.5 303 70 75 22 6R8
6 327 73 87 25 765
9 1670 166 383 112 3760
12 3780 316 1510 313 10,300
15 16,900 1110 13 ,000 1260 70,300
18 32,400 1410 23,000 2130 114 ,000
21 35,900 1460 25,300 2510 129,000
24 41,800 1510 25,800 2660 135,000
27 44,700 1500 25,900 2740 137,000
30 41 ,300 1540 25,900 2730 140,000

17
TABLE III
A comparison of nutrient concentrations found at comparable sites in Lake Bonney by several investigators.
Nutrient Concentration Source Site Depth, m o-P04-P NO--N ftOz-N NHrN 3
µg/1 mg/l µg/l mg/l
Anni tage and 11. 3 10 Noa 14 ND House, 1962 31 10 ND 40 NO (reference 7)
Angino et al., 3 4.5 0 ND 10 1964 - - 12 430 ND 30 T (reference 16 )b 15 1480 ND 150 T
24 80 ND 1100 T
Goldman, 1964 - l-2c 0 0.100 NRd NR (reference 26) 2-3 572 0.007
5 44 0.119 10 84 o. 176
Yamagata et Bl 5 0.37 NR 4.2 NR a 1 . , 1967 10 0.50 7.3 "'(reference 23) 14 0.34 70
21 0.47 312 28 0.47 308 32 NR 270
Tori i et _tl., El 5 0 0.099 8.4 0.031 1975 8.5 0 0.078 2.8 NR (reference 27) 10 0 0.519 4.2 0. 13
26 a 0.595 185 0. 143 32.5 0 0.543 123 0.227
a Not detected.
b Data reported f9r lower depths are not given here because examination of reported densities and other parameters suggests a sampling error.
c Depth below ice-water interface; ice thickness is about 4 m.
d Not reported.

18
Benoit et~· (20) suggested that nitrogen {as well as phosphorus)
might be flushed from the west lobe of Lake Bonney into the east
lobe due to the large input from the Taylor Glacier. They also
believed the sediments might be an important nitrogen pool.
The phosphate data shown in Table III shows the great disparity
among investigators. Angina et~· (16) reported high levels of
ortnophosphate, and Goldman (26) found intennediate values. It
might be noted that, in contrast to the east lobe, Torii et~· (27)
found up to 0.84 µg-at/1 (26 µg/1) P04-P in the west lobe of Lake Bonney.
Annitage and Angina {29) suspected that an increase in ortho-
phosphates they observed between November, 1961, and January, 1962,
was related to biological activity, but doubted that phosphorus was
limiting biological activity in the east lobe of Lake Bonney because
of the high levels they found.
Table IV compares the concentrations of sulfate, boron, and
silicate found by various investigators in the water column of Lake
Bonney. Not shown here are the sulfate values reported by Annitage
and House (7), which are considerably lower than those found by later
studies. Sulfate concentration is shown to increase with depth, a
maximal value of 3.5 g/l being found at the bottom. In spite of the
large amounts of sulfate and low oxygen levels found in the monimo-
limnion, no hydrogen sulfide has ever been reported in the water
column. Annitage and Angina (29) suggested that the low temperatures
in the monimolimnion may preclude activity of any sulfate-reducing
bacteria.

19
TABLE IV
A comparison of the concentrations of sulfate, boron, and silicate found at comparable sites in Lake Bonney by several investigators.
Concentration, mg/l
Source Site Depth, m so4 B Si02
Angina et al. (1964)a 3 4.5 67 Tb _c (reference 16) 6 115 6
9 115 T 7 12 456 2.0 7 15 2670 14.0 6 18 3010 28.0 21 2980 35.0 24 2960 39 .0
Yamagata et al. (1967) Bl 5 160 ( reference23T 10.5 480
14.5 2740 19 2980 25 3200 32 3530
Tori i et a 1. (1975)d El 5 11 2 4.38 (reference 27) 8.5 295 2 4.56
10 539 2 6.07 15 2758 16 15.9 26 3245 40 4. 10 32.5 3532 32 1.89
a Greater depths not included; see note in Table III.
b T = trace.
c Not reported.
d Some data was originally reported as g/kg; these were converted to table values by using the specific gravities reported by the same investigator.

20
Both Angina et al. (16) and Torii et al. (27) found very high -- --levels of boron in the monimolimnion--up to 40 mg/l as B--and as much
as 16 parts per million (ppm) of boron was found in soil samples
taken near Lake Bonney by Cameron et~· (30), who suggested that
these levels constitute a possible toxicity problem for bacteria in
the soils of the region.
Silicate was reported by Angina et~· (16) and by Torii et
al. (27), with the latter finding a distinct maximum of 15.9 mg/l
Si02 in the chemocline region. Yamagata et ~· (23) did not report
silicate values at depths comparable to those in Table IV, but at
another time they found between 0.79 mg/1 and 7.29 mg/l Si02 in the
water column. The low value was for surface waters and was undoubtedly
influenced by runoff because the sampling date was in January.
The only trace metals reported in profile for Lake Bonney are
manganese and zinc. The results of Annitage and Angina (29) are
reproduced in Table V. High levels of manganese were discovered
in samples from two holes, which were both in the east lobe of the
lake, but showed different distributions of manganese. Comparison
with their earlier work [Angina et Al_. (16)] indicated that site 4
was at the approximate center of the east lobe, while site 3 was
situated to the east. Site 4 was in deeper water. The maximum
manganese concentration at site 3 was found at a depth of 20 m
(8.0 mg/l), while at site 4 it was at the bottom (7.0 mg/l). The
values at s.ite 4 are generally lower than those reported for com-
parable depths at site 3. It should be noted that the sampling dates
differed by one month.

21
TABLE V
Trace Metals Reported in Lake Bonney by Annitage and Angina (reference 20). All values are mg/l.
Site 3a Site 4b
Depth, m Mn Zn Mn
11 0 Tc _d
14 0.4 0 1.5
17 4.0 0 3.0
20 8.0 0 4.0
23 7.0 0 5.0
26 6.0 0 4.5
29 6.0 0 6.0
32 .5 7.0
a November, 1961.
b December, 1961
c T = trace.
d Not reported.

22
Annitage and Angino {29) reported being unable to detect chromium
in Lake Bonney, but noted that zinc is present in trace quantities
less than one µg/l. Neither Angino et!}_. {16) nor Annitage and
House (7) could detect iron in the water column, although an iron
stain connected with a discharge from the Taylor Glacier has attrac-
ted the attention of several geologists (31, 32), and calcite
recovered from the Taylor Glacier by Stephens and Siegel (32) was
found to contain 0.68 per cent iron.
Boswell et!}_. (35) did report iron and other trace elements
in Lake Bonney, but it is difficult to interpret their findings
because they did not clearly indicate their sampling site and the
depth from which water was obtained. Apparently a single sample
was analyzed, most likely from the bottom of the lake. The concen-
trations of zinc, lead, bismuth, iron, manganese, and molybdenum
were reported as 150, <30, 7.1, 640, 23, and 8.7 µg/l, respectively.
The values reported for zinc, iron and, in particular, manganese are
at variance with the aforementioned results of Annitage and Angino (29).
While the total solids found (390.9 g/l) are similar to those
reported by Angina in the bottom waters of Lake Bonney, the given con-
centrations of chlorides and most macroelements appear high. A
chloride concentration of 248 g/l is given, along with concentrations
of sodium, potassium, magnesium, and calcium of 94.2, 3.9, 43.0,
and 1.2 g/l, respectively (cf. Table II).
Little has been done in the analysis of organic matter found in
Lake Bonney, although Parker et!}_. {33) have noted an apparent surge

23
in total organic carbon (TOC) in early December, and report values of
up to 32.2 mg/l of TOC in the water column. Soils in the region
of. the dry valleys are ahumic (34), so that sediments washed into
the lake would have minimal organic content. Goldman et al. (22)
noted strong absorbance at low wavelengths of 30 m water from
Lake Bonney and suggested the cause might be organic matter.
Biological Observations
A thorough review of the biological studies which have been
made of Lake Bonney is beyond the scope of this work, but a good
review may be found in Parker et .tl_. (36). Emphasis here will be
upon the phytoplankton and benthic algal mats.
Golanan et .tl_. (22) reported finding Ochromonas sp. and
Chlamydonomas spp. in the lake, while Annitage and House (7) repor-
ted a 11 Chlorella-like 11 alga. Koob and Leister (21) were able to
identify and isolate Chlamydomonas subcaudata, and recent work by
Parker et tl· (15) has shown that Chlorella vulgaris and Chlamydo-
monas sp. are most prevalent in the water column.
The composition of the benthic algal mats is described by
Parker et .tl_. (36): Schizothrix spp. and Phonnidium spp. dominate,
but Nostoc microscopicum, Oscillatoria brevis, Chlorella spp., and
Chlamydomonas spp. are also found. Such mats could play a major role
in the total biological productivity of the lake.
Primary productivity in the water column has been measured by
several investigators. Koob and Leister (21) found 0.36 mg C/m3hr
fixed at 9 m depth, and 0.73 mg C/m3hr fixed at 13 m. Goldman et

24
al. (22) reported 31 mg C/m2day fixed to a depth of 10 m. Goldman (26)
set the total fixation at 30.7 mg C/m2day and the average at three
mg C/m3day. A personal conrnunication from D. K. Koob to Goldman (37)
reported a peak in the 14c uptake two meters lower than the cell count
peak, which he thought might be a sampling error. Koob and Leister (21)
also noticed a great effervescence in their sampling hole on December
11, 1965, after several hours of drilling. This was attributed to
oxygen supersaturation caused by the photosynthesis of organisms under
the ice, and Benoit et .!!_. (20) have indeed recorded oxygen levels in
the mixolimnion of Lake Bonney as high as 30.5 mg/l.
Goldman (26) found nitrogen to be limiting and a trace element
mixture slightly inhibitory to algal growth in nearby Lake Vanda, and
the possibility of a factor limiting to production in Lake Bonney has
been considered by several investigators. Benoit et.!!_. (20) did not
believe low light levels were responsible for the low biomass in the
lake, and Armitage ind Angina (29) suggested nitrogen was the most
likely limiting nutrient. The question remains open.
The most detailed study of the bacteria of Lake Bonney is by
Lane (38), who noted the dominant forms as being Micrococcus, Pseudo-
monas, Brevibacterium, Arthrobacter, Bacillus, and Acinetobacter, the
latter being apparently the first occurrence reported in Antarctic
soils or aquatic ecosystems. Based primarily upon the work of Lane,
Parker et .!!_. {15) reported 30 per cent of the bacterial isolates
from Lake Bonney were nitrate reducers and 20. per cent were sulfate
reducers. The latter is not surprising considering the earlier work

25
of Barghoorn (39), who isolated Desulfovibrio from small ponds in
the nearby Wright Valley, and Benoit et !l_. (20), who reported
sulfate reducers in the Taylor Valley itself. Lane has also indi-
cated the probability of "washout" of the bacterial community from
the meltstreams into the lake proper, and in general suggested the
bacterial fluctuations in the lake were controlled by outside factors
rather than by biological activity within the lake.
Benoit et 21._. (20} noted sulfide in the sediments from the
west lobe and suggested that although sulfide ma,y not be present in
the water column, anaerobic activity might occur when heterotrophic
organisms predominate during the Antarctic winter.
Analysis of Trace Metals by Flameless Atomic Absorption
Since the first publication on atomic absorption by Walsh (40)
in 1955, the use of atomic absorption spectrophotometry (AAS) in
the analysis of trace metals has been well documented, including
representative works by Kahn (41, 42, 43) and by Burrell (44).
In conventional AAS a sample is nebulized into an acetylene-
ai r or acetylene-nitrous oxide flame while the absorption at a
particular wavelength is measured. Flameless AAS (FAAS) dates from
the work of L'vov (45), and generally utilizes a graphite tube
furnace or carbon rod analyzer to heat the sample. The method offers
good precision as well as improved absolute sensitivity over con-
ventional AAS by as much as a factor of 1000 (46, 47, 48).
Representative detection limits for a modern, corrmercially available
instrument are given in Table VI. In addition, conventional AAS

26
TABLE VI
Detection limits of the HGA-2100 graphite furnace for selected trace metals (after Perkin-Elmer Corporation, reference 20).
Detection Limit * Metal Absolute, picograms Relative, µg/1
Co 40 0.4
Cu 5 0.05
Fe 2 0.02
Mn 1 0.01
Mo 50 0.5
Ni 100 1. a
* Based on a 100 µl sample volume.

27
usually requires extraction procedures when working with saline water
samples, whereas there is now evidence that some analyses can be
accomplished directly using the graphite furnace.
A study by Segar and Gonzalez (49) showed that selective
atomization, which allows salts to be removed before atomization of
the metal of interest, allows direct analysis of seawater for Fe, Ni,
Co, V, and Mn. The technique was not successful with Zn, Cd, Pb, or
Ag, however. Somewhat poorer precision compared to extraction methods
was compensated for by greatly increased speed in the analysis.
Ediger (51) compared the analysis of copper in seawater using the
Perkin-Elmer HGA-2100 graphite furnace with direct injection and an
extraction procedure prior to injection into an HGA-2000 graphite
furnace. Results are shown in Table VII. Agreement is very good for
such low concentrations. Analysis of arsenic in spiked seawater samples
by direct injection, a more difficult analysis than that of copper, was
reported to give a relative standard deviation of 5.6 per cent.
Ediger also reported on the use of al11llonium nitrate to convert matrix
salts to more volatile fonns. The reaction with sodium chloride to
produce more volatile compounds is illustrated in Table VIII. The
armnonium nitrate, sodium nitrate and anmonium chloride volatilize out
of the graphite furnace at charring temperatures near 500°C; the
level of residual salts is then low enough to allow a deuterium back-
ground corrector to compensate for the remaining matrix absorbance.
Cruz and Loon (52) investigated similar additions using formic acid
and ammonium oxalate, but reported little success.

28
TABLE VII
A comparison of direct injection and extraction procedures for the analysis of copper in saline water by flameless atomic absorption. All values reported as µg/l. (after Ediger, reference 51)
Method of Analysis
Sample No. Extraction Direct Injection
SN 3.8 3.4
6N 2.3 2.3
8N 1. 4 0.9
12N 1.2 1.0
13N 1.3 1. 7
22N 0.6 1.8
25N 0.7 1.3

29
TABLE VIII
* The use of ammonium nitrate to volatilize matrix components for flameless atomic absorption analyses. (after Ediger, reference 51}
Compound ·M.P;. 0 € 0 B.P., C
NaCl 801 1413
NH4N03 170 210 (decomp.}
NaN03 307 380 (de comp.}
NH4Cl sublimes at 335
*

30
Fuller (53) found copper and nickel were lost to some extent
by pre-atomization temperatures exceeding 600°C, and reconmended
strict control of heating times and temperatures to minimize errors
in the analysis of these metals. It should be noted that Fuller
used an HGA-70 graphite furnace in his study; the more sophisticated
HGA-2100 (used in the present study) has more rigidly controlled
times and temperatures.
Segar and Gonzalez (54) utilized selective volatilization to
widen the applications of the graphite furnace, while Kahn (55) and
Kahn and Slavin (56) demonstrated better detection limits were
possible by interrupting the gas flow.
Cruz and Loon (52) studied the analysis of Cd, Co, Cu, Ni, Pb,
and Zn in silicate rocks, sewage, and blood using a graphite furnace.
They found enhancement in the atomic absorption of Ni, Co, and Zn,
and particularly severe suppression with the volatile elements Cd,
Pb, and Zn. Calcium was found to cause the greatest suppression
among the matrix salts. The technique of standard additions was
deemed extremely useful for FAAS, but the authors cautioned users
of the short linear regions. This study also showed better sensi-
tivity was possible by using nitrogen as the purge gas in place or
argon.
A report by Segar (57) indicated that he preferred pre-concentration
from a salt matrix prior to analysis by FAAS because of the sensitivity
loss due to matrix effects. He employed direct injection of the
extract to analyze saline waters for Ag, Co, Cd, Cu, Ni, Zn, Pb, and Fe.

31
A Brief Biogeochemistry of Select Trace Metals
What follows is a description of the occurrence, reactions,
and biological and limnological importance of several trace metals:
iron, manganese, copper, cobalt, molybdenum, and nickel. An attempt
has been made to discuss eacn of these elements in its turn, but at
times there exists an unavoidable and natural overlap. Emphasis is
on microbiota, because only these forms occur in Lake Bonney.
Iron
Iron is the fourth most abundant element in the earth 1s crust,
and the second most abundant metal; it is virtually ubiquitous in the
hydrosphere. Silvey (58) found it to be present in over 99 per cent
of 243 samples of California waters. It is generally the most abun-
dant trace metal found in both oceanic and fresh waters, with average
concentrations of approximately 10 µg/l and 670 µg/l, respectively
(rab le IX).
Important natural compounds of iron include magnetite (Fe3o4),
limonite (2Fe2o3·3H20), hematite (Fe2o3), and siderite (FeC03). In
aqueous so 1 uti ons, iron may exist as Fe (I I) (·ferrous iron) or Fe (I I I)
(ferric iron); the former can exist only in the absence of oxygen, while
the latter is nearly completely insoluble. At pH 7, for example,
Ruttner (59) reported a solution of ferrous bicarbonate can exist
only if the water contains less than 0.5 mg/l of dissolved oxygen.
A higher dissolved oxygen level or higher pH causes the precipitation
of ferric hydroxide:
4 Fe(HC03)2 + 2 H20 + o2 = 4 Fe(OH) 3 + 8 C02

32
TABLE IX
Geochemical parameters for selected trace metals. (after Hedgpeth, reference 60)
Abundance in Pri nci pa 1 Abundance in Metal Seawater, mg/1 Species Streams, µg/1
Co 0.0005 Co2+ 0. 1 CoS04
Cu 0.003 cu2+ 7 CuS04
Fe 0.01 Fe(OH)J(s) 670
Mn 0.002 Mn2+ 7 MnS04
Mo 0.01 Moo~- 0.6
Ni 0.002 Ni 2+ 0.3 NiS04

33
At lower pH values the precipitation is slower, and detectable amounts
of iron may be found in acid waters even when they are saturated
with oxygen.
Jobin and Ghosh (61) and Theis and Singer (62) have shown that
Fe(II) is complexed by dissolved organic matter and may then be
resistant to oxidation even in the presence of oxygen. Owing to
the tendency of Fe(III) to fonn strong complexes, StulllTI and Morgan (63}
found they could not distinguish between particulate and dissolved
Fe(III) by membrane filtration. Competition by calcium and magne-
sium cations, they found, decreases the tendency to form soluble
complexes.
Cotton and Wilkinson (64) found no evidence for the existence
of any definite iron (III} hydroxide, Fe(OH) 3• The red-brown
precipitate commonly called ferric hydroxide, they suggested, should
be described as hydrous ferric oxide, Fe2o3·nH2o. At least part
of such precipitate appears to be FeO(OH), which exists in at least
two definite, crystalline forms.
O'Connor (65) stated that the most comnon fonns of ferrous iron
in natural waters are Fe2+ and FeOH+. Although greatly limited in
solubility at neutral pH, the ferric fonn of iron is found princi-
pally as Fe(OH) 2+ and Fe(OH} 4-. Equilibrium values relating to these
fonns, as well as other compounds of iron, may be found in Table X.
Cytochrome oxidase is an iron-containing enzyme found in all
aerobic cells, and all plants have a small but significant oxidative
respiration that utilizes the cytochrome-cytochrome oxidase system.

94
TABLE X
Some equilibria governing the solubility of iron in natural waters.
Equilibrium pK Vafoe
Fe(OH)2(s) = Fe2+ + 20H- 15. la
2+ 2-FeC03(s) = Fe + co3
FeS = Fe2+ + s2-
Fe(OH) 3 = Fe3+ + 30H-
a at 25°C (after O'Connor, reference 65).
b at 18°C (after Weast, reference 66).

35
Cellular activity is dependent upon cytochrome oxidase action (and
hence upon iron); when the cytochrome oxidase action is blocked, as
in cyanide poisoning, the cells cannot function. Copper, as well as
iron, is involved in the cytochrome electron transport system, as is
illustrated in Figure 6.
Iron is also an important component of ferredoxin, also called
photosynthetic pyridine nucleotide reductase, which is a non-heme
protein widely distributed in both plant and animal tissue. Ferre-
doxin has an important role in photosynthesis; it acts as an electron
acceptor in the fixation of carbon dioxide into acetyl-CoA, fanning
pyruvic acid (67).
Many other enzymes and proteins incorporate iron, including
nitrogenase (utilized in nitrogen fixation), catalase (which decom-
poses toxic peroxides), and xanthine oxidase (utilized in purine
metabolism) (68).
In view of the preceding, and considering that iron is also
essential for chlorophyll synthesis (69), it is not surprising that
of all the micronutrients required for algal growth, iron most often
approaches macronutrient status, often being required in mg/1
quantities.
Hutchinson (70) listed iron as an essential nutrient for
Chlorella pyrenoidosa, and Gerloff and Skoog (71) found that the
critical level for the growth of Microcystis aeruginosa was 100 mg/l
in the cells. Morton and Lee (72), using Chlorella, Anabaena, and
Gloeotrichia, discovered that iron stimulated the growth of

A
3• Fe
Cyt b
36
Cyt c,c1
2• Cu
2• Fe
3• Fe
Cytochrome Oxidase: Cyt a,a1
Figure 6. Cytochrome oxidase. Arrows show the direction of flow of electrons in a portion of the cytochrome electron transport system. The sequence Cu+F~ in cytochrome oxidase is probable but not certai~. After Frieden, reference 68.

37
blue-green algae more than green algae, independent of the phos-
phorus or manganese concentrations present. They did not suggest
a mechanism for the preferential stimulation of blue-greens, but
ruled out the effects of iron tying up phosphorus or of iron tying
up impurities toxic to blue-greens but not greens. Goldman (73)
found that iron stimulated photosynthetic carbon fixation in five
of the six lakes he tested in New Zealand.
Due to the insolubility of ferric hydroxide, iron is not likely
to be found in high concentrations in the epilimnion of a lake;
Hutchinson (70) suggested a range of 50-200 pg/l. However, under
reducing conditions with little or no dissolved oxygen and low pH,
such as may be found in the hypolimnion of a stratified lake, the
iron may be reduced to the more soluble ferrous state, and higher
concentrations may be found.
In this manner the hypolimnion of eutrophic lakes can act as
an iron trap, with iron being precipitated during circulation and
restricted to the hypolimnion during stratification. Reducing
conditions might also be such that hydrogen sulfide is produced, and
iron sulfide can be precipitated.
Levels of iron on the bottom of pennanently stratified lakes
tend to be higher than average. Weimer and Lee (74) found 0.37 mg/l
total iron in the mixolimnion of Lake Mary (Wisconsin), and 0.81 mg/l
in the monimolimnion; they found little change seasonally. Ruttner (59)
noted very high levels of iron in two meromictic lakes: 18 mg/l in
the Krottensee (Austria) and 41 mg/l in the Zellersee (West Gennany).

38
Some bacteria can derive their energy from the oxidation of
iron compounds. Leptothrix ochracea is a facultative iron organism
(it can also utilize manganous salts), while Spirophyllum ferrugineum
is obligate (70). Siderocapsa coronata is characteristic of the
chemocline region of meromictic lakes, c01T111only at dissolved oxygen
concentrations of 0.12-0.3 mg/l.
A study of Lake Mendota (Wisconsin) by Delfino and Lee (75)
showed that during summer stratification the hypolimnion became
enriched in manganese, with a manganese to iron ratio of about 5:1.
The ratio of manganese to iron in the sediments, however, was 1:19,
showing that during stratification reducing conditions were not
sufficient to release iron.
Plumb and Lee (76) found 15-20 per cent of the iron in Lake Mary
was associated with organic matter. Such association is important,
because Reid (77) s"tates that one of the forms of iron most readily
available to phytoplankton is an amorphous mass of ferruginous
organic complex. Also impressive is the effect of organics on the
solubility of iron compounds. Rashid and Leonard (78) demonstrated
that the presence of humic acid dramatically increased the solubility
of several metal compounds. They measured the quantities of various
metals required to cause precipitation with sulfide alone, with
humic acid alone, and with sulfide and humic acid together. The
results were definitive; in every case more metal was required to
precipitate the sulfide when humic acid was present. Iron, manganese,
nickel, and cobalt were required in greater amounts by factors of 42.9,

39
18.7, 8.0, and 11.6, respectively. A similar test with the carbonate
salts yielded like results, with factors of 26.2, 14.5, 2.7, and 5.0,
respectively. The effective increase in solubility was most marked
with iron, and the relative increase in each test was Fe>Mn>Cu>Ni.
Thus, the presence of organic matter can drastically influence the
solubility of trace metals.
Manganese
Manganese constitutes approximately 0.085 per cent of the
earth's crust (64), and among the heavy metals only iron is more
abundant. Pyrolusite (Mn02) and rhodochrosite MnC03) are c011111on ores.
There are several other oxides, including manganosite (MnO),
hausmannite (Mn3o4), pyrochroite (MnO·H20), and manganite (Mn2o3.tt2o). In addition, several indefinite hydrated fonns of the general fonnula
ntr1nO·nMno2·2H2o are known (70). The abundance of manganese in the
sea and in streams is about 2 µg/1 and 7 µg/1, respectively (Table IX),
but Morgan and Stumm (79) indicated levels up to 10 mg/1 can be
found in reservoirs.
The chemistry of manganese resembles that of iron very closely.
Both metals are stable as the divalent ion under low redox potentials
and very low pH, and both fonn fairly insoluble carbonates, sulfides,
and silicates in neutral or basic solutions (80). Like iron, the
most colllllon fonns in natural waters are Mn2+and MnOH+ (65). Table
XI gives several equilibrium values relating to these and other
manganese compounds. Note that manganous sulfide is more soluble
than ferrous sulfide (Table X).

40
TABLE XI
Some eQuilibria governing the solubility of manganese in natural watersa.
Equilibrium pK Value
Mn2+ + H20 = MnOH+ + H+ 10.6
2+ -Mn(OH) 2(s) = Mn + 20H 13
2+ -MnC03(s) = Mn + COJ 10.4
MnS(s) = Mn2+ + s= 15.7b
a at 25°C (after O'Connor, reference 65).
b after Leckie and James, reference 81.
41
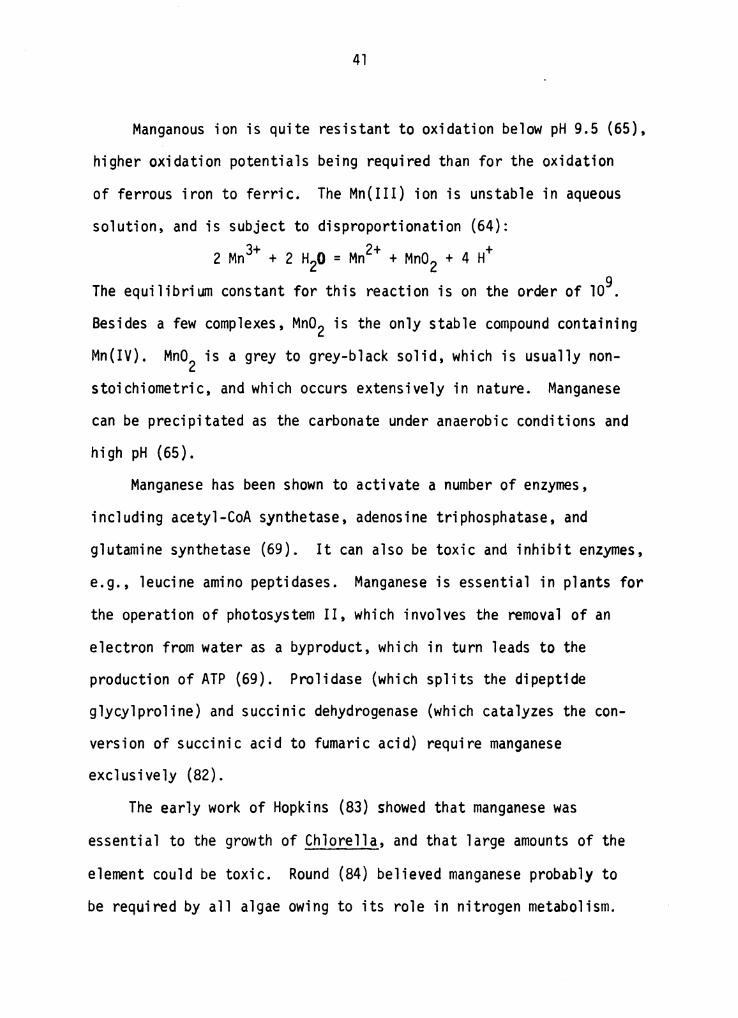
Manganous ion is quite resistant to oxidation below pH 9.5 (65},
higher oxidation potentials being required than for the oxidation
of ferrous iron to ferric. The Mn(III) ion is unstable in aqueous
solution, and is subject to disproportionation (64}: 3+ 2+ + 2 Mn + 2 H20 = Mn + Mn02 + 4 H
The equilibrium constant for this reaction is on the order of 109.
Besides a few complexes, Mn02 is the only stable compound containing
Mn(IV). Mn02 is a grey to grey-black solid, which is usually non-
stoichiometric, and which occurs extensively in nature. Manganese
can be precipitated as the carbonate under anaerobic conditions and
hi gh pH ( 65) .
Manganese has been shown to activate a number of enzymes,
including acetyl-CoA synthetase, adenosine triphosphatase, and
glutamine synthetase (69}. It can also be toxic and inhibit enzymes,
e.g., leucine amino peptidases. Manganese is essential in plants for
the operation of photosystem II, which involves the removal of an
electron from water as a byproduct, which in turn leads to the
production of ATP (69}. Prolidase (which splits the dipeptide
glycylproline} and succinic dehydrogenase (which catalyzes the con-
version of succinic acid to fumaric acid) require manganese
exclusively (82).
The early work of Hopkins (83) showed that manganese was
essential to the growth of Chlorella, and that large amounts of the
element could be toxic. Round (84) believed manganese probably to
be required by all algae owing to its role in nitrogen metabolism.

42
He noted photosynthesis was lowered in manganese-deficient cells,
but that there was no inmediate effect on respiration, nitrate
reduction, or the oxidative assimilation of glucose in darkness.
On occasion, manganese has been found to be limiting in
natural waters. Goldman (73) found that phytoplankton activity in
Lake Nerka (Alaska) was stimulated by the addition of manganese,
and four of five lakes he tested in New Zealand showed similar
results, with the productivity in Lake Sarah increasing 80 per cent
over the control. In addition, Harvey (85) found manganese to be
possibly limiting to Chlamydomonas in the English Channel. He
also found deprivation of manganese caused a lag period in Chlorella,
and that additional manganese alone was not sufficient for recovery,
but that a period of illumination was required also.
Gerloff and Skoog (71) found that a cell content of 10 ppm of
manganese in M;crocystis aeruginosa was critical to growth. They
also showed antagonism between manganese and iron (Table XII). In
cultures containing 0.02 mg/l iron, optimum yield was obtained
with 0.02 mg/l manganese, and increased manganese levels sharply
decreased growth. In cultures containing 1.0 mg/l manganese, an
increase in the concentration of iron from 0.05 mg/l to 0. 10 mg/l
greatly increased the growth. They expressed doubt, however, that
manganese affected iron availability in the lakes they studied to
the extent of limiting algal growth because all the algal samples
collected from lake blooms contained far more iron than manganese,
generally in the range of from 5:1 to 13:1. Moreover, Microcystis
grew excellently even with 4.0 mg/l manganese.

43
TABLE XII
The effect of manganese concentration in the culture solution on the iron requirement of Microcystis (after Gerloff and Skoog, reference 71).
Concentration in Culture Dry Weight of Solution, mg/l Algae, mg
Fe Mn
0.00 0.00 142 0.02 173 o. io 142 0.50 18 1.00 3
0.02 0.00 250 0.02 251 o. io 189 0.50 98 1.00 21
0.05 0.00 272 0.02 268 o. io 290 0.50 177 1.00 63
0.10 0.00 286 0.02 283 0.10 271 0.50 255 1.00 177
44
Gerloff and Skoog also were able to demonstrate an antagonism
between manganese and calcium. They concluded that in the hard
waters studied even high levels of manganese (4 mg/l) would be
unlikely to interfere with Microcystis growth and subsequent bloom
development. And though it might appear that high calcium content
might lead to manganese deficiency, such was not indicated in their
experiments.
Knauer and Martin (86) found the levels of manganese and
copper (as well as three other metals) in algae tended to vary simul-
taneously in Monterey Bay (California), while the concentrations in
the water column showed little seasonal differences. Kneip and
Lauer (87) found the concentration factor for manganese in algae
in an estuarine system to be about 700.
Delfino and Lee (75) observed the total manganese in the hypo-
limnion of Lake Mendota increased from 0.02 mg/l to 0.58 mg/l during
the summer stratification and then fell again to the previous levels
after fall overturn. Both a decrease in dissolved oxygen and a
decrease in pH were responsible for the increased levels of manganese
in the hypolimnion, they concluded. The relationship between man-
ganese and iron here has been mentioned previously.
Rashid and Leonard (78) found that relatively insoluble manganese
compounds were solubilized by humic acid: manganese carbonate to the
extent of 54 mg per gram of humic acid, and manganese sulfide to the
extent of 337.5 mg per gram of humic acid. Cobalt, copper, and nickel
salts were also tested, and the manganese salt proved the least
solubilized of the carbonates, but by far the most solubilized of the
45
sulfides. The authors emphasized that the quantities of the
various metals dissolved in blanks were less than l mg in the case
of the carbonates, and 0.03-7.9 mg for the sulfides. The results
are surrmarized in Table XIII.
Copper
Despite its colTDTion use, copper is not very abundant in the
earth's crust, being present to the extent of about 0.001 per cent
(88). The principal ores are chalcopyrite {CuFeS2) and chalcocite
(cu2s), although other naturally occurring forms include cuprite
(Cu2o), azurite {2CuC03Cu{OH)2), and malachite (Cuco3·cu(OH)2).
It is present in seawater and stream waters in concentrations of
about 3µg/l and 7 µg/l, respectively (Table IX).
Copper occurs primarily in two oxidation states, Cu(I) and Cu(II).
Free Cu(!) ion can exist in aqueous solutions only in exceedingly
low concentrations, because it is subject to disproportionation:
2 Cu+ = Cu + Cu2+ K ; 106
The only cuprous compounds stable in water are the highly insoluble
ones like CuCl or CuCN (64). The divalent state is the most important, and most cuprous
compounds are fairly readily oxidized to the cupric state. Most
cupric salts dissolve readily in water and yield the cupric ion.
Many complexes can be formed with copper, including one with
ammonia which is deep blue in color, Cu{NH3)42+. Halide ion complexes - 2- ( ) may also be formed, e.g., CuC1 3 and CuC1 4 88 .

46
TABLE XII I
Quantities of various metals (in mg} solubilized by each gram of humic acid from insoluble metal carbonates and sulfides at pH 7.0 (after Rashid and Leonard, reference 78).
Metal Carbonates Sulfides
Co 250.0 90.0
Cu 55.0 35.5
Mn 54.0 337.5
Ni 200.0 0.0
Zn 134.0 23.0
47
A conmon lab salt is blue cupric sulfate, nonnally a penta-
hydrate. Upon heating to ll0°C four waters of hydration are lost,
and on further heating to 150°C, anhydrous Cuso4 is produced which
is colorless.
Copper compounds are quite toxic; alkaline cupric sulfate,
Cuso4·Cu(OH)2--also known as Bordeaux mixture--is an excellent
fungicide.
Both cuprous and cupric sulfides are quite insoluble, with
pKsp values of 47 and 44, respectively.
Biologically, copper is a two-edged sword: it is essential in
small amounts, but toxic in larger doses. Its presence in cytochrome
oxidase, which was discussed in conjunction with iron, was regarded
by Frieden (68) as "the ultimate in the integration of the functions
of iron and copper in biological systems" (Figure 6). It is also a
component of tyrosinase, ascorbic oxidase, urate oxidase, and plasto-
cyanin (89, 90).
Many of the studies of copper relate to its toxicity. Fitzgerald
and Faust (91) found 0.5 mg/l Cu toxic to Chlorella pYrenoidosa for
exposure periods of seven days, regardless of whether the copper
sulfate used was chelated with citric acid to prevent precipitation.
Greenfield (92) observed inhibition of the rate of photosynthesis
of Chlorella vulgaris at levels of cuso4 equivalent to 0.06 mg/l Cu.
A concentration of 0.32 mg/l Cu resulted in a 50 per cent decrease
in photosynthetic activity. An exposure period of about 20 minutes
was required for maximum inhibitory influence. A slight depression

48
in the rate of respiration was also noted.
Nielson et~- (93) found not all algae reacted to excess
copper concentrations in the same way. They found that the diatom
Skeletonema costatum bound the copper by excreting large amounts of
organic matter, whereas this did not occur with the green alga
Chlorella pyrenoidosa. Copper was also found to inhibit the libera-
tion of autospores in Chlorella, and without cellular division the
accumulation of metabolic end-products caused a decrease in the
rate of photosynthesis.
Maloney and Palmer (94) demonstrated the selective toxicity of
Cuso4 for some diatoms, green algae, and blue-green algae. At 0.5 mg
Cu/l, the copper sulfate was toxic to 100 per cent of the diatoms
and to 57 per cent of the blue-greens tested, while it was effective
against only 37 per cent of the greens. At a concentration of 0. 12
mg Cu/l it was effective against only 33 per cent of the diatoms and
28 per cent of the blue-greens, having no effect at all on the green
algae.
Oxygen has an effect on copper toxicity. Hassal1 (95) found
that copper salts in unshaken test vessels inhibited the respiration
of Chlorella vulgaris at concentrations of 63.5 mg Cu/l and lower,
while in shaken vessels levels 100 times as great were not inhibitory.
It was thought that a lack of oxygen was the major factor affecting
the increased toxicity, and he noted the effect was not found for
eleven other metals tested, including manganese and nickel. Similar
results were obtained by McBrien and Hassall (96) who found increased

49
copper concentrations caused greater inhibition under anaerobic con-
ditions but little difference under aerobic conditions when compared
to cells not subjected to copper treatment. They suggested different
mechanisms for copper binding might occur under aerobic and anaerobic
conditions.
Hassall (97) also found that light increased the toxicity of
copper sulfate in Chlorella vulgaris, and that the copper concen-
tration limiting to growth under photosynthetic conditions was
about 10 per cent of that under chemotrophic conditions.
Fitzgerald (98) has shown certain blue-green algae (Micro-
cystis aeruginosa, Anabaena circinalis and Gloeothrichia echinulata)
to be killed by 0.5-1.0 mg/l Cuso4, while more than 3 mg/l was
required to kill the green alga Chlorella pyrenoidosa.
Hassall (97) concluded from a study of Chlorella vulgaris that
the phosphorus metabolism of growing cells was severely disturbed
when the ratio of sorbed copper to nucleotide phosphorus rose
above 0.2 or, alternatively, that copper rendered the cells permeable
to solutes. He found cells supplied with glucose as an energy
source grew in higher copper concentrations than those depending
upon photosynthesis.
Copper toxicity is obviously extensively modified by many
environmental factors, and Parker (99) has noted blue-green
algae growing in intimate association with copper ore from mines in
the Mohave Desert. Nielson et !]_. (93) found that ten times as much
copper was required at pH 5 as compared to pH 8 to cause an equal

50
decrease in the rate of photosynthesis of Chlorella pYrenoidosa.
Periodic algal blooms have been noted in at least one instance
to depend upon available copper (100), and Kneip and Lauer (87)
gave a concentration factor of 100 for algae in seawater.
A study by Ferguson and Bubela (101) showed that Cu(II) and
other ions were readily sorbed onto the particulate organic matter
on algal suspensions of both Chlamydomonas spp. and Chlorella
vulgaris, and that Cu(II) sorption occurred to an appreciable extent
even in strong brines. There appeared to be no dependence of the
sorption upon the proportion of whole cells in the suspension,
implying that the metal sorption sites were readily available to metals
in the bulk of the solution. In both Chlorella and Chlamydomonas
phosphates were found to precipitate the metals.
In an investigation of copper in the muds of several Wisconsin
lakes, Nichols et~· (102) found that copper tended to concentrate
in the deeper waters. Rough calculations suggested that the bulk
of the copper applied to Lake Monona to control algal blooms
remained as a deposit in the lake mud. Wallmeyer (103) found less
than 0.04 mg/l Cu in a Virginia reservoir subject to treatment with
copper sulfate. Furthennore, he could not demonstrate copper release
from sediment even under conditions of low pH (4.0) and low dissolved
oxygen (1. 1 mg/l).
Even though basic copper carbonates presumably could precipi-
tate in hard waters, Hutchinson (70) found little evidence for this
in untreated lakes. He also stated that copper shows little vertical

51
variation even at the height of summer stratification: it does not
increase under reducing conditions, as do iron and manganese. He
also noted some evidence that biological activity can provide the
conditions to reduce copper to the metallic state.
Cobalt
Cobalt always occurs in nature in association with nickel, and
usually with arsenic (64); common forms include cobaltite (CoAsS),
linneite (Co3s4), smaltite (CoAs 2), and spherocobaltite (CoC03) (66).
Its concentration in seawater and freshwater streams is about 0.5 µg/l
and 0.1 µg/1, respectively (Table IX).
In aqueous solutions, the important oxidation states of cobalt
are Co(II) and Co(III). Co(III) itself is unstable in aqueous solution,
but stable complexes are exceedingly numerous, with Co(III) showing
a particular affinity for nitrogen donors, e.g., ammonia and amines.
Cobalt(!!) sulfide can be precipitated from solution, and,
upon standing under acid conditions, the precipitate becomes markedly
less soluble. A proposed explanation is that, in the presence of
air, sulfide ion is oxidized and the precipitate is transformed into
co2s3 or Cos2,, both of which are quite insoluble (64). Cobalt(II)
sulfide precipitated in the absence of air has been found to remain
soluble in acid indefinitely.
An important Co(III) complex that occurs in nature is vitamin s12 ,
which contains cobalt in a porphyrin-like ring coordinated by four
nitrogen atoms, and a fifth position in the octahedron being filled
by an adenine nitrogen; the sixth position is often filled by a

52
cyanide ion, but the ligand occupying this position--which seems to
be the active site of the enzyme--is variable (64).
Vitamin s12 catalyzes the intermolecular conversion of
methylmalonyl-CoA to succinyl-CoA, thus facilitating further metabolism
of methylmalonyl-CoA through the citric acid cycle {67). Parker (104)
stated that 70 per cent of all fresh and marine plankton algae
require some form of vitamin s12 , more often than any other metabolite.
In addition to its role in vitamin s12 synthesis, cobalt is also
necessary for the action of carbo~peptidases, and can serve as a
co-activator of malate dehydrogenase and carboxylase in some
organisms (87, 88).
Over 20 years ago, Holm-Hansen et!]_. (105) demonstrated that
cobalt was an essential nutrient element for four species of blue-
green algae, including two nitrogen-fixers and two non-nitrogen-fixers.
Maximum growth of Nostoc muscorum {a nitrogen fixer) was obtained
with the addition of 0.40 µg Co/l. The cobalt requirement was
found to be adequately replaced by minute amounts of vitamin s12 .
The ability of Chlorella to synthesize vitamin s12 has been cited
by Round (84).
Parker (104) found direct correlations with increases in cobal-
amines and blooms of Chlamydomonas sp. in a small goldfish pond.
This and other vitamins apparently entered the pond solely in rain-
water, and concentrations of vitamin s12 up to 20 picograms per ml
(pg/ml) were found in rainwater in the St. Louis (Missouri) area.

53
Goldman (73) made individual additions of vitamin B12 and
cobalt to the waters of Lake Nerka (Alaska), and found that 14c uptake was stimulated. Eight of ten New Zealand lakes also
responded to similar treatment, with Lake Wakatipu showing a 127
per cent increase in production.
Krauskopf (106) showed cobalt and nickel to be among the metals
most strongly absorbed from seawater onto the hydrated oxides of
iron and manganese, and hypothesized that organic reactions reduced
levels in the sea even further. The carbonates and sulfides of
cobalt, particularly the former, are greatly solubilized by humic
acid (Table XIII); cobalt carbonate, in fact, reacted more strongly
than any of the other metal carbonates examined.
Molybdenum
This element occurs only to a small extent in the earth's crust,
about 0.0001 per cent, chiefly as molybdenite (Mos2), but also as
molybdates such as wulfenite (PbMo04) (64). Its occurrence in
seawater and stream waters is about 10 µg/l and 0.6 µg/l, respectively
(Table IX).
Molybdenum is a constituent of xanthine oxidase, aldehyde oxidase,
and nitrate reductase, which catalyzes the reaction between nitrate
and nicotinamide-adenine dinucleotide (NADH):
N03- + NADH + H+ = N02- +NAO++ H20 (67, 89)
Parker (87) noted that algae grown on anmonia nitrogen sources show
essentially no requirement for molybdenum.

54
Holm-Hansen et~- {105) determined a marked requirement for
molybdenum by Calothrix parietini in the absence of fixed nitrogen,
but could not demonstrate this in the presence of fixed nitrogen. A
definite requirement for molybdenum in the presence of nitrate was
established for Diplocystis aeruginosa (Microcystis aeruginosa), a
species which does not fix its own nitrogen. Vega et !.]_. {107) found the role of Mo in nitrate reduction in
Chlorella fusca limited to the conversion of nitrate to nitrite. In
addition, they found that molybdates in concentrations up to l µM
{96 µg Mo/l) had no toxic effects, but that a 1 nft1 {96 mg Mo/l) was
inhibitory to growth.
Goldman (108) demonstrated that Castle Lake (California) was
molbdenum limited, largely due to the strong absorption of molybdate
ion by the hydrated oxides of iron and manganese. The natural Mo
concentration in Castle Lake was below 0.2 µg/l; Goldman added
Na2Mo04·2H2o in sufficient quantity to increase the concentration
in the epilimnion to 7.7 µg/l. After an initial one-day period of
inhibition, the primary productivity of the lake increased 40 per cent
above that of the previous year.
Bertine (109) suggested molybdenum could be removed from water
mechanically under anoxic conditions. Over a short time span (days)
co-precipitation with FeS was thought to be more important, but over
a longer period (years) the removal by sorption on humic acids was
thought to predominate. He noted that some marine muds have been
found to contain up to 2700 mg Mo/l. It is interesting to note here

55
that Krauskopf (106) found that molybdenum was not very effectively
adsorbed on iron and manganese oxides from seawater.
Nickel
Nickel occurs in nature as niccolite (NiAs), bunsenite {NiO},
and millerite (NiS). Its approximate concentration in seawater
is 2 µg/1; in stream waters, 0.3 µg/l {Table IX). The only oxidation
state important in the aqueous chemistry of nickel is Ni{II).
Scant work has been done with nickel, but there is some evidence
that it plays an important role as an enzyme activator and in
maintaining the confonnation fo protein molecules (67). It is
conmionly found associated with ribonucleic acids (RNA}. Parker (69)
noted that it may substitute partially for some essential elements.
Cairns et _tl. (99) noted studies which have been reported
inhibitory concentrations for nickel at 1.5 mg/l for Scenedesmus
and 0.05 mg/l for Microregma.
Studies have shown that nickel carbonate is quite effectively
solubilized by humic acid, but the sulfide is not {Table XIII).

56
III. EXPERIMENTAL METHODS
The following is a description of the sampling methods and analy-
tical techniques used in this investigation. The field work was
accomplished during two separate periods, and references to the first
and second field seasons denote the 1973-74 and 1974-75 austral
slltlmers, respectively.
Sampling Stations and Routines
In October and November of 1973 a series of holes was drilled
through the permanent ice of Lake Bonney with a gasoline-powered
Jiffy ice drill (Feldman Engineering and Manufacturing Company,
Sheboygan Falls, Wisconsin). The principal sampling site in the
east lobe of the lake was designated as site 1, and transects were
made from this point (Figure 7). Additional holes were drilled in the
isthmus and the west lobe of the lake, and each hole was surveyed
and its depth recorded.
During the second season, practically the entire focus was upon
site l as established the previous year. In addition, a second hole
was drilled approximately one km west of the hut for access to deeper
water. Holes also were drilled north and east of the hut and near the
mouth of the Sollas-LaCroix meltstream.
The water column at site l was sampled weekly during the 1974-75
field season with a non-metallic Kemnerer bottle (Wildlife Supply Com-
pany, Saginaw, Michigan) secured by a metered length of brass chain.
Water drawn up with the Kemmerer bottle was placed in screw-capped,

TAYLOR GLACIER
• 4w
HUGHES GLACIER
;V MATTERHORN
GLACIER
• 3w • • 2w 2
LACROIX GLACIERZ,.
meltstream
SOLL AS GLACIER
Figure 7. Sampling sites on Lake Bonney. These were established during the 1973-74 field season, except for site 2, which was drilled during the 1974-75 field season. A transect perpendicular to the one shown and intersecting it at site 1 was also drilled, but is not shown.
c.n .......

58
plastic bottles and returned to the lab adjacent to the hut for
analysis. Samples were routinely taken from the following depths, as
measured from the piezometric surface: 4 m, 8 m, 12 m, 15 m, 20 m,
and 25 m. Whenever required by biological studies, samples were taken
at one-meter intervals from 4-12 m deptns.
At times, problems were encountered with the closing of the
sampling bottles, e.g., failure to close when struck by the messenger
or closing when striking the underside of the pennanent ice upon reco-
very. A check on the depth sampled was provided by both specific
gravity and chloride measurements, and dubious samples were discarded.
Meltstreams occasionally were sampled during the first field season,
and, because phosphorus was present, the Sollas-LaCroix meltstream was
monitored daily for phosphorus during the 1974-75 field season. Melt-
waters were sampled at various locations, but primarily at the weir
sites on the Matterhorn and the Sollas-LaCroix meltstreams (Figure 7).
Stream Flow Measurements
During December, 1973, two weirs were constructed, one on the
Sollas-LaCroix meltstream, and the other on the Matterhorn meltstream
(Figure 7). The latter filled very quickly with silt and yielded no
useable data, while the fonner provided some data before it was
destroyed by high flows.
A Parshall flume was placed in the Sollas-LaCroix meltstream during
December, 1974, at the same location as the weir had been the previous
season, and remained operative the entire season. An automatic
recorder (Leupold & Stevens Company, Inc., Beaverton, Oregon) provided

59
a continuous record of the streamflow.
Chemical Analyses
Chemical analyses carried out in the field included those for
anmonia, nitrate, nitrite, ortho- and condensed phosphates, sulfate,
alkalinity, and dissolved oxygen. Specific methods are indicated
below.
Standard Additions
The quantity of dissolved solids in Lake Bonney precluded the
use of a simple standard curve approach to colorimetric analyses.
Instead, the method of standard additions was utilized in all such
analyses in order to compensate for complex matrix effects (Appen-
dix A). This entailed analyzing a series of spiked samples along with
the sample itself. When a plot of absorbance ~· concentration was
drawn, the sample concentration of the substance in question could be
detennined as the intercept on the concentration axis (110). Rather
than rely on visual interpretation, a least squares regression line
was fit to the data and the intercept determined mathematically.
Colorimetric Analyses
In most analyses, some dilution was necessitated by the inter-
ferences encountered (Table XIV). The dilution water was distilled
and deionized, and a blank was analyzed in all instances. Absorbance
was Dieasured with a Klett-Sunmerson colorimeter (Klett Manufacturing
Corporation, New York, New York) and recorded as Klett units.
Orthophosphate-phosphorus was analyzed using the ascorbic acid technique
of Murphy and Riley (111), while condensed phosphate-phosphorus was

60
TABLE XIV
Dilution required to prepare Lake Bonney water samples for various analyses. The key at the bottom of the table indicates the ratio of sample water to distilled water used.
Depth, m
4
5
6
7
8
9
10
11
12
15
20
25
NH
D Ill No l : 1
Dilution
Anal sis No- P03-2 4
rETI . • • 1: 9 1 :99 l :999
61
detennined according to Standard Methods (112). Problems were encoun-
tered with the latter technique in that deep-water samples often
yielded non-linear curves when subjected to the standard additions method.
Even with dilution, such samples produced a precipitate when neutralized
following the acidification and boiling procedure. When this occurred,
the samples were either filtered or allowed to settle before analysis
of the supernatant liquid. These problems were not encountered with
samples from the mixolimnion.
Commonly-used marine chemistry techniques were used to quantify
nitrogen compounds. Amnonia was analyzed by the phenol-hypochlorite
method described by Martin (113), while nitrates and nitrites were
determined by the cadmium reduction technique and diazotization proce-
dure, respectively, as described in Standard Methods (112).
Samples analyzed for sulfates were first diluted and then
analyzed by the turbidimetric procedure found in Standard Methods (112).
Other Analyses
Other chemical analyses which were perfonned routinely included
dissolved oxygen, pH, chlorides, and alkalinity.
Dissolved oxygen was detennined by the azide modification of the
Winkler method as described in Standard Methods (10). All samples
were collected in 300 ml BOD bottles and fixed on site. Titration in
the lab was accomplished within a few hours after sampling.
Modifications of the dissolved oxygen technique were necessitated
by the high oxygen levels encountered in the mixolimnion of the lake.
In the Winkler method, manganous ion (Mn 2+) is first oxidized to Mn02,

62
which is then reduced by iodide ion, producing iodine in the process: - + 2+ 0
Mn~ + 2 I + 4 H = Mn + I 2 + 2 H20
The iodine produced is stoichiometrically related to the amount of
dissolved oxygen in the original sample. Samples containing oxygen
usually assume a straw-yellow to amber color upon fixation, but some
samples from the mixolimnion of Lake Bonney were very dark amber and
contained dark brown crystals after fixation. When these crystals
were dissolved in carbon tetrachloride (CC1 4), a violet color charac-
teristic of iodine was produced. It became apparent, therefore, that
some samples were so supersaturated with oxygen that elemental iodine
was precipitated when the samples were fixed. While the usual procedure
in the Winkler analysis is to withdraw a portion of the fixed sample
and titrate it with standard thiosulfate solution, in this instance
to ignore the iodine crystals would be to introduce serious error,
substantially underestimating the dissolved oxygen present in the
sample. To avoid this difficulty the entire sample, including any
floe and crystals, was titrated for each analysis.
A Beckman pH meter was used to detennine the pH of the water sam-
ples within three hours of collection. The pH meter was also used to
detennine alkalinity of the samples by titration with sulfuric acid
to pH 4.2, as described in Standard Methods (112).
After appropriate dilution of the samples, chlorides were deter-
mined by the argentometric method, also described in Standard Methods.

63
Additional Measurements
Temperatures of the water column were measured quite frequently
during 1974-75, being recorded for site 1 and site 2 on alternate days
throughout the field season. A calibrated thennistor {Yellow Springs
InstrL1T1ent Canpany, Inc., Yellow Springs, Ohio) was attached to a
weighted, metered cable, lowered into the water, and allowed to
stabilize before the temperature was recorded. Temperature profiles
were obtained less frequently during 1973-74.
Hydrometers were used to measure the specific gravity of water
samples drawn by Kenunerer bottle during 1974-75. As the purpose of
these measurements was to rapidly identify 11 bad 11 samples on site,
the results were only occasionally recorded.
Trace Metal Analysis
The water column at site 1 was sampled weekly during 1974-75 for
trace metals, and less regularly during 1973-74. Samples were stored
in screw-capped, Teflon - FEP containers and acidified with hydro-
chloric acid to pH 2 for subsequent transport to VPI & SU for analy-
sis by atomic absorption spectrophotanetry.
Analysis for trace amounts of copper, cobalt, iron, manganese,
molybdenum, and nickel was accomplished by flameless atomic absorption
spectrophotanetry using a Perkin-Elmer Model 403 spectrophotometer
(Perkin-Elmer Corporation, Norwalk, Connecticut) in conjunction with
a Perkin-Elmer Model HGA-2100 graphite furnace. In addition, a Perkin-
Elmer deuteriLITl background corrector and a strip chart recorder

64
(linear Instrument Corporation, Irvine, California) were utilized.
Other means of trace analysis were considered, but most could
not surmount the problems incurred by salinity. Anodic stripping
voltammetry (ASV) and extraction techniques were both possible, but
the graphite furnace was found to be more generally applicable than
ASV and much less time consuming than extraction techniques. An
additional advantage of flameless AAS was that only small quantities
of sample were required, which meant that samples could be hand-
carried to VPI & SU by the field team at the end of the season.
Larger quantities of water would have required ship transport and
would not have arrived in the United States until the sunmer following
the field season.
Furnace Operation
The Perkin-Elmer HGA-2100 graphite furnace contains a hollow
graphite cylinder, approximately 28 nm in length and 8 mm in diameter,
placed so that the sample beam passes through it. An Eppendorf pipet
is used to introduce liquid samples via a hole about 2 mm in diameter
in the middle of the cylinder. Maximum sample size is 100 microliters
( µ l).
The cylinder is heated in three stages by passing an electric
current through its walls. A low current is used to dry the sample,
a higher current to ash it, and a still higher current to heat the
cylinder to incandescence, atomizing the sample. Separate and con-
tinuously adjustable controls are provided to regulate both time and
temperature in each stage of heating. Once adjusted, a programmed

65
power controller will automatically proceed through the three tem-
perature cycles and stop after completion of the atomization step.
Nitrogen gas was used to purge the system and prevent oxidation
of the graphite cylinder. Removable quartz windows at each end of the
furnace prevent air from entering the cylinder. Nitrogen enters from
the ends of the cylinder and exits through the sample introduction
hole in the center. The purge gas also serves to sweep out any
smoke produced during the drying and ashing steps.
Background Correction
Vaporization of samples having a complex matrix may absorb or
scatter light from the hollow cathode lamp (HCL) due to the presence
of gaseous molecular species, salt particles, or smoke. If a back-
ground corrector is not used under these circumstances, analytical
results will be erroneously high. As described in its operating
manual (115), the deuterium arc background corrector passes its light
through the graphite tube in alternation with the light from the HCL.
The element being determined absorbs only the light from the HCL,
while background absorption affects each beam equally. The ratio of
the beams taken by the instrllllent 1 s electronics automatically eliminates
the effects of the background absorption.
Furnace Operating Parameters
OptimlJll time and temperature settings used with the graphite fur-
nace are very much dependent upon the sample and the element of interest.
Therefore, operating conditions needed to be ascertained for each
element of interest within the same matrix. General procedures for
66
detennining optimum operating conditions are found in the HGA-2100
opeating manual (116).
Drying temperature was generally set at 120 C, slightly higher
than the boiling point of the sample. In most instances, 20 µl of
sample were introduced and dried for 20 seconds. Longer drying times
were required with the samples having higher quantities of dissolved
solids, i.e., those samples from the monimolimnion.
Atomization temperatures were different for each element, and
were detennined by noting the absorbance of the samples when atomized
at various temperatures. The optimum atomization temperature was
taken as the minimum temperature needed to produce maximum absorbance,
and atomization time was selected to be as short as possible while
still providing complete atomization.
Optimum charring temperature required
(1) a long enough charring time and high enough temperature
to volatilize any interfering matrix, and
(2) a sufficiently short charring time and low enough tempera-
ture to insure against loss of the element of interest.
The optimum charring time and temperature were chosen as those which
produced the maximum absorbance for the sample. General operating
parameters used in this study are found in Table XV.
Analytical Procedure
Basic furnace operating conditions used for the analysis of trace
metals in Lake Bonney samples are detailed in Table II. The applicability
of Beer's Law was confinned by analyzing varying volumes of the sample

67
TABLE XV
Operating parameters used in the analysis of trace elements in Lake Bonney samples by flameless atomic absorption with the Perkin-Elmer HGA-2100 graphite furnace.
Parameter Metal
Co Cu Fe Mn Ni
Wavelength, 240. 7 324.7 248.8 280. 1 232.0 nm
Lamp 16 12 30 10 14 Current, v
Slit Width, 0.7 2.0 0.7 0.2 0.7 nm
* Nitrogen 40 40 40 40 40 Flow Rate
Drying 120 120 120 120 120 Temp., c Drying 20 20 30 20 20 Time, sec.
Charring 900 1100 1200 800 800 Temp., c Charring 30 30 30 20 30 Time, sec.
Atomization 2700 2500 2600 2400 2700 Temp., c Atomization 6 5 5 5 5 Time, sec.
* Interrupt mode.

68
water as well as different amounts of standard. Once linearity was
established, the standard additions technique was used in each analysis.
Generally, 20 µl of sample were analyzed, followed by a spiked sample
prepared by introducing 20 µl of sample and 20 µl of standard into the
furnace. The standards were prepared from conmercial AAS reference
standards (Fisher Scientific Company, Raleigh, North Carolina} by serial
dilution with glass-distilled water. The hypersaline samples from the
monimoliRllion were diluted with glass-distilled water and analyzed by
the ammonillTI nitrate technique described by Ediger et!!_. (51}. The
saturated anmonium nitrate solution was mixed with a chelating resin
(Chelex 100, Bio-Rad Laboratories, Richmond, California} to remove
trace metal impurities. Ten microliters of ammonillTI nitrate solution
were introduced into the furnace along with the samples and spiked
samples. Blanks were analyzed to insure against contamination by the
dilution water or anmonium nitrate solution.
The concentration of the metal of interest in the sample was
calculated using the following equation:
A· V • C cs = s a a
(Aa-As) Vs
where c = concentration of metal in sample (µg/l} s ca = concentration of metal in standard (µg/l}
~ = absorbance of the sample
Aa = absorbance of the spiked sample
vs = volllTie of sample analyzed (µl)
Va = volume of standard used (µl)

69
When the spiked sample consisted of equal volumes of sample and
standard, as was commonly the case, the above expression reduced to
=
Sediment Sampling and Analysis
A • C s a
Sediments and soils were collected manually and by use of a gravity
coring device (Alpine Geophysical Associates, Inc., Norwood, N. J.)
and Ekman dredge (Wildlife Supply Co., Saginaw, Michigan) and sealed
in screw-capped plastic containers or in plastic bags. Samples were
kept in a freezer on site and returned to VPI & SU packed in dry ice.
The coring device used during the first field season was never
entirely satisfactory; it was cumbersane and the winch used to raise
the corer was extremely difficult to manuever from site to site over
the rough lake ice. Under the best of conditions only a few centi-
meters of core were retrieved.
Any sampling device used at the sampling holes was physically
limited to a maximum diameter of 74 cm by the size of the sampling
hole itself. This made the use of even a small dredge impossible.
Some sediments were retrieved merely by tamping the corer barrel about
the lake bottom, thus packing sediment into the plastic sleeve. Halite
and hydrohalite were both recovered in this manner (117).
In the latter part of the season the littoral areas became ice-free,
allowing access by a small rubber raft. Such areas were then sampled
with an Ekman dredge.
Phosphorus analysis of various soil samples were carried out at

70
VPI & SU using the technique described by Mehta (118). Some soil
samples were also analyzed for various elements by the Cooperative
Extension Service of the University of Georgia (Athens, Georgia).
The double-dilute acid extraction method was used for these analyses
( 119' 120).
A few soil samples were analyzed for volatile matter by drying
at 103°C for one hour and ashing at 550°C for 30 minutes, followed
by rehydration and drying at 103°C for an additional hour. The residues
were also analyzed using an X-ray spectrometer (EDAX International,
Prarie View, Illinois) in the Wood Technology Department of VPI & SU.
Benthic Mat Samples
Samp.les of benthic algal mat were recovered in two ways:
(1) by an Ekman dredge in the ice-free littoral areas, and
(2) by collecting dehydrated mat that was found on the surface
of the lake ice at the start of the field season.
Samples of benthic algal mat were analyzed for water content and
volatile fractions using the procedures in Standard Methods (112).
Spectrographic analysis of dehydrated benthic mat was made by
the Cooperative Extension Service, University of Georgia, using the
methods of Jones and Warner (121).
IV. RESULTS
The results of this study have been grouped for presentation
into four categories: (1) general descriptive chemical and physical
characteristics of the lake, including morphometry and flow data;
(2) trace metals; (3) nutrients; and (4) miscellaneous measurements
on soils, sediments, and benthic algal mat. All original data may
be found in Appendix C and apply to site l unless otherwise noted.
General Descriptive Data
Morphometry
A recent bathymetric survey of Lake Bonney by a University of
Waikato (N. Z.) research team (Figure 5) was planimetered to find the
contour areas (Appendix Table B-1). These areas were then used to
calculate vertical volume elements in the lake after the method of
Hutchinson (70); the results are contained in Appendix Table B-2.
The depth-volume curve produced for Lake Bonney (Figure 8) shows
half of the lake's volume is above the 12 m depth, and approximately
25 per cent of the volume is contained in the upper six meters.
Area and volume measurements, as well as various calculated
limnological parameters, are contained in Table XVI. The total surface
area was found to be 3.26 km2 and the volume 69.2 cubic hectometers
(hm3). The east lobe accounts for approximately 78 per cent of the
total surface area of the lake and 81 per cent of the total lake
volume. Simple division of volume by area yields a mean depth of 21.2 m
for the entire lake.
71

72
Per cent volume above given depth 0 25
10 20 30 Volume, hm3
Figure 8. Volume-depth curve for Lake Bonney.

73
TABLE XVI
Morphometric parameters of Lake Bonney as computed from the 1974 bathymetric survey by the University of Waikato (N. Z.) research team (Figure 5). Depths are taken from the piezometric surface. Calculations after Hutchinson, reference 70.
Parameter East Lobe West Lobe Overall
Area, km2 2.53 0.73 3.26
Volume, hm3 55.9 13.3 69.2
Mean Depth, m 22.l 18. 2 21.2
Maximum Depth, m 33 35 35
Mean Depth: 0.67 0.52 0.61 Maximum Depth
Shore Line, km 8.8 4.4 13.2
Shoreline 1.56 1.45 2.06 Devel op men t
Maximum Length, km 4.4 1.8
Relative Depth 1.84 3.63 l. 72
Development of 2.01 1.56 1.82 Volume

74
Meltstream Flow
During the 1974-75 field season the piezometric level of Lake
Bonney rose 0.37 m (119). Using the surface area calculated
earlier, the volume increase during the season was calculated to
be 1.21 hm3 (l hm3 = 106 m3 ). This is considerably less than the
estimated volume increase of 3.26 hm3 for the previous season (11).
Both estimates ignore losses during the season, and, hence, represent
minimum inflow values.
The Sollas-LaCroix meltstream (Figure 7) was continuously mon-
itored during the second field season, and daily flows are recorded
in Appendix Table C-1. Although this stream was still flowing when
measurements were halted on January 31, 1975, it ceased a few days
thereafter. The total recorded flow of 0.140 hm3 over 53 days is
therefore essentially the total annual flow; this represents a seasonal
mean flow of 2.62 x 10³ m3 per day, and about 11.5 per cent of the
total inflow to the lake. The highest recorded flow rate was 13.9 m3
per minute on December 28, 1974, (at 2000 hours) and the largest daily
volLme was 11,950 m3 , recorded on December 29, 1974.
Figure 9 shows the cumulative flow of the meltstream. By
December 30, 1974, 50 per cent of the total annual flow through the
meltstream had passed by the weir; and by January 19, 1975, over 90
per cent of the total flow was achieved.
Temperature
Temperature profiles were taken on alternate days at sites 1
and 2 throughout the second field season; weekly data from site l

M 100 -6 .. ~ ...-4-
Cl> >
•r-+' '° '; 50 E ::s u
0 10 20
December 30 9 19
January Figure 9. Cumulative flow in the Sollas-laCroix meltstream (1974-75).
75 ~ -s (') R> ::s
"' 0 50 .......
"' 0
"' Ill ....... __, 0'1
....... __,
25 i
0

76
have been recorded in Appendix Table C-2. Throughout the season the
maximum temperatures at each site were in the chemocline region.
The minimum temperature observed was -4.0°C at the bottom of site 2,
(33 m), while the temperature at the bottom of site 1 (26 m) never
dropped below l.5°C. The profiles taken at site 1 coincided with
those for site 2 taken on comparable dates.
Seasonal variation of temperature at site 1 is illustrated by
the isopleth in Figure 10. A general wanning trend can be seen
throughout the water coltJTin from early December until mid-January.
The wannest region increased in both area and temperature during
this period, with a temperature maximum of 6.5°C being recorded on
January 17, 1975.
Chlorides
As has been noted by other investigators (16, 23, 27), chloride
concentration increases markedly with depth (Appendix Table C-3).
Seasonal variations are most easily seen in Figure 11. Particularly
notable is the decrease of chloride concentration at depth in late
November, followed by a marked increase. Concurrent changes are not
seen in the mixolimnion. The contour intervals in Figure 11 are too
large to show the effects of meltwater inflow upon chloride concen-
tration. The data in Appendix C-3, however, show marked decreases
in chloride concentrations at the four-meter depth on December 20, 1974,
and again on January 10, 1975. The chloride concentration at four meters
at the end of the field season is only 29 per cent of that recorded
at the start.

77
·· ·o7 ................ · ~ · · ... ,::.: .. :~ . .-0· · 5 '-2 =-----
E .. ..c:: +' ~15
0
20
t-----------3 ------...
----5
6 6
6 r------5
3
2------...... 28 6 13 20 3
Nov. Dec. Jan.
Figure 10. Seasonal temperature variations at site 1 (1974-75). Temperatures in degrees Celsius.

78
---------o.5
10
150--- 150
28 6 27 Nov. Dec. Jan.
Figure 11. Seasonal variation in chloride concentrations at site l (1974-75), Concentrations in g/l.
17

79
When only the chloride concentrations recorded for November 5,
1974, and January 17, 1975, are considered, a seasonal decrease is
seen to have occurred at nearly every depth. The notable exception
is at 20 m, where an increase from 115 g/l to 139 g/l ( 21 per cent)
was noted. A slight increase also was noted at the 25 m depth, but
this is not significant within experimental error of the analysis.
The highest concentration recorded was 155 g/l, which occurred
at 25 m on January 17, 1975.
Dissolved Oxygen
The entire mixolimnion of Lake Bonney was supersaturated with
oxygen, with the maximum concentration usually in the region of 8-10 m
(Appendix Table C-4). In contrast, the monimolimnion was virtually
devoid of oxygen, although concentrations near 1.0 mg/l were not
uncommon.
Two values in Appendix Table C-4 appear anomalous. On Decem-
ber 13 a relatively low concentration of 13.4 mg/l dissolved oxygen
was found at 12 m, while on all other dates from 30.1-37.8 mg/l was
present at this depth. It seems possible that the sample on Decem-
ber 13 was not properly fixed, resulting in a low value; unfortunately,
another sample was not taken. The 4.5 mg/1 of dissolved oxygen
reported at 20 m on November 28 might also be suspect, since on other
dates the concentration ranged from 0. 1-0.4 mg/l. But, that depth
was sampled twice, and significant dissolved oxygen was indicated each
time by the amber color produced upon fixation at the sampling site.

80
Some comment must also be made on other values given in Appen-
dix Table C-4. At the time of the November 5 sampling, the procedure
involving titration of the entire dissolved oxygen sample had not yet
been adopted, and there is record that dark crystals were present to
some extent in the sample from eight meters. The value recorded at
eight meters on November 5, therefore, is probably low, possibly by
as much as 50 per cent. Also, in tests run during the season, boiled
water from the monimolimnion was analyzed for dissolved oxygen and a
concentration of 0. 1 mg/l was found. This small amount may have been
reabsorbed from the air, or there may be some reaction with other
dissolved matter in the water itself. In any case, the values
recorded as 0.1 mg/l are presumably even lower, and may probably be
considered as zero, in effect.
Seasonal fluctuations based on the data in Appendix Table C-4
are easily visualized by means of an isolepth (Figure 12). A dis-
tinct increase can be seen throughout the mixolimnion in early
November--though probably less than indicated because of the problem
with the eight-meter, November 5 value described above--after which
the higher levels are maintained throughout the rest of the season.
The highest dissolved oxygen concentration recorded was 40.2 mg/l at
a depth of eight meters on December 6, 1974.
The contour intervals plotted for the monimolimnion in Figure 12
are much smaller than those used for the mixolimnion, so that the
magnitude of the variation is somewhat distorted. Nevertheless,
somewhat higher oxygen levels are indicated in the bottom waters in
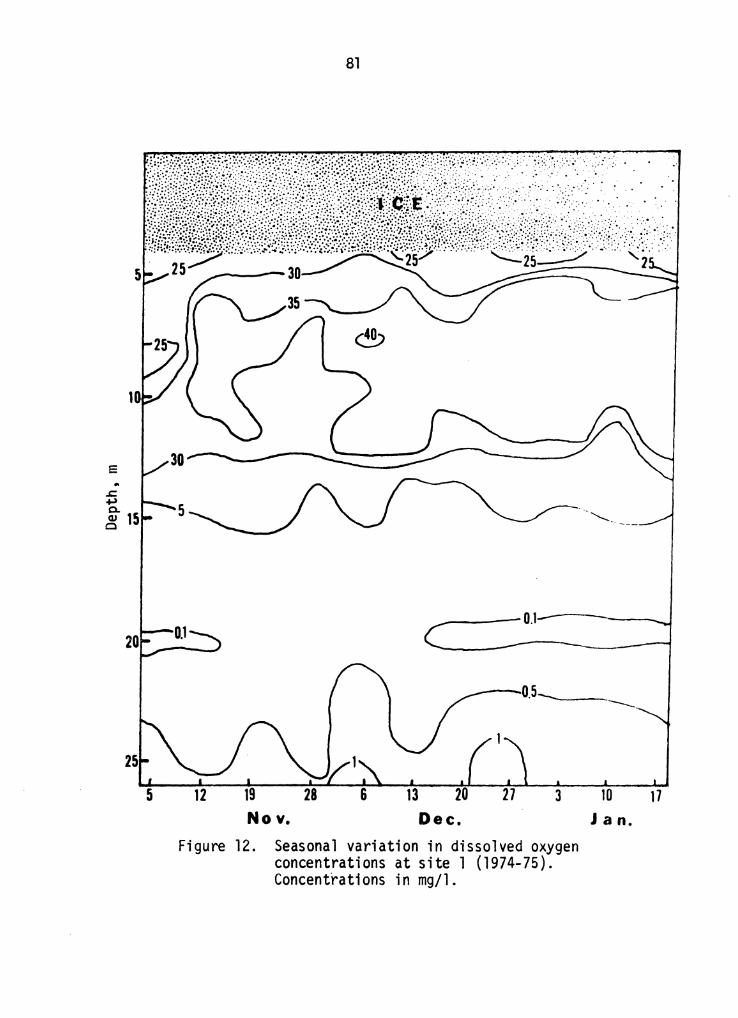
1
E .. .s:; +1 0.. <LI 15 0
81
5
-------0.1------J
--o.s--~-----....._
13 3 Nov. Dec.
Figure 12. Seasonal variation in dissolved oxygen concentrations at site l (1974-75). Concentrations in mg/1.
10 Jan.
17

82
early and late December. This is a matter of some interest, for
there is evidence of inflow at depth in Lake Bonney (11). In fact,
a primary purpose of the frequent dissolved oxygen and temperature
profiles taken during the second field season was to corroborate
earlier reports of sporadic, high dissolved oxygen concentrations
at depth. Such high concentrations were indeed found at both
sampling sites l and 2 during November, 1974. At site 2, concentra-
tions of 19.7 and 26.9 mg/l were found at 33 m on November 4 and 6,
respectively; at site 1 concentrations of 25.9, 23.8, and 31.6 mg/l
were found at 25 m on November 7, 11, and 16, respectively. In the
last instance two samples were retrieved separately to confirm the
high value.
~
The pH profiles taken weekly at site l during the second field
season are Sl.ITlmarized in Appendix Table C-5. Values in the mixo-
limnion were generally within 0.5 pH units of neutrality, but a pH
as low as 5.9 was recorded in the monimolimnion. While there is
relatively little fluctuation in the mixolimnion, there is a pro-
nounced decrease in pH at depth during the season (Figure 13).
At 20 m, for example, the pH of 6.6 recorded on November 5 dropped
to 5.9 by January 3. At 25 m, a pH miniml.ITl of 6.2 was reached in
early December, after which the pH rose to 6.4, its value at the
start of the season.

83
..__---.;~ 7.4.=::---------1.2--- .... _____ ....... __ ....---.... ----~
~-7.D .---------10~-~----&.8
e .. ..c: +' c.. ~ 15
20
19 Nov.
62
28 6 13 20 27 Dec.
3 ID Jan.
Figure 13. Seasonal variation in pH at site l (1974-75).
17
84
Alkalinity
In general, the water collJTln at site l shows maxim1.111 alkalinity
at 15 m, and it was at this depth that the highest alkalinity was
recorded during the second field season: 809 mg/l (as Caco3) on
November 5, 1974 (Appendix Table C-6).
A decrease in alkalinity throughout the season is noticeable
in the upper 10 m of the water colLJRn. Of particular interest are the
fluctuations in alkalinity at 25 m, most easily seen in the alkalinity
isopleth (Figure 14). Apart from the high values noted on November 5,
November 19, and December 13, the alkalinity at this depth remained
in the range of 315-347 mg/1 as Caco3 .
. A zone of decreasing alkalinity was observed between the 11 m
and 15 m depths from November 12-19, with the 15 m depth showing
a change from 746 to 430 mg/l (as CaC03). The effect was less at
superior depths, and there was actually an increase in alkalinity
between these dates at 4 m and 10 m.
Trace Metals
Results from the trace metal analyses of water from sites 1
and 2 are contained in Appendix Tables C-7 through C-10. All trace
element concentrations are 11 total 11 values due to sampling methods
and analytical techniques employed, and all references to the water
column refer to site 1 unless otherwise stated.
Water Column
A large range of manganese concentrations was found: the mean
concentration near the bottom (25 m) was 8.76 mg/l, while the mean

E .. .c: .µ a. Q.I
Cl
5
85
Nov. Dec. Jan.
Figure 14. Seasonal variation in alkalinity at site 1 (1974-75). Concentrations in mg/1 as Caco3.

86
concentration at four meters was only 0.01 mg/l (Appendix Table C-7).
Manganese was detected in all samples analyzed but one and was the
most abundant trace metal in the lake {of those studied).
A profile of the mean seasonal concentrations shows a logarith-
mic increase with depth, with a greater than ten-fold increase in
the chemocline region (Figure 15). At some depths, and at 12 m in
particular, a rather large range of concentrations was found. This
may usually be ascribed to but one or two values far from the mean.
Because only total concentrations were determined, it is possible that
the variations are due to changes in the particulate matter found
in the samples, but there are no data with which to test this hypo-
thesis. The extremely high value found in the bottom water from
January 8 at site 2 cannot be easily explained, unless a great deal
of particulates were present, perhaps from the bottom sediments. The
sample, however, was not noted to be turbid.
As with manganese, the monimolimnion was also enriched with
iron, having a mean concentration of 0.11 mg/l at four meters, and 1.48
mg/l at 25 m (Appendix Table C-8). The seasonal mean values show a
minimum at 12 m (Figure 16).
Seasonal variations are evident. At four meters the concen-
tration of total iron underwent a sudden increase on December 27,
and remained at these higher levels through the remainder of the
season. This increase was not otherwise observed in the mixolimnion.
At 15 m there was an increase late in the season, and at 25 m there

5
10
E
20
25
Figure 15.
10
87
100 Mn, µg/l
1000
Mean value and range of total manganese concentrations found at site 1 (1974-75).

E
..c: +'
5
10
g- 15 Cl
20
25
10
Figure 16.
88
100 Fe, µg/l
t----------1--·----i
1000
Mean value and range of total iron concentrations found at site l (1974-75).

89
was a decrease in mid-season. All of these observations are in
agreement with the data obtained from samples taken at site 2.
The distribution of copper in the water column was similar to
that of iron in that a miniml.ITl appeared in the mixolimnion, generally
at eight meters; the seasonal mean at this depth was 0.013 mg/l
(Figure 17). The profile of copper, however, was quite dissimilar
from the others due to the decreasing concentration with depth in
the monimolimnion. The maximum seasonal mean was found not at the
bottom, but at 15 m, and was 0.59 mg/l.
The weekly data for copper indicated a definite late season
increase throughout the mixolimnion in general (Appendix Table C-9).
At greater depths there was a decrease in November followed by an
increase later in the season, concurrent with the increase in the
mixolimnion. Overall, in the period from November 5, 1974, through
January 17, 1975, there was an increase in the total copper concen-
tration in the mixolimnion and a decrease in the monimolimnion.
Data from site 2 indicated the same variations, though at the bot-
tom (33 m) a slight increase was observed.
Analyses of nickel and cobalt concentrations were not as exten-
sive as for the previous three metals. Samples from the beginning
and end of the season were analyzed, and the results are in Appendix
Table C-10. The mean nickel concentrations depicted in Figure 18
were calculated from the only two values available at each depth,
and the mean given for the four-meter depth is hypothetical, as only
an upper limit was determined. The profile of nickel concentration

E
..c: ~
90
5
10
fil-15--~~~~~~~~~~~~~~~~~~~.-~~~--1 Cl
20
25
10 100 .cu, µg/l
1000
Figure 17. Mean value and range of total copper concentrations found at site l (1974-75).

5
10
E
20
25
Figure 18.
10
91
100 Ni, µg/1
1000
Mean value and range of total nickel concentrations found at site 1 (1974-75).

92
in the water column shows a regular increase occurred with depth and
is very similar to the manganese profile presented earlier. Nickel,
however, was present in lower concentrations than manganese, and--
although more data would be desirable--it appears that the concen-
tration of nickel decreased throughout much of the water column during
the season.
Cobalt was not detectable ;n the mixolimnion, but its distribution
in the monimolimnion parallels that of copper (Figure 19). As with
nickel, the mean concentrations of cobalt were calculated frcxn only
two values. The maximum concentration of cobalt found was 0.26 mg/l
on November 5 at a depth of 15 m (Appendix Table C-10). A seasonal
decrease in cobalt was apparent at both 15 m and 20 m, but there was
an increase at 25 m.
Attempts to analyze molybdenum were unsuccessful due to some
unidentified interference. Linearity could not be achieved, and a
background signal was apparent even when analyzing glass-distilled
water. Although accurate, quantitative analysis could not be com-
pleted, there were indications that molybdenum was present to some
small extent. Apparently, qualitative analysis by another technique
also indicated the presence of molybdenum in Lake Bonney water samples
(120). As an approximation, the concentration of molybdenum has been
estimated by this investigator to be less than 0.001 mg/l in all the
samples analyzed. Because water from the monimolimnion was diluted 1:9
before analysis, the estimated concentration of molybdenum in the moni-
molimnion was less than 0.01 mg/l.

..c: .µ Q. <11 Cl
5
10
20
25
10
Figure 19.
93
100 1000 Co, µg/1
of total cobalt Mean value and range concentrations found at site 1 (1974-75).

94
Total Mass
The volume-depth curve for Lake Bonney (Figure 8) was used to
calculate volume elements corresponding to actual sampling depths.
These vol1JT1e elements (Appendix Table B-3) may be multiplied by the
seasonal mean concentration of any analyte at each depth to obtain
an estimate of the total mass of analyte present in Lake Bonney.
Because the most extensive sampling was at site 1, the mean analyte
concentration at each depth at this location was utilized. The 25 m
mean concentration of each analyte was also used to represent the
concentrations at greater depths. In most instances, the concen-
trations at 25 m at site l were comparable to those found at the
bottom at site 2 (33 m).
Estimates of the total mass of various trace elements in Lake
Bonney are in Appendix Table C-11. The most abundant element is
manganese, with a total mass of 220,000 kg present. There is only
about one-fifth as much iron (39,900 kg) and about six per cent as
much copper (13,800 kg) in the lake. These three elements alone
constitute nearly 95 per cent (by mass) of the six trace elements
studied.
The amount of nickel present (8670 kg) is less than copper, but
larger than either cobalt or molybdenl.ITI. The masses calculated for
cobalt and molybdent.m (3110 kg and 3550 kg, respectively) are simi-
lar, but it must be remembered that the molybdenlJTl concentrations
used were more hypothetical in nature, and represent an upper limit.

95
The overall abundance of these trace elements in Lake Bonney is
apparently Mn>>Fe>Cu>Ni>Co=Mo. This relationship is clearly shown in
Figure 20, which also shows over 90 per cent of each element is found
in the monimolimnion. Very little, if any, cobalt or molybdenum is
present in the upper waters. While both manganese and nickel are
present in the mixolimnion, they are considerably more abundant in the
monimolimnion. A greater portion of copper and iron 1s found in the
mixolimnion than for any of the other elements, and the total mass of
iron in the mixolimnion is even greater than that of manganese. In
terms of the percentage of each element found in the mixolimnion, the
order is Cu>Fe>>Ni>Mn>>Co=Mo.
Meltstreams
Six water samples from the Sollas-LaCroix meltstream were analyzed
for trace elements; the results are given in Appendix Table C-12.
Where upper limit values were reported, a range was calculated for
the seasonal mean rather than a single value. The most abundant
metal in the meltstream water was manganese, averaging 63 µg/l.
Iron and copper were next in abundance, with mean concentrations
of 17-20 µg/l and 6.7 µg/l, respectively. The mean range of nickel
(5-13 µg/l) is elevated by the single large value on December 20, but
its mean concentration in actuality is probably less than that of cop-
per. Cobalt is present to the least extent, having a mean of 2.2-2.5
µg/l.
Using these mean concentrations in conjunction with the known
1974-75 seasonal inflow of 1 .21 hm3, the total loading of each trace

~ ~
~
.,..
100 O'l ~
(Y) 0 ...-.. I/) (/)
"' ~ 10
Mn ---
t:.":-:: !(/:
Fe ~:J~·
~~~ r .f.~.~:;.
if~ ;i .,..e. '·
Bi~;; ·.:::.:.· ;f:~.::=
~\;] :~:-::;
Cu """"'" .;:;\:::··
i~Q~ f -~I .. :~-~-~.;
~.w{~~
ttt ?\f
J.C:?· .. · .,• ...... .....
Co ,___
To
D total mass
bill . . 0/o in mixolimnion
Ni -~I Mo ·.·:·:·.:.-. ·. ~:: ~ :.· ... -~ ~ ... ; .\\: . ' ~.~:.•
Figure 20. Total mass of certain trace elements found in Lake Bonney.
-1110
~ Cl) ~ -a n ro :::s rt
0 -+i
-a& ~
-4
-2
ro 3 ct> :::s rt ..Jo
:::s 3 ..... >< 0 -..... 3 :::s ..... 0 :::s
\0 O'I

97
metal to the lake may be estimated (Table XVII). The element added
in the greatest quantity is seen to be manganese (76 kg), followed
by iron (21-24 kg). Copper and nickel loadings are similar, and
both are greater than cobalt or molybdenlJll.
A residence time was calculated for each trace element by simply
dividing the total mass in the lake (Table XVII) by the annual loading
rate since there do not appear to be significant losses from the lake.
Residence times are highest for manganese and molybdenlJll, and lowest
for nickel and cobalt.
Nutrients
The following includes data on phosphorus, nitrogen, and sulfate
in the water coltJTin of Lake Bonney and in meltstreams. All data are
for the second field season unless noted otherwise.
Phosphorus
Results from the weekly analysis of ortho- and condensed
phosphates are given in Appendix Table C-13. Very low orthophosphate-
phosphorus (a-PO -P) concentrations appeared in the mixolimnion 4
throughout the field season, with a seasonal mean value of 6.45 µg/l.
But, below the chemocline there is a great reservoir of o-PO -P, with 4
a seasonal mean concentration of 110 µg/l.
Condensed phosphate data were incomplete becauc;e of difficulties
with the analytical procedure. Precipitation was common upon boiling
the samples, and results were not always reproducible. It was still
apparent, however, that condensed phosphate was distributed in a manner
similar to the other forms, i.e., greatly concentrated in the

98
TABLE XVII
Annual loading of trace metals to Lake Bonney by meltstreams.
Calculated Parameter
Mean concen-tration in meltstream, µg/l
Annua 1 loading to lake, kg
Residence time, yrs.
*
Mn
63
76
2900
Metal Fe Cu Ni
17-20 6.7 5-13
21-24 8. l 6. 1-16
1700- 1700 540-1900 1400
Estimated, see text.
Co Mo
* 2.2- <l 2.5
2.7- <l. 2 3.0
1100- <3000 1200

99
monimolimnion. Mean concentrations of condensed phosphate in the
mixolimnion and monimolimnion were 12.25 and 263 µg/l, respectively.
The most complete profiles of condensed phosphate concentrations
available are those for November 19 and January 10 (Figures 21, 22}.
The early season profile vividly depicts the enrichment of both ortho-
and condensed phosphate fonns in the monimolimnion. The concentration
of condensed phosphate-phosphorus (c-P04-P} at 25 m on this date was
500 µg/l! The late season profile of both phosphate fonns in the
mixolimnion was similar to that for the early season, though both
were somewhat lower in concentration than at the earlier date. In
the monimolimnion o-P04-P concentrations were similar to those
found earlier, but a shift in the distribution of the condensed forms
produced a prominent maximum at 15 m. It must be noted that no 15 m
value was available for condensed phosphate on November 19, so there
might indeed have been a peak at 15 m on that date also. In fact,
high concentrations of condensed phosphate were observed at 15 m on
at least two other occasions: 366 µg/l on November 28 and 550 µg/l
on January 17. The high concentration of condensed phosphate shown
at 25 m in Figure 21 appeared again on only one other date: it was 210
µg/l on December 13.
Seasonal mean concentrations of o-P04-P and c-P04-P are also given
in Appendix Table C-13, and these values were used to calculate the
total mass of these fonns in the lake (Appendix Table C-14}. The total
mass of inorganic phosphate (as P} in Lake Bonney is 17.8 x 10³ kg, over
89 per cent of which is in the condensed form. Moreover, only 14.9 per

Figure 21.
100
P04-P, µg/1
Profile of ortho- and condensed phosphate at site l early in the field season. Sampling date November 19, 1974.

E
..s:::.
.µ
g-15 Cl
101
500 P04-P, µg/1
Figure 22. Profile of ortho- and condensed phosphate at site 1 late in the field season. Sampling date January 10, 1975.

102
cent of the o-P04-P and 4.9 per cent of the c-P04-P are in the mixo-
limnion, giving a mean concentration of 7.6 and 21 µg/l, respectively,
if a uniform distribution is assumed (Figure 23).
During the first field season, low o-P04-P concentrations also
were noted in the mixolimnion, averaging 7.01 µg/l. Below the chemo-
cline the mean was 96.6 µg/l (121) and was similar to the average
observed in the second field season.
During the first field season, a peak in o-P04-P concentration
{398 µg/l) was observed in early January in the Sallas-Lacroix melt-
stream. During the second field season, the meltstream was analyzed
daily for o-P04-P; the results are given in Appendix Table C-15, and
illustrated in Figure 24. A wide range of concentrations was found,
from 0.6 µg/l on December 24 to 269 µg/l on December 18. The highest
concentrations were found during the early flow period, particularly
in the December 16-25 period.
Using the available flow data (Appendix Table C-1) in conjunction
with the orthophosphate concentrations in Appendix Table C-15, the
daily loading of o-Po4-P to Lake Bonney from the Sollas-LaCroix melt-
stream was calculated (Appendix Table C-16). The results are
illustrated in Figure 25. For the 34 days for which orthophosphate
data were available, the total loading was found to be 2.95 g with a
mean daily value of 86.8 mg. The smallest daily loading was 0.6 mg,
and the highest was 466 mg. The highest loadings were found to occur
early in the flow period, but there is no demonstrable correlation
of flow and o-P04-P concentration. In the first 14 days of measured

co co 0 E 0
- 0 - I
D
II 1 1 1
I I
I
103
Per cent of nutrient in mixolim
nion
c 0 c E
0 )(
·-E c ~
0
rn
LJ
I I
z IC....
'o z
I ... I •
I I
I
= 0
ao I
I
I I I
I I
I •
I I
I
=
. ~
c: c: 0 co CV .:.L.
'° _J
c: .,... V
I CV V
I V
I
'° E +> c: CV
.,... s.... +> :::::J c:
,.... '° +> 0 +> l+-0 c: 0 I/) .,... s....
'° 0.. 8 u . ('\") N
~ :::::J O
'I .,... u...

.--...... O"I ;:1
,. 0..
I <:;t
0 0..
I 0
20 December
30 9 January
Figure 24. Daily concentrations of orthophosphate phosphorus in the Sollas-LaCroix melt-stream (1974-75).
19
__. 0 ~

400
~ a.." 300
I v 0 0..
I 0
4-0
~ 200 Ill ~
100_ .
0 10 20
December 30
mean
9 January
Figure 25. Daily loading of orthophosphate phosphorus to lake Bonney from the Sollas-LaCroix meltstream {1974-75).
19
__, 0 U'1

106
flow, about 35 per cent of the total flow passed the weir (Figure 9),
but over 60 per cent of the total o-P04-P loading was discharged.
Each day in January except one the loading of o-P04-P was below the
mean daily value.
Nitrogen
Results of the weekly analyses of nitrogen as arrmonia (NH 3-N},
nitrate (NOj-N}, and nitrite (N02-N} at site l are recorded in Appen-
dix Tables C-17 through C-19. Profiles showing these concentrations
in early and late season are in Figures 26 and 27, respectively (note
that the concentration scales are different}. The early season
profile shows NH3-N--or more correctly, the ammonium ion--to be the
predominant fonn at nearly all depths. At 25 m, the NH3-N concentra-
tion was its greatest (7.13 mg/l}, and, in fact, concentrations of all
forms of inorganic nitrogen increased with depth. Nitrite-nitrogen
was present in substantial concentrations only in the monimolimnion,
a fact that is not surprising considering the high oxygen levels in
the mixolimnion. The late season distribution (Figure 27} was very
similar to that for the early season, but the concentration of NH3-N
in the mixolimnion had decreased to about 50 per cent of the Novem-
ber 19 values. At the same time there was some increase in both NOj-N
and NH 3-N concentrations at depth.
The greatest seasonal fluctuation of inorganic nitrogen was
shown by NH3-N (Appendix Table C-17}. In early and late season the
range of concentrations at 4 m was 184-378 µg/l as N. During December
and the first part of January, however, a dramatic decrease was

E
107
Nitrogen-N, mg/l
Figure 26. Distribution of inorganic nitrogen forms at site l early in the field season. Sampling date November 19, 1974.
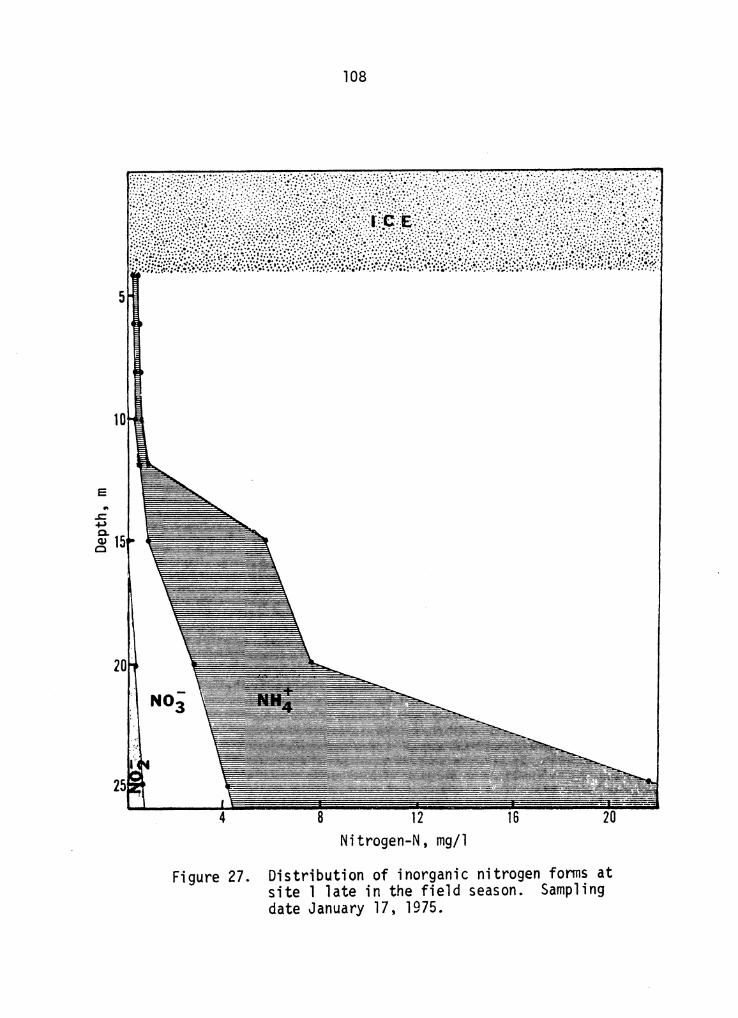
E .. .s:; .µ
5
10
g-15 Cl
108
Nitrogen-N, mg/l
Figure 27. Distribution of inorganic nitrogen fonns at site l late in the field season. Sampling date January 17, 1975.
109
observed, the range of observed concentrations being only 0-83 µg/l
NH 3-N. A similar effect was apparent at depths of 6 m and, to a
lesser extent, 8 m.
At times, the NH 3-N concentration in the monimolimnion appeared
very high, e.g., 11.4 mg/l on November 28 (25 m) and 17.8 mg/l on
January 17 (25 m), and similar extreme values had been detennined in
earlier seasons also (10).
Nitrate-nitrogen and NH3-N concentrations were comparable in
the mixolimnion, except when the NH3-N concentration decreased during
December. Some decline in N03-N concentration was noted at 4 m during
the same period, but it was not as marked nor as extensive as was the
decrease in concentration of NH 3-N.
There was little N02-N in the mixolimnion at any time, but con-
centrations were higher in early November than at any time thereafter
(Appendix Table C-19). Concentrations in the monimolimnion increased
to as much as 624 µg/l. A minimum in N02-N concentration at 25 m
occurred on November 19, and a similar miniml.Bll at 20 m on November 12
and 19.
The total mass of inorganic nitrogen in Lake Bonney was calcu-
lated using seasonal mean values (Table XVII). The total mass was
found to be 297,000 kg, which was composed of 68 per cent NH3-N, 28
per cent N03-N, and four per cent N02-N. Nitrate-nitrogen had a
greater proportion of its mass in the mixolimnion than did the arrmonia
or nitrite forms (Figure 23), so that although NH3-N predominated overall,
the mass of N03-N in the mixolimnion was somewhat larger. From the

110
estimated masses, the mean concentrations of NH3-N, NOj-N, and N02-N
in the mixolimnion were calculated to be 0.215, 0.252, and 0.0076 µg/l,
respectively.
Occasionally, analyses for nitrogen forms were performed on
meltstream water (Appendix Table C-20). Arnnonia-nitrogen and N02-N
concentrations were usually zero, but occasional pulses of NH3-rJ some-
times appeared. Nitrate-nitrogen was the most abundant form in the
meltstream, with concentrations usually over 0.1 mg/l as N.
Sulfate
As with other dissolved matter, the concentration of sulfate
(so;) increased markedly below the chemocline (Appendix Table C-21 ).
With few exceptions, there was a steady increase in sulfate concen-
tration to the bottom. But, on some dates in late November and late
January, a peak was observed at 20 m.
Seasonal variations at site 1 are depicted in Figure 28. There
was a marked decrease in so4 concentration at 4 m during the season,
probably due to meltwater entering the lake. The most interesting and
dramatic changes, however, occurred in the monimolimnion. There was
a general increase in so; throughout the monimolimnion during the
season, but the most striking changes appeared at 20 m. Early Novem-
ber results indicated a concentration of 3600 mg/l at this depth,
but a peak of 7200 mg/l was reached shortly thereafter (November 28).
High concentrations were sustained for two weeks, after which there
was a decrease at 20 m, followed by a second peak (5400 mg/l) on
December 20. At this time, there was a concurrent peak in

11
e .. .s:; +J ~15
0
20
25
5
111
4000
12 28 Nov.
20 Dec.
27 3 10 Jan.
Figure 28. Seasonal variations in sulfate concentration at sfte l (1974-75). Concentrations in mg/l so4.
17
112
concentration throughout the monimolimnion. End-of-season con-
centrations were only slightly higher than at the beginning of the
season. -The dramatic increase in S04 concentration in the monimolimnion
was also noted during the first field season (11}. The largest
increase at that time was at the bottcm of site 1 (26 m}, from 2250
mg/1 on November 12, 1973, to 4930 mg/l on January 15, 1974. Data
frcm the start of second field season indicated the higher levels
had decreased scmewhat but had not returned to their lower 1973
concentrations.
The total mass of so4 in Lake Bonney was estimated from the
seasonal mean.data to be 127,000 kg (Table XVII}. The mixolimnion
contained 14.5 per cent of this amount, a proportion which is high
when compared to other nutrients (Figure 23}.. The mean concentration
in the mixolimnion, based on the calculated mass, was 492 mg/1.
In comparing the mass of S~ to the masses of other nutrients,
it must be remembered that others were computed on an elemental basis
(as N or P). If so4 values were calculated on the basis of so4-s, they
would all be only one-third as great.
Sulfate analyses were only occasionally perfonned on meltwaters.
Results from the analysis of Sollas-LaCroix meltwater on December 13
and 20 (1974) and January 3 (1975) were 10.3, 19.9, and 18.0 mg/l,
respectively.

113
Miscellaneous Results
Soils and Sediments
Analysis of 12 soil samples from in and around Lake Bonney
yielded a mean concentration of total phosphorus of 340 ~g per gram
{pp11) of soil. This was primarily inorganic phosphorus, and only
three of the samples contained any organic phosphorus at all (always
less than ten per cent of the total}.
A sample of fine, greenish-brown soil, common in the Lake Bonney
area, and several sections of a sediment core taken from the bottom
of site 2N (about 50 m north of site l} were ashed and the residue
analyzed with an X-ray spectrometer (Appendix Table C-22}. Very
little volatile material was present in most of the samples, but
losses of six to seven per cent occurred when the sediment samples
from the surface andlOcm· below the surface were ashed. Reaction with
hydrochloric acid prodttced gas, which indicated the loss from the 10
an core sample probably was due to the destruction of inorganic
carbonates upon ashing; but the surface sediment sample showed no
reaction with acid, and the weight loss probably represented organic
matter. Waters of hydration could also have been lost on ashing, but
the rehydration procedure would have minimized this effect. Analysis
of the residue, although only semi-quantitative, indicated relatively
high calcium content in the 10 cm core sample. These data, together
with the noted reaction with acid, suggest the presence of Caco3.
The samples were scanned for traces of various elements, includ-
ing phosphorus, manganese, molybdenum, cobalt, nickel, iron, and zinc.

114
Of the~e, only iron was present in discernable quantities. The great-
est amounts of iron were found in the soil sample and in the surface
sample from the sediment core. Within the core, iron decreased at
subsurface levels. Analysis of the same type of soil sample by the
University of Georgia Extension Service yielded <2 ppm zinc and 15.5
ppm manganese.
Benthic Algal Mat
Dried mat was collected from the surface of the lake ice in
November, 1974. Duplicate samples were subjected to spectrographic
analysis (Appendix Table C-21). Phosphorus and nitrogen were present
to.the extent of 700-900 and 4200 ppm, respectively, giving an N/P
ratio of 4.7-6.0. The amount of iron present appears quite high,
which suggests inorganic material might be incorporated in the mat.
Ashing of the dried mat indicated 8.43 per cent volatile matter.
This is an extremely low value, considering that many biological
materials show a volatile content of about 90 per cent of dry weight.
Analysis of mat which was collected in a viable state and frozen for
transport to VPI & SU did show a higher proportion of volatile
materials. The mean of eight detenninations indicated a loss of 31.3
per cent of dry weight on ashing.
Using the concentrations of nitrogen, phosphorus, and various
trace elements found in the mat in conjunction with the mean concen-
trations in the mixolimnion of Lake Bonney, a concentration factor
was computed (Table XVIII). The phosphorus and nitrogen concentrations
used actually represent only the inorganic fonns present,. so

115
TABLE XVI II
Concentration factors of benthic algal mat from Lake Bonney for various nutrients and trace elements.
Parameter Element B Cu Fe Mn Mo N p
Mean concentra- 35 42 5465 202 12.5 4200 800 tion in mat, ppm
Mean concentra- 2a .036 .073 .064 <.001 .475b .029b tion in mixolimnion, mg/l
Concentration factor
17.5 1170 74,900 3160 >12,500 8840 27,600
a After Torii et !l_., reference 27.
b Total inorganic fonns.

116
that the concentration factors for these elements are likely to be
less than stated. The highest concentration factor, by far, ;~.that
of iron. But, how much of the iron is inorganically tied to the mat
structure is unknown. Other concentration factors decrease in the
order P>Mo>N>Mn>Cu>B.
Algal Counts
Total algal counts, as provided by other members of the field
team, are contained in Appendix Table C-22. These data will be
discussed in relation to various chemical parameters in the following
section.

V. DISCUSSION
Morphometric parameters of Lake Bonney calculated from the recent
bathymetric survey by the University of Waikato (Table XVI) indicate
changes have occurred since the original survey by Angino et~· (16)
during 1961-62. The surface area of the lake was determined to be
3.26 km2, very close to the 3. 18 km2 reported by Angino et~· (16),
but conspicuously lower than the 4.08 km2 found by Goldman et ~.(22).
The total lake volume was calculated to be 69.2 hm3, about 16 per cent
larger than that found earlier by Angino et .!]_.(16); Goldman reported
no estimate of volume. The increase in lake volume has naturally re-
sulted in changes in other parameters. The mean depth found here,
for example, was 21.2 m, or about 2.5 m greater than that reported
by Angino et~· (16). Measurements of inflow during the past two
field seasons clearly indicate such an increase over the intervening
years is reasonable.
Comparison of the parameters in Tables I and XVI indicates that,
aside from changes due to the increase in lake volume, the results of
Angino et.!]_. (16) compare very favorably with the present work. Values
reported by Goldman et~· (22), however, are contradicted by the data
here, and are generally about 25 per cent too high.
Continuous monitoring of the Sollas-LaCroix meltstream indicated
a total flow of 0. 140 hm3 for the 53 days of record, which represented
11.5 per cent of the total increase in lake volume noted over the same
117

118
period. The daily flows from this stream were quite variable; on
one day (December 29, 1974) the flow was equivalent to 8.5 per cent
of the total Sollas-LaCroix input for the season.
The amount of total inflow to the lake is also quite different
from year to year. The increase in lake volume noted during the
first field season was 3.36 hm3, 2.78 times that recorded the second
season. It is especially interesting that the difference in the
amount of inflow was not determined by the period of flow alone.
In fact, during the second season the Sollas-LaCroix meltstream first
began flowing through the weir on December 10, which was 17 days
earlier than in the previous season.
Although the Taylor meltstream, which enters the extreme western
end of Lake Bonney, was not monitored closely, it is generally agreed
that it is the major source of surface flow to the lake. This would
strongly suggest the movement of a large volume of water through the
isthmus of the lake, from west to east, particularly since calcula-
tions based on Figure 5 show the east lobe of the lake to contain
over 80 per cent of the total lake volume. Nevertheless, attempts
to detect a current in the isthmus with a portable velocity meter
during 1974-75 were unsuccessful (122). If there was indeed no flow
through the isthmus, there is a strong possibility of subsurface flow
from the western lobe of Lake Bonney into the eastern lobe. One
mechanism might be by flow through fractured bedrock, an occurrence
which has been supposed at another lake in the McMurdo Oasis _(125).

119
Inflow at depth is supported by fluctuations in various chemical
parameters in the monimolimnion of Lake Bonney. During the second
field season, for example, there were several occasions in early
November on which high dissolved oxygen concentrations were found near
the bottom of site 1 (26 m), whereas concentrations throughout the
monimolimnion were consistently less than t mg/l during most of the
season. Such high oxygen concentrations in the monimolimnion had
been noted during earlier studies at Lake Bonney, and seemed to be
associated with local temperature increases in the water column (11).
The high concentrations of oxygen found at the bottom of site l
during the second field season were associated with only very small
temperature increases {<0.5 C0 ), and those found at site 2 were not
identified with any variation in temperature. These changes might
be explained by the intennittent flow of oxygenated water into the
monimolimnion of the lake. The oxygen would be dispersed, reduced,
or released due to its decreased solubility in the hypersaline
environment, so that high concentrations would be possible only for
short time periods.
Data taken on November 28, 1974, also support the hypothesis of
subterranean inflow. A decrease in alkalinity was observed on this
date at both 20 m and 25 m, which might be explained by dilution
caused by the inflow of relatively fresh water. It would appear,
however, that chloride concentrations would also be affected if this
were true, and although they decreased markedly during the previous
sampling period, they had returned to higher levels by November 28.

120
Other changes noted on November 28 were increases in sulfate
concentration and in the concentration of all inorganic nitrogen
forms throughout the monimolimnion. Fresh water entering the bottom
of the lake would tend to rise in the hypersaline surroundings,.
which could cause some degree of vertical mixing, and hence an
increase in concentration of various chemical constituents in the
upper portions of the monimolimnion. One would then expect to
observe a comparable decrease in these concentrations at the greater
depths, but this was not observed. Rather, there was a general
increase throughout the monimolimnion. For such changes to be the
result of subterranean inflow, the inflow itself would have to con-
tain substantial dissolved solids, or perhaps the inflow occurred
at greater depths--much of the floor of Lake Bonney is at 33 m--
than found at site 1, so that the changes observed were the result
of vertical mixing. Unfortunately, extensive data at sites in
deeper water were not available. This should certainly be an objec-
tive of future studies.
There is an intriguing fluctuation in sulfate concentration in
the monimolimnion, particularly at 20 m. At this depth there is an
abrupt increase in sulfate concentration, peaking at a level about
twice that observed early in the season, and accompanied by a
decrease in pH. These data, in addition to the slight increase in
oxygen concentration observed beginning on November 28, were at
first considered to support the hypothesis that sulfides in the
monimolimnion were undergoing oxidation:

121
Sulfides, however, have never been detected anywhere in the water
column of Lake Bonney, despite the analytical efforts of several
investigators (23, 27), although they have been noted in localized
areas, such as within reducing zones in the benthic algal mats. A
fundamental question arises, then, as to the source of the sulfate
increase. One possibility is that sulfates are entering the lake
with subterranean inflow; another is that sulfur found in organic
compounds is being oxidized during the season. But the only study
of organic matter in Lake Bonney (33) indicated up to 32.2 mg/l
TOC in the water column, and this would be insufficient to explain
the large increase in sulfate observed. The entire phenomenon is
a recurrent one, having also been observed during the first field
season.
Of the trace elements studied, manganese is by far the most
abundant in Lake Bonney. The maximum concentration found is more
than 100 times that reported by Boswell et~· (35), but is in good
agreement with the work of Armitage and Angino (29). The total mass
of manganese in the lake is so large that if it were uniformly dis-
tributed, a concentration of 3.2 mg/l would result. Most of the metal
is located in the monimolimnion; the concentration in the mixolimnion
averages only 64 µg/l. The enrichment of manganese in the monimo-
limnion is undoubtedly linked to the conditions of low dissolved
oxygen concentrations and pH found there. It is also quite possible

122
that manganese compounds have been made more soluble by the presence
of organic matter.
During the season there was a negative correlation (r = -.69)
between manganese concentration and the algal cell counts at the 4 m
depth when a linear regression analysis was made. This was the
highest correlation discovered between the algal cell counts and
any of the trace metals studied, but the correlation was found to be
very much weaker at other depths, although always negative. The
possibility that manganese inhibited growth of the phytoplankton
population must therefore be considered. Lab cultures have been
shown to be inhibited at manganese concentrations as little as 0.1
mg/l (71), but there are many mediating factors. Calcium, for
example, has been demonstrated to be antagonistic to manganese (71),
and the high concentrations of calcuim found at depth in Lake Bonney
would undoubtedly help ameliorate the potential for manganese toxicity.
Also, while the only measure of the trace element content of Lake
Bonney biota pertains to the benthic algal mat (which may not be
comparable to the water column phytoplankton), the average of 202
µg Mn/g dry mat is not greatly more than the 130 µg/g given as an
average for plankton by Wetzel (126). At this time, therefore, the
chemical data cannot clearly support the hypothesis that manganese
in inhibiting phytoplankton growth in Lake Bonney, and the matter
must be resolved by future studies.
The mean concentration of manganese in the Sollas-LaCroix melt-
stream is nine times the world average quoted by Hedgpeth (60).

123
Such concentrations no doubt reflect the geology of the region, but
the manganese concentration found in soil coll1llon to the area was 15.5
ppm, much less than the 2500 ppm suggested as representative of
soils by Buckman and Brady (127). Nevertheless, the concentrations of
manganese found in the meltwater were equal to those in the mixolimnion
of Lake Bonney. Calculations based on the mean meltstream concentra-
tion of 63 µg Mn/l, however, showed that the maximum increase in
manganese to be expected was about 2 µg/l, even if the entire load of
manganese remained in the mixolimnion. This would represent an
increase of about three per cent over the existing mean concentration,
so that the impact would be minimal.
The total masses of iron and copper in Lake Bonney are each
a magnitude lower than that of manganese, and their distributions are
quite different from that found for manganese. Both have proportion-
ately more of their mass in the mixolimnion than does manganese, and
iron is actually more abundant in the upper depths than any other
trace metal studied.
An unusual feature of the iron distribution is that its concen-
tration declines with depth within the mixolimnion. The effect is
most pronounced late in the field se~son, and is probably the result
of the enrichment of the surface waters in respect to iron by the
incoming meltwater. It must be noted, however, that the highest con-
centration of iron found in the Sollas~LaCroix meltstream was 50 µg/l,
which is less than the average concentration in the mixolimnion of the
lake, and far less than the concentration of 400 µg/l found on

124
December 27, 1974, at 4 m. If other meltwaters contain iron concen-
rations comparable to those found in the Sollas-LaCroix water, then
there must be another source of the metal important to the surface
waters of the lake. Perhaps soil particles entrapped in the ice cover
of the lake are released when the ice melts, introducing more partic-
ulates into the water. Whatever the cause, the increase is pronounced
by January.
Analysis of meltwaters indicated that manganese concentrations
averaged about three times the iron concentrations. It would be
expected, then, that the enrichment shown to occur with respect to
iron in the surface waters of the lake would also occur with manganese.
Indeed, an increase in manganese concentration at 4 m is observed
after meltstream began. But, a decrease in manganese concentration
was observed later. An increase in the concentration of manganese
at 12 m was not noticeable until the last of the season, which might
indicate that manganese is being precipitated from the surface waters.
If the Sollas-LaCroix meltwater is representative of other sources of
inflow, then it is apparent that manganese was being preferentially
removed in some manner from the mixolimnion, because the Mn:Fe ratio
is much less in the mixolimnion of the lake than in the meltwater.
The principal fonn of both iron and manganese in the mixolimnion
would be their respective hydrated oxides, due to the very high oxygen
concentrations encountered there. It might be possible that the
colloidal iron is stabilized by organic complexes, allowing it to
remain longer in the surface waters.

125
The analysis of a sediment core indicated that the surface
layer is enriched with iron, which is evidence that iron has been
deposited. There is no definitive evidence of its form, but the
sediments did not appear anaerobic, nor was the characteristic odor
of sulfide encountered. It is therefore doubtful that the primary
form was iron sulfide.
High manganese concentrations have been shown to render iron
unavailable to biota, but the ratio of Fe:Mn found in the benthic
algal mat was 27:1, which implies the absence of this type of inter-
ference. While the concentration of iron found in the mat appears
rather high, the concentration factor calculated for iron {74,500)
compares well with literature values {126).
Copper also has an unusual distribution, in that the maximum
concentration is generally at 15 m, and the minimum concentration
at 8 m. The higher concentrations at 4 m, when compared to 8 m,
might be explained by meltwater contributions, especially considering
the increase in copper concentration at 4 m during the season. The
interesting point here is that the mean concentration of copper found
in the meltwater was significantly less than the concentrations
found at the 4 m depth later in the season. Apparently, other sources
of meltwater contain much more copper than does the Sollas-LaCroix
stream, or there is some unknown source of copper to the surface
waters of the lake.
Copper is toxic to Chlorella vulgaris, a green alga corrrnon in
Lake Bonney, at concentrations as low as 0.06 mg/l {92). This

126
concentration was exceeded on a number of occasions in the mixo-
limnion during the late season, and nearly always exceeded in the
monimolimnion. Studies have shown, however, that copper toxicity
is mitigated by the presence of oxygen, and the high concentration
of dissolved oxygen encountered in the mixolimnion of Lake Bonney
would likely reduce the potential hazard. This would not be true
in the monimolimnion, where oxygen levels are low. Moreover, the
particular strain of f. vulgaris in Lake Bonney may be copper tolerant.
No statistically significant correlation could be shown between
copper concentration and algal cell counts at any depth, but the
correlation coefficients of a linear regression analysis were
generally negative.
In tenl1S of total mass, nickel, cobalt, and molybdenum were
each present to a much lesser extent in Lake Bonney than any of the
trace metals thus far discussed. Nickel was present in the greatest
amount of the three, and, based on the literature reviewed, did not
appear to pose a problem of toxicity or deficiency with respect to
algal growth.
Cobalt could not be detected in the mixolimnion of Lake Bonney,
and the concentration was reported as less than 1.0 µg/l. An
appropriate extraction procedure could probably produce a more
definite result. Because only exceedingly small amounts of cobalt--
and even less vitamin B1 2--are required for optimum algal growth, it
is improbably that a deficiency exists in Lake Bonney. Cobalt was
not one of the elements analyzed in the benthic algal mat, so there

127
is no measure of its availability to the biota at hand. The presence
of significant amounts of cobalt in the monimo1imnion, however, is
an indication that it is probably present to some degree in the
mixolimnion also.
It is surprising that relatively large amounts of cobalt were
found in some of the water samples from the Sollas-LaCroix meltstream.
The mean concentration, which was elevated by these higher values, was
used in calculating the annual loading of cobalt to the lake, 3.0 kg.
Evenly distributed, this amount of cobalt would result in a concen-
tration increase of about 43 ng/l in the lake; if all the cobalt
remained in the mixolimnion, the concentration in the mixolimnion
would increase approximately 80 ng/l. These concentrations are
below the detection limits of the analytical procedure employed, but
are quite sisnificant in terms of the small amounts originally present
in the lake. The higher concentrations in the meltstream were found
during the early period of flow. As this was also a period of high
flows, it is possible that the cobalt was associated with suspended
soil particles. Its availability to the biota of the lake is therefore
uncertain.
The concentration of molybdenum in the lake was not accurately
determined, but certainly there is not enough of the element present
to prove inhibitory, as the concentrations necessary for inhibition
approach 100 mg/1. The possibility that molybdenum is limiting to
phytoplankton in the lake is reduced upon consideration of the con-
centrations found in the benthic algal mat. The mean concentration

128
of 12.5 mg/l was about three times the average value in plankton
given by Wetzel (126).
Some comments on the procedure employed in the analysis of trace
elements for this study seem appropriate here. On first analysis
it might seem preferable to have employed an extraction procedure
to obtain better sensitivity, as reconJllended by Segar (57). The
larger quantities of water necessary for extraction, however, would
have delayed the analyses, since they could not have been hand-carried
from Antarctica. An alternate approach might have been to decrease
the number of sampling dates, but this did not seem to be desirable.
Although the graphite furnace provided the fastest analysis
available, much time was spent becoming familiar with the instru-
mentation, establishing the proper operating parameters, and
simply awaiting the arrival of samples from Antarctica. As a result,
many samples were not analyzed until six months after collection.
Even though these samples were preserved in an accepted manner and
stored in Teflon-FEP containers, it is definitely possible that
either adsorption or leaching occurred before analysis.
It is difficult to assess what the effects of delayed analysis
might have been, but, barring on-site analysis--which is impossible
without sophisticated instrumentation--such delay was unavoidable.
In the future it may be possible to analyze some trace metals on-site
by wet chemical methods, but such analyses would be very time consuming,
and the work schedule of the field party was already heavy with other
analyses. In spite of the difficulties, what can be said is that

129
the analyses presented here are, in the opinion of the author, the
best data available to date.
Although boron was not a subject of this study, it was noted that
other investigators (16, 27) have reported its presence in Lake
Bonney. Concentrations as high as 40 mg/l were reported in the moni-
molimnion, but those in the mixolimnion were generally about 2 mg
B/l. This could have a significant effect on the biota, because
concentrations of 0.50-1.0 B/l can be toxic to plants (128). The
concentration of boron in benthic algal mat was found to be 35 ppm,
indicating that it is not concentrated from the water to a great
degree. Concentrations of B in the monimolimnion exceed the toxicity
limit of even tolerant plant species, and this presents a definite
obstacle to phytoplankton growth. The possibility of boron toxicity
in the moxolimnion needs to be investigated.
Data collected during two field seasons at Lake Bonney clearly
indicate that the high orthophosphorus-phosphate (o-P04-P) concen-
trations reported earlier by Angino et~· (16) are incorrect, and
it now appears there were salinity interferences in their analytical
technique. The mean concentration of o-P04-P found in the mixolim-
nion during this study was 7.6 µg/l, and, while low concentrations
were observed throughout the season, never was it found to be absent,
as reported by Torii et!}_. (27).
Analysis of condensed phosphate-phosphorus (c-P04-P) during this
study was the first attempt at identifying alternate phosphorus forms
available to Lake Bonney biota. The concentration of c-P04-P in the
130
mixolimnion of the lake averages 21 µg/l, about three times the
concentration of o-P04-P. The condensed phosphate forms could play
an important role in the overall lake metabolism, particularly in vie
view of the small orthophosphate concentrations found in the mixo-
limnion. The mean inorganic phosphorus concentration in the
mixolimnion of Lake Bonney is approximately 29 µg/l.
The annual loading of o-P04-P to Lake Bonney from the Sollas-
LaCroix meltstream was calculated to be 2.95 g (based on 1974-75
data). If this value is typical of other inflows, then the total
load from all sources (Figure 7) of inflow would be 25.5 g per year.
Distributed uniformly throughout the lake, this would represent an
increase of only 0.368 ng/l in the concentration of o-Po4-P. If
it is assumed that all o-P04-P load went only into the mixolimnion,
the increase in concentration there would still be only 0.682 ng/l;
and if the loading of condensed phosphates was considered to be
double that of the orthophosphates, the increase in inorganic phos-
phates is but 2.05 ng/l. Therefore, the effects of meltstream
loading upon average inorganic phosphorus concentrations do not
appear to be very great.
Perhaps localized effects are more significant. The Sollas-
LaCroix meltstream, for example, enters Lake Bonney in its extreme
eastern portion, which constitutes a small, shallow portion of the
lake as a whole. Calculations based on the University of Waikato
bathymetric survey yield an area for this eastern portion equal to
approximately 50,700 m2. Assuming an average depth of five meters,

131
the volume of this portion of the lake would be 0.254 hm3, less
than 0.4 per cent of the total lake volume. If the entire load
of phosphate carried by the Sallas-Lacroix meltstream were restricted
to the eastern portion of the lake, the effect would not be much
greater than that calculated for the entire lake previously. Even
when condensed forms are estimated, as before, the increase in total
inorganic phosphorus in the extreme eastern portion is calculated to
be only 34.8 ng/1.
In spite of the small effects calculated above, there is at
least one indication that phosphorus loading by the meltstreams may
be important. It was found that the algal cell counts at four meters
could be related to the total o-P04-P load carried by the Sollas-
LaCroix meltstream during the preceding week (r = 0.788). No
correlation between algal cell counts and flow (per~) could be
demonstrated, so the effect is not due just to the addition of fresh
water to the lake.
It is apparent that there was no simple relationship between
flow and o-Po4-P concentration in the Sollas-LaCroix meltstream.
A comparison of o-P04-P results with the flow at the time of sampling
showed no significant correlation. A comparison of calculated daily
orthophosphate loadings with daily flows indicated that high loadings
were sometimes associated with high flows, but other times not.
It is interesting that the bulk of orthophosphate contributed
to the lake by the Sollas-LaCroix meltstream during the season was
delivered during the first two weeks of flow. It was hypothesized
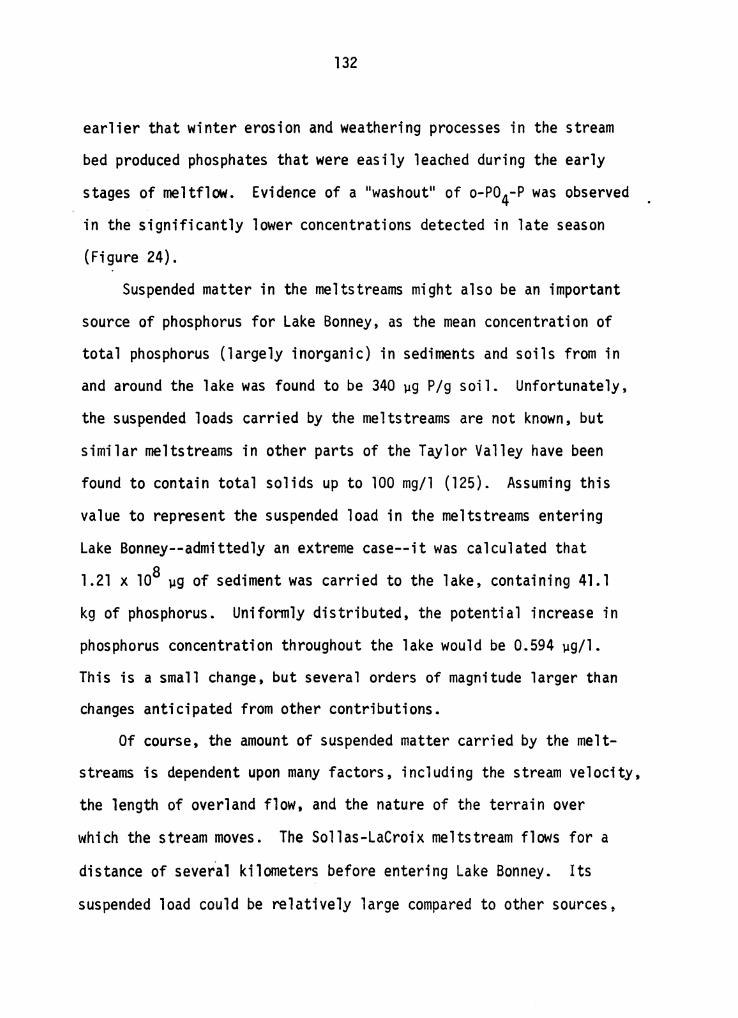
132
earlier that winter erosion and weathering processes in the stream
bed produced phosphates that were easily leached during the early
stages of meltflow. Evidence of a 11washout11 of o-P04-P was observed
in the significantly lower concentrations detected in late season
(Figure 24).
Suspended matter in the meltstreams might also be an important
source of phosphorus for Lake Bonney, as the mean concentration of
total phosphorus (largely inorganic) in sediments and soils from in
and around the lake was found to be 340 µg P/g soil. Unfortunately,
the suspended loads carried by the meltstreams are not known, but
similar meltstreams in other parts of the Taylor Valley have been
found to contain total solids up to 100 mg/1 (125). Assuming this
value to represent the suspended load in the meltstreams entering
Lake Bonney--admittedly an extreme case--it was calculated that
1.21x10⁸ µg of sediment was carried to the lake, containing 41.l
kg of phosphorus. Uniformly distributed, the potential increase in
phosphorus concentration throughout the lake would be 0.594 µg/l.
This is a small change, but several orders of magnitude larger than
changes anticipated from other contributions.
Of course, the amount of suspended matter carried by the melt-
streams is dependent upon many factors, including the stream velocity,
the length of overland flow, and the nature of the terrain over
which the stream moves. The Sollas-LaCroix meltstream flows for a
distance of sever.a 1 k i1 ometers before entering Lake Bonney. I ts
suspended load could be relatively large compared to other sources,

133
and the effects of the suspended materials might also be localized
in the extreme eastern portion of the lake.
Wind-blown soil might provide another source of phosphorus to
the lake. On first arriving at Lake Bonney in October, 1974,
patches of soil which had been blown onto the surface of the lake
were evident everywhere. The soil particles tended to collect in
large fissures in the annual ice, as well as in depressions in the
pennanent ice. Later, melting released some of these soils to the
water, making possible the release of phosphorus to the lake.
Early investigators (7, 16) did not find nitrates or anvnonia
present in Lake Bonney, but the results of this study, as well as
those reported by Torii et!}_. (27), indicated rather that these
inorganic nitrogen forms are indeed present and abundant.
Very different distributions of inorganic nitrogen are found
above and below the chemocline. In the mixolimnion, the NH3-N
concentration is generally comparable to the NOj-N concentration,
and N02-N concentrations are very small, which would be expected
with the high concentration of dissolved oxygen in evidence. In
the monimolimnion, there is a definite dominance of NH3-N over the
other inorganic forms, and the concentration of NH3-N is approxi-
mately twice that of the NOj-N . The concentration of N02-N reaches
much higher levels in the monimolimnion, but is significantly less
than the other forms.
The NH3-N concentrations found in the mixolimnion are in
agreement with those reported by Torii et al. (27), but the present --

134
study detected far more NH3-N in the monimolimnion than they did.
The high concentrations were found during two field seasons using
an accepted marine analytical technique, along with Standard Additions
and linear regression analysis, and, therefore, are probably accurate.
The NH3-N concentrations found, while high, are not unprecedented,
and the meromictic nature of the lake would undoubtedly lead to the
enrichment of this nitrogen species in the monimolimnion.
The total mass of inorganic nitrogen in Lake Bonney is an
astounding 297,000 kg, the largest amount of any nutrient considered
in this thesis. Less than 0.6 per cent of this is present in the
mixolimnion, and the mean concentrations of NH3-N and NOj-N in the
mixolimnion are 0.217 and 0.252 mg/l, respectively. The meltstreams
appear to contribute little NH3-N or N02-N, but significant NOj-N
was found in the Sallas-Lacroix meltwater. If these values are
typical of all meltwater entering the lake, the total loading from
all inflow would increase the concentration of NOj-N in the lake
by 2.5 µg/l NOj-N. Applied only to the mixolimnion, the increase
expected is still only 4.5 µg/l NOj-N.
Localized effects of nitrate loading may be more pronounced.
If the NOj-N load carried by the Sollas-LaCroix meltstream were
contained in the area of the extreme eastern portion of the lake,
the increase in nitrate concentration would be 78.8 µg/l NOj-N
in that region.
To date no factor limiting productivity in Lake Bonney has
been identified. On the basis of chemical analyses of the water

135
column, nitrogen would have to be eliminated as a possibility, for
the ratio of inorganic nitrogen to inorganic phosphorus is 37:1.
Moreover, no relationship could be identified between nitrogen
levels and fluctuations in algal cell counts.
Analysis of the benthic algal mat has provided relevant data
on nitrogen and phosphorus, but, unfortunately, no measure of
organic carbon content in these samples was obtained concurrent
with the nutrient analyses. Because it is desirable to calculate the
C:N:P ratio in the algal mat, another estimate of organic carbon
was utilized: the volatile solids fraction measured when the dried
mat was ashed. Such ashing would include some losses due to inor-
ganic carbonates, and some mat samples were found to have contained
mineralized layers. These properties would give rise to either high
or low estimates of organic content, respectively. Ashing of the mat
in many cases produced the loss of less than 10 per cent of the dry
weight as volatile matter. This is extremely low for biological
materials, suggesting the presence of the mineralized zones mentioned
previously. Analyses of mat which was collected in a viable state,
however, showed a higher proportion of volatile materials: the mean
of eight detenninations indicated a loss of 31.3 per cent dry weight
on ashing.
Forty per cent of the volatile solids may be taken as a
reasonable estimate of organic carbon, because this is approximately
the per cent of carbon in organic molecules based on glucose,
c6H12o6• Using this value in conjunction with the 31.3 per cent
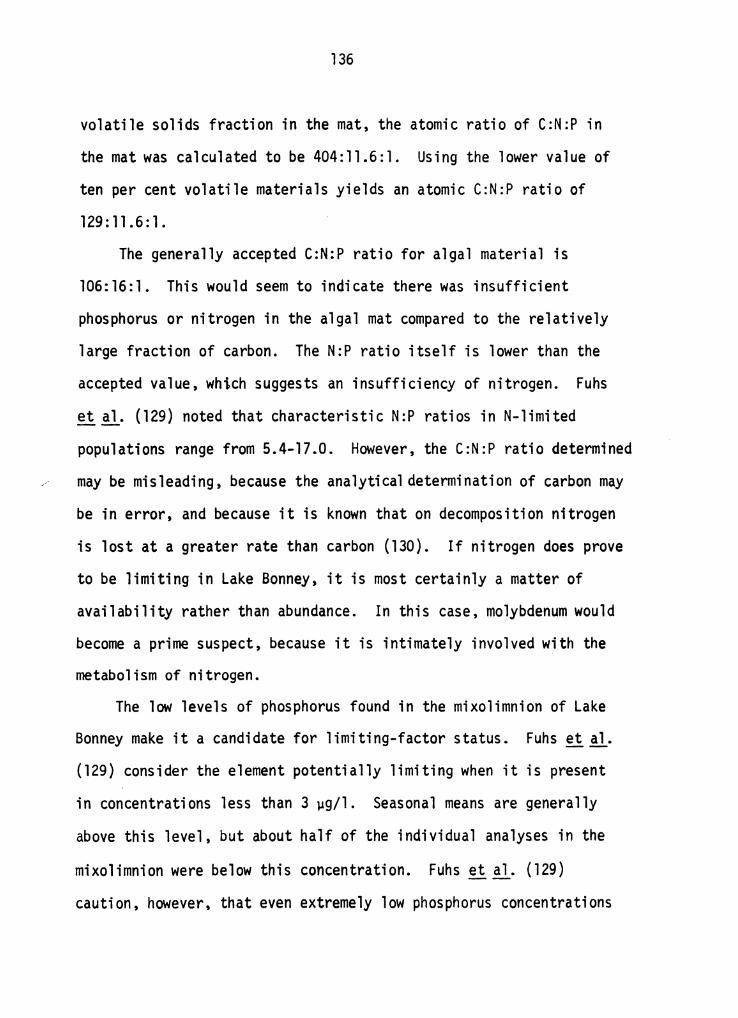
136
volatile solids fraction in the mat, the atomic ratio of C:N:P in
the mat was calculated to be 404:11.6:1. Using the lower value of
ten per cent volatile materials yields an atomic C:N:P ratio of
129 : 11. 6 : 1.
The generally accepted C:N:P ratio for algal material is
106:16:1. This would seem to indicate there was insufficient
phosphorus or nitrogen in the algal mat compared to the relatively
large fraction of carbon. The N:P ratio itself is lower than the
accepted value, which suggests an insufficiency of nitrogen. Fuhs
et El· (129) noted that characteristic N:P ratios in N-limited
populations range from 5.4-17.0. However, the C:N:P ratio determined
may be misleading, because the analytical determination of carbon may
be in error, and because it is known that on decomposition nitrogen
is lost at a greater rate than carbon (130). If nitrogen does prove
to be limiting in Lake Bonney, it is most certainly a matter of
availability rather than abundance. In this case, molybdenum would
become a prime suspect, because it is intimately involved with the
metabolism of nitrogen.
The low levels of phosphorus found in the mixolimnion of Lake
Bonney make it a candidate for limiting-factor status. Fuhs et!]_.
(129) consider the element potentially limiting when it is present
in concentrations less than 3 µg/l. Seasonal means are generally
above this level, but about half of the individual analyses in the
mixolimnion were below this concentration. Fuhs et El· (129)
caution, however, that even extremely low phosphorus concentrations

137
cannot be interpreted as P-limitation, because N-1imitation favors
luxury uptake of phosphorus.
A factor limiting to biological production in Lake Bonney has
not, therefore, been clearly indicated. Based on the results of
this study, either phosphorus or nitrogen {or both) may be limiting,
but there are also possible toxicity and non-chemical factors, such
as light and temperature, which need to be considered. The question
will not be resolved without further experimentation.
The data gathered in this study are further evidence of the
uniqueness of Lake Bonney. Lake Bonney has been described as mero-
mictic since the early work of Armitage and House (7), a term that
is used to describe a lake in which some water remains partially
or wholly unmixed during circulation periods. There is no evidence,
however, for any circulation periods in Lake Bonney, even in what is
usually tenned the mixolimnion. Lake Bonney is invariably mesother-
mic, i.e., exhibits a temperature maximum in the water column, which ~
has been explained on the basis of solar heating (17, 18). A similar
condition has been noted in Fayetteville Green Lake, a meromictic
lake in New York. But, in the latter instance, the mesothermic charac-
ter is seasonal in nature, and the warming in the chemocline region
is due primarily to absorption of sunlight by a layer of photosynthetic
bacteria (131). The abrupt chemical changes noted in the monimolimnion
of Lake Bonney (e.g., sulfates, alkalinity, etc.) are not typical of
the stability encountered in many meromictic lakes. Lake Mary
(Wisconsin), for example, shows virtually no seasonal variation in the
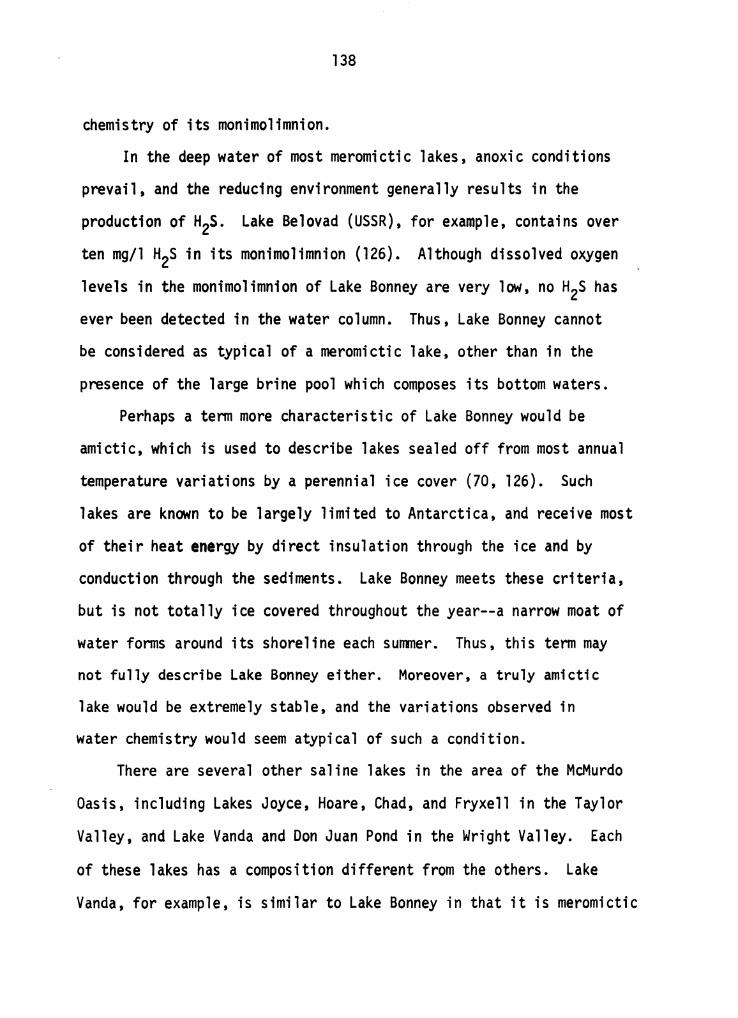
138
chemistry of its monimolimnion.
In the deep water of most meromictic lakes, anoxic conditions
prevail, and the reducing environment generally results in the
production of H2S. Lake Belovad (USSR), for example, contains over
ten mg/l H2s in its monimolimnion (126). Although dissolved oxygen
levels in the monimolimnion of Lake Bonney are very low, no H2s has
ever been detected in the water column. Thus, Lake Bonney cannot
be considered as typical of a meromictic lake, other than in the
presence of the large brine pool which composes its bottom waters.
Perhaps a term more characteristic of Lake Bonney would be
amictic, which is used to describe lakes sealed off from most annual
temperature variations by a perennial ice cover (70, 126). Such
lakes are known to be largely limited to Antarctica, and receive most
of their heat energy by direct insulation through the ice and by
conduction through the sediments. Lake Bonney meets these criteria,
but is not totally ice covered throughout the year--a narrow moat of
water forms around its shoreline each summer. Thus, this term may
not fully describe Lake Bonney either. Moreover, a truly amictic
lake would be extremely stable, and the variations observed in
water chemistry would seem atypical of such a condition.
There are several other saline lakes in the area of the McMurdo
Oasis, including Lakes Joyce, Hoare, Chad, and Fryxell in the Taylor
Valley, and Lake Vanda and Don Juan Pond in the Wright Valley. Each
of these lakes has a composition different from the others. Lake
Vanda, for example, is similar to Lake Bonney in that it is meromictic

139
and perennially ice covered, but there are striking differences.
Lake Vanda is 65 m deep with a mixolimnion that extends to about 55
m. Large quantities of H2S have been found in the monimolimnion.
The maximum temperature in the water column (25°C) is at the bottom,
and several convective cells have been identified in the lake (24, 27).
A comparison of these lakes and discussion of their origins is of
some interest, and is addressed by Yamagata et!}_. (73), Torii et!}_.
(27), and Wilson (132).
This study represents a major contribution to the kno~ledge
of Lake Bonney in several ways. It is the first continuous seasonal
study of the lake chemistry; it provides the most detailed analysis
of the trace metals in the lake; and it is the only detailed study
to date on the contributions of the meltstreams to the lake.
Knowledge of seasonal changes in the chemical limnology of Lake
Bonney is imperative to the construction of any ecosystem model of
the lake. Such a model is now being formulated, and the data collec-
ted in the course of this study will help provide it with a sound
empirical base.

VI. CONCLUSIONS
The results of this study have led to the following conclusions:
1. Lake Bonney is increasing in volume, with concomitant changes
in its morphometric parameters.
2. The Sollas-LaCroix meltstream accounts for approximately 11.5
per cent of the annual inflow to the lake. Both daily and
seasonal flows are highly variable.
3. There is strong evidence, based on chemical fluctuations in
the monimolimnion, that there is significant, though inter-
mittent, subterranean inflow to the lake.
4. There is a rapid increase in sulfate concentration throughout
the monimolimnion during the austral summer. The mechanism
is unknown, but may be related to subterranean inflow.
5. The relative abundance of trace metals analyzed in this study
in the lake, by mass, is Mn>Fe>Cu>Ni>Co=Mo. More than 90 per
cent of the mass of each trace metal is in the monimolimnion.
6. Manganese concentration was found to be negatively correlated
with algal cell counts at one depth. There was no other
evidence that any trace metal might be limiting or toxic to
the growth of phytoplankton in the mixolimnion. Toxic concen-
trations, to at least one algal species, or copper were present
in the monimolimnion.
7. The most significant loading of phosphorus to the lake from
the Sollas-LaCroix meltstream was during the first two weeks
l~

141
of flow, probably due to the leaching of phosphates from
substances in the stream beds which had weathered over the
long Antarctic winter.
8. Inorganic nitrogen is abundant in the water column. The prin-
cipal form is NH3-N.
9. Phosphorus loading from the Sollas-LaCroix meltstream was
correlated with algal cell counts one week later at the 4 m
depth, indicating such loading may enhance growth.
10. The meltstreams did not appear to contribute significant
quantities of most trace metals or nutrients when compared
to the concentrations found in the mixolimnion of the lake.
Cobalt may be an exception. Localized effects of inflow could
be significant.
The following rec0fl111endations for further study are made:
l. Additional data should be collected to clarify the relation-
ship between manganese concentration and algal growth in the
water column, and between algal growth and the phosphorus
loading by the meltstreams.
2. More information is needed concerning the flow of water between
the two lobes of Lake Bonney. Attempts to detect water movement
should center on the isthmus and on the western end of the
east lobe. Some effort should be made to quantify the inflow
from the Taylor meltstream, which is probably the greatest
source of surface inflow to the lake.
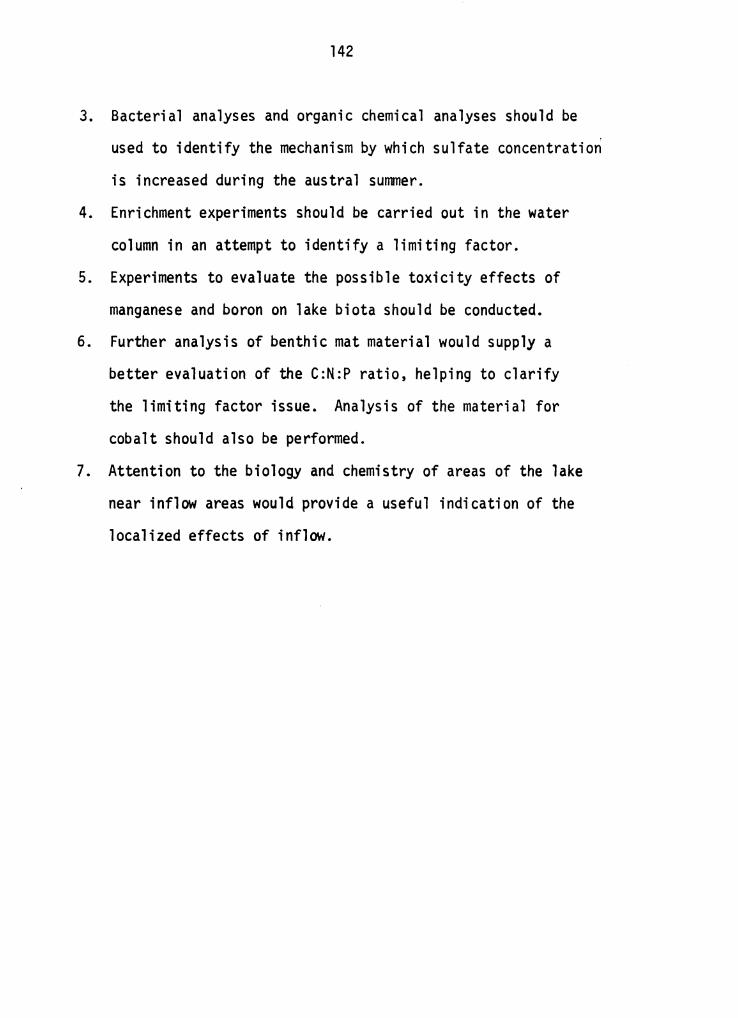
142
3. Bacterial analyses and organic chemical analyses should be
used to identify the mechanism by which sulfate concentration
is increased during the austral summer.
4. Enrichment experiments should be carried out in the water
column in an attempt to identify a limiting factor.
5. Experiments to evaluate the possible toxicity effects of
manganese and boron on lake biota should be conducted.
6. Further analysis of benthic mat material would supply a
better evaluation of the C:N:P ratio, helping to clarify
the limiting factor issue. Analysis of the material for
cobalt should also be performed.
7. Attention to the biology and chemistry of areas of the lake
near inflow areas would provide a useful indication of the
localized effects of inflow.

VII. Literature Cited
1. Neider, Charles, Ed~e of the World - Ross Island, Anatrctica, Doubleday and ompany, Inc., Garden City, N. Y. (1974).
2. King, H. G. R., The Antarctic, Blauford Press, London, England (1969).
3. Dort, Jr., Wakefield, "Mummified Seals of Southern Victoria Land, 11 Antarctic Journal of the U. s., Y!_: 210 (1971).
4. Scott, Robert Falcon, The Voya~e of the Discovery, Greenwood Press Publishers, New Yor , N. Y. (1969).
5. Neider, Charles, "A Walk in the Taylor Valley," Antarctic Journal of the U. S., VII: 249 (1972).
6. Wright, Sir Charles S., personal communication.
7. Annitage, Kenneth B. and House, Hugh B., 11A Limnological Reconnaissance in the Area of McMurdo Sound, Antarctica," Limnol. Oceanog., l_: 36 (1962).
,. ,. 8. Pewe, Troy L., "Multiple Glaciation in the McMurdo Sound Region,
Antarctica - A Progress Report, 11 Journ. Geo 1. , 68: 498 ( 1960).
9. Wilson, A. T., et al., "Dry Valley Lake Sediments: a Record of Cenozoic CTfmatic Events," Antarctic Journal of the U.S., .!!= 134 (1974).
10. Angi no, Ernest E. and Anni tage, Kenneth B., 11 A Geochemical Study of Lakes Bonney and Vanda, Victoria Land, Antarctica, 11
Journ. Geel., 71: 89 (1~63).
11. Weand, Barron L., et al., 11 Subterranean Inflow into Lake Bonney, 11
Antarctic Journai--of the u. S., != 15 (1975).
12. Parker, B. C., Hoehn, R. C. and Paterson, R. A., "Ecological Model for Lake Bonney, Southern Victoria Land, Antarctica, 11
Antarctic Journal of the U. S., VIII: 214 {1973).
13. Hoehn, R. C., Parker, B. C. and Paterson, R. A., 11Toward an Ecological Model of Lake Bonney, 11 Antarctic Journal of the u. s.' _!!: 297 {1974).
14. Fortner, R. D. and Weand, B. L., "Environmental Science in Antarctica," The Science Teacher, 42: 34 (1975).
143
144
15. Parker, Bruce C.,et !]_.,"Lake Bonney Ecosystems" Antarctic Journal of the u. S., !: 137 (1975).
16. Angina, Ernest E., Armitage, Kenneth B. and Tash, Jerry C., "Physiochemical Limnology of Lake Bonney, Antarctica," Limnol. Oceanog., i= 207 (1964).
17. Hoare, R. A., et al., "Lake Bonney, Taylor Valley, Antarctica: A NaturalSolar Energy Trap, 11 Nature, 202: 886 (1964).
18. Shirtcliffe, T. G. L. and Senseman, R. F., "A Sun-Heated Antarctic Lake, 11 Journ ~ Geophys. Res., 69: 3355 ( 1964).
19. Shirtcliffe, T. G. L., "Lake Bonney, Antarctica: Cause of the Elevated Temperatures," Journ. Geophys. Res., 69: 5257 (1964).
20. Benoit, Robert, Hatcher, Roger and Green, William, "Bacteriological Profiles and Some Chemical Characteristics of Two Permanently Frozen Antarctic Lakes, 11 In: Cairns, John (ed.), The Structure and Function of---;:'"reshwater Microbial ComiTii:iilities, Research Monogram No. 3, VPI & SO, Blacksburg, Va. (1969).
21. Koob, Derry D. and Leister, Geoffrey L., "Primary Productivity and Associated Physical, Chemical, and Biological Character-istics of Lake Bonney: a Perennially Ice-Covered Lake in Antarctica,"!!!.= Llano, George A. (ed.), Antarctic Terres-trial Biology, Antarctic Research Series, Volume 20, American Geophysical Union, Washington, D. C. (1972).
22. Goldman, Charles R., Mason, David T. and Hobbie, John E., "Two Antarctic Desert Lakes, 11 L imnol. Oceanog., ].£: 295 (1967).
23. Yamagata, N., Torii, T. and Murata, S., "Report of the Japanese Sunmer Parties in the Dry Valleys, 1963-1965: Part V, Chemi ca 1 Composition of Lake Waters, 11 Antarctic Record (Japan) , 29: 2339 ( 196 7) •
24. Ragotzkie, Robert A. and Likens, Gene E., "The Heat Balance of Two Antarctic Lakes, 11 Limnol. Oceanog., i= 412 (1964).
25. Angina, Ernest E., Armitage, Kenneth B. and Tash, J.C., 11A Chemical and Limnological Study of Lake Vanda, Victoria Land, Antarctica, 11 Kansas Science Bull., 45: 1097 ( 1965).
26. Goldman, C. R., "Primary Productivity in Antarctic Lakes, 11
In: Carrick, R., Holdgate, M. W. and Prevost, J. (eds.), Biologie Antarctigue, Hermann Publishing Co., Paris, France (1964).

145
27. Torii, Tetsuya, et al., "Geochemical and Geophysical Studies of Dry Valleys-:-Victoria Land in Antarctica, 11 Memoirs of National Institute of Polar Research, Special Issue No. 4, Tof<Yo, Japan (1975).
28. Armitage, Kenneth B., "The Need for Conservation of Freshwater Environments," In: Parker, B. C. (ed.), Conservation Problems in Antarctica, Allen Press, Inc., Lawrence, Kansas (1972).
29. Annitage, Kenneth B. and Angina, Ernest E., 11Minor Elements of Lakes Bonney and Vanda, Antarctica," Unpublished Manuscript (no date).
30.
31.
32.
33.
34.
35.
36.
37.
Cameron, Roy E., David, Charles N. and King, Jonathon, "Soil Toxicity in Antarctic Dry Valleys, 11 Antarctic Journal of the U.S., III: 164 (1968).
Black, Robert F., Johnson, M. L. and Berg, Thomas E., "Saline Discharge from Taylor Glacier, Victoria Land, Antarctica," Journ. Geol., 73: 175 (1965).
Stephens, George C. and Siegel, Fredric R., "Calcium Salts from Taylor Glacier, Southern Victoria Land," Antarctic Journal of the U. S., .!.'L= 133 (1969).
Parker, Bruce C., Whitehurst, Jeffrey T. and Hoehn, Robert C., "Observations of in situ Concentrations and Production of Organic Matter inan>rntarctic Meromictic Lake," Virginia Journ. Sci., 25:-136 (1974).
Tedrow, J. C. F. and U~olini, F. C., "Antarctic Soils," l!l.= Tedrow, J. C. F. (ed.), Antarctic Soils and Soil Fanning Processes, Antarctic ResearCh Series, Volume 8, American Geophysical Union, Washington, D. C. (1966).
J
Boswell, C.R., Brooks, R.R. and Wilson, A. T., "Some Trace Elements in Lakes of the McMurdo Oasis, Antarctica," Geochim. Cosmochim. Acta, l]_: 731 (1967).
Parker, Bruce C., et al., "Changes in the Dissolved Organic Matter, Photosyntnetic Production and Microbial C0111T1unity Composition in Lake Bonney, Southern Victoria Land, Antarctica," In: Third SCAR/IUBS Symposium on Antarctic Biology, Proceedings, National Academy of Sciences, Washington, D. c. (In Press).
Goldman, Charles R., "Antarctic Freshwater Ecosystems," In: Holdgate, M. W. (ed.), Antarctic Ecology, Academic Press, New York, N. Y. (1970).

146
38. Lane, Larry S., 11A Study of the Planktoni.c Bacterial Population Fluctuations in Lake Bonney, Antarctica, including Physiological Characterization and Identification of Select Members," Unpublished M. S. Thesis, VPI & SU, Blacksburg, Va. (1975).
39. Barghoorn, Elsa S. and Nichols, Robert L., "Sulfate-Reducing Bacteria and P.yri tic Sediments in Antarctica," Science, 134: 190 ( 1961 ) .
40. Walsh, Alan, 11The Application of Atomic Absorption Spectra to Chemical Analysis," Spectrochim. Acta, I= 108 (1955).
41.
42.
43.
44.
Kahn, Herbert L., 11 Principles and Practice of Atomic Absorption," In: Gould, Robert F. (ed.), Trace Inorganics in Water, ~erican Chemical Society9 Washington, D. C. (1968).
Kahn, Herbert L., "Instrumentation for Atomic Absorption - Part I, 11
Journ. Chem. Ed., 43: A-7 (1966).
Kahn, Herbert L., 11 lnstrumentation for Atomic Absorption -Part II," Journ, Chem. Ed., 43: Al03 (1966).
Burrell, David C., Atomic Spectrometric Analysis of Heavl Metal Pollutants in Water, Ann Arbor Science Publishers, nc., Ann Arbor, Michigan (1974).
45. L'Vov, B. V., 11 The Analytical Use of Atomic Absorption Spectra," Spectrochim. Acta,]_: 761 (1961).
46. Brodtman, Jr., Noel and Houghton, Irvin, "Analytical Determination of Trace Meta 1 s in Water, 11 Water and Sewage Works, 122: 64 (1975). -
47. Manning, D. C. and Fernandez, F., 11Atomization for Atomic Absorp-tion Using a Heated Graphite Tube, 11 A. A. Newsletter, 9: 65 (1970). -
48. Fernandez, F. J, and Manning, D. C., "Atomic Absorption Analysis of Metal Pollutants in Water Using a Heated Graphite Atomizer, 11
A. A. Newsletter, 1.9_: 65 (1971).
49. Segar, D. A. and Gonzalez, J. G., 11 Evaluation of Atomic Absorption with a Heated Graphite Atomizer for the Direct Determination of Trace Transition Metals in Sea Water, 11 Anal. Chim. Acta, 58: 7 {1972).
50. Anon., "Model HGA-2100 Graphite Furnace for Atomic Absorption," Order No. L-357A, Perkin Elmer Corp., Norwalk, Connecticut (1974).

51.
52.
53.
54.
. 55.
56.
57.
58.
59.
60.
147
Ediger, R. D., Peterson, G. E. and Kerber, J. D., 11Application of the Graphite Furnace to Saline Water Analysis, 11 Presented at the Pittsburgh Conference on Analytical Chemistry and Applied Spectroscopy, Cleveland, Ohio, March 5, 1974.
Cruz, Romana B. and Van Loon, Jon C., 11A Critical Study of the Application of Graphite-Furnace Non-Flame Atomic Absorption Spectrometry to the Detennination of Trace Base Metals in Complex Heavy-Matrix Sample Solutions," Anal. Chim. Acta, lJ:..: 231 (1974).
Fuller, C. W., 11 The Loss of Copper and Nickel During Pre-Atomiza-tion Heating Periods in Flameless Atomic Absorption Deter-minations, 11 Anal. Chim. Acta, 62: 442 (1972).
Segar, D. A. and Gonzalez, J. G., "Greater Flexibility with the Perkin-Elmer HGA-70 Heated Graphite Atomizer for Use in Selective Volatilization Analysis, 11 A. A. Newsletter, .!Q_: 94 ( 1971).
Kahn, Herbert L., 11The Detennination of Metallic Elements in Wastes and Waters with the Graphite Furnace, 11 Intern. Journ. Environ. Anal. Chem.,~: 121 (1973).
Kahn, Herbert L. and Slavin, Sabina, "Static Method of Analysis with Graphite Furnace (HGA-70), 11 A. A. News letter, 10: 125 (1971). -
Segar, Douglas A., 11 Atom Reservoir Atomic Absorption. Applica-tion to Marine Environmental Samples, 11 Intern. Journ. Environ. Anal. Chem., l= 107 (1973).
Silvey, William D., Occurrence of Selected Minor Elements in the Waters of California, Geological Survey Water-Supply Paper 1535-L, 0. S Government Printing Office, Washington, D. C • ( 196 7) .
Ruttner, Franz, Fundamentals of Limnolo,,,, 3rd ed., Univ. of Toronto Press, Toronto, Canada {19 ).
Hedgpeth, Joel W. t 11The Sea: a Biol ogi cal Sys tern, 11 In: Liptak, Bela G. (ed.J, Environmental Engineers• HandboOk, Vol. 1, Chilton Book Co., Radnor, Pennsylvania {1974).
61. Jobin, Robert and Ghosh, Mriganka M., "Effect of Buffer Intensity and Organic Matter on the Oxygenation of Ferrous Iron, 11
Journ. Am. Water Works Assoc., 64: 590 (1972).

148
62. Theis, Thomas L. and Singer, Philip C., 11 Complexation of Iron (II) . by Organic Matter and Its Effect on Iron (II) Oxygenation,"
Env. Sci. Technol., 8: 569 (1974).
63.
64.
65.
StuRJTI, Werner and Morgan, James L., Aguatic Chemistry, Wiley-Interscience, New York, N. Y. (1 70).
Cotton, F. Albert and Wilkinson, G., Advanced Inor~anic Chemistry, Interscience Publishers, New York, N. Y. {196 ).
O'Connor, John T., 11 Iron and Manganese, 11 In: American Water Works Association, Inc., Water Quality and""'Treatment, 3rd ed., McGraw-Hill Book Co., New York, N. Y. (1971).
66. Weast, Robert c. (ed.-in-chief), Handbook of Chemistra and Ph~sics, 48th ed., Chemical Rubber Co., Clevelan , Ohio (1 67).
67. Orten, James M. and Neuhaus, Otto W., Biochemistry, 8th ed., C. V. Mosby Co., St. Louis, Missouri (1970).
68. Frieden, Earl, 11 Biochemical Evolution of Iron and Copper Proteins, Substances Vi ta l to Life, 11 Chem. Eng. News, 52: 42 (March 25, 1974). -
69. Parker, Bruce C., "Aspects of Algal Physiological Ecology, 11
Unpublished Notes (1975).
70. Hutchinson, G. Evelyn, A Treatise on Limnology, Vol. I: Geography, Physics and Chemistry, John Wiley and Sons, Inc., New York, N. Y. (1957).
71. Gerloff, Gerald C. and Skogg, Falke, 11 Availability of Iron and Manganese in Southern Wisconsin Lakes for the Growth of Microcystis aeruginosa, 11 Ecology: 38: 551 (1957).
72. Morton, Stephen D. and Lee, Terrence H., 11Algal Blooms - Possible Effects of Iron, 11 Env. Sci. Technol., ~: 673 (1974).
73. Goldman, Charles R., "The Role of Minor Elements in Limiting the Productivity of Aquatic Ecosystems, 11 In: Likens, G. E. (ed.), Nutrients and Eutrophication, special Symposia Vol. 1, American Society of Limno1o~ and Oceanoggraphy, Inc., Allen Press, Lawrence, Kansas (1972).
74. Weimer, Walter C. and Lee, G. Fred, 11 Some Considerations of the Chemical Limnology of Meromictic Lake Mary, 11 Limnol. Oceanog. ~: 414 (1973).

75.
76.
77.
78.
79.
80.
81.
149
Delfino, Joseph J. and Lee, G. Freds. 11 Variation of Manganese, Dissolved Oxygen and Related Chemical Parameters in the Bottom Waters of Lake Mendota, Wisconsin, 11 Water Research (G. B.), §_: 1207 (1971).
Plumb, Russell H. and Lee, G. Fred, 11 A Note on the Iron-Organic Relationship in Natural Water," Water Research (G. B.), ]_: 581 (1973).
Reid, George K., Ecolo9t of Inland Waters and Estuaries, Van Nostrand Reinhold o., New York, N. Y. (1961).
Rashid, M.A. and Leonard, J. D., 11Modifications in the Solubility and Precipitation Behavior of Various Metals as a Result of Their Interaction with Sedimentary Humic Acid, 11 Chem. Geel., Jl: 89 (1973).
Morgan, J. J. and StU111T1, Werner, 11Analytical Chemistry of Aqueous Manganese, 11 Journ. Am. Water Works Assoc., 57: 107 (1965).
Krauskopf, Konrad B., Introduction to Geochemistry, McGraw-Hill Book Co., New York, N. Y. (1967).
Leckie, James 0. and James, Robert O., 11 Control Mechanisms for Trace Metals in Natural Waters, 11 In: Rubin, Alan J. (ed.), A ueous-Environmental Chemistr or-Metals, Ann Arbor Science u is ers, nc., nn r or, ic igan 4).
82. Comnittee on Biologic Effects of Atmospheric Pollutants, Man,anese, National Academy of Sciences, Washington, D. C. (19 3).
83.
84.
85.
86.
Hopkins, E. F. , "The Necessity and Function of Manganese in the Growth of Chlorella sp., 11 Science, 72: 609 (1930).
Round, F. E., The Biolor8 of the Algae, 2nd ed., Edt/ard Arnold Publishers, Ltd., ondon, England (1973).
Harvey, H. W., "Manganese and the Growth of Phytoplankton," Journ. Marine Biol. Assoc. (G. B.), 26: 562 {1947).
Knauer, George A. and Martin, John H., 11 Seasonal Variation of Cadmium, Copper, Manganese, Lead, and Zinc in Water and Phytoplankton in Monterey Bay, California, 11 Limnol. Oceanog., ~: 597 (1973).

87.
88.
89.
90.
91.
92.
93.
94.
95.
96.
97.
98.
150
Kneip, Theo. J. and Lauer, Gerald.Jes 11 Trace Metal Concentration Factors in Aquat1.c Ecosystems. 11 .!.!!.= Ahuja, Sut, et al. {eds.) Chemical Anallsis of the Environment. Plenum Press, New York, N. Y. ( 973).
Hutchinson, Eric, Chemistry, W. B. Saunders Co., Philadelphia, Pennsylvania (1959).
Conn, Eric E. and Stumpf, P. K., Outlines of Biochemistrt, 2nd ed., John Wiley and Sons, Inc., New York, N. Y. (19 6).
Wood, Dennis K. and Tchobanoglous, George, "Trace Elements in Biological Waste Treatment, 11 Journ. Water Poll. Control Fed., 47: 1933 (1975).
Fitzgerald, G. P. and Faust, S. L., 11 Factors Affecting the A~gicidal and Al9istatic Properties of Copper, 11 Applied Mlcro., 11: 345 {1963).
Greenfield, S. S., 11 Inhibitory Effect. of Inorganic Compounds on Photosynthesis in Chlorella, 11 Am. Journ. Botany, 29: 121 (1942). -
Nielson, E. S., Kamp-Nielson, L. and Wium-Andersen, S., 11The Effect of Deleterious Concentrations of Copper on the Photosynthesis of Chlorella PYrenoidusa, 11 Physiologia Plantarum, 22: 1121 (1969).
Maloney, T. E. and Palmer, C. M., 11 Toxicity of Six Chemical Compounds to Thirty Cul tu res of A 1gae, 11 Water and Sewage Works, 103: 509 (1956}.
Hassall,K. A., 11 A Specific Effect of Copper on the Respiration of Chlorella vulgaris, 11 Nature, 193: 90 (1962).
McBrien, D. C. H. and Hassall, K. A., 11 The Effect of Toxic Doses of Copper Upon Respiration, Photosynthesis and Growth of Chlorella vulgaris, 11 Physiologia Plantarum, 20: 113 (1967).
Hassall, K. A., 11 Uptake of Copper and Its Physiological Effects in Chlorella vulgaris, 11 Physiologia Plantarum, 16: 323 (1963). -
Fitzgerald, George P., Algicides, Literature Review No. 2, University of Wisconsin Water Resources Center, Madison, Wisconsin (1971).

99.
100.
101.
102.
151
Cairns, Jr., John, Lanza, Guy R. and Parker, Bruce C., "Pollution Related Structural and Functional Changes in Aquatic Coomunities with Emphasis on Freshwater Algae and Protozoa," Proc. Acad. Nat. Sci. Philadelphia, 124: 79 (1972).
Foehrenbach, Jack, 11 Eutrophication, 11 Journ. Water Poll. Control Fed., 44: 1150 (1972).
Ferguson, J. and Bube 1 a, B., "The Concentration of Cu (II), Pb (II), and Zn(Il) from Aqueous Solutions b¥ Particulate Algal Matter, 11 Chem. Geol., .!l: 163 (1974).
Nichols, M. Starr, Henkel, Theresa and McNall, Dorothy, "Copper in Lake Muds from Lakes of the Madison Area, 11 Trans. Wisc. Acad. Sciences, Arts and Letters, 38: 333 (1946).
103. Wallmeyer, Joseph G., "The Fate of Copper Following Coriper Sulfate Applications to the Occoquan Reservoir, Virginia,' Unpublished M. s. Thesis, VPI & SU, Blacksburg, Va. (1973).
104. Parker, Bruce C., "Rain as a Source of Vitamin B12 , 11 Nature, 219: 617 (1968).
105. Holm-Hansen, Osmund, Gerloff, Gerald C. and Skopg, Folke, "Cobalt as an Essential Element for Blue-Green Alga~, 11 Physiologia Plantarum, ]_: 665 (1954).
106. Krauskopf, Konrad B., "Factors Controlling the Concentration of Thirteen Rare Metals in Sea-Water, 11 Geochim. Cosmochim. Acta, ~: l (1956).
107. Vega, J.M., et al., 11 Role of Molybdenum in Nitrate Reduction by Chlorelli:"''Plant Physiol., 48: 294 (1971).
108. Goldman, Charles R., "Molybdenum as an Essential Mi cronutrient and Useful Watermass Marker in Castle Lake, California," In: Gotterman, H. L. and Cyrano, R. S. (eds.), Chemical tilvironment in the A~uatic Habitat, N. V. Norrd-Hollandsche Uitgevers MoatshappiJ, Amsterdam, The Netherlands (1967).
109. Bertine, K. K., "The Deposition of Molybdenum in Anoxic Waters, 11
Mari ne Chem. , l: 43 ( 19 72) .
110. Weand, Barron L., "Using Standard Additions in Antarctica," Chemistry, ~: 6 (1975).

152
111. Murphy, J. and Riley, J. P., 11 A Modified Single Solution Method for the Detnnination of Phosphate in Natural Waters," Anal. Chim. Acta, 27: 31 (1962).
112. American Public Health Association, Standard Methods for the Examination of Water and Wastewater, 13th ed., APHA, Washington, D. C. (1971).
113.
114.
115.
Martin, Dean F., Marine Chemistr), Volume I, Marcel Dekker Inc., New York, N. Y. (1972 .
Sawyer, Clair N. and McCarty, Perry L., Chemistry for Sanitary En§ineers, 2nd ed., McGraw-Hill Book Co., New York, N.Y. ( 1 67) .
Manning, D. C., "Alignment Procedure for the D2 Background Corrector," Atomic Absorption Application Study No. 476, Perkin-Elmer Co\poration, Norwalk, Conn. (1973).
116. Anon., Analytical Methods for Atomic Absorption Spectroscor>' Using the AGA Graghite Furnace, Perkin-Elmer Corporat on, Norwalk, Conn. (1 73).
117. Craig, James R., Fortner, Richard D. and Weand, Barron L., "Halite and Hydrohalite from Lake Bonney, Taylor Valley, Antarctica," Geology, _g_: 389 (1974). ·
118. Mehta, N. C., et al., "Detennination of Organic Phosphorus in Soi 1 s: I. """txtracti on Method," Soi 1 Sc. Soc. Amer. Proc. , ~: 443 (1954).
119. Sabbe, W. E. and Bre 1 and, H. L. (eds. ) , 11 Procedures Used by State Soil Testing Laboratories in the Southern Region of the United States, 11 Southern Coop. Serv. Bulletin No. 190 (1974).
120. Perkins, H. F., 11A Rapid Method of Evaluating the Zinc Status of Coastal Plain Soils," Coll111. Soil Sci. Plant Anal., 1: 35 (1970). -
121. Jones, J. B., Jr. and Warner, M. H., "Analysis of Plant-Ash Solutions by Spark-Emission Spectroscopy," In: Grove, E. L. and Perkins, A. J. (eds.), Developments in 'Applied SlectroscoPY, Volume 7A, Plenum Press,'New York, N. Y. ( 969).
122. Crouch, Gary S., personal coll111unication.
123. Parker, Bruce C., personal coll111unication.

153
124. Hoehn, Robert C., et al., "Nitrogen and PhosplJorus Availability to Plankton an<:f Benthic Communities in Lake Bonney, Southern Victoria Land, Antarctica," In: Third SCAR/IUBS Symposium on Antarctic Biology, Proceedings, National Academy of Sciences, Washington, D. C. (In Press).
125. Harris, Henry, Illinois State Geological Survey, personal comnunication.
126. Wetzel, Robert G., LimnologT, W. B. Saunders Company, Phila-delphia, Pennsylvania 1975).
127.
128.
129.
130.
131.
132.
Buckman, Harry 0. and Brady, Nyle C., The Nature and Properties of Soils, 7th ed., The Maanillan Company, New York, N. Y. (1969).
Bingham, F. T., "Boron in Cultivated Soils and Irrigation Waters," In: Kothny, Evaldo L. (ed.), Trace Elements in the Environment, American Chemical Society, Washington, D. C. (1973}.
Fuhs, G. Wolfgang, et al., "Characterization of Phosphorus-Limited Plankton Algae, 11 In: Likens, G. E. (ed.), Nutrients and Eutrophication, SpeciaT Symposia Volume l, American Society of Limnology and Oceanography, Inc., Allen Press Inc., Lawrence, Kansas (1972).
Odum, Eugene P. and Odum, Howard T., Fundamentals of Ecology, 2nd ed., W. B. Saunders Company, Philadelphia, Pennsylvania (1959).
Brunskill, G. J. and Ludlam, S. 0., "Fayetteville Green Lake, New York. I. Physical and Chemical Limnology, 11 Limnol. Oceanog. , !i= 817 ( 1969).
Wilson, A. T., 11 The McMurdo Dry Valleys," In: Holdgate, M. W. (ed.), Antarctic Ecology, Academic Press, New York, N. Y. (1970).

Appendix A
The Method of Standard Additions
154

155
The method of standard additions was utilized for most chemical
analyses in this study. A standard addition is merely the addition
of a known quantity of a substance to a sample containing an unknown
amount of the same substance. The amount added is sometimes called
a spike, and a sample so treated is said to be spiked. Upon analysis
using colorimetric or spectrophotometric techniques, spiked saqiples
will obviously show higher absorbance than the unspiked sample, and,
in the range where Beer's law is applicable, a straight line results
when absorbance is plotted vs. concentration. It can be shown
algebraically that the concentration of the unknown in the sample is
ntJT1erically equal to the concentration intercept on such a graph (110).
A specific example of the use of this technique is shown in
Appendix Figure A-1. Five spiked samples were analyzed for ortho-
phosphate phosphorus, in addition to the unspiked sample. Each
spiked sample contained a different amount of added orthophosphate,
as indicated by the abscissa in the figure. The intercept on the
concentration axis is -34, which indicates the orthophosphate
phosphorus concentration in the sample was 34 µg/1.
Although graphical analysis is quite useful in the standard
additions approach, data from Lake Bonney were fitted to a least
squares linear regression line and the intercept calculated
mathematically.

156
OPTICAL DENSITY, KLETT UNITS
200
X X+50 X+100 X+150 CONCENTRATION P04- P , pa/ I
Appendix Figure A-1. A typical analysis by standard additions. The unknown contained 34 µg/l P04-P.

Appendix B
Data Calculated from the University of Waikato (N.Z.)
Bathymetric Survey of Lake Bonney
157

158
APENDIX TABLE B-1
Planimetered areas of the contours from the University of Waikato bathymetric survey of Lake Bonney.
Depth, m Area, km
East Lobe West Lobe Total
Surface 2.53 0.73 3.26
5 2.23 0.63 2.86
10 2.11 0.52 2.63
15 l. 79 0.42 2.21
20 1. 59 0.36 1.95
25 1. 35 0.26 1.61
30 1.01 o. 13 l. 14
35 0.00 0.014 0.014

159
APPENDIX TABLE B-2
Volume of vertical elements of Lake Bonney. Calculated after the method of Hutchinson, reference 70.
Vertical Element, m Volume, hm3
East Lobe West Lobe Total
0-5 11.89 3.39 15.28
5-10 10.86 2.86 13.72
10-15 9.73 2.34 12.07
15-20 8.45 1.94 10.39
20-25 7.36 1.54 8.90
25-30 5.89 0.96 6.85
30-35 1.68 o. 31 1.99
Totals 55.86 13.34 69.20
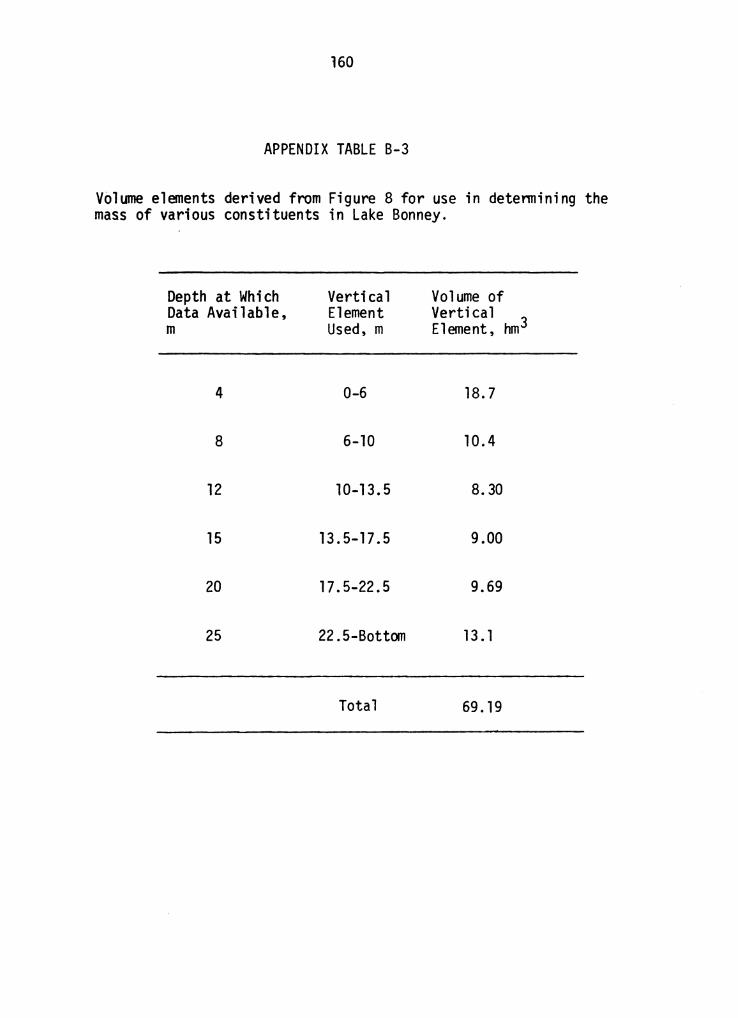
160
APPENDIX TABLE B-3
Volume elements derived from Figure 8 for use in detennining the mass of various constituents in Lake Bonney.
Depth at Which Data Available, m
4
8
12
15
20
25
Vertical Element Used, m
0-6
6-10
10-13.5
13.5-17.5
17.5-22.5
22.5-Bottom
Total
Volume of Vertical 3 Element, hm
18.7
10.4
8.30
9.00
9.69
13. 1
69. 19

Appendix C
Data from Field Study at Lake Bonney
161

162
APPENDIX TABLE C-1
Daily flow in the Sollas-LaCroix meltstream (1974-75).
Date Flow, m3 Date Flow, m3
10 December 1974 179 4 January 1975 1223 11 II II 682 5 II II 1050 12 II II 1362 6 II II 842 13 II II 4204 7 II II 963 14 II II 4699 8 II II 194
15 II II 5264 9 II II 2237 16 II II 3285 10 II II 3105 17 II II 3720 11 II II 1958 18 II II 1521 12 II II 2749 19 II II 9058 13 II II 4720
20 II II 6554 14 II II 4231 21 II II 5676 15 II II 7430 22 II II 592 16 II II 7234 23 II II 407 17 II II 3057 24 II II 1082 18 II II 2891
25 II II 333 19 II II 1020 26 II II 375 20 II II 515 27 II II 1047 21 II II 279 28 II II 8522 22 II II 432 29 II II 11950 23 II II 174
30 II II 8370 24 II II 308 31 II II 1876 25 II II 101 l January 1975 575 26 II II 371 2 II II 1026 27 II II 1047 3 II II 2493 28 II II 1970
29 II II 1938 30 II II 1940 31 II II 989
Total Flow 139 ,820

APPENDIX TABLE C-2
Weekly water and air temperatures at site l (1974-75). Temperatures were recorded to the nearest 0.25°C. Depths were measured from the piezometric surface.
Date Depth, m November December January
5 12 19 28 6 12 20 27 3 10 17
Surface 0.00 -1.00 -0.75 -1.00 -1.00 -0.25 -0.50 -0.25 -0.25 -0.25 -0.25 2 -0.50 -0.50 -1.00 -1.00 -0.75 -1.00 xa -0.25 0.00 -0.75 0.00 4 0.75 0.50 0.50 0.00 -0.25 0.50 0.50 0.75 0.75 0.50 1.00 6 2.00 2.25 2.25 2.50 2.50 2.00 2.25 2.75 2.75 2.25 3.00 .....
°' 8 3.75 3.50 3.75 3.50 4.00 4.00 3.75 3.00 3.75 3.75 4.25 w
10 4.75 5.00 4.75 4.75 5.00 5.50 4.75 5.00 4.75 4.75 5.50 12 5.00 5.50 5.25 5.00 5.25 5.25 5.25 5.75 5.50 5.25 6.00 14 5.50 5.50 5.50 5.50 5.25 5.50 5.50 6.00 6.00 5.75 6.50
16 5.50 5.50 5.50 5.50 5.25 4.25 5.50 6.00 6.00 5.75 6.50 18 5.25 5.50 5.00 5.00 5.00 5.00 5.00 5.75 5.50 5.50 6.00 20 4.50 4.75 4.50 4.50 4.50 4.00 4.75 5.00 5.00 4.75 5.50 22 3.75 4.00 3.25 4.00 3.50 3.00 3.50 4.00 4.25 4.00 5.00
24 2.75 3.00 2.50 2.00 2.00 2.00 3.00 3.00 3.00 3.00 3.50 26 1. 75 2.00 1.25 1.50 l.00 1.25 1. 75 2.00 2.00 1. 75 2.25
a Datum not available.

APPENDIX TABLE C-3
Seasonal variations in chloride concentration at site l (1974-75). All values g/l.
Depth, m November 5 12 19 28
Date December
6 13 20 27 January
3 10 17
4 0.289 0.247 0.247 0.295 0.257 0.261 0.152 0.153 0. 197 0.097 0.085
6 1.11 1.05 0.926 0.732 * 0.618 0.608 0.564
8 3.90 3.56 2.85 3.52 1.76 1.43 2.09 l .62 3.09 l.52 1.64
10 9.12 5.51 9.41 10.6 5.27 7.08 7.23
12 12.4 14.9 15.2 17.4 16.7 18.l 16.7 14.3 11.8 13.2 12.l
15 68.4 76.5 32.3 77.0 70.3 72.2 68.4 63.7 61.8 65.6 59.8
20
25
115
152
lll
151
85.5 143
136 148
* Data not available.
133
142
139
152
139
151
136
151
131
148
135
152
139
155
..... 0\ ~

APPENDIX TABLE C-4
Seasonal variation in dissolved oxygen at site l (1974-75). All values in mg/l.
Date Depth, m November December January
5 12 19 28 6 13 20 27 3 10 17
4 22.4 24.4 28.0 27.4 29.9 23.8 26.9 23.5 24. l 26. l 20.0
6 28.4 37.0 33.2 34.6 32.9 36 .4 29.2 36.8 37.3 33.4 34.6 ...J
23.6a b O'I 8 - 36. l 34.2 40.2 38.8 34.8 35.2 38.9 38.4 37.7 (J'1
10 29.4 36.2 32.6 30.9 33.8 37.1 35.9 37. l 35.7 39.4 37.8
12 33.7 32.9 35. l 31. l 37.8 13 .4 33.4 36.2 37.3 30. 1 36.6
15 4.5 5.8 6.8 1.2 6.0 0.8 1.8 5.7 4.9 6.0 5.6
20 0. l 0.1 0.3 4.5 0.4 0.2 0. 1 0. l 0. 1 0. l 0.1
25 0.7 0.3 0.9 0.5 l.0 0.5 0.8 0.9 1.2 0.8 0.7
a Probably low, see text.
b Datum not available.
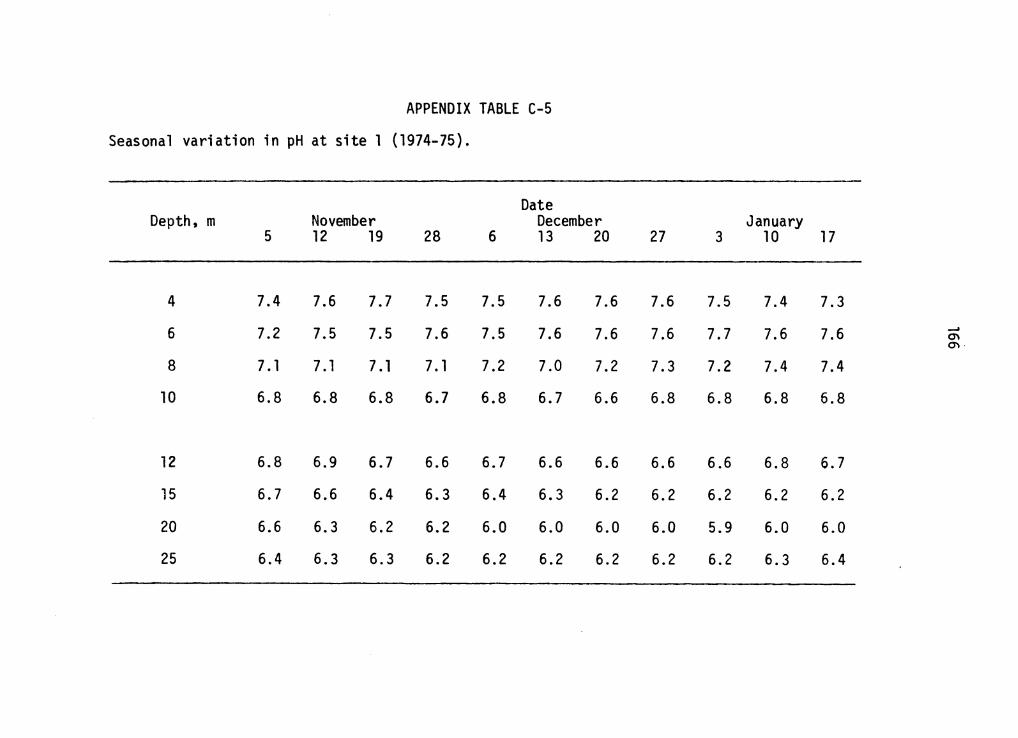
APPENDIX TABLE C-5
Seasonal variation in pH at site 1 (1974-75).
Depth, m November Date
December January 5 12 19 28 6 13 20 27 3 10 17
4
6
8
10
12
15
20
25
7.4
7.2
7.6
7.5
7.7
7.5
7.5
7.6
7.5
7.5
7.6
7.6
7.6
7.6
7.6
7.6
7.5
7.7
7.1 7.1 7.1 7.1 7.2 7.0 7.2 7.3 7.2
6.8 6.8 6.8 6.7 6.8 6.7 6.6 6.8 6.8
6.8 6.9 6.7 6.6 6.7 6.6 6.6 6.6 6.6
6.7 6.6 6.4 6.3 6.4 6.3 6.2 6.2 6.2
6.6 6.3 6.2 6.2 6.0 6.0 6.0 6.0 5.9
6.4 6.3 6.3 6.2 6.2 6.2 6.2 6.2 6.2
7.4
7.6
7.3
7.6
7.4 7.4
6.8 6.8
6.8 6.7
6.2 6.2
6.0 6.0
6.3 6.4
~
CJ\ CJ\.

APPENDIX TABLE C-6
Seasonal variation in alkalinity at site 1 (1974-75). All values mg/l as Caco3.
Date Depth, m November December January
5 12 19 28 6 13 20 27 3 10 17
4 63 47 58 58 58 58 32 32 21 26 21 5 * 68 68 68 53 47 63 32 42 47 47 -6 100 100 79 84 89 74 95 47 74 74 63
--'
°' 7 105 105 110 110 42 84 63 100 95 100 "' -8 163 163 136 131 110 110 121 95 147 110 105 9 - 242 184 268 226 242 247 179 158 163 231
10 326 200 310 315 247 284 305 142 200 273 257 11 - 315 304 299 294 315 294 284 320 315 310 12 326 326 284 315 320 336 326 310 299 289 315
15 809 746 430 764 714 798 672 730 677 609 703 20 615 536 541 399 420 499 415 488 457 389 499 25 420 315 551 315 342 504 326 331 326 347 326
* Data not available.

168
APPENDIX TABLE C-7
Seasonal variation of total manganese concentration at sites 1 and 2 (1974-75). All values are mg/l.*
Depth, m Date
4 8 12 15 20 25 33
Site 1
November 5 0.009 0.·12 0.020 4.0 6.9 9.7 -t 12 0.003 0.082 0.042 2.7 5.4 9.9 19 < .001 0.038 0.038 1.4 3.5 6.9 28 0.003 0.38 0.038 5.0 7.8 9.3
December 6 0.001 0.047 0.062 3.8 2.5 8.3 13 0.23 0. 17 0.004 6. l 8.7 8.8 20 0.032 0.044 0.006 4.7 7.7 8.5 27 0.012 0.011 0.003 11.2 8.7 8.3
January 3 0.016 0.005 0.60 3. l 7.8 9.9 10 0.002 0.014 0.010 4.0 5.2 8.2 17 0.007 0.015 0.92 3.9 7.0 8.6
Mean 0.011 0.084 0.158 4.54 6.47 8.76
Site 2
November 13 0.002 0.029 0.032 3.6 7. l 9.8 8.1
January 8 0.010 0. 11 0.006 3.3 7.3 7.9 43
* All values reported to two significant figures or to the nearest 0.001 mg/1, whichever is 1 arger.
t Site 1 only 26 m deep.

l69
APPENDIX TABLE C-8
Seasonal variation of total iron c~ncentration at sites 1 and 2 (1974-75). All values are mg/1.
Depth, m Date
4 8 12 15 20 25 33
Site 1
November 5 0. 10 0.02 0.02 0.47 2.2 5.8 t 12 0.03 0.03 0.01 0.41 0.30 3.6 19 0.02 0.05 0.02 0.89 0.42 0.93 28 0.03 0.03 0.02 0.42 0.83 1.5
December 6 0.01 0.02 <. 01 0.61 1.6 0.52 13 0.09 0.11 0.03 0.61 2. 1 0.82 20 0.03 0.01 <. 01 0.32 1. 1 0.95 27 0.40 0.04 <. 01 0.30 0.62 0.33
January 3 0. 16 0.03 0.06 1.2 0.38 0.65 10 0. 12 0.05 0.08 0.87 1.6 0.27 17 0.25 0.05 0.02 1.2 2.3 0.96
Mean 0. 11 0.04 0.032 0.66 1.22 1.48
Site 2
November 13 0.02 0.01 0.03 0.33 0.38 3.6 1. 3
January 8 0. 13 0.04 0.03 1.1 0.73 1.0 1.2
* All values reported to two significant figures or to the nearest 0.01 mg/l, whichever was larger.
t Site l only 26 m deep.

170
APPENDIX TABLE C-9
Seasonal variation of total copper concentration at sites 1 and 2 (1974-75). All values are mg/l.*
Depth, m Date
4 8 12 15 20 25
Site l
November 5 0.025 0.004 0.039 0.77 0. 19 0. 12 12 0.009 0.006 0.002 0.28 0.20 o. 72 19 0.009 0.003 0.011 0.050 1.2 0.20 28 0.002 <.001 <.001 0.050 0.054 0.065
December 6 0.002 0.006 0.007 0.43 0.036 0.037 13 0.034 <.001 0.005 0.15 0. 10 0.029 20 0.005 <.001 <.001 <.001 0.051 0.033 27 0.039 0.047 0.046 3.0 0.57 0.38
January 3 0. 12 0.011 0. 17 0. 19 1.5 0.68 10 0.096 0.010 0.025 0.35 0. 77 0. 11 17 0. 16 0.014 0.088 0.61 0. 15 0.019
Mean 0.046 0.013 0.044 0.59 0.44 0.22
Site 2
November 13 0.015 0.005 0.057 0.62 1.0 0. 19
January 8 0.020 0.008 0.25 0.42 0.40 0.16
*
33
t -
0. 18
0.20
All values reported to two significant figures or to the nearest 0.001 mg/1, whichever was larger.
t Site 1 only 26 m deep.

171
APPENDIX TABLE C-10
Concentration of total nickel and total cobalt on two dates at site l (1974-75). All values are mg/l.
Metal Date 4 8
* Ni November 5 <.01 0.04
January 17 <.01 <.01
Depth, m
12
0.04
0.01
15
0.05
0.04
20
0.55
0.08
25
0.38
3.3
cot November 5 <.001 <.001 <.001 0.26 0.18 0.023
January 17 <.001 <.001 <.001 0.013 0.042 0.10
* Values reported to two significant figures or to the nearest 0.01 mg/l, whichever was larger.
t Values reported to two significant figures or to the nearest 0.001 mg/1, whichever was greater.

172
APPENDIX TABLE C-11
Mass of certain trace metals in Lake Bonney.
Metal Parameter Mn Fe Cu Ni Co
Total mass, 221 39.9 13. 8 8.67 3 .11 <3.55 io3 kg
Mass in mixo- 2.39 2.74 l. 36 0.229 <.0384 <.0384 limnion, 103 kg
Per cent in 1. 1 6.9 9.8 2.6 <1.2 mi xol imnion
Mean concen- 64 73 36 6. l <l <l tration in mixolimnion,
* µg/1
t Based on estimated concentrations. * Mass of metal in mixolimnion divided by volume of
mi xol imnion.

173
APPENDIX TABLE C-12
Concentration of selected trace metals in the Sollas-LaCroix meltstream during the 1974-75 field s~ason. All values represent total concentrations and are in mg/l.
Date
December 13
January
20
27
3
10
17
Meant
*
Mn
0.023
0.018
0. 13
0.052
0.055
0.10
0.063
Fe
0.02
0.05
0.02
0.01
<.01
<.01
0.017-0.020
Metal Cu
0.003
0.024
0.004
0.003
0.004
0.002
0.0067
Ni
<.01
0.03
<.01
<.01
<.01
<.01
0.005-0.013
Co
0.003
0.005
0.004
<.001
0.001
<.001
0.0022 0.0025
Values reported to same significance as in Appendix Tables C-7 through C-10.
t Range of mean given for some metals, see text.

APPENDIX TABLE C-13
Seasonal variation in orthophosphate phosphorus and condensed phosphate phosphorus at site 1 (1974-75). All values in µg/l.
Depth, m November 5 12 19 28
o-P04-P
* 4 - 3.7 8.0 <. 1
6 3.7 5.9 4. 1 6. 1
8 4.0 2.9 0.5 7.3
10 3.2 3.5 <. 1 2.8
12 9.5 61.6 16.7 1. 7
15
20
25
86.0 18.9 6.0 102
36
75
37
84
*Data not available
51
80
59
63
Date December
6 13 20
5.4 9.5
0.7 1.2
1.4 -0.8 36.4
<. 1 5.0
20. 6 19. 0
34
68
57
18
4.0
1.0
7.0
0.9
1. 9
5.4
27
44
27
21.2
3.0
3.0
2.6
1.0
4.0
100
22
January Mean 3 10 17
4.6 0.9
2.0 4.2
<. 1 4.2
6.5 6.8
9.0 6.9
6.5 26.8
76
70
59
55
7.0 7. l
4.9 3.3
9.0 4.4
2.9 6.0
1.0 11.4
5.4 27.3
92
89
57. 1
60.7
_, ""J .J:>

Depth, m
c-P04-P
4
6
8
10
12
15
20
25
5
----
APPENDIX TABLE C-13 (continued)
November 12 19 28
- 27.0 12.6
- 3.2 1.0
- 19.2 -
- 13.3 -
366
110 4200
500 15
Date December
6 13 20 27
0.0
7.2
4.0
-
15.0
830
21
0.0
34.0
--
210
- -11. 2 -- 240
10.4 16.4
1.3 13.0
92.0 125
o.o 88
January Mean 3 10 17
1.4 7.6
4.0 8.3
4.8 5.3
0.5 10.6
2.2
52.4 360
- 8. l
6.7 9.5
- 54.7
2. l 8.9
7.6 7.8
550 258
43 1600 1130
37 145
_, ..... (J'1

176
APPENDIX TABLE C-14
Orthophosphate phosphorus concentrations in the Sollas-LaCroix meltstream during the 1974-75 field season.
Date
December 10 11 12 13 14
15 16 17 18 19
20 21 22 23 24
25 26 27 28 29
30 31
*
Concentration o-P04-P, µg/1
23.9 22.2 12.7 15.0 35.7
12.5 65.5 21. 3
269 21. 2
71. i 21. 1 72.2
* 0.6
59.9 14.8 8.6
2i.6 17.4
9.7 34.5
Data not available.
Date
January 1 2 3 4 5
6 7 8 9
10
11 12 13 14 15
16 17 18
Concentration o-P04-P, µg/1
24.7 30.6
29.1
2.3 11.0 5.8 6. 1
14 .2 14.5 7.0
14.7
17. 4 20.3

177
APPENDIX TABLE C- 15
Mass of certain nutrients in Lake Bonney.
Parameter Nutrient o-P04-P c-P04-P NH+-N 4 N03-N N02-N so4
Total mass, 1. 90 15.9 103 kg
201 84 .1 11.8 127
Mass in mixo- 0.282 0.785 8.10 9.41 0.278 18.4 limnion, 103 kg
Per cent in 14.9 4.9 4.0 11.2 2.4 14.5 mixolimnion
Mean concen- 0.00754 0.0210 0.217 0.252 0.00743 0.492 tration in mixolimnion, mg/l*
* Mass of metal in mixolimnion divided by volume of mixolimnion.

178
APPENDIX TABLE C-16
Daily loading of orthophosphate phosphorus to Lake Bonney from the Sollas-LaCroix meltstream during the 1974-75 field season.
Date
December 10 4.28 11 15. 1 12 17.3 13 15.0 14 168
15 65.8 16 215 17 79.2 18 409 19 192
20 466 21 120 22 42. 7 23 -* 24 0.6
25 19.9 26 5.55 27 9.00 28 184 29 208
30 81.2 31 64.7
* Data not available.
Date
January 1 2 3 4 5
6 7 8 9
10
11 12 13 14 15
16 17 18
Total
Mass o-P04-P mg
25.3 76.3
30.6
2.21 2 .13
18.0
11. 9 39.0 68.4 29.6
109
53.2 58.7
2. 95 grams
Mean Daily Loading 86.8 mg

APPENDIX TABLE C-17
Seasonal variation of arrrnonia concentration at site l (1974-75). All values in µg/l as N.
Depth, m
4
6
8
10
12
15
20
25
November 12 19
184
795
378
479
28
186
687
Date December
6 13 20
73
59
0
3
0
201
27
4
57
January 3 10 17
83
374
185
265
144
151
75 229 298 36 6 420 321 572 73 254
167 1310 559 303 303 373 351 326 326 251
124 500 721 159 159 172 687 446 342 491
4240 2830 5130 2490 2110 5970 2820 6080 3840 4940
4430 5470 9660 5110 5380 4660 8820 2840 8200 4680
4600 7130 11,400 8300 3020 3660 8190 5430 6010 17,800
Mean
124
307
228
427
380
4040
5930
7550
__, -....J
"°

APPENDIX TABLE C-18
Seasonal nitrate-nitrogen concentration at site l (1974-75). All values as µg/l.
Depth, m
4
6
5
202
168
November 12 19
219
272
202
157
28
288
347
Date December
6 13 20
239
272
130
202
145
298
27
163
311
January 3 10 17 Mean
118
270
90
258
173
331
179
263
8 450 273 271 323 222 246 365 230 260 272 192 282
10 482 289 375 377 297 383 479 266 336 303 294 353
12 329 585 553 792 463 530 635 549 329 597 334 518
15 943 1700 1330 2110 1560 989 1620 1190 255 1790 831 1300
20 3650 2250 1970 3530 3000 2680 1820 2030 2410 2310 2350 2550
25 2980 3120 2970 3130 2820 3450 2050 2860 2940 2500 3310 2920
_, ~

APPENDIX TABLE C-19
Seasonal variation in nitrite-nitrogen concentration at site 1 (1974-75). All values in µg/l.
Depth, m
4
6
8
lO
12
15
20
25
5
21
12
5
4
14
117
430
562
November 12 19
8
2
3
4
7
54
186
519
8
9
5
4
15
69
201
420
28
6
0
5
3
11
80
469
528
Date December
6 13 20
7
6
3
6
11
71
354
553
15
5
5
3
12
81
366
540
9
8
1
7
10
72
561
624
27
6
4
4
4
6
73
426
550
January 3 10 17
9
0
3
4
11
61
348
549
4
4
4
4
8
67
488
602
0
1
4
0
l
47
421
551
Mean
8.5
4.6
3.8
3.9
9.6
72
386
545
...... 00 _,

APPENDIX TABLE c-·20
Concentration of inorganic nitrogen species in the Sollas-LaCroix meltstream during the 1974-75 field season. All values in µg/l as N.
Date Species December January
13 18 20 26 5 17
0 230 0 0 0 170
310 150 115 10 180 95
0 0 15 0 0 0

APPENDIX TABLE C-21
Seasonal variation of sulfate concentration at site 1 (1974-75). All values in mg/l.
Depth, m
4
6
8
10
12
15
20
25
November 12 19 28
210
230
130
280
130
230
Date December
6 13 20
20
400
110
230
60
230
27
220
130
January 3 10 17
55
160
40
230
50
150
310 430 390 400 280 420 310 520 180 190
640 1200 970 980 1000 1400 490 700 490 520
1200 1200 1400 1500 2000 4100 1000 1900 560 770
310 1500 3500 4700 2900 6500 1400 23GO 2400 1900
3600 3600 7200 6800 3600 5400 4400 3200 3000 4500
3700 4000 4600 6500 4000 5900 5000 3800 1900 4100
Mean
103
227
343
839
1560
2740
4200
4350
""-' CX> w

APPENDIX TABLE C-22
Analysis of soil and sediment samples from Lake Bonney for volatile matter and various elements.
Sample Per Cent Loss
Ashing Procedurea
Conmen ts
Elemental X-Ray Analysisb
Mg Al Si S Cl K Ca Fe
Soil 0.92 Turned brown-red on ashing; 0.8 1.9 5.8 NDc rd 1.0 2.0 1.9 very fine powder; no reaction with HCl.
Sediment Coree
Surf ace 6.96 Turned light brown-red on 1.3 2.3 8.0 ND 3.8 2.0 3.7 2.3
2 an
5 cm
10 cm
ashing; no reaction with HCl.
3.18 White salts prominent on ashing; gas produced when reacted with HCl.
1 .70 Turned brown-red on ashing; no reaction with HCl.
6.06 Copious white deposits on ashing; vigorous gas produc-tion when reacted with HCl.
a Included rehydration procedure, see text.
1.0 1.3 3.5 2.0 4.8 1.4 9.2 1.3
1.1 1.4 6.0 0. 7 3.1 0.9 2.6 0.9
f 0.9 ND 1.8 1.5 6.0 ND VH 0.8
b Values given are relative to these samples only.
c Not detected
d T = trace.
e taken at site 2N, November 29, 1973.
f Very high; off scale.
...... co ~

185
APPENDIX TABLE C-23
Spectrographic analysis of dried benthic algal mat from Lake Bonney.
Element
Ca
K
Mg
N
p
B
Cu
Fe
Mn
Mo
Zn
Concentration, ppm Sample A Sample B
109,000
4500
4500
4200
900
35
25
608G
218
13. 3
6
83,000
3800
3800
4200
700
34
59
4850
186
11. 7
17

APPENDIX TABLE C-24
Total algal counts per ml at site l during the 1974-75 field season. Utermohl's settling method was utilized.
Depth, m November 12 19 28
4 -t 2010 416 5 1822 1459 218 6 1064 642 291
7 - 427 291 8 1338 990 270 9 225 395 83
10 - 96 -11 - 197 72 12 - 187 41
15 96 - -20 16 10 291 25 - 0 -
t Data not available.
Date December
6 13 20
790 274 387 1145 - 338 274 - 258
645 145 209 516 483 387 193 - 290
338 16 48 96 0 145
322 145 96
48 193 0 0 0 0
16 0 177
January 27 3 17
572 467 306 572 161 209 656 693 1193
406 225 983 489 338 1048 250 112 838
72 48 258 129 274 274 209 145 96
129 145 64 48 225 177 16 241 0
_, CX> O'I

The three page vita has been removed from the scanned
document. Page 1 of 3

The three page vita has been removed from the scanned
document. Page 2 of 3

The three page vita has been removed from the scanned
document. Page 3 of 3

THE CHEMICAL LI~OLOGY OF LAKE BONNEY, ANTARCTICA
WITH EMPHASIS ON TRACE METALS AND NUTRIENTS
by
Barron Luther Weand
(ABSTRACT)
Chemical parameters of Lake Bonney, southern Victoria Land,
Antarctica, were closely monitored during the 1973-74 and 1974-75
austral su111T1ers using marine analytical techniques and the method
of standard additions. Results were at variance with reports of
several previous investigators. Inorganic nitrogen was found to
be present in high concentrations, particularly in the monimolirnnion,
and the dominent inorganic species was generally ammonia. Ortho-
phosphate-phosphorus concentrations in the mixolimnion were ordinar-
ily less than 10 µg/l throughout the study.
Water samples were analyzed for the presence of copper, cobalt,
iron, manganese, molybdenum, and nickel using flameless atomic
absorption. More than 90 per cent of the mass of each trace metal
was found to be in the monimolimnion. Manganese was by far the
most abundant trace metal in the lake, and some evidence suggests
it may present a toxicity problem to algae in the surface waters.
Concentrations of copper potentially toxic to at least algal species
in the lake were present in the monimolimnion and, at times, in
the mixolimnion.

Continuous monitoring 1 of one meltstream showed flows to be
highly variable. Most of the orthophosphate-phosphorus carried
to the lake by this meltstream was transported during the first
two weeks of flow, probably due to the leaching of phosphates
from the products of weathering generated over the long Antarctic
winter. Whereas the meltstreams were previously considered as
potential sources of significant quantities of nitrogen and
phosphorus, it was determined that they probably contribute rela-
tively minor amounts of these nutrients. The loading of trace
metals to the lake also appears to be of minor importance, with
the possible exception of cobalt.
A decided peak in sulfate concentration and concomitant drop
in pH was observed during each field season. Because no precursor
to the sulfate could be identified, the mechanism for this pheno-
menon is not apparent, but may be related to subterranean inflow.
The hypothesis that there is intermittant subterranean inflow at
depth in Lake Bonney was supported by fluctuations in various
chemical parameters.