Embed Size (px)
Citation preview

WORKING P A P E R
The Changing Relationship between Education and Marriage in the United States, 1940–2000
BERNA M. TORR
WR-530
October 2007
This paper series made possible by the NIA funded RAND Center for the Study of Aging (P30AG012815) and the NICHD funded RAND Population Research Center (R24HD050906).
This product is part of the RAND Labor and Population working paper series. RAND working papers are intended to share researchers’ latest findings and to solicit informal peer review. They have been approved for circulation by RAND Labor and Population but have not been formally edited or peer reviewed. Unless otherwise indicated, working papers can be quoted and cited without permission of the author, provided the source is clearly referred to as a working paper. RAND’s publications do not necessarily reflect the opinions of its research clients and sponsors.
is a registered trademark.

THE CHANGING RELATIONSHIP BETWEEN EDUCATION AND MARRIAGE
IN THE UNITED STATES, 1940–2000*
Berna M. Torr, RAND Corporation
1776 Main Street, P.O. Box 2138
Santa Monica, CA 90407-2138
Email: [email protected];
Phone: (310)393-0411 x6127
Fax: 310 260-8160.
* The author gratefully acknowledges support from the National Institute of Child Health and
Human Development under pre-doctoral training grant T32-HD07338 to the Population Studies
Center at Brown University and postdoctoral training grant T32-HD007329 to RAND Corporation,
and from Brown University under a Florence K. Harnish Dissertation Fellowship. I would like to
thank Frances Goldscheider, Susan Short, John Modell, Steven Ruggles, Catherine Fitch, Jacob
Klerman, and Maryhelen MacInnes for their helpful comments.

THE CHANGING RELATIONSHIP BETWEEN EDUCATION AND MARRIAGE
IN THE UNITED STATES, 1940–2000
Abstract
This analysis examines the changing relationship between education and marital status
between 1940 and 2000 for black and white women. In 1940, when gender specialization was
high, there was a negative relationship between education and marital status for women. College-
educated women were least likely to be currently married and most likely to be never married.
By 2000, when gender specialization was low, there was a positive relationship between
education and marriage for women. The change in the relationship between education and
marriage was observed for both black and white women. However, the transition occurred earlier
for black women, consistent with black women’s earlier mass entry into the labor force. In
addition, the transition was observed across all marital statuses for black women, but only among
the currently married for white women. These changes suggest that the relationship between
education and marriage is dependent on the gender-role context.

THE CHANGING RELATIONSHIP BETWEEN EDUCATION AND MARRIAGE
IN THE UNITED STATES, 1940–2000
INTRODUCTION
Over the last 60 years there have been dramatic changes in union formation and living
arrangements, gender roles, and work in the United States. Between 1940 and 1960, first
marriage rates rose along with fertility rates, creating the high-marriage, high-fertility baby-
boom years. After 1960 (and continuing through the present), marriage rates and marital fertility
began to fall, while age at first marriage and rates of divorce, cohabitation, living alone, and
nonmarital childbearing all rose (Axinn and Thornton 2000; Cherlin 1992). Declines in marriage
rates have been especially dramatic for blacks and those with less education and income. These
changes in family formation behaviors were accompanied by the expansion of education and
significant changes in gender roles and in the economy. Of particular note is the movement of
women, particularly married women and mothers of young children, into the labor force (Goldin
1990). The dramatic increase in women’s labor force participation led to an increase in women’s
economic status.
There has been much debate about the consequences of women’s increased economic
status, or independence, on family formation. Specialization and exchange theorists argue that
greater economic status should decrease the likelihood of marriage for women, but increase it for
men. Thus, observed declines in marriage rates result from women’s increased status and
independence (e.g., Becker 1982). In contrast, theorists who focus exclusively on the current
similarity of men and women in the labor market argue that, since men and women now have
similar roles in the labor market, they should also have a similar (positive) relationship between
economic status and marriage (e.g., Oppenheimer 1988; Sweeney 2002). This approach suggests
1

that declining marriage rates result from increases in economic disadvantage, especially among
men, rather than increases in independence. While empirical research consistently finds a
positive relationship between economic status and marriage for men, the evidence for women is
mixed. Previous research has reported a negative relationship (e.g., Bennett, Bloom, and Craig
1989; Raymo and Iwasawa 2006), no relationship (e.g., Bloom and Bennett 1990), and a positive
relationship (e.g., Goldstein and Kenney 2001; Sweeney 2002) between economic status and
marriage for women.
Rather than treating these two theories as oppositional (as is often the case in the
literature), it may make more sense to think of them as complementary theories that can be
combined to create a more dynamic theory of marriage, in which the relationship between
economic status and marriage for women varies depending on the gender-role context. Recent
work on gender equity and fertility suggests that the relationship between women’s labor force
participation and fertility varies depending on the gender-role context (e.g., Chesnais 1998;
McDonald 2000; Torr and Short 2004). This may be a useful concept for theories of marriage as
well. If this is the case, then we would expect the relationship between education and marriage
for women in the U.S. to change over time as women’s roles became more similar to men’s. Not
only does this make sense theoretically, but as I describe in this study, this provides a better
explanation for the changes in the relationship between education and marriage for women over
the last 60 years.
This study examines changes in the relationship between education and marital status for
women between 1940 and 2000 and whether these changes were coincident with changes in
gender roles. While a large body of literature has examined the relationship between economic
status and marriage, most of this research has focused on one point in time, with only a handful
2

assessing change across periods (Fitch 2005; Fitch and Ruggles 2000) or cohorts (Goldstein and
Kenney 2001; Sassler and Goldscheider 2004; Sweeney 2002). Using IPUMS data, this study
extends the analysis to include census data for 1940 to 2000. This allows an examination of the
relationship between education and marital status before, during, and after the baby boom, which
has not previously been done in a multivariate context. These data allow the examination of the
relationship between education and marital status for women born as early as 1901 and as late as
1982. And they allow an examination of how period changes in the gender-role context may alter
the relationship between education and marital status.
This analysis also complements previous work by examining marital status more
generally, including the never, currently, and previously married. Most previous work has
focused on the relationship between economic status and first marriages, marriage timing, or
ever-marriage rates. As a result, divorce and remarriage are largely ignored in discussion of the
changing relationship between education and marriage. Given the dramatic rise in divorce and
remarriage in the recent past, it is important to asses the role that economic status may play not
just in getting married, but also in staying married.
BACKGROUND
Theory
The coincident timing of changes in marriage and family life, along with changes in gender roles
and the expansion of economic opportunity for women, has led many social scientists to theorize
a connection between the two. Specialization and exchange theories draw on Becker’s
([1981]1992) discussion of “New Home Economics,” which outlines how gendered role
specialization and exchange shape what makes a person an attractive marriage partner. Becker
argues that people utilize a rational decision-making approach to marriage and marry in order to
3

maximize their mutual economic benefit (or utility). Thus, individuals make attractive marriage
partners if they can provide something that the other person wants or needs. Exchanges need not
be limited to income or housework and reproductive activities, but these are generally the most
relevant factors for discussions of marriage.
In this framework, the decline in specialization that accompanied increases in women’s
economic status has two important consequences for marriage. First, higher-status women make
less attractive marriage partners because they are less focused on tasks of home production.
Second, women themselves derive less benefit from marriage since they have less need of a
husband’s income for financial support. That is, economic independence affords women the
financial freedom to opt out of marriage. Demographic constraints on the availability of
normatively appropriate (e.g., higher-status) potential spouses for high-status women may play
an additional role in reducing marriage rates (Bernard [1972]1982; Raymo and Iwasawa 2006).
As a result, specialization and exchange theory suggests a gendered relationship between
economic status and marriage. Greater economic status increases the marriage chances of men,
but decreases the marriage chances of women. This is often referred to as the “independence
hypothesis.” Since higher-status women are less likely to marry, macro-level increases in
women’s status, such as those that accompanied increases in women’s education and labor force
participation in the latter half of the twentieth century, will cause macro-level declines in
marriage rates overall, and particularly for women with higher status.
In contrast, Oppenheimer (1988, 1994, 1997, 2000) argues that women’s mass entry into
the labor force, and especially the increase in labor force participation among married women in
the recent period, fundamentally altered what makes women attractive marriage partners. As
women become more like men in the labor market, so too should they become more like men in
4

the marriage market. Oppenheimer also points out that, at the same time that women’s economic
status was increasing, men experienced substantial declines in real wages. As a result, the gap
between men’s and women’s relative status narrowed considerably, and the marriage search
process was reshaped to adjust to the new economic reality. The shift in gender roles
fundamentally altered the marriage bargain (Oppenheimer 1988, 2000; Sweeney 2002). As a
result, greater economic status not only increases the marriage chances for men, but also for
women. Thus, observed declines in marriage are the result of increasingly poor economic
prospects for men, rather than increases in women’s independence.
No discussion of changes in marriage in the United States can ignore the substantial
differences in marriage patterns by race over the last 60 years. Prior to 1940, blacks had higher
marriage rates and earlier ages at first marriage than whites. Between 1940 and 1960, whites
experienced a substantial marriage and baby boom, which was experienced to a much smaller
extent by blacks. As a result, by 1960, there was a racial crossover in marriage rates and whites
now had higher marriage rates and earlier ages at first marriage (Fitch 2005; Fitch and Ruggles
2000; Koball 1998). Marriage rates declined for all women after 1960, but declined much more
dramatically for black women, resulting in what is often called “the retreat from marriage” for
black women.
Specialization and exchange theory would suggest that declines in marriage among black
women are a result of black women’s increased status. In contrast, focusing on the changes in the
relative economic status of men and women suggests that the race differences in marriage rates
emerging over the period, including the retreat from marriage for black women, might be tied to
the differential economic position of blacks and whites. Fitch and Ruggles (2000) argue that the
lack of a marriage boom for blacks was due to the poor employment prospects for black men as
5

the economy shifted away from agriculture. Similarly, Oppenheimer (2000) finds that declines in
economic status among men (concurrent with women’s mass entry into the labor force) were
particularly acute for black men and less educated men. In the more recent period, demographic
constraints, including unfavorable sex ratios due to high incarceration and mortality rates among
young black males, may also play a role (Wilson and Neckerman 1987).
Rather than considering these two theories as oppositional, it may be more useful to
consider them complementary. Combining these approaches yields a more dynamic and flexible
theory of marriage that results in different predictions for the relationship between economic
status and marriage under different gender role contexts. Thus, in a context where gender
specialization is high, we might expect a gendered relationship between economic status and
marriage. Specifically, we would anticipate an inverse relationship between education and
marriage for women. But, where gender specialization is low, we might expect a similar, positive
relationship between economic status and marriage for both men and women. In addition, if
declines in specialization alter the relationship between economic status and marriage, then we
might expect black women’s earlier entry into the labor force to alter the relationship between
economic status and marriage earlier for black women than for white women. This integrated
approach may allow us to better understand variation in marriage patterns over time, across
groups, and across countries.
Prior Research
As predicted by both theories, empirical research consistently finds a consistent and positive
relationship between socioeconomic status and marriage for men, both historically and today
(e.g., Bennett, Bloom, and Craig 1989; Fitch and Ruggles 2000; Goldscheider and Waite 1986;
Oppenheimer 2003; Raley 2000; Sweeney 2002), regardless of whether economic status is
6

measured as income, education, or employment. Although some recent evidence suggests that
the effect of economic status on the likelihood of marriage for men has declined slightly across
baby-boom cohorts (Sassler and Goldscheider 2004; Sweeney 2002), economic status remains a
strong predictor of men’s marriage.
In contrast, the evidence on the relationship between economic status and marriage for
women is quite mixed. In keeping with theories of specialization and exchange, a few studies
have found a negative effect of greater education on marriage both historically (Cookingham
1984; Fitch 2005) and in the more recent period (Bennett, Bloom, and Craig 1989; Fitch 2005),
as well as in international contexts with high gender specialization (e.g., Raymo and Iwasawa
2006). However, most analyses of data for the post–baby boom era find either no relationship
between educational attainment and the likelihood of marriage (Bloom and Bennett 1990;
Blossfeld and Huinik 1991) or a positive relationship between education and/or income and
marriage for women (Clarkberg 1999; Goldscheider and Waite 1986, 1991; Goldstein and
Kenney 2001; Qian and Preston 1993; Sweeney 2002; Thornton, Axinn, and Teachman 1995).
These contradictory findings suggest that the relationship between economic status and marriage
for women may vary depending on the gender-role context.
Changes in Marriage Across Periods and Cohorts
Almost all of the research described above on the relationship between economic status and
marriage focuses on one particular point in time. Only a handful of studies examine changes
across periods (Fitch and Ruggles 2000; Fitch 2005) or cohorts (Goldscheider and Sassler 2004;
Goldstein and Kenney 2001; Sweeney 2002). Consistent with a story of changing relationships
over time, Goldstein and Kenney (2001) find that, while for two earlier cohorts of baby boomers
there was a negative relationship between education and the likelihood of ever-marrying, for two
7

later cohorts of baby boomers there was a positive relationship. Although highly educated
women were less likely to marry at younger ages, at later ages they were more likely to marry,
and thus more likely to marry overall. This change was evident for both black and white women,
although it was evident in an earlier cohort for black women. Similarly, Fitch (2005) concludes
that greater female economic opportunity is associated (at the bivariate level) with later ages at
marriage across the period 1850 to 2000. However, in the early part of the period, greater
economic opportunity for women resulted in lower marriage rates, while in the latter part of the
period, economic opportunity had more of an effect on the timing of marriage than it had on
marriage rates. Likewise, Sweeney (2002) finds a positive relationship between education and
first-marriage rates for two baby-boom cohorts of men and women, net of earnings. Furthermore,
the importance of earnings for women’s marriage formation increased across the two cohorts,
increasing similarity between men and women in the relationship between earnings and
marriage.
This paper extends this work on changes over time in the relationship between economic
status and marriage by examining both a longer time period and by focusing on all marital
statuses, not just first marriages or ever-marriage rates. This analysis highlights changes over
time in the U.S. and examines the changing relationship between education and marital status
concurrent with changes in gender roles. In addition, this analysis examines whether the
differential changes in marriage patterns for black and white women can be explained by the
differential timing of changes in the economic status of women across the two groups. While this
analysis focuses on past changes in the U.S., it is also relevant for assessing how marriage
patterns may change in the future and why marriage patterns may differ across groups and across
contexts.
8

DATA AND METHODS
Data
Data for this study come from the IPUMS-USA, Integrated Public Use Microdata Series, version
3.0, of the United States decennial censuses (Ruggles et al. 2004). The analytic sample includes
data from the IPUMS one-percent samples for the seven census years, 1940 through 2000. This
allows the examination of marriage patterns for persons born as early as 1901 and as late as
1982. IPUMS data are uniquely suited to an individual-level analysis of changes over time in
marriage patterns by education and income. No other data allow the examination of these
relationships using consistent measures1 across the 60-year period. Furthermore, the large
sample sizes allow the inclusion of characteristics that may have been relatively rare in one
census, but common in another (e.g., farm residence). The major limitation of the IPUMS data i
that they are cross-sectional and thus provide a snapshot of educational attainment by marital
status at the time of the census, rather than allowing for a longitudinal examination of th
of completed schooling on subsequent marriage. Unfortunately, no nationally representativ
samples with longitudinal data cover the entire period, including the pre–baby boom reference
period. This pre–baby boom reference period is particularly important given the dramatic
changes of the baby boom and the racial crossovers in family patterns observed in that era (e.g.,
Fitch and Ruggles 2000; Koball 1998).
s
e effects
e
The analytic sample is limited to women age 18 to 39 at the time of each census year, in
order to best capture the population at risk of a becoming ever-married across the entire period.
Clearly, some of the youngest adults in the sample have not yet completed their education,
potentially underestimating the relationship between education and marital status. In order to
assess the sensitivity of the results to the sample definition, alternative age restrictions for the
9

sample were explored, limiting the analysis to those 21 and older, those 25 and older. In addition,
different specifications of age (e.g., as a continuous variable) were also explored. Although the
regression coefficients changed slightly with the different age restrictions and specifications,
none of these alternative age specifications altered the substantive content of the findings
reported here. That is, the results are not sensitive to the exclusion of younger or older women
from the sample. Thus, I chose to use the wider sample age range in order to maximize sample
size for the analysis of black women and the previously married across the entire period. Data
are weighted where appropriate (e.g., 1940, 1950, 1990, and 2000); the other three years are self-
weighting.
Method
I use multinomial logistic regression procedures (Stokes, Davis, and Koch 2000) in SAS to
examine the relationship between education and marital status for women net of other
characteristics. Models are analyzed separately for blacks and whites in each census year. Given
the cross-sectional nature of census data, the findings reported here should be interpreted
descriptively rather than causally. However, using a regression approach allows the assessment
of the relationship between education and marital status net of other characteristics that may be
related to marriage, and more importantly, whose distribution in the population may have
changed over the period. Thus, for example, we can look at the cross-sectional relationship
between education and marital status net of metropolitan residence, which prior research has
shown to decrease the likelihood of marriage (McLaughlin, Lichter, and Johnston 1993), and
which dramatically increased between 1940 and 2000 (see Table 1 below).
Multinomial logistic regression also has the major benefit of allowing comparisons across
all three marital statuses. We can examine the likelihood of being 1) currently versus never
10

married, 2) previously married versus never married, and 3) among the ever-married, the
likelihood of being currently married versus previously married. For ease of discussion, the
regression coefficients are then used to calculate the predicted probability of being never,
currently, and previously married by education level, taking into account all three comparisons.
Individual predicted probabilities are calculated by applying the regression coefficients to the
data for each person, holding constant the education level of interest (Hosmer and Lemenshow
1989) and taking the mean across all individuals.
For ease of discussion, I focus on the results for 1940, 1970, and 2000. These years
highlight the major changes in the relationship between economic status and marriage over the
period, without obscuring these changes in a wealth of detail. In addition, these years also
highlight the transition in gender roles and changes in women’s status in the U.S.: 1940 serves as
a pre–baby boom reference period and a time of high gender specialization; 1970 illustrates the
relationship during the transitional period of women’s mass entry into the labor force; and 2000
highlights the current era of low gender specialization in market work.
Measures
Marital Status. In each census year, the head of household (or person filling out the
census form) was asked to provide the marital status of each person age 15 and older living in the
household.2 This information was used to create the dependent variable, a trichotomous measure
of marital status that indicates whether the person was never married, currently married, or
previously married at the time of the census. Previous work on the changes in the relationship
between education and marriage has generally focused on first marriages (e.g., Sweeney 2002),
marriage timing (e.g., Fitch 2005), or ever-marriage rates (Goldstein and Kenney 2001). These
measures all largely ignore divorce and remarriage. This paper begins to fill that gap by
11

examining the role that education plays in ever-married women’s propensity to stay married or to
remarry after divorce or widowhood. Unfortunately, no distinction can be made between first
and higher-order marriages among the currently married using census microdata; we can only
distinguish between the previously and currently married.
Education. On each census year since 1940,3 information was collected on each person’s
highest level of education completed. For this analysis, educational attainment is measured
categorically as a set of dummy variables for highest education level completed: grade school
only, some high school, high school diploma, some college, and college degree or higher.
Because many women do not work for pay,4 educational attainment has a major advantage over
income as a measure of economic status in cross-sectional data for women. The use of education
as a measure of economic status eliminates the complication of having to estimate potential
earnings for those not in the labor force (Goldstein and Kenney 2001). This is particularly
relevant in the earlier part of the period, when women were likely to drop out of the labor force
after marriage and married women often worked for pay outside the home only when faced with
severe financial hardship (Goldin 1990).
Period and Control Variables. Although the models for each year do not include
explicit measures of period, they function as full interactions by census year, allowing the
examination of the changing effect of education on marital status over the 60-year period. In a
sense, census years represent the historical context in which young adults made decisions about
marriage at that time. The differences in periods, rather than simply marking the passage of time,
are intended to represent the broad changes in historical contexts between 1940 and 2000,
including the transformation of gender roles, expansion of education, changing occupational
12

structure, suburbanization, changes in fertility and contraception, and increases in divorce,
cohabitation, nonmarital childbearing, and nonfamily living.
All models include additional controls for population characteristics that may be related
to marital status, and whose representation in the population may have changed over time. Life-
course factors, such as younger age and school enrollment, may inhibit marriage (Goldscheider
and Waite 1991; Thornton et al. 1995). Marriage and divorce rates differ by race and ethnicity
(Cherlin 1992; Espenshade 1985; Fitch and Ruggles 2000; Koball 1998; Oropesa and Landale
2004), foreign-born status (Landale 1994; Sassler 1997), region (Fenelon 1971; Glenn and
Shelton 1985; Goldscheider and Waite 1991), farm and metropolitan residence (Fitch and
Ruggles 2000; McLaughlin, Lichter, and Johnston 1993), and home ownership (Lauster 2006). A
dummy variable for Hispanic ethnicity is included for 1980 and later censuses to account for the
dramatic growth in Hispanic white women in the recent period.
Since census data are cross-sectional in nature, not all of the independent variables are
causally prior to the dependent variable in the regression analysis. That is, they may be
endogenous to the dependent variable. Using education as a measure of economic status
minimizes this problem for the key independent variable, because most women complete their
education prior to marriage. In order to assess the sensitivity of the results to issues of
endogeneity for the control variables, alternative regression models were examined that
alternately excluded and included different combinations of variables, such as school enrollment,
home ownership, and other variables that may be particularly endogenous to marital status. As
for the sensitivity tests for the sample age restrictions, the coefficients changed slightly, but there
were no substantive differences in the results. The final model is presented in the appendix.
13
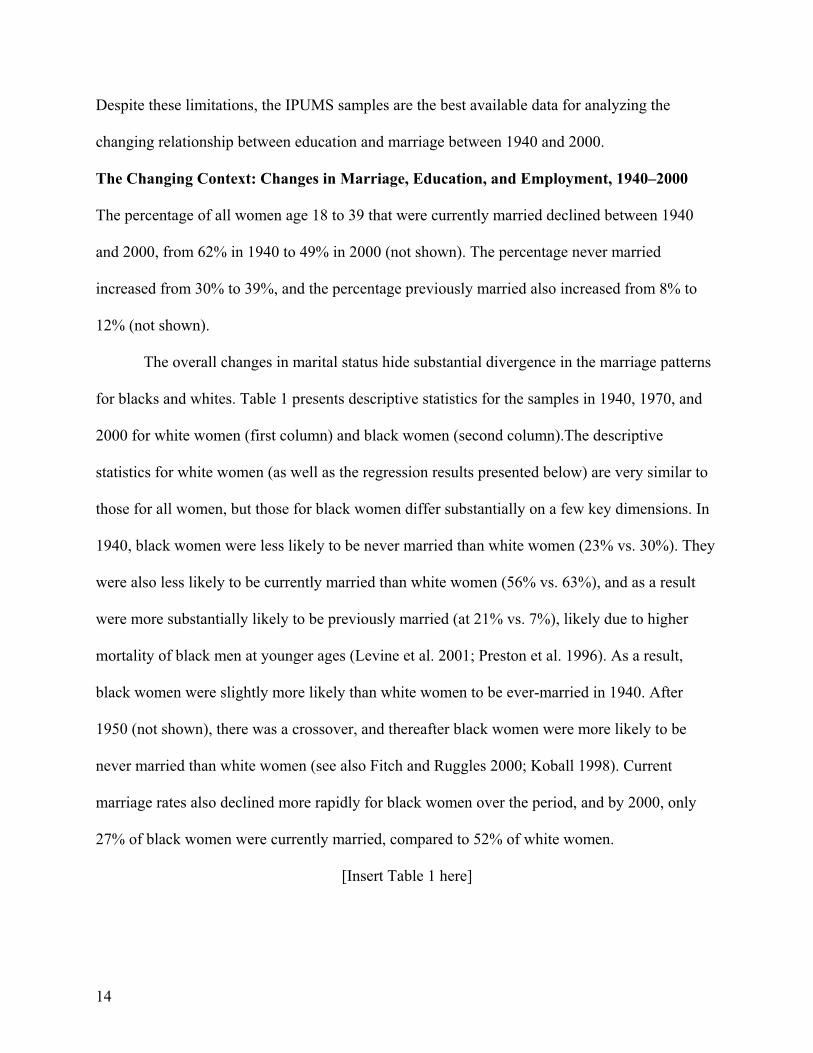
Despite these limitations, the IPUMS samples are the best available data for analyzing the
changing relationship between education and marriage between 1940 and 2000.
The Changing Context: Changes in Marriage, Education, and Employment, 1940–2000
The percentage of all women age 18 to 39 that were currently married declined between 1940
and 2000, from 62% in 1940 to 49% in 2000 (not shown). The percentage never married
increased from 30% to 39%, and the percentage previously married also increased from 8% to
12% (not shown).
The overall changes in marital status hide substantial divergence in the marriage patterns
for blacks and whites. Table 1 presents descriptive statistics for the samples in 1940, 1970, and
2000 for white women (first column) and black women (second column).The descriptive
statistics for white women (as well as the regression results presented below) are very similar to
those for all women, but those for black women differ substantially on a few key dimensions. In
1940, black women were less likely to be never married than white women (23% vs. 30%). They
were also less likely to be currently married than white women (56% vs. 63%), and as a result
were more substantially likely to be previously married (at 21% vs. 7%), likely due to higher
mortality of black men at younger ages (Levine et al. 2001; Preston et al. 1996). As a result,
black women were slightly more likely than white women to be ever-married in 1940. After
1950 (not shown), there was a crossover, and thereafter black women were more likely to be
never married than white women (see also Fitch and Ruggles 2000; Koball 1998). Current
marriage rates also declined more rapidly for black women over the period, and by 2000, only
27% of black women were currently married, compared to 52% of white women.
[Insert Table 1 here]
14

Along with changes in marriage, access to education increased substantially between
1940 and 2000. A majority of women in the sample in 1940 had less than a high school diploma
(88% of black women and 58% of white women), and a grade school education was the modal
category. By 2000, the vast majority of women had at least a high school diploma (79% of black
women and 87% of white women), and 49% of black women and over 62% of white women had
a least some college education. The percentage of white women who were college graduates
expanded from 4% in 1940 to 25% by 2000. Black women lagged behind (at 13%) with a college
degree or higher in 2000, although this was a substantial increase from just 1% in 1940. By 2000,
few women had just the lowest level of education. While some of the sample sizes for education
groups were quite small in some years,5 these same groups composed a substantial proportion of
the population in other years.
Along with gains in education, women’s employment more than doubled over the 60-
year period, increasing from 32% in 1940 to 66% in 2000. Labor force participation is not
included in the models because of its covariation with marriage for white women in the early part
of the period. However, these descriptive statistics provide relevant context for the shift in
gender roles over the period. This increase was particularly dramatic for married women,
increasing from 16% to 65% (not shown). In 1940, 41% of black women were employed,
compared to 31% of white women. Black women remained more likely than white women to be
employed through 1970 (50% versus 45%), but after 1970 the growth in white women’s
employment outpaced the growth in black women’s employment, and white women became
more likely than black women to be employed. However, married white women continued to lag
behind married black women in employment rates (data not shown). By 2000, more than two-
thirds of women in both groups were economically active.
15

RESULTS
Currently Married
In 1940, when gender specialization was high, college-educated women (black and
white) were the least likely to be currently married. By 2000, when specialization was low,
college-educated women were the most likely to be currently married. Panel A of Table 2
presents the predicted probabilities of being currently married for white and black women for
1940 through 2000, calculated based on the regression coefficients (regression results for 1940,
1970, and 2000 are presented in the appendix; results for other years are available from the
author on request). For ease of presentation, I focus on 1940, 1970, and 2000 in the discussion.
[Insert Table 2 here]
In 1940, there was a negative relationship between education and the predicted
probability of being currently married for white women. Forty-six percent of college-educated
white women in 1940 were predicted to be currently married, all else equal. In contrast, almost
70% of white women with less than a high school diploma were predicted to be currently
married.
Comparing 1940 to 2000, the predicted probability of being currently married declined
for most white women (with the exception of those with college degrees, for whom it increased
slightly). White women with some high school or grade school education experienced the largest
decline in the predicted probability of being currently married (from 66% in 1940 to 47% in
2000); those with high school diplomas experienced a moderate decline (from 59% to 50%);
while those with some college education experienced a smaller decline (from 56% to just over
50%). In contrast, the predicted probability of being currently married increased between 1940
and 2000 for white women with college degrees, from 46% to 53%. These changes occurred as a
16

result of increases in marriage during the baby-boom period followed by declines in the post-
1970 period that more than offset the earlier rise for all white women—except those with college
degrees. By the end of the period, white women with college degrees were most likely to be
currently married (53%), while those with a grade school education were least likely to be
currently married (47%).
Figure 1a highlights the reversal of the relationship between education and the predicted
probability of being currently married for white women. The relationship between education and
the predicted probability of being currently married was negative in 1940 and remained mostly
negative in 1970. The probability of being currently married declined among the least educated
women after 1970, but increased for all other women, resulting in an inverse U-shaped
relationship in 1970. After 1970, the probability of being currently married declined for all
women, but more rapidly for the less educated. By 2000, the relationship was positive.
[Insert Figure 1a about here]
Black women had a lower predicted probability of being currently married than white
women at all education levels in all years, but the relationship between education and the
predicted probability of being currently married was similar to that for white women. In 1940,
there was a negative relationship between education and the predicted probability of being
currently married. Thirty-seven percent of all college-educated black women in 1940 were
predicted to be currently married, all else equal. In contrast, 56% of black women with a grade
school education were predicted to be currently married.
Comparing 1940 to 2000, the predicted probability of being currently married declined
for all black women. Black women with some high school or grade school education experienced
the largest decline in the predicted probability of being currently married (from 58% and 56%,
17

respectively, in 1940 to 21% and 20% in 2000); those with high school diplomas experienced a
moderate decline (from 51% to 30%); while black women with some college education
experienced a smaller decline (from 47% to 30%). In contrast to their white counterparts, black
women with college degrees also experienced a decline in the predicted probability of being
currently married between 1940 and 2000, but it was the smallest decline for black women (from
37% to 33%). For black women with a high school diploma or less, the overall decline in the
predicted probability of being currently married occurred as a result of continuous declines over
the entire period, although the declines were larger in the post-1970 period. For black women
with at least some college education, a small increase in the early period was offset by later
declines. Just as for white women, black women with college degrees were most likely to be
currently married (33%) in 2000, while those with a grade school education were least likely to
be currently married (20%).
Figure 1b shows a similar pattern of change for black women to that shown in Figure 1a
for white women, from a negative relationship in 1940, to a transitional relationship in 1970, to a
positive relationship in 2000. The main differences are the larger overall decline in the
probability of being currently married for black women at all education levels and the 1970
patterns. Figure 1b highlights that the positive relationship between education and the predicted
probability of being currently married was observed as early as 1970 for black women, primarily
because black women with at least some college education became more likely to be currently
married between 1940 and 1970, while less educated black women became less likely to be
currently married. Despite declines in the likelihood of being currently married for all black
women in the post-1970 period, the positive relationship between education and the predicted
probability of being currently married remained. Furthermore, the reversal in the relationship
18

between education and marital status was mostly complete before the most dramatic declines in
marriage rates began for black women in the post-1970 period. White women’s mass entry into
the labor force did not occur until after 1970, which may explain some of their lag behind black
women in the timing of changes in marriage.
[Insert Figure 1b about here]
Previously Married
Black and white women with college degrees have the lowest predicted probability of being
previously married in all years and experienced the smallest increase between 1940 and 2000.
However, there are two main differences between black and white women in the probability of
being previously married. First, white women were less likely than black women at similar
education levels to be previously married, in all years. Second, between 1940 and 2000 the
predicted probability of being previously married increased for white women in all educational
groups, but declined substantially for all black women.
Panel B of Table 2 shows the predicted probability of being previously married by
education level for white and black women. In 1940, 4% of white women with college degrees
were predicted to be previously married. For white women at all other education levels, the
predicted probability in 1940 of being previously married was roughly similar (5 to 7%). The
predicted probability of being previously married increased 3 percentage points for college-
educated white women between 1940 and 2000 (to 7%). White women at all other education
levels experienced a slightly greater increase of 8 to 10 percentage points between 1940 and
2000 (to 15 to 17%). The predicted probability of being previously married increased gradually
across the entire period. The only exception to this pattern of gradual increase was for white
women with a grade school education: They experienced a dramatic increase in the predicted
19

probability of being previously married between 1940 and 1970, followed by a decline in the
post-1970 period.
The predicted probability of being previously married started out substantially higher for
black women than for white women. In 1940, 11% of black women with college degrees were
predicted to be previously married, compared to 21% of black women with only a grade school
education. Similar to the pattern for the least educated white women (and in contrast to the
pattern for all other white women), the predicted probability of being previously married
increased for all black women between 1940 and 1970 before falling dramatically in the post-
1970 period. However, this decline in the post-1970 period for black women is due in part to
large increases in the predicted probability of being never married, which reduced the pool of
women eligible to be previously married.
Summing the predicted probability of being currently and previously married gives us the
probability that women will be ever-married (not shown, but calculated by summing the
predicted probabilities from Panels A and B of Table 2)—that is, the predicted probability of
having been married at least once. For both black and white women, there was a negative
relationship between education and the predicted probability of being ever-married in 1940.
Although there was a decline in the predicted probability of being ever-married for black women
at all educational levels between 1940 and 2000, this decline was accompanied by a clear
transition from a negative to a positive relationship between education and the predicted
probability of being ever-married, similar to the transition for the currently married.
In contrast to the declines for black women, the predicted probability of being ever-
married increased 10 percentage points for highly educated white women over the period (to
60%) and there were smaller increases for white women at lower education levels. Furthermore,
20

college-educated white women continued to have a slightly lower predicted probability of being
ever-married (60%) than those with some college (67%) through 2000. That is, the relationship
remained U-shaped for white women, in contrast to the transition to the positive relationship for
black women. However, the regression coefficients suggest that among ever-married white
women, those with college educations were more likely to be currently married than previously
married after 1970.
Never Married
There was a racial crossover in the likelihood of being never married over the period. In
1940, black women were less likely to be never married than white women, at all education
levels except those with a college degree. By 2000, black women were more likely than white
women at similar education levels to be never married. However, between 1940 and 2000, both
groups experienced a transition in the relationship between education and the predicted
probability of being never married. For black women, there was a clear transition from a
negative relationship in 1940 to a positive relationship in 2000. This transition proceeded more
slowly for white women, and the relationship remained U-shaped in 2000, similar to the
relationship observed for black women in 1970. If white women continue to follow a similar
transition as black women, then we might expect this relationship to be positive in the future.
In 1940, 50% of college-educated white women were predicted to be never married,
compared to 39% for those with some college, 36% for those with a high school diploma, and
just 27% of white women with a grade school education (see Panel C of Table 2). During the
baby boom period, the predicted probability of being never married declined for white women at
all education levels. After 1970, the predicted probability of being never married increased for all
white women, but the increase was larger among the less educated. Comparing 1940 to 2000, the
21

predicted probability of being never married declined 10 percentage points for college-educated
white women (from 40% to 50%) over the entire period. In contrast, white women with less than
a high school diploma became more likely to be never married over the period (increasing from
approximately 27% in 1940 to over 35% in 2000). As a result, there was a U-shaped relationship
between education and the predicted probability of being never married in 2000 for white
women. College-educated white women continued to have a higher predicted probability of
being never married than their less educated counterparts (50% vs. 35%) but the education gap in
the predicted probability of being never married narrowed considerably, from 23 percentage
points in 1940 to just 3 percentage points in 2000.
In 1940, college-educated black women, like college-educated white women, had the
highest predicted probability of being never married, at 52%, compared to 37% of those with
some college education, 29% for those with a high school diploma, and 23% of black women
with a grade school education (see Panel C of Table 2). Between 1940 and 1970, black women
with at least some college education experienced a decline in the predicted probability of being
never married, while black women at lower education levels experienced an increase. This led to
a U-shaped relationship between education and the predicted probability of being never married
for black women in 1970, similar to that observed for white women in 2000. After 1970, the
predicted probability of being never married increased for black women at all education levels,
resulting in an overall increase between 1940 and 2000. The increase over the period was
smallest for those with at least some college education (4 percentage points) and largest for
women with less than a high school education (over 40 percentage points). By 2000, college-
educated black women had the lowest predicted probability of being never married, at 56%,
compared to 66% of those with a grade school education.
22

Decomposing the Change
The above results show a clear change in the relationship between education and the
predicted probabilities of being currently and never married. However, changes in these
predicted probabilities have two components: 1) change due to changes in population
characteristics and 2) change due to changes in the relationship between education and marriage.
The regression coefficients in the appendix indicate that the changes in the predicted
probabilities are not simply due to changes in population characteristics, because there has been
a change in the coefficients for education. In addition, using a counterfactual simulation, or
standardization, we can also decompose the change in the predicted probabilities. This allows us
to asses the contributions of changes in population characteristics and changes in the relationship
between education and marriage to the observed changes in predicted probabilities.
Table 3 shows the predicted probabilities of being currently and never married for black
and white women in 1940 and 2000, along with a counterfactual simulation applying the 1940
model to the 2000 population—in effect, a standardization on the 2000 population. This
standardization allows us to decompose the observed changes in the predicted probability of
being never and currently married into 1) the percentage of the change due to changes in
population characteristics and 2) the percentage of the observed change due to changes in the
model. The percentage of change due to changes in population characteristics is calculated by
comparing the counterfactual change between columns 1 and 2 (holding the model constant) in
Table 3 to the observed change in columns 1 and 3. The percentage of change due to changes in
the model is calculated by comparing the counterfactual change between columns 2 and 3
(holding the population constant) in Table 3 to the observed change in columns 1 and 3. Panel A
23

shows this decomposition for white women and Panel B shows the decomposition for black
women.
[Insert Table 3 about here]
For white women with a high school diploma or less, the majority of change in the
predicted probability of being currently married and never married occurred is explained simply
by changes in population characteristics (explaining 67% to 84% of the decline for currently
married, and more than the observed change in the probability of being never married). In
contrast, changes in the model play a larger role in explaining changes in marriage among
college-educated white women. Changes in the relationship between education and marital status
offset changes in the population for those with some college, and explain almost all of the
observed increase in the predicted probability of being currently married among white women
with a college degree (86%). In addition, changes in the relationship explain the majority (60%
to 80%) of the decline in the probability of being never married among college-educated white
women.
In contrast, for black women, changes in the relationship between education and marriage
play more of a role. Changes in population characteristics explain one-third to two-thirds of the
decline in the predicted probability of being currently married among those with some college or
less, while changes in population characteristics explain the rest. Changes in the relationship
between education and marriage offset changes in population characteristics among college-
educated black women, resulting in a smaller decline in the probability of being currently
married for college-educated black women. Similar contributions of changes in population
characteristics and changes in the relationship explain the observed increases in the predicted
probability of being never married for black women.
24

Thus, both 1) changes in population characteristics and 2) changes in the relationship
between education and marriage play a role in changing marriage patterns. For less-educated
black and white women, changes in population characteristics are responsible for much of the
decline in current marriage probabilities and increase in nonmarriage probabilities. In contrast,
among college-educated white women, the changing relationship between education and
marriage plays a substantial role in explaining the increase in the predicted probability of being
currently married and the decrease in the predicted probability of being never married. For
college-educated black women, changes in the relationship between education and marriage
offset declines in the predicted probability of being currently married and increases in the
predicted probability of being never married due to changes in population characteristics. As a
result, college-educated women were more likely to be currently married and less likely to be
never married than if the relationship between education and marriage had not changed. Thus,
while changes in population characteristics play a role in declining marriage rates among the less
educated, the observed transformation of the relationship between education and the predicted
probability of being currently or never married is primarily the result of changes in the
relationship between education and marriage.
SUMMARY AND CONCLUSION
Marriage Is a Dynamic Institution
This analysis extends previous work on the changing relationship between economic status and
marriage. A major contribution of this analysis is the use of IPUMS data, which allows the
inclusion of a longer time period than has been previously examined in a multivariate context.
Thus we can examine the relationship between economic status and marriage before, during, and
after the baby boom. This study also extends the definition of marital status to include the
25

currently, previously, and never married, which allows the examination of the relationship
between education and the likelihood of both getting and staying married. While the cross-
sectional nature of the IPUMS data limits what we can conclude about the causal ordering of the
relationship between education and marriage, there is a clear and changing association between
education and marital status for women between 1940 and 2000, net of other characteristics.
In 1940, there was a clear negative relationship between education and marriage for both
black and white women, consistent with specialization and exchange theory. College-educated
women (black and white) were most likely to be never married and least likely to be currently
married. The opposite was true for women with less than a high school diploma—they were the
least likely to be never married and the most likely to be currently married. By 2000, the
relationship between education and marriage was positive, and college graduates were most
likely to be currently married. College-educated black women were also least likely of all black
women to be never married, while for white women the gap in the probability of being never
married probabilities narrowed substantially, but college-educated women remained slightly
more likely than other white women to be never married.
In short, in the early part of the period, when separate spheres and the specialization of
gender roles were more likely to prevail, greater education decreased the likelihood of marriage
for women. By the end of the period, gender roles became increasingly similar, and so too did
the relationship between economic status and marriage for men and women. In the most recent
era, in which gender roles are more symmetrical, greater education increases the likelihood of
both getting and staying married (or remarrying after divorce or widowhood).
Although the reversal of the relationship between education and marriage occurred for
both black and white women, there are some notable differences in the patterns of change over
26

time for the two groups. First, the transition occurred earlier for black women. Second, a clear
transition is observed across all three marital statuses for black women. Third, black women
experienced a substantial decline in current marriage rates between 1940 and 2000 at all
education levels, due in part to changes in the characteristics of the population. White women
with a college degree experienced an increase in current marriage rates between 1940 and 2000,
while black women with college degrees experienced smaller declines than all other black
women. Current marriage probabilities declined for all other women.
Although it may be coincidental, both the timing of white women’s mass entry into the
labor force and the change in the relationship between education and marriage for white women
lagged behind black women. It is feasible that black women’s earlier mass entry into the labor
force increased both the benefit of education (DiPrete and Buchmann 2006) and the symmetry of
gender roles at an earlier point leading to an earlier transition in the relationship between
education and marital status. The relatively poor position of black men in the labor market after
1940 likely helped facilitate these changes. However, the standardization analysis suggests that
at least some of the decline in marriage rates over time can be explained simply by the changing
characteristics of the population. In addition, at least some of the black-white difference in
marriage is explained by differences in group characteristics. White women’s marriage rates
have not yet experienced the same sizeable declines as black women, and if those declines are a
result of the uniquely disadvantaged position of black men, it is unlikely that white women will
experience the same large declines.
Overall, the transformation of the relationship between education and marital status
occurred primarily as a result of the decreasing likelihood of marriage (and remarriage) among
less educated women. These declines were accompanied by small increases in marriage (and
27

remarriage) among highly educated white women and smaller decreases in marriage among
highly educated black women relative to other black women. Consistent with Oppenheimer’s
(1998, 2000) findings that the increasing disadvantage of men led to declines in marriage rates,
economic disadvantage among women also decreases the likelihood of marriage, at least in
contexts where gender specialization is low. Furthermore, the dramatic decline in marriage rates
for black women occurred after the relationship between education and marriage had already
become positive, suggesting that population characteristics and the increasing disadvantage of
the least educated women in the marriage market, rather than women’s increased economic
status and independence, is the likely explanation for the “retreat from marriage” among black
women.
Another important component of the change in the relationship between education and
marriage is the increased propensity of ever-married women with at least some college education
to be currently married, particularly among white women. Given the increases in divorce and
remarriage over the period, it is crucial to understand the role that economic status plays in both
getting married and staying married. This analysis provides a first step, suggesting that higher
education increases the probability of staying married, or of remarrying after divorce. Highly
educated women, black or white, are least likely to be previously married in all years. However,
the change over time in the predicted probability of being previously married seems to be largely
driven by period changes in mortality and divorce laws. While this analysis provides a first step
toward a more thorough understanding of the role of education in lowering previous marriage
rates, additional analysis on this topic is needed.
Consequences for Inequality
28

Highly educated women are now more likely than their less educated counterparts to be currently
married, and highly educated black women are more likely to be ever-married. This suggests that
although marriage rates declined coincident with substantial increases in women’s status
between 1940 and 2000, the declines in marriage rates did not result from declines in marriage
among highly educated women, as predicted by specialization and exchange theory. Rather,
declines in marriage, as well as the transformation in the relationship between education and
marital status for women, were largely driven by declines in marriage among the most
disadvantaged women.
This finding has serious consequences for inequality, and particularly intergenerational
inequality. Not only has there been a dramatic decline in the likelihood of marriage among the
most disadvantaged women, but over the same period there have been increases in educational
homogamy (Kalmjin 1991; Mare 1991; Schwartz and Mare 2006). Thus, less educated women
are less likely to marry, and when they do marry, they are more likely to marry men with similar
economic disadvantages than in the past. When gender specialization was high, marriage as an
institution helped mitigate economic disadvantages for women with little education. However, as
specialization declined, marriage may increasingly exacerbate socioeconomic inequalities.
This analysis provides substantial support for the idea that the relationship between
economic status and marriage is dependent on the gender-role context. When specialization is
high, highly educated women are likely to opt out (or be forced out) of the marriage market.
However, when specialization is low, those women most able to live independently are also the
most likely to be married. In contrast, those who might benefit most (in financial terms) from
marriage are the least likely to be married. This raises interesting questions about what the
revolution in gender roles and expectations mean for economically disadvantaged women. The
29

gender revolution is not just about micro-level increases in women’s employment and economic
status. Rather it profoundly altered the roles and statuses available to women. One possible
explanation is that less educated women are using macro-level increases in the acceptance of
women’s independence outside of marriage to opt out of what they see as “bad” or undesirable
marriages (e.g., Edin and Kefalas 2007; Edin and Reed 2005). The alternative interpretation is
that changing expectations about what make women good marriage partners has made
economically disadvantaged women, like lower socioeconomic status men, less attractive
marriage partners. Although both interpretations have implications for inequality, distinguishing
between these to interpretations is an important avenue for further research.
Increases in nonmarital childbearing and single parenthood have reduced some children’s
access to both parents’ economic and emotional resources. However, some of the increase in
nonmarital childbearing and single parenthood has been offset by increases in cohabitation
(Bumpass and Raley 1995; Bumpass and Sweet 1989), particularly among those of lower
socioeconomic status (Bumpass, Sweet, and Cherlin 1991; Clarkberg 1999; Oppenheimer 2003).
If the less educated are increasingly more likely to cohabit than to marry over the period, than
this might explain the changing relationship between education and marriage over the period.
Alternative specifications of the models, which treat cohabiting couples as currently married in
2000 (data not shown), do not alter the patterns of change observed in the relationship between
education and marriage for women. Thus, the changing relationship between education and
marriage for women does not appear to be a result of increases in cohabitation.
The changing relationship between education and marriage between 1940 and 2000
suggests that marriage is a dynamic institution. Thus, it may be useful to think about the theories
of marriage based on specialization and exchange and those based on similarities in the marriage
30

market as complementary rather than oppositional. When gender specialization is high, greater
economic status decreases the likelihood of marriage for women, but increases it for men.
However, the increased symmetry of men’s and women’s gender roles in market work in the
recent period appears to have increased the symmetry of the characteristics that make an
attractive marriage partner. In the process, the relationship between education and marital status
for women has been transformed. This dynamic interpretation allows us to assess how the
gender-role context shapes, and reshapes, the relationship between economic status and
marriage. Such an approach is useful for thinking about past changes over time in marriage, and
theorizing about future changes. It is also useful for thinking about differences in marriage
patterns and differential timing of changes in marriage across groups, and across countries with
different gender-role contexts.
31

REFERENCES
Axinn, W.G. and A. Thornton. 2000. “The Transformation in the Meaning of Marriage.” Pp.
147-165 in The Ties That Bind: Perspectives on Marriage and Cohabitation, edited by L.
Waite, C. Bachrach, M. Hindin, E. Thomson, and A.Thorton. New York: Aldine de
Gruyter.
Becker, G. [1981] 1992. A Treatise on the Family. Cambridge, MA: Harvard University Press.
Bennett, N.G., D.E. Bloom, and P H. Craig. 1989. “The Divergence of Black and White
Marriage Patterns.” American Journal of Sociology, 95(3):692-722.
Bernard, J. [1972] 1982. The Future of Marriage. New Haven, CT: Yale University Press.
Bloom, D.E. and N.G. Bennett. 1990. “Modeling American Marriage Patterns.” Journal of
American Statistical Association, 85(412):1009-1017.
Blossfeld, H. and J. Huinink. 1991. Human Capital Investments or Norms of Role Transition?
How Women’s Schooling and Career Affect the Process of Family Formation.” American
Journal of Sociology, 97(1):143-168.
Bumpass, L., and R.K. Raley. 1995. "Redefining Single-Parent Families: Cohabitation and the
Changing Family Reality." Demography, 32(1)"97-109.
Bumpass, L. and J. Sweet. 1989. “National Estimates of Cohabitation.” Demography, 26:615-25.
Bumpass, L., J.A. Sweet, and A. Cherlin. 1991. “The Role of Cohabitation in Declining Rates of
Marriage.” Journal of Marriage and the Family, 53(4):913-927.
Cherlin, A.J. 2004. “The Deinstitutionalization of American Marriage.” Journal of Marriage and
Family, 66:848-861.
32

______. 2000. “Toward a New Home Socioeconomics of Union Formation,” Pp. 126-146 in The
Ties That Bind: Perspectives on Marriage and Cohabitation, edited by L. Waite, C.
Bachrach, M. Hindin, E. Thomson, and A.Thorton. New York: Aldine de Gruyter.
______. 1992. Marriage, Divorce, and Remarriage. Cambridge, MA: Harvard University Press.
Chesnais, J.C. 1996. “Fertility, Family, and Social Policy in Contemporary Western
Europe,” Population and Development Review, 22(4): 729–739.
Clarkberg, M. 1999. “The Price of Partnering: The Role of Economic Well-Being in Young
Adults’ First Union Experiences.” Social Forces, 77(3):945-968.
Cookingham, M.E. 1984. “Bluestockings, Spinsters, and Pedagogues: Women College
Graduates, 1865 to 1910. Population Studies, 38:349-64.
DiPrete, T.A. and C. Buchmann. 2006. “Gender-Specific Trends in the Value of Education and
the Emerging Gender Gap in College Completion." Demography, 43(1):1-24.
Edin, K. and M. Kefalas. 2007. Promises I Can Keep: Why Poor Women Put Motherhood Before
Marriage. Berkeley: University of California Press.
Edin, K. and J.M. Reed. 2005. “Why Don’t They Just Get Married? Barriers to Marriage Among
the Disadvantaged.” The Future of Children, 15(2):117-137.
Espenshade, T.J. 1985. “Marriage Trends in America: Estimates, Implications, and Underlying
Causes.” Population and Development Review, 11(2):193-245.
Fenelon, B. 1971. "State Variations in United States Divorce Rates." Journal of Marriage and
Family, 33(2):321-327.
Fitch, C.A. 2005. Transitions to Marriage in the United States, 1850-2000. Ph.D. Dissertation,
Department of History, University of Minnesota, Minneapolis, MN.
33

Fitch, C.A. and S. Ruggles. 2000. “Historical Trends in Marriage Formation: The United States
1850-1990.” Pp. 59-90 in The Ties That Bind: Perspectives on Marriage and
Cohabitation, edited by L. Waite, C. Bachrach, M. Hindin, E. Thomson, and A.Thorton.
New York: Aldine de Gruyter.
Glenn, N. D. and B. A. Shelton. 1985. “Regional Differences in Divorce in the United States.”
Journal of Marriage and the Family, 47(3): 641-652.
Goldin, C. 1990. Understanding the Gender Gap: An Economic History of American Women.
New York: Oxford University Press.
Goldscheider, F.K. and L.J. Waite. 1986. “Sex Differences in the Entry Into Marriage.”
American Journal of Sociology, 92(1):91-109.
______. 1991. New Families, No Families: The Transformation of the American Home.
Berkeley: University of California Press.
Goldstein, J.R. and C.T. Kenney. 2001. “Marriage Delayed or Marriage Foregone? New Cohort
Forecasts of First Marriage for U.S. Women.” American Sociological Review, 66(4):506-
519.
Hosmer, D.W. and S. Lemenshow. 1989. Applied Logistic Regression. New York: John Wiley
and Sons.
Kalmjin, M.S. 1991. “Status Homogamy in the United States.” American Journal of Sociology,
97(2):496-523.
Koball, H. 1998. “Have African American Men Become Less Committed to Marriage?
Explaining the Twentieth Century-Racial Cross-Over in Men’s Marriage Timing.”
Demography, 35(2):251-258.
34

Landale, N. S. 1994. “Migration and the Latino Family: The Union Formation Behavior of
Puerto Rican Women.” Demography, 31(1):133-157.
Lauster, N. 2006. "This Land is My Land: Establishing the Historical Link Between Housing and
Family Status Within Middle Class Life Course in the USA." Presented at the annual
meeting of the Population Association of America, April 2006, Los Angeles, CA.
Levine, R.S., J.E. Foster, R.E. Fullilove, M.T. Fullilove, N.C. Briggs, P.C. Hull, B.A. Husaini,
and C.H. Hennekens. 2001. “Black-White Inequalities in Mortality and Life Expectancy,
1933-1999: Implications for Healthy People 2010.” Public Health Reports, 116(5):474-
483.
Mare, R.D. 1991. “Five Decades of Assortative Mating.” American Sociological Review,
56(1):15-32.
McDonald, P. 2000. “Gender Equity in Theories of Fertility Transition,” Population and
Development Review, 26(3): 427–439.
McLaughlin, D.K., D.T. Lichter, and G.M. Johnston. 1993. "Some Women Marry Young:
Transitions to First Marriage in Metropolitan and Nonmetropolitan Areas." Journal of
Marriage and Family, 55(4):827-838.
Oppenheimer, V.K. 2003. “Cohabiting and Marriage During Young Men’s Career-Development
Process.” Demography, 40(1):127-149.
______. 2000. “The Continuing Importance of Men’s Economic Position in Marriage
Formation,” Pp. 283-301 in The Ties That Bind: Perspectives on Marriage and
Cohabitation, edited by L. Waite, C. Bachrach, M. Hindin, E. Thomson, and A.Thorton.
New York: Aldine de Gruyter.
35

______. 1997. “Comment on ‘The Rise of Divorce and Separation in the United States, 1880-
1990,’” Demography, 34(4):467-472.
______. 1994. “Cohabiting Women’s Rising Employment and the Future of the Family in
Industrial Societies.” Population and Development Review, 20(2):293-342.
______. 1988. “A Theory of Marriage Timing.” American Journal of Sociology, 94(3):563-591.
Oppenheimer, V.K. M. Kalmjin, and N. Lim. 1997. “Men’s Career Development and Marriage
Timing during a Period of Rising Inequality.” Demography, 34(3):311-330.
Oropesa, R.S. and N.S. Landale. 2004. “The Future of Marriage and Hispanics.” Journal of
Marriage and Family, 66:901-920.
Qian, Z. and S. H. Preston. 1993. “Changes in American Marriage, 1972 to 1987: Availability
and Forces of Attraction by Age and Education.” American Sociological Review,
58(4):482-495.
Preston, S.H., I.T. Elo, I. Rosenwaike, and M. Hill. 1996. “African-American Mortality at Older
Ages: Results of a Matching Study.” Demography, 33(2):193-205.
Raley, R. Kelly. 2000. “Recent Trends and Differentials in Marriage and Cohabitation: The
United States,” Pp. 19-39 in The Ties That Bind: Perspectives on Marriage and
Cohabitation, edited by L. Waite, C. Bachrach, M. Hindin, E. Thomson, and A.Thorton.
New York: Aldine de Gruyter.
Raymo, J.M. and M. Iwasawa. 2006. "Marriage Market Mismatches in Japan." American
Sociological Review, 70(5):801-822.
Ruggles, S., M. Sobek, T. Alexander, C.A. Fitch, R. Goeken, P.K. Hall, M. King, and C.
Ronnander. Integrated Public Use Microdata Series: Version 3.0 [Machine-readable
36

database]. Minneapolis, MN: Minnesota Population Center [producer and distributor],
2004. http://www.ipums.org
Sassler, S. 1997. “Women’s Marital Timing At the Turn of the Century: Generational and Ethnic
Differences.” Sociological Quarterly, 38(4):567-585.
Sassler, S. and F. Goldscheider. 2004. “Revisiting Jane Austen’s Theory of Marriage Timing:
Changes in Union Formation Among American Men in the Late 20th Century.” Journal
of Family Issues, 25(2):139-166.
Schwartz, C. and R.D. Mare. 2005. "Trends in Educational Assortative Marriage from 1940 to
2003." Demography, 42(4):621-646.
Simmons, T. and M. O’Connell. 2003. Married-Couple and Unmarried-Partner Households:
2000. Census 2000 Special Report, CENSR-5. U.S. Census Bureau, Washington, DC.
Stokes, M.E., C.S. Davis, and G.G. Koch. 2001. Categorical Data Analysis Using the SAS
System, 2nd Ed. WA: Wiley.
Sweeney, M.M. 2002. “Two Decades of Family Change: The Shifting Economic Foundations of
Marriage.” American Sociological Review, 67(1):132-147.
Thornton, A., W.G. Axinn, and J.D. Teachman. 1995. “The Influence of School Enrollment and
Accumulation on Cohabitation and Marriage in Early Childhood.” American Sociological
Review, 60(5):762-774.
Torr, B.M. and S. Short. 2004. “Second Births and the Second Shift: A Research Note on Gender
Equity and Fertility.” Population and Development Review, 30(1):109-130.
Wilson, W.J. with K. Neckerman. 1987. “Poverty and Family Structure: The Widening Gap
Between Evidence and Public Policy Issues.” Pp. 63-92 in The Truly Disadvantaged: The
Inner City, The Underclass, and Public Policy. Chicago: University of Chicago Press.
37

Xie, Y., J.M. Raymo, K. Goyette, and A. Thornton. 2003. “Economic Potential and Entry Into
Marriage and Cohabitation.” Demography, 40(20):351-367.
NOTES
1 While the basic structure and format of the files is similar across years, there are some minor
differences in sampling frames, coverage, and definitions. Alaska and Hawaii were not included
prior to 1960; no comparable income data are available prior to 1950; multiple race categories
were added in 2000; and metropolitan area definitions vary across years. In 1940 and 1950, the
sampling procedures used by the Census Bureau collected education and income data for
“sample line individuals” only, resulting in a smaller analytic sample for these two census years.
2 In 1940, there were five possible categories: married spouse present, married spouse absent,
divorced, widowed, and single. In 1950 and all subsequent years, the additional category of
separated was added and “single” was renamed “never married.” For the marital status variable
used in this analysis, those whose reported martial status was “married spouse present” were
coded as currently married, while those whose reported marital status was single (1940) or never
married (1950–2000) were coded as never married. Finally, those whose reported marital status
was married spouse absent, separated (1950–2000), divorced, or widowed were all coded as
being previously married. Although there was no separated category in 1940, IPUMS-USA
documentation (Ruggles et. al 2004) indicates that such individuals would have been coded as
“married spouse absent” and thus included in the previously married category used here.
3 Prior to 1940, the census asked about literacy rather than educational attainment.
4 Prior to 1980, married women were much less likely than unmarried women to be employed
and/or have any earnings (data not shown).
5 In all cases, there were at least 1,000 observations in each cell.
38

Table 1. Descriptive Characteristics For White and Black Women Aged 18-39
1940 1970 2000 1940 1970 2000Value or
ProportionValue or
ProportionValue or
ProportionValue or
ProportionValue or
ProportionValue or
ProportionNever Married 0.30 0.23 0.36 0.23 0.30 0.58Currently Married 0.63 0.68 0.52 0.56 0.47 0.27Previously Married 0.07 0.09 0.12 0.21 0.23 0.14
Grade School 0.35 0.08 0.03 0.72 0.15 0.02Some HS 0.23 0.18 0.10 0.16 0.33 0.19HS Diploma 0.29 0.46 0.25 0.08 0.38 0.30Some College 0.09 0.18 0.37 0.03 0.10 0.36College Degree or Higher 0.04 0.10 0.25 0.01 0.04 0.13
Age (mean) 27.93 27.41 29.16 27.97 27.37 28.72
Hispanic ---------- ---------- 0.09 ---------- ---------- 0.02
Foreign Born 0.07 0.05 0.09 0.01 0.02 0.08
Employed 0.31 0.45 0.69 0.41 0.50 0.62Unemployed 0.04 0.03 0.04 0.05 0.06 0.10Not in Labor Force 0.65 0.52 0.27 0.54 0.45 0.28
Currently In School 0.04 0.13 0.21 0.03 0.12 0.23
Northeast 0.30 0.24 0.19 0.14 0.21 0.18Midwest 0.32 0.29 0.26 0.12 0.21 0.19South 0.27 0.29 0.35 0.73 0.50 0.55West 0.10 0.18 0.20 0.01 0.08 0.08
Metropolitan 0.57 0.64 0.56 0.50 0.73 0.72Farm 0.17 0.03 0.01 0.26 0.02 0.00Owner Occupied Housing 0.38 0.58 0.61 0.19 0.37 0.38
N 30,142 264,018 310,000 3,561 34,673 54,033Source: IPUMS-USA
White Women Black Women
Notes: The large changes in the percent living in metropolitan areas between 1990 and 2000 are due to changes in definitions betweenthe 1990 and 2000 Censuses.

Panel A: Currently Married
1940 1950 1960 1970 1980 1990 2000 1940 1950 1960 1970 1980 1990 2000College Degree or Higher 46% 62% 69% 63% 55% 56% 53% 37% 48% 52% 53% 36% 36% 33%Some College 56% 67% 74% 68% 60% 58% 52% 47% 49% 55% 51% 34% 31% 30%High School Diploma 59% 75% 75% 69% 63% 60% 50% 51% 55% 56% 48% 35% 27% 26%Some High School 67% 78% 79% 71% 64% 56% 47% 58% 58% 56% 46% 28% 20% 21%Grade School 66% 74% 72% 59% 59% 53% 47% 56% 58% 54% 40% 23% 16% 20%
Panel B: Previously Married
1940 1950 1960 1970 1980 1990 2000 1940 1950 1960 1970 1980 1990 2000College Degree or Higher 4% 4% 4% 5% 7% 7% 7% 11% 18% 17% 12% 15% 12% 11%Some College 5% 6% 6% 7% 10% 13% 15% 15% 17% 19% 18% 23% 19% 17%High School Diploma 5% 6% 7% 8% 11% 15% 16% 20% 21% 19% 20% 23% 20% 14%Some High School 7% 8% 9% 12% 15% 19% 17% 20% 24% 24% 25% 27% 21% 15%Grade School 7% 10% 18% 29% 13% 16% 16% 21% 26% 23% 23% 24% 19% 14%
Panel C: Never Married
1940 1950 1960 1970 1980 1990 2000 1940 1950 1960 1970 1980 1990 2000College Degree or Higher 50% 33% 27% 31% 38% 37% 40% 52% 35% 32% 35% 49% 53% 56%Some College 39% 27% 20% 25% 30% 29% 34% 37% 35% 26% 32% 43% 50% 54%High School Diploma 36% 19% 18% 23% 26% 26% 34% 29% 24% 25% 32% 43% 53% 59%Some High School 26% 14% 12% 18% 21% 26% 35% 21% 18% 20% 29% 45% 59% 63%Grade School 27% 16% 18% 12% 28% 31% 37% 23% 16% 23% 36% 54% 65% 66%
Source: From authors calucation based on the regression models (see Appendix) applied to population characteristics for each year.
White Women Black Women
Table 2. Predicted Probability of Being Currently Married, Previously Married, and Never Married by Education, Women 18 to 39
Black WomenWhite Women
White Women Black Women

Panel A. White Women
1940 on 1940
1940 on 2000*
2000 on 2000
Changes in Population
Changes in Relationship
1940 on 1940
1940 on 2000* 2000 on 2000
Changes in Population
Changes in Relationship
Grade School 66% 50% 47% 84% 16% 27% 43% 37% 160% -60%Some High School 67% 50% 47% 85% 15% 26% 42% 35% 178% -78%High School Diploma 59% 53% 50% 67% 33% 36% 39% 34% -150% 250%Some College 56% 47% 52% 225% -125% 39% 38% 34% 20% 80%College Degree or Higher 46% 47% 53% 14% 86% 50% 46% 40% 40% 60%
Panel B. Black Women
1940 on 1940
1940 on 2000*
2000 on 2000
Changes in Population
Changes in Relationship
1940 on 1940
1940 on 2000* 2000 on 2000
Changes in Population
Changes in Relationship
Grade School 56% 43% 20% 37% 63% 23% 32% 66% 20% 80%Some High School 58% 45% 21% 35% 65% 21% 30% 63% 22% 78%High School Diploma 51% 39% 26% 46% 54% 29% 37% 59% 27% 73%Some College 47% 37% 30% 61% 39% 37% 45% 54% 48% 52%College Degree or Higher 37% 29% 33% 193% -93% 52% 58% 56% 148% -47%
* Standardization applying 1940 regression coefficients to the 2000 populationSource: From authors calucation based on the regression models (see Appendix) applied to population characteristics for each year.
Percent of Difference Due to
Currently Married Percent of Difference Due to Never Married Percent of Difference Due to
Table 3. Predicted Probabilities of Being Currently and Never Married for Black and White Women, 1940, Standardized 1940, and 2000
Currently Married Percent of Difference Due to Never Married

Figure 1a. Predicted Probabilty of Being Currently Married for White Women by Education Level, 1940-2000
0%
10%
20%
30%
40%
50%
60%
70%
80%
1940 1970 2000
Year
Pre
dic
ted
Pro
bab
ility
Grade School Some High School High School Diploma Some College College Degree or Higher

Figure 1b. Predicted Probabilty of Being Currently Married for Black Women by Education Level, 1940-2000
0%
10%
20%
30%
40%
50%
60%
70%
1940 1970 2000
Year
Pre
dic
ted
Pro
bab
ility
Grade School Some High School High School Diploma Some College College Degree or Higher

Table A1. Multinomial Logistic Regression Coefficients for Black and White Women Aged 18-39Panel A. White Women
1940 1970 2000 1940 1970 2000 1940 1970 2000Education (HS is reference)Grade School 0.61 *** -0.56 *** -0.25 *** 0.82 *** -0.01 -0.22 *** -0.21 ** -0.54 *** -0.03Some High School 0.63 *** 0.49 *** -0.15 *** 0.82 *** 0.80 *** 0.00 -0.19 * -0.31 *** -0.15 ***HS Diploma -------- -------- -------- -------- -------- -------- -------- -------- --------Some College -0.18 * -0.14 *** 0.04 * -0.17 -0.29 *** -0.08 *** -0.02 0.15 *** 0.12 ***College Degree or Higher -0.79 *** -0.62 *** -0.25 *** -0.70 *** -0.99 *** -1.11 -0.09 0.37 *** 0.88 ***
Age (mean) 0.18 *** 0.22 *** 0.18 *** 0.20 *** 0.22 *** 0.22 *** -0.02 ^ 0.00 -0.04 ***
Hispanic -------- -------- 0.03 -------- -------- -0.10 ** -------- -------- 0.13 ***Foreign Born 0.06 0.01 ^ 0.69 *** -0.16 -0.30 *** -0.03 0.22 ^ 0.31 *** 0.72 ***
Currently In School -2.75 *** -2.2 *** -1.12 *** -1.57 *** -1.68 *** -0.33 *** -1.18 *** -0.52 *** -0.79 ***
Region (Northeast is reference)Midwest 0.48 *** 0.46 *** 0.37 *** 0.44 *** 0.35 *** 0.39 *** 0.03 0.10 *** -0.02South 0.66 *** 0.70 *** 0.60 *** 0.97 *** 0.74 *** 0.75 *** -0.31 *** -0.03 -0.15 ***West 0.98 *** 0.52 *** 0.32 *** 1.42 *** 0.75 *** 0.35 *** -0.44 *** -0.23 *** -0.03
Metropolitan -0.35 *** -0.30 *** -0.44 *** -0.20 * -0.17 *** -0.40 *** -0.16 * -0.14 *** -0.04 *Farm 0.10 ^ -0.40 *** 0.18 *** -0.61 *** -0.75 *** -0.86 *** 0.72 *** 0.36 *** 1.04 ***Owner Occupied Housing -0.83 *** -0.25 *** 0.70 *** -0.87 *** -0.91 *** -0.56 *** 0.03 0.88 *** 1.28 ***
Intercept -4.22 -4.17 -5.05 -7.35 -5.06 -6.78 3.16 1.89 7.73
Currently Versus Never Married Previously Versus Never Married Currently Versus Previously Married

Panel B. Black Women
1940 1970 2000 1940 1970 2000 1940 1970 2000Education (HS is reference)Grade School 0.37 ^ -0.35 -0.42 *** 0.37 ^ -0.02 -0.26 * -0.01 -0.33 *** -0.15Some High School 0.63 * 0.13 *** -0.32 *** 0.44 ^ 0.39 *** -0.12 * 0.09 -0.26 *** -0.2 ***HS Diploma -------- -------- -------- -------- -------- -------- -------- -------- --------Some College -0.45 0.09 0.29 *** -0.64 ^ -0.09 0.22 *** 0.19 0.18 ** 0.07 ^College Degree or Higher -1.17 * -0.06 *** 0.32 *** -1.47 * -0.56 *** -0.32 *** 0.30 0.50 *** 0.64 ***
Age (mean) 0.16 *** 0.16 *** 0.13 *** 0.19 *** 0.18 *** 0.17 *** 0.00 *** -0.02 *** -0.04 ***
Hispanic -------- -------- 0.68 *** -------- -------- 0.47 *** -------- -------- 0.21 ^Foreign Born -0.34 -0.03 0.84 *** -0.34 -0.59 *** 0.13 ^ 0.23 0.56 *** 0.71 ***
Currently In School -2.78 *** -1.7 *** -0.51 *** -1.12 * -1.28 *** 0.01 -1.66 * -0.42 *** -0.52 ***
Region (Northeast is reference)Midwest 0.50 * 0.36 *** 0.15 *** 0.58 * 0.35 *** 0.22 *** -0.06 0.01 -0.07South 0.35 ^ 0.27 *** 0.43 *** 0.23 0.16 *** 0.45 *** 0.12 0.11 * -0.02 ***West 0.99 ^ 0.59 *** 0.50 *** 1.23 * 0.68 *** 0.50 *** -0.27 -0.09 ^ 0.01
Metropolitan -0.52 *** -0.03 -11.00 *** -0.17 0.15 *** -0.20 *** -0.35 *** -0.18 *** 0.09 *Farm 0.22 ^ -0.21 * 0.19 -0.68 *** -0.65 *** 0.05 0.89 *** 0.44 ** 0.14Owner Occupied Housing -0.64 *** -0.03 0.58 *** -0.62 *** -0.56 *** -0.34 *** -0.03 0.59 *** 0.92 ***
Intercept -3.60 -3.81 -5.11 -5.39 -5.16 -6.47 1.78 1.35 1.36 ^ p<.10, * p<.05, ** p<.01, *** p<.001
Currently Versus Never Married Previously Versus Never Married Currently Versus Previously Married